EP0481814A2 - Système de traitement de données - Google Patents
Système de traitement de données Download PDFInfo
- Publication number
- EP0481814A2 EP0481814A2 EP91309651A EP91309651A EP0481814A2 EP 0481814 A2 EP0481814 A2 EP 0481814A2 EP 91309651 A EP91309651 A EP 91309651A EP 91309651 A EP91309651 A EP 91309651A EP 0481814 A2 EP0481814 A2 EP 0481814A2
- Authority
- EP
- European Patent Office
- Prior art keywords
- data
- group
- variables
- processing system
- data processing
- Prior art date
- Legal status (The legal status is an assumption and is not a legal conclusion. Google has not performed a legal analysis and makes no representation as to the accuracy of the status listed.)
- Pending
Links
Images


Classifications
-
- G—PHYSICS
- G06—COMPUTING; CALCULATING OR COUNTING
- G06F—ELECTRIC DIGITAL DATA PROCESSING
- G06F3/00—Input arrangements for transferring data to be processed into a form capable of being handled by the computer; Output arrangements for transferring data from processing unit to output unit, e.g. interface arrangements
- G06F3/01—Input arrangements or combined input and output arrangements for interaction between user and computer
- G06F3/048—Interaction techniques based on graphical user interfaces [GUI]
- G06F3/0481—Interaction techniques based on graphical user interfaces [GUI] based on specific properties of the displayed interaction object or a metaphor-based environment, e.g. interaction with desktop elements like windows or icons, or assisted by a cursor's changing behaviour or appearance
-
- G—PHYSICS
- G06—COMPUTING; CALCULATING OR COUNTING
- G06F—ELECTRIC DIGITAL DATA PROCESSING
- G06F30/00—Computer-aided design [CAD]
- G06F30/20—Design optimisation, verification or simulation
-
- G—PHYSICS
- G06—COMPUTING; CALCULATING OR COUNTING
- G06F—ELECTRIC DIGITAL DATA PROCESSING
- G06F40/00—Handling natural language data
- G06F40/10—Text processing
- G06F40/12—Use of codes for handling textual entities
- G06F40/123—Storage facilities
-
- G—PHYSICS
- G06—COMPUTING; CALCULATING OR COUNTING
- G06F—ELECTRIC DIGITAL DATA PROCESSING
- G06F40/00—Handling natural language data
- G06F40/10—Text processing
- G06F40/166—Editing, e.g. inserting or deleting
-
- G—PHYSICS
- G06—COMPUTING; CALCULATING OR COUNTING
- G06Q—INFORMATION AND COMMUNICATION TECHNOLOGY [ICT] SPECIALLY ADAPTED FOR ADMINISTRATIVE, COMMERCIAL, FINANCIAL, MANAGERIAL OR SUPERVISORY PURPOSES; SYSTEMS OR METHODS SPECIALLY ADAPTED FOR ADMINISTRATIVE, COMMERCIAL, FINANCIAL, MANAGERIAL OR SUPERVISORY PURPOSES, NOT OTHERWISE PROVIDED FOR
- G06Q40/00—Finance; Insurance; Tax strategies; Processing of corporate or income taxes
- G06Q40/02—Banking, e.g. interest calculation or account maintenance
Definitions
- the present invention is directed to user interfaces for data processing systems. It finds particular, although not exclusive, use in data processing systems used for complex simulations.
- variable of interest is revenues while the independent variable is time.
- a data processing system comprising:
- Our system provides an efficient, natural interface between the user and that part of the data processing system that presents data to the user.
- Our data processing system as described in a detailed embodiment below includes a memory for storing data groups, such as the simulation results for different variables in the model of a simulated system. Each data group is associated with a different group name, which may be the same as the name of the variable whose simulation results the data group contains.
- the data processing system includes means for displaying the names of data groups and for displaying the "tool symbols" associated with respective data-group operations.
- the user employs some type of input means, such as a mouse, to designate a displayed data-group name and tool symbol.
- the data processing system performs the operation represented by the tool symbol on the data group represented by the designated name. We have found that this provides a very natural user interface, particularly when the data processing system is used for simulation.
- the data-group operations represented by the tool symbols may include, for instance, displays of the names and graphs of the values of the variables that are the "causes" of the variable whose name the user designates.
- the user can determine which of the causes is of greatest interest, and he can use a mouse or other input device to designate the name of that cause variable and specify the cause-graphing tool again.
- he can investigate the system in a natural manner. The user can thus maximize his concentration on the actual investigation rather than on the mechanics of requesting that the computer present the needed information.
- FIG. 1 depicts in diagrammatic form a simulation system of the type that can embody the teachings of the present invention.
- a system typically includes a computer, which FIG. 1 symbolizes by the contents of the computer's memory, represented by dashed lines 12.
- Appropriate input devices such as a keyboard 14 and a mouse 15 are coupled to the computer.
- the keyboard is depicted in such a manner as to represent its use to enter a simulation model, while the mouse 15 is so depicted as to suggest its use to control the presentation of simulation results.
- both input devices can be used for either or both functions.
- the pre-compiler 18 is the programming that enables the computer 12 to perform a number of functions having to do with the appropriate interpretation of the information that the user enters by way of the keyboard 14 to define the simulation model.
- the entries made from the keyboard 14 are ultimately compiled into object code--i.e., into machine-language instructions.
- FIG. 1 depicts the software in its more typical, two-part form, in which a pre-compiler 18 recognizes the simulation language and converts it into source code of a compiler language, such as C, and a compiler 20 converts the source code into machine code.
- a pre-compiler 18 may also create cause and effect lists in a manner described in more detail in United States Patent Application Serial No. 516,987 of William T. Wood for A Simulation System Employing Causal Tracing, which was filed on May 14, 1990, and assigned to the assignee of the present invention.
- the simulation model is written as a set of equations typically entered from the keyboard by the user.
- Each of the equations defines a relationship between an effect variable and each of the variables that are its proximate causes.
- the effect variable in an equation is a proximate effect of each of the cause variables in that equation.
- the cause and effect lists include a list of all of the proximate causes of each variable as well as a list of all of its proximate effects.
- the machine code generated by the compiler module 20 is a simulation program 24, which the computer 12 runs to generate simulation results 26.
- the results typically take the form of series of values of the various variables as functions of time.
- the user employs the mouse 15 to interact with a presentation module 28, which controls the display device 16.
- the colon indicates that the variable at the left of it is a subscript variable whose values can be any of those at the right of the colon.
- the particular model-writing language employed requires, for each such entry, two tildes and a vertical line; the first tilde represents the beginning of a dimension-entry field, the second tilde represents the beginning of a comment-entry field, and the vertical line represents the end of the current entry.
- the user may then enter the model by using entries such as these:
- the first entry in the simulation defines relationships for two variables. Since the subscript CLIENT can have two values, namely, MARY and JOHN, the first entry essentially represents two equations, one in which the value of the subscript in all of the subscripted variables is MARY and the other in which it is JOHN.
- the first statement specifies that the BALANCE at any given time is the sum of an initial value INITIAL_BALANCE[CLIENT] and the integral of the difference between MONEY_IN[CLIENT] and MONEY_OUT[CLIENT] between some initial time and the given time.
- the entry after the first tilde represents the dimensions (dollars)
- the entry after the second tilde is a comment explaining the meaning of BALANCE[CLIENT].
- the effect variable for this entry is BALANCE[CLIENT]
- the cause variables are MONEY_IN[CLIENT], MONEY_OUT(CLIENT] and INITIAL_BALANCE[CLIENT].
- the vertical line indicates the end of the entry for BALANCE[CLIENT].
- the next entry defines a relationship between the variable MONEY_IN[CLIENT] and the variables INTEREST[CLIENT] and DEPOSITS[CLIENT].
- the entry indicates that MONEY_IN has the dimension dollars/week and explains that MONEY_IN is a rate.
- the next entry represents only one equation; it uses as a subscript the constant MARY rather than the variable CLIENT.
- the fifth entry similarly represents only one equation.
- the dimensions and comments for two variables that differ only in subscripts can be written in common, even though their equations are entered separately, and this is the result of following the first equation simply with two tildes and a vertical line but following the second equation with a dimension and a comment.
- the sixth entry the one for INTEREST[CLIENT] is self-explanatory.
- the seventh entry describes a two-level interest rate. It states that INTEREST_RATE[CLIENT] takes on the value of LOW_INTEREST_RATE/100 if the BALANCE[CLIENT] is less than $1,500 and is equal to HIGH_INTEREST_RATE/100 otherwise.
- the purpose of the simulation program is to evaluate the various variables at successive values of the independent variable, which is typically assumed to be time. Accordingly, the simulation language will typically have variables reserved for this function, and the user may give them values in the following manner:
- the first two entries tell when, in simulated time, the simulation is to start and stop.
- the third entry specifies that the simulation is to make successive calculations in steps of one week of simulated time.
- the user may not be interested in the results of each week; he may instead be interested only in the results of each year. In such a situation, the simulation would not need to retain the weekly results for display purposes, and it could discard them as soon as they are no longer needed for subsequent calculations.
- the user wants to see all of the results, and the fourth entry, which specifies that the save period is equal to the time step, gives this information to the simulation routine.
- the memory containing the simulation results can be thought of as being organized into data groups, one for each variable, containing the simulation results as well as other information related to the associated variables, such as its cause and effect lists, the equations in which they are the effects, comments regarding the equations, and so forth.
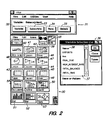
- the presentation module 28 then presents the user a display of the type shown in FIG. 2.
- a number of the items of the display are not relevant to the present invention, and they will not be described here. But a major part of the display is a "toolbox" area 30, which contains a number of tool symbols of the type that can be employed in the present invention.
- the tool symbols typically take the forms of icons, by which the user can choose one of a number of data-group operations.
- buttons 32-35 contain the legends “variable,” “subscripts,” “runs,” and “globals.”
- the user may "click on” the "variable” button 32 by using a mouse or other input device to move a display cursor over it and then pushing a button on the input device. This indicates that the user wishes to place a variable in the workbench, and a window 36 pops up in response.
- the part of the window relevant to the present invention is a list 37 of the variables in the simulation that he has entered. For the purposes of illustration, we assume that the user then moves the cursor over the "balance" entry 38 in the list and, say, double clicks on it. As a result, that variable appears, as shown, in the workbench.
- variable BALANCE is shown with its variable subscript name, namely, CLIENT.
- the user could then click on the "subscripts" button 33 to enter one of the individual values for CLIENT, namely, MARY or JOHN, but we will assume for the purposes of the present explanation that he does not. Instead, he proceeds directly to choosing a data-group operation by clicking on one of the tool symbols in the toolbox 30. The chosen data-group operation is then performed on the data groups represented by BALANCE[CLIENT], i.e., by the name displayed in the workbench area 31.
- icon 40 represents the operation of graphing as functions of time the values that the simulation has calculated for the variable whose name is displayed in the workbench. If the simulation has been run more than once, the user can use the "runs" button to specify the run whose results he wants to graph. Since the user has not specified a particular subscript, the name in the workbench actually represents two variables, both of which the presentation module 28 graphs in response to designation of the graphing icon 40.
- the particular icon shown represents a strip graph, i.e., a graph in which different variables are plotted on different axes, but a typical embodiment of the present system will also provide a data-group operation in which the several graphed variables are plotted on common axes.
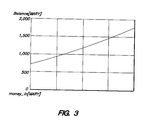
- FIG. 3 represents part of the resultant display, namely, the graph of the values of BALANCE[MARY] as a function of time. BALANCE[JOHN] would also be graphed.
- tool symbols 41 and 42 are similar to the one represented by tool symbol 40; they all represent graphing data.
- Tool symbol 41 represents graphing the proximate cause variables of the variable whose name is in the workbench area 31, and symbol 42 represents graphing its proximate effect variables.
- Tool symbols 43, 44, and 45 represent operations that parallel those represented by symbols 40, 41, and 42, with the exception that the operations that they represent present the data in tabular, rather than graphical, form.
- Tool symbols 46 and 47 represent data-group operations that parallel those of the operations represented by tool symbols 41 and 42 in that they call for presentation of causes and effects, respectively. Rather than causing the values to be displayed, however, they merely cause the names of the causes and effects to be displayed, and they show not only proximate causes but also other causes to a level three deep in the causal chain.
- FIG. 5 is a tree diagram of the causes of BALANCE[CLIENT]. This diagram lists not only INITIAL_BALANCE, MONEY_IN, and MONEY_OUT, which are the proximate causes of BALANCE[CLIENT,], but also variables on which those proximate causes depend.
- the operation represented by tool symbol 46 is arranged to display only three levels of causation. Moreover, even if the BALANCE entries at the left side of the diagram were not disposed three levels deep in the causal chain, cause variables for them would not additionally be shown, since they are the same as those for the same, ultimate effect variable BALANCE at the right, and further display of the causes of these variables would thus be redundant. The fact that there is such a causal loop is indicated by the angle brackets in the drawing.
- the user may click on tool symbol 48, which requests a list of loops.
- the result would be the display of FIG. 6.
- the display of FIG. 6 lists loops in tabular form and shows not only the two loops that are evident from the display of FIG. 5 but also a third loop, which would have been evident if the tree display of FIG. 5 had been extended by one level.
- the causes of BALANCE can be shown in yet another way by clicking on tool symbol 49, which gives a causation tree in tabular form, as FIG. 7 shows.
- Tool symbols 50, 51, and 52 represent further graphing operations, which will not be separately illustrated.
- Tool symbol 50 represents preparation of a Gantt chart. Clicking on that tool symbol causes both of the BALANCE[CLIENT] variables to be displayed in a Gantt chart, in which the bars that represent their presence would start and stop at the points in time at which the values of those variables pass through predetermined thresholds.
- Clicking on tool symbols 51 and 52 would cause display of vertical and horizontal bar charts that would depict the values of the two variables BALANCE[MARY] and BALANCE[JOHN] at a predetermined point in time.
- the thresholds for the Gantt charts, and other display parameters the user clicks on the "globals" button and is provided with displays that enable him to perform such operations.
- the user may also want to review the entries that he made for the variable in creating the model. For this purpose, he may click on tool symbol 54, which would cause display of the entries that he made to define the variable whose name is on the workbench. Such an operation may simply show the equation, or it may additionally show the entered units and any comments that the user entered. At this point, the user may have learned something through his review of the data and may want to record the information for further reference by adding it to the comment that he initially entered. For this purpose, he can click on tool symbol 55, which would enable him to edit the entry for that variable.
- a final tool symbol is symbol 59. This symbol represents the operation of performing a dimensional analysis on the equation in which the variable in the workbench is the effect. That is, clicking on this symbol causes this system to determine whether the units written in the equation are consistent and generates a display that tells the user the results of that determination.
- the model illustrated above is very simple and can readily be understood without using the more-sophisticated features of a simulation program. But it is not uncommon for a simulation to involve thousands of equations and tens of thousands of variables. It is in such simulations that the ease of presentation afforded by the present invention yields the greatest advantage. This is particularly true when the invention is embodied in a system that is capable of data-group operations like the cause and effect operations described above, which place on the display the names of the data groups associated with the cause or effect variables of the variable whose name is currently "on the workbench.”
- a user can display a causation tree by simply clicking on tool symbol 46 or 49, as was described above. When the tree is displayed, he can then look at a particular cause variable by merely clicking twice on its displayed name and once on the appropriate tool symbol, which may be the graph symbol 34. After seeing the behavior of that particular variable, the user may want to find out what else that variable affects, and he may therefore click on the effect-tree symbol 47. In this way, the user moves in a very natural way through the chains of causation in the model.
- the user can concentrate more on the model and less on the process of interacting with the computer than he could with a less natural presentation scheme.
- the use of the present system thus greatly facilitates the user's investigation of the behavior of a computer model, and it thus constitutes a significant advance in the art.
Applications Claiming Priority (2)
| Application Number | Priority Date | Filing Date | Title |
|---|---|---|---|
| US59961990A | 1990-10-18 | 1990-10-18 | |
| US599619 | 1990-10-18 |
Publications (2)
| Publication Number | Publication Date |
|---|---|
| EP0481814A2 true EP0481814A2 (fr) | 1992-04-22 |
| EP0481814A3 EP0481814A3 (fr) | 1994-04-06 |
Family
ID=24400365
Family Applications (1)
| Application Number | Title | Priority Date | Filing Date |
|---|---|---|---|
| EP91309651A Pending EP0481814A2 (fr) | 1990-10-18 | 1991-10-18 | Système de traitement de données |
Country Status (4)
| Country | Link |
|---|---|
| EP (1) | EP0481814A2 (fr) |
| JP (1) | JPH04315255A (fr) |
| AU (1) | AU642305B2 (fr) |
| CA (1) | CA2053628A1 (fr) |
Cited By (2)
| Publication number | Priority date | Publication date | Assignee | Title |
|---|---|---|---|---|
| EP0597794A2 (fr) * | 1992-11-13 | 1994-05-18 | International Business Machines Corporation | Procédé et système pour interaction graphique entre données et applications dans un système de traitement de données |
| EP0831440A1 (fr) * | 1996-09-18 | 1998-03-25 | Nec Corporation | Récepteur d'appels sélectifs sans fil et méthode d'affichage des messages reçus |
Family Cites Families (2)
| Publication number | Priority date | Publication date | Assignee | Title |
|---|---|---|---|---|
| US4894743A (en) * | 1986-01-10 | 1990-01-16 | Allsop, Inc. | Replaceable cleaner/drive members for a tape drive machine |
| US4965743A (en) * | 1988-07-14 | 1990-10-23 | The United States Of America As Represented By The Administrator Of The National Aeronautics And Space Administration | Discrete event simulation tool for analysis of qualitative models of continuous processing system |
-
1991
- 1991-10-17 CA CA002053628A patent/CA2053628A1/fr not_active Abandoned
- 1991-10-17 AU AU85893/91A patent/AU642305B2/en not_active Ceased
- 1991-10-18 EP EP91309651A patent/EP0481814A2/fr active Pending
- 1991-10-18 JP JP3271546A patent/JPH04315255A/ja active Pending
Non-Patent Citations (3)
| Title |
|---|
| COMPUTER vol. 22, no. 9 , September 1989 , LOS ALAMITOS CA US US pages 11 - 28 JOHNSON ET AL 'the xerox star : a retrospective' * |
| PROCEEDINGS OF THE 1986 WINTER SIMULATION CONFERENCE US pages 453 - 459 D.H. HELMAN ET AL 'explanation systems for computer simulations' * |
| PROCEEDINGS OF THE 1991 SUMMER COMPUTER SIMULATION CONFERENCE 22 July 1991 , MALTIMORE MD US pages 21 - 25 EBERLEIN ET AL 'enhancing the simulation process' * |
Cited By (4)
| Publication number | Priority date | Publication date | Assignee | Title |
|---|---|---|---|---|
| EP0597794A2 (fr) * | 1992-11-13 | 1994-05-18 | International Business Machines Corporation | Procédé et système pour interaction graphique entre données et applications dans un système de traitement de données |
| EP0597794A3 (fr) * | 1992-11-13 | 1994-10-12 | Ibm | Procédé et système pour interaction graphique entre données et applications dans un système de traitement de données. |
| EP0831440A1 (fr) * | 1996-09-18 | 1998-03-25 | Nec Corporation | Récepteur d'appels sélectifs sans fil et méthode d'affichage des messages reçus |
| CN1096199C (zh) * | 1996-09-18 | 2002-12-11 | 日本电气株式会社 | 选择被呼无线接收机及显示所接收信息的方法 |
Also Published As
| Publication number | Publication date |
|---|---|
| AU8589391A (en) | 1992-04-30 |
| AU642305B2 (en) | 1993-10-14 |
| EP0481814A3 (fr) | 1994-04-06 |
| JPH04315255A (ja) | 1992-11-06 |
| CA2053628A1 (fr) | 1992-04-19 |
Similar Documents
| Publication | Publication Date | Title |
|---|---|---|
| US5428740A (en) | Applying successive data group operations to an active data group | |
| Bangsow | Tecnomatix plant simulation | |
| McGeoch | Toward an experimental method for algorithm simulation | |
| EP0242131B1 (fr) | Système graphique pour modeler un processus et méthode associée | |
| USRE42579E1 (en) | Virtual machine programming system | |
| Shannon | Simulation: A survey with research suggestions | |
| JPH07505492A (ja) | 大域プロセス制御情報システム及び方法 | |
| Shannon | Knowledge based simulation techniques for manufacturing | |
| WO2000005647A1 (fr) | Procede et outil pour generer et afficher une annotation descriptive de donnees d'application selectionnees | |
| EP0481814A2 (fr) | Système de traitement de données | |
| Schreiber | Specification and generation of user interfaces with the boss-system | |
| Spengler et al. | Expert systems and quality tools for quality improvement | |
| Goedicke et al. | oriented software development: Tool support for integrating multiple perspectives by distributed graph transformation | |
| Velázquez-Iturbide et al. | Recursion-Based Visualizations of Search Algorithms in State-Spaces | |
| Mills | Metrics in the software engineering curriculum | |
| Matson et al. | An object‐oriented tool for function point analysis | |
| Díaz-Bejarano et al. | Data analysis for chemical engineers: Introduction to R | |
| Ebrahimi | VPCL: A visual language for teaching and learning programming.(A picture is worth a thousand words) | |
| Meijer | A MatCont Tutorial Learning the GUI by exploring a Neural Mass Model | |
| Griffiths | CASE in the third generation | |
| Kamita et al. | Prototyping and Evaluation of Programming Learning Support System with Function for Switching Display Language | |
| Caron | AG: a set of Maple packages for manipulating automata and semigroups | |
| Genter et al. | Software tool for modeling, simulation and real-time implementation of Petri net-based supervisors | |
| Sutinen et al. | String matching animator SALSA | |
| Díaz-Bejarano et al. | 7 Data Analysis for |
Legal Events
| Date | Code | Title | Description |
|---|---|---|---|
| PUAI | Public reference made under article 153(3) epc to a published international application that has entered the european phase |
Free format text: ORIGINAL CODE: 0009012 |
|
| AK | Designated contracting states |
Kind code of ref document: A2 Designated state(s): AT BE CH DE DK ES FR GB GR IT LI LU NL SE |
|
| PUAL | Search report despatched |
Free format text: ORIGINAL CODE: 0009013 |
|
| AK | Designated contracting states |
Kind code of ref document: A3 Designated state(s): AT BE CH DE DK ES FR GB GR IT LI LU NL SE |
|
| 17P | Request for examination filed |
Effective date: 19941005 |
|
| STAA | Information on the status of an ep patent application or granted ep patent |
Free format text: STATUS: THE APPLICATION HAS BEEN WITHDRAWN |
|
| 18D | Application deemed to be withdrawn |
Effective date: 19970501 |
|
| 18W | Application withdrawn |
Withdrawal date: 19970505 |
|
| D18D | Application deemed to be withdrawn (deleted) |