EP0449992B1 - Bias drift compensation in near infrared quantitative analysis instruments - Google Patents
Bias drift compensation in near infrared quantitative analysis instruments Download PDFInfo
- Publication number
- EP0449992B1 EP0449992B1 EP90903575A EP90903575A EP0449992B1 EP 0449992 B1 EP0449992 B1 EP 0449992B1 EP 90903575 A EP90903575 A EP 90903575A EP 90903575 A EP90903575 A EP 90903575A EP 0449992 B1 EP0449992 B1 EP 0449992B1
- Authority
- EP
- European Patent Office
- Prior art keywords
- values
- value
- infrared
- emitting sources
- individual
- Prior art date
- Legal status (The legal status is an assumption and is not a legal conclusion. Google has not performed a legal analysis and makes no representation as to the accuracy of the status listed.)
- Expired - Lifetime
Links
Images


Classifications
-
- G—PHYSICS
- G01—MEASURING; TESTING
- G01N—INVESTIGATING OR ANALYSING MATERIALS BY DETERMINING THEIR CHEMICAL OR PHYSICAL PROPERTIES
- G01N21/00—Investigating or analysing materials by the use of optical means, i.e. using sub-millimetre waves, infrared, visible or ultraviolet light
- G01N21/17—Systems in which incident light is modified in accordance with the properties of the material investigated
- G01N21/25—Colour; Spectral properties, i.e. comparison of effect of material on the light at two or more different wavelengths or wavelength bands
- G01N21/27—Colour; Spectral properties, i.e. comparison of effect of material on the light at two or more different wavelengths or wavelength bands using photo-electric detection ; circuits for computing concentration
- G01N21/274—Calibration, base line adjustment, drift correction
-
- G—PHYSICS
- G01—MEASURING; TESTING
- G01N—INVESTIGATING OR ANALYSING MATERIALS BY DETERMINING THEIR CHEMICAL OR PHYSICAL PROPERTIES
- G01N21/00—Investigating or analysing materials by the use of optical means, i.e. using sub-millimetre waves, infrared, visible or ultraviolet light
- G01N21/17—Systems in which incident light is modified in accordance with the properties of the material investigated
- G01N21/25—Colour; Spectral properties, i.e. comparison of effect of material on the light at two or more different wavelengths or wavelength bands
- G01N21/31—Investigating relative effect of material at wavelengths characteristic of specific elements or molecules, e.g. atomic absorption spectrometry
- G01N21/35—Investigating relative effect of material at wavelengths characteristic of specific elements or molecules, e.g. atomic absorption spectrometry using infrared light
- G01N21/359—Investigating relative effect of material at wavelengths characteristic of specific elements or molecules, e.g. atomic absorption spectrometry using infrared light using near infrared light
-
- G—PHYSICS
- G01—MEASURING; TESTING
- G01N—INVESTIGATING OR ANALYSING MATERIALS BY DETERMINING THEIR CHEMICAL OR PHYSICAL PROPERTIES
- G01N21/00—Investigating or analysing materials by the use of optical means, i.e. using sub-millimetre waves, infrared, visible or ultraviolet light
- G01N21/84—Systems specially adapted for particular applications
- G01N21/85—Investigating moving fluids or granular solids
Definitions
- the invention relates to improvements in near infrared quantitative analysis instruments.
- Near infrared quantitative analysis instruments are known and commercially available. Such instruments as are known in the prior art make use of the phenomena that certain organic substances absorb energy in the near infrared (near-IR) region of the spectrum. In measuring the amount of energy absorbed by the substances at specific wavelengths (i.e., the Optical Density of the material) precise quantitative measurements of the constituents of the material can be determined. For example, protein, oil and moisture analyses of cereal grains can be determined by such instruments. For general introduction to near infrared quantitative analysis, see the paper presented by Robert D. Rosenthal to the 1977 Annual Meeting of American Association of Cereal Chemists, entitled "An Introduction to Near Infrared Quantitative Analysis".
- U.S.-A-4,286,327 and 4,466,076 disclose near infrared instruments wherein the radiation source is a plurality of infrared emitting diodes (IREDs).
- US-A-4,404,642 discloses an apparatus for near-infrared quantitative analysis having the features of the pre-characterising portion of claim 1.
- IRED-type instruments are more subject to bias shift. The reason for this is that broad band light instruments generally have only a single illumination source, i.e., a light bulb, and if the illumination source changes intensity, it usually affects all emitted wavelengths identically. Thus, a change in intensity of the single light bulb does not cause bias shift of the instrument.
- EP-A-0221357 discloses an electro-optical computer for a catheter oximeter.
- the present invention provides an apparatus for near-infrared quantitative analysis correcting for bias shift, comprising: a) a plurality of near-infrared emitting sources for transmitting near-infrared energy through a sample to be quantitatively analysed; b) sensor means for detecting near-infrared energy transmitted through the sample, and for providing a signal corresponding to the detected amount of near-infrared energy transmitted through the sample for each of said plurality of near-infrared emitting sources; and c) a computer which receives signals from said sensor means, characterised in that the computer calculates and stores individual initial Optical Density (OD) values of a calibration standard for each of said plurality of near-infrared emitting sources based on said received signals, calculates an average initial OD value of said calibration standard from the individual initial OD values, and calculates a true OD value for each of said plurality of near-infrared emitting sources by subtracting said average initial OD value from each of said individual initial OD values, and
- the present invention further provides a method for correcting a quantitative measurement for bias shift in a near-infrared quantitative analysis instrument which irradiates a sample with near-infrared energy emitted from a plurality of near-infrared emitting sources and provides a signal corresponding to the detected amount of near-infrared energy tranmsitting through the sample for each of said plurality of near-infrared emitting sources, comprising the steps of: a) calculating individual initial Optical Density (OD) values of a calibration standard for each of said plurality of near-infrared emitting sources based on said provided signals; b) calculating an average initial OD value of said calibration standard from the individual initial OD values; c) calculating a true OD value for each of said plurality of near-infrared emitting sources by subtracting said average initial OD value from each of said individual initial OD values; d) calculating individual subsequent OD values of said calibration standard for each of said plurality of near-in
- Figure 1 is a schematic diagram of a near infrared quantitative analysis instrument to which the present invention is applicable.
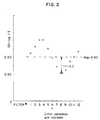
- Figure 2 is a graph illustrating sample absorbance values for each filter of an instrument as in Figure 1, at the time of initial calibration.
- Figure 3 is a graph exemplifying the effect of bias shift on absorption values for each filter of an instrument as in Figure 1 after a period of time.
- the present invention corrects bias shift in near infrared quantitative analysis instruments employing a plurality of near infrared emitting sources.
- a sample holding chamber 10 can be any form of suitable chamber having at least a portion thereof transparent to near infrared energy, such as windows 12 and 14.
- a sample S to be analyzed may be, for example, unground cereal grain.
- a sample is contained within the holding chamber 10 during measuring. Suitable gates (not shown) are positioned to put the sample in the chamber during measurement and to remove the sample from the chamber following the measurement.
- IREDs infrared emitting diodes
- Suitable IREDs are manufactured by General Electric, Model No. IN624.
- the combination of each IRED and its corresponding filter is referred to herein as a near infrared emitting source.
- five IREDs and filters are shown, although the actual number used may be more or less than five.
- the number of IREDs used is 12.
- Suitable shields such as baffles 36, 38, 40, 42, 44, and 46 shield the individual IREDs and filters from other light sources.
- the beams from the individual IREDs may be focused together by suitable lens means (not shown). Each narrow band-pass filter yields one of the specified wavelengths required for the quantitative analysis.
- the temperature of the sample S is sensed by a thermistor 48 which is positioned within the holding chamber 10 in contact with the sample.
- a timer 50 is connected to the individual IRED's 16-24 to sequentially pulse them.
- a suitable timer is National Semiconductor Model No. NE555.
- the optical energy transmitted through the sample S by the IREDs is quantitatively detected by a photovoltaic sensor 56.
- a suitable sensor is Silicon Detector Corporation Model No. SD444-11-21-251.
- the output of the sensor is amplified by an amplifier 58 and fed to an analog-to-digital converter 61 to convert the signal to digital form for entering into a micro-computer 54.
- the amplifier 60 can be a National Semiconductor Model LF355, the analog-to-digital converter 61 can be an Analog Devices Corporation Model AD574KD, and the micro-computer 54 can be an Intel 8085A system.
- Es energy received from sample
- Er energy received from a reference.
- These initial OD values are obtained by transmitting optical energy from each of the 12 near-IR sources through an empty holding chamber, the calibration standard being air.
- these initial OD values are stored in the computer 54 individually, and also combined to yield an average initial Optical Density value, which also is stored in the computer.
- Each initial OD value is then compared to the initial average value to obtain a "t" (true) value for each IRED/filter combination, which also is stored in the computer.
- the average initial or normalized Optical Density value of the calibration standard for all twelve of the near-IR sources, as shown in Figure 2, is 0.50.
- the Optical Density value of the calibration standard for radiation emitted by near-IR source No. 8 is 0.3, as shown in Figure 2.
- the true (t) value for near-IR source No. 8 is determined by comparing the OD value of source No. 8 to the average OD value for all twelve of the near-IR sources.
- Figure 3 shows OD values during subsequent calibration with air as a standard for each of the twelve near-IR sources after a bias shift has occurred, such as might be attributable to wear or other factors which cause the readings to change.
- the average OD value for all twelve near-IR sources has changed to 0.65, as shown by the dotted line in Figure 3.
- source No. 8 has an OD value of -0.55 and an n (new) value of -0.1.
- the computer compensates for Optical Density variations between the subsequent and initial optical densities for each of the near-IR sources so as to provide an analysis corrected for bias shift.
- each n value is the new OD value for a particular near-IR source; each t value is the true OD value for a particular near-IR source; and each f value is the "transfer function" for a particular near-IR source.
- the transfer function which also may be termed a "weighting factor", expresses the percent contribution that the bias shift of a particular near-IR source is to the percent protein reading.
- the transfer function may be determined experimentally by sequentially adding a small resistor in parallel to the dropping resistor of each IRED and then analyzing a test sample (e.g., grain) to determine the percent change.
- the present invention thus provides a method and apparatus for correcting bias shift in near infrared quantitative analysis instruments that irradiate a sample with a plurality of near infrared emitting sources.
Landscapes
- Physics & Mathematics (AREA)
- Analytical Chemistry (AREA)
- General Physics & Mathematics (AREA)
- Pathology (AREA)
- Spectroscopy & Molecular Physics (AREA)
- Health & Medical Sciences (AREA)
- Life Sciences & Earth Sciences (AREA)
- Chemical & Material Sciences (AREA)
- Immunology (AREA)
- General Health & Medical Sciences (AREA)
- Biochemistry (AREA)
- Mathematical Physics (AREA)
- Engineering & Computer Science (AREA)
- Theoretical Computer Science (AREA)
- Investigating Or Analysing Materials By Optical Means (AREA)
- Photometry And Measurement Of Optical Pulse Characteristics (AREA)
- Spectrometry And Color Measurement (AREA)
- Glass Compositions (AREA)
- Analysing Materials By The Use Of Radiation (AREA)
Abstract
Description
- The invention relates to improvements in near infrared quantitative analysis instruments.
- Near infrared quantitative analysis instruments are known and commercially available. Such instruments as are known in the prior art make use of the phenomena that certain organic substances absorb energy in the near infrared (near-IR) region of the spectrum. In measuring the amount of energy absorbed by the substances at specific wavelengths (i.e., the Optical Density of the material) precise quantitative measurements of the constituents of the material can be determined. For example, protein, oil and moisture analyses of cereal grains can be determined by such instruments. For general introduction to near infrared quantitative analysis, see the paper presented by Robert D. Rosenthal to the 1977 Annual Meeting of American Association of Cereal Chemists, entitled "An Introduction to Near Infrared Quantitative Analysis".
- Commonly owned U.S.-A-4,286,327 and 4,466,076 disclose near infrared instruments wherein the radiation source is a plurality of infrared emitting diodes (IREDs). US-A-4,404,642 discloses an apparatus for near-infrared quantitative analysis having the features of the pre-characterising portion of
claim 1. In contrast to broad band light analytical instruments, IRED-type instruments are more subject to bias shift. The reason for this is that broad band light instruments generally have only a single illumination source, i.e., a light bulb, and if the illumination source changes intensity, it usually affects all emitted wavelengths identically. Thus, a change in intensity of the single light bulb does not cause bias shift of the instrument. In an IRED-type instrument with multiple IREDs, this "self compensating" effect of having a single light source does not exist. Thus, if any single IRED changes intensity, the result is an apparent absorbance that differs from the true absorbance of the sample being tested. This absorbance shift can be caused by shifts in the IRED center wavelength and changes in the IRED half-power band width. These may result from IRED temperature changes related to changes in intensity. Another source of error in IRED instruments may result from changes in the optical filters used. For example, if an optical filter changes in its band width or center wavelength, it can cause an IRED-type instrument to have a bias shift. - There thus remains a need in the art for near infrared quantitative analysis instruments that provide for reduction or elimination of error due to bias shift.
- EP-A-0221357 discloses an electro-optical computer for a catheter oximeter.
- The present invention provides an apparatus for near-infrared quantitative analysis correcting for bias shift, comprising: a) a plurality of near-infrared emitting sources for transmitting near-infrared energy through a sample to be quantitatively analysed; b) sensor means for detecting near-infrared energy transmitted through the sample, and for providing a signal corresponding to the detected amount of near-infrared energy transmitted through the sample for each of said plurality of near-infrared emitting sources; and c) a computer which receives signals from said sensor means, characterised in that the computer calculates and stores individual initial Optical Density (OD) values of a calibration standard for each of said plurality of near-infrared emitting sources based on said received signals, calculates an average initial OD value of said calibration standard from the individual initial OD values, and calculates a true OD value for each of said plurality of near-infrared emitting sources by subtracting said average initial OD value from each of said individual initial OD values, and wherein said computer further calculates and stores individual subsequent OD values of said calibration standard for each of said plurality of near-infrared emitting sources based on said received signals, calculates an average subsequent OD value of said calibration standard from the individual subsequent OD values, calculates a new OD value for each of said plurality of near-infrared emitting sources by subtracting said average subsequent OD value from each of said individual subsequent OD values, and corrects a quantitative measurement of a sample for bias shift by using said true OD values and said new OD values according to a predetermined correction formula.
- The present invention further provides a method for correcting a quantitative measurement for bias shift in a near-infrared quantitative analysis instrument which irradiates a sample with near-infrared energy emitted from a plurality of near-infrared emitting sources and provides a signal corresponding to the detected amount of near-infrared energy tranmsitting through the sample for each of said plurality of near-infrared emitting sources, comprising the steps of: a) calculating individual initial Optical Density (OD) values of a calibration standard for each of said plurality of near-infrared emitting sources based on said provided signals; b) calculating an average initial OD value of said calibration standard from the individual initial OD values; c) calculating a true OD value for each of said plurality of near-infrared emitting sources by subtracting said average initial OD value from each of said individual initial OD values; d) calculating individual subsequent OD values of said calibration standard for each of said plurality of near-infrared emitting sources based on said provided signals; e) calculating an average subsequent OD value of said calibration standard from the individual subsequent OD values; f) calculating a new OD value for each of said plurality of near-infrared emitting sources by subtracting said average subseqent OD value from each of said individual subsequent OD values; and g) correcting a quantitative measurement of a sample for bias shift by using said true OD values and said new OD values according to a predetermined correction formula.
- Embodiments of the present invention will now be described by way of example only with reference to the accompanying drawings, in which:-
- Figure 1 is a schematic diagram of a near infrared quantitative analysis instrument to which the present invention is applicable.
- Figure 2 is a graph illustrating sample absorbance values for each filter of an instrument as in Figure 1, at the time of initial calibration.
- Figure 3 is a graph exemplifying the effect of bias shift on absorption values for each filter of an instrument as in Figure 1 after a period of time.
- The present invention corrects bias shift in near infrared quantitative analysis instruments employing a plurality of near infrared emitting sources. One such instrument is schematically shown in Figure 1, wherein a
sample holding chamber 10 can be any form of suitable chamber having at least a portion thereof transparent to near infrared energy, such aswindows holding chamber 10 during measuring. Suitable gates (not shown) are positioned to put the sample in the chamber during measurement and to remove the sample from the chamber following the measurement. - A plurality of infrared emitting diodes (IREDs) 16, 18, 20, 22, and 24 are positioned so that when sequentially pulsed they will emit their illumination or infrared energy through individual narrow
band pass filters baffles holding chamber 10 in contact with the sample. Atimer 50 is connected to the individual IRED's 16-24 to sequentially pulse them. A suitable timer is National Semiconductor Model No. NE555. - The optical energy transmitted through the sample S by the IREDs is quantitatively detected by a
photovoltaic sensor 56. A suitable sensor is Silicon Detector Corporation Model No. SD444-11-21-251. The output of the sensor is amplified by anamplifier 58 and fed to an analog-to-digital converter 61 to convert the signal to digital form for entering into a micro-computer 54. The amplifier 60 can be a National Semiconductor Model LF355, the analog-to-digital converter 61 can be an Analog Devices Corporation Model AD574KD, and the micro-computer 54 can be an Intel 8085A system. - For further reference to the operation of the pulsed IREDs and to the use of narrow band-pass filters, see the above cited U.S. Patent Nos. 4,286,327 and 4,466,076, incorporated herein by reference.
- Although five near infrared sources are shown for convenience in Figure 1, the invention will be further described with reference to the near infrared analysis instrument having the preferred number of twelve IREDs and filters, mentioned above.
- Figure 2, shows Optical Density (OD) =
log 1/I values of radiation received from each of 12 near-IR sources (i.e., 12 IREDs, each having a corresponding filter) during initial calibration of the instrument with a calibration standard. In the above equation, I is interactance and equal to Es/Er (Es = energy received from sample; Er = energy received from a reference). These initial OD values are obtained by transmitting optical energy from each of the 12 near-IR sources through an empty holding chamber, the calibration standard being air. According to the present invention, these initial OD values are stored in thecomputer 54 individually, and also combined to yield an average initial Optical Density value, which also is stored in the computer. Each initial OD value is then compared to the initial average value to obtain a "t" (true) value for each IRED/filter combination, which also is stored in the computer. The average initial or normalized Optical Density value of the calibration standard for all twelve of the near-IR sources, as shown in Figure 2, is 0.50. - In this example, at the time of initial calibration, the Optical Density value of the calibration standard for radiation emitted by near-IR source No. 8 is 0.3, as shown in Figure 2. Thus, the true (t) value for near-IR source No. 8 is determined by comparing the OD value of source No. 8 to the average OD value for all twelve of the near-IR sources. Thus, source No. 8 has a "t" value of 0.3 - 0.5 = -0.2.
- Figure 3, shows OD values during subsequent calibration with air as a standard for each of the twelve near-IR sources after a bias shift has occurred, such as might be attributable to wear or other factors which cause the readings to change. At this point, the average OD value for all twelve near-IR sources has changed to 0.65, as shown by the dotted line in Figure 3. As compared to the new average OD value for all twelve near-IR sources, source No. 8 has an OD value of -0.55 and an n (new) value of -0.1.
- In the present invention, the computer compensates for Optical Density variations between the subsequent and initial optical densities for each of the near-IR sources so as to provide an analysis corrected for bias shift. A formula that the computer can utilize to determine the percent protein in cereal grain in a near infrared instrument that corrects for bias shift according to the invention is as follows:

- The present invention thus provides a method and apparatus for correcting bias shift in near infrared quantitative analysis instruments that irradiate a sample with a plurality of near infrared emitting sources.
Claims (4)
- Apparatus for near-infrared quantitative analysis correcting for bias shift, comprising:a) a plurality of near-infrared emitting sources (16,18,20,22,24) for transmitting near-infrared energy through a sample (S) to be quantitatively analysed;b) sensor means (56) for detecting near-infrared energy transmitted through the sample (S), and for providing a signal corresponding to the detected amount of near-infrared energy transmitted through the sample (S) for each of said plurality of near-infrared emitting sources (16,18,20,22, 24); andc) a computer (54) which receives signals from said sensor means (56),characterised in that the computer (54) calculates and stores individual initial Optical Density (OD) values of a calibration standard for each of said plurality of near-infrared emitting sources (16,18,20,22,24) based on said received signals, calculates an average initial OD value of said calibration standard from the individual initial OD values, and calculates a true OD value for each of said plurality of near-infrared emitting sources (16,18,20,22,24) by subtracting said average initial OD value from each of said individual initial OD values, and wherein said computer (54) further calculates and stores individual subsequent OD values of said calibration standard for each of said plurality of near-infrared emitting sources (16,18,20,22,24) based on said received signals, calculates an average subsequent OD value of said calibration standard from the individual subsequent OD values, calculates a new OD value for each of said plurality of near-infrared emitting sources (16,18,20,22,24) by subtracting said average subsequent OD value from each of said individual subsequent OD values, and corrects a quantitative measurement of a sample (S) for bias shift by using said true OD values and said new OD values according to a predetermined correction formula.
- The apparatus of claim 1 wherein each near infrared source includes an IRED and a corresponding narrow band-pass filter.
- The apparatus of claim 1 wherein the calibration standard is air.
- A method for correcting a quantitative measurement for bias shift in a near-infrared quantitative analysis instrument which irradiates a sample (S) with near-infrared energy emitted from a plurality of near-infrared emitting sources (16,18,20,22,24) and provides a signal corresponding to the detected amount of near-infrared energy tranmsitting through the sample (S) for each of said plurality of near-infrared emitting sources (16,18,20,22,24), comprising the steps of:a) calculating individual initial Optical Density (OD) values of a calibration standard for each of said plurality of near-infrared emitting sources (16,18,20,22,24) based on said provided signals;b) calculating an average initial OD value of said calibration standard from the individual initial OD values;c) calculating a true OD value for each of said plurality of near-infrared emitting sources (16,18,20,22,24) by subtracting said average initial OD value from each of said individual initial OD values;d) calculating individual subsequent OD values of said calibration standard for each of said plurality of near-infrared emitting sources (16,18,20,22,24) based on said provided signals;e) calculating an average subsequent OD value of said calibration standard from the individual subsequent OD values;f) calculating a new OD value for each of said plurality of near-infrared emitting sources (16,18,20,22,24) by subtracting said average subseqent OD value from each of said individual subsequent OD values; andg) correcting a quantitative measurement of a sample (S) for bias shift by using said true OD values and said new OD values according to a predetermined correction formula.
Applications Claiming Priority (3)
| Application Number | Priority Date | Filing Date | Title |
|---|---|---|---|
| US07/286,740 US4970671A (en) | 1988-12-20 | 1988-12-20 | Bias drift compensation in near infrared quantitative analysis instruments |
| US286740 | 1988-12-20 | ||
| PCT/US1989/005772 WO1990007160A1 (en) | 1988-12-20 | 1989-12-19 | Bias drift compensation in near infrared quantitative analysis instruments |
Publications (3)
| Publication Number | Publication Date |
|---|---|
| EP0449992A1 EP0449992A1 (en) | 1991-10-09 |
| EP0449992A4 EP0449992A4 (en) | 1992-05-06 |
| EP0449992B1 true EP0449992B1 (en) | 1996-02-07 |
Family
ID=23099964
Family Applications (1)
| Application Number | Title | Priority Date | Filing Date |
|---|---|---|---|
| EP90903575A Expired - Lifetime EP0449992B1 (en) | 1988-12-20 | 1989-12-19 | Bias drift compensation in near infrared quantitative analysis instruments |
Country Status (6)
| Country | Link |
|---|---|
| US (1) | US4970671A (en) |
| EP (1) | EP0449992B1 (en) |
| AT (1) | ATE134038T1 (en) |
| AU (1) | AU5152090A (en) |
| DE (1) | DE68925647D1 (en) |
| WO (1) | WO1990007160A1 (en) |
Families Citing this family (7)
| Publication number | Priority date | Publication date | Assignee | Title |
|---|---|---|---|---|
| US5332974A (en) * | 1990-05-01 | 1994-07-26 | Hewlett-Packard Company | Network analyzer performance verification |
| AT399053B (en) * | 1991-09-20 | 1995-03-27 | Avl Verbrennungskraft Messtech | MEASURING DEVICE FOR DETERMINING PROPERTIES OF A SAMPLE |
| US5279505A (en) * | 1992-11-02 | 1994-01-18 | Comguard, Inc. | Apparatus for securely attaching a casing to a person |
| US5822225A (en) * | 1994-09-21 | 1998-10-13 | Ericsson Raynet Corporation | Self-calibrating data processors and methods for calibrating same |
| WO1996024832A1 (en) * | 1995-02-09 | 1996-08-15 | Foss Electric A/S | A method for standardizing a spectrometer |
| US6404500B1 (en) | 1999-01-25 | 2002-06-11 | Aqua Check Systems, Inc | Colorimeter apparatus and related process |
| US6559655B1 (en) | 2001-04-30 | 2003-05-06 | Zeltex, Inc. | System and method for analyzing agricultural products on harvesting equipment |
Family Cites Families (8)
| Publication number | Priority date | Publication date | Assignee | Title |
|---|---|---|---|---|
| US3681577A (en) * | 1970-10-30 | 1972-08-01 | Technicon Instr | Automatic calibration apparatus |
| US4040747A (en) * | 1972-08-24 | 1977-08-09 | Neotec Corporation | Optical analyzer for agricultural products |
| US4171913A (en) * | 1972-12-20 | 1979-10-23 | Varian Techtron Proprietary Limited | Spectrophotometer |
| US4286327A (en) * | 1979-09-10 | 1981-08-25 | Trebor Industries, Inc. | Apparatus for near infrared quantitative analysis |
| US4404642A (en) * | 1981-05-15 | 1983-09-13 | Trebor Industries, Inc. | Apparatus for near infrared quantitative analysis with temperature variation correction |
| US4744657A (en) * | 1985-07-11 | 1988-05-17 | Beckman Instruments, Inc. | Method and record for calibration of a spectrophotometer |
| US4684245A (en) * | 1985-10-28 | 1987-08-04 | Oximetrix, Inc. | Electro-optical coupler for catheter oximeter |
| US4687934A (en) * | 1986-01-10 | 1987-08-18 | Andros Analyzers Incorporated | Infrared gas analyzer with automatic zero adjustment |
-
1988
- 1988-12-20 US US07/286,740 patent/US4970671A/en not_active Expired - Lifetime
-
1989
- 1989-12-19 AT AT90903575T patent/ATE134038T1/en not_active IP Right Cessation
- 1989-12-19 EP EP90903575A patent/EP0449992B1/en not_active Expired - Lifetime
- 1989-12-19 DE DE68925647T patent/DE68925647D1/en not_active Expired - Lifetime
- 1989-12-19 WO PCT/US1989/005772 patent/WO1990007160A1/en not_active Ceased
- 1989-12-19 AU AU51520/90A patent/AU5152090A/en not_active Abandoned
Also Published As
| Publication number | Publication date |
|---|---|
| ATE134038T1 (en) | 1996-02-15 |
| WO1990007160A1 (en) | 1990-06-28 |
| DE68925647D1 (en) | 1996-03-21 |
| EP0449992A4 (en) | 1992-05-06 |
| AU5152090A (en) | 1990-07-10 |
| US4970671A (en) | 1990-11-13 |
| EP0449992A1 (en) | 1991-10-09 |
Similar Documents
| Publication | Publication Date | Title |
|---|---|---|
| US4627008A (en) | Optical quantitative analysis using curvilinear interpolation | |
| US5365066A (en) | Low cost means for increasing measurement sensitivity in LED/IRED near-infrared instruments | |
| US5088493A (en) | Multiple wavelength light photometer for non-invasive monitoring | |
| US5218207A (en) | Using led harmonic wavelengths for near-infrared quantitative | |
| EP0290279B1 (en) | Examination apparatus for measuring oxygenation | |
| US5703364A (en) | Method and apparatus for near-infrared quantitative analysis | |
| CA1137785A (en) | Apparatus for near infrared quantitative analysis | |
| US4466076A (en) | Apparatus for near infrared quantitative analysis with temperature variation correction | |
| US7881892B2 (en) | Standardization methods for correcting spectral differences across multiple spectroscopic instruments | |
| US7095491B2 (en) | Device and method for measuring constituents in blood | |
| CA1127865A (en) | Method and device for analysis with color identification test paper | |
| US5974337A (en) | Method and apparatus for rapid non-invasive determination of blood composition parameters | |
| US20050197790A1 (en) | Method of determining an analyte concentration in a sample from an absorption spectrum | |
| RU2383881C2 (en) | Spectrometric measuring head for harvesting and other agricultural machines | |
| US4404642A (en) | Apparatus for near infrared quantitative analysis with temperature variation correction | |
| RU2004123207A (en) | METHOD FOR ANALYSIS OF HEMOGLOBIN AND SYSTEM FOR ITS IMPLEMENTATION | |
| JPH06186159A (en) | Non-destructive measurement method for fruits sugar degree with near-infrared transmission spectrum | |
| EP0121404B1 (en) | A photometric light absorption measuring apparatus | |
| CN1314368C (en) | Method and apparatus for measuring a concentration of a component in a subject | |
| EP0449992B1 (en) | Bias drift compensation in near infrared quantitative analysis instruments | |
| CA2283154C (en) | Method and apparatus for measurement of blood substitutes | |
| Kuenstner et al. | Measurement of hemoglobin in unlysed blood by near-infrared spectroscopy | |
| Hamid et al. | Rapid spectrophotometric analysis of the chemical composition of tobacco | |
| EP0623307A1 (en) | Non-invasive determination of constituent concentration using non-continuous radiation | |
| JP3524976B2 (en) | Concentration measuring device |
Legal Events
| Date | Code | Title | Description |
|---|---|---|---|
| PUAI | Public reference made under article 153(3) epc to a published international application that has entered the european phase |
Free format text: ORIGINAL CODE: 0009012 |
|
| 17P | Request for examination filed |
Effective date: 19910527 |
|
| AK | Designated contracting states |
Kind code of ref document: A1 Designated state(s): AT BE CH DE ES FR GB IT LI LU NL SE |
|
| A4 | Supplementary search report drawn up and despatched |
Effective date: 19920316 |
|
| AK | Designated contracting states |
Kind code of ref document: A4 Designated state(s): AT BE CH DE ES FR GB IT LI LU NL SE |
|
| 17Q | First examination report despatched |
Effective date: 19940926 |
|
| RAP1 | Party data changed (applicant data changed or rights of an application transferred) |
Owner name: FUTREX, INC. |
|
| GRAA | (expected) grant |
Free format text: ORIGINAL CODE: 0009210 |
|
| AK | Designated contracting states |
Kind code of ref document: B1 Designated state(s): AT BE CH DE ES FR GB IT LI LU NL SE |
|
| PG25 | Lapsed in a contracting state [announced via postgrant information from national office to epo] |
Ref country code: IT Free format text: LAPSE BECAUSE OF FAILURE TO SUBMIT A TRANSLATION OF THE DESCRIPTION OR TO PAY THE FEE WITHIN THE PRESCRIBED TIME-LIMIT;WARNING: LAPSES OF ITALIAN PATENTS WITH EFFECTIVE DATE BEFORE 2007 MAY HAVE OCCURRED AT ANY TIME BEFORE 2007. THE CORRECT EFFECTIVE DATE MAY BE DIFFERENT FROM THE ONE RECORDED. Effective date: 19960207 Ref country code: ES Free format text: THE PATENT HAS BEEN ANNULLED BY A DECISION OF A NATIONAL AUTHORITY Effective date: 19960207 Ref country code: BE Effective date: 19960207 Ref country code: AT Effective date: 19960207 Ref country code: CH Effective date: 19960207 Ref country code: LI Effective date: 19960207 Ref country code: NL Free format text: LAPSE BECAUSE OF FAILURE TO SUBMIT A TRANSLATION OF THE DESCRIPTION OR TO PAY THE FEE WITHIN THE PRESCRIBED TIME-LIMIT Effective date: 19960207 Ref country code: FR Effective date: 19960207 |
|
| REF | Corresponds to: |
Ref document number: 134038 Country of ref document: AT Date of ref document: 19960215 Kind code of ref document: T |
|
| REF | Corresponds to: |
Ref document number: 68925647 Country of ref document: DE Date of ref document: 19960321 |
|
| PG25 | Lapsed in a contracting state [announced via postgrant information from national office to epo] |
Ref country code: SE Effective date: 19960507 |
|
| PG25 | Lapsed in a contracting state [announced via postgrant information from national office to epo] |
Ref country code: DE Effective date: 19960508 |
|
| NLV1 | Nl: lapsed or annulled due to failure to fulfill the requirements of art. 29p and 29m of the patents act | ||
| EN | Fr: translation not filed | ||
| REG | Reference to a national code |
Ref country code: CH Ref legal event code: PL |
|
| PG25 | Lapsed in a contracting state [announced via postgrant information from national office to epo] |
Ref country code: GB Effective date: 19961219 |
|
| PLBE | No opposition filed within time limit |
Free format text: ORIGINAL CODE: 0009261 |
|
| STAA | Information on the status of an ep patent application or granted ep patent |
Free format text: STATUS: NO OPPOSITION FILED WITHIN TIME LIMIT |
|
| PG25 | Lapsed in a contracting state [announced via postgrant information from national office to epo] |
Ref country code: LU Free format text: LAPSE BECAUSE OF NON-PAYMENT OF DUE FEES Effective date: 19961231 |
|
| 26N | No opposition filed | ||
| GBPC | Gb: european patent ceased through non-payment of renewal fee |
Effective date: 19961219 |