EP0419223B1 - Characterizing biological matter in a dynamic condition using near infrared spectroscopy - Google Patents
Characterizing biological matter in a dynamic condition using near infrared spectroscopy Download PDFInfo
- Publication number
- EP0419223B1 EP0419223B1 EP90310219A EP90310219A EP0419223B1 EP 0419223 B1 EP0419223 B1 EP 0419223B1 EP 90310219 A EP90310219 A EP 90310219A EP 90310219 A EP90310219 A EP 90310219A EP 0419223 B1 EP0419223 B1 EP 0419223B1
- Authority
- EP
- European Patent Office
- Prior art keywords
- property
- blood
- near infrared
- spectra
- analyzed
- Prior art date
- Legal status (The legal status is an assumption and is not a legal conclusion. Google has not performed a legal analysis and makes no representation as to the accuracy of the status listed.)
- Expired - Lifetime
Links
- 238000004497 NIR spectroscopy Methods 0.000 title 1
- 238000000034 method Methods 0.000 claims description 150
- 239000008280 blood Substances 0.000 claims description 142
- 210000004369 blood Anatomy 0.000 claims description 140
- 238000001228 spectrum Methods 0.000 claims description 123
- 108010054147 Hemoglobins Proteins 0.000 claims description 117
- 102000001554 Hemoglobins Human genes 0.000 claims description 117
- 229910052760 oxygen Inorganic materials 0.000 claims description 110
- QVGXLLKOCUKJST-UHFFFAOYSA-N atomic oxygen Chemical compound [O] QVGXLLKOCUKJST-UHFFFAOYSA-N 0.000 claims description 109
- 239000001301 oxygen Substances 0.000 claims description 109
- 238000005534 hematocrit Methods 0.000 claims description 93
- 238000007781 pre-processing Methods 0.000 claims description 73
- 238000012549 training Methods 0.000 claims description 60
- 230000003595 spectral effect Effects 0.000 claims description 55
- XLYOFNOQVPJJNP-UHFFFAOYSA-N water Substances O XLYOFNOQVPJJNP-UHFFFAOYSA-N 0.000 claims description 55
- 238000002835 absorbance Methods 0.000 claims description 52
- 241001465754 Metazoa Species 0.000 claims description 26
- 238000002329 infrared spectrum Methods 0.000 claims description 23
- INGWEZCOABYORO-UHFFFAOYSA-N 2-(furan-2-yl)-7-methyl-1h-1,8-naphthyridin-4-one Chemical compound N=1C2=NC(C)=CC=C2C(O)=CC=1C1=CC=CO1 INGWEZCOABYORO-UHFFFAOYSA-N 0.000 claims description 8
- 238000012544 monitoring process Methods 0.000 claims description 8
- 108010064719 Oxyhemoglobins Proteins 0.000 claims description 7
- 238000011481 absorbance measurement Methods 0.000 claims description 7
- 108010002255 deoxyhemoglobin Proteins 0.000 claims description 7
- 230000001678 irradiating effect Effects 0.000 claims description 6
- 238000000862 absorption spectrum Methods 0.000 claims description 5
- 230000017531 blood circulation Effects 0.000 claims description 3
- 238000012886 linear function Methods 0.000 claims 1
- 239000000523 sample Substances 0.000 description 86
- 238000004458 analytical method Methods 0.000 description 44
- 210000004027 cell Anatomy 0.000 description 40
- 238000011002 quantification Methods 0.000 description 29
- 230000009466 transformation Effects 0.000 description 26
- 238000005259 measurement Methods 0.000 description 22
- 238000012417 linear regression Methods 0.000 description 17
- 238000001514 detection method Methods 0.000 description 16
- 230000000694 effects Effects 0.000 description 16
- 210000003743 erythrocyte Anatomy 0.000 description 16
- 238000002474 experimental method Methods 0.000 description 14
- 239000000306 component Substances 0.000 description 12
- 238000000611 regression analysis Methods 0.000 description 11
- 239000013060 biological fluid Substances 0.000 description 10
- 238000010200 validation analysis Methods 0.000 description 10
- 230000008859 change Effects 0.000 description 9
- 239000007789 gas Substances 0.000 description 9
- 210000002381 plasma Anatomy 0.000 description 8
- 238000002347 injection Methods 0.000 description 7
- 239000007924 injection Substances 0.000 description 7
- 238000004519 manufacturing process Methods 0.000 description 7
- 238000005065 mining Methods 0.000 description 7
- 238000006213 oxygenation reaction Methods 0.000 description 7
- 238000010183 spectrum analysis Methods 0.000 description 7
- 206010002091 Anaesthesia Diseases 0.000 description 6
- FAPWRFPIFSIZLT-UHFFFAOYSA-M Sodium chloride Chemical compound [Na+].[Cl-] FAPWRFPIFSIZLT-UHFFFAOYSA-M 0.000 description 6
- 230000004075 alteration Effects 0.000 description 6
- 238000001949 anaesthesia Methods 0.000 description 6
- 230000037005 anaesthesia Effects 0.000 description 6
- 238000000149 argon plasma sintering Methods 0.000 description 6
- 230000000875 corresponding effect Effects 0.000 description 6
- 238000004868 gas analysis Methods 0.000 description 6
- 238000005070 sampling Methods 0.000 description 6
- 239000000243 solution Substances 0.000 description 6
- 239000000126 substance Substances 0.000 description 6
- 238000012360 testing method Methods 0.000 description 6
- 230000036772 blood pressure Effects 0.000 description 5
- 230000001419 dependent effect Effects 0.000 description 5
- 239000000463 material Substances 0.000 description 5
- 235000005338 Allium tuberosum Nutrition 0.000 description 4
- 244000003377 Allium tuberosum Species 0.000 description 4
- IJGRMHOSHXDMSA-UHFFFAOYSA-N Atomic nitrogen Chemical compound N#N IJGRMHOSHXDMSA-UHFFFAOYSA-N 0.000 description 4
- 241000282465 Canis Species 0.000 description 4
- 210000001105 femoral artery Anatomy 0.000 description 4
- 230000002452 interceptive effect Effects 0.000 description 4
- 230000005855 radiation Effects 0.000 description 4
- 230000003068 static effect Effects 0.000 description 4
- 230000032258 transport Effects 0.000 description 4
- 241000282472 Canis lupus familiaris Species 0.000 description 3
- XUIMIQQOPSSXEZ-UHFFFAOYSA-N Silicon Chemical compound [Si] XUIMIQQOPSSXEZ-UHFFFAOYSA-N 0.000 description 3
- 230000008033 biological extinction Effects 0.000 description 3
- 230000015572 biosynthetic process Effects 0.000 description 3
- HGAZMNJKRQFZKS-UHFFFAOYSA-N chloroethene;ethenyl acetate Chemical compound ClC=C.CC(=O)OC=C HGAZMNJKRQFZKS-UHFFFAOYSA-N 0.000 description 3
- 230000002596 correlated effect Effects 0.000 description 3
- 230000007423 decrease Effects 0.000 description 3
- 238000011161 development Methods 0.000 description 3
- 229920000669 heparin Polymers 0.000 description 3
- 230000002934 lysing effect Effects 0.000 description 3
- 239000000203 mixture Substances 0.000 description 3
- 230000003287 optical effect Effects 0.000 description 3
- 238000012545 processing Methods 0.000 description 3
- ZUFQODAHGAHPFQ-UHFFFAOYSA-N pyridoxine hydrochloride Chemical compound Cl.CC1=NC=C(CO)C(CO)=C1O ZUFQODAHGAHPFQ-UHFFFAOYSA-N 0.000 description 3
- 238000011160 research Methods 0.000 description 3
- 238000000926 separation method Methods 0.000 description 3
- 229910052710 silicon Inorganic materials 0.000 description 3
- 239000010703 silicon Substances 0.000 description 3
- 239000011780 sodium chloride Substances 0.000 description 3
- WFKWXMTUELFFGS-UHFFFAOYSA-N tungsten Chemical compound [W] WFKWXMTUELFFGS-UHFFFAOYSA-N 0.000 description 3
- 229910052721 tungsten Inorganic materials 0.000 description 3
- 239000010937 tungsten Substances 0.000 description 3
- MYMOFIZGZYHOMD-UHFFFAOYSA-N Dioxygen Chemical compound O=O MYMOFIZGZYHOMD-UHFFFAOYSA-N 0.000 description 2
- WQZGKKKJIJFFOK-GASJEMHNSA-N Glucose Natural products OC[C@H]1OC(O)[C@H](O)[C@@H](O)[C@@H]1O WQZGKKKJIJFFOK-GASJEMHNSA-N 0.000 description 2
- PIWKPBJCKXDKJR-UHFFFAOYSA-N Isoflurane Chemical compound FC(F)OC(Cl)C(F)(F)F PIWKPBJCKXDKJR-UHFFFAOYSA-N 0.000 description 2
- 241000124008 Mammalia Species 0.000 description 2
- BQCADISMDOOEFD-UHFFFAOYSA-N Silver Chemical compound [Ag] BQCADISMDOOEFD-UHFFFAOYSA-N 0.000 description 2
- 229920003027 Thinsulate Polymers 0.000 description 2
- 239000004789 Thinsulate Substances 0.000 description 2
- 239000012491 analyte Substances 0.000 description 2
- 239000003146 anticoagulant agent Substances 0.000 description 2
- 229940127219 anticoagulant drug Drugs 0.000 description 2
- 230000005540 biological transmission Effects 0.000 description 2
- 210000000601 blood cell Anatomy 0.000 description 2
- 238000010241 blood sampling Methods 0.000 description 2
- 210000004204 blood vessel Anatomy 0.000 description 2
- 230000036760 body temperature Effects 0.000 description 2
- 230000004087 circulation Effects 0.000 description 2
- 238000010586 diagram Methods 0.000 description 2
- 238000000502 dialysis Methods 0.000 description 2
- 230000005284 excitation Effects 0.000 description 2
- 210000003191 femoral vein Anatomy 0.000 description 2
- 239000005357 flat glass Substances 0.000 description 2
- 239000012530 fluid Substances 0.000 description 2
- 239000008103 glucose Substances 0.000 description 2
- ZFGMDIBRIDKWMY-PASTXAENSA-N heparin Chemical compound CC(O)=N[C@@H]1[C@@H](O)[C@H](O)[C@@H](COS(O)(=O)=O)O[C@@H]1O[C@@H]1[C@@H](C(O)=O)O[C@@H](O[C@H]2[C@@H]([C@@H](OS(O)(=O)=O)[C@@H](O[C@@H]3[C@@H](OC(O)[C@H](OS(O)(=O)=O)[C@H]3O)C(O)=O)O[C@@H]2O)CS(O)(=O)=O)[C@H](O)[C@H]1O ZFGMDIBRIDKWMY-PASTXAENSA-N 0.000 description 2
- 230000000977 initiatory effect Effects 0.000 description 2
- 229960002725 isoflurane Drugs 0.000 description 2
- 239000012528 membrane Substances 0.000 description 2
- 229910052757 nitrogen Inorganic materials 0.000 description 2
- 238000002496 oximetry Methods 0.000 description 2
- 238000010238 partial least squares regression Methods 0.000 description 2
- 239000004033 plastic Substances 0.000 description 2
- 229920003023 plastic Polymers 0.000 description 2
- 238000012628 principal component regression Methods 0.000 description 2
- 230000035945 sensitivity Effects 0.000 description 2
- 229910052709 silver Inorganic materials 0.000 description 2
- 239000004332 silver Substances 0.000 description 2
- 241000894007 species Species 0.000 description 2
- 210000001519 tissue Anatomy 0.000 description 2
- 238000002834 transmittance Methods 0.000 description 2
- 230000000472 traumatic effect Effects 0.000 description 2
- 125000000391 vinyl group Chemical group [H]C([*])=C([H])[H] 0.000 description 2
- 229920002554 vinyl polymer Polymers 0.000 description 2
- VCLJODPNBNEBKW-UHFFFAOYSA-N 2,2,4,4,6,8,8-heptamethylnonane Chemical compound CC(C)(C)CC(C)CC(C)(C)CC(C)(C)C VCLJODPNBNEBKW-UHFFFAOYSA-N 0.000 description 1
- FQRHOOHLUYHMGG-BTJKTKAUSA-N 3-(2-acetylphenothiazin-10-yl)propyl-dimethylazanium;(z)-4-hydroxy-4-oxobut-2-enoate Chemical compound OC(=O)\C=C/C(O)=O.C1=C(C(C)=O)C=C2N(CCCN(C)C)C3=CC=CC=C3SC2=C1 FQRHOOHLUYHMGG-BTJKTKAUSA-N 0.000 description 1
- JBRZTFJDHDCESZ-UHFFFAOYSA-N AsGa Chemical compound [As]#[Ga] JBRZTFJDHDCESZ-UHFFFAOYSA-N 0.000 description 1
- 229930003347 Atropine Natural products 0.000 description 1
- XFXPMWWXUTWYJX-UHFFFAOYSA-N Cyanide Chemical compound N#[C-] XFXPMWWXUTWYJX-UHFFFAOYSA-N 0.000 description 1
- 229910001218 Gallium arsenide Inorganic materials 0.000 description 1
- 229910000530 Gallium indium arsenide Inorganic materials 0.000 description 1
- HTTJABKRGRZYRN-UHFFFAOYSA-N Heparin Chemical compound OC1C(NC(=O)C)C(O)OC(COS(O)(=O)=O)C1OC1C(OS(O)(=O)=O)C(O)C(OC2C(C(OS(O)(=O)=O)C(OC3C(C(O)C(O)C(O3)C(O)=O)OS(O)(=O)=O)C(CO)O2)NS(O)(=O)=O)C(C(O)=O)O1 HTTJABKRGRZYRN-UHFFFAOYSA-N 0.000 description 1
- 241001669134 Heraeus Species 0.000 description 1
- 101000823271 Homo sapiens Tyrosine-protein kinase ABL2 Proteins 0.000 description 1
- RKUNBYITZUJHSG-UHFFFAOYSA-N Hyosciamin-hydrochlorid Natural products CN1C(C2)CCC1CC2OC(=O)C(CO)C1=CC=CC=C1 RKUNBYITZUJHSG-UHFFFAOYSA-N 0.000 description 1
- 108010061951 Methemoglobin Proteins 0.000 description 1
- 239000012891 Ringer solution Substances 0.000 description 1
- BUGBHKTXTAQXES-UHFFFAOYSA-N Selenium Chemical compound [Se] BUGBHKTXTAQXES-UHFFFAOYSA-N 0.000 description 1
- 239000004809 Teflon Substances 0.000 description 1
- 229920006362 Teflon® Polymers 0.000 description 1
- LYZGJWXNOGIVQA-UHFFFAOYSA-M Thiamylal sodium Chemical compound [Na+].CCCC(C)C1(CC=C)C(=O)NC([S-])=NC1=O LYZGJWXNOGIVQA-UHFFFAOYSA-M 0.000 description 1
- 102100022651 Tyrosine-protein kinase ABL2 Human genes 0.000 description 1
- 208000027418 Wounds and injury Diseases 0.000 description 1
- HOBWAPHTEJGALG-JKCMADFCSA-N [(1r,5s)-8-methyl-8-azoniabicyclo[3.2.1]octan-3-yl] 3-hydroxy-2-phenylpropanoate;sulfate Chemical compound [O-]S([O-])(=O)=O.C([C@H]1CC[C@@H](C2)[NH+]1C)C2OC(=O)C(CO)C1=CC=CC=C1.C([C@H]1CC[C@@H](C2)[NH+]1C)C2OC(=O)C(CO)C1=CC=CC=C1 HOBWAPHTEJGALG-JKCMADFCSA-N 0.000 description 1
- KXNLCSXBJCPWGL-UHFFFAOYSA-N [Ga].[As].[In] Chemical compound [Ga].[As].[In] KXNLCSXBJCPWGL-UHFFFAOYSA-N 0.000 description 1
- 230000002159 abnormal effect Effects 0.000 description 1
- 238000010521 absorption reaction Methods 0.000 description 1
- 229960005054 acepromazine Drugs 0.000 description 1
- NOSIYYJFMPDDSA-UHFFFAOYSA-N acepromazine Chemical compound C1=C(C(C)=O)C=C2N(CCCN(C)C)C3=CC=CC=C3SC2=C1 NOSIYYJFMPDDSA-UHFFFAOYSA-N 0.000 description 1
- 229960001946 acepromazine maleate Drugs 0.000 description 1
- 230000006978 adaptation Effects 0.000 description 1
- 210000000577 adipose tissue Anatomy 0.000 description 1
- 238000005054 agglomeration Methods 0.000 description 1
- 230000002776 aggregation Effects 0.000 description 1
- 208000007502 anemia Diseases 0.000 description 1
- 238000013459 approach Methods 0.000 description 1
- 239000007864 aqueous solution Substances 0.000 description 1
- 238000003491 array Methods 0.000 description 1
- 229960000396 atropine Drugs 0.000 description 1
- RKUNBYITZUJHSG-SPUOUPEWSA-N atropine Chemical compound O([C@H]1C[C@H]2CC[C@@H](C1)N2C)C(=O)C(CO)C1=CC=CC=C1 RKUNBYITZUJHSG-SPUOUPEWSA-N 0.000 description 1
- 229960002028 atropine sulfate Drugs 0.000 description 1
- 238000005452 bending Methods 0.000 description 1
- 239000012472 biological sample Substances 0.000 description 1
- 239000012503 blood component Substances 0.000 description 1
- 238000004364 calculation method Methods 0.000 description 1
- 230000004656 cell transport Effects 0.000 description 1
- 238000007385 chemical modification Methods 0.000 description 1
- 239000003153 chemical reaction reagent Substances 0.000 description 1
- 239000003795 chemical substances by application Substances 0.000 description 1
- 210000000038 chest Anatomy 0.000 description 1
- 238000003759 clinical diagnosis Methods 0.000 description 1
- 239000012141 concentrate Substances 0.000 description 1
- 238000010276 construction Methods 0.000 description 1
- 230000036757 core body temperature Effects 0.000 description 1
- 108700042971 cyanomethemoglobin Proteins 0.000 description 1
- 230000006378 damage Effects 0.000 description 1
- 238000007405 data analysis Methods 0.000 description 1
- 230000001934 delay Effects 0.000 description 1
- 230000002939 deleterious effect Effects 0.000 description 1
- 238000003745 diagnosis Methods 0.000 description 1
- 230000003292 diminished effect Effects 0.000 description 1
- 239000006185 dispersion Substances 0.000 description 1
- 238000002224 dissection Methods 0.000 description 1
- 230000009977 dual effect Effects 0.000 description 1
- 230000002526 effect on cardiovascular system Effects 0.000 description 1
- 230000003911 electrolyte status Effects 0.000 description 1
- 230000005670 electromagnetic radiation Effects 0.000 description 1
- 235000020774 essential nutrients Nutrition 0.000 description 1
- 238000001914 filtration Methods 0.000 description 1
- 230000006870 function Effects 0.000 description 1
- 229910052732 germanium Inorganic materials 0.000 description 1
- GNPVGFCGXDBREM-UHFFFAOYSA-N germanium atom Chemical compound [Ge] GNPVGFCGXDBREM-UHFFFAOYSA-N 0.000 description 1
- 230000036541 health Effects 0.000 description 1
- 229960002897 heparin Drugs 0.000 description 1
- 229960001008 heparin sodium Drugs 0.000 description 1
- 230000003284 homeostatic effect Effects 0.000 description 1
- 230000013632 homeostatic process Effects 0.000 description 1
- 239000001257 hydrogen Substances 0.000 description 1
- 229910052739 hydrogen Inorganic materials 0.000 description 1
- 238000001727 in vivo Methods 0.000 description 1
- 208000014674 injury Diseases 0.000 description 1
- 230000000968 intestinal effect Effects 0.000 description 1
- 210000004731 jugular vein Anatomy 0.000 description 1
- 229940056932 lead sulfide Drugs 0.000 description 1
- 229910052981 lead sulfide Inorganic materials 0.000 description 1
- 210000002414 leg Anatomy 0.000 description 1
- 210000000265 leukocyte Anatomy 0.000 description 1
- 150000002632 lipids Chemical class 0.000 description 1
- 239000007788 liquid Substances 0.000 description 1
- 230000004199 lung function Effects 0.000 description 1
- 238000012067 mathematical method Methods 0.000 description 1
- 230000035800 maturation Effects 0.000 description 1
- 238000000691 measurement method Methods 0.000 description 1
- 230000007246 mechanism Effects 0.000 description 1
- 229910052751 metal Inorganic materials 0.000 description 1
- 239000002184 metal Substances 0.000 description 1
- 230000036961 partial effect Effects 0.000 description 1
- 239000002245 particle Substances 0.000 description 1
- 230000004962 physiological condition Effects 0.000 description 1
- -1 polytetrafluoroethylene Polymers 0.000 description 1
- 229920001343 polytetrafluoroethylene Polymers 0.000 description 1
- 239000004810 polytetrafluoroethylene Substances 0.000 description 1
- 238000002360 preparation method Methods 0.000 description 1
- 230000008569 process Effects 0.000 description 1
- 239000010453 quartz Substances 0.000 description 1
- 230000002829 reductive effect Effects 0.000 description 1
- 238000001223 reverse osmosis Methods 0.000 description 1
- 239000000932 sedative agent Substances 0.000 description 1
- 230000001624 sedative effect Effects 0.000 description 1
- 229910052711 selenium Inorganic materials 0.000 description 1
- 239000011669 selenium Substances 0.000 description 1
- 230000035939 shock Effects 0.000 description 1
- VYPSYNLAJGMNEJ-UHFFFAOYSA-N silicon dioxide Inorganic materials O=[Si]=O VYPSYNLAJGMNEJ-UHFFFAOYSA-N 0.000 description 1
- 238000002798 spectrophotometry method Methods 0.000 description 1
- 238000007619 statistical method Methods 0.000 description 1
- 238000010254 subcutaneous injection Methods 0.000 description 1
- 239000007929 subcutaneous injection Substances 0.000 description 1
- 238000001356 surgical procedure Methods 0.000 description 1
- 230000002459 sustained effect Effects 0.000 description 1
- 230000001225 therapeutic effect Effects 0.000 description 1
- 229960001525 thiamylal sodium Drugs 0.000 description 1
- 210000003437 trachea Anatomy 0.000 description 1
- 238000002627 tracheal intubation Methods 0.000 description 1
- 238000000844 transformation Methods 0.000 description 1
- 230000001131 transforming effect Effects 0.000 description 1
- 238000000411 transmission spectrum Methods 0.000 description 1
- 239000012780 transparent material Substances 0.000 description 1
- 210000000689 upper leg Anatomy 0.000 description 1
- 230000036642 wellbeing Effects 0.000 description 1
Images


Classifications
-
- A—HUMAN NECESSITIES
- A61—MEDICAL OR VETERINARY SCIENCE; HYGIENE
- A61B—DIAGNOSIS; SURGERY; IDENTIFICATION
- A61B5/00—Measuring for diagnostic purposes; Identification of persons
- A61B5/145—Measuring characteristics of blood in vivo, e.g. gas concentration, pH value; Measuring characteristics of body fluids or tissues, e.g. interstitial fluid, cerebral tissue
- A61B5/14535—Measuring characteristics of blood in vivo, e.g. gas concentration, pH value; Measuring characteristics of body fluids or tissues, e.g. interstitial fluid, cerebral tissue for measuring haematocrit
-
- A—HUMAN NECESSITIES
- A61—MEDICAL OR VETERINARY SCIENCE; HYGIENE
- A61B—DIAGNOSIS; SURGERY; IDENTIFICATION
- A61B5/00—Measuring for diagnostic purposes; Identification of persons
- A61B5/145—Measuring characteristics of blood in vivo, e.g. gas concentration, pH value; Measuring characteristics of body fluids or tissues, e.g. interstitial fluid, cerebral tissue
- A61B5/1455—Measuring characteristics of blood in vivo, e.g. gas concentration, pH value; Measuring characteristics of body fluids or tissues, e.g. interstitial fluid, cerebral tissue using optical sensors, e.g. spectral photometrical oximeters
- A61B5/14551—Measuring characteristics of blood in vivo, e.g. gas concentration, pH value; Measuring characteristics of body fluids or tissues, e.g. interstitial fluid, cerebral tissue using optical sensors, e.g. spectral photometrical oximeters for measuring blood gases
- A61B5/14557—Measuring characteristics of blood in vivo, e.g. gas concentration, pH value; Measuring characteristics of body fluids or tissues, e.g. interstitial fluid, cerebral tissue using optical sensors, e.g. spectral photometrical oximeters for measuring blood gases specially adapted to extracorporeal circuits
-
- A—HUMAN NECESSITIES
- A61—MEDICAL OR VETERINARY SCIENCE; HYGIENE
- A61B—DIAGNOSIS; SURGERY; IDENTIFICATION
- A61B5/00—Measuring for diagnostic purposes; Identification of persons
- A61B5/72—Signal processing specially adapted for physiological signals or for diagnostic purposes
- A61B5/7235—Details of waveform analysis
- A61B5/7239—Details of waveform analysis using differentiation including higher order derivatives
-
- G—PHYSICS
- G01—MEASURING; TESTING
- G01N—INVESTIGATING OR ANALYSING MATERIALS BY DETERMINING THEIR CHEMICAL OR PHYSICAL PROPERTIES
- G01N21/00—Investigating or analysing materials by the use of optical means, i.e. using sub-millimetre waves, infrared, visible or ultraviolet light
- G01N21/17—Systems in which incident light is modified in accordance with the properties of the material investigated
- G01N21/25—Colour; Spectral properties, i.e. comparison of effect of material on the light at two or more different wavelengths or wavelength bands
- G01N21/31—Investigating relative effect of material at wavelengths characteristic of specific elements or molecules, e.g. atomic absorption spectrometry
- G01N21/35—Investigating relative effect of material at wavelengths characteristic of specific elements or molecules, e.g. atomic absorption spectrometry using infrared light
- G01N21/359—Investigating relative effect of material at wavelengths characteristic of specific elements or molecules, e.g. atomic absorption spectrometry using infrared light using near infrared light
-
- G—PHYSICS
- G01—MEASURING; TESTING
- G01N—INVESTIGATING OR ANALYSING MATERIALS BY DETERMINING THEIR CHEMICAL OR PHYSICAL PROPERTIES
- G01N2201/00—Features of devices classified in G01N21/00
- G01N2201/12—Circuits of general importance; Signal processing
- G01N2201/129—Using chemometrical methods
Definitions
- the present invention relates to the analysis of a sample of matter of biological origin in a dynamic condition using the near-infrared (NIR) spectrum of that biological matter having a water content.
- NIR near-infrared
- the method permits prediction of a property of interest because the biological matter may be approximated to contain two compartments where one compartment has a proportionally larger or smaller amount of water than the other compartment having the property of interest.
- Analysis of an unknown sample in a dynamic condition is achieved by use of mathematical techniques developed using a NIR spectral training set of known samples and independent quantification of the property of interest in the known samples in that training set.
- Presence of water in an organism is the common denominator of life.
- the corpus of an organism is compartmentalized with each compartment capable of being distinguished by the amount of water it contains.
- the processes of osmosis and reverse osmosis in an organism act to stabilize this compartmentalization.
- Determination of the volume fraction or percentage concentration of components other than water in the various compartments of biological matter, such as tissue or blood, is often critical to the determination of the well-being or homeostasis of the organism.
- biological matter such as tissue or blood
- the diagnosis of such biological matter provides an excellent medium to assess the homeostatic condition of the organism.
- Hematocrit is the volume fraction of agglomerated erythrocytes in whole blood.
- Hemoglobin is the chemical molecule in the erythrocytes which transports oxygen to the cells. Hemoglobin may take several forms depending on the presence or absence of oxygen or other chemicals which may be bonded to active sites in the hemoglobin molecule. Hematocrit in whole blood has been found to have a suitable direct mathematical correlation to the concentration of hemoglobin, providing the blood has few or no lysed erythrocytes.
- US-A-4 651 741 discloses a method of determining the blood oxygen saturation by measurement of the absorption of the sample in the red and infra red and using the ratio of these measurements and calibration constants in an equation to calculate the saturation of oxygen.
- the calibration constants are hematocrit dependent and their values as a function thereof are contained in a look up table and are selected for the hematocrit level to be measured.
- Water is omnipresent in whole blood. Hemoglobin is dissolved in the erythrocytes, while plasma is principally water. But the amount of water in which hemoglobin is dissolved, and hence in erythroctyes, is comparatively less than the amount of water in the plasma.
- Clinical analysis of an organism requires monitoring of the status of or the changes in condition. As a result of injury or illness or other deleterious biological conditions, the hematocrit or the concentration of hemoglobin in erythrocytes available for oxygen transport to the cells of the organism may be diminished below healthy levels even to the point of critical life sustaining levels. Also, analysis of various types of anemia is vital to continuing successful treatment of a patient, especially in critical care facilities such as emergency rooms, operating rooms, or intensive care units, including neo-natal units. Less traumatic but just as vital, most blood donors must undergo hematocrit testing to assure that their blood to be donated has appropriate hemoglobin levels for later use.
- Hemoglobin concentrations are measured traditionally using lengthy and complicated procedures which require the preconditioning, i.e., chemical modification or component separation, of a blood sample withdrawn from the body.
- the traditional methods destroy the blood, preventing its return to the body.
- hemoglobin One popular method for the determination of hemoglobin involves (1) lysing the red blood cells by hypotonic shock or sonification, (2) removal of the red blood cell membranes to produce a clear solution, (3) addition of a cyanide ion reagent to normalize or convert the various forms of hemoglobin to a single form hemoglobin (e.g., cyanomet hemoglobin), and (4) spectrophotometric analysis to derive the hemoglobin concentration of the normalized sample.
- a cyanide ion reagent to normalize or convert the various forms of hemoglobin to a single form hemoglobin (e.g., cyanomet hemoglobin)
- spectrophotometric analysis to derive the hemoglobin concentration of the normalized sample.
- centrifugal attribution in a test tube of specific diameter centrifugal attribution in a test tube of specific diameter and Coulter counting.
- Centrifugal attribution involves centrifuging of blood withdrawn from the body in a tube of specific diameter at pre-selected centrifugal forces and times that serve to separate the blood into two portions.
- the heavier portion is the agglomeration of erythrocytes in the whole blood.
- the lighter portion is plasma dominated by water.
- the ratio of the volume of the erthrocytes to the total volume of the blood sample in the centrifuge tube is the hematocrit.
- Coulter counting determines hematocrit by physical counting of red blood cells and a determination, through the size of each cell on a cell-by-cell basis, the volume of each. After a predetermined number of blood cells are counted, the hematocrit is determined by the number of red blood cells counted multiplied by the mean volume of the blood cells for a given blood sample.
- U.S. Patent 4,243,883 describes a monitor of a flowing stream of blood using a discrete near-infrared wavelength.
- U.S. Patent 4,745,279 describes a dual path NIR spectral analysis at discrete wavelengths of flowing whole blood.
- U.S. Patent 4,805,623 describes a NIR spectral method and apparatus using multiple wavelengths to determine the concentration of a dilute component of known identity in comparison with a reference component of known concentration.
- the near-infrared (NIR) spectral region of electromagnetic radiation contains absorbance peaks for the various forms of hemoglobin and water.
- NIR near-infrared
- Prior spectral analytical efforts have focused on the measurement of the diffuse transmission or reflectance of near infrared light through blood samples.
- light scattering in the samples and other properties which interfere with accurate measurement cause variances in the specific spectrum taken.
- even using measurements taken with sensitive instrumentation is not satisfactory.
- the choice of specific wavelengths in near-infrared spectra for which whole blood samples may be best monitored is not straightforward due to variances in the broad peaks of water and various forms of hemoglobin in such NIR spectra.
- the present invention provides a method for rapidly, inexpensively, and accurately characterizing the properties of matter of biological origin containing water by analyzing the near-infrared spectrum of the biological matter while in a dynamic condition using techniques useful with NIR spectral instrumentation and predicting the properties without sample preconditioning.
- the techniques seek to minimize the effect of light scattering and use mathematical regression analysis to permit transforming the observed spectrum into a prediction of the property to be analyzed.
- the method of the present invention avoids chemical alteration or physical separation of the components in the sample of biological matter.
- the method also avoids inaccuracies caused by irrelevant variations in samples and instrumental noise in measurement techniques.
- the method of the present invention is founded on the principle that the biological matter may be considered to consist of essentially two compartments: one compartment which has a proportionally different (larger or smaller) amount of water than the other compartment related to or having the property to be analyzed.
- the present invention is also founded on the principle that identification of the volume or weight fraction or concentration of water in the biological matter will serve as the basis for calculation of the property to be analyzed.
- the method of the present invention is further founded on the principle that the establishment of a training set of the combination of NIR spectra of several samples of the biological matter and the independent quantification of the property to be analyzed in each sample provides a source of mathematical comparison for accurately predicting the property to be analyzed in an unknown additional sample by using such mathematical comparison.
- hematocrit or hemoglobin concentration is achieved by obtaining near-infrared spectra of a statistically sufficient number of samples of whole blood to establish a training set for mathematical comparisons against individual additional unknown samples of other whole blood.
- the property to be analyzed in the whole blood e.g., hematocrit or hemoglobin concentration
- hematocrit or hemoglobin concentration is independently quantified by using an independent known technique: lysing and chemical alteration for hemoglobin and Coulter counting or centrifuging for hematocrit.
- the nature of the inter-relationship between the hematocrit or hemoglobin and the water content is statistically correlated to establish the source of comparison when predicting unknown samples.
- a pre-processing technique is employed.
- One useful pre-processing technique is disclosed in European Patent Publication 0 476 192 based on an application claiming priority from U.S. Patent Application Serial Number 07/408,747. That technique is a multiple derivative transformation of the training set spectra and the unknown sample's spectrum to minimize the effect of light scattering and other instrumental noise on the various spectra, in order to allow a mathematical correlation using the multiple derivative of the spectral intensity at a single wavelength to accurately predict the property of the compartment being analyzed in the unknown sample.
- a different and useful type of pre-processing technique is disclosed in European Patent Publication 0 419 222 based on an application claiming priority from U.S. Patent Application Serial Number 07/408,746. That technique is a ratio pre-processing technique which applies a ratio of an absorbance peak of the water content in the biological matter to another absorbance measuring point in order to minimize variations due to sampling techniques and instrumentation factors. This allows the accurate mathematical correlation to predict the property of the compartment being analyzed in the unknown sample.
- the absorbance peak of water in this region is primarily the result of simultaneous excitation of the symmetric O-H stretch, the O-H bending mode, and the antisymmetric O-H stretch of the water molecule, whether existing in the biological matter as free water, bound to other molecules, or other forms.
- the peak of absorbance of water in the 1150-1190 nm range may be largely isolated from the absorbance of hemoglobin, it is not totally isolated. Indeed, it is preferred in the present invention to distinguish between the two principal forms of the hemoglobin component in whole blood, oxyhemoglobin and deoxyhemoglobin, and add that independent variable to the regression analysis which both establishes the training set and predicts the unknown sample's hematocrit or hemoglobin concentration.
- Gathering the training set spectral data for the samples of the biological matter depends on the type of instrumentation to be employed.
- the biological matter is diverted from the body of the organism and returned.
- One embodiment of diversion and return of the biological matter to the patient is an extracorporeal loop described herein.
- Gathering the unknown sample spectral data for analysis also depends on the type of instrumentation to be employed.
- the unknown sample may be diverted from the body of the organism for spectral detection or measurement and returned to the body, or the unknown sample may be analyzed in vivo.
- One embodiment of diversion and return of the biological matter to the patient is the extracorporeal loop described herein.
- Processing and instrumentation variabilities are dependent upon the method by which the training set is established and the method by which the unknown samples are analyzed.
- the biological fluid is moving when being spectrally analyzed, a dynamic condition.
- the whole blood is spectrally analyzed in a dynamic condition either using diffuse transmission detection or reflectance detection as appropriate.
- the NIR spectrum of the unknown sample is obtained from either continuous or discrete wavelength measuring instrumentation. After the spectrum is obtained and subjected to the appropriate pre-processing, the property of interest may be predicted by a mathematical correlation to the training set spectra.
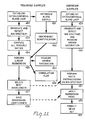
- FIG. 1 is a schematic block diagram of the instrumentation useful in a method carried out in accordance with the present invention.
- FIG. 2 is a schematic flow chart of the methods to mathematically minimize variability of spectral data using multiple derivative transformation techniques and establish the mathematical correlation between known samples and the training set spectra, in order to permit the predicting of the property of interest in an unknown sample by comparison with the mathematical correlation.
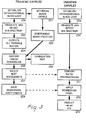
- FIG. 3 is a schematic flow chart of the methods to mathematically minimize variability of spectral data using ratioing techniques and establish the mathematical correlation between known samples and the training set spectra, in order to permit the predicting of the property of interest in an unknown sample by comparison with the mathematical correlation.
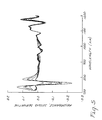
- FIG. 4 is a graphic representation of typical whole blood spectra detected in a dynamic condition indicating the effects of typical light scattering variances and other instrumental noise variances.
- FIG. 5 is a graphic representation of the same whole blood spectra as in FIG. 4 after the application of the multiple derivative transformation to minimize the effects of typical light scattering variances and other instrumental noise variances.
- FIG. 6 is a correlation plot of correlation coefficient versus wavelength for hemoglobin after the spectral data were second derivative pre-processed and regression analysis of the spectral data was performed against hemoglobin.
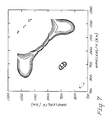
- FIG. 7 is a correlation map of correlation cofficient squared versus wavelength for hemoglobin after ratio pre-processing and regression analysis of the spectral data was performed against hemoglobin.
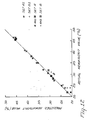
- FIG. 8 is a graph showing the accuracy of prediction of hematocrit after multiple derivative transformation pre-processing compared with actual hematocrit values determined by prior art methods.
- FIG. 9 is a graph showing the accuracy of prediction of hematocrit after ratioing pre-processing compared with actual hematocrit values determined by prior art methods.
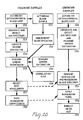
- FIG. 10 is a schematic flow chart, similar to FIG. 2, of another method of the present invention to mathematically minimize variability of spectral data using multiple derivative transformation techniques and adjustment for the different forms of hemoglobin.
- FIG. 11 is a schematic flow chart, similar to FIG. 2, of another method of the present invention to mathematically minimize variability of spectral data using ratioing techniques and adjustment for the different forms of hemoglobin in the whole blood.
- FIG. 12 is a graph showing the accuracy of prediction of hematocrit after multiple derivative transformation pre-processing and adjusting for the different forms of hemoglobin present in the whole blood, compared with actual hematocrit values determined by prior art methods.
- FIG. 13 is a graph showing the accuracy of prediction of hematocrit after ratioing pre-processing and adjusting for the different forms of hemoglobin present in the whole blood, compared with actual hematocrit values determined by prior art methods.
- FIG. 14 is a schematic depiction of the components of the extracorporeal blood loop of the present invention.
- One embodiment of the present invention is the analysis of hematocrit in whole blood.
- Another embodiment of the present invention is the analysis of hemoglobin concentration in whole blood.
- the determination of hematocrit is an excellent correlation to the concentration of hemoglobin in whole blood.
- one or more methods of independent quantification of the property to be analyzed may be used to provide alternative clinical diagnosis of the condition of the patient.
- the property of the biological matter to be analyzed must have some correlation either positively or negatively with the water content in order to develop a mathematical correlation therefor in accordance with the present invention. That may not preclude the presence of other components in de minimus volume fractions or concentrations.
- the presence of white blood cells, platelets, hydrocarbonaceous lipids, and the like are not present in sufficient quantity at the desired level of precision to destroy the validity of the mathematical correlation found.
- the determination of the oxygen saturation in the whole blood may distinguish between oxyhemoglobin and deoxyhemoglobin, in order to predict the property of interest with greater accuracy.
- FIG. 1 identifies the schematic block diagram of spectral instrumentation useful in establishing the training set initially and thereafter predicting the property of the compartment to be analyzed in one or more unknown additional samples.
- FIG. 1 illustrates a typical instrumentation system available which can be used for obtaining the near infrared spectrum of a biological fluid, such as whole blood.
- FIG. 1 identifies a Model 6250 spectrophotometer manufactured by Near Infrared Systems of Silver Spring, Maryland, formerly known as Model 6250 made by Pacific Scientific.
- the radiation from a tungsten lamp 100 is concentrated by a reflector 101 and lens 102 on the entrance slit 103 and thereafter passed through an order sorting filter 104 before illuminating a concave holographic grating 105 to disperse the radiation from the tungsten lamp 100 onto the sample 113 in a dynamic condition in an optical blood loop or in the body of the organism.
- the grating 105 is where the wavelength dispersion occurs.
- the grating is scanned through the desired wavelength range, typically 680 to 1235 nanometers, by the rotating cam bearing 106, which is coupled to the grating by linkage assembly 107.
- the selected wavelength passes through exit slit 108 and is guided through the cell 113 through which the sample is moving in direction F, by mirror 109, iris 111, and lenses 110 and 112. After passing through the sample, the remaining radiation is converted to an electrical signal by detector 114.
- Monochromators such as Model HR 320 available from Instruments S.A. are useful.
- Polychromators such as the Chemspec Model 100S available from American Holograph or Model JY320 also available from Instruments S.A. may be used to gather the spectral data to establish the training set.
- Detection means may employ either diffuse transmittance detection devices or reflectance devices available commercially.
- the Model 6250 spectrophotometer may be configured to detect either diffuse transmittance or diffuse reflectance.
- the detector 114 may be a silicon detector, a gallium arsenide detector, a lead sulfide detector, an indium gallium arsenide detector, a selenium detector or a germanium detector.
- Whichever detector is chosen, it is preferred to be consistent in the usage of same detection means for establishing the training set spectra and for measuring the unknown sample's spectrum.
- polychromatic analyzers using a reversed beam geometry may be used to disperse the transmitted or reflected light into its spectral components and photodiode arrays may be used to detect or measure the dispersed light at different positions along the output spectral plane.
- the polychromatic analyzer should include an entrance slit that defines the bandwidth of light which is consistent with the spectal resolution desired.
- One commercially available photodiode array useful with the present invention is Model 1024S photodiode array available from Reticon, Inc., which consists of 1024 diodes of 25 micron width and 2.5 millimeters height. That photodiode array may be used in a complete spectral detection system such as Model ST120 available from Princeton Instruments.
- interference filters as spectroanalyzers, for example, by passing a series of discrete wavelength interference filters one at a time before a suitable detector. It is also possible to use interferometers or a Hadamard transform spectrometer to analyze the diffuse light.
- the above detection means are based on detection of spectra from a broad band light source.
- narrow band sources of NIR light such as tungsten lamps with interference filters, light emitting diodes, or laser (either a single tunable laser or multiple lasers at fixed frequencies)
- other detection techniques may be used.
- the input signal can be multiplexed either in time, (to sequence each wavelength), or in wavelength (using sequences of multiple wavelengths), and thereafter modulated and the collected signals demodulated and demultiplexed to provide individual wavelength signals without the need for optical filtering.
- a computer connected to the instrument to receive the spectral data, perform the analysis described below, and provide a printout or readout of the value of the property predicted.
- a personal computer such as a "PS/2" Model 50 computer from IBM of Boca Raton, Florida is used and preferred.
- FIG. 2 is a schematic flow chart of the method of the present invention using for pre-processing the multiple derivative transformation pre-processing technique disclosed in U.S. Patent Application Serial Number 07/408,747, which pre-processing is employed to minimize sample and instrumentation variability.
- the regression analysis of the method identifies the nature of the mathematical correlation between the property to be analyzed in the first compartment and the water content in the biological matter, in order to predict the property of the compartment to be analyzed in an unknown sample.
- steps 120 to 128 which comprise the training phase of the analysis
- steps 129 to 133 which comprise the prediction of the property of an unknown sample.
- the training or calibration development phase consists of observing a series of blood samples 120 by diverting the samples from one or more animals of the same species through a blood loop or by otherwise observing the samples in the organisms. Additionally, for the independent quantification of property of interest, samples are obtained by withdrawing blood, step 121, from each of the animals participating in step 120.
- the samples of steps 120 and 121 are analyzed on two parallel paths.
- the first path consists of independent quantification of the property of interest, step 122. It is important that the independent quantification be done accurately.
- the accuracy of the method of the present invention is dependent upon the accuracy of the independent quantification step 122 because validation of the mathematical correlation is based on the independently quantified value of the property of interest.
- the second path consists of irradiating the samples with infrared light and detecting the near infrared spectrum for each sample, step 123, and then computing the second derivative of the spectra, step 124.
- reference to detecting the near infrared spectrum involves both the measurement of diffusely transmitted or reflected spectrum and the transformation of that spectrum to an absorbance spectrum. The transformation is based on having taken a spectrum of the cell containing only air for calibration purposes.
- the near infrared spectrum from 680 to 1235 nanometers consists of 700 individual absorbance measurements.
- the second derivative transformation preprocessing step computes less than the total 700 measurements because some transformations are not available at the edges of the spectra.
- software such as "Near Infrared Spectral Analysis” commercially available from Pacific Scientific, now known as Near Infrared Systems of Silver Spring, Maryland, one may compute an approximated derivative by using finite difference approximations. Different approximations may yield different derivative spectra and different transformation equations. In such software, different approximations may be adjusted according to segment of the spectrum being measured and the gap between segments being measured.
- the preprocessed spectra for the set of training samples subjected to second derivative transformation, step 124, are correlated with the values obtained during the independent quantification step 122 by using a mathematical regression technique, step 125, such as linear regression.
- the second derivative value providing the best correlation of calculated value to actual value is generally the wavelength chosen for the mathematical correlation.
- One of the outputs of this regression step is a correlation plot, step 126, which graphically shows the wavelengths of the spectrum where the highest correlation is found.
- the best transformed wavelength in the water band region of 1150 to 1190 nm, step 127, is selected by identifying the peak of optimum correlation.
- the regression coefficients corresponding to the selected wavelength are saved, step 128, for future application to the analysis of individual samples to predict the property of interest.
- the steps 129 to 133 in FIG. 2 show the procedure to be followed for predicting hematocrit (abbreviated as HCT in FIG. 2) or hemoglobin (abbreviated as HB in FIG. 2) concentration in an individual unknown sample.
- a blood sample of unknown hematocrit or hemoglobin concentration, step 129 is observed by viewing the blood in an extracorporeal blood loop or in the organism, and the near infrared spectrum of this sample is detected or measured, step 130.
- the second derivative intensity for the best wavelength determined in step 127 is computed for the unknown sample, step 131. Then the regression coefficients contained in the mathematical correlation, determined during the training procedure and saved in step 128, are applied to the second derivative wavelength obtained for the additional individual unknown blood sample 132, in order to yield the predicted hematocrit or hemoglobin concentration, step 133.
- the pre-processing technique of multiple derivative transformation serves to eliminate the variances of spectral data caused by scatter in each of the various samples of both the training set and each unknown sample. This scatter would otherwise disrupt the accuracy of the detection of the training set spectra and its ability to predict the property of the unknown sample.
- the second derivative transformation provides N spectral features less the loss of the features at the edges of the spectrum. In FIG. 2, such computation is shown at step 124.
- the best wavelength must be chosen from the myriad of N transformed wavelengths using regression mathematical techniques, as is shown in FIG. 2 at step 125, depicted in a correlation plot at step 126, and selected at step 127 for use to determine the best possible regression coefficients in step 129 and for use with each unknown sample in step 132.
- regression techniques such as, linear regression, multiple linear regression, stepwise regression, partial least squares regression, or principal component regression can be used to develop a statistical correlation between the ratio spectral features and the variable of the property being quantified.
- regression techniques are available by reference to such literature as Draper and Smith, Applied Regression Analysis , Wiley and Sons, New York, 1982 and Geladi and Kowalski, Analytica Chimica Acta , Volume 185, pp 1-17 and 19-32, 1986.
- regression models are computed against all of the possible N transformed wavelengths.
- Each regression model is evaluated by using an accepted statistical measure.
- one useful measure is the simple correlation coefficient computed from the actual hematocrit value obtained from the independent quantification and the predicted hematocrit value obtained from the regression model, as is shown in FIG. 2 at step 127.
- a correlation plot can be constructed to visually show which wavelength involving the absorbance of water provides the highest correlation, as is shown in FIG. 2 at step 127.
- a representative correlation plot for hemoglobin appears as FIG. 6. It is important to consider both high correlation and also the sensitivity of the correlation obtained to measure small changes in the actual wavelengths.
- FIG. 3 is a schematic flow chart of the method of the present invention using for pre-processing the ratio pre-processing technique described herein and also disclosed in U.S. Patent Application Serial Number 07/408,746, which pre-processing is employed to minimize sample and instrumentation variability.
- the regression analysis of the method identifies the nature of the mathematical correlation between the property to be analyzed in the first compartment and the water content in the biological matter, in order to predict the property to be analyzed in an unknown sample.
- steps 220 to 228 which comprise the training phase of the analysis
- steps 229 to 233 which comprise the prediction of the property of an unknown sample.
- the training or calibration development phase consists of observing a series of blood samples 220 by diverting the samples of one or more animals of the same species through a blood loop or by otherwise observing the samples in the organisms. Additionally, for the independent quantification of property of interest, samples are obtained by withdrawing blood, step 221, from each of the animals participating in step 220.
- steps 220 and 221 are analyzed on two parallel paths.
- the first path consists of independent quantification of the property of interest, step 222. It is important that the independent quantification be done accurately.
- the accuracy of the method of the present invention is dependent upon the accuracy of the independent quantification step 222 because validation of the mathematical correlation is based on the independently quantified value of the property of interest.
- the second path consists of irradiating the samples with infrared light and detecting the near infrared spectrum for each sample, step 223, and then computing all possible ratios of two wavelengths in the spectrum, step 224.
- the near infrared spectrum from 680 to 1235 nanometers consists of 700 individual absorbance measurements.
- the preprocessing step of computing all possible ratios of two wavelengths expands the 700 point spectrum into 700 * 700 or 490,000 ratio pairs. Since near infrared spectra consist of broad, slowly changing absorbance bands, computing the ratio terms using every fifth data point, 140 point spectrum, results in equivalent performance with a significant decrease in the overall computation requirement, 140 * 140 or 19,600 ratio terms.
- the preprocessed spectra for the set of training samples consisting of the calculated ratios, step 224, are correlated with the values obtained during the independent quantification step 222 by using a mathematical regression technique, step 225, such as linear regression.
- the pair providing the best correlation of calculated values to actual values is generally the pair of wavelengths chosen for the ratio in the mathematical correlation.
- One of the outputs of this regression step is a correlation map, step 226, which graphically shows the regions of the spectrum where the most useful ratio pairs are found.
- the best ratio pair, step 227 is selected by identifying a region of high correlation which is also independent of small changes in the actual wavelength selected.
- the regression coefficients corresponding to the selected ratio pair are saved, step 228, for future application to the analysis of individual samples of unknown analyte content.
- the steps 229 to 233 in FIG. 3 show the procedure to be followed for predicting hematocrit (abbreviated as HCT in FIG. 3) or hemoglobin (abbreviated as HB in FIG. 3) concentration in an individual unknown sample.
- a blood sample of unknown hematocrit or hemoglobin concentration, step 229 is observed in a dynamic condition and the near infrared spectrum of this sample is detected or measured, step 230.
- the ratio of the absorbance readings for the selected pair of wavelengths determined in step 227 is computed for the unknown sample, step 231. Then the regression coefficients contained in the mathematical correlation, determined during the training procedure and saved in step 228, are applied to the ratio obtained for the additional individual unknown blood sample 232, in order to yield the predicted hematocrit or hemoglobin concentration, step 233.
- the ratio pre-processing technique serves to eliminate the variances of spectral data caused by scatter or other multiplicative errors in each of the various samples of both the training set and each unknown sample. This scatter would otherwise disrupt the accuracy of the detection of the training set spectra and its ability to predict the property in the unknown sample. Because both wavelengths in the selected best pair of wavelengths used in the ratio experience the same path length, variations in the effective path length due to scatter are minimized.
- the near infrared spectrum consists of N individual wavelengths
- computing all possible ratios of each pair of wavelengths provides N*N new spectral features.
- FIG. 3 such computation of all possible ratios is shown at step 224.
- the best possible ratio pair of wavelengths must be distilled from the myriad of combinations using regression mathematical techniques, as is shown in FIG. 3, at step 225, depicted in a correlation map at step 226, and selected at step 227 for the use to determine the best possible regression coefficients in step 228 and for use with each unknown sample in step 231.
- regression techniques such as, linear regression, multiple linear regression, stepwise regression, partial least squares regression, or principal component regression can be used to develop a statistical correlation between the ratio spectral features and the variable of the analyte being quantified.
- regression techniques are available by reference to such literature as Draper and Smith and Geladi and Kowalski publications described above for use in multiple derivative transformation. In order to determine the best ratio for a given application, regression models are computed against all possible ratio pairs of wavelengths.
- Each regression model is evaluated by using an accepted statistical measure.
- one useful measure is the simple correlation coefficient computed from the actual hematocrit value obtained from the independent quantification and the predicted hematocrit value obtained from the regression model, as is shown in FIG. 3 at step 228.
- a correlation map can be constructed to visually show which wavelength ratios provide the highest correlation, as is shown in FIG. 3, at step 226.
- a representative correlation map for hemoglobin appears as FIG. 7. It is important to consider both high correlation and also the sensitivity of the correlation obtained to measure small changes in the actual wavelengths. The best overall ratio is found by selecting the pair of wavelengths which provide high correlation and which occur in a reasonably flat region of the correlation map.
- the mathematical correlation endeavors to yield a linear relationship between the single independent variable, which is the multiple derivative transformed intensity or the ratio of the two best absorbance pairs, and the property of interest to be measured.
- the linear functional relationship is more complex and involves more than one independent variable when the effect of oxygen saturation is used to adjust the mathematical correlation of hematocrit or hemoglobin concentration to the water content in whole blood.
- the mathematical correlation is established, it is validated.
- the accuracy in formation and performance is reviewed to assure reproducibility.
- the accuracy and precision of the mathematical correlation can be validated by physical interpretation of the selected spectral features or using additional samples analyzed by independent quantification, step 122 of FIG. 2 or step 222 of FIG. 3, and then subjecting those samples to steps 129-133 of FIG. 2 or steps 229-233 of FIG. 3, as if the samples were unknown.
- Statistical methods may then be used to compare the value of the predicted property, step 133 or step 233, and the value determined by independent quantification, step 122 or step 222, to confirm reproducibility.
- Standard error of calibration measures precision of formation of the model of the training set spectra, i.e., how well the regression analysis performs with the data used to construct the training set.
- the standard error of calibration can be calculated from the following equation: where N is the number of training samples, n is the number of absorbance terms in the regression technique employed, where c i is the hematocrit value of the ith sample as calculated during linear regression and C i is the hematocrit value of the ith sample as independently determined. The smaller the SEC, the more precise the model mathematical correlation has been formed.
- the standard error of prediction measures the assurance of reproducible performance, i.e., a test to identify quantitatively the accuracy and precision of the prediction results obtained using the method of the present invention with the actual value for the property determined by independent quantification using known and accepted techniques and may be used in conjunction with a confidence limit to quantitatively express the accuracy of the prediction of the property being analyzed.
- the standard error of prediction can be calculated from the following equation: where N is the number of validation samples, C i is the independently quantified value for the ith validation sample, c i is the value for the ith validation sample obtained using the mathematical correlation of step 131. Also, the smaller the SEP, the more accurate and precise the prediction.
- Bias measures the extent of deviation of all points within a given data set in the solved mathematical equation from the line of exact correlation between predicted and actual values.
- a low bias indicates the presence of a robustness of the training set spectra to tolerate possible error.
- the robustness of the training set sampling anticipates the variety of sampling possibilities for the unknown sample and minimizes its effect.
- the regression analysis may employ multiple variables according to the equations described above.
- One multiple variable of assistance to the prediction of the property of interest is the percentage oxygen in the hemoglobin of whole blood, which distinguishes the hemoglobin between its oxy and deoxy forms. Because oxy and deoxy hemoglobin have different spectra, including in the region of 1150-1190 nm, the assessment of the relative contributions of both forms of hemoglobin, or a value proportional to their relative contributions, allows the adjustment of the mathematical correlation being developed for the prediction of hematocrit or hemoglobin concentration.
- FIGS. 10 and 11 depict the schematic flow charts, similar to FIGS. 2 and 3, respectively.
- Reference numbers 320-333 in FIG. 10 depicts the same steps as reference numbers 120-133 in FIG. 2.
- Reference numbers 420-433 in FIG. 11 depicts the same steps as reference numbers 220-233 in FIG. 3.
- FIGS. 10 and 11 add the steps in the method to adjust the mathematical correlation and the prediction to account for percent oxygen saturation in the whole blood.
- measurement of oxygen saturation or a value proportional to oxygen saturation is added to assist in performing the linear regression, step 325, and step 330 is modified to include the measurement of the oxygen saturation or a value proportional to oxygen saturation in the unknown sample.
- step 434 is added to assist in performing the linear regression, step 425, and step 430 is modified to include the measurement of the oxygen saturation or a value proportional to oxygen saturation in the unknown sample.
- step 434 provides the adjustment of the independent variable, percent oxygen saturation or a value proportional to oxygen saturation, to the other independent variable, the multiple derivative transformed spectral intensity at the best wavelength or the best ratio.
- the use of the percent oxygen saturation independent variable in the mathematical correlation is optional.
- the use of the percent oxygen saturation independent variable in the mathematical correlation is preferred.
- Instruments to measure oxygen saturation of the hemoglobin concentration at the same time as the spectrum of whole blood is analyzed includes such commercially available instrumentation as a co-oximeter, a pulse oximeter, or other device which measures the oxygen saturation known to those skilled in the art.
- Co-oximetry typically involves measurement of oxygen saturation in a static condition.
- the art has progressed to measuring oxygen saturation in flowing blood such as that shown in U.S. Patent 4,745,279.
- Another method of measuring the second independent variable as a value proportional to percent oxygen saturation for purposes of the regression analysis depicted in FIG. 10 at 334 and 330, respectively and FIG. 11 at 434 and 430, respectively, is to employ a ratio of absorbances at two wavelengths.
- the value proportional to percent oxygen saturation is the ratio of the absorbances of two wavelengths where the ratio of the extinction coefficients for oxyhemoglobin and deoxyhemoglobin at one wavelength is different than that ratio at the second wavelength.
- the ratio uses the absorbance of a wavelength where the extinction coefficients of oxy and deoxy hemoglobin are different, (for example at from about 680 nm to 720 nm), to the absorbance of a wavelength where the extinction coefficients of oxy and deoxy hemoglobins are the same, the isosbestic point.
- Use of the ratio of this spectral data obviates the need for additional oxygen saturation instrumentation.
- the comparison of predicted vs. actual hematocrit or hemoglobin concentration may be graphed when the percent oxygen saturation is included as an independent variable.
- FIG. 12 shows a graph of predicted hematocrit against actual hematocrit.
- a comparison of FIG. 8 and FIG. 12 shows how the multiple independent variable mathematical correlation is generally more accurate.
- An embodiment of the analysis of a property of interest in a biological fluid in a dynamic condition employs an extracorporeal blood loop.
- This blood loop permits "real time” monitoring of the changes in the values of the property of interest in whole blood.
- FIG. 14 identifies schematically the type of blood loop of the present invention using reference numerals while the other equipment necessary for the experiments described in the examples are identified by reference letters.
- the loop 500 is formed by connecting flow through cell 510 in the spectrometer S, also seen in FIG. 1 as item 113, tubing, generally 520, and valves, generally 530.
- the loop 500 may be separately configured to the patient P or may form a subloop to the loop already established for the patient P in the operative environment.
- Loop 500 includes the following components interconnected: diversion section tubing 521 connected between the patient's blood vessel (not shown) and valve 532, diversion section tubing 522 between the valve 532 and flow through cell 510, return section tubing 523 between the flow through cell 510 and valve 534, return section tubing 524 between valves 534 and 536, return section tubing 525 between valve 536 and another blood vessel (not shown) of the patient P, and a bypass tubing section 526 between valves 532 and 536.
- the tubing, generally 520, and the valves, generally 530, must be made from materials which are biocompatible with the patient's biological fluid and strong enough to withstand use of flowing pressurized fluid therethrough. A leak in the loop 500 could be traumatic for the patient P.
- tubing 520 Preferred commercially available materials for the tubing 520 are "TYGON" brand plastic tubing available from Norton Performance Plactics of Akron, Ohio.
- Preferred commercially available valves are three-way stopcock type valves marketed under the trademark "INTRALOK” from Abbott Sorenson Research of Salt Lake City, Utah.
- the flow through cell 510 must be made of a transparent material used in spectrophotometric instrumentation, such as quartz plate glass, and geometrically configured and constructed in a manner to minimize the stagnation of the biological fluid in that portion of the cell irradiated with the near infrared light. Glassblowers skilled in the art are capable of configuring the cell 510, which preferably has an oval shape with opposing ports at the perimeters of sharper curvatures.
- the loop 500 has a biological fluid flow in the direction of arrow F1 from the patient P through diversion section comprising tubing 521 and 522 and in the direction of arrow F2 to the patient through tubing 523, 524, and 525.
- valves 532 and 536 allow the control of the amount of biological fluid flowing through cell 510. It is desired that adequate biological fluid flow through cell 510 during spectral detection. However, if it is desired to entirely bypass cell 510, valves 532 and 536 may be opened in a way to direct all fluid flow through section 526.
- Valve 534 is adjacent the emergence of the tubing 523 from the cell 510 in order that any independent quantification needed or desired may be performed in the loop as closely as possible to the location of the spectral irradiation and detection in the cell 510.
- loop 500 may be combined with any spectrometric instrumentation described above, although the use of a spectrometer such as a Model 6250 spectrometer, with a computer such as a personal computer, described above is preferred.
- a spectrometer such as a Model 6250 spectrometer
- a computer such as a personal computer
- spectra data may be gathered in conjunction with an extracorporeal blood gas sensor (EBGS) sold by Cardiovascular Devices, Inc. of Irvine, California.
- EBGS extracorporeal blood gas sensor
- hematocrit or hemoglobin concentration may be monitored nearly instantaneously, permitting the health care practitioner to treat the patient without delay.
- the extracorporeal loop 500 may be used in routine dialysis procedures as part of the dialysis blood loop to monitor the water content of the blood and other properties of interest. Another use of the extracorporeal loop 500 is in critical cases of prematurely born babies, neonatals, that require the use of ExtraCorporeal Membrane Oxygenators (ECMO) wherein a blood loop is formed with the ECMO to oxygenate the blood for days, if needed, until the proper maturation of lung functions is attained. It is a critical setting, and continuous monitoring of the blood components such as hemoglobin concentration and hematocrit among other properties, can be vital. Further, the use of loop 500 in the ECMO eliminates the undesirable need to withdraw blood samples for these analyses from the neonatal infant already in critical condition.
- ECMO ExtraCorporeal Membrane Oxygenators
- a flow through cell 510 or an extracorporeal blood gas sensor with a cell 510 permits real time monitoring of the time taken to commence and complete the oxygenation change as well as maintaining in real time a monitor of the patient's condition for properties of interest such as hematocrit, hemoglobin concentration, and percent oxygen saturation.
- the spectra set A was gathered using a 11 Kg female Beagle dog approximately two years old; and the spectra set B was gathered using a 11 Kg. female Beagle dog approximately four and one half years old. While there were some minor variations during the experimentation, the experiments used the following protocol with the following materials, instruments, and supplies.
- the method of the experiment was as follows: the Beagle dog was first administered by subcutaneous injection 0.05 mg/Kg of the sedative Acepromazine and then 0.025 mg/Kg of Atropine. Anaesthesia was induced by the administration of the barbituate Bio-tal (4%) to obtain the desired level of anaesthesia which was then sustained by the intubation of the trachea and maintained with a mixture of isoflurane in pure oxygen from the respirator, R.
- the skin was shaved on the medial aspects of the hind legs and the neck for placement of the cannulae and the animal was transferred from initial preparation areas to the operating room.
- a jugular vein cut-down at the shaved neck area was performed and the teflon cannula was inserted and connected to a drip bag containing the lactated Ringers Solution, L, dripping at the rate of 2 to 5 ml per pound per hour.
- the anaesthesia was maintained by continued delivery of isoflurane at 1-2 percent delivered in pure oxygen via the semi-open anaesthesia system.
- Three EKG electrodes were attached on the thorax of the animal at appropriate diagnostic locations and connected via cables to the Burdick CS525 EKG-Blood Pressure Monitor, M.
- Electro-surgical plate (not shown in FIG. 12) was placed under the animal on the back with an electrically conductive paste (Gel #1103 available from Minnesota Mining and Manufacturing Company) between the plate and the skin.
- An electro-surgical scalpel (not shown in FIG. 12) was attached to an electro-surgical unit (ESU) generator, ES, and used to make a skin incision over the proximal medial femur with dissection carried down to expose the femoral artery and vein.
- ESU electro-surgical unit
- ES electro-surgical unit
- Fourteen gauge “TEFLONTM" cannulae were inserted into the femoral artery and vein, respectively, and tied in place with a 2-0 vinyl suture.
- the contra-lateral femoral artery similarly exposed and a 14 gauge cannulae was inserted and similarly secured with suture.
- This latter cannulae was connected to the Burdick Corporation blood pressure transducer, M, and connected via hydraulic lines to a pressurized bag containing 0.9 percent sodium chloride solution dripping at approximately 3 ml per hour to prevent any clogging of the cannula.
- the thermometer readings were displayed on the "YSI-400" Readout Temperature Monitor, T.
- a second channel of that monitor was connected to a thermometer needle inserted into the tubing section 523 at the outlet port of the blood flow through cell 510 to monitor the temperature of the blood in the extracorporeal loop 500.
- the "TYGON R " tubing was assembled in lengths from about 30 cm to 50 cm.
- One stop cock valve, 532 was placed in the diversion section of the loop between tubing 521 and 522.
- a second stop cock valve, 536 was placed in the return section of the loop between tubing 524 and 525. Between the two valves, 532 and 536, a piece of tubing 526 was connected to provide a bypass, which by manipulation of the two valves, 532 and 536, could eliminate flow of the blood through the flow through cell 510 entirely, or to control the rate of flow therethrough.
- a third stopcock valve, 534 was placed in the return section of the extracorporeal blood loop 500 between tubing 523 and 524 to permit withdrawal of samples periodically for testing of various blood related parameters using the centrifuge, MC, the co-oximeter, O, the blood gas analyzer, BG, and the glucose test strips.
- the flow through cell 510 was connected to the opposing ends of the diversion section at tubing 522 and the return section at tubing 523 and placed within the Model 6250 Spectrometer.
- the cell 510 and associated tubing 520 was filled with a 0.9% NaCl solution made by Abbott Laboratories of North Chicago, Illinois in order to remove air from the cell 510 and tubing 520 to avoid injection of air emboli upon connection of the extracorporeal loop 500 to the animal and to allow recording of a spectra of water so that known features of the water may serve as a reference of the proper functioning of the loop 500 and spectrophotometric system depicted in FIG. 1.
- the flow through cell 510 was approximately 6 cm long and 3.5 cm wide at the middle of the cell and mounted onto a transport metal plate of the dimensions of 11 cm by 6 cm with a circular aperture of approximately 1.5 cm. The plate was inserted into the positioning tracks of the chamber and the Model 6250 Spectrometer, S. The chamber cover was shut and taped to prevent accidental opening during the experiment.
- the computer control of the cell transport mechanism was disabled by disconnecting the transport board cable between the PS/2 Personal Computer, C and the Model 6250 Spectrometer, S. This was done to prevent movement of the cell 510.
- the tubing 522 of the loop 500 leading to and the tubing 523 coming from the Model 6250 Spectrometer, S was wrapped with black vinyl electrical tape available from Minnesota Mining and Manufacturing Company.
- the tubing itself was prevented from acting as a light guide which upon entering the cell would serve as a noise source of light.
- the animal was injected with 3800 units of sodium heparin from a 1,000 unit/ml solution available under the brand name "LYPHOMED".
- the heparin served as a blood anticoagulant because the blood in the extracorporeal loop would be in contact with various materials such as the "TEFLONTM” cannulae, valves 530, tubing 520, and the flow through cell 510.
- the diversion section tubing 522 was connected to the inlet port of the cell 510 so that any spurious air bubbles would be flushed from the cell 510.
- the extracorporeal loop 500 was adjusted at valves 532 and 536 to permit the animal's blood to flow from the animal through the flow through cell 510 and back to the animal, avoiding the bypass tubing 526 between the diversion section valve 532 and the return section 536 which would eliminate blood flow through the flow through cell 510.
- a 1 ml sample of blood in a 1 ml syringe was withdrawn through valve 534 and subjected to blood gas analysis and co-oximetry and centrifuging. Less than 10 seconds after the withdrawal of the blood sample, 64 scans of spectra were acquired by the spectrometer upon initiation from the personal computer. Approximately 24 seconds were required to obtain these spectra.
- valve 534 Strict adherence to the protocol of blood sample handling is required to minimize aberrations. For example, blood is withdrawn into new syringes for every sample. The operation of the valve 534 where the blood is withdrawn must be such that only blood exiting the flow through cell 510 fills the syringe in order to avoid any blood which has proceeded further in the direction of the return to the animal has not been also withdrawn. A first one-third to one-half ml of withdrawn blood is reinjected into valve 534 positioned to direct such reinjected blood into section 524 and towards the animal. This procedure helps to force any old blood and/or air in the valve from being also withdrawn.
- the next one ml of blood withdrawn in the syringe is removed for analysis by instruments, O, MC, and BG. Further, the blood from the syringe is injected into all three of the diagnostic analyzers, O, BG, and MC as soon as possible, within less than a minute, in order to obtain accurate readings not affected by atmospheric changes to the samples.
- the blood gas analysis showed an oxygen saturation of 68.6 percent with a corresponding PO 2 of 27.8 mm of Hg.
- the 64 spectra were recorded by the spectrometer, S, by initiation from the personal computer keyboard, C.
- the 100 ml of blood withdrawn was centrifuged at 3000 RPM for 10 minutes in 2 centrifuge tubes of equal volumes and weights in a "BECKMAN GPR" refrigerated centrifuge, RC, utilizing a "GH-3.7" rotor available as catalog #349702 from Beckman Instrument, Inc. of Palo Alto, California.
- the plasma supernatent fraction was removed with a pipette from each tube and the densely packed red blood cells in the lower portion of the centrifuge tubes were stored in the refrigerator at approximately 4°C.
- the plasma was returned to the animal through the same valve 534 to maintain plasma volume but with a reduced hematocrit and hemoglobin concentration.
- the procedure of withdrawing 100 ml of blood, centrifuging it, re-injecting the plasma and storing the red blood cells in the refrigerator was repeated several times. Each time, the blood gas analysis was performed and the spectra taken both before and after each such procedure.
- the hematocrit varied for each animal, e.g. for one animal from an initial percent of about 47 percent to a low of about 22 percent, at which point the refrigerated red blood cells were re-injected into the animal through the valve in the return section of the loop to increase the hematocrit to its original level and to restore the hemoglobin concentration.
- Spectra were taken before and after the red blood cell re-injection into the loop and contributed to the spectra used for the training set spectra from which the mathematical regression techniques after pre-processing established the mathematical correlation between the hemoglobin concentration or hematocrit and the water content of the blood.
- Table I identifies the sessions as sets A and B, and the number of samples analyzed are identified as the number of spectra obtained, which varied as shown.
- a representative group of samples from set A are graphed in FIG. 4.
- the sample spectra indicated the ranges of variability of the spectral data found, against which mathematical correlations would have been otherwise attempted to be calculated.
- Hct hematocrit
- Hb hemoglobin concentration
- O 2 Sat. percent oxygen saturation range
- Table I below further identifies the correlation of hematocrit to hemoglobin which demonstrated correlation for the spectra observed greater than 0.99 for both sets.
- Sets of Samples Spectrally Analyzed and Independent Quantification Ranges of Hematocrit, Hemoglobin and Oxygen Saturation Set No. of Spectra Hct Range (%) Hb Range (g/dL) Hct/Hb Corr. O 2 Sat. Range (%) A 19 22-47 8.0-16.6 0.999 67.0-100.3 A1 14 22-47 8.2-10.7 99.2-100.3 B 8 24-32 8.2-10.8 0.995 61.2- 99.8 B1 6 24-31 8.0-10.7 98.5- 99.8
- the purpose of establishing a training set for comparisons and prediction purposes is to attempt to anticipate sampling differences which may exist in various individuals at various times.
- the training set should be as broad as possible to include as many variances within each of the factors affecting the measurement of the property of interest.
- the training set includes samples that represent all of the different kinds of changes in the hematocrit and hemoglobin concentration over a full range of values likely to be encountered in an unknown sample as well as all of the other kinds of changes within each factor likely to affect blood sampling, e.g., temperature, amount of liquids, details of light scattering, presence of other components, and physiological condition of the patient.
- the second derivative pre-processing technique was performed against the combination of the sets using the Near Infrared Spectral Analysis software program described above, with a personal computer described above, and available with the Model 6250 spectrometer from Near Infrared Systems to compute the second derivatives, to perform the linear regression, to select the best wavelength, and to save the regression coefficients (steps 124, 125, 127, 128, and 131 of FIG. 2).
- Other software "VAX IDL Interactive Data Language” available from Research Systems, Inc. (copyright 1982-1988) was used to apply the regression model, predict the property, (steps 132 and 133 of FIG. 2) and to compute the SEC, SEP, and the bias for validation purposes.
- the group of spectra for Set A are shown in FIG. 4 are re-depicted in FIG. 5 after the second derivative pre-processing has been performed.
- the variations in absorbances as caused by baseline offsets and other variances from spectrum to spectrum are minimized, permitting better attempted mathematical correlation.
- the second derivative pre-processing technique computes a transformed absorbance value for all of the wavelengths in order to find the best correlation in the area of the water absorbance peak.
- Another reason for rejection of a wavelength in the 900 nm region of broad hemoglobin absorbance is the possible interference by other forms of hemoglobin absorbing in this region, such as methemoglobin.
- FIG. 6 depicts that correlation plot.
- the correlation in the region of 890 nm is an anomalously sharp band where variations in the wavelength selected can significantly reduce the extent of correlation.
- the correlation in the region of 1150 to 1190 nm is a broader band where variations in the wavelength selected do no significantly reduce the extent of correlation. As discussed below, predictions using a wavelength within this range are acceptable.
- Example 1 The validation of the performance of the selected linear functional equation described in Example 1 was performed to assess standard error of prediction (SEP) and bias. Each set was used as a known and used to predict each other set as if such other set were unknown.
- SEP standard error of prediction
- VAX IDL software The Near Infrared Spectral Analysis software and the VAX IDL software were used in the same manner as described in Example 1 and used in Example 2 to compute the results. Table III shows the results found.
- Segregated sets A1 and B1 provided the more precise predictions, but the larger set A having a better balance of percent oxygen saturation spectra variations predicted set B1 with acceptable precision.
- the prediction by set B and the prediction of set B showed the effects that two outlier spectra can have on a smaller set having less robustness of spectra.
- Bias for the predictions by all of the sets were more positive when predicting the segregated sets A1 or B1 than when predicting the full sets A or B, again indicating an under-prediction is possible when the spectra has a lower percent oxygen saturation.
- FIG. 8 is a graph of the comparison of predictions of set A to the actual independently quantified values for hematocrit.
- the percent oxygen saturation of the patient was added as an independent variable to the linear functional equation and multiple linear regression analysis or the like was performed as depicted in FIG. 10 in the case of multiple derivative transformation pre-processing.
- the percent oxygen saturation was measured for each spectrum using the "IL-482" co-oximeter. That data comprised one column of data used in replacement of one column of spectral data to achieve a multiple variable set of data, which the Near Infrared Spectral Analysis software and the VAX IDL software computed in the manner described in Examples 1-3 to yield the mathematical results.
- Table VI shows the results found when individual sets were used to predict other individual sets for hemoglobin where the percent oxygen saturation was added to the mathematical analysis as an independent variable.
- Table VII shows the analogous results for hematocrit. Prediction of Individual Sets against Other Individual Sets With Adjustment For Percent Oxygen Saturation From A Co-Oximeter For Hemoglobin at 1170 nm After Second Derivative Pre-Processing Known Set R SEC g/dL O 2 Slope Slope Intercept Unknown Set SEP g/dL Bias g/dL A 0.996 0.27 -0.109 159.01 11.00 B1 0.76 -0.51 B 0.62 -0.32 B 0.999 0.16 -0.083 147.63 9.59 A1 0.49 0.28 A 0.46 0.15 Prediction of Individual Sets against Other Individual Sets With Adjustment For Percent Oxygen Saturation From A Co-Oximeter For Hematocrit at 1169 nm After Second Derivative Pre-Process
- FIG. 12 shows the high resolution of accuracy between the method used in this Example 5 and the independent quantification used for the same spectra and how that resolution is more accurate than that shown in FIG. 8.
- the effect of variations in percent oxygen saturation among the spectra was also calculated from the spectra without use of the co-oximeter.
- the ratio of the wavelengths of 700 and 820 nm, was proportional to the percent oxygen saturation which existed in each sample as it was analyzed. That ratio data from the originally detected spectra replaced one column of transformed spectral data to achieve a multiple variable set of data, which the Near Infrared Spectral Analysis software and the VAX IDL software computed in the manner described in Examples 1-3 to yield the mathematical results.
- Table VIII shows the results found for hemoglobin when the adjustment for percent oxygen saturation was determined by the ratio described here.
- Table IX shows the analogous results found for hematocrit.
- ratio pre-processing technique provided comparable results to the use of the multiple derivative pre-processing technique.
- the ratio pre-processing method depicted in FIG. 3 was employed using the following Fortran generated software program described herein, with a personal computer, to select the best ratio, to perform the linear regression, and to save the regression coefficients (steps 224, 225, 227, and 228 of FIG. 3).
- Procedures in the VAX IDL Interactive Data Language software program described in Example 1 were used to perform the ratio pre-processing on the unknown sample, apply the regression model and predict the property, (steps 231, 232, and 233 of FIG. 3) and to compute the SEC, SEP, and bias for validation purposes.
- the ratio pre-processing technique computed substantially possible wavelength pairs, as described above, in order to find the best correlation in the area of the water absorbance peak and another absorbance measuring point.
- Table X shows the results found using this equation as applied to predict each set A1, A, B1, and B against the combined set A + B for hemoglobin concentration. Prediction of Individual Sets against Combined Set For Hemoglobin at Ratio of 820/1161 nm Set R SEC g/dL Bias g/dL A1 0.998 0.32 -0.16 A 0.992 0.39 0.00 B1 0.994 0.36 -0.22 B 0.832 0.92 0.14
- the results provide proof of the accuracy and the precision of the linear functional equation for predicting hemoglobin in a dynamic condition of an extracorporeal blood loop of a mammal. Recognizing the effects of outlier spectra in set B as previously described in a smaller set than that to be used in forming the training set, the most precise predictions arise from segregated sets A1 and B1, followed by the predictions of and with set A. The trend in the bias is slightly toward the positive, but all sets were predicting within a range of acceptable bias.
- Example 7 The same experiments as those described in Example 7 were conducted for the analysis of hematocrit using the ratio pre-processing technique computed using the same software and procedures as described in Example 7.
- the combined sets A and B were analyzed for the best wavelength pair not likely to be rendered inaccurate by changes in concentration of the various forms of hemoglobin, i.e., in the range of 1150-1190 nm and around the isosbestic point.
- Bias for the predictions by all of the sets were more negative when predicting the segregated sets A1 or B1 than when predicting the full sets A or B, indicating a possible over-prediction is possible when the spectra has a lower percent oxygen saturation. But the bias in all sets' predictions is acceptable.
- FIG. 9 is a graph of the comparison of predictions of set A to the actual independently quantified values for hematocrit.
- FIG. 11 depicts the method of the invention altered to adjust for the use of the second independent variable.
- the 820/1161 nm ratio computed with the VAX IDL software was added with the co-oximeter measurements to produce a linear summation, and then computed with a multiple linear regression analysis procedure of the VAX IDL software to yield the mathematical results.
- Tables XIV and XV show the results found when including the co-oximeter measurements of percent oxygen saturation into the equation for hemoglobin and hematocrit, respectively.
- FIG. 13 shows the high resolution of accuracy between the method used in this Example 9 and the independent quantification used for the same spectra and how that resolution is more accurate than that shown in FIG. 9.
- the effect of variations in percent oxygen saturation among the spectra was also calculated from the spectra without use of the co-oximeter.
- the ratio of the absorbances at the wavelengths of 700 and 820 nm was proportional to the percent oxygen saturation existing in each sample as it was analyzed.
- the 820/1161 nm ratio computed with the VAX IDL software was added with the 700/820 nm ratio to produce a linear summation, and then computed with a multiple linear regression analysis procedure of the VAX IDL software to yield the mathematical results.
- Table XVI shows the results found for hemoglobin when the adjustment for percent oxygen saturation was determined by the ratio described here.
- Table XVII shows the analogous results found for hematocrit.
Landscapes
- Health & Medical Sciences (AREA)
- Life Sciences & Earth Sciences (AREA)
- Physics & Mathematics (AREA)
- Engineering & Computer Science (AREA)
- General Health & Medical Sciences (AREA)
- Pathology (AREA)
- Molecular Biology (AREA)
- Public Health (AREA)
- Biophysics (AREA)
- Spectroscopy & Molecular Physics (AREA)
- Biomedical Technology (AREA)
- Heart & Thoracic Surgery (AREA)
- Medical Informatics (AREA)
- Veterinary Medicine (AREA)
- Surgery (AREA)
- Animal Behavior & Ethology (AREA)
- Optics & Photonics (AREA)
- Artificial Intelligence (AREA)
- Signal Processing (AREA)
- Computer Vision & Pattern Recognition (AREA)
- Physiology (AREA)
- Psychiatry (AREA)
- Chemical & Material Sciences (AREA)
- Analytical Chemistry (AREA)
- Biochemistry (AREA)
- General Physics & Mathematics (AREA)
- Immunology (AREA)
- Investigating Or Analysing Materials By Optical Means (AREA)
- Measurement Of The Respiration, Hearing Ability, Form, And Blood Characteristics Of Living Organisms (AREA)
- Investigating Or Analysing Biological Materials (AREA)
Description


| Sets of Samples Spectrally Analyzed and Independent Quantification Ranges of Hematocrit, Hemoglobin and Oxygen Saturation | |||||
| Set | No. of Spectra | Hct Range (%) | Hb Range (g/dL) | Hct/Hb Corr. | O2 Sat. Range (%) |
| A | 19 | 22-47 | 8.0-16.6 | 0.999 | 67.0-100.3 |
| A1 | 14 | 22-47 | 8.2-10.7 | 99.2-100.3 | |
| B | 8 | 24-32 | 8.2-10.8 | 0.995 | 61.2- 99.8 |
| B1 | 6 | 24-31 | 8.0-10.7 | 98.5- 99.8 |
| Prediction of Individual Sets Against Combined Set A + B For Hemoglobin at 1170 nm After Second Derivative Pre-Processing | |||
| Set | R | SEC g/dL | Bias g/dL |
| A1 | 0.995 | 0.84 | 0.56 |
| A | 0.930 | 1.13 | 0.03 |
| B1 | 0.993 | 0.72 | 0.57 |
| B | 0.456 | 1.31 | -0.07 |
| Prediction of Individual Sets Against Other Individual Sets For Hemoglobin at 1170 nm After Second Derivative Pre-Processing | |||||||
| Known Set | R | SEC g/dL | Slope | Intercept | Unknown Set | SEP g/dL | Bias g/dL |
| A1 | 0.995 | 0.29 | 155.7 | 0.35 | B1 | 0.64 | -0.50 |
| B | 2.06 | -1.24 | |||||
| A | 0.922 | 1.18 | 136.2 | 2.39 | B1 | 0.50 | 0.39 |
| B | 1.40 | -0.29 | |||||
| B1 | 0.992 | 0.16 | 142.5 | 1.63 | A1 | 0.47 | 0.20 |
| A | 1.18 | -0.35 | |||||
| B | 0.406 | 1.05 | 43.5 | 7.48 | A1 | 2.31 | -1.13 |
| A | 2.62 | -1.49 |
| Predict Individual Sets Against the Combined Set For Hematocrit at 1169 nm After Second Derivative Pre-Processing | |||
| Set | R | SEC (%) | Bias (%) |
| A1 | 0.996 | 2.56 | 1.75 |
| A | 0.934 | 3.21 | 0.27 |
| B1 | 0.984 | 1.77 | 1.29 |
| B | 0.404 | 3.99 | -0.64 |
| Predict Individual Sets Against Other Individual Sets For Hematocrit at 1169 nm After Second Derivative Pre-Processing | |||||||
| Known Set | R | SEC (%) | Slope | Intercept | Unknown Set | SEP (%) | Bias (%) |
| A1 | 0.996 | 0.73 | 450.0 | 1.71 | B1 | 2.54 | -1.99 |
| B | 6.62 | -4.21 | |||||
| A | 0.926 | 3.29 | 395.3 | 7.22 | B1 | 0.89 | 0.47 |
| B | 4.52 | -1.58 | |||||
| B1 | 0.956 | 0.63 | 420.1 | 5.54 | A1 | 1.79 | 1.38 |
| A | 3.14 | -0.21 | |||||
| B | 0.362 | 3.21 | 117.0 | 22.43 | A1 | 6.42 | -2.54 |
| A | 7.22 | -3.52 |
| Prediction of Individual Sets Against Other Individual Sets With Adjustment For Percent Oxygen Saturation From A Co-Oximeter For Hemoglobin at 1170 nm After Second Derivative Pre-Processing | ||||||||
| Known Set | R | SEC g/dL | O2 Slope | Slope | Intercept | Unknown Set | SEP g/dL | Bias g/dL |
| A | 0.996 | 0.27 | -0.109 | 159.01 | 11.00 | B1 | 0.76 | -0.51 |
| B | 0.62 | -0.32 | ||||||
| B | 0.999 | 0.16 | -0.083 | 147.63 | 9.59 | A1 | 0.49 | 0.28 |
| A | 0.46 | 0.15 |
| Prediction of Individual Sets Against Other Individual Sets With Adjustment For Percent Oxygen Saturation From A Co-Oximeter For Hematocrit at 1169 nm After Second Derivative Pre-Processing | ||||||||
| Known Set | R | SEC % | O2 Slope | Slope | Intercept | Unknown Set | SEP % | Bias % |
| A | 0.997 | 0.70 | -0.305 | 459.66 | 31.50 | B1 | 2.97 | -2.01 |
| B | 2.36 | -1.62 | ||||||
| B | 0.983 | 0.69 | -0.253 | 439.55 | 29.64 | A1 | 2.08 | 1.68 |
| A | 1.78 | 1.38 |
| Prediction of Individual Sets Against Other Individual Sets With Adjustment For Percent Oxygen Saturation From A Spectral Ratio For Hemoglobin at 1170 nm After Second Derivative Pre-Processing | ||||||||
| Known Set | R | SEC g/dL | O2 Slope | Slope | Intercept | Unknown Set | SEP g/dL | Bias g/dL |
| A | 0.997 | 0.259 | 13.07 | 168.9 | -11.33 | B1 | 0.94 | -0.52 |
| B | 0.73 | -0.46 | ||||||
| B | 0.981 | 0.242 | 11.84 | 166.4 | -9.624 | A1 | 0.62 | 0.48 |
| A | 0.59 | 0.48 |
| Prediction of Individual Sets Against Other Individual Sets With Adjustment For Percent Oxygen Saturation From A Spectral Ratio For Hemoglobin at 1170 nm After Second Derivative Pre-Processing | ||||||||
| Known Set | R | SEC % | O2 Slope | Slope | Intercept | Unknown Set | SEP % | Bias % |
| A | 0.997 | 0.72 | 36.46 | 495.38 | -31.18 | B1 | 3.90 | -2.19 |
| B | 2.67 | -2.18 | ||||||
| B | 0.970 | 0.92 | 36.05 | 496.69 | -28.69 | A1 | 2.72 | 2.22 |
| A | 2.61 | 2.22 |


| Prediction of Individual Sets Against Combined Set For Hemoglobin at Ratio of 820/1161 nm | |||
| Set | R | SEC g/dL | Bias g/dL |
| A1 | 0.998 | 0.32 | -0.16 |
| A | 0.992 | 0.39 | 0.00 |
| B1 | 0.994 | 0.36 | -0.22 |
| B | 0.832 | 0.92 | 0.14 |
| Prediction of Individual Sets Against Other Individual Sets For Hemoglobin After Ratio Pre-Processing at 820/1161 nm | |||||||
| Known Set | R | SEC g/dL | Slope | Intercept | Unknown Set | SEP g/dL | Bias g/dL |
| A1 | 0.998 | 0.20 | 42.817 | -43.793 | B1 | 0.34 | -0.21 |
| B | 0.99 | 0.18 | |||||
| A | 0.992 | 0.39 | 41.071 | -43.683 | B1 | 0.42 | -0.27 |
| B | 0.93 | 0.10 | |||||
| B1 | 0.995 | 0.15 | 43.195 | -44.047 | A1 | 0.34 | 0.24 |
| A | 0.63 | 0.42 | |||||
| B | 0.832 | 0.70 | 26.227 | -23.170 | A1 | 1.63 | -0.99 |
| A | 1.59 | -0.98 |
| Predict Individual Sets Against The Combined Set For Hematocrit After Ratio Pre-Processing at 820/1161 nm | |||
| Set | R | SEC (%) | Bias (%) |
| A1 | 0.998 | 0.93 | -0.29 |
| A | 0.991 | 1.25 | 0.15 |
| B1 | 0.987 | 1.94 | -1.25 |
| B | 0.835 | 2.52 | -0.35 |
| Predict Individual Sets Against Other Individual Sets For Hematocrit After Ratio Pre-Processing at 820/1161 nm | |||||||
| Known Set | R | SEC (%) | Slope | Intercept | Unknown Set | SEP (%) | Bias (%) |
| A1 | 0.998 | 0.53 | 122.53 | -126.08 | B1 | 2.32 | -1.57 |
| B | 2.80 | -0.53 | |||||
| A | 0.991 | 1.18 | 117.50 | -120.02 | B1 | 2.58 | -1.75 |
| B | 2.87 | -0.78 | |||||
| B1 | 0.987 | 0.68 | 125.02 | -127.60 | A1 | 2.03 | 1.73 |
| A | 2.82 | 2.29 | |||||
| B | 0.835 | 2.08 | 78.72 | -70.63 | A1 | 3.63 | -1.61 |
| A | 3.57 | -1.52 |
| Prediction of Individual Sets Against Other Individual Sets With Adjustment For Percent Oxygen Saturation From A Co-Oximeter For Hemoglobin After Pre-Processing at 820/1161 nm | ||||||||
| Known Set | R | SEC g/dL | O2 Slope | Slope | Intercept | Unknown Set | SEP g/dL | Bias g/dL |
| A | 0.997 | 0.23 | 0.0273 | 41.506 | -44.820 | B1 | 0.33 | -0.15 |
| B | 0.56 | -0.03 | ||||||
| B | 0.945 | 0.46 | 0.0418 | 41.935 | -46.633 | A1 | 0.30 | 0.17 |
| A | 0.32 | 0.11 |
| Prediction of Individual Sets Against Other Individual Sets With Adjustment For Percent Oxygen Saturation From A Co-Oximeter For Hematocrit After Ratio Pre-Processing at 820/1161 nm | ||||||||
| Known Set | R | SEC % | O2 Slope | Slope | Intercept | Unknown Set | SEP % | Bias % |
| A | 0.997 | 0.67 | 0.0850 | 118.86 | -129.79 | B1 | 2.55 | -1.38 |
| B | 2.36 | -1.18 | ||||||
| B | 0.928 | 1.58 | 0.1129 | 121.17 | -134.02 | A1 | 1.91 | 1.54 |
| B | 1.77 | 1.42 |
| Prediction of Individual Sets Against Other Individual Sets With Adjustment For Percent Oxygen Saturation From A Spectral Ratio For Hemoglobin After Ratio Pre-Processing at 820/1161 nm | ||||||||
| Known Set | R | SEC % | O2 Slope | Slope | Intercept | Unknown Set | SEP % | Bias % |
| A | 0.998 | 0.21 | -3.109 | 40.758 | -38.561 | B1 | 0.35 | -0.17 |
| B | 0.56 | -0.02 | ||||||
| B | 0.960 | 0.39 | -5.421 | 40.725 | -36.410 | A1 | 0.36 | 0.24 |
| A | 0.35 | 0.12 |
| Prediction of Individual Sets Against Other Individual Sets With Adjustment For Percent Oxygen Saturation From A Spectral Ratio For Hematocrit After Ratio Pre-Processing at 820/1161 nm | ||||||||
| Known Set | R | SEC % | O2 Slope | Slope | Intercept | Unknown Set | SEP % | Bias % |
| A | 0.998 | 0.60 | -9.647 | 116.54 | -110.40 | B1 | 2.61 | -1.43 |
| B | 2.30 | -1.14 | ||||||
| B | 0.943 | 1.40 | -14.858 | 118.46 | -106.91 | A1 | 2.18 | 1.77 |
| A | 1.88 | 1.49 |
Claims (10)
- A method for analyzing a property of biological matter having a water content in a dynamic condition, the biological matter approximated to comprise a first compartment related to the property to be analyzed and a second compartment having a proportionally larger or smaller amount of water than the first compartment, the method comprising:(a) observing multiple samples of biological matter in a dynamic condition;(b) irradiating with near infrared light said multiple samples of the biological matter;(c) detecting the near infrared absorption spectrum of each of said multiple samples as spectral data consisting of absorbance measurements;(d) applying a ratio pre-processing technique to the spectral data of absorbance measurements of the spectrum of each of said multiple samples to identify a multiplicity of ratio wavelength pairs;(e) independently quantifying the property to be analyzed for each of said multiple samples;(f) establishing a training set from said near infrared absorption spectra of step (d) of said multiple samples using the multiplicity of ratio wavelength pairs; and(g) statistically identifying the nature of a best two compartment mathematical correlation between the property to be analyzed in the first compartment and the water content in the biological matter (1) by correlating values obtained during step (e) with values obtained during step (f) and (2) by selecting a ratio wavelength pair of absorbance measurements in which one wavelength is a strong near infrared wavelength absorbance peak of the water content and in which the second wavelength of the ratio wavelength pair is another near infrared wavelength absorbance measuring point having absorbances in the first compartment wherein the ratio pair is selected to minimize variability in the property to be analyzed.
- The method according to Claim 1, further comprising the steps of:(h) observing an unknown sample of the biological matter in a dynamic condition;(i) irradiating said unknown sample with near infrared light;(j) detecting near infrared spectrum of said unknown sample as spectral data consisting of absorbance measurements;(k) applying said ratio pre-processing technique using the ratio wavelength pair selected in step (g) to the spectral data of absorbance measurements of said spectrum of said unknown sample; and(l) predicting the property to be analyzed in said unknown sample by utilizing said best two compartment mathematical correlation obtained in said statistically identifying step (g).
- A method according to Claim 1 or Claim 2, wherein said mathematical correlation in said statistically identifying step (g) comprises a linear function related to a near infrared absorbance peak of water in the absorbance spectra of said multiple samples subjected to said pre-processing technique.
- A method according to Claim 1 or Claim 2, wherein the biological matter is whole blood and the property of the first compartment to be analyzed is hematocrit.
- A method according to Claim 1 or Claim 2, wherein the biological matter is whole blood and the property of the first compartment to be analyzed is the hemoglobin concentration in the whole blood.
- A method according to Claim 4 or Claim 5, wherein the biological matter is whole blood and said absorbance peak of water occurs in the near infrared spectra from about 1150 to about 1190 nanometers.
- A method according to Claim 4, Claim 5, or Claim 6, wherein said another near infrared wavelength absorbance measuring point is the isosbestic point of oxyhemoglobin and deoxyhemoglobin.
- A method according to Claim 1, further comprising the steps of:(1) observing additional samples of biological matter in a dynamic condition;(2) independently quantifying the property to be analyzed for each of said additional samples;(3) performing steps (b), (c), and (d) with respect to said additional samples;(4) predicting the property to be analyzed in said additional samples by utilizing said mathematical correlation obtained in said statistically identifying step (g); and(5) validating said mathematical correlation by comparing the property predicted in step (4) to the property independently quantified in step (2).
- A method according to any of Claims 2-7, wherein the biological matter is whole animal blood and further comprising the steps of independently quantifying a value proportional to the percentage oxygen saturation in the whole animal blood for each of said multiple samples and determining a value proportional to the percent oxygen saturation of the unknown sample.
- A method for monitoring a property of interest in whole blood of a live patient, nearly simultaneously with flow of the whole blood in the patient, comprising:wherein said linear functional relationship is established by the method according to any of the preceding Claims.(a) establishing a blood flow loop having a diversion section departing from the patient terminating at a flow cell, a return section returning to the patient beginning at a flow cell, and a bypass section between the diversion section and the return section;(b) flowing the whole blood through the blood loop;(c) using near infrared detecting means to monitor the property of interest in the whole blood flowing through the blood loop; and(d) identifying the value of the property of interest using a method of correlation of a linear functional relationship;
Applications Claiming Priority (2)
| Application Number | Priority Date | Filing Date | Title |
|---|---|---|---|
| US40889089A | 1989-09-18 | 1989-09-18 | |
| US408890 | 1999-09-29 |
Publications (3)
| Publication Number | Publication Date |
|---|---|
| EP0419223A2 EP0419223A2 (en) | 1991-03-27 |
| EP0419223A3 EP0419223A3 (en) | 1992-05-20 |
| EP0419223B1 true EP0419223B1 (en) | 1998-05-27 |
Family
ID=23618192
Family Applications (1)
| Application Number | Title | Priority Date | Filing Date |
|---|---|---|---|
| EP90310219A Expired - Lifetime EP0419223B1 (en) | 1989-09-18 | 1990-09-18 | Characterizing biological matter in a dynamic condition using near infrared spectroscopy |
Country Status (7)
| Country | Link |
|---|---|
| US (2) | US5729333A (en) |
| EP (1) | EP0419223B1 (en) |
| JP (1) | JP3213308B2 (en) |
| CA (1) | CA2025330C (en) |
| DE (1) | DE69032339T2 (en) |
| DK (1) | DK0419223T3 (en) |
| ES (1) | ES2118714T3 (en) |
Cited By (6)
| Publication number | Priority date | Publication date | Assignee | Title |
|---|---|---|---|---|
| US8224411B2 (en) | 2005-03-01 | 2012-07-17 | Masimo Laboratories, Inc. | Noninvasive multi-parameter patient monitor |
| US8781544B2 (en) | 2007-03-27 | 2014-07-15 | Cercacor Laboratories, Inc. | Multiple wavelength optical sensor |
| US8909310B2 (en) | 2008-08-04 | 2014-12-09 | Cercacor Laboratories, Inc. | Multi-stream sensor front ends for noninvasive measurement of blood constituents |
| US8965471B2 (en) | 2007-04-21 | 2015-02-24 | Cercacor Laboratories, Inc. | Tissue profile wellness monitor |
| US9186102B2 (en) | 2009-09-03 | 2015-11-17 | Cercacor Laboratories, Inc. | Emitter driver for noninvasive patient monitor |
| US9591975B2 (en) | 2008-07-03 | 2017-03-14 | Masimo Corporation | Contoured protrusion for improving spectroscopic measurement of blood constituents |
Families Citing this family (135)
| Publication number | Priority date | Publication date | Assignee | Title |
|---|---|---|---|---|
| US5223714A (en) * | 1991-11-26 | 1993-06-29 | Ashland Oil, Inc. | Process for predicting properties of multi-component fluid blends |
| DK88893D0 (en) * | 1993-07-30 | 1993-07-30 | Radiometer As | A METHOD AND APPARATUS FOR DETERMINING THE CONTENT OF A CONSTITUENT OF BLOOD OF AN INDIVIDUAL |
| US5553615A (en) * | 1994-01-31 | 1996-09-10 | Minnesota Mining And Manufacturing Company | Method and apparatus for noninvasive prediction of hematocrit |
| SG38866A1 (en) * | 1995-07-31 | 1997-04-17 | Instrumentation Metrics Inc | Liquid correlation spectrometry |
| US6240306B1 (en) | 1995-08-09 | 2001-05-29 | Rio Grande Medical Technologies, Inc. | Method and apparatus for non-invasive blood analyte measurement with fluid compartment equilibration |
| EP0762109A3 (en) * | 1995-08-30 | 1997-09-17 | Kyoto Daiichi Kagaku Kk | Method of and apparatus for measuring lactic acid in organism |
| JP3237692B2 (en) * | 1996-04-24 | 2001-12-10 | 横河電機株式会社 | Converter for near infrared spectrometer |
| US6855562B1 (en) * | 1996-07-30 | 2005-02-15 | Horiba, Ltd. | Immunoassay method for lyzed whole blood |
| CA2231305C (en) * | 1997-03-11 | 2007-03-20 | Merrit Nyles Jacobs | Improved analyzer throughput featuring through-the-tip analysis |
| EP0971625B1 (en) * | 1997-04-03 | 2013-08-21 | National Research Council Of Canada | Method of assessing tissue viability using near-infrared spectroscopy |
| US7267665B2 (en) * | 1999-06-03 | 2007-09-11 | Medtronic Minimed, Inc. | Closed loop system for controlling insulin infusion |
| US7890158B2 (en) | 2001-06-05 | 2011-02-15 | Lumidigm, Inc. | Apparatus and method of biometric determination using specialized optical spectroscopy systems |
| US6558351B1 (en) | 1999-06-03 | 2003-05-06 | Medtronic Minimed, Inc. | Closed loop system for controlling insulin infusion |
| US5954643A (en) * | 1997-06-09 | 1999-09-21 | Minimid Inc. | Insertion set for a transcutaneous sensor |
| WO2002065090A2 (en) * | 2001-01-26 | 2002-08-22 | Sensys Medical | Noninvasive measurement of glucose through the optical properties of tissue |
| US6385474B1 (en) * | 1999-03-19 | 2002-05-07 | Barbara Ann Karmanos Cancer Institute | Method and apparatus for high-resolution detection and characterization of medical pathologies |
| US6526298B1 (en) * | 1998-05-18 | 2003-02-25 | Abbott Laboratories | Method for the non-invasive determination of analytes in a selected volume of tissue |
| ATE468068T1 (en) * | 1998-07-04 | 2010-06-15 | Whitland Res Ltd | BLOODLESS MEASUREMENT OF ANALYTES FROM BLOOD |
| US7400918B2 (en) * | 1998-07-04 | 2008-07-15 | Edwards Lifesciences | Measurement of blood oxygen saturation |
| EP1104254A2 (en) | 1998-08-13 | 2001-06-06 | Whitland Research Limited | Optical device |
| US6430513B1 (en) | 1998-09-04 | 2002-08-06 | Perkinelmer Instruments Llc | Monitoring constituents of an animal organ using statistical correlation |
| US6424847B1 (en) * | 1999-02-25 | 2002-07-23 | Medtronic Minimed, Inc. | Glucose monitor calibration methods |
| US7047054B2 (en) * | 1999-03-12 | 2006-05-16 | Cas Medical Systems, Inc. | Laser diode optical transducer assembly for non-invasive spectrophotometric blood oxygenation monitoring |
| US6669663B1 (en) * | 1999-04-30 | 2003-12-30 | Medtronic, Inc. | Closed loop medicament pump |
| US6473632B1 (en) | 1999-06-16 | 2002-10-29 | Hutchinson Technology Incorporated | Total hemoglobin concentration measurement |
| US6526297B1 (en) * | 1999-10-04 | 2003-02-25 | Instrumentarium Corp. | Method and apparatus for quantifying the hypnotic component of the depth of anesthesia by monitoring changes in optical scattering properties of brain tissue |
| US6816605B2 (en) | 1999-10-08 | 2004-11-09 | Lumidigm, Inc. | Methods and systems for biometric identification of individuals using linear optical spectroscopy |
| US6687004B1 (en) | 1999-10-22 | 2004-02-03 | Marquette University | Optical sensor for opaque and non-opaque materials |
| AT409451B (en) * | 1999-12-14 | 2002-08-26 | Hoffmann La Roche | DEVICE FOR DETERMINING THE LOCAL DISTRIBUTION OF A MEASURED VALUE |
| US6898533B1 (en) | 2000-02-01 | 2005-05-24 | The United States Of America As Represented By The Department Of Health And Human Services | Methods for predicting the biological, chemical, and physical properties of molecules from their spectral properties |
| CA2399967A1 (en) * | 2000-02-01 | 2001-08-09 | Dwight W. Miller | Methods for predicting the biological, chemical, and physical properties of molecules from their spectral properties |
| US7890295B2 (en) | 2000-02-23 | 2011-02-15 | Medtronic Minimed, Inc. | Real time self-adjusting calibration algorithm |
| HUP0201283A2 (en) * | 2000-03-31 | 2002-08-28 | Japan Government | Method and apparatus for detecting mastitis by using visible light and/or near infrared light |
| US6456862B2 (en) * | 2000-05-02 | 2002-09-24 | Cas Medical Systems, Inc. | Method for non-invasive spectrophotometric blood oxygenation monitoring |
| US6749565B2 (en) | 2000-07-08 | 2004-06-15 | Victor Chudner | Method for blood infrared spectroscopy diagnosing of inner organs pathology |
| US6549861B1 (en) | 2000-08-10 | 2003-04-15 | Euro-Celtique, S.A. | Automated system and method for spectroscopic analysis |
| WO2002014812A1 (en) * | 2000-08-10 | 2002-02-21 | Euro-Celtique, S.A. | Automated system and method for spectroscopic analysis |
| WO2002016905A2 (en) | 2000-08-21 | 2002-02-28 | Euro-Celtique, S.A. | Near infrared blood glucose monitoring system |
| JP4054853B2 (en) * | 2000-10-17 | 2008-03-05 | 独立行政法人農業・食品産業技術総合研究機構 | Blood analysis using near infrared spectroscopy |
| US6534768B1 (en) | 2000-10-30 | 2003-03-18 | Euro-Oeltique, S.A. | Hemispherical detector |
| US6865408B1 (en) | 2001-04-11 | 2005-03-08 | Inlight Solutions, Inc. | System for non-invasive measurement of glucose in humans |
| US6574490B2 (en) | 2001-04-11 | 2003-06-03 | Rio Grande Medical Technologies, Inc. | System for non-invasive measurement of glucose in humans |
| US6983176B2 (en) | 2001-04-11 | 2006-01-03 | Rio Grande Medical Technologies, Inc. | Optically similar reference samples and related methods for multivariate calibration models used in optical spectroscopy |
| DE10131724B4 (en) * | 2001-06-29 | 2007-10-18 | Dräger Safety AG & Co. KGaA | Optical absorption measuring device |
| US6827702B2 (en) | 2001-09-07 | 2004-12-07 | Medtronic Minimed, Inc. | Safety limits for closed-loop infusion pump control |
| CA2474134C (en) * | 2002-01-15 | 2015-11-17 | Board Of Regents, The University Of Texas System | Methods and compositions to reduce scattering of light during therapeutic and diagnostic imaging procedures |
| US7996156B2 (en) * | 2002-03-07 | 2011-08-09 | The United States Of America As Represented By The Secretary, Department Of Health And Human Services | Methods for predicting properties of molecules |
| JP4129866B2 (en) * | 2002-07-18 | 2008-08-06 | 日機装株式会社 | Blood processing equipment |
| WO2004010844A2 (en) * | 2002-07-26 | 2004-02-05 | Cas Medical Systems, Inc. | Method for spectrophotometric blood oxygenation monitoring |
| US7302349B2 (en) | 2002-08-16 | 2007-11-27 | Lattec I/S | System and a method for observing and predicting a physiological state of an animal |
| JP3958733B2 (en) * | 2002-11-14 | 2007-08-15 | 日機装株式会社 | Blood purification equipment |
| WO2004079347A1 (en) * | 2003-03-07 | 2004-09-16 | Pfizer Products Inc. | Method of analysis of nir data |
| US7751594B2 (en) | 2003-04-04 | 2010-07-06 | Lumidigm, Inc. | White-light spectral biometric sensors |
| US7460696B2 (en) | 2004-06-01 | 2008-12-02 | Lumidigm, Inc. | Multispectral imaging biometrics |
| US7668350B2 (en) | 2003-04-04 | 2010-02-23 | Lumidigm, Inc. | Comparative texture analysis of tissue for biometric spoof detection |
| WO2004090786A2 (en) | 2003-04-04 | 2004-10-21 | Lumidigm, Inc. | Multispectral biometric sensor |
| EP1491876A1 (en) * | 2003-06-24 | 2004-12-29 | Ecole Polytechnique | FTIR ellipsometry device and process for characterization and further identification of samples of complex biogical materials, notably micro-organisms |
| ITMI20031715A1 (en) * | 2003-09-05 | 2005-03-06 | Dideco Spa | CONTROL DEVICE IN THE DIFFERENTIATED COLLECTION OF THE |
| US7060018B2 (en) | 2003-09-11 | 2006-06-13 | Cobe Cardiovascular, Inc. | Centrifuge apparatus for processing blood |
| US8229185B2 (en) | 2004-06-01 | 2012-07-24 | Lumidigm, Inc. | Hygienic biometric sensors |
| US8787630B2 (en) | 2004-08-11 | 2014-07-22 | Lumidigm, Inc. | Multispectral barcode imaging |
| US7467075B2 (en) * | 2004-12-23 | 2008-12-16 | Covidien Ag | Three-dimensional finite-element code for electrosurgery and thermal ablation simulations |
| US7547281B2 (en) * | 2005-02-01 | 2009-06-16 | Medtronic Minimed, Inc. | Algorithm sensor augmented bolus estimator for semi-closed loop infusion system |
| US20070103678A1 (en) | 2005-02-14 | 2007-05-10 | Sterling Bernhard B | Analyte detection system with interferent identification and correction |
| EP1866628A1 (en) * | 2005-03-29 | 2007-12-19 | The Dow Chemical Company | Spectroscopic analysis and control |
| US7801338B2 (en) | 2005-04-27 | 2010-09-21 | Lumidigm, Inc. | Multispectral biometric sensors |
| CA2824033A1 (en) * | 2005-09-13 | 2007-03-22 | Edwards Lifesciences Corporation | Continuous spectroscopic measurement of total hemoglobin |
| US7536214B2 (en) * | 2005-10-26 | 2009-05-19 | Hutchinson Technology Incorporated | Dynamic StO2 measurements and analysis |
| US7985330B2 (en) * | 2005-12-30 | 2011-07-26 | Medtronic Minimed, Inc. | Method and system for detecting age, hydration, and functional states of sensors using electrochemical impedance spectroscopy |
| US8114268B2 (en) | 2005-12-30 | 2012-02-14 | Medtronic Minimed, Inc. | Method and system for remedying sensor malfunctions detected by electrochemical impedance spectroscopy |
| US8114269B2 (en) | 2005-12-30 | 2012-02-14 | Medtronic Minimed, Inc. | System and method for determining the point of hydration and proper time to apply potential to a glucose sensor |
| US7995808B2 (en) | 2006-07-19 | 2011-08-09 | Lumidigm, Inc. | Contactless multispectral biometric capture |
| US8355545B2 (en) | 2007-04-10 | 2013-01-15 | Lumidigm, Inc. | Biometric detection using spatial, temporal, and/or spectral techniques |
| CN101506826A (en) | 2006-07-19 | 2009-08-12 | 光谱辨识公司 | Multibiometric multispectral imager |
| US8175346B2 (en) | 2006-07-19 | 2012-05-08 | Lumidigm, Inc. | Whole-hand multispectral biometric imaging |
| US7804984B2 (en) | 2006-07-31 | 2010-09-28 | Lumidigm, Inc. | Spatial-spectral fingerprint spoof detection |
| US7801339B2 (en) | 2006-07-31 | 2010-09-21 | Lumidigm, Inc. | Biometrics with spatiospectral spoof detection |
| US8265723B1 (en) | 2006-10-12 | 2012-09-11 | Cercacor Laboratories, Inc. | Oximeter probe off indicator defining probe off space |
| US7952692B2 (en) * | 2006-12-12 | 2011-05-31 | Orsense Ltd. | Method and apparatus for determination of analyte concentration |
| EP2101634A1 (en) * | 2006-12-13 | 2009-09-23 | Bayer Healthcare, LLC | Biosensor with coded information and method for manufacturing the same |
| US7946985B2 (en) * | 2006-12-29 | 2011-05-24 | Medtronic Minimed, Inc. | Method and system for providing sensor redundancy |
| US8175665B2 (en) * | 2007-03-09 | 2012-05-08 | Nellcor Puritan Bennett Llc | Method and apparatus for spectroscopic tissue analyte measurement |
| US8285010B2 (en) | 2007-03-21 | 2012-10-09 | Lumidigm, Inc. | Biometrics based on locally consistent features |
| US8703492B2 (en) | 2007-04-06 | 2014-04-22 | Qiagen Gaithersburg, Inc. | Open platform hybrid manual-automated sample processing system |
| US8877507B2 (en) | 2007-04-06 | 2014-11-04 | Qiagen Gaithersburg, Inc. | Ensuring sample adequacy using turbidity light scattering techniques |
| US8355132B2 (en) * | 2007-04-06 | 2013-01-15 | Qiagen Gaithersburg, Inc. | Sample adequacy measurement system having a plurality of sample tubes and using turbidity light scattering techniques |
| US20080269714A1 (en) | 2007-04-25 | 2008-10-30 | Medtronic Minimed, Inc. | Closed loop/semi-closed loop therapy modification system |
| US20080269723A1 (en) * | 2007-04-25 | 2008-10-30 | Medtronic Minimed, Inc. | Closed loop/semi-closed loop therapy modification system |
| US10201324B2 (en) | 2007-05-04 | 2019-02-12 | Delphinus Medical Technologies, Inc. | Patient interface system |
| US8597190B2 (en) | 2007-05-18 | 2013-12-03 | Optiscan Biomedical Corporation | Monitoring systems and methods with fast initialization |
| EP2174129A1 (en) * | 2007-08-06 | 2010-04-14 | Bayer Healthcare, LLC | System and method for automatic calibration |
| JP5219440B2 (en) * | 2007-09-12 | 2013-06-26 | キヤノン株式会社 | measuring device |
| US7783442B2 (en) * | 2007-10-31 | 2010-08-24 | Medtronic Minimed, Inc. | System and methods for calibrating physiological characteristic sensors |
| US8241488B2 (en) * | 2007-11-06 | 2012-08-14 | Bayer Healthcare Llc | Auto-calibrating test sensors |
| US7809512B2 (en) * | 2007-11-11 | 2010-10-05 | Bayer Healthcare Llc | Biosensor coding system |
| US20090205399A1 (en) * | 2008-02-15 | 2009-08-20 | Bayer Healthcare, Llc | Auto-calibrating test sensors |
| US8424763B2 (en) * | 2008-10-07 | 2013-04-23 | Bayer Healthcare Llc | Method of forming an auto-calibration circuit or label |
| US8130369B2 (en) * | 2008-11-05 | 2012-03-06 | Fresenius Medical Care Holdings, Inc. | Measuring hematocrit and estimating hemoglobin values with a non-invasive, optical blood monitoring system |
| US9370324B2 (en) | 2008-11-05 | 2016-06-21 | Fresenius Medical Care Holdings, Inc. | Hemodialysis patient data acquisition, management and analysis system |
| US8319953B2 (en) * | 2009-03-10 | 2012-11-27 | Spectra Tracker LLC | Method and device for spectrally detecting presence of blood |
| US9091676B2 (en) | 2010-06-09 | 2015-07-28 | Optiscan Biomedical Corp. | Systems and methods for measuring multiple analytes in a sample |
| US10475529B2 (en) | 2011-07-19 | 2019-11-12 | Optiscan Biomedical Corporation | Method and apparatus for analyte measurements using calibration sets |
| WO2011028620A1 (en) | 2009-08-26 | 2011-03-10 | Lumidigm, Inc. | Multiplexed biometric imaging and dual-imager biometric sensor |
| US9839381B1 (en) | 2009-11-24 | 2017-12-12 | Cercacor Laboratories, Inc. | Physiological measurement system with automatic wavelength adjustment |
| GB2487882B (en) | 2009-12-04 | 2017-03-29 | Masimo Corp | Calibration for multi-stage physiological monitors |
| US8570149B2 (en) | 2010-03-16 | 2013-10-29 | Lumidigm, Inc. | Biometric imaging using an optical adaptive interface |
| CN103270414B (en) * | 2010-03-23 | 2015-02-04 | 费森尼斯医疗德国公司 | Methods and apparatuses for predicting the effects of erythropoesis stimulating agents (ESA), and for determining a dose to be administered |
| ES2636468T3 (en) * | 2010-08-03 | 2017-10-05 | Fresenius Medical Care Deutschland Gmbh | Method and apparatus for predicting the effects of erythropoiesis stimulating agents (ESA), and for determining a dose to be administered |
| US8743354B2 (en) | 2010-09-07 | 2014-06-03 | Fresenius Medical Care Holdings, Inc. | Shrouded sensor clip assembly and blood chamber for an optical blood monitoring system |
| US9194792B2 (en) | 2010-09-07 | 2015-11-24 | Fresenius Medical Care Holdings, Inc. | Blood chamber for an optical blood monitoring system |
| US8645082B2 (en) * | 2010-09-13 | 2014-02-04 | Mks Instruments, Inc. | Monitoring, detecting and quantifying chemical compounds in a sample |
| US8489164B2 (en) | 2010-10-27 | 2013-07-16 | Medtronic, Inc. | Monitoring of tissue hemoglobin concentration |
| US9173988B2 (en) | 2010-11-17 | 2015-11-03 | Fresenius Medical Care Holdings, Inc. | Sensor clip assembly for an optical monitoring system |
| EP3150239B1 (en) | 2010-11-17 | 2019-01-02 | Fresenius Medical Care Holdings, Inc. | Sensor clip assembly for an optical monitoring system |
| US10092226B2 (en) * | 2011-12-23 | 2018-10-09 | General Electric Company | Method, arrangement, sensor, and computer program product for non-invasively measuring hemoglobin concentrations in blood |
| JP5901012B2 (en) * | 2012-02-13 | 2016-04-06 | 国立大学法人 東京医科歯科大学 | Blood information measuring method and apparatus |
| USD725261S1 (en) | 2012-02-24 | 2015-03-24 | Fresenius Medical Care Holdings, Inc. | Blood flow chamber |
| EP2642276A1 (en) * | 2012-03-22 | 2013-09-25 | Inoviem Scientific | Method of dynamic spectroscopy under physiological conditions |
| US9763641B2 (en) | 2012-08-30 | 2017-09-19 | Delphinus Medical Technologies, Inc. | Method and system for imaging a volume of tissue with tissue boundary detection |
| US10123770B2 (en) | 2013-03-13 | 2018-11-13 | Delphinus Medical Technologies, Inc. | Patient support system |
| WO2015009970A1 (en) * | 2013-07-18 | 2015-01-22 | Erythron Llc | Spectroscopic measurements with parallel array detector |
| US9861317B2 (en) * | 2014-02-20 | 2018-01-09 | Covidien Lp | Methods and systems for determining regional blood oxygen saturation |
| US20150338338A1 (en) | 2014-02-28 | 2015-11-26 | Erythron, Llc | Method and Apparatus for Determining Markers of Health by Analysis of Blood |
| US10143443B2 (en) | 2014-05-05 | 2018-12-04 | Delphinus Medical Technologies, Inc. | Method for representing tissue stiffness |
| US10743837B2 (en) | 2014-08-04 | 2020-08-18 | Delphinus Medical Technologies, Inc. | Ultrasound waveform tomography method and system |
| US10285667B2 (en) | 2014-08-05 | 2019-05-14 | Delphinus Medical Technologies, Inc. | Method for generating an enhanced image of a volume of tissue |
| CN104237158B (en) * | 2014-09-04 | 2016-07-27 | 浙江科技学院 | A kind of Qualitative Analysis of Near Infrared Spectroscopy method with universality |
| WO2016168090A1 (en) | 2015-04-14 | 2016-10-20 | Nueon, Inc. | Method and apparatus for determining markers of health by analysis of blood |
| USD799031S1 (en) | 2015-09-09 | 2017-10-03 | Fresenius Medical Care Holdings, Inc. | Blood flow chamber with directional arrow |
| KR102461185B1 (en) * | 2015-11-30 | 2022-11-01 | 삼성전자주식회사 | Apparatus for estimating blood level of an ingredient using specrum analysis |
| WO2017165403A1 (en) | 2016-03-21 | 2017-09-28 | Nueon Inc. | Porous mesh spectrometry methods and apparatus |
| US10408812B2 (en) * | 2016-10-12 | 2019-09-10 | General Electric Company | Characterization and control system and method for a resin |
| WO2018085699A1 (en) | 2016-11-04 | 2018-05-11 | Nueon Inc. | Combination blood lancet and analyzer |
| EP3606428A4 (en) * | 2017-04-04 | 2020-04-22 | Cas Medical Systems, Inc. | Method and apparatus for non-invasively measuring circulatory hemoglobin |
| US20210251534A1 (en) * | 2018-06-26 | 2021-08-19 | Mayo Foundation For Medical Education And Research | System and Method for Determining a Current Hemoglobin Level |
Family Cites Families (34)
| Publication number | Priority date | Publication date | Assignee | Title |
|---|---|---|---|---|
| BE758318A (en) * | 1969-12-01 | 1971-04-30 | Technicon Instr | METHOD AND APPARATUS FOR THE AUTOMATIC HIGH PRECISION DETERMINATION OF THE HEMATOCRITIS OF TOTAL BLOOD SAMPLES |
| US3877818A (en) * | 1974-01-28 | 1975-04-15 | Us Agriculture | Photo-optical method for determining fat content in meat |
| US4017192A (en) * | 1975-02-06 | 1977-04-12 | Neotec Corporation | Optical analysis of biomedical specimens |
| CA1037285A (en) * | 1975-04-30 | 1978-08-29 | Glenfield Warner | Ear oximetry process and apparatus |
| US4114604A (en) * | 1976-10-18 | 1978-09-19 | Shaw Robert F | Catheter oximeter apparatus and method |
| US4134678A (en) * | 1977-03-16 | 1979-01-16 | Instrumentation Laboratory Inc. | Automatic blood analysis apparatus and method |
| US4281645A (en) * | 1977-06-28 | 1981-08-04 | Duke University, Inc. | Method and apparatus for monitoring metabolism in body organs |
| US4303336A (en) * | 1978-08-28 | 1981-12-01 | Baxter Travenol Laboratories, Inc. | Method and apparatus for making a rapid measurement of the hematocrit of blood |
| US4243883A (en) * | 1979-01-19 | 1981-01-06 | Midwest Cardiovascular Institute Foundation | Blood hematocrit monitoring system |
| US4210809A (en) * | 1979-03-16 | 1980-07-01 | Technicon Instruments Corporation | Method and apparatus for the non-invasive determination of the characteristics of a segmented fluid stream |
| JPS60620B2 (en) * | 1979-05-21 | 1985-01-09 | 横河電機株式会社 | Method and device for measuring moisture content of paper |
| DE2934190A1 (en) * | 1979-08-23 | 1981-03-19 | Müller, Gerhard, Prof. Dr.-Ing., 7080 Aalen | METHOD AND DEVICE FOR MOLECULAR SPECTROSCOPY, ESPECIALLY FOR DETERMINING METABOLISM PRODUCTS |
| US4523279A (en) * | 1980-11-24 | 1985-06-11 | Oximetrix, Inc. | Apparatus for determining oxygen saturation levels in blood |
| US4447150A (en) * | 1981-02-27 | 1984-05-08 | Bentley Laboratories | Apparatus and method for measuring blood oxygen saturation |
| US4407290A (en) * | 1981-04-01 | 1983-10-04 | Biox Technology, Inc. | Blood constituent measuring device and method |
| US4466076A (en) * | 1981-05-15 | 1984-08-14 | Trebor Industries, Inc. | Apparatus for near infrared quantitative analysis with temperature variation correction |
| JPS58143243A (en) * | 1982-02-19 | 1983-08-25 | Minolta Camera Co Ltd | Measuring apparatus for coloring matter in blood without taking out blood |
| US4485820A (en) * | 1982-05-10 | 1984-12-04 | The Johns Hopkins University | Method and apparatus for the continuous monitoring of hemoglobin saturation in the blood of premature infants |
| JPS60501268A (en) * | 1983-05-12 | 1985-08-08 | ザ ブロ−クン ヒル プロプライエタリイ カンパニ− リミテツド | Characterization and processing of multicomponent materials |
| US4660151A (en) * | 1983-09-19 | 1987-04-21 | Beckman Instruments, Inc. | Multicomponent quantitative analytical method and apparatus |
| US4642778A (en) * | 1984-03-02 | 1987-02-10 | Indiana University Foundation | Method and device for spectral reconstruction |
| EP0404207B1 (en) * | 1984-11-13 | 1995-09-13 | Shields Instruments Limited | Infrared spectrophotometric method |
| US4655225A (en) * | 1985-04-18 | 1987-04-07 | Kurabo Industries Ltd. | Spectrophotometric method and apparatus for the non-invasive |
| US4633087A (en) * | 1985-04-24 | 1986-12-30 | Trebor Industries, Inc. | Near infrared apparatus for measurement of organic constituents of material |
| US4651741A (en) * | 1985-05-30 | 1987-03-24 | Baxter Travenol Laboratories, Inc. | Method and apparatus for determining oxygen saturation in vivo |
| US4800279A (en) * | 1985-09-13 | 1989-01-24 | Indiana University Foundation | Methods and devices for near-infrared evaluation of physical properties of samples |
| US4745279A (en) * | 1986-01-02 | 1988-05-17 | American Hospital Supply Corporation | Hematocrit measuring apparatus |
| EP0240742A3 (en) * | 1986-03-07 | 1989-01-11 | TERUMO KABUSHIKI KAISHA trading as TERUMO CORPORATION | Apparatus and method for measuring amount of oxygen in blood |
| SE459641B (en) * | 1986-03-24 | 1989-07-24 | Gambro Ab | DETECTOR SYSTEM CONTROLS A BLOOD CIRCULATION ALTERNATIVE WITH A SIGNIFICANTLY UNLESSED |
| US4805623A (en) * | 1987-09-04 | 1989-02-21 | Vander Corporation | Spectrophotometric method for quantitatively determining the concentration of a dilute component in a light- or other radiation-scattering environment |
| US5101825A (en) * | 1988-10-28 | 1992-04-07 | Blackbox, Inc. | Method for noninvasive intermittent and/or continuous hemoglobin, arterial oxygen content, and hematocrit determination |
| CA1331483C (en) * | 1988-11-02 | 1994-08-16 | Britton Chance | User-wearable hemoglobinometer for measuring the metabolic condition of a subject |
| US4972331A (en) * | 1989-02-06 | 1990-11-20 | Nim, Inc. | Phase modulated spectrophotometry |
| US4975581A (en) * | 1989-06-21 | 1990-12-04 | University Of New Mexico | Method of and apparatus for determining the similarity of a biological analyte from a model constructed from known biological fluids |
-
1990
- 1990-09-13 CA CA002025330A patent/CA2025330C/en not_active Expired - Fee Related
- 1990-09-17 JP JP24693790A patent/JP3213308B2/en not_active Expired - Fee Related
- 1990-09-18 DE DE69032339T patent/DE69032339T2/en not_active Expired - Fee Related
- 1990-09-18 EP EP90310219A patent/EP0419223B1/en not_active Expired - Lifetime
- 1990-09-18 ES ES90310219T patent/ES2118714T3/en not_active Expired - Lifetime
- 1990-09-18 DK DK90310219T patent/DK0419223T3/en active
-
1992
- 1992-12-22 US US07/995,951 patent/US5729333A/en not_active Expired - Fee Related
-
1995
- 1995-06-07 US US08/476,129 patent/US5830133A/en not_active Expired - Fee Related
Non-Patent Citations (2)
| Title |
|---|
| Analytical Chemistry, Vol. 58, No. 8, July 1986. * |
| Near Infrared Analysis, Analytical Instrumentation, Vol. 14(1), Pages 1-62, (1985). * |
Cited By (18)
| Publication number | Priority date | Publication date | Assignee | Title |
|---|---|---|---|---|
| US9167995B2 (en) | 2005-03-01 | 2015-10-27 | Cercacor Laboratories, Inc. | Physiological parameter confidence measure |
| US8849365B2 (en) | 2005-03-01 | 2014-09-30 | Cercacor Laboratories, Inc. | Multiple wavelength sensor emitters |
| US8224411B2 (en) | 2005-03-01 | 2012-07-17 | Masimo Laboratories, Inc. | Noninvasive multi-parameter patient monitor |
| US9241662B2 (en) | 2005-03-01 | 2016-01-26 | Cercacor Laboratories, Inc. | Configurable physiological measurement system |
| US8912909B2 (en) | 2005-03-01 | 2014-12-16 | Cercacor Laboratories, Inc. | Noninvasive multi-parameter patient monitor |
| US8929964B2 (en) | 2005-03-01 | 2015-01-06 | Cercacor Laboratories, Inc. | Multiple wavelength sensor drivers |
| US9549696B2 (en) | 2005-03-01 | 2017-01-24 | Cercacor Laboratories, Inc. | Physiological parameter confidence measure |
| US9131882B2 (en) | 2005-03-01 | 2015-09-15 | Cercacor Laboratories, Inc. | Noninvasive multi-parameter patient monitor |
| US9351675B2 (en) | 2005-03-01 | 2016-05-31 | Cercacor Laboratories, Inc. | Noninvasive multi-parameter patient monitor |
| US8781544B2 (en) | 2007-03-27 | 2014-07-15 | Cercacor Laboratories, Inc. | Multiple wavelength optical sensor |
| US8965471B2 (en) | 2007-04-21 | 2015-02-24 | Cercacor Laboratories, Inc. | Tissue profile wellness monitor |
| US9277880B2 (en) | 2008-07-03 | 2016-03-08 | Masimo Corporation | Multi-stream data collection system for noninvasive measurement of blood constituents |
| US12036009B1 (en) | 2008-07-03 | 2024-07-16 | Masimo Corporation | User-worn device for noninvasively measuring a physiological parameter of a user |
| US9591975B2 (en) | 2008-07-03 | 2017-03-14 | Masimo Corporation | Contoured protrusion for improving spectroscopic measurement of blood constituents |
| US10376190B1 (en) | 2008-07-03 | 2019-08-13 | Masimo Corporation | Multi-stream data collection system for noninvasive measurement of blood constituents |
| US10376191B1 (en) | 2008-07-03 | 2019-08-13 | Masimo Corporation | Multi-stream data collection system for noninvasive measurement of blood constituents |
| US8909310B2 (en) | 2008-08-04 | 2014-12-09 | Cercacor Laboratories, Inc. | Multi-stream sensor front ends for noninvasive measurement of blood constituents |
| US9186102B2 (en) | 2009-09-03 | 2015-11-17 | Cercacor Laboratories, Inc. | Emitter driver for noninvasive patient monitor |
Also Published As
| Publication number | Publication date |
|---|---|
| ES2118714T3 (en) | 1998-10-01 |
| US5729333A (en) | 1998-03-17 |
| EP0419223A2 (en) | 1991-03-27 |
| DK0419223T3 (en) | 1999-03-22 |
| CA2025330A1 (en) | 1991-03-19 |
| EP0419223A3 (en) | 1992-05-20 |
| JP3213308B2 (en) | 2001-10-02 |
| US5830133A (en) | 1998-11-03 |
| DE69032339D1 (en) | 1998-07-02 |
| CA2025330C (en) | 2002-01-22 |
| DE69032339T2 (en) | 1998-12-24 |
| JPH03118446A (en) | 1991-05-21 |
Similar Documents
| Publication | Publication Date | Title |
|---|---|---|
| EP0419223B1 (en) | Characterizing biological matter in a dynamic condition using near infrared spectroscopy | |
| US5706208A (en) | Method for the prediction of properties of biological matter by analysis of the near-infrared spectrum thereof | |
| US5692503A (en) | Method for noninvasive (in-vivo) total hemoglobin, oxyhemogolobin, deoxyhemoglobin, carboxyhemoglobin and methemoglobin concentration determination | |
| EP0210417B1 (en) | A method and an apparatus for determining blood components | |
| US8788004B2 (en) | Method for spectrophotometric blood oxygenation monitoring | |
| JP2965212B2 (en) | Method and apparatus for determining the similarity of biological analytes from models made from known biological fluids | |
| US5377674A (en) | Method for non-invasive and in-vitro hemoglobin concentration measurement | |
| EP0693900B1 (en) | System and method for noninvasive hematocrit monitoring | |
| US5803908A (en) | System for noninvasive hematocrit monitoring | |
| US6456862B2 (en) | Method for non-invasive spectrophotometric blood oxygenation monitoring | |
| US6061581A (en) | Invasive and in vivo near-infrared determination of pH | |
| JP4636762B2 (en) | Method for calibrating a spectroscopic device | |
| CA2025329C (en) | Characterizing matter of biological origin using near infrared spectroscopy | |
| US8180419B2 (en) | Tissue hydration estimation by spectral absorption bandwidth measurement | |
| US20030202170A1 (en) | Method and apparatus for direct spectrophotometric measurements in unaltered whole blood | |
| WO1999040432A1 (en) | Optical measurement of blood hematocrit incorporating a self-calibration algorithm | |
| Meinke et al. | Chemometric determination of blood parameters using visible–near-infrared spectra | |
| CA2460898A1 (en) | Apparatus and method for combining in vivo and in vitro testing | |
| US20080214911A1 (en) | Method and Device for Determining Blood Components Using Ratiometric Absolute Pulse Spectroscopy | |
| Mendelson | A multiwavelength vis-nir spectrometer for pulsatile measurement of hemoglobin derivatives in whole blood | |
| US10863937B2 (en) | Ex vivo calibration of a photoplethysmographic device | |
| Koo | Measurement of blood analytes in turbid biological tissue using near-infrared Raman spectroscopy | |
| Soller et al. | Investigation of electrolyte measurement in diluted whole blood using spectroscopic and chemometric methods | |
| RU2140083C1 (en) | Method of determination of content of main derivatives of hemoglobin | |
| Sequeira et al. | Prediction of Alanine Using Neural Network Model |
Legal Events
| Date | Code | Title | Description |
|---|---|---|---|
| PUAI | Public reference made under article 153(3) epc to a published international application that has entered the european phase |
Free format text: ORIGINAL CODE: 0009012 |
|
| 17P | Request for examination filed |
Effective date: 19910102 |
|
| AK | Designated contracting states |
Kind code of ref document: A2 Designated state(s): DE DK ES FR GB IT NL SE |
|
| PUAL | Search report despatched |
Free format text: ORIGINAL CODE: 0009013 |
|
| AK | Designated contracting states |
Kind code of ref document: A3 Designated state(s): DE DK ES FR GB IT NL SE |
|
| 17Q | First examination report despatched |
Effective date: 19940915 |
|
| GRAG | Despatch of communication of intention to grant |
Free format text: ORIGINAL CODE: EPIDOS AGRA |
|
| GRAG | Despatch of communication of intention to grant |
Free format text: ORIGINAL CODE: EPIDOS AGRA |
|
| GRAH | Despatch of communication of intention to grant a patent |
Free format text: ORIGINAL CODE: EPIDOS IGRA |
|
| GRAH | Despatch of communication of intention to grant a patent |
Free format text: ORIGINAL CODE: EPIDOS IGRA |
|
| GRAA | (expected) grant |
Free format text: ORIGINAL CODE: 0009210 |
|
| AK | Designated contracting states |
Kind code of ref document: B1 Designated state(s): DE DK ES FR GB IT NL SE |
|
| ITF | It: translation for a ep patent filed | ||
| REF | Corresponds to: |
Ref document number: 69032339 Country of ref document: DE Date of ref document: 19980702 |
|
| ET | Fr: translation filed | ||
| REG | Reference to a national code |
Ref country code: ES Ref legal event code: FG2A Ref document number: 2118714 Country of ref document: ES Kind code of ref document: T3 |
|
| REG | Reference to a national code |
Ref country code: DK Ref legal event code: T3 |
|
| PLBE | No opposition filed within time limit |
Free format text: ORIGINAL CODE: 0009261 |
|
| STAA | Information on the status of an ep patent application or granted ep patent |
Free format text: STATUS: NO OPPOSITION FILED WITHIN TIME LIMIT |
|
| 26N | No opposition filed | ||
| PGFP | Annual fee paid to national office [announced via postgrant information from national office to epo] |
Ref country code: SE Payment date: 20000906 Year of fee payment: 11 |
|
| PGFP | Annual fee paid to national office [announced via postgrant information from national office to epo] |
Ref country code: DK Payment date: 20000913 Year of fee payment: 11 |
|
| PGFP | Annual fee paid to national office [announced via postgrant information from national office to epo] |
Ref country code: ES Payment date: 20000925 Year of fee payment: 11 |
|
| PGFP | Annual fee paid to national office [announced via postgrant information from national office to epo] |
Ref country code: NL Payment date: 20000928 Year of fee payment: 11 |
|
| PGFP | Annual fee paid to national office [announced via postgrant information from national office to epo] |
Ref country code: FR Payment date: 20010911 Year of fee payment: 12 |
|
| PG25 | Lapsed in a contracting state [announced via postgrant information from national office to epo] |
Ref country code: DK Free format text: LAPSE BECAUSE OF NON-PAYMENT OF DUE FEES Effective date: 20010918 |
|
| PG25 | Lapsed in a contracting state [announced via postgrant information from national office to epo] |
Ref country code: SE Free format text: LAPSE BECAUSE OF NON-PAYMENT OF DUE FEES Effective date: 20010919 Ref country code: ES Free format text: LAPSE BECAUSE OF NON-PAYMENT OF DUE FEES Effective date: 20010919 |
|
| PGFP | Annual fee paid to national office [announced via postgrant information from national office to epo] |
Ref country code: GB Payment date: 20010919 Year of fee payment: 12 |
|
| PGFP | Annual fee paid to national office [announced via postgrant information from national office to epo] |
Ref country code: DE Payment date: 20011001 Year of fee payment: 12 |
|
| REG | Reference to a national code |
Ref country code: GB Ref legal event code: IF02 |
|
| PG25 | Lapsed in a contracting state [announced via postgrant information from national office to epo] |
Ref country code: NL Free format text: LAPSE BECAUSE OF NON-PAYMENT OF DUE FEES Effective date: 20020401 |
|
| EUG | Se: european patent has lapsed |
Ref document number: 90310219.2 |
|
| NLV4 | Nl: lapsed or anulled due to non-payment of the annual fee |
Effective date: 20020401 |
|
| REG | Reference to a national code |
Ref country code: DK Ref legal event code: EBP |
|
| PG25 | Lapsed in a contracting state [announced via postgrant information from national office to epo] |
Ref country code: GB Free format text: LAPSE BECAUSE OF NON-PAYMENT OF DUE FEES Effective date: 20020918 |
|
| PG25 | Lapsed in a contracting state [announced via postgrant information from national office to epo] |
Ref country code: DE Free format text: LAPSE BECAUSE OF NON-PAYMENT OF DUE FEES Effective date: 20030401 |
|
| GBPC | Gb: european patent ceased through non-payment of renewal fee |
Effective date: 20020918 |
|
| NLV4 | Nl: lapsed or anulled due to non-payment of the annual fee |
Effective date: 20020401 |
|
| PG25 | Lapsed in a contracting state [announced via postgrant information from national office to epo] |
Ref country code: FR Free format text: LAPSE BECAUSE OF NON-PAYMENT OF DUE FEES Effective date: 20030603 |
|
| REG | Reference to a national code |
Ref country code: FR Ref legal event code: ST |
|
| REG | Reference to a national code |
Ref country code: ES Ref legal event code: FD2A Effective date: 20021011 |
|
| PG25 | Lapsed in a contracting state [announced via postgrant information from national office to epo] |
Ref country code: IT Free format text: LAPSE BECAUSE OF NON-PAYMENT OF DUE FEES;WARNING: LAPSES OF ITALIAN PATENTS WITH EFFECTIVE DATE BEFORE 2007 MAY HAVE OCCURRED AT ANY TIME BEFORE 2007. THE CORRECT EFFECTIVE DATE MAY BE DIFFERENT FROM THE ONE RECORDED. Effective date: 20050918 |