EP0366298A2 - Recognition and processing of wave forms - Google Patents
Recognition and processing of wave forms Download PDFInfo
- Publication number
- EP0366298A2 EP0366298A2 EP89310333A EP89310333A EP0366298A2 EP 0366298 A2 EP0366298 A2 EP 0366298A2 EP 89310333 A EP89310333 A EP 89310333A EP 89310333 A EP89310333 A EP 89310333A EP 0366298 A2 EP0366298 A2 EP 0366298A2
- Authority
- EP
- European Patent Office
- Prior art keywords
- signal
- magnitude
- points
- matrix
- radiation
- Prior art date
- Legal status (The legal status is an assumption and is not a legal conclusion. Google has not performed a legal analysis and makes no representation as to the accuracy of the status listed.)
- Granted
Links
Images

Classifications
-
- G—PHYSICS
- G08—SIGNALLING
- G08B—SIGNALLING SYSTEMS, e.g. PERSONAL CALLING SYSTEMS; ORDER TELEGRAPHS; ALARM SYSTEMS
- G08B17/00—Fire alarms; Alarms responsive to explosion
- G08B17/12—Actuation by presence of radiation or particles, e.g. of infrared radiation or of ions
-
- G—PHYSICS
- G06—COMPUTING OR CALCULATING; COUNTING
- G06F—ELECTRIC DIGITAL DATA PROCESSING
- G06F2218/00—Aspects of pattern recognition specially adapted for signal processing
- G06F2218/12—Classification; Matching
- G06F2218/16—Classification; Matching by matching signal segments
- G06F2218/18—Classification; Matching by matching signal segments by plotting the signal segments against each other, e.g. analysing scattergrams
Definitions
- the invention relates to the recognition and processing of waveforms.
- waveforms may, for example, be waveforms derived from electromagnetic radiation produced by flames or explosions.
- Embodiments of the invention to be described have improved discrimination against sources of varying infra-red radiation which might be confused with infra-red radiation emitted by flames.
- apparatus for recognition and classification comprising a sensor for detecting a parameter of interest and providing an electrical signal representative thereof, calculating means arranged to derive from said signal at least one matrix representing transitions of the signal waveform, and means for comparing the signal matrix and the reference values.
- a method of recognition and classification of phenomena involving complex waveforms comprising the steps of detecting a waveform of interest, identifying transitions in said waveform, deriving a matrix of values related to said transitions as a representation of said waveform, and comparing said matrix with stored reference values.
- a system for processing signals derived from infra-red radiation sources so as to discriminate in favour of flame sources and against other, interfering, sources comprising means for measuring the changes in magnitude between successive turning points of the signal, comparing means for comparing each such magnitude change with the immediately preceding such magnitude change, and processing means responsive to the successive comparisons to discriminate against those produced when the signal is substantially regularly varying or includes substantially step changes and in favour of those corresponding to a substantially randomly varying signal.
- a method of discriminating in favour of infra-red radiation from flames and against infra-red radiation from interfering sources comprising the steps of producing signals varying in correspondence with the said radiation, detecting the turning points of the signals, measuring the change in signal magnitude between successive said turning points whereby to produce a series of magnitude change signals, simulating the spatial representation of successive points on a graph having two orthogonal axes each of which is scaled with values increasing from zero for the said magnitude changes with one of the axes representing each currently considered magnitude change and the other of them representing the corresponding immediately preceding magnitude change so that each said point on the graph represents a plot of a particular one of the magnitude changes as compared with the immediately preceding one thereof, whereby points on the graph corresponding to substantially regularly varying said signals lie within a predetermined region extending from the origin and inclined to each said axis, points on the graph corresponding to substantially step changes in the said signals lie within either of two regions extending closely adjacent the respective axes, and
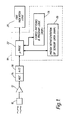
- a fire detection system comprises a radiation sensor 10 which may suitably be a broad-band detector for visible, infrared or ultraviolet light.
- the output of sensor 10 is amplified at 12 and passed via an automatic gain control circuit 14 to an A-to-D converter 16.
- the resulting digitised signal is analysed as will be described by microcomputer 18; if this results in recognition of a fire, an alarm signal of any convenient type is generated at 20.
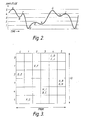
- the output signal from the sensor 10 will be a relatively complex waveform, part of which is shown in Figure 2.
- the invention is based on deriving from the waveform one or more matrices, each representing in a simple manner information providing a significant characterisation of the waveform which can then be compared with a reference.
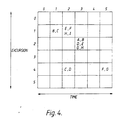
- Figure 3 shows a "transition matrix" of the waveform of Figure 2. This is formed by detecting the transitions or the turning points A-J of the waveform and measuring the amplitude of each, in the example shown to a resolution of five amplitude levels. The matrix is then created representing the change in amplitude between successive transitions as a 2-dimensional matrix with axes defining the start and finish amplitudes of that change. For example, between C and D the amplitude changes from 4 units to 0 units, and the step C, D is positioned to define "from 4" (horizontal axis) "to 0" (vertical axis).
- Figure 3 is thus descriptive of the varying absolute amplitudes of the signal in a time-independent manner.
- Figure 4 illustrates a "signal reversal" matrix for the same signal, which is descriptive of change (but not absolute value) of amplitude with time.
- the matrix is based on detecting signal transitions and their amplitudes, but the elements of the matrix are the amplitude excursion and the time between transitions.
- the excursion vertical axis
- the time horizontal axis
- the matrices may readily be derived from the digitised detected signal by the microcomputer 18, which comprises microprocessor 22, ROM 24, and RAM 26, by appropriate software within the routine competence of a person of ordinary skill in the art.
- a given period of sensor signal is digitised and converted into matrix form on a repetitive basis.
- Each matrix is stored in RAM 26, and the microprocessor 22 then operates to compare the matrix with a reference held in ROM 24.
- Suitable reference patterns can be developed for loading in ROM 24 by empirical methods, specifically by using a similar sensor and associated equipment to derive matrices from actual fires and actual false-alarm-inducing phenomena. If a predetermined relationship exists between a sensor matrix and a reference matrix, an alarm indication is produced.
- Modifications and refinements to the handling of the matrix information may be made, particularly with the use of neural network pattern recognition systems.
- the two types of matrix described above may each be derived and compared with respective references, and the results of the two comparisons combined to give an overall probability.
- the apparatus may be applied to recognition of other complex variable phenomena, such as explosion detection, transient analysis, and monitoring the condition of machinery.
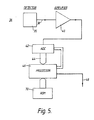
- the form of apparatus shown in Figure 5 includes an infra-red radiation detector 35, such as a pyroelectric detector, which is arranged to view the area 36 in which flames to be detected are expected to arise.
- the detector 35 may view the area 36 through a suitable radiation filter if required.
- the detector is arranged to be responsive to infra-red radiation at about 4.3 micrometres, and produces a corresponding electrical signal on a line 38 which is amplified in an amplifier 40 and passed to an analogue to digital converter 42.
- the resultant digital signal on channel 44 representing the varying radiation produced by the flickering flame, is passed to a processing unit 46 for analysis in the manner to be described.
- An output line 48 produces a warning signal if the processing unit 46 determines that the signal on line 44 represents a flame. If the processing unit 46 determines that the signal on line 44 represents a non-flame source of infra-red radiation, no warning signal is produced on line 18.
- the apparatus is able to discriminate against such non-flame sources of varying infra-red radiation as incandescent lamps, moving or vibrating hot surfaces or other sources of infra-red radiation such as sunlight modulated by the passage of a moving body or bodies through its path to the detector.
- non-flame sources of varying infra-red radiation as incandescent lamps, moving or vibrating hot surfaces or other sources of infra-red radiation such as sunlight modulated by the passage of a moving body or bodies through its path to the detector.
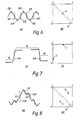
- FIG. 6 illustrates at 6A the waveform (somewhat idealised) of the signal likely to be produced on line 44 (Fig. 5) in response to a regularly varying source of infra-red radiation such as a modulated incandescent lamp.
- the waveform 50 is substantially a regular sine wave.
- each positive and negative peak 50A,50B,50C... is detected, and the processing unit measures the change in magnitude between each peak value and the immediately preceding peak value so as to produce a succession of "magnitude change" signals.
- These magnitude change signals are represented in Figure 5A by the vertical lines 52A,52B,52C...
- each of these magnitude change values will be approximately the same.
- the processing unit 46 analyses the magnitude change signals by comparing the value of each one with the previous one.
- Figure 6B shows in diagrammatic form the processing carried out.
- the horizontal axis from the origin 0/0 has an arbitrary scale of 0 to 5 and represents the value of each magnitude change signal being considered.
- the vertical axis downwards from the origin 0/0 is calibrated to the same arbitrary scale and represents the value of the immediately preceding magnitude change signal. Therefore, considering the magnitude change signals 52A and 52B (Figure 6A), point A on Figure 6B represents the comparison between them in graphical fashion; thus, point A represents the point corresponding the intersection of the value of the magnitude change signal 52B plotted on the horizontal axis and the value of the magnitude change signal 52A plotted on the vertical axis.
- Figure 7A shows the waveform represented by the digital signal on line 44 ( Figure 5) for the case where the infra-red radiation being received is from a source which is randomly switched on and off or interrupted.
- the waveform at region 54 could represent low background radiation.
- a source of radiation is then suddenly switched on and the level rises to that shown at region 56. This radiation continues and is then abruptly switched off and the detected radiation once more reduces to the background level as shown at region 58.
- the radiation in region 56 could be radiation from a hot surface which is interrupted or blocked from the detector over regions 54 and 58.
- the waveform shown in Figure 7A is processed in the processor 46 in the same way as described above.
- the processing unit senses the positive and negative peaks and measures the magnitude change between the successive peaks.
- the value of each such magnitude change signal is then compared with the immediately preceding one.
- Figure 7B shows a graph corresponding to that shown in Figure 6B. It will be apparent that, over regions 54,56 and 58, the signal is fluctuating between peaks whose magnitude difference is very small. Therefore, the corresponding plots on Figure 7B will be clustered around the origin 0/0 - and are not illustrated in Figure 7B.
- the waveform undergoes the transition from region 54 to region 56 there will be a large change, shown at 59A, and the corresponding plot is shown at C in Figure 7B.
- Figure 8A shows the waveform of the signal on line 44 when the infra-red radiation received is from a flame. As will be apparent, the waveform is significantly random.
- the processing unit 46 detects each positive and negative peak and measures the value of the magnitude change between each peak and the preceding one and then compares successive values of these magnitude cange signals, such as the magnitude change signals shown at 60A,60B,60C,60D.
- Figure 8B shows some of the corresponding points on a graph of the same form as that shown in Figures 6B and 7B.
- point E is the plot produced by comparing the magnitude change signal 60B with the magnitude change signal 60A.
- point F is shown the plot produced by comparing the magnitude change signal 60C with the magnitude change signal 60B. Because of the nature of the waveform of Figure 8A, which varies much more randomly than the waveforms shown in Figures 6A and 7A, the corresponding points on the graph of Figure 8B will tend to be positioned away from the diagonal line B and also away from the horizontal and vertical axes.
- the processing unit therefore analyses the incoming waveform on line 44 and, for a fixed number of events where each event consists of a comparison of the value of a magnitude change signal with the value of the immediately preceding magnitude change signal), determines the respective proportions of the number of events which produce (a) plots either on the diagonal B (Figs, 6B,7B and 8B) or close to the horizontal and vertical axes, and (b) plots which are spaced from the diagonal and from the axes.
- the analysis could be carried out by assigning a negative "score" e.g. -1) to each event producing a plot on the diagonal B or adjacent to the horizontal and vertical axes, and assigning a positive score (e.g.
- processing unit 46 may be arranged to produce a flame warning signal on line 48 only when the number produced by subtracting X from Y is more positive than a fixed threshold.
- the program for controlling the processing unit 46 and the thresholds used in the assessment and decision processes may be stored in the ROM 70 (Fig. 5).
- the number of events necessary for the processing unit 46 to make a decision can be arranged on a "rolling" basis.
- the unit 46 can make its decision on the basis of a consideration of the immediately preceding twenty events, each new event occurring then being considered in combination with the immediately preceding nineteen events.
- the latter may be achieved by adding the magnitude of each magnitude change signal to those of the preceding nineteen on a rolling basis.
- Figure 9 shows a flow chart for explaining such processes in more detail.
- Block 100 represents the process of reading the data from the analogue to digital converter which may, for example, be carried out by sampling the received digital representation at intervals substantially less than the period of waveforms likely to be received.
- the process checks each sample and compares its magnitude with the previous sample so as to determine whether a turning point has been reached. If it has, the difference from the previous turning point is calculated at block 104 and compared with the previous difference in block 106, a score being assigned according to the notional position of the event on the graph shown in Figs 6 to 8; for example each event of the type shown in Fig. 8 could be assigned a score of +1 and each event of the type shown in Fig. 6 or Fig. 7 could be assigned a score of -1.
- Block 108 represents the comparison process by which the current score is added to the previous 19 (for example) scores, and the result compared with a threshold.
- Block 110 represents the summing of the magnitudes of the differences between successive events (the magnitude change signals) and at 112 the magnitude for the current event is summed with the total for the nineteen previous events and the resultant checked to determine whether it exceeds a predetermined minimum.
- Block 114 represents the production of the fire warning signal if "yes" outputs are produced by both blocks 108 and 112.
- An alternative method of assessing the magnitude of the radiation is to integrate the digital signal received from the analogue to digital converter over a fixed time period.
- the system described above may be used as part of a system for discriminating against interfering sources of radiation.
- the system shown in Figure 5 could form one channel of a two-channel system.
- the second channel would be driven by a radiation detector rendered responsive to radiation in a different wavelength band from that of the channel illustrated, such as in another band in which radiation from the flames is expected to lie or another band in which interfering radiation is expected to lie.
- the flame warning signal on line 48 could then be processed in combination with the output of the second channel so as to produce an overall flame warning only when the signal on line 48 is present and when both channels detected flame.
- the signal on line 48 could be produced with the signal from the second channel so that an overall flame warning would only be produced when the signal on line 48 was present and no signal was present from the second channel.
Landscapes
- Business, Economics & Management (AREA)
- Emergency Management (AREA)
- Physics & Mathematics (AREA)
- General Physics & Mathematics (AREA)
- Photometry And Measurement Of Optical Pulse Characteristics (AREA)
- Fire-Detection Mechanisms (AREA)
- Fire Alarms (AREA)
- Investigating Or Analyzing Materials Using Thermal Means (AREA)
Abstract
Description
- The invention relates to the recognition and processing of waveforms. Such waveforms may, for example, be waveforms derived from electromagnetic radiation produced by flames or explosions. Embodiments of the invention to be described have improved discrimination against sources of varying infra-red radiation which might be confused with infra-red radiation emitted by flames.
- According to the invention, there is provided apparatus for recognition and classification, comprising a sensor for detecting a parameter of interest and providing an electrical signal representative thereof, calculating means arranged to derive from said signal at least one matrix representing transitions of the signal waveform, and means for comparing the signal matrix and the reference values.
- According to the invention, there is also provided a method of recognition and classification of phenomena involving complex waveforms, comprising the steps of detecting a waveform of interest, identifying transitions in said waveform, deriving a matrix of values related to said transitions as a representation of said waveform, and comparing said matrix with stored reference values.
- According to the invention, there is further provided a system for processing signals derived from infra-red radiation sources so as to discriminate in favour of flame sources and against other, interfering, sources, comprising means for measuring the changes in magnitude between successive turning points of the signal, comparing means for comparing each such magnitude change with the immediately preceding such magnitude change, and processing means responsive to the successive comparisons to discriminate against those produced when the signal is substantially regularly varying or includes substantially step changes and in favour of those corresponding to a substantially randomly varying signal.
- According to the invention, there is yet further provided a method of discriminating in favour of infra-red radiation from flames and against infra-red radiation from interfering sources, comprising the steps of producing signals varying in correspondence with the said radiation, detecting the turning points of the signals, measuring the change in signal magnitude between successive said turning points whereby to produce a series of magnitude change signals, simulating the spatial representation of successive points on a graph having two orthogonal axes each of which is scaled with values increasing from zero for the said magnitude changes with one of the axes representing each currently considered magnitude change and the other of them representing the corresponding immediately preceding magnitude change so that each said point on the graph represents a plot of a particular one of the magnitude changes as compared with the immediately preceding one thereof, whereby points on the graph corresponding to substantially regularly varying said signals lie within a predetermined region extending from the origin and inclined to each said axis, points on the graph corresponding to substantially step changes in the said signals lie within either of two regions extending closely adjacent the respective axes, and points corresponding to substantially randomly varying said signals tend to lie outside all the said regions, and including the step of determining the proportion of the said points which lie outside the said regions whereby to produce an output signal indicating detection of radiation from flames when the said proportion exceeds a predetermined threshold.
- Flame detection apparatus embodying the invention will now be described, by way of example only, with reference to the accompanying diagrammatic drawings in which:
- Figure 1 is a block diagram of one form of the apparatus;
- Figure 2 is a graphical representation of a signal detected in the apparatus of Figure 1;
- Figure 3 is a graphical representation of a transition matrix derived from the signal of Figure 2;
- Figure 4 is a graphical representation of a signal reversal matrix derived from the signal of Figure 2;
- Figure 5 is a block diagram of another form of the apparatus;
- Figures 6,7 and 8 show waveforms and associated graphs for explaining the operation of the apparatus of Figure 5; and
- Figure 9 is a schematic flow diagram for explaining the operation of the apparatus of Figure 5.
- Referring to Figure 1 a fire detection system comprises a
radiation sensor 10 which may suitably be a broad-band detector for visible, infrared or ultraviolet light. The output ofsensor 10 is amplified at 12 and passed via an automaticgain control circuit 14 to an A-to-D converter 16. The resulting digitised signal is analysed as will be described bymicrocomputer 18; if this results in recognition of a fire, an alarm signal of any convenient type is generated at 20. - The output signal from the
sensor 10 will be a relatively complex waveform, part of which is shown in Figure 2. The invention is based on deriving from the waveform one or more matrices, each representing in a simple manner information providing a significant characterisation of the waveform which can then be compared with a reference. - Figure 3 shows a "transition matrix" of the waveform of Figure 2. This is formed by detecting the transitions or the turning points A-J of the waveform and measuring the amplitude of each, in the example shown to a resolution of five amplitude levels. The matrix is then created representing the change in amplitude between successive transitions as a 2-dimensional matrix with axes defining the start and finish amplitudes of that change. For example, between C and D the amplitude changes from 4 units to 0 units, and the step C, D is positioned to define "from 4" (horizontal axis) "to 0" (vertical axis).
- The matrix of Figure 3 is thus descriptive of the varying absolute amplitudes of the signal in a time-independent manner. Figure 4 illustrates a "signal reversal" matrix for the same signal, which is descriptive of change (but not absolute value) of amplitude with time. Here again, the matrix is based on detecting signal transitions and their amplitudes, but the elements of the matrix are the amplitude excursion and the time between transitions. Thus, for example, between F and G the excursion (vertical axis) is 4 units and the time (horizontal axis) 5 units.
- The matrices may readily be derived from the digitised detected signal by the
microcomputer 18, which comprisesmicroprocessor 22,ROM 24, andRAM 26, by appropriate software within the routine competence of a person of ordinary skill in the art. - In use, a given period of sensor signal is digitised and converted into matrix form on a repetitive basis. Each matrix is stored in
RAM 26, and themicroprocessor 22 then operates to compare the matrix with a reference held inROM 24. Suitable reference patterns can be developed for loading inROM 24 by empirical methods, specifically by using a similar sensor and associated equipment to derive matrices from actual fires and actual false-alarm-inducing phenomena. If a predetermined relationship exists between a sensor matrix and a reference matrix, an alarm indication is produced. - Modifications and refinements to the handling of the matrix information may be made, particularly with the use of neural network pattern recognition systems. The two types of matrix described above may each be derived and compared with respective references, and the results of the two comparisons combined to give an overall probability. It is also possible to use auto-correlation, i.e. comparing the sensor signal with a delayed version of itself, to establish the degree of periodicity in the sensor signal as an auxiliary false alarm indication, a high degree of periodicity being associated with a false alarm situation.
- Although described above with specific reference to fire detection, the apparatus may be applied to recognition of other complex variable phenomena, such as explosion detection, transient analysis, and monitoring the condition of machinery.
- The form of apparatus shown in Figure 5 includes an infra-
red radiation detector 35, such as a pyroelectric detector, which is arranged to view thearea 36 in which flames to be detected are expected to arise. Thedetector 35 may view thearea 36 through a suitable radiation filter if required. In a specific example being considered, the detector is arranged to be responsive to infra-red radiation at about 4.3 micrometres, and produces a corresponding electrical signal on aline 38 which is amplified in anamplifier 40 and passed to an analogue todigital converter 42. The resultant digital signal onchannel 44, representing the varying radiation produced by the flickering flame, is passed to aprocessing unit 46 for analysis in the manner to be described. Anoutput line 48 produces a warning signal if theprocessing unit 46 determines that the signal online 44 represents a flame. If theprocessing unit 46 determines that the signal online 44 represents a non-flame source of infra-red radiation, no warning signal is produced online 18. - In the manner to be described, the apparatus is able to discriminate against such non-flame sources of varying infra-red radiation as incandescent lamps, moving or vibrating hot surfaces or other sources of infra-red radiation such as sunlight modulated by the passage of a moving body or bodies through its path to the detector.
- Figures 6,7 and 8 explain the operation of the apparatus.
- Figure 6 illustrates at 6A the waveform (somewhat idealised) of the signal likely to be produced on line 44 (Fig. 5) in response to a regularly varying source of infra-red radiation such as a modulated incandescent lamp. As shown, the waveform 50 is substantially a regular sine wave. In the
processing unit 46, each positive andnegative peak vertical lines processing unit 46 analyses the magnitude change signals by comparing the value of each one with the previous one. - Figure 6B shows in diagrammatic form the processing carried out. In Figure 6B, the horizontal axis from the
origin 0/0 has an arbitrary scale of 0 to 5 and represents the value of each magnitude change signal being considered. The vertical axis downwards from theorigin 0/0 is calibrated to the same arbitrary scale and represents the value of the immediately preceding magnitude change signal. Therefore, considering themagnitude change signals 52A and 52B (Figure 6A), point A on Figure 6B represents the comparison between them in graphical fashion; thus, point A represents the point corresponding the intersection of the value of the magnitude change signal 52B plotted on the horizontal axis and the value of themagnitude change signal 52A plotted on the vertical axis. - The regular nature of the waveform of Figure 6A is such that the corresponding plot on Figure 6B for the comparison of the
magnitude change signal 52C with the magnitude change signal 52B will also be at point A. As long as the amplitude of the waveform shown in Figure 6A remains the same, all plots will be at point A. If the amplitude of the waveform is different, but still regular, the plots on Figure 6B will be differently positioned, but will always be on the diagonal line shown chain-dotted at B. - Figure 7A shows the waveform represented by the digital signal on line 44 (Figure 5) for the case where the infra-red radiation being received is from a source which is randomly switched on and off or interrupted. For example, the waveform at
region 54 could represent low background radiation. A source of radiation is then suddenly switched on and the level rises to that shown atregion 56. This radiation continues and is then abruptly switched off and the detected radiation once more reduces to the background level as shown atregion 58. Instead, for example, the radiation inregion 56 could be radiation from a hot surface which is interrupted or blocked from the detector overregions - The waveform shown in Figure 7A is processed in the
processor 46 in the same way as described above. The processing unit senses the positive and negative peaks and measures the magnitude change between the successive peaks. The value of each such magnitude change signal is then compared with the immediately preceding one. Figure 7B shows a graph corresponding to that shown in Figure 6B. It will be apparent that, overregions origin 0/0 - and are not illustrated in Figure 7B. When the waveform undergoes the transition fromregion 54 toregion 56, there will be a large change, shown at 59A, and the corresponding plot is shown at C in Figure 7B. Similarly, there will be a large change, 59B, when the waveform switches fromregion 56 toregion 58, and the corresponding plot is shown at point D. It will therefore be apparent that, with a waveform of the form shown in Figure 7B, the plots on the graph will either be clustered around the origin or will be close to the horizontal or vertical axes. - Figure 8A shows the waveform of the signal on
line 44 when the infra-red radiation received is from a flame. As will be apparent, the waveform is significantly random. As before, theprocessing unit 46 detects each positive and negative peak and measures the value of the magnitude change between each peak and the preceding one and then compares successive values of these magnitude cange signals, such as the magnitude change signals shown at 60A,60B,60C,60D. - Figure 8B shows some of the corresponding points on a graph of the same form as that shown in Figures 6B and 7B. Thus, point E is the plot produced by comparing the
magnitude change signal 60B with themagnitude change signal 60A. At point F is shown the plot produced by comparing themagnitude change signal 60C with themagnitude change signal 60B. Because of the nature of the waveform of Figure 8A, which varies much more randomly than the waveforms shown in Figures 6A and 7A, the corresponding points on the graph of Figure 8B will tend to be positioned away from the diagonal line B and also away from the horizontal and vertical axes. - The processing unit therefore analyses the incoming waveform on
line 44 and, for a fixed number of events where each event consists of a comparison of the value of a magnitude change signal with the value of the immediately preceding magnitude change signal), determines the respective proportions of the number of events which produce (a) plots either on the diagonal B (Figs, 6B,7B and 8B) or close to the horizontal and vertical axes, and (b) plots which are spaced from the diagonal and from the axes. For example, the analysis could be carried out by assigning a negative "score" e.g. -1) to each event producing a plot on the diagonal B or adjacent to the horizontal and vertical axes, and assigning a positive score (e.g. +1) to each event which produces a plot (corresponding to plots D and F, for example) spaced from the diagonal and spaced from the horizontal and vertical axes. After a predetermined number of events, the negative total is subtracted from the positive total to give a resultant number. A more positive number will indicate that the signal being compared corresponds to radiation from a flame, whereas a more negative number will indicate that the signal corresponds to radiation produced from an interfering source such as one producingwaveform unit 46 may be arranged to produce a flame warning signal online 48 only when the number produced by subtracting X from Y is more positive than a fixed threshold. - In practice, of course, sources of interfering radiation of the form shown in Figure 6A will not always produce plots exactly on diagonal B. Therefore, all plots lying within a region whose boundaries lie either side of the diagonal B (as shown by the dotted lines adjacent to the diagonal B) would be considered as representing radiation from interfering sources of the type producing waveform A. Similarly, all points lying within defined regions running parallel to the horizontal and vertical axes would be considered as being derived from interfering radiation of the
type producing waveform 7A. - It will be noted that no account is taken of the sign of the magnitude change signals, merely their actual magnitude values.
- The program for controlling the
processing unit 46 and the thresholds used in the assessment and decision processes may be stored in the ROM 70 (Fig. 5). - The number of events necessary for the
processing unit 46 to make a decision can be arranged on a "rolling" basis. For example, theunit 46 can make its decision on the basis of a consideration of the immediately preceding twenty events, each new event occurring then being considered in combination with the immediately preceding nineteen events. - It is also desirable that an assessment be made of the intensity of the radiation so that a warning is only given when (a) the radiation is determined (in the manner described) to originate from a flame and (b) its intensity exceeds a minimum level. The latter may be achieved by adding the magnitude of each magnitude change signal to those of the preceding nineteen on a rolling basis.
- Figure 9 shows a flow chart for explaining such processes in more detail.
-
Block 100 represents the process of reading the data from the analogue to digital converter which may, for example, be carried out by sampling the received digital representation at intervals substantially less than the period of waveforms likely to be received. At block 102, the process checks each sample and compares its magnitude with the previous sample so as to determine whether a turning point has been reached. If it has, the difference from the previous turning point is calculated atblock 104 and compared with the previous difference inblock 106, a score being assigned according to the notional position of the event on the graph shown in Figs 6 to 8; for example each event of the type shown in Fig. 8 could be assigned a score of +1 and each event of the type shown in Fig. 6 or Fig. 7 could be assigned a score of -1. In practice, however, better discrimination may be achieved by assigning each event of the type shown in Figure 8 a more positive score such as +10.Block 108 represents the comparison process by which the current score is added to the previous 19 (for example) scores, and the result compared with a threshold.Block 110 represents the summing of the magnitudes of the differences between successive events (the magnitude change signals) and at 112 the magnitude for the current event is summed with the total for the nineteen previous events and the resultant checked to determine whether it exceeds a predetermined minimum. Block 114 represents the production of the fire warning signal if "yes" outputs are produced by bothblocks - The system described above may be used as part of a system for discriminating against interfering sources of radiation. For example, the system shown in Figure 5 could form one channel of a two-channel system. The second channel would be driven by a radiation detector rendered responsive to radiation in a different wavelength band from that of the channel illustrated, such as in another band in which radiation from the flames is expected to lie or another band in which interfering radiation is expected to lie. In the first case, the flame warning signal on
line 48 could then be processed in combination with the output of the second channel so as to produce an overall flame warning only when the signal online 48 is present and when both channels detected flame. In the second case, the signal online 48 could be produced with the signal from the second channel so that an overall flame warning would only be produced when the signal online 48 was present and no signal was present from the second channel.
Claims (11)
Applications Claiming Priority (4)
| Application Number | Priority Date | Filing Date | Title |
|---|---|---|---|
| GB8823947 | 1988-10-12 | ||
| GB8823947A GB2223844A (en) | 1988-10-12 | 1988-10-12 | Flame detector |
| GB8828166 | 1988-12-02 | ||
| GB888828166A GB8828166D0 (en) | 1988-12-02 | 1988-12-02 | Recognition system |
Publications (3)
| Publication Number | Publication Date |
|---|---|
| EP0366298A2 true EP0366298A2 (en) | 1990-05-02 |
| EP0366298A3 EP0366298A3 (en) | 1992-06-10 |
| EP0366298B1 EP0366298B1 (en) | 1996-03-13 |
Family
ID=26294509
Family Applications (1)
| Application Number | Title | Priority Date | Filing Date |
|---|---|---|---|
| EP89310333A Expired - Lifetime EP0366298B1 (en) | 1988-10-12 | 1989-10-10 | Recognition and processing of wave forms |
Country Status (6)
| Country | Link |
|---|---|
| EP (1) | EP0366298B1 (en) |
| AU (1) | AU4285689A (en) |
| DE (1) | DE68925937T2 (en) |
| GB (1) | GB2224117B (en) |
| IL (1) | IL91966A (en) |
| NO (1) | NO180737C (en) |
Cited By (4)
| Publication number | Priority date | Publication date | Assignee | Title |
|---|---|---|---|---|
| WO2005066384A1 (en) * | 2004-01-09 | 2005-07-21 | Mtu Aero Engines Gmbh | Wear-resistant layer and component comprising a wear-resistant layer |
| US7202794B2 (en) | 2004-07-20 | 2007-04-10 | General Monitors, Inc. | Flame detection system |
| US7942638B2 (en) | 2005-06-29 | 2011-05-17 | Mtu Aero Engines Gmbh | Turbomachine blade with a blade tip armor cladding |
| US8920881B2 (en) | 2004-10-16 | 2014-12-30 | MTU Aero Engines AG | Method for producing a component covered with a wear-resistant coating |
Family Cites Families (8)
| Publication number | Priority date | Publication date | Assignee | Title |
|---|---|---|---|---|
| US3466394A (en) * | 1966-05-02 | 1969-09-09 | Ibm | Voice verification system |
| CH519761A (en) * | 1971-03-04 | 1972-02-29 | Cerberus Ag | Flame detector |
| JPS5727109Y2 (en) * | 1974-07-20 | 1982-06-12 | ||
| AU2796877A (en) * | 1976-08-16 | 1979-02-22 | Doherty L E | Digital signal analyser |
| US4143356A (en) * | 1977-10-31 | 1979-03-06 | Ncr Canada Ltd - Ncr Canada Ltee | Character recognition apparatus |
| US4495585A (en) * | 1981-07-08 | 1985-01-22 | Buckley William H | Method of and apparatus for indicating characteristics of undulating data |
| GB2145864B (en) * | 1983-09-01 | 1987-09-03 | King Reginald Alfred | Voice recognition |
| DE3421782A1 (en) * | 1984-06-12 | 1985-12-12 | Manfred 6903 Neckargemünd Pistor | Circuit arrangement for suppressing periodic noise signals in danger alarm systems |
-
1989
- 1989-10-10 GB GB8922739A patent/GB2224117B/en not_active Expired - Lifetime
- 1989-10-10 NO NO894042A patent/NO180737C/en unknown
- 1989-10-10 EP EP89310333A patent/EP0366298B1/en not_active Expired - Lifetime
- 1989-10-10 DE DE68925937T patent/DE68925937T2/en not_active Expired - Lifetime
- 1989-10-12 AU AU42856/89A patent/AU4285689A/en not_active Abandoned
- 1989-10-12 IL IL91966A patent/IL91966A/en not_active IP Right Cessation
Cited By (5)
| Publication number | Priority date | Publication date | Assignee | Title |
|---|---|---|---|---|
| WO2005066384A1 (en) * | 2004-01-09 | 2005-07-21 | Mtu Aero Engines Gmbh | Wear-resistant layer and component comprising a wear-resistant layer |
| US7927709B2 (en) | 2004-01-09 | 2011-04-19 | Mtu Aero Engines Gmbh | Wear-resistant coating and a component having a wear-resistant coating |
| US7202794B2 (en) | 2004-07-20 | 2007-04-10 | General Monitors, Inc. | Flame detection system |
| US8920881B2 (en) | 2004-10-16 | 2014-12-30 | MTU Aero Engines AG | Method for producing a component covered with a wear-resistant coating |
| US7942638B2 (en) | 2005-06-29 | 2011-05-17 | Mtu Aero Engines Gmbh | Turbomachine blade with a blade tip armor cladding |
Also Published As
| Publication number | Publication date |
|---|---|
| EP0366298B1 (en) | 1996-03-13 |
| DE68925937T2 (en) | 1996-10-02 |
| IL91966A (en) | 1992-07-15 |
| NO894042L (en) | 1990-04-17 |
| NO180737C (en) | 1997-06-04 |
| AU4285689A (en) | 1990-04-26 |
| NO180737B (en) | 1997-02-24 |
| DE68925937D1 (en) | 1996-04-18 |
| EP0366298A3 (en) | 1992-06-10 |
| IL91966A0 (en) | 1990-07-12 |
| GB2224117B (en) | 1993-06-09 |
| GB2224117A (en) | 1990-04-25 |
| NO894042D0 (en) | 1989-10-10 |
| GB8922739D0 (en) | 1989-11-22 |
Similar Documents
| Publication | Publication Date | Title |
|---|---|---|
| EP0233245B1 (en) | Fire sensor statistical discriminator | |
| US6222456B1 (en) | Detector with variable sample rate | |
| US5483222A (en) | Multiple sensor apparatus and method | |
| EP0588753B1 (en) | Method for detecting a fire condition | |
| EP1687784B1 (en) | Smoke detection method and apparatus | |
| US20030141980A1 (en) | Smoke and flame detection | |
| US4866420A (en) | Method of detecting a fire of open uncontrolled flames | |
| EP0583131A1 (en) | Flame detection method and apparatus | |
| EP1174837B1 (en) | Method of detecting fire with light section image to sense smoke | |
| US5504473A (en) | Method of analyzing signal quality | |
| JPH08305980A (en) | Device and method for flame detection | |
| CN119479179B (en) | A highly reliable fire detection method and system | |
| US5006710A (en) | Recognition and processing of waveforms | |
| WO2001057819A2 (en) | Smoke and flame detection | |
| EP0366298A2 (en) | Recognition and processing of wave forms | |
| US5237512A (en) | Signal recognition and classification for identifying a fire | |
| GB2277989A (en) | Detector circuit for discriminating random events such as flame flicker | |
| US5838242A (en) | Fire detection system using modulation ratiometrics | |
| CN110428579B (en) | Indoor monitoring system, method and device based on image recognition | |
| WO2009126300A2 (en) | Process and system of energy signal detection | |
| JPH07200961A (en) | Fire alarm device for early detection of fire | |
| EP0926647B1 (en) | Method for detecting a fire condition | |
| EP0715744B1 (en) | Method and apparatus for preventing false responses in optical detection devices | |
| GB2251684A (en) | Method and apparatus for detecting fire | |
| JPH03134797A (en) | Fire alarm system |
Legal Events
| Date | Code | Title | Description |
|---|---|---|---|
| PUAI | Public reference made under article 153(3) epc to a published international application that has entered the european phase |
Free format text: ORIGINAL CODE: 0009012 |
|
| AK | Designated contracting states |
Kind code of ref document: A2 Designated state(s): AT BE CH DE ES FR GR IT LI LU NL SE |
|
| RBV | Designated contracting states (corrected) |
Designated state(s): CH DE FR IT LI |
|
| PUAL | Search report despatched |
Free format text: ORIGINAL CODE: 0009013 |
|
| AK | Designated contracting states |
Kind code of ref document: A3 Designated state(s): AT BE CH DE ES FR GR IT LI LU NL SE |
|
| 17P | Request for examination filed |
Effective date: 19920715 |
|
| 17Q | First examination report despatched |
Effective date: 19931019 |
|
| GRAA | (expected) grant |
Free format text: ORIGINAL CODE: 0009210 |
|
| AK | Designated contracting states |
Kind code of ref document: B1 Designated state(s): CH DE FR IT LI |
|
| PG25 | Lapsed in a contracting state [announced via postgrant information from national office to epo] |
Ref country code: IT Free format text: LAPSE BECAUSE OF FAILURE TO SUBMIT A TRANSLATION OF THE DESCRIPTION OR TO PAY THE FEE WITHIN THE PRE;WARNING: LAPSES OF ITALIAN PATENTS WITH EFFECTIVE DATE BEFORE 2007 MAY HAVE OCCURRED AT ANY TIME BEFORE 2007. THE CORRECT EFFECTIVE DATE MAY BE DIFFERENT FROM THE ONE RECORDED.SCRIBED TIME-LIMIT Effective date: 19960313 Ref country code: LI Effective date: 19960313 Ref country code: CH Effective date: 19960313 |
|
| REF | Corresponds to: |
Ref document number: 68925937 Country of ref document: DE Date of ref document: 19960418 |
|
| ET | Fr: translation filed | ||
| REG | Reference to a national code |
Ref country code: CH Ref legal event code: PL |
|
| PLBE | No opposition filed within time limit |
Free format text: ORIGINAL CODE: 0009261 |
|
| STAA | Information on the status of an ep patent application or granted ep patent |
Free format text: STATUS: NO OPPOSITION FILED WITHIN TIME LIMIT |
|
| 26N | No opposition filed | ||
| PGFP | Annual fee paid to national office [announced via postgrant information from national office to epo] |
Ref country code: FR Payment date: 19981009 Year of fee payment: 10 |
|
| PG25 | Lapsed in a contracting state [announced via postgrant information from national office to epo] |
Ref country code: FR Free format text: LAPSE BECAUSE OF NON-PAYMENT OF DUE FEES Effective date: 20000630 |
|
| REG | Reference to a national code |
Ref country code: FR Ref legal event code: ST |
|
| PGFP | Annual fee paid to national office [announced via postgrant information from national office to epo] |
Ref country code: DE Payment date: 20081031 Year of fee payment: 20 |