EP0354813B1 - Seismic data processing - Google Patents
Seismic data processing Download PDFInfo
- Publication number
- EP0354813B1 EP0354813B1 EP89308204A EP89308204A EP0354813B1 EP 0354813 B1 EP0354813 B1 EP 0354813B1 EP 89308204 A EP89308204 A EP 89308204A EP 89308204 A EP89308204 A EP 89308204A EP 0354813 B1 EP0354813 B1 EP 0354813B1
- Authority
- EP
- European Patent Office
- Prior art keywords
- amplitude
- noise
- ijh
- log
- factor
- Prior art date
- Legal status (The legal status is an assumption and is not a legal conclusion. Google has not performed a legal analysis and makes no representation as to the accuracy of the status listed.)
- Expired - Lifetime
Links
Images


Classifications
-
- G—PHYSICS
- G01—MEASURING; TESTING
- G01V—GEOPHYSICS; GRAVITATIONAL MEASUREMENTS; DETECTING MASSES OR OBJECTS; TAGS
- G01V1/00—Seismology; Seismic or acoustic prospecting or detecting
- G01V1/28—Processing seismic data, e.g. analysis, for interpretation, for correction
- G01V1/288—Event detection in seismic signals, e.g. microseismics
Definitions
- This method relates generally to seismic data processing .
- U.S. Patent No. 4,218,766 discloses a method of correcting trace to trace variations due to weathered-layer attenuation in seismic data.
- U.S. Patent No. 4,613,960 discloses a method for time correcting gathered traces by constructing an optimal pilot trace from the gathered traces.
- Taner and Koehler (1981) show an example of a similar computation which attempts to recognize anomalous amplitudes caused by outside disturbances such as near-subsurface layers (weathered zone) which might distort or influence the behaviour of the received seismic signals.
- European Patent Application EP-A-0 182 956 discloses a method of removing some noise from seismic traces by converting the traces into normalised data, obtaining the derivative of the normalised data, and plotting the derivative against the normalised data.
- a method for identifying anomalous noise amplitude data in seismic records having a plurality of shot traces comprising the steps of:
- the method may be computer-aided and designed for evaluating, correcting or suppressing anomalous amplitude values present in seismic data records prior to conventional data processing and may provide the geophysicist with an opportunity to evaluate the amount of noise present in a given trace before final processing where it is difficult to determine and remove the effects of noise on a final section.
- amplitude factors are calculated for each trace of demultiplexed seismic data for each shot point as a function of time.
- the time function is a series of time windows, the period of which is fixed for the calculation and user defined.
- a mathematical model relating several variable parameters which contribute to amplitude variation are calculated for each trace to produce a measured amplitude factor. Taking the logarithm of both sides of the mathematical model provides a solution to the equations which yield a computed noise-free amplitude factor.
- a correction ratio of the computed noise-free amplitude factor to the measured amplitude factor is made which is then weighed against used defined values chosen from predetermined histograms and printouts. If the correction ratio exceeds a given threshold, the entire trace, or only the portion of the trace exhibiting the anomalous amplitude may be corrected or removed prior to conventional data processing techniques.
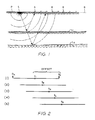
- FIG. 1 is a general diagram of a conventional land seismic reflection technique which involves generating a seismic signal (S) at a "shot point" on the surface of the earth (P) by way of a vibratory or explosive source.
- S seismic signal
- P surface of the earth
- L subsurface layers
- R a plurality of points
- the signals received by the detectors (R) are converted to another signal which is recorded by a central recording device often located on a truck. Once all the data is collected for a given shot point, the acoustic signal generator is moved to a new shot point and the process is repeated.
- FIG. 2 is a general illustration of one source-receiver geometry used in a seismic survey as described above.
- the Figure contains five receiver lines, otherwise known as “receiver spreads", labeled 1 through 5 which represent the lines of survey along a line A-B along the surface of the earth.
- Each receiver spread also contains a point shown by an "X" and labeled S1, S2, S3, etc. which represent the shot point for each spread 1 through 5.
- the spreads 1 through 5 are shown offset from each other and are just a sample of the many lines normally recorded in a typical survey. In reality, each seismic survey spread 1-5 would overlap the previous survey spread along the line A-B by a considerable distance.
- Each spread 1-5 also has a shot point common with the other spreads shot in a survey. That is the shot point occurs at the same location relative to the total number of receivers along a spread, thus the distance (offset) from the shot point to a particular receiver in each spread will be essentially the same.
- This type of survey also lends itself to common midpoint (CMP) or common depth point (CDP) collection of seismic data. Details of these terms will not be discussed herein and are well known to those skilled in the art.
- the signals detected and recorded be unaffected by outside influences other than the structure which reflected the signal.
- Science has not yet been able to devise a way of receiving such pure data.
- the received data are subject to many outside influences which affect the quality of the data.
- the technique described below provides one tool to better identify the role that one of these influences, noise, plays in the quality of seismic data.
- the quality of the seismic data depends on two broad categories of factors.
- the first factor is the equipment used in the survey. This includes everything from the type of source used to generate the signal, the kind of detectors used to receive the signal, and the recording equipment.
- the second factor which influences the quality of the seismic data is the subsurface geology of the earth. These elements include the type of material through which the signal propagates, the depth of the weathering layer along the surface, the density of the subsurface layers, the continuity of the subsurface layers, etc. The list is long.
- the amplitude of the seismic signal has been of interest to geophysical scientists for some time.
- the amplitude of a received signal is a general indicator of the strength of the received signal as well as its phase relative to the signal generated. The alignment and consistency of the amplitude between adjacent traces in a seismic section helps the scientist determine the character of the reflecting horizon in the subsurface.
- Geometry information provides the location of the survey along the surface of the earth, as well as the location of each receiver or receiver group.
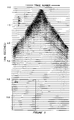
- Figure 3 generally illustrates one shot record taken from one shot point associated with the above geometry of Figure 2.
- Each trace of a record is labeled at the top of the record according to its location along the line of survey, and its relative distance from the shot point is easily calculated.
- the vertical scale is in two-way travel time.
- the records taken from each line, such as those shown in Figure 3 may contain up to as many as, or more than, 1024 different traces, each trace representing the signals received by a single detector or detector group at a known location on the surface of the earth.
- most of the traces have relatively consistent amplitudes.
- a noticeable exception is marked in the box labeled AA showing a portion of the record containing a trace with an anomalous amplitude.
- Figure 4 is an enlarged portion of the shot record shown in Figure 3 as box AA.
- the differences in the amplitudes from trace to trace are more clearly distinguishable than from Figure 3.
- the following method embodying the present invention may be used.
- each trace of a shot record is examined in a series of time windows shown generally as t1, t2, . . . t n Figure 4.
- Each window may be of any desired period and is selected by the user. For the purposes of this discussion it will be assumed that the time window has a period of 200 milliseconds. Once a period is selected by the user, the window period remains constant during that operation/evaluation. The period may be changed for the next data set to be evaluated.
- the method next calculates the amplitude values for each trace as a function of the window period.
- Rms root mean square
- rms values can be used to represent the amplitudes, as well as peak amplitudes values. It is preferred that rms values be used in situations where the noise in a section appears as long duration (20 to 300 milliseconds) anomalous amplitudes, often known as "blobs" in the industry.
- a blob is a noise artifact caused by some of the following factors: weeds or branches brushing against the geophones, traffic on nearby roads, as well as other extraneous events occurring during the recording process and appear as the amplitudes shown in Figure 4 marked N b .
- Peak amplitude values are preferred when attempting to discriminate against single sample (spike) noise in a section which may be caused by an error in the digital recording where one or more bits of a digital word are contaminated.
- a spike in Figure 4 is labeled as N s .
- an amplitude factor A ijh can be expressed as the product of surface consistent shot and receiver terms, subsurface-consistent geology (CDP) and offset terms, and channel number terms.
- a ijh S i * R j * G kh * O lh * C c * N (1)
- a ijh is the measured amplitude level
- S i is the amplitude variation component associated with the source position i
- R j is the amplitude variation component associated with the detector position j
- G kh is the component of amplitude variation associated with the common depth point position k (also known as midpoint) in window h
- O lh is the amplitude variation component associated with offset l in window h
- C c is the component of amplitude variation associated with recording channel c
- N is the amount of noise.
- a basic assumption in the inversion is the variables from expression (1) initially have values of zero.
- the mean (clipped mean) amplitude attributable to the geology, or CDP position is preferably solved first. Using this first amplitude value related to the geology, the same procedure is applied to obtain the amplitude value of the offset, followed by that for the channel. The procedure is repeated for each of the variables for all of the traces, with the exception of determining the value for the noise. The amplitude value for the noise drops out after all of the calculations.
- the value obtained from expression (3) provides a correction ratio which is an indication of whether or not to correct the trace for the anomalous noise amplitude or to delete the trace from the subsequent stacking sequence in the final data processing steps.
- the correction value is compared to a predetermined user specified threshold value (usually 1.0) to determine whether anomalous noise amplitudes are present on the trace.
- the range of acceptable values may be chosen from analysis of histograms prior to conventional processing.
- FIG. 5 is an example of the seismic records after correction by the method described herein. Notice that the traces, N b and N s originally shown in box AA of Figures 3 and 4, no longer exhibit the wide swing in amplitude and are substantially similar to the other traces.
- the embodiment of the invention described has been described as a computer aided method of calculating, and correcting or suppressing anomalous noise amplitudes, it is entirely possible by one skilled in the art to implement such method in hardware so that the method may be conducted in the field as opposed to performing the method at a data processing center.
- the hardware may be coupled ahead of the multiplexer and recorder in a seismic field data acquisition unit.
- the same device may be employed equally as well to seismic data taken from marine environments.
Landscapes
- Engineering & Computer Science (AREA)
- Life Sciences & Earth Sciences (AREA)
- Environmental & Geological Engineering (AREA)
- Remote Sensing (AREA)
- Physics & Mathematics (AREA)
- Emergency Management (AREA)
- Business, Economics & Management (AREA)
- Acoustics & Sound (AREA)
- Geology (AREA)
- General Life Sciences & Earth Sciences (AREA)
- General Physics & Mathematics (AREA)
- Geophysics (AREA)
- Geophysics And Detection Of Objects (AREA)
- Measurement Of Mechanical Vibrations Or Ultrasonic Waves (AREA)
Description
- This method relates generally to seismic data processing .
- Amplitudes of seismic records have been thoroughly investigated over the last several decades. Gutenberg (1936), referring to earlier works of Knott (1899) and Zoepprits et al. (1912), discussed the expected amplitudes of seismic reflections from the subsurface. After the introduction of automatic gain control (AGC) instrumentation and recording devices, geophysical interpretation was directed more toward the study of time anomalies and reflection character. The study of reflection amplitudes did not become popular again until the development of binary gain and floating point recording. These developments led to the "bright spot" interpretation technique, which incorporated the study of amplitude anomalies into seismic interpretation. The acceptance of the "bright spot" technique was industry wide.
- The first application of the technique was to offshore seismic data, principally in deltaic regions. It quickly became evident that the brightness or dullness of the reflection was of significance when making interpretation. Hermont (1969), O'Doherty and Anstey (1971), and Larner et al. (1973) demonstrated the significance and diagnostic value of reflection amplitudes.
- Application of these techniques to land situations required a more intensive study of the factors which affect recorded amplitudes. Sheriff (1973), Taner and Koehler (1974) provided a review of these factors, while Houba et al. (1973) and Disher and Randle (1973) discussed a processing method for land data.
- It is generally recognized that several factors play a role in the amplitude of the received seismic signal. Larner et al. (1973), Larner (1975), and Taner and Koehler (1981) as well as others determined several surface and subsurface characteristics which affect the amplitude of the received seismic signals. U.S. Patent No. 4,218,766 discloses a method of correcting trace to trace variations due to weathered-layer attenuation in seismic data. U.S. Patent No. 4,613,960 discloses a method for time correcting gathered traces by constructing an optimal pilot trace from the gathered traces.
- The assignee of this invention, as early as October 1977, developed a computation for correcting or removing anomalous noise amplitudes from seismic data. Taner and Koehler (1981) show an example of a similar computation which attempts to recognize anomalous amplitudes caused by outside disturbances such as near-subsurface layers (weathered zone) which might distort or influence the behaviour of the received seismic signals.
- European Patent Application EP-A-0 182 956 discloses a method of removing some noise from seismic traces by converting the traces into normalised data, obtaining the derivative of the normalised data, and plotting the derivative against the normalised data.
- According to the present invention there is provided a method for identifying anomalous noise amplitude data in seismic records having a plurality of shot traces, comprising the steps of:
- (a) measuring an amplitude factor as a function of time for a predetermined number of the shot traces;
- (b) calculating a noise-free amplitude factor for the predetermined number of shot traces as a function of time;
- (c) comparing the noise-free amplitude factor and the measured amplitude factor to derive a correction ratio; and
- (d) comparing the correction ratio to a predetermined threshold value to determine whether an anomalous noise amplitude is present on a trace.
- It is an object of certain embodiments of this invention to provide a method for exercising quality control and suppressing anomalous noise amplitude information in seismic data prior to conventional data processing.
- It is another object of certain embodiments of this invention to provide the above mentioned method where noise in the seismic data is a prime consideration in correcting or suppressing a particular seismic trace (or a portion of the trace) because of amplitude associated problems.
- The method may be computer-aided and designed for evaluating, correcting or suppressing anomalous amplitude values present in seismic data records prior to conventional data processing and may provide the geophysicist with an opportunity to evaluate the amount of noise present in a given trace before final processing where it is difficult to determine and remove the effects of noise on a final section.
- In an embodiment of the present invention amplitude factors are calculated for each trace of demultiplexed seismic data for each shot point as a function of time. The time function is a series of time windows, the period of which is fixed for the calculation and user defined. A mathematical model relating several variable parameters which contribute to amplitude variation are calculated for each trace to produce a measured amplitude factor. Taking the logarithm of both sides of the mathematical model provides a solution to the equations which yield a computed noise-free amplitude factor. A correction ratio of the computed noise-free amplitude factor to the measured amplitude factor is made which is then weighed against used defined values chosen from predetermined histograms and printouts. If the correction ratio exceeds a given threshold, the entire trace, or only the portion of the trace exhibiting the anomalous amplitude may be corrected or removed prior to conventional data processing techniques.
- For a better understanding of the present invention and to show how the same may be carried into effect, reference will be made, by way of example, to the accompanying drawings in which:
- Figure 1 is a general diagram of a conventional seismic reflection technique; and
- Figure 2 is a general illustration of one source-receiver geometry used in a typical seismic survey line;
- Figure 3 generally illustrates one shot record taken from one survey shot associated with the above geometry of Figure 2;
- Figure 4 is an enlarged portion of the shot record shown in Figure 3 illustrating anomalous amplitudes often found in a shot record;
- Figure 5 is an example of the shot record shown in Figure 3 after correction by the herein described method.
- It is a primary objective of a geophysical survey to provide an accurate representation of the subsurface structures which may be present at a particular location on the earth. One of the tools used to obtain this representation is known as seismic reflection profiling. Figure 1 is a general diagram of a conventional land seismic reflection technique which involves generating a seismic signal (S) at a "shot point" on the surface of the earth (P) by way of a vibratory or explosive source. The signal propagates downward as an expanding spherical wave front which is reflected by the subsurface layers (L) having variable acoustic impedance. The reflected seismic signal arriving at the surface is received at a plurality of points (R) on a line or grid along the surface of the earth. The signals received by the detectors (R) are converted to another signal which is recorded by a central recording device often located on a truck. Once all the data is collected for a given shot point, the acoustic signal generator is moved to a new shot point and the process is repeated.
- Figure 2 is a general illustration of one source-receiver geometry used in a seismic survey as described above. The Figure contains five receiver lines, otherwise known as "receiver spreads", labeled 1 through 5 which represent the lines of survey along a line A-B along the surface of the earth. Each receiver spread also contains a point shown by an "X" and labeled S₁, S₂, S₃, etc. which represent the shot point for each
spread 1 through 5. For the sake of explanation, thespreads 1 through 5 are shown offset from each other and are just a sample of the many lines normally recorded in a typical survey. In reality, each seismic survey spread 1-5 would overlap the previous survey spread along the line A-B by a considerable distance. - The distance from the shot point (source) within a spread to a particular receiver is known as the offset distance. Each spread 1-5 also has a shot point common with the other spreads shot in a survey. That is the shot point occurs at the same location relative to the total number of receivers along a spread, thus the distance (offset) from the shot point to a particular receiver in each spread will be essentially the same. This type of survey also lends itself to common midpoint (CMP) or common depth point (CDP) collection of seismic data. Details of these terms will not be discussed herein and are well known to those skilled in the art.
- It is generally held that to obtain an ideal representation of the subsurface, it would be preferred that the signals detected and recorded be unaffected by outside influences other than the structure which reflected the signal. Science has not yet been able to devise a way of receiving such pure data. The received data are subject to many outside influences which affect the quality of the data. The technique described below provides one tool to better identify the role that one of these influences, noise, plays in the quality of seismic data.
- Generally the quality of the seismic data depends on two broad categories of factors. The first factor is the equipment used in the survey. This includes everything from the type of source used to generate the signal, the kind of detectors used to receive the signal, and the recording equipment. The second factor which influences the quality of the seismic data is the subsurface geology of the earth. These elements include the type of material through which the signal propagates, the depth of the weathering layer along the surface, the density of the subsurface layers, the continuity of the subsurface layers, etc. The list is long. As mentioned briefly in the introduction above, the amplitude of the seismic signal has been of interest to geophysical scientists for some time. The amplitude of a received signal is a general indicator of the strength of the received signal as well as its phase relative to the signal generated. The alignment and consistency of the amplitude between adjacent traces in a seismic section helps the scientist determine the character of the reflecting horizon in the subsurface.
- In evaluating anomalous noise amplitudes in the method embodying the present invention data is brought in from the field complete with geometry information. Geometry information provides the location of the survey along the surface of the earth, as well as the location of each receiver or receiver group.
- Figure 3 generally illustrates one shot record taken from one shot point associated with the above geometry of Figure 2. Each trace of a record is labeled at the top of the record according to its location along the line of survey, and its relative distance from the shot point is easily calculated. The vertical scale is in two-way travel time. The records taken from each line, such as those shown in Figure 3 may contain up to as many as, or more than, 1024 different traces, each trace representing the signals received by a single detector or detector group at a known location on the surface of the earth. As shown in the Figure, most of the traces have relatively consistent amplitudes. A noticeable exception is marked in the box labeled AA showing a portion of the record containing a trace with an anomalous amplitude.
- Figure 4 is an enlarged portion of the shot record shown in Figure 3 as box AA. In this Figure, the differences in the amplitudes from trace to trace are more clearly distinguishable than from Figure 3. To eliminate these anomalous amplitudes, the following method embodying the present invention may be used.
- In this method, each trace of a shot record is examined in a series of time windows shown generally as t₁, t₂, . . . tn Figure 4. Each window may be of any desired period and is selected by the user. For the purposes of this discussion it will be assumed that the time window has a period of 200 milliseconds. Once a period is selected by the user, the window period remains constant during that operation/evaluation. The period may be changed for the next data set to be evaluated.
- Once the window period and the traces to be evaluated have been determined, the method next calculates the amplitude values for each trace as a function of the window period. Rms (root mean square) values can be used to represent the amplitudes, as well as peak amplitudes values. It is preferred that rms values be used in situations where the noise in a section appears as long duration (20 to 300 milliseconds) anomalous amplitudes, often known as "blobs" in the industry. A blob is a noise artifact caused by some of the following factors: weeds or branches brushing against the geophones, traffic on nearby roads, as well as other extraneous events occurring during the recording process and appear as the amplitudes shown in Figure 4 marked Nb. Peak amplitude values are preferred when attempting to discriminate against single sample (spike) noise in a section which may be caused by an error in the digital recording where one or more bits of a digital word are contaminated. A spike in Figure 4 is labeled as Ns.
- The assumptions that near-source and near-receiver amplitude effects are surface-consistent and that subsurface amplitude variation is subsurface-consistent lead to a mathematical model for the parameters that contribute to variation in observed amplitudes. Specifically, consider a trace at source i and receiver j, whose amplitudes are measured at different horizon windows h: an amplitude factor Aijh can be expressed as the product of surface consistent shot and receiver terms, subsurface-consistent geology (CDP) and offset terms, and channel number terms. According to the mathematical model, the actual variation of measured amplitudes Aijh is given by the expression:

where
Aijh is the measured amplitude level;
Si is the amplitude variation component associated with the source position i;
Rj is the amplitude variation component associated with the detector position j;
Gkh is the component of amplitude variation associated with the common depth point position k (also known as midpoint) in window h;
Olh is the amplitude variation component associated with offset l in window h;
Cc is the component of amplitude variation associated with recording channel c; and
N is the amount of noise. - Taking the logarithm of both sides of expression (1) yields an expression (2) of the following form:


Expression (2) is solved using an iterative method of matrix inversion such as the Gauss-Seidel method. - A basic assumption in the inversion is the variables from expression (1) initially have values of zero. The mean (clipped mean) amplitude attributable to the geology, or CDP position, is preferably solved first. Using this first amplitude value related to the geology, the same procedure is applied to obtain the amplitude value of the offset, followed by that for the channel. The procedure is repeated for each of the variables for all of the traces, with the exception of determining the value for the noise. The amplitude value for the noise drops out after all of the calculations.
- Small inaccuracies of the average values for each variable are of little or no real concern. This step in the method is only concerned with the average amplitude of each signal relative to others in the record. Once values have been determined for each of the variables using the matrix inversion, they are recombined in the same form as expression (1) to yield a computed amplitude factor Bijh which is a measure of the noise free amplitude. Each trace window has two numerical values for the amplitude: a measured amplitude and an approximated noise-free amplitude. These two values are scaled in a window-by-window fashion as shown in expression (3):

where the superscript n is typically defined by the user (either 1 or 2). The value obtained from expression (3) provides a correction ratio which is an indication of whether or not to correct the trace for the anomalous noise amplitude or to delete the trace from the subsequent stacking sequence in the final data processing steps. The correction value is compared to a predetermined user specified threshold value (usually 1.0) to determine whether anomalous noise amplitudes are present on the trace. The range of acceptable values may be chosen from analysis of histograms prior to conventional processing. - Figure 5 is an example of the seismic records after correction by the method described herein. Notice that the traces, Nb and Ns originally shown in box AA of Figures 3 and 4, no longer exhibit the wide swing in amplitude and are substantially similar to the other traces.
- Although the embodiment of the invention described has been described as a computer aided method of calculating, and correcting or suppressing anomalous noise amplitudes, it is entirely possible by one skilled in the art to implement such method in hardware so that the method may be conducted in the field as opposed to performing the method at a data processing center. For example the hardware may be coupled ahead of the multiplexer and recorder in a seismic field data acquisition unit. The same device may be employed equally as well to seismic data taken from marine environments.
Claims (7)
- A method for identifying anomalous noise amplitude data in seismic records having a plurality of shot traces, comprising the steps of:(a) determining an amplitude factor (Aijh) as a function of time for a predetermined number of the shot traces;(b) calculating a noise-free amplitude factor (Bijh) for the predetermined number of shot traces as a function of time;(c) comparing the noise-free amplitude factor and the measured amplitude factor to derive a correction ratio; and(d) comparing the correction ratio to a predetermined threshold value to determine whether an anomalous noise amplitude is present on a trace.
- A method according to claim 1 comprising the step of correcting the traces exhibiting anomalous noise amplitudes, prior to conventional seismic data processing based on the correction ratio.
- A method according to claim 1 comprising the step of suppressing the traces exhibiting anomalous noise amplitudes, prior to conventional seismic data processing based on the correction ratio.
- A method according to any one of the preceding claims, wherein the step of determining an amplitude factor for each trace of the seismic section as a function of time uses the following expression:

where
Aijh is the determined amplitude factor;
Si is the amplitude variation component associated with the source position i;
Rj is the amplitude variation component associated with the detector position j;
Gkh is the component of amplitude variation associated with the common depth point position k (also known as midpoint) in window h;
Olh is the amplitude variation component associated with offset l in window h;
Cc is the component of amplitude variation associated with recording channel c; and
N is the amount of noise. - A method according to any one of the preceding claims wherein the step of calculating a noise-free amplitude factor (Bijh) comprises the step of iteratively calculating a matrix inversion according to the expression:


where
Aijh is the determined amplitude factor;
Si is the amplitude variation component associated with the source position i;
Rj is the amplitude variation component associated with the detector position j;
Gkh is the component of amplitude variation associated with the common depth point position k (also known as midpoint) in window h;
Olh is the amplitude variation component associated with offset l in window h;
Cc is the component of amplitude variation associated with recording channel c; and
N is the amount of noise. - A method according to claim 5, wherein the step of calculating a matrix inversion is accomplished using a Gauss-Seidel method of calculating a matrix inversion.
- A method according to any one of the preceding claims wherein the correction ratio is determined according to the following expression:

Applications Claiming Priority (2)
| Application Number | Priority Date | Filing Date | Title |
|---|---|---|---|
| US07/230,909 US4866679A (en) | 1988-08-11 | 1988-08-11 | Method for identifying anomalous noise amplitudes in seismic data |
| US230909 | 1988-08-11 |
Publications (3)
| Publication Number | Publication Date |
|---|---|
| EP0354813A2 EP0354813A2 (en) | 1990-02-14 |
| EP0354813A3 EP0354813A3 (en) | 1991-05-29 |
| EP0354813B1 true EP0354813B1 (en) | 1994-02-16 |
Family
ID=22867043
Family Applications (1)
| Application Number | Title | Priority Date | Filing Date |
|---|---|---|---|
| EP89308204A Expired - Lifetime EP0354813B1 (en) | 1988-08-11 | 1989-08-11 | Seismic data processing |
Country Status (8)
| Country | Link |
|---|---|
| US (1) | US4866679A (en) |
| EP (1) | EP0354813B1 (en) |
| CN (1) | CN1015835B (en) |
| AU (1) | AU608496B2 (en) |
| CA (1) | CA1329647C (en) |
| DE (1) | DE68913095D1 (en) |
| DK (1) | DK392389A (en) |
| NO (1) | NO177946C (en) |
Families Citing this family (13)
| Publication number | Priority date | Publication date | Assignee | Title |
|---|---|---|---|---|
| US4992993A (en) * | 1990-06-18 | 1991-02-12 | Western Atlas International, Inc. | Correction for variable water-column velocity in seismic data |
| US5293352A (en) * | 1993-01-07 | 1994-03-08 | Western Atlas International, Inc. | Method for removing noise due to near surface scatterers |
| US5479376A (en) * | 1993-08-30 | 1995-12-26 | Western Atlas International, Inc. | Method for compensating seismic wavefield amplitudes for transmission losses in the overburden |
| US5491669A (en) * | 1994-10-06 | 1996-02-13 | Western Atlas International | Method for identifying and suppressing anomalous frequency components in seismic data |
| US8391039B2 (en) | 2001-04-24 | 2013-03-05 | Rambus Inc. | Memory module with termination component |
| US6675272B2 (en) | 2001-04-24 | 2004-01-06 | Rambus Inc. | Method and apparatus for coordinating memory operations among diversely-located memory components |
| US7301831B2 (en) | 2004-09-15 | 2007-11-27 | Rambus Inc. | Memory systems with variable delays for write data signals |
| GB2420625B (en) * | 2004-11-30 | 2007-02-28 | Westerngeco Ltd | Amplitude correction for seismic recordings |
| US9405027B2 (en) | 2012-01-12 | 2016-08-02 | Westerngeco L.L.C. | Attentuating noise acquired in an energy measurement |
| EP2841966B1 (en) | 2012-04-23 | 2023-10-11 | Westerngeco LLC | Attenuating noise in a multi-shot measurement |
| CN109212601A (en) * | 2018-08-31 | 2019-01-15 | 中国石油化工股份有限公司 | A kind of seismic data exception measuring point detection method |
| CN111694056B (en) * | 2020-06-03 | 2021-03-02 | 西安交通大学 | Method, storage medium and equipment for suppressing abnormal noise of seismic data |
| CN114114391B (en) * | 2020-09-01 | 2023-08-22 | 中国石油天然气股份有限公司 | Method and device for identifying negative samples of seismic data |
Family Cites Families (6)
| Publication number | Priority date | Publication date | Assignee | Title |
|---|---|---|---|---|
| US4218766A (en) * | 1975-01-10 | 1980-08-19 | Texaco Inc. | Method of seismic wave amplitude normalization |
| US4577298A (en) * | 1983-09-08 | 1986-03-18 | Mobil Oil Corporation | Method for correcting surface consistent statics in seismic traces |
| US4613960A (en) * | 1983-09-08 | 1986-09-23 | Mobil Oil Corporation | Method for constructing and using an optimal pilot trace in surface consistent statics estimations |
| CA1227576A (en) * | 1984-03-14 | 1987-09-29 | Dennis B. Neff | Method for removing noise from data |
| US4695984A (en) * | 1984-12-24 | 1987-09-22 | Exxon Production Research Company | Method for establishing a surface consistent correction for the effects of the low velocity layer in seismic data processing |
| US4750156A (en) * | 1986-03-03 | 1988-06-07 | Input/Output, Inc. | Noise suppression during seismic exploration |
-
1988
- 1988-08-11 US US07/230,909 patent/US4866679A/en not_active Expired - Lifetime
-
1989
- 1989-08-09 CA CA000607912A patent/CA1329647C/en not_active Expired - Fee Related
- 1989-08-10 DK DK392389A patent/DK392389A/en not_active Application Discontinuation
- 1989-08-10 NO NO893227A patent/NO177946C/en unknown
- 1989-08-11 CN CN89107185A patent/CN1015835B/en not_active Expired
- 1989-08-11 EP EP89308204A patent/EP0354813B1/en not_active Expired - Lifetime
- 1989-08-11 AU AU39529/89A patent/AU608496B2/en not_active Ceased
- 1989-08-11 DE DE89308204T patent/DE68913095D1/en not_active Expired - Lifetime
Also Published As
| Publication number | Publication date |
|---|---|
| DK392389A (en) | 1990-02-12 |
| CN1015835B (en) | 1992-03-11 |
| CA1329647C (en) | 1994-05-17 |
| DK392389D0 (en) | 1989-08-10 |
| AU3952989A (en) | 1990-02-15 |
| AU608496B2 (en) | 1991-03-28 |
| NO893227D0 (en) | 1989-08-10 |
| NO177946C (en) | 1995-12-20 |
| NO177946B (en) | 1995-09-11 |
| NO893227L (en) | 1990-02-12 |
| EP0354813A2 (en) | 1990-02-14 |
| US4866679A (en) | 1989-09-12 |
| DE68913095D1 (en) | 1994-03-24 |
| CN1040869A (en) | 1990-03-28 |
| EP0354813A3 (en) | 1991-05-29 |
Similar Documents
| Publication | Publication Date | Title |
|---|---|---|
| AU2006279961B2 (en) | Method of accounting for wavelet stretch in seismic data | |
| EP0354813B1 (en) | Seismic data processing | |
| EP0060029B1 (en) | A method of determining the ratio of the velocities of compressional and shear waves in subterranean formations | |
| EP0174648B1 (en) | Data processing method for correlating p and s-wave seismic traces | |
| US5515335A (en) | Seismic trace overburden correction method | |
| Martin et al. | Practical experience using a simplified procedure to measure average shear-wave velocity to a depth of 30 meters (VS30) | |
| Ghose et al. | Integrating S-wave seismic-reflection data and cone penetration test data using a multiangle multiscale approach | |
| Park et al. | Multi-channel analysis of surface waves using Vibroseis (MASWV) | |
| US6917881B2 (en) | Method for determining primary static corrections to be applied to seismic traces | |
| US6868038B2 (en) | Seismic method of performing the time picking step | |
| US5287328A (en) | Method for removing random source and receiver noise from seismic traces | |
| US4218766A (en) | Method of seismic wave amplitude normalization | |
| KR100412097B1 (en) | Method, system and apparatus for processing seismic data using the time-varying optimum offset concept | |
| CN101609163B (en) | Multi-scale seismic data joint imaging method based on fluctuation theory | |
| EP0288154B1 (en) | Method for estimating shear wave reflection data from acquired compressional wave reflection data | |
| CN114236612A (en) | Signal processing method for earthquake background noise of water area in land | |
| Fujimoto et al. | DAS 3DVSP survey at Stratigraphic Test Well (Hydrate-01) | |
| Havskov et al. | Magnitude scales for very local earthquakes. Application for Deception Island Volcano (Antarctica) | |
| Burdick | Estimation of the frequency dependence of Q from ScP and ScS phases | |
| US3571787A (en) | Method and system for automatic seismic reflection picking | |
| CN113806674A (en) | Method and device for quantifying longitudinal dimension of ancient river channel, electronic equipment and storage medium | |
| US3671930A (en) | Method of seismographic exploration by measuring the attenuation coefficient in geologic section | |
| US4601023A (en) | Automatic gain control in seismic data samples | |
| O’Neill | Full waveform reflectivity for inversion of surface wave dispersion in shallow site investigations | |
| Shaibu et al. | Uses of seismic refraction tomography in investigation of groundwater potential in Kaduna millennium city, Kaduna Nigeria |
Legal Events
| Date | Code | Title | Description |
|---|---|---|---|
| PUAI | Public reference made under article 153(3) epc to a published international application that has entered the european phase |
Free format text: ORIGINAL CODE: 0009012 |
|
| AK | Designated contracting states |
Kind code of ref document: A2 Designated state(s): CH DE ES FR GB IT LI NL SE |
|
| PUAL | Search report despatched |
Free format text: ORIGINAL CODE: 0009013 |
|
| AK | Designated contracting states |
Kind code of ref document: A3 Designated state(s): CH DE ES FR GB IT LI NL SE |
|
| 17P | Request for examination filed |
Effective date: 19911113 |
|
| 17Q | First examination report despatched |
Effective date: 19920928 |
|
| GRAA | (expected) grant |
Free format text: ORIGINAL CODE: 0009210 |
|
| AK | Designated contracting states |
Kind code of ref document: B1 Designated state(s): CH DE ES FR GB IT LI NL SE |
|
| PG25 | Lapsed in a contracting state [announced via postgrant information from national office to epo] |
Ref country code: IT Free format text: LAPSE BECAUSE OF FAILURE TO SUBMIT A TRANSLATION OF THE DESCRIPTION OR TO PAY THE FEE WITHIN THE PRE;WARNING: LAPSES OF ITALIAN PATENTS WITH EFFECTIVE DATE BEFORE 2007 MAY HAVE OCCURRED AT ANY TIME BEFORE 2007. THE CORRECT EFFECTIVE DATE MAY BE DIFFERENT FROM THE ONE RECORDED.SCRIBED TIME-LIMIT Effective date: 19940216 Ref country code: NL Effective date: 19940216 Ref country code: ES Free format text: THE PATENT HAS BEEN ANNULLED BY A DECISION OF A NATIONAL AUTHORITY Effective date: 19940216 Ref country code: FR Free format text: THE PATENT HAS BEEN ANNULLED BY A DECISION OF A NATIONAL AUTHORITY Effective date: 19940216 Ref country code: DE Effective date: 19940216 Ref country code: LI Effective date: 19940216 Ref country code: CH Effective date: 19940216 Ref country code: SE Effective date: 19940216 |
|
| REF | Corresponds to: |
Ref document number: 68913095 Country of ref document: DE Date of ref document: 19940324 |
|
| REG | Reference to a national code |
Ref country code: CH Ref legal event code: PL |
|
| EN | Fr: translation not filed | ||
| NLV1 | Nl: lapsed or annulled due to failure to fulfill the requirements of art. 29p and 29m of the patents act | ||
| PLBE | No opposition filed within time limit |
Free format text: ORIGINAL CODE: 0009261 |
|
| STAA | Information on the status of an ep patent application or granted ep patent |
Free format text: STATUS: NO OPPOSITION FILED WITHIN TIME LIMIT |
|
| 26N | No opposition filed | ||
| REG | Reference to a national code |
Ref country code: GB Ref legal event code: IF02 |
|
| PGFP | Annual fee paid to national office [announced via postgrant information from national office to epo] |
Ref country code: GB Payment date: 20020807 Year of fee payment: 14 |
|
| PG25 | Lapsed in a contracting state [announced via postgrant information from national office to epo] |
Ref country code: GB Free format text: LAPSE BECAUSE OF NON-PAYMENT OF DUE FEES Effective date: 20030811 |
|
| GBPC | Gb: european patent ceased through non-payment of renewal fee |
Effective date: 20030811 |