EP0240029B1 - Picture display apparatus - Google Patents
Picture display apparatus Download PDFInfo
- Publication number
- EP0240029B1 EP0240029B1 EP87104932A EP87104932A EP0240029B1 EP 0240029 B1 EP0240029 B1 EP 0240029B1 EP 87104932 A EP87104932 A EP 87104932A EP 87104932 A EP87104932 A EP 87104932A EP 0240029 B1 EP0240029 B1 EP 0240029B1
- Authority
- EP
- European Patent Office
- Prior art keywords
- spectrum
- spatial spectrum
- spatial
- fourier transformation
- shape
- Prior art date
- Legal status (The legal status is an assumption and is not a legal conclusion. Google has not performed a legal analysis and makes no representation as to the accuracy of the status listed.)
- Expired - Lifetime
Links
- 238000001228 spectrum Methods 0.000 claims description 137
- 238000009826 distribution Methods 0.000 claims description 48
- 238000005259 measurement Methods 0.000 claims description 43
- 230000009466 transformation Effects 0.000 claims description 39
- 238000012546 transfer Methods 0.000 claims description 13
- 238000009499 grossing Methods 0.000 claims description 3
- 238000005315 distribution function Methods 0.000 claims 2
- 230000006870 function Effects 0.000 description 20
- 239000000523 sample Substances 0.000 description 19
- 238000010586 diagram Methods 0.000 description 12
- 230000010355 oscillation Effects 0.000 description 5
- 230000005855 radiation Effects 0.000 description 3
- 238000012360 testing method Methods 0.000 description 3
- 238000012545 processing Methods 0.000 description 2
- 238000003325 tomography Methods 0.000 description 2
- 230000005540 biological transmission Effects 0.000 description 1
- 230000000694 effects Effects 0.000 description 1
- 230000010354 integration Effects 0.000 description 1
- 238000000034 method Methods 0.000 description 1
- 238000009659 non-destructive testing Methods 0.000 description 1
- 230000004044 response Effects 0.000 description 1
- 230000003595 spectral effect Effects 0.000 description 1
Images


Classifications
-
- G—PHYSICS
- G01—MEASURING; TESTING
- G01S—RADIO DIRECTION-FINDING; RADIO NAVIGATION; DETERMINING DISTANCE OR VELOCITY BY USE OF RADIO WAVES; LOCATING OR PRESENCE-DETECTING BY USE OF THE REFLECTION OR RERADIATION OF RADIO WAVES; ANALOGOUS ARRANGEMENTS USING OTHER WAVES
- G01S15/00—Systems using the reflection or reradiation of acoustic waves, e.g. sonar systems
- G01S15/88—Sonar systems specially adapted for specific applications
- G01S15/89—Sonar systems specially adapted for specific applications for mapping or imaging
- G01S15/8906—Short-range imaging systems; Acoustic microscope systems using pulse-echo techniques
- G01S15/8977—Short-range imaging systems; Acoustic microscope systems using pulse-echo techniques using special techniques for image reconstruction, e.g. FFT, geometrical transformations, spatial deconvolution, time deconvolution
-
- G—PHYSICS
- G06—COMPUTING; CALCULATING OR COUNTING
- G06T—IMAGE DATA PROCESSING OR GENERATION, IN GENERAL
- G06T5/00—Image enhancement or restoration
- G06T5/10—Image enhancement or restoration using non-spatial domain filtering
-
- G—PHYSICS
- G06—COMPUTING; CALCULATING OR COUNTING
- G06T—IMAGE DATA PROCESSING OR GENERATION, IN GENERAL
- G06T5/00—Image enhancement or restoration
- G06T5/70—Denoising; Smoothing
-
- G—PHYSICS
- G06—COMPUTING; CALCULATING OR COUNTING
- G06T—IMAGE DATA PROCESSING OR GENERATION, IN GENERAL
- G06T5/00—Image enhancement or restoration
- G06T5/73—Deblurring; Sharpening
-
- G—PHYSICS
- G06—COMPUTING; CALCULATING OR COUNTING
- G06T—IMAGE DATA PROCESSING OR GENERATION, IN GENERAL
- G06T2207/00—Indexing scheme for image analysis or image enhancement
- G06T2207/20—Special algorithmic details
- G06T2207/20048—Transform domain processing
- G06T2207/20056—Discrete and fast Fourier transform, [DFT, FFT]
Definitions
- the present invention generally relates to a picture display apparatus, and particularly relates to a an apparatus which is to be connected to a testing device having a purpose of displaying the result of test as a picture, for example, a measurement device of low resolution such as an ultrasonic inspector, a radiation computerized tomography, a radar pickup device, etc., so as to display a picture with high resolution.
- a measurement device of low resolution such as an ultrasonic inspector, a radiation computerized tomography, a radar pickup device, etc.
- the conventional picture display apparatus could be applied only to a testing or measurement device capable of approximating the spatial resolution with a Gaussian distribution, and inverse Weierstrass transformation was applied to a measured spectrum so as to derive a spectrum improved in resolution. Accordingly, the conventional picture display apparatus could not be used for a measurement device having a spatial resolution having a distribution which is unknown or which is different from a Gaussian distribution.
- the above-mentioned conventional picture display apparatus could be applied only in the case where the spatial resolution of the measurement device used was known or had a Gaussian distribution. Accordingly, it was required to obtain the spatial resolution of the measurement device in advance by any other means.
- a picture display apparatus has been proposed in which the resolution peculiar to the measurement device is calculated on the basis of a spectrum representing an object having a known shape and a measured spectrum of the same object, so that the measured spectrum deteriorated on account of the low resolution of the measurement device is automatically converted into a spectrum of high resolution so as to make it possible to display a clear and detailed picture.
- the picture display apparatus in which an approximate spectrum of a theoretical spectrum representing an object having a known shape as a reference and a spectrum obtained through measurement of the known-shaped object are subject to Fourier transformation and a transfer function of a measurement device is calculated from the ratio between the respective values obtained through the two operations of Fourier transformation to thereby display an unknown shape of an object on the basis of the transfer function and Fourier transformation values of a measured spectrum of the unknown-shaped object, is featured in that a modified Gaussian distribution obtained by combining two Gaussian distributions is employed as the approximate spectrum of the theoretical spectrum representing the known-shaped object so that the Fourier transformation values of the spatial spectrum of the known shape are reduced in a high frequency range and oscillations are less spread in the high frequency range, thereby reducing the high frequency components of the spatial spectrum of the unknown shape to be displayed.
- the Fourier transformation values of the spatial spectrum of the known shape are reduced in a high frequency range and oscillations are less spread in the high frequency range. Accordingly, even if noises, measurement errors or the like, are included in the measured spectrum to make the Fourier transformation values of the measured spectrum large in the high frequency range, the Fourier transformation values of the known shape may act as windows for the measured spectrum so as to cancel the causes for such as noises, measurement errors or the like, so that the high frequency components of the spectrum of the unknown shape to be displayed are reduced so as to make it possible to display a clear picture with high resolution.
- the picture display apparatus comprises means for approximating the measured spectrum with B-spline curves of m order.
- the measured spectrum is not smooth and has discontinuous points. If a spatial spectrum having discontinuous points is subject to Fourier transformation, the frequency spectrum obtained has high frequency components large in value. Accordingly, if the variations of intensity of the spectrum due to the variations of measurement errors in the measured spectrum are reduced to make the discontinuous points smooth, the high frequency components can be further reduced to make it possible to obtain a clear picture.
- a nondestructive testing or measurement device in which an internal fault or a shape of an internal structure is displayed as a picture, for example, such as an ultrasonic inspector, a radiation computerized tomography, a microwave radar prospector, etc.
- there occurs blur in picture on account of spatial expansion of the ultrasonic wave, the radiation rays, or the microwave, the size of aperture at the sensor receiver portion, and so on.
- the blur can be regarded as spatial resolution peculiar to the measurement device.
- the spatial resolution means a spatial expansion of a picture when a point object is displayed.
- the present invention provides an apparatus in which, in displaying a picture, the influence of high frequency noises are reduced to make it possible to display a picture more approximate to the true shape.
- a picture having no blur is generally two- dimensional
- a one-dimensional picture is hereinafter referred to as "a spatial spectrum" as a matter of convenience. It is defined that the abscissa and ordinate of the spatial spectrum respectively represent the spatial position and intensity of the spatial spectrum.
- Fig. 1 shows a spatial spectrum O(x) measured by a measurement device and having blur
- Fig. 2 shows a spatial spectrum R(x) of spatial resolution including blur.
- Equation (1) If a spatial spectrum having no blur is represented by I(x), the relation expressed by the following equation (1) is satisfied between the spatial spectra O(x) and R(x).
- the equation (1) is called "convolution integration".
- l( ⁇ ) is obtained by substituting the variable x by another variable a in I(x)
- R(x-a) is obtained in such a manner that R(a) obtained by substituting the variable x by another variable a in I(x) is reversed about a vertical axis of the coordinate representing the function R(a) to thereby obtain R(-a) and then R(-a) is shifted by x to thereby obtained R(x- ⁇ ).
- the following equation (2) is derived by performing Fourier transformation on the both sides of the equation (1).
- (v), (v), and (v) represent functions obtained by performing Fourier transformation on O(x), I(x), and R(x) respectively.
- Each of the functions R(v), I (v), and (v) is called a frequency spectrum, and the respective frequency functions ⁇ (v), ⁇ (v), and (v) are defined by the following equations (3), (4) and (5).
- j is an imaginary unit and v represents a spatial frequency. Accordingly, if spatial spectra O(x) and R-(x) are known, an unknown spatial spectrum I(x) can be obtained in such a manner as follows.
- the frequency spectrum (v) can be obtained by the following equation (6) derived from the equation (2).
- This frequency spectrum (v) can be brought back to the actual spatial spectrum I(x) through reverse Fourier transformation by the following equation (7).
- (v) can be obtained from measured spatial spectrum O(x) through Fourier transformation, however, there is a problem as to a manner how to obtain the spatial spectrum R(x) which is the source function of (v).
- R(x) is defined as the spatial resolution of the measurement device, when a point-like object is made to be a picture by a measurement device so as to display the picture, the spatial expansion of the picture can be regarded as the spatial resolution R(x). In an actual case, however, such a point-like object cannot exist and the spatial resolution R(x) may vary depending on the position of the point-like object.
- an object having a known shape is made to be a picture by a measurement device and a true shape is compared with the picture to thereby derive the spatial resolution of the measurement device.
- the function (v) derived from this spatial resolution through Fourier transformation can be regarded as the transfer function of the measurement device.
- R(v) a picture of an object is derived on the basis of the equation (7). If a known shape and a picture thereof are represented by spatial spectra ls(x) and Os(x), the transfer function (v) can be obtained on the basis of the following equation (8) which is derived from the equation (2).
- s(v) and s(v) are frequency spectra obtained from the spatial spectra Os(x) and ls(x) through Fourier transformation.
- the transfer function (v) of the measurement device can be derived, and in order to correct a picture obtained through measurement and having blur, a spatial spectrum I(x) representing a picture approximate to a true shape can be calculated on the basis of the equation (7) by using the derived (v) of the measurement device.
- the possibility of generation of high frequency components in the spatial spectrum I(x) of the unknown shape calculated in the above-mentioned procedure is determined depending on the selection as to what kind of shape is used as the spatial spectrum ls(x) representing a known shape.
- the spatial spectrum ls(x) representing a known shape is rectangular as shown in Fig. 3A
- the frequency spectrum s(v) derived from the spatial spectrum ls(x) through Fourier transformation has a shape as shown in Fig. 3B.
- the spectrum has large values in a high frequency range so that high frequency components are generated in the spatial spectrum I(x) of the unknown shape.
- the spatial spectrum ls(x) of the known shape is selected to satisfy the following conditions: (i) The expansion of the spatial spectrum ls(x) is definite; (ii) The spatial spectrum ls(x) has small values in a high frequency range; and (iii) In a frequency domain of the spatial spectrum ls(x), the oscillation does not extend in a wide range.
- the inventors have examined various shapes, such a Gaussian distribution, a cosine distribution, a cosine distribution about a position where the intensity becomes half (a modified cosine distribution), etc., under the condition that the width of the spatial spectrum ls(x) at a position where the intensity of the spatial spectrum ls(x) becomes half (hereinafter referred to as "half-value width W") is made to correspond to the width of the rectangle shown in Fig. 3A.
- half-value width W the width of the spatial spectrum ls(x) at a position where the intensity of the spatial spectrum ls(x) becomes half
- Fig. 4A shows the spatial spectrum ls(x) expressed by the equation (9) and Fig. 4B shows the frequency spectrum s(v) derived from the spatial spectrum ls(x) through Fourier transformation.
- the above-mentioned three conditions are satisfied so that the high frequency components in the spatial spectrum I(x) of an unknown shape can be reduced and a picture approximate to a true shape can be obtained.
- the transfer function R(v) of the measurement device is obtained. If the output of a switching controller 5 is made to be “1 ", the terminals a and c are made conductive with each other in each of switches 10 and 11, while if the output of the switching controller 5 is made to be "0", the terminals b and c are made conductive with each other in the same switches. Switches 8 and 9 are controlled by the output of an AND gate 7 or a logical product of the respective outputs of the switching controller 5 and a selection instructor 6.
- the terminals a and c of each of the switches 8 and 9 are made conductive with each other only when both the respective outputs of the switching controller 5 and the selection instructor 6 are "1 ", while the terminals b and c of the same are made conductive with each other during the periods in other conditions of the respective outputs of the switching controller 5 and the selection instructor 6. Accordingly, first, both the respective outputs of the switching controller 5 and the selection instructor 6 are made to be "1".
- a half-value width of a known shape as a reference is set through a half-value width setting switch 1.
- a modified Gaussian distribution operator 2 Upon reception of this half-value idth, a modified Gaussian distribution operator 2 performs operations to obtain a modified Gaussian distribution on the basis of the equation (9), the result being stored in an ls(x) memory 3. Accordingly, the half-value width setting switch 1, the modified Gaussian distribution operator 2 and the ls(x) memory 3 constitute a modified Gaussian distribution holding means.
- the address is made to correspond to the spatial position and the intensity of spectra is stored as the contents.
- the contents of the ls(x) memory 3 are applied to a Fourier transformation device 12 through the switch 8 and a frequency spectrum s(v) is derived on the basis of the equation (4).
- the frequency spectrum ls(v) is applied to an ls(v) memory 13 and the real part and the imaginary parts are stored separately from each other in the ls(v) memory 13. Then, the output of the selection instructor 6 is made to be "0" so that the terminals b and c of each of the switches 8 and 9 are made conductive with each other.
- a spatial spectrum O(x) obtained through measurement on an object having a reference shape is applied from a measurement device to a measured spectrum memory 4 so as to be stored therein. The contents of the measured spectrum memory 4 is applied to the Fourier transformation device 12 through the switch 8.
- the Fourier transformation device 12 Upon reception of the contents of the measured spectrum memory 4, the Fourier transformation device 12 performs operations to obtain a spatial spectrum (v) on the basis of the equation (3), and the real and imaginary parts of the thus obtained frequency spectrum (v) are stored separately from each other in an (v) memory 14.
- the contents of the (v) memory 14 are applied to a port A of a vector divider 17 and the contents of the s(v) memory 13 are applied to another port B of the same vector divider 17 through the switch 10.
- the vector divider 17 performs operations to obtain a real value Cr and an imaginary value Ci on the basis of the following equation (10) by the use of a real part Ar and an imaginary part Ai of the input to the port A and a real part Br and an imaginary part Bi of the input to the port B.
- the values Cr and Ci are stored in a real part and an imaginary part of an R(v) memory 15 through the switch 11. In this manner, the transfer function (v) of the measured device has been obtained.
- the values Cr and Ci of the equation (10) represent the real part and the imaginary part of the transfer function R(v) obtained by the division of s(v)/ s(v).
- an unknown shape of an object is displayed on the basis of the measurement on the object having the unknown shape.
- the output of the switching controller 5 is made "0" and a spatial spectrum O-(x) obtained through the measurement on the object having the unknown shape is applied to the Fourier transformation device 12 from the measurement device through the switch 8.
- the Fourier transformation device 12 performs operations to obtain a frequency spectrum 6( f ) on the basis of the equation (3), and the real and imaginary parts of the thus obtained frequency spectrum (v) are stored separately from each other in the (v) memory 14.
- the contents of the (v) memory 14 are applied to the port A of the vector divider 17 and the contents of the R(v) memory 15 are applied to the port B of the same vector divider 17 through the switch 10.
- the vector divider 17 performs an operation to obtain values Cr and Ci on the basis of the equation (10) and thus obtained values Cr and Ci are respectively stored in a real part and an imaginary part of a frequency spectrum (v) memory 16.
- a reverse Fourier transformation device 18 performs an operation to obtain a spatial spectrum I(x) from the contents of the (v) memory 16 on the basis of the equation (7) and the real part Ir and the imaginary part li of the thus obtained spatial spectrum I(x) are stored in a real part and an imaginary part of an I(x) memory 19.
- a power operator 20 performs an operation to obtain an intensity Ip on the basis of the following equation (11) by the use of the real part Ir and the imaginary part li of the I(x) memory 19, and thus obtained intensity Ip is stored in a power spectrum memory 21.
- An address converter 22 shifts the addresses of the I(x) memory 19 on the basis of the following equation (12) so as to store the rearranged contents of the I(x) memory 19 in a shift spectrum memory 23. Assuming now that the number of the addresses of the shift spectrum memory 23 is 2N and that the contents at the k-th address of the power spectrum memory 21 are represented by lp(k), the contents lsp(m) of the m-th address of the shift spectrum memory 23 are determined on the basis of the following equation (12).
- a picture display 26 displays a picture having no blur.
- Fig. 6 shows an example of an arrangement to reproduce the result of measurement of an ultrasonic inspector in the form of a picture.
- an ultrasonic beam 104 is transmitted to a sample 102 from a probe 100.
- the probe 100 receives an ultrasonic wave reflected from the surface of a rectangular groove 103 of the sample 102.
- the probe 100 is scanned in the X-direction by a scanner 101.
- An operator 106 measures a time interval t(x) from transmission to reception of the ultrasonic signal in a spatial position x and calculates a depth h(x) of the groove on the basis of the following equation (13).
- ho and v represent a height of the sample 102 and a sonic velocity in the sample 102.
- This h(x) has a distribution substantially similar to the intensity distribution of the ultrasonic wave received by the probe 100.
- the spatial position x and the intensity of the ultrasonic wave received at each position or the depth at each position are transmitted from the operator 106 to the measured spectrum memory 4. Since the ultrasonic beam 104 spreads in the sample 102, such a spatial spectrum O(x) as shown in Fig. 7B is obtained when a rectangular groove shown in Fig.
- the ultrasonic beam spreads as shown in Fig. 8A. Therefore, the reflected ultrasonic wave can be received by the probe 100 even if the groove is not right beneath the probe position x.
- a transfer function R(v) of the measurement device is obtained so as to obtain a shape of a groove having an unknown width 1 by the use of a groove having a width to as a known reference shape.
- the modified Gaussian distribution operator 2 performs an operation to obtain a spatial spectrum ls(x) on the basis of the equation (9) and the result is stored in the ls(x) memory 3.
- the spatial spectrum ls(x) has such a shape as shown in Fig. 9A. If a spatial spectrum I(x) of the unknown shape is obtained by the apparatus of Fig. 5, the spatial spectrum I(x) has such a shape as shown in Fig. 9B.
- Fig. 9B shows a spatial spectrum distribution I(x) in the case where a rectangular shape is used as the reference spatial spectrum ls(x) without using a modified Gaussian distribution. If it is assumed that the shape to be derived should have intensity not smaller than 0.5, the derived shape has three grooves as indicated by circles in Fig. 10.
- Fig. 11 shows a comparison of the cases where the spatial spectrum ls(x) of the reference shape employs a rectangular distribution, a cosine distribution, a Gaussian distribution, etc., with the case where a modified Gaussian distribution is used. As seen from Fig. 11, the shape obtained by using the modified Gaussian distribution is the most approximate to the true shape.
- Fig. 11 shows a comparison of the cases where the spatial spectrum ls(x) of the reference shape employs a rectangular distribution, a cosine distribution, a Gaussian distribution, etc.
- FIG. 12 is a graph showing the results obtained in the cases where the apparatus according to the present invention is applied to various groove widths 1.
- Fig. 12 shows the fact that although the difference between the measured groove width and the true one is large in the case where the true width is smaller than the reference groove width lo, the shape can be displayed with an error within a range of 13 % or less with respect to the true shape in the case where the true groove width 1 has a value within a range of from to to 2lo.
- the measured spectrum is not smooth and has discontinuous points. If the spatial spectrum having discontinuous points is subject to Fourier transformation, the high frequency components have large values. Accordingly, if the variations due to measurement errors or the like in the measured spectrum are reduced so as to smooth the shape of the measured spectrum, it is possible to reduce the high frequency components to thereby derive a clearer spatial spectrum I(x).
- the B-spline curve of m order can be derived from the following equation (14).
- Vk, n, and N k , m represent a sequence of points, the number of the sequence of points, and a weight function respectively.
- respective sections are connected through a curve of (m-1) order and are continuous to a derivative of (m-2) order.
- a variation at one measurement point has a little influence on the whole curve and the curve passes through the initial point Vo and the last point Vn.
- FIG. 13 shows a device for executing this processing in a broken line enclosure.
- Those parts of the apparatus shown in Fig. 5 exist outside the broken line enclosure in Fig. 13.
- a circuit constituted by the parts within the broken line enclosure is additionally provided in the apparatus of Fig. 5.
- a weight function operator 29 performs an operation to obtain a weight function corresponding to the curve order number m set by an order-number m setting switch 28, and the result of this operation and the contents of the measured spectrum memory 4 are applied to an m-order B-spline curve operator 27.
- the B-spline curve operator 27 performs an operation to obtain a B-spline curve on the basis of the equation (14) and the result of this operation is stored in a corrected spectrum memory 30.
- a modified Gaussian distribution composed of two Gaussian distributions is used as a spectral distribution representing the shape of a known sample, so that the oscillations of the high frequency components of the measured spectrum due to the measurement errors can be reduced to make it possible to display a picture approximate to the true shape of an object having an unknown shape with high resolution.
- the invention has such a meritorious effect that in the case where the size of the object having an unknown shape is within a range from the size to of the known sample to 2to, the unknown-shaped object can be displayed as a picture which is different in size only by 15 % or less from the true one.
Landscapes
- Physics & Mathematics (AREA)
- Engineering & Computer Science (AREA)
- General Physics & Mathematics (AREA)
- Remote Sensing (AREA)
- Radar, Positioning & Navigation (AREA)
- Theoretical Computer Science (AREA)
- Acoustics & Sound (AREA)
- Computer Networks & Wireless Communication (AREA)
- Ultra Sonic Daignosis Equipment (AREA)
- Length Measuring Devices By Optical Means (AREA)
- Length Measuring Devices Characterised By Use Of Acoustic Means (AREA)
- Radar Systems Or Details Thereof (AREA)
- Investigating Or Analyzing Materials By The Use Of Ultrasonic Waves (AREA)
- Apparatus For Radiation Diagnosis (AREA)
- Closed-Circuit Television Systems (AREA)
Description
- The present invention generally relates to a picture display apparatus, and particularly relates to a an apparatus which is to be connected to a testing device having a purpose of displaying the result of test as a picture, for example, a measurement device of low resolution such as an ultrasonic inspector, a radiation computerized tomography, a radar pickup device, etc., so as to display a picture with high resolution.
- As disclosed in the publication of JP-A-50-137184, the conventional picture display apparatus could be applied only to a testing or measurement device capable of approximating the spatial resolution with a Gaussian distribution, and inverse Weierstrass transformation was applied to a measured spectrum so as to derive a spectrum improved in resolution. Accordingly, the conventional picture display apparatus could not be used for a measurement device having a spatial resolution having a distribution which is unknown or which is different from a Gaussian distribution.
- The above-mentioned conventional picture display apparatus could be applied only in the case where the spatial resolution of the measurement device used was known or had a Gaussian distribution. Accordingly, it was required to obtain the spatial resolution of the measurement device in advance by any other means. In order to satisfy this requirement, a picture display apparatus has been proposed in which the resolution peculiar to the measurement device is calculated on the basis of a spectrum representing an object having a known shape and a measured spectrum of the same object, so that the measured spectrum deteriorated on account of the low resolution of the measurement device is automatically converted into a spectrum of high resolution so as to make it possible to display a clear and detailed picture. In this picture display apparatus, however, there has been such a problem that measurement errors or the like contained in the measured spectrum may make the values of the measured spectrum large in a high frequency range to produce high frequency oscillations in a picture displayed to thereby make the picture unclear. This apparatus is disclosed in Japanese Patent Application No. 60-155136 filed in the name of the same assignee on July 16, 1985 and laid-open on January 26, 1987 under Laid-Open No. 62-017654.
- It is therefore an object of the present invention as set forth in the claims to provide a picture display apparatus capable of displaying a clear and detailed picture.
- To attain the above object, according to an aspect of the present invention, the picture display apparatus in which an approximate spectrum of a theoretical spectrum representing an object having a known shape as a reference and a spectrum obtained through measurement of the known-shaped object are subject to Fourier transformation and a transfer function of a measurement device is calculated from the ratio between the respective values obtained through the two operations of Fourier transformation to thereby display an unknown shape of an object on the basis of the transfer function and Fourier transformation values of a measured spectrum of the unknown-shaped object, is featured in that a modified Gaussian distribution obtained by combining two Gaussian distributions is employed as the approximate spectrum of the theoretical spectrum representing the known-shaped object so that the Fourier transformation values of the spatial spectrum of the known shape are reduced in a high frequency range and oscillations are less spread in the high frequency range, thereby reducing the high frequency components of the spatial spectrum of the unknown shape to be displayed.
- Since a modified Gaussian distribution obtained by combining two gaussian distributions is employed as the approximate spectrum of the theoretical spectrum representing the known-shape of the reference object, the Fourier transformation values of the spatial spectrum of the known shape are reduced in a high frequency range and oscillations are less spread in the high frequency range. Accordingly, even if noises, measurement errors or the like, are included in the measured spectrum to make the Fourier transformation values of the measured spectrum large in the high frequency range, the Fourier transformation values of the known shape may act as windows for the measured spectrum so as to cancel the causes for such as noises, measurement errors or the like, so that the high frequency components of the spectrum of the unknown shape to be displayed are reduced so as to make it possible to display a clear picture with high resolution.
- Preferably, the picture display apparatus comprises means for approximating the measured spectrum with B-spline curves of m order.
- In the case where there are variations in values of a spectrum distribution obtained through measurement of an object having a known shape or an object having an unknown shape, the measured spectrum is not smooth and has discontinuous points. If a spatial spectrum having discontinuous points is subject to Fourier transformation, the frequency spectrum obtained has high frequency components large in value. Accordingly, if the variations of intensity of the spectrum due to the variations of measurement errors in the measured spectrum are reduced to make the discontinuous points smooth, the high frequency components can be further reduced to make it possible to obtain a clear picture.
- The above and other objects, features and advantages of the present invention will become apparent upon a reading of the following detailed description and drawings, in which:
- Fig. 1 is a diagram showing an example of a spectrum measured by a measurement device of low resolution;
- Fig. 2 is a diagram showing an example of spatial resolution including blur of the measurement device;
- Figs. 3A and 3B are diagrams respectively showing a spatial spectrum and a frequency spectrum in the case where the reference shape is rectangular;
- Figs. 4A and 4B are diagrams respectively showing a spatial spectrum and a frequency spectrum in the case where the reference shape is a modified Gaussian distribution which is a foundation of the present invention;
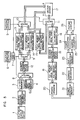
- Fig. 5 is a diagram showing a basic arrangement of the picture display apparatus according to the present invention;
- Fig. 6 is a diagram showing an arrangement of the apparatus in the case where a groove in the sample is measured by ultrasonic wave and operated into a picture to be displayed;
- Figs. 7A and 7B are diagrams respectively showing a spatial spectrum and a measurement spectrum illustrating the reference shape under the condition of Fig. 6;
- Figs. 8A and 8B are schematic diagrams useful to explain the relation among the probe, the groove and the resultant spatial spectrum of the groove;
- Figs. 9A, 9B and 9C are diagrams respectively showing the result in the case where the invention is applied to the spectrum measured under the condition of Fig. 6;
- Fig. 10 is a diagram showing a spatial spectrum of an unknown shape obtained in the case where the reference shape is made rectangular under the condition of Fig. 6;
- Fig. 11 is a table showing a comparison among various kinds of distribution reference shapes;
- Fig. 12 is a graph showing the result in the case where the invention is applied to the various groove widths under the condition of Fig. 6;
- Fig. 13 is a diagram showing an additional circuit for smoothing the measured spectrum in the picture display apparatus according to the present invention; and
- Figs. 14A and 14B are diagrams respectively showing the results of obtained in the picture display apparatus which is provided with the additional circuit shown in Fig. 13.
- Prior to illustration of preferred embodiments of the invention, description will be made first about the principle of the invention. In a nondestructive testing or measurement device, in which an internal fault or a shape of an internal structure is displayed as a picture, for example, such as an ultrasonic inspector, a radiation computerized tomography, a microwave radar prospector, etc., there occurs blur in picture on account of spatial expansion of the ultrasonic wave, the radiation rays, or the microwave, the size of aperture at the sensor receiver portion, and so on. The blur can be regarded as spatial resolution peculiar to the measurement device. The spatial resolution means a spatial expansion of a picture when a point object is displayed. If the spatial resolution peculiar to the measurement device is grasped and the blur caused by the spatial resolution is corrected, the true shape can be approximately displayed. The present invention provides an apparatus in which, in displaying a picture, the influence of high frequency noises are reduced to make it possible to display a picture more approximate to the true shape.
- First, the principle of deriving a picture having no blur from a picture having blur in the case where the spatial resolution is known will be described. For the sake of simplicity, consideration is made about a case of mathematical processing for correcting a one-dimensional blur. Although a picture is generally two- dimensional, a one-dimensional picture is hereinafter referred to as "a spatial spectrum" as a matter of convenience. It is defined that the abscissa and ordinate of the spatial spectrum respectively represent the spatial position and intensity of the spatial spectrum. Fig. 1 shows a spatial spectrum O(x) measured by a measurement device and having blur, and Fig. 2 shows a spatial spectrum R(x) of spatial resolution including blur. If a spatial spectrum having no blur is represented by I(x), the relation expressed by the following equation (1) is satisfied between the spatial spectra O(x) and R(x).

- The following equation (2) is derived by performing Fourier transformation on the both sides of the equation (1).


- This frequency spectrum (v) can be brought back to the actual spatial spectrum I(x) through reverse Fourier transformation by the following equation (7).

- In the equation (7), (v) can be obtained from measured spatial spectrum O(x) through Fourier transformation, however, there is a problem as to a manner how to obtain the spatial spectrum R(x) which is the source function of (v). If R(x) is defined as the spatial resolution of the measurement device, when a point-like object is made to be a picture by a measurement device so as to display the picture, the spatial expansion of the picture can be regarded as the spatial resolution R(x). In an actual case, however, such a point-like object cannot exist and the spatial resolution R(x) may vary depending on the position of the point-like object. Accordingly, an object having a known shape is made to be a picture by a measurement device and a true shape is compared with the picture to thereby derive the spatial resolution of the measurement device. The function (v) derived from this spatial resolution through Fourier transformation can be regarded as the transfer function of the measurement device. By the use of this transfer function R(v), a picture of an object is derived on the basis of the equation (7). If a known shape and a picture thereof are represented by spatial spectra ls(x) and Os(x), the transfer function (v) can be obtained on the basis of the following equation (8) which is derived from the equation (2).

- In this case, the possibility of generation of high frequency components in the spatial spectrum I(x) of the unknown shape calculated in the above-mentioned procedure is determined depending on the selection as to what kind of shape is used as the spatial spectrum ls(x) representing a known shape. For example, if the spatial spectrum ls(x) representing a known shape is rectangular as shown in Fig. 3A, the frequency spectrum s(v) derived from the spatial spectrum ls(x) through Fourier transformation has a shape as shown in Fig. 3B. In this case, as seen in Fig. 3B, the spectrum has large values in a high frequency range so that high frequency components are generated in the spatial spectrum I(x) of the unknown shape. In order to reduce these high frequency components, the spatial spectrum ls(x) of the known shape is selected to satisfy the following conditions: (i) The expansion of the spatial spectrum ls(x) is definite; (ii) The spatial spectrum ls(x) has small values in a high frequency range; and (iii) In a frequency domain of the spatial spectrum ls(x), the oscillation does not extend in a wide range. Accordingly, the inventors have examined various shapes, such a Gaussian distribution, a cosine distribution, a cosine distribution about a position where the intensity becomes half (a modified cosine distribution), etc., under the condition that the width of the spatial spectrum ls(x) at a position where the intensity of the spatial spectrum ls(x) becomes half (hereinafter referred to as "half-value width W") is made to correspond to the width of the rectangle shown in Fig. 3A. As the result of examination in view of the above-mentioned three conditions, it has been found that such a distribution as expressed by the following equation (9), which is a combination of two Gaussian distributions and which is therefore referred to as a modified Gaussian distribution in this specification, is optimum.

- The principle of the present invention has thus been described. Referring to Fig. 5, now, an embodiment of the invention will be described hereunder.
- First, the transfer function R(v) of the measurement device is obtained. If the output of a switching
controller 5 is made to be "1 ", the terminals a and c are made conductive with each other in each ofswitches controller 5 is made to be "0", the terminals b and c are made conductive with each other in the same switches.Switches controller 5 and aselection instructor 6. That is, the terminals a and c of each of theswitches controller 5 and theselection instructor 6 are "1 ", while the terminals b and c of the same are made conductive with each other during the periods in other conditions of the respective outputs of the switchingcontroller 5 and theselection instructor 6. Accordingly, first, both the respective outputs of the switchingcontroller 5 and theselection instructor 6 are made to be "1". A half-value width of a known shape as a reference is set through a half-valuewidth setting switch 1. Upon reception of this half-value idth, a modifiedGaussian distribution operator 2 performs operations to obtain a modified Gaussian distribution on the basis of the equation (9), the result being stored in an ls(x)memory 3. Accordingly, the half-valuewidth setting switch 1, the modifiedGaussian distribution operator 2 and the ls(x)memory 3 constitute a modified Gaussian distribution holding means. In this case, in the ls(x)memory 3, the address is made to correspond to the spatial position and the intensity of spectra is stored as the contents. The contents of the ls(x)memory 3 are applied to aFourier transformation device 12 through theswitch 8 and a frequency spectrum s(v) is derived on the basis of the equation (4). The frequency spectrum ls(v) is applied to an ls(v)memory 13 and the real part and the imaginary parts are stored separately from each other in the ls(v)memory 13. Then, the output of theselection instructor 6 is made to be "0" so that the terminals b and c of each of theswitches spectrum memory 4 so as to be stored therein. The contents of the measuredspectrum memory 4 is applied to theFourier transformation device 12 through theswitch 8. Upon reception of the contents of the measuredspectrum memory 4, theFourier transformation device 12 performs operations to obtain a spatial spectrum (v) on the basis of the equation (3), and the real and imaginary parts of the thus obtained frequency spectrum (v) are stored separately from each other in an (v)memory 14. The contents of the (v)memory 14 are applied to a port A of avector divider 17 and the contents of the s(v)memory 13 are applied to another port B of thesame vector divider 17 through theswitch 10. Thevector divider 17 performs operations to obtain a real value Cr and an imaginary value Ci on the basis of the following equation (10) by the use of a real part Ar and an imaginary part Ai of the input to the port A and a real part Br and an imaginary part Bi of the input to the port B.
memory 15 through theswitch 11. In this manner, the transfer function (v) of the measured device has been obtained. The values Cr and Ci of the equation (10) represent the real part and the imaginary part of the transfer function R(v) obtained by the division of s(v)/ s(v). - Next, an unknown shape of an object is displayed on the basis of the measurement on the object having the unknown shape. The output of the switching
controller 5 is made "0" and a spatial spectrum O-(x) obtained through the measurement on the object having the unknown shape is applied to theFourier transformation device 12 from the measurement device through theswitch 8. TheFourier transformation device 12 performs operations to obtain a frequency spectrum 6(f) on the basis of the equation (3), and the real and imaginary parts of the thus obtained frequency spectrum (v) are stored separately from each other in the (v)memory 14. The contents of the (v)memory 14 are applied to the port A of thevector divider 17 and the contents of the R(v)memory 15 are applied to the port B of thesame vector divider 17 through theswitch 10. Thevector divider 17 performs an operation to obtain values Cr and Ci on the basis of the equation (10) and thus obtained values Cr and Ci are respectively stored in a real part and an imaginary part of a frequency spectrum (v)memory 16. A reverseFourier transformation device 18 performs an operation to obtain a spatial spectrum I(x) from the contents of the (v)memory 16 on the basis of the equation (7) and the real part Ir and the imaginary part li of the thus obtained spatial spectrum I(x) are stored in a real part and an imaginary part of an I(x)memory 19. Apower operator 20 performs an operation to obtain an intensity Ip on the basis of the following equation (11) by the use of the real part Ir and the imaginary part li of the I(x)memory 19, and thus obtained intensity Ip is stored in apower spectrum memory 21.
address converter 22 shifts the addresses of the I(x)memory 19 on the basis of the following equation (12) so as to store the rearranged contents of the I(x)memory 19 in ashift spectrum memory 23. Assuming now that the number of the addresses of theshift spectrum memory 23 is 2N and that the contents at the k-th address of thepower spectrum memory 21 are represented by lp(k), the contents lsp(m) of the m-th address of theshift spectrum memory 23 are determined on the basis of the following equation (12).
- Receiving voltage values Vx and Vy each proportional to the contents lsp(m) at the m-th address of the
shift spectrum memory 23 from an address converter 25 and apower converter 24 respectively as a horizontal and a vertical deflection signal, apicture display 26 displays a picture having no blur. - In the following, description will be made as to an example of case where the apparatus according to the present invention is applied to a resultant picture of a rectangular groove existing in a sample measured by an ultrasonic inspector. Fig. 6 shows an example of an arrangement to reproduce the result of measurement of an ultrasonic inspector in the form of a picture. In response to a signal from an
ultrasonic inspector 105, anultrasonic beam 104 is transmitted to asample 102 from aprobe 100. Theprobe 100 receives an ultrasonic wave reflected from the surface of arectangular groove 103 of thesample 102. Theprobe 100 is scanned in the X-direction by ascanner 101. Anoperator 106 measures a time interval t(x) from transmission to reception of the ultrasonic signal in a spatial position x and calculates a depth h(x) of the groove on the basis of the following equation (13).
sample 102 and a sonic velocity in thesample 102. This h(x) has a distribution substantially similar to the intensity distribution of the ultrasonic wave received by theprobe 100. The spatial position x and the intensity of the ultrasonic wave received at each position or the depth at each position are transmitted from theoperator 106 to the measuredspectrum memory 4. Since theultrasonic beam 104 spreads in thesample 102, such a spatial spectrum O(x) as shown in Fig. 7B is obtained when a rectangular groove shown in Fig. 7A is measured. By the use of those spatial spectra I(x) and O(x), the result of measurement is made to be a picture in the apparatus of Fig. 5. In this connection, the reason why the above spatial spectrum as shown in Fig. 7B is obtained will be explained with reference to Figs. 8A and 8B. - The ultrasonic beam spreads as shown in Fig. 8A. Therefore, the reflected ultrasonic wave can be received by the
probe 100 even if the groove is not right beneath the probe position x. - When a reflected ultrasonic wave is received at the probe position x, the received wave is usually regarded as being reflected from right beneath the position x. Accordingly, when the probe receives the ultrasonic wave reflected from a position which is shifted from the position right beneath the position x as shown in Fig. 8A, calculation of h(x) according to the equation (13) is carried out on the basis of a time interval which is longer than that obtained when the probe is right above the groove, and therefore, the resultant depth is smaller than the depth of the groove. Therefore, the distribution of h(x) as shown in Fig. 8B is obtained.
- Assume now that a transfer function R(v) of the measurement device is obtained so as to obtain a shape of a groove having an
unknown width 1 by the use of a groove having a width to as a known reference shape. If the width to is set by the half-valuewidth setting switch 1, the modifiedGaussian distribution operator 2 performs an operation to obtain a spatial spectrum ls(x) on the basis of the equation (9) and the result is stored in the ls(x)memory 3. The spatial spectrum ls(x) has such a shape as shown in Fig. 9A. If a spatial spectrum I(x) of the unknown shape is obtained by the apparatus of Fig. 5, the spatial spectrum I(x) has such a shape as shown in Fig. 9B. In this case, it is judged in Fig. 9B that the shape portion having intensity not smaller than 0.5 is the unknown shape. Thus, such a shape as shown by a broken line is obtained. If the thus obtained shape shown by the broken line in Fig. 9B is compared with the true shape shown in Fig. 9C, the former is different from the latter only in that the width of the former is smaller than the latter by 10%. On the other hand, Fig. 10 shows a spatial spectrum distribution I(x) in the case where a rectangular shape is used as the reference spatial spectrum ls(x) without using a modified Gaussian distribution. If it is assumed that the shape to be derived should have intensity not smaller than 0.5, the derived shape has three grooves as indicated by circles in Fig. 10. The shape is different from the true one. This is because the spectrum has large values in a high frequency range as shown in Fig. 3B and the high frequency components cannot be reduced. In comparison with the case of Fig. 10, the result according to the present invention has reduced noises as shown in Fig. 9B so that a shape approximate to the true one can be obtained. Fig. 11 shows a comparison of the cases where the spatial spectrum ls(x) of the reference shape employs a rectangular distribution, a cosine distribution, a Gaussian distribution, etc., with the case where a modified Gaussian distribution is used. As seen from Fig. 11, the shape obtained by using the modified Gaussian distribution is the most approximate to the true shape. Fig. 12 is a graph showing the results obtained in the cases where the apparatus according to the present invention is applied tovarious groove widths 1. Fig. 12 shows the fact that although the difference between the measured groove width and the true one is large in the case where the true width is smaller than the reference groove width ℓo, the shape can be displayed with an error within a range of 13 % or less with respect to the true shape in the case where thetrue groove width 1 has a value within a range of from to to 2ℓo. - According to the apparatus shown in Fig. 5, if there are large variations in the measured values of the spectra Os(x) and O(x), the measured spectrum is not smooth and has discontinuous points. If the spatial spectrum having discontinuous points is subject to Fourier transformation, the high frequency components have large values. Accordingly, if the variations due to measurement errors or the like in the measured spectrum are reduced so as to smooth the shape of the measured spectrum, it is possible to reduce the high frequency components to thereby derive a clearer spatial spectrum I(x).
- One of the means to cope with this problem is such that the measured spectrum is approximated by an m-order B-spline curve so as to smoothly connect the discontinuous points. The B-spline curve of m order can be derived from the following equation (14).

weight function operator 29 performs an operation to obtain a weight function corresponding to the curve order number m set by an order-numberm setting switch 28, and the result of this operation and the contents of the measuredspectrum memory 4 are applied to an m-order B-spline curve operator 27. The B-spline curve operator 27 performs an operation to obtain a B-spline curve on the basis of the equation (14) and the result of this operation is stored in a correctedspectrum memory 30. - Description will be made hereunder about the performance of the new apparatus of Fig. 5 incorporated with the parts of Fig. 12. This apparatus is applied to the result of making a picture by the ultrasonic inspector of Figs. 8A-8C. For example, in the case where the number m has been set in the measured
spectrum memory 4 by the order-numberm setting switch 28, the measured spectrum of Fig. 7B becomes such a corrected spectrum as shown in Fig. 14A. By the additional provision of the circuit of Fig. 13, the spatial spectrum I(x) for an object having an unknown shape is obtained as shown in Fig. 14B. In comparison of the spatial spectrum I(x) of Fig. 14B obtained by the apparatus Fig. 5 incorporated with the additional circuit of Fig. 13 with the spatial spectrum I(x) of Fig. 9B obtained by the apparatus of Fig. 5 in which the additional circuit of Fig. 13 is not incorporated, it is found that on account of the additional provision of the circuit of Fig. 12 the high frequency components of the measured spectrum are reduced so that a picture approximate to the true shape can be obtained. - According to the present invention, when the transfer function peculiar to the measurement device is measured by the apparatus of the invention, a modified Gaussian distribution composed of two Gaussian distributions is used as a spectral distribution representing the shape of a known sample, so that the oscillations of the high frequency components of the measured spectrum due to the measurement errors can be reduced to make it possible to display a picture approximate to the true shape of an object having an unknown shape with high resolution. For example, the invention has such a meritorious effect that in the case where the size of the object having an unknown shape is within a range from the size to of the known sample to 2to, the unknown-shaped object can be displayed as a picture which is different in size only by 15 % or less from the true one.
Claims (5)
characterised by
said first transformation means (12) thus producing
and

Applications Claiming Priority (2)
| Application Number | Priority Date | Filing Date | Title |
|---|---|---|---|
| JP76570/86 | 1986-04-04 | ||
| JP61076570A JP2528829B2 (en) | 1986-04-04 | 1986-04-04 | Imaging method and imaging apparatus |
Publications (3)
| Publication Number | Publication Date |
|---|---|
| EP0240029A2 EP0240029A2 (en) | 1987-10-07 |
| EP0240029A3 EP0240029A3 (en) | 1990-01-24 |
| EP0240029B1 true EP0240029B1 (en) | 1994-03-09 |
Family
ID=13608890
Family Applications (1)
| Application Number | Title | Priority Date | Filing Date |
|---|---|---|---|
| EP87104932A Expired - Lifetime EP0240029B1 (en) | 1986-04-04 | 1987-04-03 | Picture display apparatus |
Country Status (4)
| Country | Link |
|---|---|
| US (1) | US4831598A (en) |
| EP (1) | EP0240029B1 (en) |
| JP (1) | JP2528829B2 (en) |
| DE (1) | DE3789248T2 (en) |
Cited By (1)
| Publication number | Priority date | Publication date | Assignee | Title |
|---|---|---|---|---|
| EP3460515B1 (en) * | 2017-09-22 | 2023-09-06 | BSH Hausgeräte GmbH | Mapping for autonomous robotic devices |
Families Citing this family (6)
| Publication number | Priority date | Publication date | Assignee | Title |
|---|---|---|---|---|
| DE3836280C1 (en) * | 1988-10-25 | 1989-08-10 | Rohde & Schwarz Gmbh & Co Kg, 8000 Muenchen, De | |
| US5265013A (en) * | 1990-11-19 | 1993-11-23 | General Electric Company | Compensation of computed tomography data for X-ray detector afterglow artifacts |
| US5367579A (en) * | 1993-06-25 | 1994-11-22 | The United States Of America As Represented By The Secretary Of The Air Force | Method of removing spurious responses from optical joint transform correlators |
| US5438632A (en) * | 1993-06-25 | 1995-08-01 | The United States Of America As Represented By The Secretary Of The Air Force | Joint transform correlator using a 4-F lens system to achieve virtual displacement along the optical axis |
| US7304482B1 (en) * | 2002-12-04 | 2007-12-04 | Kay Robert L | Characterization of the nonlinearities of a display device by adaptive bisection with continuous user refinement |
| US10768294B2 (en) * | 2018-03-19 | 2020-09-08 | Mitsubishi Electric Research Laboratories, Inc. | System and method for multimodal, motion-aware radar imaging |
Family Cites Families (3)
| Publication number | Priority date | Publication date | Assignee | Title |
|---|---|---|---|---|
| US4042928A (en) * | 1974-03-22 | 1977-08-16 | Esl Incorporated | Technique of characterizing the nature of a radiation path transfer function by a few constants |
| US4003054A (en) * | 1974-10-03 | 1977-01-11 | Raytheon Company | Method of compensating for imbalances in a quadrature demodulator |
| US4084148A (en) * | 1975-10-13 | 1978-04-11 | Hitachi, Ltd. | Object recognition system |
-
1986
- 1986-04-04 JP JP61076570A patent/JP2528829B2/en not_active Expired - Lifetime
-
1987
- 1987-04-03 EP EP87104932A patent/EP0240029B1/en not_active Expired - Lifetime
- 1987-04-03 US US07/033,756 patent/US4831598A/en not_active Expired - Fee Related
- 1987-04-03 DE DE3789248T patent/DE3789248T2/en not_active Expired - Fee Related
Cited By (1)
| Publication number | Priority date | Publication date | Assignee | Title |
|---|---|---|---|---|
| EP3460515B1 (en) * | 2017-09-22 | 2023-09-06 | BSH Hausgeräte GmbH | Mapping for autonomous robotic devices |
Also Published As
| Publication number | Publication date |
|---|---|
| JP2528829B2 (en) | 1996-08-28 |
| EP0240029A2 (en) | 1987-10-07 |
| US4831598A (en) | 1989-05-16 |
| DE3789248T2 (en) | 1994-09-01 |
| DE3789248D1 (en) | 1994-04-14 |
| JPS62233756A (en) | 1987-10-14 |
| EP0240029A3 (en) | 1990-01-24 |
Similar Documents
| Publication | Publication Date | Title |
|---|---|---|
| US7280227B2 (en) | Device, method and system for measuring the distribution of selected properties in a material | |
| US4545251A (en) | Electronic scanning type ultrasonic non-destructive testing apparatus | |
| US5529069A (en) | Magnetic resonance imaging apparatus | |
| JPH06233118A (en) | Equipment and method for performing discleaning and resolution altering of half-tone image to generate continuous-tone image | |
| KR0171606B1 (en) | Ultrasonic inspection and imaging instrument | |
| US4801873A (en) | Waveform measuring apparatus with marker zone displaying function | |
| EP0240029B1 (en) | Picture display apparatus | |
| US4271389A (en) | Method and apparatus for physiologic facsimile imaging of biologic targets without multipath contamination using remote microwave interrogation | |
| US4653909A (en) | Sinusoidal determination of limiting optical resolution | |
| JP3304692B2 (en) | Spectrometer | |
| US6140960A (en) | Hologram observation method for three-dimensional wave source distribution, and stereoscopic directivity estimation method of antenna and wave distribution observation method based on hologram observation | |
| US2820173A (en) | Spectrum analyzer | |
| DE19917661A1 (en) | Visual radio wave representation apparatus for determining directional characteristic of antenna | |
| US5042491A (en) | Ultrasonic diagnostic apparatus | |
| US4448201A (en) | Digital scan converter | |
| EP4009079A1 (en) | Multi-band attribute blending in three-dimensional space | |
| JPS6217654A (en) | Image pick-up apparatus | |
| US4475166A (en) | Digital signal processing apparatus with improved display | |
| JPH06261906A (en) | Ultrasonic diagnostic device | |
| JPS6391783A (en) | Processing for smoothing image signal | |
| EP0648359B1 (en) | Correlation signal processing | |
| GB2101750A (en) | Microwave impedance measurement apparatus | |
| JPS5817404B2 (en) | Distance pattern measurement method using deconvolution | |
| EP1853171B1 (en) | Method and device for determining the motion vector of tissues in a biological medium | |
| JPH02263180A (en) | Aperture synthetic processor |
Legal Events
| Date | Code | Title | Description |
|---|---|---|---|
| PUAI | Public reference made under article 153(3) epc to a published international application that has entered the european phase |
Free format text: ORIGINAL CODE: 0009012 |
|
| AK | Designated contracting states |
Kind code of ref document: A2 Designated state(s): DE FR GB |
|
| PUAL | Search report despatched |
Free format text: ORIGINAL CODE: 0009013 |
|
| AK | Designated contracting states |
Kind code of ref document: A3 Designated state(s): DE FR GB |
|
| 17P | Request for examination filed |
Effective date: 19900130 |
|
| 17Q | First examination report despatched |
Effective date: 19911028 |
|
| GRAA | (expected) grant |
Free format text: ORIGINAL CODE: 0009210 |
|
| AK | Designated contracting states |
Kind code of ref document: B1 Designated state(s): DE FR GB |
|
| REF | Corresponds to: |
Ref document number: 3789248 Country of ref document: DE Date of ref document: 19940414 |
|
| ET | Fr: translation filed | ||
| PLBE | No opposition filed within time limit |
Free format text: ORIGINAL CODE: 0009261 |
|
| STAA | Information on the status of an ep patent application or granted ep patent |
Free format text: STATUS: NO OPPOSITION FILED WITHIN TIME LIMIT |
|
| 26N | No opposition filed | ||
| PGFP | Annual fee paid to national office [announced via postgrant information from national office to epo] |
Ref country code: FR Payment date: 19960321 Year of fee payment: 10 |
|
| PGFP | Annual fee paid to national office [announced via postgrant information from national office to epo] |
Ref country code: GB Payment date: 19960325 Year of fee payment: 10 |
|
| PGFP | Annual fee paid to national office [announced via postgrant information from national office to epo] |
Ref country code: DE Payment date: 19960628 Year of fee payment: 10 |
|
| PG25 | Lapsed in a contracting state [announced via postgrant information from national office to epo] |
Ref country code: GB Effective date: 19970403 |
|
| GBPC | Gb: european patent ceased through non-payment of renewal fee |
Effective date: 19970403 |
|
| PG25 | Lapsed in a contracting state [announced via postgrant information from national office to epo] |
Ref country code: FR Free format text: LAPSE BECAUSE OF NON-PAYMENT OF DUE FEES Effective date: 19971231 |
|
| PG25 | Lapsed in a contracting state [announced via postgrant information from national office to epo] |
Ref country code: DE Free format text: LAPSE BECAUSE OF NON-PAYMENT OF DUE FEES Effective date: 19980101 |
|
| REG | Reference to a national code |
Ref country code: FR Ref legal event code: ST |