EP0219206A2 - Phase sensitive detection in multislice magnetic resonance imaging systems - Google Patents
Phase sensitive detection in multislice magnetic resonance imaging systems Download PDFInfo
- Publication number
- EP0219206A2 EP0219206A2 EP86306320A EP86306320A EP0219206A2 EP 0219206 A2 EP0219206 A2 EP 0219206A2 EP 86306320 A EP86306320 A EP 86306320A EP 86306320 A EP86306320 A EP 86306320A EP 0219206 A2 EP0219206 A2 EP 0219206A2
- Authority
- EP
- European Patent Office
- Prior art keywords
- frequency
- gradient
- signal
- field
- slice
- Prior art date
- Legal status (The legal status is an assumption and is not a legal conclusion. Google has not performed a legal analysis and makes no representation as to the accuracy of the status listed.)
- Granted
Links
Images


Classifications
-
- G—PHYSICS
- G01—MEASURING; TESTING
- G01R—MEASURING ELECTRIC VARIABLES; MEASURING MAGNETIC VARIABLES
- G01R33/00—Arrangements or instruments for measuring magnetic variables
- G01R33/20—Arrangements or instruments for measuring magnetic variables involving magnetic resonance
- G01R33/44—Arrangements or instruments for measuring magnetic variables involving magnetic resonance using nuclear magnetic resonance [NMR]
- G01R33/48—NMR imaging systems
- G01R33/58—Calibration of imaging systems, e.g. using test probes, Phantoms; Calibration objects or fiducial markers such as active or passive RF coils surrounding an MR active material
- G01R33/583—Calibration of signal excitation or detection systems, e.g. for optimal RF excitation power or frequency
Definitions
- This invention relates to magnetic resonance imaging (MRI) systems and, in particular to the phase sensitive detection of nuclear magnetic resonance (NMR) signals in such systems.
- MRI magnetic resonance imaging
- NMR nuclear magnetic resonance
- MRI Magnetic resonance Imaging
- a common imaging technique is the formation of images of selected planes, or slices, of the subject being imaged.
- the subject is located in the static magnetic field with the physical region of the slice at the geometric center of the gradient field.
- the field center is the point where the gradients of the x, y and z dimensions all have nominal zero values.
- each gradient will exhibit an increasing field strength on one side of the field center, and a decreasing field strength on the other side, both variations progressing in the direction of the particular gradient.
- the field strength at the field center will thus correspond to a nominal Larmor frequency for the MRI system, usually equal to that of the static magnetic field.
- the radio frequency (RF) coils which transmit RF excitation pulses to the subject and receive NMR signals in return are normally tuned about the nominal Larmor frequency.
- the RF transmitters and receivers are similarly adjusted with bandwidths centered about this frequency. With the region of the slice located at the field center, the transmitted and received signals will be in a range about-the nominal frequency.
- Multiple slice imaging presents a particular problem in that slices located at other than the field center will respond to and emit signals of different frequencies and frequency bands during excitation and NMR signal emission.
- An off-center slice will be selected by an excitation signal of a frequency other than the nominal system center frequency, but reception in the presence of a frequency-encoding "read" gradient may still be over a frequency band centered about the nominal center frequency,
- the problem that develops is that frequencies and bandwidths must then be changed between excitation and NMR signal reception.
- a straightforward approach to the above problem is to transmit at a selected, narrow frequency band to excite the desired slice, then receive signals over a broad band, with a center frequency that is always the same as the nominal center frequency, thereby aligning the receiver band with the read gradient field.
- the slice will be excited in relation to both the frequency and phase characteristics of the transmitted excitation signals.
- Subsequence encoding of the NMR spin systems proceeds from the phase reference of the transmitted signal.
- the phase reference of the transmitted signal must be utilized during NMR signal reception. But if the frequency is changed in preparation for reception the phase reference may be lost: the phase may become " unlocked". Thus, some technique is necessary to maintain the phase lock between transmission and reception when the frequency is changed.
- a second technique is to use a multiple frequency reference source that provides separate, phase-locked signals for transmission and reception.
- One such system would derive the two signals from a high frequency master reference signal which is divided down in frequency.
- this arrangement restricts both the spacing of the slices and signal timing to predetermined choices, a penalty in system flexibility.
- the multiple frequency source may attempt to phase-align two completely variable frequency signals. This too, presents a problem in that signals of different frequencies may be phase-compared only when they momentarily achieve phase alignment, which happens only once every inverse difference frequency. The closer the frequencies of the signals, the less often they are in alignment, and hence the less often a phase correction can be made.
- a final technique is to employ a stabilizing circuit for the reference frequency source which will set the phase to a particular value each time the frequency is changed.
- Such a circuit is difficult to produce, and can suffer from instability which makes it no more reliable than the first technique.
- each spatially different image slice is interrogated at its own particular frequency.
- a selected common frequency is used for excitation and for reception of NMR signal information from each particular slice. Since the frequency is not changed between the transmit and receive cycles the phase reference is not unlocked between the two cycles.
- the use of a different frequency reference for each slice causes an apparent left/right frequency shift in the demodulated information signals. This undesired shift is corrected by modulating the received signals with the trigonometric function of the difference frequency of the demodulating signal and a given reference frequency.
- FIGURE 1 a block of material 70 containing slices A and B is shown.
- the block is oriented with respect to the x, y and z axes drawn next to the block, with the null point of the gradient fields centered with respect to slice B.
- An x-directed gradient G x is drawn to show the variation of the gradient field for the x-direction. Its degree of variation is indicated with respect to an x-axis line 74 drawn in the plane of and through the center of the slice.
- a z-directed gradient G z is also shown, and for clarity of illustration the G gradient is drawn in the plane of the forward face 72 of the block.
- the G z gradient field has its null point coincident with the x-axis line 74.
- the center of the slice B at the center of the gradient field thus has a coordinate value with respect to the gradients of (X . Y o , Z o ).
- the slice B is excited by a radio frequency (RF) signal having a narrow frequency band centered around frequency F Zo , as indicated by the arrow below the slice B.
- the frequency F Zo is the characteristic frequency at the null point of the G gradient field.
- RF radio frequency
- the acquired signals are spatially encoded by frequency variation along the x-direction in a band of frequencies BW x .
- the center of the BW x band is indicated by a frequency F Xo , which is the characteristic frequency at the null point of the G z gradient field.
- both center frequencies F Zo and F Xo are at field null points where the field is equal to the static magnetic field, the two center frequencies are equal.
- F Zo F Xo .
- the use of a common reference frequency for both the transmitter and receiver, equal to F Zo and F Xo may be used to generate and demodulate signals from slice B. Since the reference frequency does not have to be changed, there will be no loss of the phase reference, or "unlock", when the received signals are demodulated.
- the slice A is also shown with respect to the G x gradient, which is drawn with reference to an x-axis line 76 passing through the center of slice A and in the plane of the slice.
- the center of slice A is also located at the null point of the G gradient field.
- the G z gradient in the plane of the face 72 of block 70 is seen to be below the x-axis line 76, because the slice A is in a field location of the G z gradient field which differs from that at the null point.
- the center of the slice A has a coordinate value with respect to the gradients of (X . Y o , Z L ).
- the slice A is excited with respect to the G z gradient field by an RF signal having a frequency band centered around frequency F ZL , as indicated by the arrow below the slice A.
- the frequency F ZL is the characteristic frequency of the G z gradient field in the plane of the x-axis line 76, the slice A plane.
- the frequency F Xo is the characteristic frequency at the null point of the G x gradient field, while the frequency F ZL is characteristic of an off-null point of the G z gradient field, such as the point indicated by arrow F XL .
- F ZL is not equal to F Xo .
- the phase unlock problem is overcome by using the same reference signal for both RF transmission and NMR signal reception and demodulation.
- an off-center slice such as slice A of FIGURE 1.
- FZL frequency equal to FZL
- the F ZL frequency will be at a point on the x-axis reference line 76 which is other than the center point, since F Xo is not equal to F ZL .
- This new band of demodulated frequencies will be offset from the desired frequency-encoded band of BW. This condition of frequency band offset will be discussed further below.
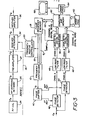
- the NMR techniques of the present invention may be performed by an MRI system such as that shown in block diagram form in FIGURES 2 and 3. Referring to FIGURE 2. the transmission portion of an MRI system is shown.
- a pulse sequencer and memory 18 applies a control signal V c to a frequency synthesizer 10.
- the frequency synthesizer 10 applies an f transmit reference signal to a transmitter 12.
- F s is the center frequency of a transmitted radio frequency signal.
- the transmitter 12 produces a timed transmit F s signal, which is coupled by way of a controlled transmitter attenuator 14 to a transmitter amplifier 16.
- the transmitter 12 and attenuator 14 are controlled by control signals provided by a transmit/receive controller 20, which is under control of the pulse sequencer 18.
- the F s signal is amplified by the amplifier 16 and applied to the RF coil 24 in the magnet 30 in the form of a sequence of pulses formed under control of the transmit/receive controller 20.
- the RF coil 24 applies the F 6 pulses to the subject being imaged.
- timing control signals are also produced by the frequency synthesizer 10 and coupled to the transmit/receive controller and the pulse sequencer on line 19.
- x, y, and z gradient coils 26, 28, and 29 are also located within the field of the magnet 30. These coils receive gradient control signals G x , G y , and G from gradient signal amplifier 22. The control signals are provided by the transmit/receive controller 20.
- the NMR signals emitted by the nuclei of the material being imaged induce F R return signals in the RF coil 24. These return signals are coupled by way of an RF matching network 25 to a pre-amplifier 27, and on to a receiver attenuator 34.
- the receiver attenuator is controlled by the transmit/receive controller 20.
- the received F i signals are amplified by an amplifier 36 and applied to quadrature phase detectors 42 and 44.
- the phase detectors receive two phase demodulating signals at respective 0° and 90° phase angles from a phase shifter 40, which receives reference signal f R from the frequency synthesizer 10.
- the phase detectors 42 and 44 produce a channel A and a channel B signal, respectively.
- the baseband channel A and B signals are filtered by respective low pass filters 46 and 48. and the filtered signals are then sampled by respective analog to digital converters 50 and 52 in response to a sampling signal f sam p le produced by the pulse sequencer 18.
- the resultant channel A and channel B digital words are stored in the memory of a computer 60.
- the computer and memory 60 also exchanges information with the pulse sequencer and memory 18 by way of a data link 68.
- the channel A and B digital words are processed. combined and transformed to the frequency domain by a Fourier transform array processor 62.
- the resultant image signals are assembled in an image format by an image processor 64, and the processed image is displayed on a video monitor 66.
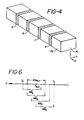
- FIGURE 4 a rectangular block of material 70 which is to be imaged by the system of FIGURES 3 and 4 is shown.
- Four slices. A, B, C, and D, of the block are to be imaged using a multi-slice, multi-echo format.
- the coordinates of the block are as indicated by the x, y and z coordinate axes shown adjacent the block 70.
- One face 172 of the block 70 is specifically indicated.
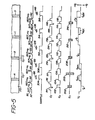
- FIGURE 5 shows waveforms for imaging the four slices of block 170.
- the face 172 of the block is partially shown with reference to a z-directed gradient G z .
- Slice B of the block is centered at the center, or null point of the G z gradient field.
- the null point is the point at which the G gradient makes substantially no contribution to the static magnetic field (G z -O). On either side of the null point the gradient field increases relatively positively or negatively.
- Slice A is scanned first by applying a frequency selective 90° RF pulse 80 together with a slice selecting G z gradient 84.
- the 90° pulse 80 exhibits a frequency characteristic ⁇ A for spatial selection of slice A.
- a preconditioning G gradient 102 is applied to the slice and one level of a level variable phase encoding G y gradient 202 is applied to spatially encode the slice in the y direction.
- a frequency selective 180° RF pulse 82 is then applied to the block together with a G z gradient 8 6, resulting in the later formation of a spin echo signal 88.
- the spin echo signal 88 is sampled during a sampling interval 304 in the presence of a frequency-encoding read gradient 104 for the x direction. G .
- a second spin echo signal is acquired from slice A by applying one level of a second phase-encoding G y gradient 205 to the block 170, followed by a second 18 0 ° RF pulse 85 in the presence of G z gradient 87.
- a second spin echo signal 89 develops and is sampled during a sampling period 306 in the presence of a G x gradient 10 6 .
- the second G y gradient 205 has a level chosen to provide twice the phase-encoding effect as the first G y gradient 202, but in an opposite sense. This compensates for the phase reversal caused by the two 180° RF pulses 82 and 85 and causes the phases of the spin echo signal 89 to be of the same sense for processing.
- the G y gradient 205 eliminates ghosts in the second echo image by causing them to superimpose and cancel.
- the frequency synthesizer of FIGURE 2 is receiving a V control signal from the pulse sequencer 18 as indicated at the bottom of FIGURE 5.
- This control voltage causes the reference frequency produced by the frequency synthesizer 10, f s , to be equal to a frequency f A as indicated in FIGURE 5.
- This demodulating signal determines the spatial representation of the frequency-encoded signal information.
- the receiver reference signal was frequency shifted for reception to the nominal reference frequency f REF , as indicated by the broken lines beneath the frequency encoding gradients 104 and 106.
- this change in frequency would disturb the phase lock of the reference signals applied to phase detectors 42 and 44, which unlock is indicated by the arrows on the broken lines at the bottom of FIGURE 5.
- the phase unlock results in erroneous phase-sensitive detection of the received NMR signals, and would also unlock the phase reference of the individual RF pulses in the multi-echo sequence.
- phase unlocking is prevented in apparatus of the present invention by maintaining the same control signal V c for the frequency synthesizer 10 during the entire transmit and receive cycle, as indicated by solid line f A in FIGURE 5.
- the phase-encoded NMR signal information is thus accurately detected for precise image reconstruction.
- a G x gradient 108 and one level of the amplitude variable G y gradient 208 are applied to the block for spatial encoding.
- a 180° RF pulse 122 with frequency spectral content u B is applied in the presence of G z gradient 126, which results in the development of a spin echo signal 128.
- This signal is sampled during sampling interval 310 in the presence of a G x frequency encoding gradient 110. Since the slice selection and sampling of the frequency encoded spin echo signal are both done at the nominal center frequency of f REF' this slice is effectively interrogated in the same manner as was done in the prior apparatus.
- the frequencies f s , f R and f B are all equal to f REF .
- Slice C is selected next by applying a 90° RF pulse 130 with a frequency spectral content of ⁇ C to the block in the presence of a G z gradient 134.
- the fourth slice D is the slice most distant from the null point of the gradient field. Accordingly, the V c control signal is switched to an even greater offset level as shown by the V c line of FIGURE 5, causing the frequency synthesizer signal f to be offset to a frequency f D .
- the slice D is selected by applying a 90° R F pulse 140 with a frequency spectral content ⁇ D and centered about frequency f D to the block 170 in the presence of G z gradient 144.
- a G gradient 116 and one level of G y gradient 216 are applied to the block. followed by a frequency selective 180° RF pulse 142 which is applied in the presence of G z gradient 146.
- the resulting spin echo signal 148 is sampled during an interval 318 in the presence of frequency encoding G x gradient 118 without switching the demodulating reference frequency to the f REF frequency as indicated by the dashed lines in the V c signal line.
- the offsets caused by the changing V c control signal and attendant frequency changes are illustrated in FIGURE 6.
- the nominal bandwidth of the received NMR signals when the demodulating reference frequency is reset to f REF during each sampling interval is indicated as BW REF , with a center frequency of f REF .
- the detected NMR signals from the four slices occupy different bands as shown in the FIGURE.
- the bandwidth of the slice A signals is offset above the nominal band, as indicated by bandwidth BW A .
- Slice B. which is centered in the gradient field, has a bandwidth BW B which is aligned with the nominal band.
- the bands for slices C and D are offset below the nominal band, as indicated by bandwidths BW C and BW D .
- the four frequency bands are seen to occupy a total band extending from f L to f H , instead of the single, narrower BW REF band of the prior apparatus.
- the bandwidth from f L to f H is determined by the relative strengths (slopes) of the G and the G gradient fields for a given spacing of slices.
- sampling frequency is the frequency of the f sample signal used for the analog to digital converters in FIGURE 3.
- this problem is overcome by filtering the NMR signal information prior to reconstruction.
- the filter function used is a function of the frequency offset used to establish the reference frequency for each slice.
- the filter function is embodied in software used to process the NMR signal information.
- a measure of the frequency offset is retained in the computer and memory 60 of FIGURE 3.
- the offset representative information is of the form (V REF -V c ), where V REF represents the control signal for the center frequency of the nominal frequency band BW REF , and V c is the control signal used for acquisition of information from a particular slice .
- the offset representative signal information is used to digitally filter the NMR signal information as illustrated by the flowchart of FIGURE 7.
- the flowcharted routine is executed by the computer and memory 60 in processing the channel A and channel B NMR signal information.
- Retained in memory are parameters ZR. AC. NSL. GZ and ⁇ t, where ZR 1 is the separation range between the two end slices of the slices which are to be imaged: ZC is the location of the center slice along the slice separation direction with respect to the gradient null: N S L is the number of slices: GZ represents the strength of the slice selection gradient, in this example.
- G : and At is the time interval between sampling points of the analog to digital converters.
- the center of the group of slices with respect to center of the z-gradient field is then used to determine the offset of the initial slice in the z-direction.
- the results of the two previous calculations are used to determine the frequency offset for a given slice i, which is the difference between the f R reference frequency for slice i and f REF .
- This frequency offset calculation is communicated to the pulse sequencer and memory 18 over data link 68 where it translates directly into a value for V.
- the frequency offset is also used to correct the apparent left/right shift of the NMR signal information by digitally filtering the acquired data by sine and cosine terms of the frequency offset.
- the NMR signal information in the form of the digitally detected A and B data values of the channel A and B lines is modified by calculating and where n/2 is equal to half the maximum value attained by n (i.e., is a constant).
- the A' and B' n signal information is then stored in memory for subsequent combination.
- Fourier transform processing and image reconstruction In the form of A' n and B' n values, the acquired signal information is effectively frequency shifted as if it had been demodulated by an f REF reference signal.
- the frequency offset is expressed in radians as ⁇
- the A and B data values are modified by trigonometric function of the frequency offset cos ⁇ t and sin(- ⁇ )t.
- the reconstructed slice images will now be identically oriented on the display 66.
Abstract
Description
- This invention relates to magnetic resonance imaging (MRI) systems and, in particular to the phase sensitive detection of nuclear magnetic resonance (NMR) signals in such systems.
- In MRI. a common imaging technique is the formation of images of selected planes, or slices, of the subject being imaged. Typically the subject is located in the static magnetic field with the physical region of the slice at the geometric center of the gradient field. The field center is the point where the gradients of the x, y and z dimensions all have nominal zero values. Generally, each gradient will exhibit an increasing field strength on one side of the field center, and a decreasing field strength on the other side, both variations progressing in the direction of the particular gradient. The field strength at the field center will thus correspond to a nominal Larmor frequency for the MRI system, usually equal to that of the static magnetic field.
- The radio frequency (RF) coils which transmit RF excitation pulses to the subject and receive NMR signals in return are normally tuned about the nominal Larmor frequency. Correspondingly, the RF transmitters and receivers are similarly adjusted with bandwidths centered about this frequency. With the region of the slice located at the field center, the transmitted and received signals will be in a range about-the nominal frequency.
- It is often desirable to acquire several slice images from various regions of the subject for better diagnostic utility. In order to make efficient use of the MRI system, techniques have been developed for acquiring image information from multiple slices simultaneously, such as the techniques described in concurrently filed European patent application number , entitled "MULTIPLEXED MAGNETIC RESONANCE IMAGING OF VOLUMETRIC REGIONS". (Ref;
TECH 30, claiming priority from United States application No. 766613). When multiple slices are imaged simultaneously, one may be located at the field center, but others will be located elsewhere in the gradient fields. Thus, a number of slices will be located in field regions of Larmor frequences other than the nominal center frequency. The bandwidths of the transmitting and receiving coils and circuitry must therefore be adjusted to accommodate the transmission and reception of signals over a wider range of frequencies. - Multiple slice imaging presents a particular problem in that slices located at other than the field center will respond to and emit signals of different frequencies and frequency bands during excitation and NMR signal emission. An off-center slice will be selected by an excitation signal of a frequency other than the nominal system center frequency, but reception in the presence of a frequency-encoding "read" gradient may still be over a frequency band centered about the nominal center frequency, The problem that develops is that frequencies and bandwidths must then be changed between excitation and NMR signal reception.
- A straightforward approach to the above problem is to transmit at a selected, narrow frequency band to excite the desired slice, then receive signals over a broad band, with a center frequency that is always the same as the nominal center frequency, thereby aligning the receiver band with the read gradient field. However, the slice will be excited in relation to both the frequency and phase characteristics of the transmitted excitation signals. Subsequence encoding of the NMR spin systems proceeds from the phase reference of the transmitted signal. To properly decode the received NMR signal information, the phase reference of the transmitted signal must be utilized during NMR signal reception. But if the frequency is changed in preparation for reception the phase reference may be lost: the phase may become "unlocked". Thus, some technique is necessary to maintain the phase lock between transmission and reception when the frequency is changed.
- One technique is to use a reference frequency source that smoothly changes frequency while maintaining a known phase characteristic. However, it has been found that such systems are not always reliable, and that some phase variation may be experienced from time to time when the frequency is changed after transmission. This problem is usually not realized until after the scanning has been completed and it is discovered that the processing system cannot reconstruct a coherent image.
- A second technique is to use a multiple frequency reference source that provides separate, phase-locked signals for transmission and reception. One such system would derive the two signals from a high frequency master reference signal which is divided down in frequency. However, this arrangement restricts both the spacing of the slices and signal timing to predetermined choices, a penalty in system flexibility. To overcome this, the multiple frequency source may attempt to phase-align two completely variable frequency signals. This too, presents a problem in that signals of different frequencies may be phase-compared only when they momentarily achieve phase alignment, which happens only once every inverse difference frequency. The closer the frequencies of the signals, the less often they are in alignment, and hence the less often a phase correction can be made.
- Yet another technique is to offset the frequency-encoding gradient with a uniform bias field so that its center frequency matches the center transmit frequency, as by using the bias coil described in published European patent application number 0 134 701, entitled "OFFSET GRADIENT FIELDS IN NUCLEAR MAGNETIC RESONANCE IMAGING SYSTEMS", However, since any gradient can be a slice-selecting gradient, all gradient coils must respond identically to gradient pulses of the same rise times and pulse area integrals. This requires substantial manufacturing precision and constant adjustment during system use to maintain the necessary gradient accuracy.
- A final technique is to employ a stabilizing circuit for the reference frequency source which will set the phase to a particular value each time the frequency is changed. Such a circuit is difficult to produce, and can suffer from instability which makes it no more reliable than the first technique.
- In accordance with the principles of the present invention, an MRI system is provided which overcomes the problems of the aforementioned techniques for phase sensitive detection. In an embodiment of the present invention, each spatially different image slice is interrogated at its own particular frequency. A selected common frequency is used for excitation and for reception of NMR signal information from each particular slice. Since the frequency is not changed between the transmit and receive cycles the phase reference is not unlocked between the two cycles. However, the use of a different frequency reference for each slice causes an apparent left/right frequency shift in the demodulated information signals. This undesired shift is corrected by modulating the received signals with the trigonometric function of the difference frequency of the demodulating signal and a given reference frequency. By using a common frequency for both transmission and reception the phase information of the NMR signals is preserved, and by knowing the frequency offset between the selected frequency and the given reference frequency the misregistration introduced by the frequency offset is eliminated.
- In the drawings:
- FIGURE 1 illustrates the frequency differences between two slices of different spatial location:
- FIGURES 2 and 3 illustrate an MRI system constructed in accordance with the principles of the present invention:
- FIGURE 4 illustrates a block of material, multiple slices of which are to be imaged:
- FIGURE 5 illustrates waveforms involved in the imaging of the multiple slices of FIGURE 5 in accordance with the principles of the present invention:
- FIGURE 6 illustrates frequency bands of different slices in the frequency-encoding direction: and
- FIGURE 7 is a flowchart of a software sequence for performing digital filtering in accordance with the principles of the present invention.
- Referring first to FIGURE 1, a block of
material 70 containing slices A and B is shown. The block is oriented with respect to the x, y and z axes drawn next to the block, with the null point of the gradient fields centered with respect to slice B. An x-directed gradient Gx is drawn to show the variation of the gradient field for the x-direction. Its degree of variation is indicated with respect to an x-axis line 74 drawn in the plane of and through the center of the slice. A z-directed gradient Gz is also shown, and for clarity of illustration the G gradient is drawn in the plane of theforward face 72 of the block. The Gz gradient field has its null point coincident with the x-axis line 74. The center of the slice B at the center of the gradient field thus has a coordinate value with respect to the gradients of (X . Yo, Zo). - The slice B is excited by a radio frequency (RF) signal having a narrow frequency band centered around frequency FZo, as indicated by the arrow below the slice B. The frequency FZo is the characteristic frequency at the null point of the G gradient field. When the NMR signals resulting from the excited nuclei of the slice are to be read, a read gradient Gx is applied. The acquired signals are spatially encoded by frequency variation along the x-direction in a band of frequencies BWx. The center of the BWx band is indicated by a frequency FXo, which is the characteristic frequency at the null point of the Gz gradient field. Since both center frequencies FZo and FXo are at field null points where the field is equal to the static magnetic field, the two center frequencies are equal. FZo = FXo. Thus the use of a common reference frequency for both the transmitter and receiver, equal to FZo and FXo, may be used to generate and demodulate signals from slice B. Since the reference frequency does not have to be changed, there will be no loss of the phase reference, or "unlock", when the received signals are demodulated.
- The slice A is also shown with respect to the Gx gradient, which is drawn with reference to an
x-axis line 76 passing through the center of slice A and in the plane of the slice. The center of slice A is also located at the null point of the G gradient field. However, the Gz gradient in the plane of theface 72 ofblock 70 is seen to be below thex-axis line 76, because the slice A is in a field location of the Gz gradient field which differs from that at the null point. Thus, the center of the slice A has a coordinate value with respect to the gradients of (X . Yo, ZL). - The slice A is excited with respect to the Gz gradient field by an RF signal having a frequency band centered around frequency FZL, as indicated by the arrow below the slice A. The frequency FZL is the characteristic frequency of the Gz gradient field in the plane of the
x-axis line 76, the slice A plane. When the resulting NMR signals are to be read, the slice gradient Gz is removed and the read gradient Gx is applied to the slice A. Spatially encoded signals from slice A will, as before, occupy a band of frequencies BWx centered around frequency FXo. The frequency FXo is the characteristic frequency at the null point of the Gx gradient field, while the frequency FZL is characteristic of an off-null point of the Gz gradient field, such as the point indicated by arrow FXL. Thus. FZL is not equal to FXo. - In prior NMR apparatus, the difference between FZL and FXo for slice A was taken into account by using a transmit reference frequency equal to FZL, then switching to a receive reference frequency equal to FXo. As mentioned above, this frequency change can cause a loss of the phase reference used in the excitation of the slice A. In order to image the slice A using Fourier transform reconstruction, the acquired NMR information over a number of scans must correspond to a known common phase reference. This is because the Fourier processing is essentially a correlation technique. When the phase reference is unlocked, the phase references for respective data lines will not be precisely correlated. Thus the Fourier transform processor will be operating upon spatially uncorrelated information, and will not accurately reproduce the desired spatially- encoded slice. The problem will manifest itself in the form of ghosts in the slice A image or, in extreme cases, in an unrecognizable image.
- In accordance with the principles of the present invention, the phase unlock problem is overcome by using the same reference signal for both RF transmission and NMR signal reception and demodulation. In the case of an off-center slice such as slice A of FIGURE 1. however, this creates a further complication. When a frequency equal to FZL is used as the reference signal for both transmission and reception, the FZL frequency will be at a point on the
x-axis reference line 76 which is other than the center point, since FXo is not equal to FZL. This may be a frequency such as the point indicated by the arrow of frequency FXL, for instance, where FXL = FZL' Demodulation will thus occur with respect to a band of frequencies centered about frequency FXL. This new band of demodulated frequencies will be offset from the desired frequency-encoded band of BW. This condition of frequency band offset will be discussed further below. - The NMR techniques of the present invention may be performed by an MRI system such as that shown in block diagram form in FIGURES 2 and 3. Referring to FIGURE 2. the transmission portion of an MRI system is shown. A pulse sequencer and
memory 18 applies a control signal Vc to afrequency synthesizer 10. In response to the V control signal, thefrequency synthesizer 10 applies an f transmit reference signal to atransmitter 12. where Fs is the center frequency of a transmitted radio frequency signal. Thetransmitter 12 produces a timed transmit Fs signal, which is coupled by way of a controlledtransmitter attenuator 14 to atransmitter amplifier 16. Thetransmitter 12 andattenuator 14 are controlled by control signals provided by a transmit/receivecontroller 20, which is under control of thepulse sequencer 18. The Fs signal is amplified by theamplifier 16 and applied to theRF coil 24 in themagnet 30 in the form of a sequence of pulses formed under control of the transmit/receivecontroller 20. TheRF coil 24 applies the F6 pulses to the subject being imaged. In order to synchronize the timings of the applied signals, timing control signals are also produced by thefrequency synthesizer 10 and coupled to the transmit/receive controller and the pulse sequencer online 19. - Also located within the field of the
magnet 30 are x, y, and z gradient coils 26, 28, and 29. These coils receive gradient control signals Gx, Gy, and G fromgradient signal amplifier 22. The control signals are provided by the transmit/receivecontroller 20. - Turning now to FIGURE 3, the NMR signals emitted by the nuclei of the material being imaged induce FR return signals in the
RF coil 24. These return signals are coupled by way of anRF matching network 25 to apre-amplifier 27, and on to areceiver attenuator 34. The receiver attenuator is controlled by the transmit/receivecontroller 20. The received Fi signals are amplified by anamplifier 36 and applied toquadrature phase detectors 42 and 44. The phase detectors receive two phase demodulating signals at respective 0° and 90° phase angles from aphase shifter 40, which receives reference signal fR from thefrequency synthesizer 10. Thephase detectors 42 and 44 produce a channel A and a channel B signal, respectively. The baseband channel A and B signals are filtered by respective low pass filters 46 and 48. and the filtered signals are then sampled by respective analog todigital converters pulse sequencer 18. The resultant channel A and channel B digital words are stored in the memory of acomputer 60. The computer andmemory 60 also exchanges information with the pulse sequencer andmemory 18 by way of adata link 68. The channel A and B digital words are processed. combined and transformed to the frequency domain by a Fouriertransform array processor 62. The resultant image signals are assembled in an image format by animage processor 64, and the processed image is displayed on a video monitor 66. - Referring now to FIGURE 4 a rectangular block of
material 70 which is to be imaged by the system of FIGURES 3 and 4 is shown. Four slices. A, B, C, and D, of the block are to be imaged using a multi-slice, multi-echo format. The coordinates of the block are as indicated by the x, y and z coordinate axes shown adjacent theblock 70. Oneface 172 of theblock 70 is specifically indicated. - FIGURE 5 shows waveforms for imaging the four slices of block 170. At the top of the FIGURE the
face 172 of the block is partially shown with reference to a z-directed gradient Gz. Slice B of the block is centered at the center, or null point of the Gz gradient field. The null point is the point at which the G gradient makes substantially no contribution to the static magnetic field (Gz -O). On either side of the null point the gradient field increases relatively positively or negatively. - Slice A is scanned first by applying a frequency selective 90° RF pulse 80 together with a slice selecting Gz gradient 84. The 90° pulse 80 exhibits a frequency characteristic ωA for spatial selection of slice A. A
preconditioning G gradient 102 is applied to the slice and one level of a level variable phase encoding Gy gradient 202 is applied to spatially encode the slice in the y direction. A frequency selective 180°RF pulse 82 is then applied to the block together with a Gz gradient 86, resulting in the later formation of aspin echo signal 88. Thespin echo signal 88 is sampled during asampling interval 304 in the presence of a frequency-encodingread gradient 104 for the x direction. G . - A second spin echo signal is acquired from slice A by applying one level of a second phase-encoding Gy gradient 205 to the block 170, followed by a second 180°
RF pulse 85 in the presence of Gz gradient 87. A second spin echo signal 89 develops and is sampled during asampling period 306 in the presence of a Gx gradient 106. The second Gy gradient 205 has a level chosen to provide twice the phase-encoding effect as the first Gy gradient 202, but in an opposite sense. This compensates for the phase reversal caused by the two 180°RF pulses - During this multi-echo scan of slice A, the frequency synthesizer of FIGURE 2 is receiving a V control signal from the
pulse sequencer 18 as indicated at the bottom of FIGURE 5. This control voltage causes the reference frequency produced by thefrequency synthesizer 10, fs, to be equal to a frequency fA as indicated in FIGURE 5. The reference signal for thetransmitter 12 is thereby set to fs=fA and the transmitted RF signal is centered about frequency f A. - Although the received NMR signals will be centered about a reference frequency fREF, corresponding to the null point of the G gradient field, they are demodulated by the phase detectors of FIGURE 3 by a reference signal fR=fA. This demodulating signal determines the spatial representation of the frequency-encoded signal information. In prior apparatus the receiver reference signal was frequency shifted for reception to the nominal reference frequency fREF, as indicated by the broken lines beneath the
frequency encoding gradients detectors 42 and 44, which unlock is indicated by the arrows on the broken lines at the bottom of FIGURE 5. The phase unlock results in erroneous phase-sensitive detection of the received NMR signals, and would also unlock the phase reference of the individual RF pulses in the multi-echo sequence. - The phase unlocking is prevented in apparatus of the present invention by maintaining the same control signal Vc for the
frequency synthesizer 10 during the entire transmit and receive cycle, as indicated by solid line fA in FIGURE 5. Thephase detector 42 and 44 receive reference signals which are still aligned in phase with the fs=fA reference used during transmission, as fs=fA=fR. The phase-encoded NMR signal information is thus accurately detected for precise image reconstruction. - But since the demodulating signal is at a frequency fR=fA instead of the fREF center of the received signal band, there is a shift of both the bandwidth and center frequency of the information which has been frequency-encoded in the x-direction. Unless this frequency shift is taken into consideration, there will be a spatial shift in the x direction of the reconstructed image of slice A relative to the positioning of the other slices. For instance, if the frequency shift is 1 KHz from fREF to fA and the image resolution is 100 Hz per image pixel, the image will be repositioned in the x direction by ten pixels. The repositioning can be either to the left or the right, depending upon whether fA is above or below f REF'
- Continuing on with FIGURE 5, a single echo scan is performed on slice B. Since this slice is centered in the gradient field, the V control signal for the
frequency synthesizer 10 sets f to fB, which is equal to the nominal fREF reference frequency. The reference frequency for thefrequency synthesizer 10 is thus equal to fS=fB=fREF. A 90° RF pulse 120 with a frequency spectral content of ωB and centered about f6 = fB is applied to block 170 in the presence of a Gz gradient 124. After this selection of slice B, a Gx gradient 108 and one level of the amplitude variable Gy gradient 208 are applied to the block for spatial encoding. A 180°RF pulse 122 with frequency spectral content uB is applied in the presence of Gz gradient 126, which results in the development of aspin echo signal 128. This signal is sampled duringsampling interval 310 in the presence of a Gxfrequency encoding gradient 110. Since the slice selection and sampling of the frequency encoded spin echo signal are both done at the nominal center frequency of fREF' this slice is effectively interrogated in the same manner as was done in the prior apparatus. The frequencies fs, fR and fB are all equal to fREF. - Slice C is selected next by applying a 90°
RF pulse 130 with a frequency spectral content of ωC to the block in the presence of a Gz gradient 134. For slice C, the V control signal is changed to a level so that the f6 signal of thefrequency synthesizer 18 is at a frequency fC as indicated at the bottom of FIGURE 5. This means that the transmitted RF signal Fs is centered about fC, and the reference signal for the phase detectors is equal to fR=fC. After the spatial encoding Gx andGy gradients selective RF pulse 132 is applied in the presence of a Gz gradient 136, the prior apparatus would have switched the Vc control signal back to the fREF level, as indicated by the broken line beneath the frequency encoding Gx gradient 114. However, in the present apparatus the phase unlocking resulting from such switching is prevented by maintaining the demodulating reference frequency at fR = f during this time. A spin echo signal 138 from slice C is thus phase detected in relation to the fC reference frequency during asampling interval 314 in the presence ofG gradient 114. - The fourth slice D is the slice most distant from the null point of the gradient field. Accordingly, the Vc control signal is switched to an even greater offset level as shown by the Vc line of FIGURE 5, causing the frequency synthesizer signal f to be offset to a frequency fD. The slice D is selected by applying a 90° RF pulse 140 with a frequency spectral content ωD and centered about frequency fD to the block 170 in the presence of Gz gradient 144.
A G gradient 116 and one level of Gy gradient 216 are applied to the block. followed by a frequency selective 180°RF pulse 142 which is applied in the presence of Gz gradient 146. The resultingspin echo signal 148 is sampled during aninterval 318 in the presence of frequency encoding Gx gradient 118 without switching the demodulating reference frequency to the fREF frequency as indicated by the dashed lines in the Vc signal line. - A scan of all four slices is completed at this point. The sequence of FIGURE 4 is then repeated numerous times, each with a variation of the level of the phase encoding Gy gradients 202-216, until sufficient iterations have been performed and signals gathered for Fourier transform image reconstruction of the four slices.
- The offsets caused by the changing Vc control signal and attendant frequency changes are illustrated in FIGURE 6. The nominal bandwidth of the received NMR signals when the demodulating reference frequency is reset to fREF during each sampling interval is indicated as BWREF, with a center frequency of fREF. However, when the reference frequency is maintained during both transmission and reception for phase detection stability, the detected NMR signals from the four slices occupy different bands as shown in the FIGURE. The bandwidth of the slice A signals is offset above the nominal band, as indicated by bandwidth BWA. Slice B. which is centered in the gradient field, has a bandwidth BWB which is aligned with the nominal band. The bands for slices C and D are offset below the nominal band, as indicated by bandwidths BWC and BWD. The four frequency bands are seen to occupy a total band extending from fL to fH, instead of the single, narrower BWREF band of the prior apparatus. In apparatus constructed in accordance with the present invention, the bandwidth from fL to fH is determined by the relative strengths (slopes) of the G and the G gradient fields for a given spacing of slices.
- To sample signals in the broader fL to fH band, a higher sampling frequency is needed than that used for the narrow BWREF band. The higher sampling frequency must satisfy the Nyquist criteria for sampling the broader band without creating aliasing artifacts in the band. The sampling frequency thus determined is the frequency of the fsample signal used for the analog to digital converters in FIGURE 3.
- As discussed above, there remains the problem of the apparent offset of the respective slice images in the frequency-encoded direction. This problem arises during image reconstruction processing of the acquired NMR signal information. In essence, the mathematical reconstruction algorithms are designed to anticipate that the image data will be confined to a single, predetermined frequency band with a known center frequency corresponding to the center of the image in the frequency-encoded direction. Offsets from the predetermined band and center frequency result in misregistration of the reconstructed image in this direction.
- In accordance with the principles of a further aspect of the present invention, this problem is overcome by filtering the NMR signal information prior to reconstruction. The filter function used is a function of the frequency offset used to establish the reference frequency for each slice.
- In a preferred embodiment of the present invention. the filter function is embodied in software used to process the NMR signal information. A measure of the frequency offset is retained in the computer and
memory 60 of FIGURE 3. The offset representative information is of the form (VREF-Vc), where VREF represents the control signal for the center frequency of the nominal frequency band BWREF, and Vc is the control signal used for acquisition of information from a particular slice . - The offset representative signal information is used to digitally filter the NMR signal information as illustrated by the flowchart of FIGURE 7. The flowcharted routine is executed by the computer and
memory 60 in processing the channel A and channel B NMR signal information. Retained in memory are parameters ZR. AC. NSL. GZ and Δt, where ZR1 is the separation range between the two end slices of the slices which are to be imaged: ZC is the location of the center slice along the slice separation direction with respect to the gradient null: NSL is the number of slices: GZ represents the strength of the slice selection gradient, in this example. G : and At is the time interval between sampling points of the analog to digital converters. Some of these parameter values are transferred between the computer andmemory 60 and the pulse sequencer andmemory 18 over thedata link 68, as are other values as discussed below. - Using the stored parameter values for a given NMR experiment, the computer calculates a value ΔZ = ZR/NSL, which determines the spacings between the slices. The center of the group of slices with respect to center of the z-gradient field is then used to determine the offset of the initial slice in the z-direction. Zl =-ZR/2+ZC. From these two calculations, the location of a given slice n is determined by Z(i) = (i-1)AZ+Z1.
- The results of the two previous calculations are used to determine the frequency offset for a given slice i, which is the difference between the fR reference frequency for slice i and fREF. This calculation multiplies the z spatial location of a slice i by the Gz gradient strength and by the gyromagnetic ratio for a given nuclear element in the NMR system, or Δf(i) = Z(i)*Gz*y. This frequency offset calculation is communicated to the pulse sequencer and
memory 18 over data link 68 where it translates directly into a value for V. The frequency offset is also used to correct the apparent left/right shift of the NMR signal information by digitally filtering the acquired data by sine and cosine terms of the frequency offset. - The NMR signal information in the form of the digitally detected A and B data values of the channel A and B lines is modified by calculating


Claims (10)
Priority Applications (1)
| Application Number | Priority Date | Filing Date | Title |
|---|---|---|---|
| AT86306320T ATE66075T1 (en) | 1985-08-16 | 1986-08-15 | PHASE-SENSITIVE DETECTION IN MULTILAYER SYSTEMS WITH NUCLEAR MAGNETIC RESONANCE. |
Applications Claiming Priority (2)
| Application Number | Priority Date | Filing Date | Title |
|---|---|---|---|
| US766617 | 1985-08-16 | ||
| US06/766,617 US4673880A (en) | 1985-08-16 | 1985-08-16 | Phase sensitive detection in multislice magnetic resonance imaging systems |
Publications (3)
| Publication Number | Publication Date |
|---|---|
| EP0219206A2 true EP0219206A2 (en) | 1987-04-22 |
| EP0219206A3 EP0219206A3 (en) | 1987-09-16 |
| EP0219206B1 EP0219206B1 (en) | 1991-08-07 |
Family
ID=25076989
Family Applications (1)
| Application Number | Title | Priority Date | Filing Date |
|---|---|---|---|
| EP86306320A Expired - Lifetime EP0219206B1 (en) | 1985-08-16 | 1986-08-15 | Phase sensitive detection in multislice magnetic resonance imaging systems |
Country Status (5)
| Country | Link |
|---|---|
| US (1) | US4673880A (en) |
| EP (1) | EP0219206B1 (en) |
| JP (1) | JP2608274B2 (en) |
| AT (1) | ATE66075T1 (en) |
| DE (1) | DE3680742D1 (en) |
Cited By (4)
| Publication number | Priority date | Publication date | Assignee | Title |
|---|---|---|---|---|
| EP0292064A1 (en) * | 1987-05-19 | 1988-11-23 | Koninklijke Philips Electronics N.V. | Apparatus for nuclear spin tomography with digitalized transmitter/receiver |
| EP0336479A2 (en) * | 1988-03-31 | 1989-10-11 | Philips Patentverwaltung GmbH | NMR spectrometer |
| US4951688A (en) * | 1988-09-01 | 1990-08-28 | Elscint Ltd. | Hyperthermic power delivery system |
| US6853190B2 (en) | 2001-10-25 | 2005-02-08 | Siemens Aktiengesellschaft | Method and apparatus for magnetic resonance imaging with simultaneous measurement of two neighboring slices |
Families Citing this family (15)
| Publication number | Priority date | Publication date | Assignee | Title |
|---|---|---|---|---|
| JPS62197048A (en) * | 1986-02-26 | 1987-08-31 | 横河メディカルシステム株式会社 | Nuclear magnetic resonance tomographic image pickup apparatus |
| US4847560A (en) * | 1986-08-15 | 1989-07-11 | Picker International, Inc. | Simultaneous multislice-multiangle images without saturation bands |
| DE3631039A1 (en) * | 1986-09-12 | 1988-03-24 | Philips Patentverwaltung | Nuclear spin tomography method and nuclear spin tomography for performing the method |
| EP0332634A4 (en) * | 1986-11-14 | 1991-03-20 | Fonar Corporation | Apparatus and method for multiple angle oblique magnetic resonance imaging |
| US4871966A (en) * | 1986-11-14 | 1989-10-03 | Fonar Corporation | Apparatus and method for multiple angle oblique magnetic resonance imaging |
| NL8700266A (en) * | 1987-02-04 | 1988-09-01 | Philips Nv | METHOD AND APPARATUS FOR SUPPRESSING COHERENT MALFUNCTIONS IN MAGNETIC RESONANCE SIGNALS |
| GB8702951D0 (en) * | 1987-02-10 | 1987-03-18 | Surrey Medical Imaging Systems | Nmr imaging |
| US4978918A (en) * | 1988-04-24 | 1990-12-18 | Mitsubishi Denki Kabushiki Kaisha | Magnetic resonance imaging method |
| US5560361A (en) * | 1994-01-31 | 1996-10-01 | General Electric Company | MRI system with time varying gradient during signal acquisition |
| US5529068A (en) * | 1994-06-16 | 1996-06-25 | The Regents Of The University Of California | Synchronized digital signal processor for MRI reception |
| US5739691A (en) * | 1995-11-28 | 1998-04-14 | The Regents Of The University Of California | Multi-frequency digital low pass filter for magnetic resonance imaging |
| CN100346171C (en) * | 2004-07-23 | 2007-10-31 | 华东师范大学 | Receiving method of nuclear magnetic resonance imaging signal |
| US7557575B2 (en) * | 2006-04-04 | 2009-07-07 | Kabushiki Kaisha Toshiba | Magnetic resonance imaging apparatus and magnetic resonance imaging method |
| DE102011080604B4 (en) * | 2011-08-08 | 2013-03-28 | Siemens Aktiengesellschaft | Operating method, computer program and control device for a magnetic resonance system with frequency-variable transmitting pulses and magnetic resonance system |
| CN110873856B (en) * | 2018-08-29 | 2022-08-09 | 西门子(深圳)磁共振有限公司 | Method and device for determining optimal magnetic resonance imaging scanning nesting mode |
Citations (2)
| Publication number | Priority date | Publication date | Assignee | Title |
|---|---|---|---|---|
| US766613A (en) | 1904-05-10 | 1904-08-02 | Isabel Greene | Theatrical appliance. |
| EP0134701A2 (en) | 1983-08-05 | 1985-03-20 | Technicare Corporation | Offset gradient fields in nuclear magnetic resonance imaging systems |
Family Cites Families (7)
| Publication number | Priority date | Publication date | Assignee | Title |
|---|---|---|---|---|
| US4015196A (en) * | 1974-04-05 | 1977-03-29 | National Research Development Corporation | Analysis of materials |
| US4297637A (en) * | 1978-07-20 | 1981-10-27 | The Regents Of The University Of California | Method and apparatus for mapping lines of nuclear density within an object using nuclear magnetic resonance |
| US4318043A (en) * | 1978-07-20 | 1982-03-02 | The Regents Of The University Of California | Method and apparatus for rapid NMR imaging of nuclear densities within an object |
| DE2951537A1 (en) * | 1979-12-20 | 1981-07-02 | Siemens AG, 1000 Berlin und 8000 München | TEMPERATURE METHOD |
| US4558278A (en) * | 1982-12-17 | 1985-12-10 | Picker International, Limited | Nuclear magnetic resonance methods and apparatus |
| DE3340523A1 (en) * | 1983-11-09 | 1985-05-15 | Siemens AG, 1000 Berlin und 8000 München | CORE SPIN TOMOGRAPHY UNIT |
| JPS60128339A (en) * | 1983-12-15 | 1985-07-09 | Mitsubishi Electric Corp | Magnetic field coil for nmr-ct |
-
1985
- 1985-08-16 US US06/766,617 patent/US4673880A/en not_active Expired - Fee Related
-
1986
- 1986-08-15 JP JP61190712A patent/JP2608274B2/en not_active Expired - Lifetime
- 1986-08-15 DE DE8686306320T patent/DE3680742D1/en not_active Expired - Fee Related
- 1986-08-15 AT AT86306320T patent/ATE66075T1/en active
- 1986-08-15 EP EP86306320A patent/EP0219206B1/en not_active Expired - Lifetime
Patent Citations (2)
| Publication number | Priority date | Publication date | Assignee | Title |
|---|---|---|---|---|
| US766613A (en) | 1904-05-10 | 1904-08-02 | Isabel Greene | Theatrical appliance. |
| EP0134701A2 (en) | 1983-08-05 | 1985-03-20 | Technicare Corporation | Offset gradient fields in nuclear magnetic resonance imaging systems |
Cited By (6)
| Publication number | Priority date | Publication date | Assignee | Title |
|---|---|---|---|---|
| EP0292064A1 (en) * | 1987-05-19 | 1988-11-23 | Koninklijke Philips Electronics N.V. | Apparatus for nuclear spin tomography with digitalized transmitter/receiver |
| EP0336479A2 (en) * | 1988-03-31 | 1989-10-11 | Philips Patentverwaltung GmbH | NMR spectrometer |
| EP0336479A3 (en) * | 1988-03-31 | 1991-01-02 | Philips Patentverwaltung GmbH | Nmr spectrometer |
| US4951688A (en) * | 1988-09-01 | 1990-08-28 | Elscint Ltd. | Hyperthermic power delivery system |
| US6853190B2 (en) | 2001-10-25 | 2005-02-08 | Siemens Aktiengesellschaft | Method and apparatus for magnetic resonance imaging with simultaneous measurement of two neighboring slices |
| DE10152734B4 (en) * | 2001-10-25 | 2005-12-29 | Siemens Ag | Apparatus and method for magnetic resonance imaging with simultaneous measurement of two adjacent layers |
Also Published As
| Publication number | Publication date |
|---|---|
| US4673880A (en) | 1987-06-16 |
| EP0219206B1 (en) | 1991-08-07 |
| ATE66075T1 (en) | 1991-08-15 |
| JPS6243549A (en) | 1987-02-25 |
| DE3680742D1 (en) | 1991-09-12 |
| EP0219206A3 (en) | 1987-09-16 |
| JP2608274B2 (en) | 1997-05-07 |
Similar Documents
| Publication | Publication Date | Title |
|---|---|---|
| US4673880A (en) | Phase sensitive detection in multislice magnetic resonance imaging systems | |
| US4843322A (en) | Method for producing multi-slice NMR images | |
| US5825185A (en) | Method for magnetic resonance spin echo scan calibration and reconstruction | |
| EP0445151B1 (en) | Reducing motion artifacts in nmr images | |
| EP0152879B1 (en) | Composite pulses for time reversal in nmr imaging | |
| US6841997B2 (en) | Magnetic resonance method and apparatus for generating respective images from spin ensembles exhibiting different chemical shift | |
| US5617028A (en) | Magnetic field inhomogeneity correction in MRI using estimated linear magnetic field map | |
| US6043651A (en) | Method for the phase correction of nuclear magnetic resonance signals | |
| US4859945A (en) | Optimized signal to noise ratio | |
| US5652516A (en) | Spectroscopic magnetic resonance imaging using spiral trajectories | |
| EP0144026A2 (en) | Apparatus and method of NMR imaging with off-center zoom scan | |
| EP0644437A1 (en) | Correction of read-gradient polarity in EPI and GRASE MRI | |
| FI84109B (en) | NMR imaging system in which field compensation is used | |
| JP3970371B2 (en) | MRI sequence | |
| EP0293085B1 (en) | Magnetic resonance imaging apparatus | |
| US5701074A (en) | Spectral component separation including unwrapping of the phase via a poisson equation utilizing a weighting map | |
| US5627469A (en) | Separation of fat and water magnetic resonance images | |
| US4616182A (en) | Nuclear magnetic resonance signal artifact removal | |
| EP0182267B1 (en) | A method for removing the effects of baseline error components in nmr imaging applications | |
| US4616183A (en) | Method for reducing baseline error components in NMR signals | |
| US4706027A (en) | Method for correcting phase errors in magnetic resonance imaging data | |
| WO2000002059A2 (en) | Method to reduce artefacts in the magnetic resonance image due to spurios magnetic signals | |
| EP0204569B1 (en) | Non-harmonic nmr spin echo imaging | |
| US4855679A (en) | Magnetic resonance studies of restricted volumes | |
| JP3183915B2 (en) | Magnetic resonance imaging equipment |
Legal Events
| Date | Code | Title | Description |
|---|---|---|---|
| PUAI | Public reference made under article 153(3) epc to a published international application that has entered the european phase |
Free format text: ORIGINAL CODE: 0009012 |
|
| AK | Designated contracting states |
Kind code of ref document: A2 Designated state(s): AT BE CH DE FR GB IT LI LU NL SE |
|
| PUAL | Search report despatched |
Free format text: ORIGINAL CODE: 0009013 |
|
| AK | Designated contracting states |
Kind code of ref document: A3 Designated state(s): AT BE CH DE FR GB IT LI LU NL SE |
|
| 17P | Request for examination filed |
Effective date: 19880219 |
|
| 17Q | First examination report despatched |
Effective date: 19900425 |
|
| GRAA | (expected) grant |
Free format text: ORIGINAL CODE: 0009210 |
|
| RAP1 | Party data changed (applicant data changed or rights of an application transferred) |
Owner name: SIEMENS AKTIENGESELLSCHAFT |
|
| AK | Designated contracting states |
Kind code of ref document: B1 Designated state(s): AT BE CH DE FR GB IT LI LU NL SE |
|
| PG25 | Lapsed in a contracting state [announced via postgrant information from national office to epo] |
Ref country code: SE Effective date: 19910807 Ref country code: LI Effective date: 19910807 Ref country code: CH Effective date: 19910807 Ref country code: BE Effective date: 19910807 Ref country code: AT Effective date: 19910807 |
|
| REF | Corresponds to: |
Ref document number: 66075 Country of ref document: AT Date of ref document: 19910815 Kind code of ref document: T |
|
| PG25 | Lapsed in a contracting state [announced via postgrant information from national office to epo] |
Ref country code: LU Free format text: LAPSE BECAUSE OF NON-PAYMENT OF DUE FEES Effective date: 19910831 |
|
| PGFP | Annual fee paid to national office [announced via postgrant information from national office to epo] |
Ref country code: NL Payment date: 19910831 Year of fee payment: 6 |
|
| REF | Corresponds to: |
Ref document number: 3680742 Country of ref document: DE Date of ref document: 19910912 |
|
| ET | Fr: translation filed | ||
| ITF | It: translation for a ep patent filed |
Owner name: STUDIO JAUMANN |
|
| REG | Reference to a national code |
Ref country code: CH Ref legal event code: PL |
|
| PLBE | No opposition filed within time limit |
Free format text: ORIGINAL CODE: 0009261 |
|
| STAA | Information on the status of an ep patent application or granted ep patent |
Free format text: STATUS: NO OPPOSITION FILED WITHIN TIME LIMIT |
|
| 26N | No opposition filed | ||
| PGFP | Annual fee paid to national office [announced via postgrant information from national office to epo] |
Ref country code: FR Payment date: 19920821 Year of fee payment: 7 |
|
| PG25 | Lapsed in a contracting state [announced via postgrant information from national office to epo] |
Ref country code: NL Effective date: 19930301 |
|
| NLV4 | Nl: lapsed or anulled due to non-payment of the annual fee | ||
| PG25 | Lapsed in a contracting state [announced via postgrant information from national office to epo] |
Ref country code: FR Effective date: 19940429 |
|
| REG | Reference to a national code |
Ref country code: FR Ref legal event code: ST |
|
| PGFP | Annual fee paid to national office [announced via postgrant information from national office to epo] |
Ref country code: GB Payment date: 19940718 Year of fee payment: 9 |
|
| PG25 | Lapsed in a contracting state [announced via postgrant information from national office to epo] |
Ref country code: GB Effective date: 19950815 |
|
| GBPC | Gb: european patent ceased through non-payment of renewal fee |
Effective date: 19950815 |
|
| PGFP | Annual fee paid to national office [announced via postgrant information from national office to epo] |
Ref country code: DE Payment date: 19971022 Year of fee payment: 12 |
|
| PG25 | Lapsed in a contracting state [announced via postgrant information from national office to epo] |
Ref country code: DE Free format text: LAPSE BECAUSE OF NON-PAYMENT OF DUE FEES Effective date: 19990601 |
|
| PG25 | Lapsed in a contracting state [announced via postgrant information from national office to epo] |
Ref country code: IT Free format text: LAPSE BECAUSE OF NON-PAYMENT OF DUE FEES;WARNING: LAPSES OF ITALIAN PATENTS WITH EFFECTIVE DATE BEFORE 2007 MAY HAVE OCCURRED AT ANY TIME BEFORE 2007. THE CORRECT EFFECTIVE DATE MAY BE DIFFERENT FROM THE ONE RECORDED. Effective date: 20050815 |