EP0212660A2 - Method for quantitative analysis of analyte in liquid sample using analytical element - Google Patents
Method for quantitative analysis of analyte in liquid sample using analytical element Download PDFInfo
- Publication number
- EP0212660A2 EP0212660A2 EP86111800A EP86111800A EP0212660A2 EP 0212660 A2 EP0212660 A2 EP 0212660A2 EP 86111800 A EP86111800 A EP 86111800A EP 86111800 A EP86111800 A EP 86111800A EP 0212660 A2 EP0212660 A2 EP 0212660A2
- Authority
- EP
- European Patent Office
- Prior art keywords
- analytical
- analyte
- elements
- optical reflection
- liquid sample
- Prior art date
- Legal status (The legal status is an assumption and is not a legal conclusion. Google has not performed a legal analysis and makes no representation as to the accuracy of the status listed.)
- Withdrawn
Links
Images


Classifications
-
- C—CHEMISTRY; METALLURGY
- C12—BIOCHEMISTRY; BEER; SPIRITS; WINE; VINEGAR; MICROBIOLOGY; ENZYMOLOGY; MUTATION OR GENETIC ENGINEERING
- C12Q—MEASURING OR TESTING PROCESSES INVOLVING ENZYMES, NUCLEIC ACIDS OR MICROORGANISMS; COMPOSITIONS OR TEST PAPERS THEREFOR; PROCESSES OF PREPARING SUCH COMPOSITIONS; CONDITION-RESPONSIVE CONTROL IN MICROBIOLOGICAL OR ENZYMOLOGICAL PROCESSES
- C12Q1/00—Measuring or testing processes involving enzymes, nucleic acids or microorganisms; Compositions therefor; Processes of preparing such compositions
- C12Q1/58—Measuring or testing processes involving enzymes, nucleic acids or microorganisms; Compositions therefor; Processes of preparing such compositions involving urea or urease
-
- C—CHEMISTRY; METALLURGY
- C12—BIOCHEMISTRY; BEER; SPIRITS; WINE; VINEGAR; MICROBIOLOGY; ENZYMOLOGY; MUTATION OR GENETIC ENGINEERING
- C12Q—MEASURING OR TESTING PROCESSES INVOLVING ENZYMES, NUCLEIC ACIDS OR MICROORGANISMS; COMPOSITIONS OR TEST PAPERS THEREFOR; PROCESSES OF PREPARING SUCH COMPOSITIONS; CONDITION-RESPONSIVE CONTROL IN MICROBIOLOGICAL OR ENZYMOLOGICAL PROCESSES
- C12Q1/00—Measuring or testing processes involving enzymes, nucleic acids or microorganisms; Compositions therefor; Processes of preparing such compositions
- C12Q1/54—Measuring or testing processes involving enzymes, nucleic acids or microorganisms; Compositions therefor; Processes of preparing such compositions involving glucose or galactose
-
- G—PHYSICS
- G01—MEASURING; TESTING
- G01N—INVESTIGATING OR ANALYSING MATERIALS BY DETERMINING THEIR CHEMICAL OR PHYSICAL PROPERTIES
- G01N21/00—Investigating or analysing materials by the use of optical means, i.e. using sub-millimetre waves, infrared, visible or ultraviolet light
- G01N21/17—Systems in which incident light is modified in accordance with the properties of the material investigated
- G01N21/25—Colour; Spectral properties, i.e. comparison of effect of material on the light at two or more different wavelengths or wavelength bands
- G01N21/27—Colour; Spectral properties, i.e. comparison of effect of material on the light at two or more different wavelengths or wavelength bands using photo-electric detection ; circuits for computing concentration
- G01N21/274—Calibration, base line adjustment, drift correction
-
- G—PHYSICS
- G01—MEASURING; TESTING
- G01N—INVESTIGATING OR ANALYSING MATERIALS BY DETERMINING THEIR CHEMICAL OR PHYSICAL PROPERTIES
- G01N33/00—Investigating or analysing materials by specific methods not covered by groups G01N1/00 - G01N31/00
- G01N33/48—Biological material, e.g. blood, urine; Haemocytometers
- G01N33/50—Chemical analysis of biological material, e.g. blood, urine; Testing involving biospecific ligand binding methods; Immunological testing
- G01N33/52—Use of compounds or compositions for colorimetric, spectrophotometric or fluorometric investigation, e.g. use of reagent paper and including single- and multilayer analytical elements
- G01N33/525—Multi-layer analytical elements
-
- G—PHYSICS
- G01—MEASURING; TESTING
- G01N—INVESTIGATING OR ANALYSING MATERIALS BY DETERMINING THEIR CHEMICAL OR PHYSICAL PROPERTIES
- G01N21/00—Investigating or analysing materials by the use of optical means, i.e. using sub-millimetre waves, infrared, visible or ultraviolet light
- G01N21/17—Systems in which incident light is modified in accordance with the properties of the material investigated
- G01N21/47—Scattering, i.e. diffuse reflection
- G01N21/4738—Diffuse reflection, e.g. also for testing fluids, fibrous materials
-
- G—PHYSICS
- G01—MEASURING; TESTING
- G01N—INVESTIGATING OR ANALYSING MATERIALS BY DETERMINING THEIR CHEMICAL OR PHYSICAL PROPERTIES
- G01N21/00—Investigating or analysing materials by the use of optical means, i.e. using sub-millimetre waves, infrared, visible or ultraviolet light
- G01N21/84—Systems specially adapted for particular applications
- G01N21/8483—Investigating reagent band
Definitions
- This invention relates to a method for quantitative analysis of an analyte in a liquid sample using an analytical element. More particularly, this invention relates to an improvement in a method for quantitatively analyzing an analyte in a liquid sample by applying the liquid sample on one of a set of analytical elements and measuring a color developed in the analytical element through reflection photometory in which said set of analytical elements are the same elements as a standard element except for deviation of sensitivity to the analyte, but said deviation of sensitivity is essentially equivalent to each other among the set of analytical elements, the calibration curve of the standard element with respect to said analyte being predetermined.
- analyte i.e., a substance to be analyzed
- a reaction-in-solution system involving a homogeneous reaction in a dilute solution and a procedure of measuring a light transmitted through the solution.
- This system gives analytical data with high accuracy, so long as the system is conducted by a skilled operator using a long period of time.
- the quantitative determination of an analyte in a liquid sample is performed by applying the liquid sample on the analytical element and measuring a color developed in the element through reflection photometry. It is known that the relationship between a content of an analyte in an applied liquid sample and the optical reflection density value observed on the color development due to the application of the liquid sample does not follow Beer's law, while the relationship between a content of an analyte in a liquid sample and the transmittance value observed on the color development in a solution due to the introduction of the liquid sample does follow such law.
- a calibration curve which shows the relationship between a content of an analyte in an applied liquid sample and the optical reflection density to be observed on the color development due to the application of the liquid sample is ought to be predetermined for each kind of analytical element.
- the same calibration curve is applicable to all analytical systems involving the same analyte and analytical elements belonging to the same nature, for example, those having the same composition.
- the compositions of the analytical elements slightly vary depending upon the conditions of their pre parations. Otherwise, even if analytical elements having the almost the same compositions are prepared, the analytical elements are apt to be denatured slightly in the course of their storage under influence of light, heat, humidity and so on.
- 58(1983)-109837 teaches a method for adjusting a predetermined calibration curve which comprises a step of measuring an absorbance for at least one sample having a known concentration and a step of adjusting the calibration curve based on the measured absorbance and the absorbance corresponding to the sample having the same concentration, the latter absorbance being obtained using the predetermined calibration curve.
- This adjusting method is very simple but is only applicable to a measuring system based on measurement of transmitted light.
- the measuring system utilizing transmission of light follows the Beer's law
- the relationship between the concentration or content of an analyte in a sample and the optical transmission density can be expressed by a linear equation.
- This means that such relationship can be expressed by a straight line in a graph. Accordingly, the deviation of the sensitivity of the transmittance-measuring sustem can be easily adjusted by such simple method.
- the present inventors have studied reflection photometry with respect to quantitative analysis using analytical elements and discovered that there is a linear relationship between an optical reflection density on a color developed upon application of a liquid sample on a standard analytical element and an optical reflection density on a color developed upon application of the same liquid sample on a deviated analytical element.
- the term "deviated analytical element” means an analytical element having essentially the same composition as the standard analytical element but having a sensitivity to an analyte to be detected which is different from the corresponding sensitivity of the standard analytical element. Such difference in the sensitivity is generally caused by variation or fluctuation of the conditions of the preparation of analytical elements or denaturation of the analytical element in the course of their storage under influence of light, heat, humidity and so on.
- an improvement in a method for quantitatively analyzing an analyte in a liquid sample by applying the liquid sample on one of a set of analytical elements and measuring a color developed in the analytical element through reflection photometory in which said set of analytical elements are the same elements as a standard element except for deviation of sensitivity to the analyte, but said deviation of sensitivity is essentially equivalent to each other among the set of analytical elements, the calibration curve of the standard element with respect to said analyte being predetermined, the improvement comprising the steps of:
- the first step (I) and the second step (II) are steps for determining the relationship between the sensitivity of the standard analytical element and the sensitivity of the analytical elements to be calibrated.
- the first step comprises applying two standard solutions containing the analyte in contents C1 and C2 different from each other on two analytical elements, respectively, these analytical elements being selected from said set of analytical elements and measuring colors developed on the elements through reflection photometry to obtain optical reflection density values OD x1 and OD x2 , respectively.
- the analytical element to be employed in the method of the present invention there is no specific limitation with respect to the analytical element to be employed in the method of the present invention, so long as the element is subjected to reflection photometry.
- the analytical element there can be mentioned multilayer analytical elements supplied by Eastman Kodak under the tradename of Ektachem and multilayer analytical elements by Fuji Photo Film Co., Ltd. under the tradename of Drychem.
- the method of the inven tion can be utilized to quantitatively determine glucose content, total protein content, urea-nitrogen (BUN) content, bilirubin content, contents of other substances, amylase activity, alkaline phosphotase activity, and activities of other enzymes in a liquid sample such as whole blood, serum, plasma, saliva, urine, or the like.
- BUN urea-nitrogen
- the first step two analytical elements are taken out of a set of analytical elements. All of the analytical elements belonging to the above-mentioned set are considered to have the equivalent composition and the equivalent sensitivity to an analyte to be analyzed to each other. Accordingly, any two elements can be selected from the set of the analytical elements. Alternatively, three analytical elements can be employed. In this case, the third analytical element is employed for obtaining an average value in combination with the first or sencond element. In the same way, more than three analytical elements can be employed in this stage.
- the standard solutions employed in this stage contain different amounts of the same analyte (contents are identified by C1 and C2, respectively) as the analyte of the analytical system under consideration.
- the composition of the standard solution other than the analyte can be the same as or different from the composition of the liquid sample to be analyzed, so long as the content of the analyte in the standard solution is known.
- the standard solution can be a serum containing a known amount of the analyte or a commercially available standard solution such as those supplied under tradenames of Monitol and Versatol.
- the standard solution preferably is the equivalent or as similar as possible in the physical characteristics such as viscosity to the liquid sample to be analyzed.
- the second step comprises preparing a linear equation for defining a relationship between an optical reflection density value OD x to be measured on an analytical element belonging to the above-mentioned set of the analytical elements and an optical reflection density value OD s being predetermined on the standard analytical element.
- the optical reflection density values OD x and OD s are those to be determined on colors developed on the respective elements upon application of a liquid sample containing the analyte in the same content C x .
- the preparation of the linear equation is made utilizing the calibration curve on the standard analytical element and the optical reflection density values OD x1 and OD x2 obtained in the step (I).
- the abovementioned linear equation is preferably stored either in the form of the functional equation or a graph in a memory of a computer for determining the desired results precise strictlyly within a short time of period.
- the third step and the fourth step are steps for actually analyzing a liquid sample containing a unknown amount of the analyte using the deviated analytical element.
- the third step comprises applying a liquid sample containing the analyte in a unknown amount on an analytical element belonging to the above-mentioned set of deviated analytical elements and measuring a color developed on said element through reflection photometry to obtain an optical reflection density value.
- the measurement of the color developed on the element through reflection photometrrt can be done in the known way.
- the fourth step comprises determining the content of the analyte in the applied liquid sample according to the above-prepared linear equation and the predetermined calibration curve.
- the determination of the content of the analyte in the applied liquid sample is done based on the linear equation prepared in the step (II) and the calibration curve predetermined on the standard analytical element.
- the optical reflection density value measured on the deviated analytical element is in the first place converted into an optical reflection density value of the standard analytical element, in which the latter value is positively or negatively deviated from the former value.
- the latter optical reflection density value obtained upon the conversion is then converted into a content of the analyte in the applied liquid sample according to the calibration curve previously determined on the standard analytical element.
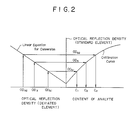
- the axis of abscissa on the left side indicates an optical reflection density measured on a deviated analytical element and the axis of abscissa on the right side indicates a content of the analyte in a liquid sample.
- the axis of ordinate indicates an optical reflection density to be measured on the standard analytical element.
- the curved line on the right side is the calibration curve prepared on the standard analytical element, and the straight line on the left side is the line representing the linear equation prepared in the second step.
- the conversion from the optical reflection density value OD x measured on the deviated analytical element to the content of the analyte C x in the applied liquid sample is easily made actually or imaginarily via the optical reflection density value OD s .
- the present invention is further decribed by the following example.
- a set of slides for glucose analysis each containing an integral multilayer analytical element for quantitative analysis of glucose were prepared according to the Example 1 described in Japanese Patent Provisional Publication No. 59(1984)-20853. A half of the set of the slides were stored for 24 hours at 30°C and 70%RH to denature the analytical elements.
- optical reflection density values of the original slide and the denatured slide were measured with no application of sample.
- the original slide gave an optical reflection density of 0.221, while the denatured slide gave an optical reflection density of 0.250.
- the measured optical reflection density values were converted into the optical reflection density values for the original slide in accordance with the above-mentioned linear equation, and then converted into the glucose content in accordance with a calibration curve previously determined using the original slide and standard liquid samples each containing a known amount of glucose.
- the results are set forth in Table 1 in the column (1).
- the values set forth in Table 1 in the column (2) are glucose content values obtained directly by calculation from the observed reflection density values in the manner applicable to the measuring system based on the measurement of transmitted light.
- the values set forth in Table 1 in the column (3) are glucose content values determined according to a standard solution system, namely, Hexokinase method.
- the reagent layer was wetted with water, and on the wetted layer was placed under pressure a tricot-knitted cloth (thickness: 200 ⁇ m) of polyethylene terephthalate spun yarn (thickness corresponding to 100 S) to form a spreading layer.
- a tricot-knitted cloth thickness: 200 ⁇ m
- polyethylene terephthalate spun yarn thickness corresponding to 100 S
- the integral multilayer analytical element was cut to give a square tip (15 mm x 15 mm) and encased in a plastic mount disclosed in Japanese Patent Provisional Publication No. 57(1981)-63452 to prepare an analytical slide for quantitative analysis of total protein.
- the values on the line with the asterisk * mean the optical reflection density values (fog values) before receiving the spotting of the sample.
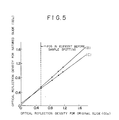
- Fig. 5 clearly indicates that the relationship between the optical reflection density (X) for the original slide and the optical reflection density (Y) for the denatured slide is also expressed by a straight line in the case of an integral multilayer analytical element for quantitative analysis of total protein.
- PET polyethylene terephthalate
- a membrane filter of cellulose diacetate having thickness of 140 ⁇ m (minimum pore size: 3.0 ⁇ m, void ratio: 75%) was immersed in a solution of silicone resin in hexane and dried.
- liquid-blocking layer On the liquid-blocking layer were coated successively the following coating solutions to form a urease-containing reagent layer, a light-blocking layer and an adhesive layer.
- the above coating solution was adjusted to pH 8 by addition of disodium orthophosphate and sodium hydroxide.
- the adhesive layer was swollen with water, and on the swollen layer was placed under pressure a cotton broadcloth (thickness: approx. 150 ⁇ m, cotton broadcloth #100) to form a spreading layer.
- a cotton broadcloth thinness: approx. 150 ⁇ m, cotton broadcloth #100
- the integral multilayer analytical element was cut to give a square tip and encased in a plastic mount to prepare an analytical slide for quantitative analysis of BUN.
- Fig. 6 clearly indicates that the relationship between the optical reflection density (X) for the original slide and the optical reflection density (Y) for the denatured slide is also expressed by a straight line in the case of an integral multilayer analytical element for quantitative analysis of BUN.
- Human serums containing different amounts of urea were separately spotted on the above slides.
- the spotted slides were incubated, and the optical reflection density on the element was measured.
- Fig. 7 clearly indicates that the relationship between the optical reflection density values for the slides belonging to different lots is also expressed by a straight line in the case of an integral multilayer analytical element for quantitative analysis of BUN.
Abstract
Description
- This invention relates to a method for quantitative analysis of an analyte in a liquid sample using an analytical element. More particularly, this invention relates to an improvement in a method for quantitatively analyzing an analyte in a liquid sample by applying the liquid sample on one of a set of analytical elements and measuring a color developed in the analytical element through reflection photometory in which said set of analytical elements are the same elements as a standard element except for deviation of sensitivity to the analyte, but said deviation of sensitivity is essentially equivalent to each other among the set of analytical elements, the calibration curve of the standard element with respect to said analyte being predetermined.
- As a method for quantitative analysis of an analyte (i.e., a substance to be analyzed) in a liquid sample, there has been generally employed a reaction-in-solution system involving a homogeneous reaction in a dilute solution and a procedure of measuring a light transmitted through the solution. This system gives analytical data with high accuracy, so long as the system is conducted by a skilled operator using a long period of time.
- In the field of clinical tests, however, an analytical system which can be operated more simply and more rapidly is strongly requested by people concerned, such as medical doctors.
- In answer to the above-mentioned request, a dry analytical system using an analytical element in the form of a sheet containing a dry reagent responsive to the analyte has been proposed to replace the above analytical system involving the reaction in a solution. In particular, a multilayer analytical element comprising a number of laminated layers in the element has been paid attention.
- In the dry analytical system, the quantitative determination of an analyte in a liquid sample is performed by applying the liquid sample on the analytical element and measuring a color developed in the element through reflection photometry. It is known that the relationship between a content of an analyte in an applied liquid sample and the optical reflection density value observed on the color development due to the application of the liquid sample does not follow Beer's law, while the relationship between a content of an analyte in a liquid sample and the transmittance value observed on the color development in a solution due to the introduction of the liquid sample does follow such law. Accordingly, in the case that the reflection photometry is employed in the analysis, a calibration curve which shows the relationship between a content of an analyte in an applied liquid sample and the optical reflection density to be observed on the color development due to the application of the liquid sample is ought to be predetermined for each kind of analytical element.
- Generally, the same calibration curve is applicable to all analytical systems involving the same analyte and analytical elements belonging to the same nature, for example, those having the same composition. However, in practice, the compositions of the analytical elements slightly vary depending upon the conditions of their pre parations. Otherwise, even if analytical elements having the almost the same compositions are prepared, the analytical elements are apt to be denatured slightly in the course of their storage under influence of light, heat, humidity and so on. Accordingly, if a precise quantitative determination is intended, it is preferred to prepare a calibration curve on each set of the analytical elements, in which the analytical elements in one set are considered to have essentially the same composition and the same sensitivity to the analyte because these elements were prepared under the same conditions and have been stored under the same conditions. The procedure of the preparation of a calibration curve for each set of analytical elements is time-consuming and accordingly is not advantageous in the practical operation.
- As is described in the above, the quantitative analysis based on the reaction-in-solution, namely wet system, follows the Beer's law. Accordingly, it is known that a calibration curve determined on a standard analytical element is well applicable with simple adjustment to an analytical element which is deviated with respect to the composition and sensitivity in the course of its preparation and/or its storage. For instance, Japanese Patent Provisional Publication No. 58(1983)-109837 teaches a method for adjusting a predetermined calibration curve which comprises a step of measuring an absorbance for at least one sample having a known concentration and a step of adjusting the calibration curve based on the measured absorbance and the absorbance corresponding to the sample having the same concentration, the latter absorbance being obtained using the predetermined calibration curve. This adjusting method is very simple but is only applicable to a measuring system based on measurement of transmitted light.
- In more detail, since the measuring system utilizing transmission of light follows the Beer's law, the relationship between the concentration or content of an analyte in a sample and the optical transmission density can be expressed by a linear equation. This means that such relationship can be expressed by a straight line in a graph. Accordingly, the deviation of the sensitivity of the transmittance-measuring sustem can be easily adjusted by such simple method.
- In contrast, such simple adjusting method is not applicable to the measuring system based on reflection photometry, because the relationship between the concentration or content of an analyte in a sample and the optical reflection density is expressed not by a linear equation but by a very complicated equation. This means that such relationship can be expressed not by a straight line but by a curve in a graph. An example of such curve is illustrated in the attached Fig. 1. In Fig. 1, a calibration curve for a standard analytical element for glucose analysis in the form of an integral multilayer element which indicates a relationship between a glucose content in serum and an optical reflection density value is illustrated by the solid curve. The dotted curve in Fig. 1 shows a calibration curve for an analytical element which is deviated in the sensitivity to glucose from the standard element. As is understood from the curves, it is very difficult to determine the relationship between the calibration curve for the standard analytical element and the calibration curve for the deviated analytical element. Accordingly, the deviation of the sensitivity of the measuring system based on reflection photometry cannot be adjusted by the above-mentioned simple method disclosed in the prior art.
- As to the relationship between the transmittance and reflectance in photographic color prints, F.C. Williams and F.R. Clapper have proposed in Journal of the Optical Society of America, Vol. 43, No. 7, 595-599(July, 1953) a conversion equation, but the proposed conversion equation is extremely complicated using a number of parameters. Accordingly, it is not easy to utilize the proposed conversion equation in analytical systems to be performed in practice.
- The present inventors have studied reflection photometry with respect to quantitative analysis using analytical elements and discovered that there is a linear relationship between an optical reflection density on a color developed upon application of a liquid sample on a standard analytical element and an optical reflection density on a color developed upon application of the same liquid sample on a deviated analytical element. The term "deviated analytical element" means an analytical element having essentially the same composition as the standard analytical element but having a sensitivity to an analyte to be detected which is different from the corresponding sensitivity of the standard analytical element. Such difference in the sensitivity is generally caused by variation or fluctuation of the conditions of the preparation of analytical elements or denaturation of the analytical element in the course of their storage under influence of light, heat, humidity and so on.
- Accordingly, it is an object of the present invention to provide a method for quantitative analysis of an analyte in a liquid sample using an analytical element which is slightly deviated in its sensitivity to the analyte from a standard analytical element.
- It is another object of the invention to provide a simple method for performing quantitative analysis of an analyte in a liquid sample using an analytical element which is slightly deviated in its sensitivity to the analyte from a standard analytical element.
- There is provided by the present invention an improvement in a method for quantitatively analyzing an analyte in a liquid sample by applying the liquid sample on one of a set of analytical elements and measuring a color developed in the analytical element through reflection photometory in which said set of analytical elements are the same elements as a standard element except for deviation of sensitivity to the analyte, but said deviation of sensitivity is essentially equivalent to each other among the set of analytical elements, the calibration curve of the standard element with respect to said analyte being predetermined, the improvement comprising the steps of:
- (I) applying two standard solutions containing the analyte in contents C₁ and C₂ different from each other on two analytical elements, respectively, these analytical elements being selected from said set of analytical elements, and measuring colors developed on the elements through reflection photometry to obtain optical reflection density values OD₁ and OD₂, respectively;
- (II) preparing a linear equation for defining a relationship between an optical reflection density value ODx to be measured on an analytical element belonging to said set of the analytical elements and an optical reflection density value ODs being predetermined on the standard analytical element, in which the optical reflection density values ODx and ODs are those to be determined on colors developed on the respective elements upon application of a liquid sample containing the analyte in the same content Cx, the preparation being made utilizing the calibration curve and the optical reflection density values ODx1 and ODx2 obtained in the step (I);
- (III) applying a liquid sample containing the analyte in a unknown on an analytical element belonging to said set of analytical elements, and measuring a color developed on said element through reflection photometry to obtain an optical reflection density value; and
- (IV) determining the content of the analyte in the applied liquid sample according to the above-prepared linear equation and the predetermined calibration curve.
-
- Fig. 1 shows calibration curves for a relationship between glucose content in serum and optical reflection density measured on color developed in an analytical element having received the serum sample.
- Fig. 2 illustrates the procedure of conversion of an optical reflection density observed on a deviated analytical element into the content of the analyte in the applied liquid sample for quantitative analysis.
- Fig. 3 illustrates a relationship for an analytical element for glucose analysis between an optical reflection density for an original slide and an optical reflection density for a denatured slide.
- Fig. 4 illustrates a relationship for an analytical element for glucose analysis between an optical reflection density values for elements belonging to different lots.
- Fig. 5 illustrates relationships for an analytical element for BUN analysis between an optical reflection density for an original element and an optical reflection density for denatured elements.
- Fig. 6 illustrates other relationships for an analytical element for BUN analysis between an optical reflection density for an original element and an optical reflection density for denatured elements.
- Fig. 7 illustrates a relationship for an analytical element for BUN analysis between an optical reflection density values for elements belonging to different lots.
- The analytical method of the present invention comprises the aforementioned four steps. Each step is described in more detail below.
- The first step (I) and the second step (II) are steps for determining the relationship between the sensitivity of the standard analytical element and the sensitivity of the analytical elements to be calibrated.
- The first step comprises applying two standard solutions containing the analyte in contents C₁ and C₂ different from each other on two analytical elements, respectively, these analytical elements being selected from said set of analytical elements and measuring colors developed on the elements through reflection photometry to obtain optical reflection density values ODx1 and ODx2, respectively.
- There is no specific limitation with respect to the analytical element to be employed in the method of the present invention, so long as the element is subjected to reflection photometry. For instance, there can be mentioned multilayer analytical elements supplied by Eastman Kodak under the tradename of Ektachem and multilayer analytical elements by Fuji Photo Film Co., Ltd. under the tradename of Drychem.
- There is also no specific limitation with respect to the analyte to be detected by the use of the method of the present invention. For instance, the method of the inven tion can be utilized to quantitatively determine glucose content, total protein content, urea-nitrogen (BUN) content, bilirubin content, contents of other substances, amylase activity, alkaline phosphotase activity, and activities of other enzymes in a liquid sample such as whole blood, serum, plasma, saliva, urine, or the like.
- In the first step, two analytical elements are taken out of a set of analytical elements. All of the analytical elements belonging to the above-mentioned set are considered to have the equivalent composition and the equivalent sensitivity to an analyte to be analyzed to each other. Accordingly, any two elements can be selected from the set of the analytical elements. Alternatively, three analytical elements can be employed. In this case, the third analytical element is employed for obtaining an average value in combination with the first or sencond element. In the same way, more than three analytical elements can be employed in this stage.
- The standard solutions employed in this stage contain different amounts of the same analyte (contents are identified by C₁ and C₂, respectively) as the analyte of the analytical system under consideration. The composition of the standard solution other than the analyte can be the same as or different from the composition of the liquid sample to be analyzed, so long as the content of the analyte in the standard solution is known. For example, in the case the liquid sample to be analyzed is a whole blood or serum, the standard solution can be a serum containing a known amount of the analyte or a commercially available standard solution such as those supplied under tradenames of Monitol and Versatol. The standard solution preferably is the equivalent or as similar as possible in the physical characteristics such as viscosity to the liquid sample to be analyzed.
- The colors developed on both elements are then measured through reflection photometry to obtain optical reflection density values OD₁ and OD₂, respectively.
- The second step comprises preparing a linear equation for defining a relationship between an optical reflection density value ODx to be measured on an analytical element belonging to the above-mentioned set of the analytical elements and an optical reflection density value ODs being predetermined on the standard analytical element. The optical reflection density values ODx and ODs are those to be determined on colors developed on the respective elements upon application of a liquid sample containing the analyte in the same content Cx. The preparation of the linear equation is made utilizing the calibration curve on the standard analytical element and the optical reflection density values ODx1 and ODx2obtained in the step (I).
- The linear equation can be given in the form of:
ODx = A·ODs + B
in which A and B are constant values obtained from the equations:
ODx1 = A·OXs1 + B
ODx2 = A·OXs2 + B
in which OXx1 is as defined above and OXs1 is an optical reflection density value to be determined on the standard analytical element upon application of a liquid sample containing the analyte in the content Cx1, and OXx2 is as defined above and OXs2 is an optical reflection density value to be determined on the standard analytical element upon application of a liquid sample containing the analyte in the content Cx2. - In the second step, the linear equation is given by the functional equation as above or expressed graphically.
- In the practical analytical procedure, the abovementioned linear equation is preferably stored either in the form of the functional equation or a graph in a memory of a computer for determining the desired results precisely within a short time of period.
- The third step and the fourth step are steps for actually analyzing a liquid sample containing a unknown amount of the analyte using the deviated analytical element.
- The third step comprises applying a liquid sample containing the analyte in a unknown amount on an analytical element belonging to the above-mentioned set of deviated analytical elements and measuring a color developed on said element through reflection photometry to obtain an optical reflection density value.
- The measurement of the color developed on the element through reflection photometrrt can be done in the known way.
- The fourth step comprises determining the content of the analyte in the applied liquid sample according to the above-prepared linear equation and the predetermined calibration curve.
- The determination of the content of the analyte in the applied liquid sample is done based on the linear equation prepared in the step (II) and the calibration curve predetermined on the standard analytical element. In this determination, the optical reflection density value measured on the deviated analytical element is in the first place converted into an optical reflection density value of the standard analytical element, in which the latter value is positively or negatively deviated from the former value. The latter optical reflection density value obtained upon the conversion is then converted into a content of the analyte in the applied liquid sample according to the calibration curve previously determined on the standard analytical element.
- The above conversion procedures are described in more detail by referring to Fig. 2.
- In Fig. 2, the axis of abscissa on the left side indicates an optical reflection density measured on a deviated analytical element and the axis of abscissa on the right side indicates a content of the analyte in a liquid sample. The axis of ordinate indicates an optical reflection density to be measured on the standard analytical element. The curved line on the right side is the calibration curve prepared on the standard analytical element, and the straight line on the left side is the line representing the linear equation prepared in the second step.
- In Fig. 2, the relationships among the optical reflection density values ODx1 and ODx2 measured on the deviated analytical elements, the optical reflection density vlaues ODs1 and ODs2 obtained respectively upon the above-mentioned conversion, and the contents of the analyte Cx1 and Cx2 in the applied liquid samples are clear.
- Thus, the conversion from the optical reflection density value ODx measured on the deviated analytical element to the content of the analyte Cx in the applied liquid sample is easily made actually or imaginarily via the optical reflection density value ODs.
- The present invention is further decribed by the following example.
- A set of slides for glucose analysis each containing an integral multilayer analytical element for quantitative analysis of glucose were prepared according to the Example 1 described in Japanese Patent Provisional Publication No. 59(1984)-20853. A half of the set of the slides were stored for 24 hours at 30°C and 70%RH to denature the analytical elements.
- The optical reflection density values of the original slide and the denatured slide were measured with no application of sample. The original slide gave an optical reflection density of 0.221, while the denatured slide gave an optical reflection density of 0.250.
- Four liquid samples containing glucose in different amounts within 50 to 600 mg/dℓ were spotted on each of the original slide and the denatured slide, and the optical reflection density values were measured after the slides were incubated.
- The results are illustrated in Fig. 3, wherein the aixs of abscissa indicates an optical reflection density for the original slide and the axis of ordinate indicates an optical reflection density for the denatured slide.
- Fig. 3 clearly indicates that the relationship between the optical reflection density (X) for the original slide and the optical reflection density (Y) for the denatured slide is expressed by the straight line according to the following linear equation:
Y = 0.724X + 0.187
r = 0.996
N = 4. - Four liquid samples each containing an unknown amount of glucose were spotted on the four denatured slides, and the optical reflection density values were measured after the slides were incubated. The measured optical reflection density values were converted into the optical reflection density values for the original slide in accordance with the above-mentioned linear equation, and then converted into the glucose content in accordance with a calibration curve previously determined using the original slide and standard liquid samples each containing a known amount of glucose. The results are set forth in Table 1 in the column (1). The values set forth in Table 1 in the column (2) are glucose content values obtained directly by calculation from the observed reflection density values in the manner applicable to the measuring system based on the measurement of transmitted light. The values set forth in Table 1 in the column (3) are glucose content values determined according to a standard solution system, namely, Hexokinase method.

- The results in Table 1 evidently indicate that the glucose content (1) determined according to the method of the present invention is in satisfactory agreement with the values (3) determined according to the standard Hexokinase method.
- Two sets (Lot No. 1 and Lot No. 2) of the same slides for glucose analysis were prepared separately from each other in the same manner as in Example 1.
- Five liquid samples containing glucose in different amounts were spotted on each set of the slides, and the optical reflection density values were measured after the slides were incubated.
- The results are illustrated in Fig. 4, wherein the axis of abscissa indicates an optical reflection density for the slide of Lot No. 1 and the axis of ordinate indicates an optical reflection density for the slide of Lot No. 2.
- Fig. 4 clearly indicates that the relationship between optical reflection density (X) for the slide of Lot No. 1 and the optical reflection density (Y) for the slide of Lot No. 2 is expressed by the straight line according to the following linear equation:
Y = 1.175X - 0.074
r = 0.989
N = 5. - Four liquid samples each containing an unknown amount of glucose were spotted on the four slides of Lot No. 2, and the optical reflection density values were measured after the slides were incubated. The measured optical reflection density values were converted into the optical reflection density values for the slide of Lot No. 1 in accordance with the above-mentioned linear equation, and then converted into the glucose content in accordance with a calibration curve previously determined using the slide of Lot No. 1 and standard liquid samples each containing a known amount of glucose. The results are set forth in Table 2 in the column (4). The values set forth in Table 2 in the column (5) are glucose content values obtained directly by calculation from the observed optical reflection density values in the manner applicable to the measuring system based on the measurement of transmitted light. The values set forth in Table 2 in the column (6) are glucose content values determined according to the standard Hexokinase method.

- The results in Table 2 evidently indicate that the glucose content (4) determined according to the method of the present invention is in satisfactory agreement with the values (6) determined according to the standard Hexokinase method.
- On a transparent colorless polyethylene terephthalate (PET) film (thickness: 180 µm) having a nitrocellulose subbing layer was coated a coating solution of the following composition to form a dry reagent layer of 40 µm thick.

- The reagent layer was wetted with water, and on the wetted layer was placed under pressure a tricot-knitted cloth (thickness: 200 µm) of polyethylene terephthalate spun yarn (thickness corresponding to 100 S) to form a spreading layer. Thus, an integral multilayer analytical element for quantitative analysis of total protein was prepared.
- The integral multilayer analytical element was cut to give a square tip (15 mm x 15 mm) and encased in a plastic mount disclosed in Japanese Patent Provisional Publication No. 57(1981)-63452 to prepare an analytical slide for quantitative analysis of total protein.
- Two sets of slides were further prepared in the above-stated manner: one set(Slide B) was allowed to stand for 7 days at 25°C and 50% RH, and another set(Slide C) was allowed to stand for 14 days at 25°C and 70% RH.
- 10 µl of human serums containing different amounts of total protein were separately spotted on the above Slides B and C, as well as on the original slide (Slide A). The spotted slides were incubated at 37°C for 6 min. Subsequently, the optical reflection density on the element was measured using a light having a central wavelength of 540 nm. The measured values are set forth in Table 3.

- In Table 3, the values on the line with the asterisk * mean the optical reflection density values (fog values) before receiving the spotting of the sample.
- The results set forth in Table 3 are illustrated in Fig. 5, wherein the axis of abscissa indicates an optical reflection density for the original slide(Slide A) and the axis of ordinate indicates an optical reflection density for the denatured slides (Slides B and C).
- Fig. 5 clearly indicates that the relationship between the optical reflection density (X) for the original slide and the optical reflection density (Y) for the denatured slide is also expressed by a straight line in the case of an integral multilayer analytical element for quantitative analysis of total protein.
- On a transparent colorless polyethylene terephthalate (PET) film (thickness: 180 µm) was coated a coating solution of the following composition to form a dry indicator layer of 10 µm thick.

- On the dry indicator layer having a sticky surface thereon was placed under pressure the following water-repellent membrane filter to form a liquid-blocking layer.
- A membrane filter of cellulose diacetate having thickness of 140 µm (minimum pore size: 3.0 µm, void ratio: 75%) was immersed in a solution of silicone resin in hexane and dried.
- On the liquid-blocking layer were coated successively the following coating solutions to form a urease-containing reagent layer, a light-blocking layer and an adhesive layer.

- The above coating solution was adjusted to pH 8 by addition of disodium orthophosphate and sodium hydroxide.

- The adhesive layer was swollen with water, and on the swollen layer was placed under pressure a cotton broadcloth (thickness: approx. 150 µm, cotton broadcloth #100) to form a spreading layer. Thus, an integral multilayer analytical element for quantitative analysis of urea-nitrogen (BUN) was prepared.
- The integral multilayer analytical element was cut to give a square tip and encased in a plastic mount to prepare an analytical slide for quantitative analysis of BUN.
- Three sets of slides were further prepared in the above-stated manner: the first set(Slide E), the second set(Slide F) and the third set(Slide G) were allowed to stand for 3 days, 5 days and 10 days, respectively, at 25°C and 70% RH.
- Human serums containing different amounts of urea were separately spotted on the above Slides E, F and G, as well as on the original slide (Slide D). The spotted slides were incubated, and the optical reflection density on the element was measured. The measured values are set forth in Table 4.

- In Table 4. the values on the line with the asterisk * mean the optical reflection density values (fog values) before receiving the spotting of the sample.
- The results set forth in Table 4 are illustrated in Fig. 6, wherein the axis of abscissa indicates an optical reflection density for the original slide(Slide D) and the axis of ordinate indicates an optical reflection density for the denatured slides (Slides E, F and G).
- Fig. 6 clearly indicates that the relationship between the optical reflection density (X) for the original slide and the optical reflection density (Y) for the denatured slide is also expressed by a straight line in the case of an integral multilayer analytical element for quantitative analysis of BUN.
- Two sets (Lot No. 1 and Lot No. 2) of the same slides for BUN analysis were prepared separately from each other in the same manner as in Example 4.
- Human serums containing different amounts of urea were separately spotted on the above slides. The spotted slides were incubated, and the optical reflection density on the element was measured.
- The results are illustrated in Fig. 7, wherein the axis of abscissa indicates an optical reflection density for the slide of Lot No. 1 and the axis of ordinate indicates an optical reflection density for the slide of Lot. No. 2.
- Fig. 7 clearly indicates that the relationship between the optical reflection density values for the slides belonging to different lots is also expressed by a straight line in the case of an integral multilayer analytical element for quantitative analysis of BUN.
Claims (7)
ODx = A·ODs + B
in which A and B are constant values obtained from the equations:
ODx1 + A·OXs1 + B
ODx2 + A·OXs2 + B
in which OXx1 is as defined above and OXs1 is an optical reflection density value to be determined on the standard analytical element upon application of a liquid sample containing the analyte in the content Cx1, and OXx2 is as defined above and OXs2 is an optical reflection density value to be determined on the standard analytical element upon application of a liquid sample containing the analyte in the content Cx2.
Applications Claiming Priority (2)
| Application Number | Priority Date | Filing Date | Title |
|---|---|---|---|
| JP60188226A JPH0629852B2 (en) | 1985-08-26 | 1985-08-26 | Quantitative analysis method of test substance in liquid sample using biased dry analysis element |
| JP188226/85 | 1985-08-26 |
Publications (2)
| Publication Number | Publication Date |
|---|---|
| EP0212660A2 true EP0212660A2 (en) | 1987-03-04 |
| EP0212660A3 EP0212660A3 (en) | 1988-01-13 |
Family
ID=16219983
Family Applications (1)
| Application Number | Title | Priority Date | Filing Date |
|---|---|---|---|
| EP86111800A Withdrawn EP0212660A3 (en) | 1985-08-26 | 1986-08-26 | Method for quantitative analysis of analyte in liquid sample using analytical element |
Country Status (3)
| Country | Link |
|---|---|
| US (1) | US4884213A (en) |
| EP (1) | EP0212660A3 (en) |
| JP (1) | JPH0629852B2 (en) |
Cited By (3)
| Publication number | Priority date | Publication date | Assignee | Title |
|---|---|---|---|---|
| EP0290013A2 (en) * | 1987-05-06 | 1988-11-09 | Fuji Photo Film Co., Ltd. | Densitometer and its use |
| EP0305563A2 (en) * | 1986-09-01 | 1989-03-08 | Fuji Photo Film Co., Ltd. | Method for correction of calibration curve in dry analytical process |
| EP0653622A1 (en) * | 1993-11-12 | 1995-05-17 | Fuji Photo Film Co., Ltd. | Method for correcting instrumental error of spectorscope of optical analyzer |
Families Citing this family (18)
| Publication number | Priority date | Publication date | Assignee | Title |
|---|---|---|---|---|
| JPH0746111B2 (en) * | 1988-03-18 | 1995-05-17 | 株式会社日立製作所 | Sample analysis method and automatic analyzer using the same |
| DE3842580A1 (en) * | 1988-12-17 | 1990-06-21 | Behringwerke Ag | METHOD FOR IMPROVING THE ACCURACY AND REPRODUCIBILITY OF THE MEASURED DATA OF IMMUNOMETRIC TESTS |
| JP2654682B2 (en) * | 1989-02-17 | 1997-09-17 | 富士写真フイルム株式会社 | Biochemical analyzer, biochemical analysis correction method and correction value recording medium |
| US5568400A (en) * | 1989-09-01 | 1996-10-22 | Stark; Edward W. | Multiplicative signal correction method and apparatus |
| JPH06105217B2 (en) * | 1990-01-11 | 1994-12-21 | 倉敷紡績株式会社 | Spectrometry |
| WO1991019187A1 (en) * | 1990-06-04 | 1991-12-12 | Pb Diagnostic Systems, Inc. | Analytical assay |
| US5197017A (en) * | 1990-09-27 | 1993-03-23 | Carroll Wallace E | Potentiophotometric fibrinogen determination |
| US5126952A (en) * | 1991-01-22 | 1992-06-30 | Eastman Kodak Company | Bar coding calibration |
| US5257212A (en) * | 1991-03-21 | 1993-10-26 | Eastman Kodak Company | Normalizing analyzer systems to a standard analyzer |
| DK0731951T3 (en) * | 1993-02-26 | 2000-11-06 | E Y Lab Inc | System and method for optical analysis of a subject |
| US5786223A (en) * | 1995-05-19 | 1998-07-28 | Fuji Photo Film Co., Ltd. | Two-step calibration method for dry chemical analysis element |
| US5525521A (en) * | 1995-06-15 | 1996-06-11 | Borrego Analytical, Inc. | Cystic fibrosis tester |
| EP1060455A4 (en) * | 1998-02-10 | 2002-08-07 | Ey Lab Inc | Reflectometry system with compensation for specimen holder topography and with lock-rejection of system noise |
| DE10138661A1 (en) * | 2000-09-01 | 2002-05-02 | Roche Diagnostics Gmbh | To control the usefulness of test strips, used for the analysis of human/animal body fluids e.g. blood glucose, a strip is measured to give a control reference value to be used in measuring further test strips |
| JP2002116145A (en) * | 2000-10-06 | 2002-04-19 | Matsushita Electric Ind Co Ltd | Method and apparatus for measuring concentration of solution |
| US6595456B2 (en) * | 2001-09-19 | 2003-07-22 | Sonoco Development, Inc. | Textile tube with start-up feature |
| EP1475679A1 (en) * | 2003-05-05 | 2004-11-10 | Asulab S.A. | Device for displaying the phases of the moon, in particular in a timepiece |
| CN111398184A (en) * | 2020-04-07 | 2020-07-10 | 陈海锋 | Method for detecting conversion rate of magnesium hydroxide to magnesium oxide |
Citations (2)
| Publication number | Priority date | Publication date | Assignee | Title |
|---|---|---|---|---|
| DE3247807A1 (en) * | 1981-12-24 | 1983-07-14 | Olympus Optical Co., Ltd., Tokyo | METHOD FOR RECORDING AN EXTINCTION / CONCENTRATION CURVE AND DEVICE FOR IMPLEMENTING THE METHOD |
| DD224666A1 (en) * | 1984-03-18 | 1985-07-10 | Adw Ddr | COLOR COMPARATOR FOR THE VISUAL EVALUATION OF ANALYTICAL ELEMENTS |
Family Cites Families (7)
| Publication number | Priority date | Publication date | Assignee | Title |
|---|---|---|---|---|
| US2554414A (en) * | 1945-07-12 | 1951-05-22 | Phillips Petroleum Co | Apparatus for determining a chemically reactive gas |
| JPS55136957A (en) * | 1979-04-14 | 1980-10-25 | Olympus Optical Co Ltd | Automatic analyzer |
| JPS56155835A (en) * | 1980-05-02 | 1981-12-02 | Olympus Optical Co Ltd | Component analyzing method |
| JPS57104342U (en) * | 1980-10-23 | 1982-06-26 | ||
| JPS5772047A (en) * | 1980-10-24 | 1982-05-06 | Olympus Optical Co Ltd | Component analyzing method |
| JPH0776771B2 (en) * | 1984-07-30 | 1995-08-16 | 株式会社東芝 | Automatic chemical analyzer |
| JPH076917B2 (en) * | 1986-09-01 | 1995-01-30 | 富士写真フイルム株式会社 | Calibration method correction method in dry analysis method |
-
1985
- 1985-08-26 JP JP60188226A patent/JPH0629852B2/en not_active Expired - Lifetime
-
1986
- 1986-08-26 EP EP86111800A patent/EP0212660A3/en not_active Withdrawn
-
1989
- 1989-02-15 US US07/311,444 patent/US4884213A/en not_active Expired - Lifetime
Patent Citations (2)
| Publication number | Priority date | Publication date | Assignee | Title |
|---|---|---|---|---|
| DE3247807A1 (en) * | 1981-12-24 | 1983-07-14 | Olympus Optical Co., Ltd., Tokyo | METHOD FOR RECORDING AN EXTINCTION / CONCENTRATION CURVE AND DEVICE FOR IMPLEMENTING THE METHOD |
| DD224666A1 (en) * | 1984-03-18 | 1985-07-10 | Adw Ddr | COLOR COMPARATOR FOR THE VISUAL EVALUATION OF ANALYTICAL ELEMENTS |
Cited By (6)
| Publication number | Priority date | Publication date | Assignee | Title |
|---|---|---|---|---|
| EP0305563A2 (en) * | 1986-09-01 | 1989-03-08 | Fuji Photo Film Co., Ltd. | Method for correction of calibration curve in dry analytical process |
| EP0305563A3 (en) * | 1986-09-01 | 1990-11-28 | Fuji Photo Film Co., Ltd. | Method for correction of calibration curve in dry analytical process |
| EP0290013A2 (en) * | 1987-05-06 | 1988-11-09 | Fuji Photo Film Co., Ltd. | Densitometer and its use |
| EP0290013A3 (en) * | 1987-05-06 | 1990-11-22 | Fuji Photo Film Co., Ltd. | Method of density calibration and apparatus therefore |
| EP0653622A1 (en) * | 1993-11-12 | 1995-05-17 | Fuji Photo Film Co., Ltd. | Method for correcting instrumental error of spectorscope of optical analyzer |
| US5592290A (en) * | 1993-11-12 | 1997-01-07 | Fuji Photo Film Co., Ltd. | Method for correcting instrumental error of spectroscope of optical analyzer |
Also Published As
| Publication number | Publication date |
|---|---|
| JPH0629852B2 (en) | 1994-04-20 |
| JPS6247535A (en) | 1987-03-02 |
| EP0212660A3 (en) | 1988-01-13 |
| US4884213A (en) | 1989-11-28 |
Similar Documents
| Publication | Publication Date | Title |
|---|---|---|
| EP0212660A2 (en) | Method for quantitative analysis of analyte in liquid sample using analytical element | |
| US20050227370A1 (en) | Body fluid analyte meter & cartridge system for performing combined general chemical and specific binding assays | |
| GB1582153A (en) | Multilayer analytical element | |
| ZA200607521B (en) | Body fluid analyte meter & cartridge system for performing combined general chemical and specific binding assays | |
| JPH0726959B2 (en) | Whole blood analysis element | |
| JPS61245057A (en) | Integral type multi-layered analyzing element | |
| US4832488A (en) | Method for correction of calibration curve in dry analytical process | |
| JPH0726960B2 (en) | Dry whole blood analysis element | |
| US4812399A (en) | Analytical element and method for the determination of creatinine or creatine | |
| US5348889A (en) | Method for correcting a calibration curve | |
| Neeley et al. | Multilayer film analysis for glucose in 1-microL samples of plasma. | |
| EP0112166B1 (en) | Method for quantitative analysis using analytical element sheet | |
| Zipp et al. | Solid-phase chemistry: its principles and applications in clinical analysis | |
| JPH0526865A (en) | Measuring method using dry process analysis element and dry process analysis element | |
| Ohkubo et al. | Plasma glucose concentrations of whole blood, as determined with a multilayer-film analytical element. | |
| EP0114403B1 (en) | Multilayer analytical element | |
| Rodriguez-Segade et al. | Effects of various serum proteins on quantification of fructosamine. | |
| Greyson | Problems and possibilities of chemistry on dry reagent carriers | |
| CN111308079B (en) | Method for improving quantitative analysis accuracy of colloidal gold immunochromatography platform | |
| EP0291321A2 (en) | Element and method for determination of creatinine or creatine | |
| Sonntag | Dry chemistry: analysis with carrier-bound reagents | |
| Stewart et al. | Statistical comparison of blood glucose as determined by several test-strip procedures and by a hexokinase procedure. | |
| CN1107230C (en) | A method of determining the degree of aggregation of the 'beta' A4 peptide | |
| Schoreder et al. | Dry reagent chemistry techniques | |
| JPS62269065A (en) | Multilayered analytical element and analysis of specimen occurring from living body using the same |
Legal Events
| Date | Code | Title | Description |
|---|---|---|---|
| PUAI | Public reference made under article 153(3) epc to a published international application that has entered the european phase |
Free format text: ORIGINAL CODE: 0009012 |
|
| AK | Designated contracting states |
Kind code of ref document: A2 Designated state(s): DE GB |
|
| PUAL | Search report despatched |
Free format text: ORIGINAL CODE: 0009013 |
|
| AK | Designated contracting states |
Kind code of ref document: A3 Designated state(s): DE GB |
|
| STAA | Information on the status of an ep patent application or granted ep patent |
Free format text: STATUS: THE APPLICATION IS DEEMED TO BE WITHDRAWN |
|
| 18D | Application deemed to be withdrawn |
Effective date: 19880714 |
|
| RIN1 | Information on inventor provided before grant (corrected) |
Inventor name: KITAJIMA, MASAOC/O FUJI PHOTO FILM CO., LTD. Inventor name: IWATA, YUZOC/O FUJI PHOTO FILM CO., LTD. Inventor name: MAKIUCHI, HAJIMAC/O FUJI PHOTO FILM CO., LTD. |