EP0186936A1 - Method and apparatus for evaluating auditory distortions of an audio system - Google Patents
Method and apparatus for evaluating auditory distortions of an audio system Download PDFInfo
- Publication number
- EP0186936A1 EP0186936A1 EP85306211A EP85306211A EP0186936A1 EP 0186936 A1 EP0186936 A1 EP 0186936A1 EP 85306211 A EP85306211 A EP 85306211A EP 85306211 A EP85306211 A EP 85306211A EP 0186936 A1 EP0186936 A1 EP 0186936A1
- Authority
- EP
- European Patent Office
- Prior art keywords
- signal
- produce
- weighting
- series
- weighting means
- Prior art date
- Legal status (The legal status is an assumption and is not a legal conclusion. Google has not performed a legal analysis and makes no representation as to the accuracy of the status listed.)
- Withdrawn
Links
Images


Classifications
-
- A—HUMAN NECESSITIES
- A61—MEDICAL OR VETERINARY SCIENCE; HYGIENE
- A61B—DIAGNOSIS; SURGERY; IDENTIFICATION
- A61B5/00—Measuring for diagnostic purposes; Identification of persons
- A61B5/12—Audiometering
-
- G—PHYSICS
- G01—MEASURING; TESTING
- G01R—MEASURING ELECTRIC VARIABLES; MEASURING MAGNETIC VARIABLES
- G01R23/00—Arrangements for measuring frequencies; Arrangements for analysing frequency spectra
- G01R23/16—Spectrum analysis; Fourier analysis
- G01R23/20—Measurement of non-linear distortion
Definitions
- the performance, or quality, of an audio system is generally evaluated in terms of “distortions.”
- disortions the “distortions” of an audio system measured by conventional methods such as a “total harmonic distortion”, for example, are typically not consistent with actual human auditory appreciation. It often happens that a listener judges a sound produced by an audio system having greater “total harmonic distortion” to be less distorted than one having less “total harmonic distortion”.
- the apparatus according to this invention also includes a weighting network for the measurement of loudspeaker subharmonics so that the results obtained will best reflect human auditory faculties.
- the quality of a soun, good or bad, has traditionally been represented by the measurement of THD (Total Harmonic Distortion) and/or IMD (Intermodulation Distortion).
- THD and/or IMD measurements are at best mere physical measurements without any human auditory meaning whatsoever; this is because the sensitivity of human auditory faculties increases in response to the number of "orders" of harmonic components.
- THD and/or IMD measurements are at best mere physical measurements without any human auditory meaning whatsoever; this is because the sensitivity of human auditory faculties increases in response to the number of "orders" of harmonic components.
- a further object of this invention is to develop a method for measuring such spurious noises as buzzes or rattles that are inherent in a loudspeaker, and which arises out of deviations, typically thos beyond tolerances, in the production procedure, these spurious noises being an essential item on Q. C. check lists. Traditionally such checking is done by skilled professional workers listening to the sweeping sinusoidal sound waves produced from a loudspeaker. Obviously, however, measurements or evaluations made by an individual listening with bare ears adds a subjective taint to the results, easily making them subject to such dispute that an objective standard cannot be established and automatic measurement operations cannot be instituted.
- This invention offers a novel method and appartus for evaluating the auditory distortion of an audio system, wherein an audio signal, whose auditory distortions are to be evaluated, is filtered by a notch filter to remove its fundamental frequency, and is then fed through a primary weighting network comprising three high pass filters followed by a secondary weighting network.
- the filtered, weighted signal is then amplified, rectified, further filtered, compared by taking the ratio with the magnitude of original signal and finally fed to a display unit to show a figure that represents auditory distortion characteristics consistent with what is actually appreciated by human auditory faculties.
- a loudspeaker 2 rotatable by 180 degrees, is arranged at distance dl from standard microphone 3.
- a human tester 5 stands at distance d2 facing loudspeaker 2, the distance d2 being equal to distance dl, which may be 50 cm.
- Loudspeaker 2 is provided with a harmonic control circuit 4 and standard microphone 3 is provided with sound analyzer 6 including sound pressure level meter 62 and a spectrum analyzer 61, as shown.
- Harmonic control circuit 4 comprises a first frequency synthesizer 41 connected to a first band pass filter 42 for feeding a signal having a fundamental frequency to a mixer 44 through a first variable resistor VR1, or first volume control 43; and a second frequency synthesizer 45 connected to a second band pass filter 46 for feeding a signal having harmonic frequencies to mixer 44 through a second variable resistor VR2 or second volume control 47.
- a power amplifier 48 is provided to amplify the mixed signal produced by mixer 44, and the mixed, amplified signal is then fed to loudspeaker 2 to produce a sound.
- second volume control 47 is set at that point and loudspeaker 2 is again turned to face standard microphone 3, which picks up the sound, including its fundamental and harmonic component, which is then fed to sound analyzer 6 consisting of a spectrum analyzer 61 and a sound pressure level meter 62, so that the contents of the mininal harmonic sound can be measured by spectum analyzer 61.
- the harmonic sound measured is 40 dB SPL (Sound Pressure Level)
- Such an ability can be referred to as the threshold of audition, the point at which a sound, typically the minimum sound of a harmonic component, begins to be detected aurally.
- a circuit which consists of a primary weighting network 20 and a secondary weighting network 24, wherein primary weighting network 20 comprises three high pass filtering units 20A having a filtering circuit composed of a capacitor 21 having a capacitance C and a resister 22 having a resistance R, and an amplifier 23.
- a signal having a frequency fl + 2:fn is applied to the first unit of the three high pass filtering units 20A, 20A, 20A, wherein OR
- the circuit shown in Fig. 2 makes a composite weighting network having a composite frequency response which closely matches the frequency response shown in Fig. 8 through Fig. 12. For instance, 50 Hz, the frequency response as a composite result of the circuit shown in Fig. 2 should be the same as or very similar to that of the solid line in Fig. 8.
- the characteristics of each frequency response, as illustrated in Figs. 8 through Figs. 12, resembles the characteristics of the band pass filter; thus enabling one to combine one set of high pass filters with another set of low pass filters, to yield the frequency response response characteristics, as shown in Figs. 8 through Figs. 12.
- the primary weighting network 20 as shown in Fig. 2 therefore essentially consists of the high pass filters mentioned above, while the secondary weighting network 24 in the same illustration is composed of the low pass filters.
- the -3 dB cutoff frequency for such a low pass filter lies between 2 KHz and 12 KHz, preferably of the range of 4.5 KHz through 6 KHz, the relevant roll-off slope being situated between 18 dB/oct. and 150 dB/oct., preferably at 60 dB/oct.
- FIG. 8 A careful study of Figs. 8 through Figs. 12 shows that close conformity with human auditory appreciation is obtained when the frequency response characteristics of the secondary weighting network, as illustrated in Fig. 2, is identical to curve A of Fig. 13.
- the vital point lies in the low pass filter of the secondary weighting network, of which, one embodiment is shown in Fig. 6, whose frequency response corresponds to curve A, of which, the details will be given in a later page.
- the secondary weighting network 24 as shown in Fig. 2 has frequency response characteristics resembling the reverse of the equal-loudness-level contours (Robinson D. W. and R. S. Dadson, Br. J. Applied Physics, 1956, Vo.7, Page 166), like what is shown in Curve A of Fig. 13.
- the signals having been filtered by a circuit exhibited in Fig. 2, will yield an auditory distortion of a magnitude compatible with that of human auditory appreciation.
- Fig. 3 shows a circuit comprising a band pass filter (hereinafter as BPF) 31 and a weighting network, 32. This circuit weights the subharmonic compnent of audio signal to be evaluated.
- BPF band pass filter
- the fundamental frequency of the signal fed to BPF 31 as shown in Fig. 3 is fl, which contains a subharmonic component with its frequency one half of fl, the resonant frequency of BPF 31 has to be exactly one half of fl in order that passage will be permitted to those subharmonic components in the input signal, only whilst ample attenuation is imposed upon all other frequencies.
- the subharmonics thus obtained will be weighted by the weighting filter 32, as shown in Fig. 3.
- the weighting filter 32 in Fig. 3 shall comprise of at least a low pass filter and a high pass filter.
- the frequency response characteristics to be expected of Weighting Filter 32 is best represented in Curve B, of Fig. 13.
- Curve B shows the average outcome of tests taken on 18 individuals with respect to the subharmonic components, and, this is based on the experiments shown in Fig. 1.
- the average of the threshold values of the 18 tested individuals are as follows:
- Fig. 4 shows a block diagram of a first embodiment of the aditory distortion evaluation device of this invention.
- the device comprises a notch filter 401, a primary weighting network 402, a secondary weighting network 403, an amplifier 404, a first rectifier and ripple filter 405, a ratio circuitry 406, a display unit (or meter) 407, and a second rectifier and ripple filter 408.
- the cutoff frequency of -3 dB cause by the value of CR in each segment is 12 times the fundamental frequency fl.
- the secondary weighting network 403 provides for a characteristic frequency response which is virtually a reversal of the above mentioned equal-loudness-level contours, like what is shown in Curve A of Fig. 13.
- an input signal (fl +Hfn) which is to be measured by having its fundamental frequency fl attenuated at Notch Filter 401, the output at the output point, which is for filter 401, point K, which all consist of harmonics alone and is to be weighted for the first time by a primary weighting network, comprising a series of three high pass filters 402, before going to secondary weighting network 403 for a secondary weighting, and then amplified by amplifier 404, rectified by first rectifier 405 for a true r.m.s.
- ratio circuitry 406 AC/DC conversion and further filtered as inputs to the right side terminal of ratio circuitry 406, such a ratio circuitry can be composed of a logarithmic converter, for which the reference input can be considered as the input to the left side terminal of ratio circuity 406, as illustrated in Fig. 4, or else as an input to an analogue divider, by considering the input at the left end of ratio circuitry 406, as the denominator and the other input, at the right end thereof, as the numerator.
- the input signal fl + Lfn is also applied to second rectifier 408 whereby the input signal undergoes a true r.m.s. AC/DC conversion and is filtered before being fed to an input point at the left end of ratio circuitry 406.
- Ratio circuitry 406 will take the ratio of two signals fed into the left and the right ends with the results fed tthe display unit 407 for demonstration, which will be of a truly reflective value to human auditory appreciation, in response to audio distortions, and which is to be referred to as "auditory distortion", according to the present invention, which can be expressed in terms of % or dB.
- the reference value 0 dB of the auditory distortion is defined as follows:
- notch filter 401 as shown in Fig. 4, is not absolutely necessary, except when it is desirous to determine auditory distortion of a level that is lower than 10 dB, bereft of that, the margin of error will become large.
- Fig. 5 shows a block diagram of a second embodiment of the device of this invention, which comprises a level control circuit 504, a notch filter 501, a primary weighting filter 502, a secondary filter 503, an complifier 505, a rectifier 506, and a display unit 507.
- Level control circuit 504 can be of the manual level control mode or automatic level control mode, both meant to convert the level of the input signal fl + ' 1: fn into a constant value.
- the signal voltage at point P would then be a constant value, and, then the rectifier and filter 506 and display unit 507, as shown in Fig. 5, will obtain the same function as do units 408, 405, 406, 407 as shown in Fig. 4 respectively; 402 and 403 shown in Fig. 4, being identical to 502 and 503 shown in Fig. 5; and therefore, as shown in illustrations in Fig. 4 and Fig. 5, will both share like performances, in all respects.
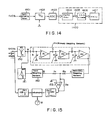
- Fig. 4 and Fig. 5 are most noticeably distinguished from conventional distortion meters in the filtering and weighting of harmonic components, the weighting can be accomplished alternatively by the method of digital procession, for which a block diagram is shown in Fig. 14.
- FIG. 14 The illustrations of Fig. 14 include an anti- aliasing filter 1401, a sample/hold circuitry S/H 1402, an analogue to digital converter 1403 and a data processing unit 1400 embodying both hardward and softward which include digital filter 1404, r.m.s. converter program 1406 and display unit 1407.
- the incoming signal fl + rfn will go through anti- aliasing filter 1401, S/H 1402 and ADC 1403 for digitization, to be further subject to treatment by digital filter 1404, that is, weighting processing, to yield a weighted data 1405, prior to being converted by said r.m.s. converter program to yield corresponding r.m.s. value and to be demonstrated by display unit 1407.
- the frequency response from the digital filter 1404, as shown in Fig. 14, shall be identical to a composite frequency response that is a combination of the output from the primary weighting network 20 and the secondary weighting network 24 as shown in Fig. 2, but if the signals to be evaluated contains subharmonic components, then digital filter 1404's performance shall correspond to that of BPF 31, as shown in Fig. 3 and get the. subharmonic components, then, such subharmonic components will be weighted, by means of the frequency response characteristics, produce from the third weighting network 32 as shown in Fig. 3.
- the circuit serves as a means of weighting the subharmonic component, so by connecting the circuit shown in Fig. 3 to the circuit shown in Fig. 4, one will get a circuit that is capable of determing a subharmonic component, as well as harmonic components of higher orders; an example of this is shown in Fig. 15.
- Fig. 15 illustrates a circuit that is entirely identical to that circuit shown in Fig. 4, with the additional incorporation of a band pass filter 151, a third weighting network 152 and a summing amplifier 153.
- incoming signal fl + ⁇ fn will have its fundamental frequency fl amply attenuated by notch filter 150 before being fed to the Band pass filter 151 where only the subharmonic component will be fed through; and higher order harmonic components will be attenuated, the resonate frequency of the Band pass filter 151 should be exactly half of fl.
- the subharmonic component will be weighted by weighting filter 152, before being fed to Summing amplifier 153 via Rl for amplification.
- the frequency response curve of the weighting filter 152 should be the same as curve B, shown in Fig. 13.
- the summation of the rejection ratio of both notch filter 150 and band pass filter 151 relative to the fundamental frequency fl is preferable to set the summation of the rejection ratio of both notch filter 150 and band pass filter 151 relative to the fundamental frequency fl, individually and severally, to be of a value that is greater than -80 dB.
- the primary weighting network invariably adopted a three-order RC high pass filter arrangent.
- a four-order or even five-order high pass filter for instance, a four-order stage can be comprised of two cascaded state variable filters, where it is intended to determine spurious noises produced by a loudspeaker, this is because a loudspeaker will usually suffer ample distortions for harmonics of the second or even third order, especially in frequencies lower than its natural resonant frequency; but, as a matter of fact, distortion of that nature is used to be tolerated by loudspeaker manufacturers, whereas spurious noises, owing to sand or dust that are carried into the gap of a voice coil, are typically of harmonics of higher orders, which would be less tolerable so it has been proposed to employ high pass flters of the fourth or fifth order, with a view to attenuate amply harmonic components of lower orders, while attenuating much less harmonics of higher orders, such a
- the high pass filters that is employed in the illustrations of Fig. 4, Fig. 5 or Fig. 15 are alike, and all of the RC mode through manual tuning, and employment of a synchronous tracking filter will permit continuous measurement of auditory distortion for the entire audio frequency range, and also a recording of the curve of variation of auditory distortion, by means of a level recorder, using the frequency as the abscissa.
- the notch filter 150, band pass filter 151 and high pass filter, as illustrated in Fig. 15 must all be of type VCF (Voltage Controlled Filter), a typical instance for the execution of such a VCF is an embodiment using state variable filters, having three outputs each for the high pass filter, low pass filter and the band pass filter respectively; but if the high pass and low pass output are summed together by a summing amplifier, then the output of the summing amplifier will account for a notch filter.
- the state variable filter there are incorporated two integrators, each provided with a pair of RC combinations to serve to determine the resonant frequency. It is permissible to replace both resistors in such RC combinations with two analogue multipliers to constitute for a voltage controld filter.
- FIG. 6 What is shown in Fig. 6 is one embodiment of the secondary weighting network, as illustrated in Fig. 2, Fig. 4, Fig. 5, or Fig. 15.
- High pass filter 81 comprises capacitors Cl and C2, resisters Rl --- R4 and an amplifier Al; and band dip filter 82 comprises resisters R5 and Rs, a capacitor C3, and an inductor Ll; and low pass filter 83 comprises resisters R6 --- R15, capacitors C4 to C13, and amplifiers A2 --- A5.
- the purpose of the circuit, as shown in Fig. 6, is to produce a composite frequency response that will best correspond to the Curve A, as shown in Fig. 13.
- frequency response for frequencies lower than 4 KHz are achieved by high pass filters 81, whilst the dip in frequency response for frequency ranging from 500 Hz through 3 KHz are achieved through band dip filter 82, and that frequency response for frequencies higher than 4 KHz are achieved through low pass filters 83.
- the frequency response remains free from any substantial variation whatsoever, for frequencies lower than 4 KHz, but will decline sharply, which means a dractic attenuation.
- the roll-off namely, the sharp declination that is the frequency response for frequencies higher than 4 KHz, should deserve much considerations, and the reasons are as follows:
- the low pass filters 83 serves to cause roll-offs in'the frequency responses for frequencies higher than 4 KHz, so that low pass filters 83 are of prime interest, in the circuit represented in Fig. 6, and if both high pass filter 81 and band dip filter 82 are removed so that low pass filters 83 alone are left, and would but incur an additional tolerance of plus/minus 4.5 dB in the frequency response for frequencies ranging from 100 Hz through 6.6 KHz, as described above.
- t is preferable to employ the circuit, as illustrated in Fig. 6, in order to obtain the frequency response exactly as depicted in Curve A of Fig. 13; by doing so, a weighting performance that can best match human auditory appreciation, will be effected.
- the secondary weighting network as described above, is adapted for weighting harmonic components of higher orders.
- a third weighting network serving as a weighting network for subharmonic components exclusively, which is another embodiment provided for, according to the invention, it is, as shown in Fig. 7.
- the third weighting network comprises of a series of high pass filters 71, a band dip filter 72 and a series of low pass filters 73, which, on the whole, resembles very much what is shown in Fig. 6.
- the frequency response of the circuit, as shown in Fig. 7, must correspond closely to the Curve B, as shown in Fig. 13.
- the low pass filters 71, as shown in Fig. 7, the -3 dB cutoff frequency lies between 800 Hz and 3 KHz, from which the frequency response for low frequency band, that is, frequencies lower than 1 KHz, as represented in Curve B of Fig.
- Band dip filter 72 serves to produce such a form of frequency response, in which a dip prevails, for frequencies of 1 KHz through 4 KHz, like what is shown in Curve B, and that low pass filters 73 are accountable for the frequency response for frequencies higher than 5 KHz, as covered in Curve B; while it has to be stressed that the -3 dB cutoff frequency for low pass filters 73 should be somewhere beten 3 KHz and 14 KHz.
- the band dip filter 72 as seen in Fig. 7, is not absolutely indispensable, which, if eliminated so that high pass filters 71 and low pass filters 73 remain in the circuit, then the composite frequency response to result therefrom, would be as if resulting from one band pass filter only. That is admittedly less than the precision requirement, but, when carefully designed, the result of a maximum tolerance of plus/minus 5 dB would be obtained, and that, will nevertheless be acceptable for usage.
- the device for measuring auditory distortions may be used to evaluate preamplifiers, loudspeakers, headphones, power amplifiers, equalizers etc., so as to further improve on the accuracy of the evaluation.
- the magnitude of the auditory distortion data, measured or evaluated, thereby, will truly serve as an index representative of the amplitudes of distortions, as it is apprehended by human auditory faculties, and is distinguished from conventional approaches, regarding the evaluation of audio distortions, which can only yield results bearing physical meaning, without being representative of the true feelings apprehended by human auditory faculties.
Abstract
Method and apparatus for evaluating the auditory distortions of an audio system, wherein an audio signal, whose auditory distortions are to be evaluated, is filtered by a notch filter (401) to remove its fundamental frequency, and is then fed through a primary weighting network (402) comprising three high pass filters followed by a secondary weighting network (403). The filtered, weighted signal is then amplified (404), rectified, further filtered (405), compared (406) by taking the ratio with the magnitude of original signal and finally fed to a display unit (407) to show a figure that represents auditory distortion characteristics consistent with what is actually appreciated by human auditory faculties.
Description
- Method and apparatus for evaluating auditory distortions of an audio system.
- The performance, or quality, of an audio system is generally evaluated in terms of "distortions." However, the "distortions" of an audio system measured by conventional methods such as a "total harmonic distortion", for example, are typically not consistent with actual human auditory appreciation. It often happens that a listener judges a sound produced by an audio system having greater "total harmonic distortion" to be less distorted than one having less "total harmonic distortion".
- The inventor has been studying the relationship between human auditory appreciation and harmonic distortion for some years and has found that the numerical measurement of distortion that best approximates human auditory appreciation is obtained by a weighting of the components of harmonic distortion; that is, by a filtered weighting of the high pass filter having 3rd through 4th order and characterised in that the damping factor thereof is (d = 2 or quality factor Q = 1/d = 0.5), the cut off frequency of each order being approximately 12 times the fundamental frequency being measured. Consequently, the main object of the present invention lies in a primary weighting network comprising of a high pass filter for the third through the fourth orders, supplemented by a secondary weighting network provided to yield a distortion figure that truly reflects human auditory faculties and which might be named an "auditory distortion parameter".
- The apparatus according to this invention also includes a weighting network for the measurement of loudspeaker subharmonics so that the results obtained will best reflect human auditory faculties.
- The key index of the performance of a high fidelity stereo system, particularly for a loudspeaker, is audio quality. Yet until now there has not been proposed, nor is there anywhere available, an ideal method of performance evaluation. The quality of a soun, good or bad, has traditionally been represented by the measurement of THD (Total Harmonic Distortion) and/or IMD (Intermodulation Distortion). However, such THD and/or IMD measurements are at best mere physical measurements without any human auditory meaning whatsoever; this is because the sensitivity of human auditory faculties increases in response to the number of "orders" of harmonic components. Thus the traditional methods of measuring the components of each harmonic, without a preliminary weighting process, will unavoidably lead to results that do not conform to human auditory appreciation, and the figures obtained therefrom will fail to represent the quality of a sound consistent with human auditory appreciation.
- Recognizing the facts set forth avove, human auditory appreciation was studied with the object of developing a rational method for the evaluation of audio distortions consistant with actual human auditory appreciation. Such a method is the primary object of the present invention.
- A further object of this invention is to develop a method for measuring such spurious noises as buzzes or rattles that are inherent in a loudspeaker, and which arises out of deviations, typically thos beyond tolerances, in the production procedure, these spurious noises being an essential item on Q. C. check lists. Traditionally such checking is done by skilled professional workers listening to the sweeping sinusoidal sound waves produced from a loudspeaker. Obviously, however, measurements or evaluations made by an individual listening with bare ears adds a subjective taint to the results, easily making them subject to such dispute that an objective standard cannot be established and automatic measurement operations cannot be instituted. A careful study of spurious noises, now shows them to be attributed to the harmonic distortions of higher orders; the present invention is thus the result of thorough research into human auditory appreciation as related to the orders of harmonics as illustrated in the accompanying drawings, in particular as adapted to the evaluation of spurious noises produced by high fidelity loudspeaker, and fall naturally into the auditory distortion domain disclosed hereunder.
- This invention offers a novel method and appartus for evaluating the auditory distortion of an audio system, wherein an audio signal, whose auditory distortions are to be evaluated, is filtered by a notch filter to remove its fundamental frequency, and is then fed through a primary weighting network comprising three high pass filters followed by a secondary weighting network. The filtered, weighted signal is then amplified, rectified, further filtered, compared by taking the ratio with the magnitude of original signal and finally fed to a display unit to show a figure that represents auditory distortion characteristics consistent with what is actually appreciated by human auditory faculties.
-
- Fig. 1 is a schematic, block diagram showing the arrangement of test equipment employed in experiments conducted to determine the relationship between harmonic components and human auditory appreciation according to this invention.
- Fig. 2 is a block diagram of an audio circuit that weights the higher order harmonic components of an input signal to produce a distortion figure that truly reflects human auditory faculties.
- Fig. 3 is a block diagram of an audio circuit for weighting the subharmonic of an input signal to produce a distortion figure compatible with human auditory faculties.
- Fig. 4 is a block diagram of a first embodiment of the auditory distortion evaluation device of this invention.
- Fig. 5 is a block diagram of a second embodiment of the device of this invntion.
- Fig. 6 is a circuit diagram of the secondary weighting network employed in the various embodiments of the device of this invention as shown in Figs. 4, 5, and 15.
- Fig. 7 is a circuit diagram of a third weighting network employed in the embodiments of the device of this invention as shown in Fig. 15 or Fig. 3.
- Fig.. 8 shows a curve representing a threshold of audition of higher order harmonics having a fundamental frequency of 50 Hz, to be used as a base for the weighting networks employed in the device of this invention. The solid line curve is obtained by inverting a dotted line plotted from the data obtained by the experiment shown in Fig. 1.
- Figs. 9-12 show various curves similar to the solid line curve shown in Fig. 8, resulting from experiments using different fundamental frequencies such as 100 Hz and 4 KHz (Fig. 9), 200 Hz and 2 KHz (Fig. 10), 500 Hz and 8 KHz (Fig. 11), and 1 KHz (Fig. 12).
- Fig. 13 shows frequency response curve A and curve B, wherein curve A represents the frequency response which should be achieved by the secondary weighting network as covered in the present invention, which, if inverted, is a closematch of the "equal-loudness-level contour"; curve B represents the frequency response which should be achieved by the third weighting network shown in Fig. 15 or Fig. 3.
- Fig. 14 illustrates a block diagram which shows how the circuit performance as showss in Fig. 4 or Fig. 5, or Fig. 15 is achieved using digital processing technique.
- Fig. 15 shows a block diagram of a third embodiment of this invention, illustrating determination of subharmonic component provided as an additional function by a third weighting network that is incorporated into the circuit shown in Fig. 4.
- The response of human audition to a distortion of sinuoidal waves is normally associated only with the fundamental frequency, but the order of its harmonic components is even more important. The distortions of lower orders of harmonics are less easily detected than the distortions for higher orders of harmonics, so the distortions of different orders of a fundamental wave will be detected and appreciated very differently by the same person.
- To evaluate the amount of distortion of different harmonic orders as detected by human auditory faculties, a series of experiments were performed whose procedure is illustrated in Fig. 1.
- In an
anechoic charmber 1, as shown in Fig. 1, aloudspeaker 2, rotatable by 180 degrees, is arranged at distance dl fromstandard microphone 3. Ahuman tester 5 stands at distanced2 facing loudspeaker 2, the distance d2 being equal to distance dl, which may be 50 cm. Loudspeaker 2 is provided with aharmonic control circuit 4 andstandard microphone 3 is provided withsound analyzer 6 including soundpressure level meter 62 and aspectrum analyzer 61, as shown.Harmonic control circuit 4 comprises afirst frequency synthesizer 41 connected to a firstband pass filter 42 for feeding a signal having a fundamental frequency to amixer 44 through a first variable resistor VR1, orfirst volume control 43; and asecond frequency synthesizer 45 connected to a secondband pass filter 46 for feeding a signal having harmonic frequencies to mixer 44 through a second variable resistor VR2 orsecond volume control 47. The frequency of the signal as generated bysecond frequency synethesizer 45 is n times the frequency generated byfirst frequency synethesizer 41, such a number of harmonic order n can be 1/2, 2, 3, 4, ..., where n = 1/2, subharmonic components will be produced; where n = 2, 3, 4 or any other integer, harmonic components of higher orders will be produced. Apower amplifier 48 is provided to amplify the mixed signal produced bymixer 44, and the mixed, amplified signal is then fed toloudspeaker 2 to produce a sound. - Loudspeaker 2 is first turned to
standard microphone 3, withsecond volume control 47 for harmonic frequencies adjusted to zero and withfirst volume control 43 for the fundamental frequcney adjusted to 90 dB SPL (Sound Pressure Level, 0 dB SPL = 0.0002 microbar). Loudspeaker 2 is then turned towardshuman tester 5 who starts to adjustsecond volume control 47 from the zero point in a "louder" direction, untilhuman tester 5 himself can barely begin to appreciate a minimal harmonic sound. Thereuponsecond volume control 47 is set at that point andloudspeaker 2 is again turned to facestandard microphone 3, which picks up the sound, including its fundamental and harmonic component, which is then fed to soundanalyzer 6 consisting of aspectrum analyzer 61 and a soundpressure level meter 62, so that the contents of the mininal harmonic sound can be measured byspectum analyzer 61. Assuming that the harmonic sound measured is 40 dB SPL (Sound Pressure Level) then the ability of the tester to detect aurally the harmonic of a given order, of a fundamental frequency of the volume corresponding to 90 dB, is expressed as 40 - 90 = -50 dB. Such an ability can be referred to as the threshold of audition, the point at which a sound, typically the minimum sound of a harmonic component, begins to be detected aurally. - Such experiments were conducted with 18 human testers with fundamental frequencies set at 50 Hz, 100 Hz, 200 Hz, 500 Hz, 1 KHz, 1.4 KHz, 2 KHz, 2.8 KHz, 4 KHz, 5.6 KHz, 8 KHz, 11 KHz, 15.6 KHz and 18 KHz while the SPL value was set at 90 dB, with a view to determining the threshold of audition, that is, the threshold of audition of each individual for various harmonics of different orders. Statistics were taken, average calculated, and an anlysis given accordingly.
- The experiments as described above extended to a subharmonic, characterised by setting n = 1/2 in Fig. 1. It should be pointed out that in the conventional theory of electric circuitry, harmonics of higher orders are all integral multiples of a fundamental frequency, so there should not be a harmonic of the 1/2 order as such. Such a harmonic of the 1/2 order, however, does, in fact, exist for a loudspeaker. At certain frequencies, the cone of a loudspeaker may oscillate at a frequency which is half of that of the fundamental frequency, while maintaining the original oscillation of the fundamental frequency. Therefore tests for the threshold of audition, in response to a 1/2 order harmonic frequency were also made.
- The results of the experiments were averaged and summarized on eight curves illustrated in Figs. 8 through 12 with each curve representing the threshold of audition of each human tester relative to the various differing orders of harmonics under the sound pressure level of 90 dB for each given frequency. For example, in Fig. 8 with the fundamental frequency set at 50 Hz, the threshold of audition to the 7th harmonic was found to be at -53.7 dB, meaning that for a 50 Hz frequency where SPL = 90 dB, the level of the 7th harmonic audible to human ear is 90 - 53.7 = 36.3 dB SPL (refer to points M, N, and P in Fig. 8).
- Actually the curves of the threshold of audition as given in Figs. 8 through 12 should be depicted in a reverse direction, as shown by the dotted line in Fig. 8. The solid line is based on the absolute value obtained from the experiments from which it emerges that by weighting each order of the harmonics with reference to the bold line shown in Fig. 8, being the same for Figs. 9 through 12, one can obtain a measurement of auditory distortion of a type consistent with human auditory appreciation on a broad basis.
- By consulting the curves shown in Figs. 8 through 12 with reference to the 70 dB line serving as a reference coordinate (an abscissa, to be exact, to represent 0 dB), it will be seen that it is very close to a Frequency Response Curve produced by the circuit represent by Fig. 2, to be described below.
- In Fig. 2 there is shown a circuit which consists of a
primary weighting network 20 and asecondary weighting network 24, whereinprimary weighting network 20 comprises three highpass filtering units 20A having a filtering circuit composed of acapacitor 21 having a capacitance C and aresister 22 having a resistance R, and anamplifier 23. - A signal having a frequency fl + 2:fn is applied to the first unit of the three high
pass filtering units 

- The circuit shown in Fig. 2 makes a composite weighting network having a composite frequency response which closely matches the frequency response shown in Fig. 8 through Fig. 12. For instance, 50 Hz, the frequency response as a composite result of the circuit shown in Fig. 2 should be the same as or very similar to that of the solid line in Fig. 8. The characteristics of each frequency response, as illustrated in Figs. 8 through Figs. 12, resembles the characteristics of the band pass filter; thus enabling one to combine one set of high pass filters with another set of low pass filters, to yield the frequency response response characteristics, as shown in Figs. 8 through Figs. 12.
- The
primary weighting network 20 as shown in Fig. 2 therefore essentially consists of the high pass filters mentioned above, while thesecondary weighting network 24 in the same illustration is composed of the low pass filters. - The -3 dB cutoff frequency for such a low pass filter lies between 2 KHz and 12 KHz, preferably of the range of 4.5 KHz through 6 KHz, the relevant roll-off slope being situated between 18 dB/oct. and 150 dB/oct., preferably at 60 dB/oct.
- A careful study of Figs. 8 through Figs. 12 shows that close conformity with human auditory appreciation is obtained when the frequency response characteristics of the secondary weighting network, as illustrated in Fig. 2, is identical to curve A of Fig. 13. The vital point lies in the low pass filter of the secondary weighting network, of which, one embodiment is shown in Fig. 6, whose frequency response corresponds to curve A, of which, the details will be given in a later page.
- The
secondary weighting network 24 as shown in Fig. 2 has frequency response characteristics resembling the reverse of the equal-loudness-level contours (Robinson D. W. and R. S. Dadson, Br. J. Applied Physics, 1956, Vo.7, Page 166), like what is shown in Curve A of Fig. 13. - The signals, having been filtered by a circuit exhibited in Fig. 2, will yield an auditory distortion of a magnitude compatible with that of human auditory appreciation.
- Fig. 3 shows a circuit comprising a band pass filter (hereinafter as BPF) 31 and a weighting network, 32. This circuit weights the subharmonic compnent of audio signal to be evaluated.
- The fundamental frequency of the signal fed to
BPF 31 as shown in Fig. 3 is fl, which contains a subharmonic component with its frequency one half of fl, the resonant frequency ofBPF 31 has to be exactly one half of fl in order that passage will be permitted to those subharmonic components in the input signal, only whilst ample attenuation is imposed upon all other frequencies. The subharmonics thus obtained will be weighted by theweighting filter 32, as shown in Fig. 3. - The
weighting filter 32 in Fig. 3 shall comprise of at least a low pass filter and a high pass filter. The frequency response characteristics to be expected ofWeighting Filter 32 is best represented in Curve B, of Fig. 13. - Curve B, as illustrated in Fig. 13, shows the average outcome of tests taken on 18 individuals with respect to the subharmonic components, and, this is based on the experiments shown in Fig. 1.
- In Fig. 1, the fundamental frequency fl is generated from
Frequency Synthesizer 41, with thesubharmonic component 1/2 fl, i.e., n = 1/2, which is produced byFrequency Synthesizer 45, whereby the threshold of audition, with respect to subharmonic components, illustrated by the 18 individuals who were tested, are obtained by means of the aforementioned methods.The average of the threshold values of the 18 tested individuals, are as follows: -

- Similarly, by a reversal of the threshold of subharmonic components as illustrated in the last Table, that is, by drawing a figure by taking the absolute value of the dB values as shown in the last Table, one will get Curve B as shown in Fig. 13, while keeping in mind that the reference level, that is, the 0 dB level line shall have to be shifted upwardly by +70 dB, with a view to comply with the presence of the +70 dB gain, as illustrated in Example 3, Fig. 15.
- It deserves to be pointed out again that distortions measured with conventional distortion meters will by no means reflect the degree or magnitude or modality of distortion appreciated by human auditory faculties. This is because a distortion meter will measre the harmonics regradless of "order", on the same conditions without discrimination whatsoever, and needless to say, without weighting, to the effect that the results obtained through measurement by conventional distortion meters do not bear an acoustic interpretation at all. They, at best, provide for some physical meaning only. It is therefore apparent from the results of the experiments described above, distortions measure by means of the circuit represented by the system of a first embodiment of this invention, as shown in Fig. 4, almost perfectly coincide with human auditory appreciation.
- Fig. 4 shows a block diagram of a first embodiment of the aditory distortion evaluation device of this invention.
- The device comprises a
notch filter 401, aprimary weighting network 402, asecondary weighting network 403, anamplifier 404, a first rectifier andripple filter 405, aratio circuitry 406, a display unit (or meter) 407, and a second rectifier andripple filter 408. - The portion of Fig. 4 from point K to point A represents the circuit as given in Fig. 2, wherein the time constant of any of the three RC filters that constitute the primary weighting network is express as RC = (1/12) x (1/2πf1). By derivation, the cutoff frequency of -3 dB cause by the value of CR in each segment is 12 times the fundamental frequency fl.
- The
secondary weighting network 403 provides for a characteristic frequency response which is virtually a reversal of the above mentioned equal-loudness-level contours, like what is shown in Curve A of Fig. 13. - When referring to Fig. 4, an input signal (fl +Hfn) which is to be measured, by having its fundamental frequency fl attenuated at
Notch Filter 401, the output at the output point, which is forfilter 401, point K, which all consist of harmonics alone and is to be weighted for the first time by a primary weighting network, comprising a series of three high pass filters 402, before going tosecondary weighting network 403 for a secondary weighting, and then amplified byamplifier 404, rectified byfirst rectifier 405 for a true r.m.s. AC/DC conversion and further filtered as inputs to the right side terminal ofratio circuitry 406, such a ratio circuitry can be composed of a logarithmic converter, for which the reference input can be considered as the input to the left side terminal ofratio circuity 406, as illustrated in Fig. 4, or else as an input to an analogue divider, by considering the input at the left end ofratio circuitry 406, as the denominator and the other input, at the right end thereof, as the numerator. - The input signal fl + Lfn is also applied to
second rectifier 408 whereby the input signal undergoes a true r.m.s. AC/DC conversion and is filtered before being fed to an input point at the left end ofratio circuitry 406. -
Ratio circuitry 406 will take the ratio of two signals fed into the left and the right ends with the results fed tthedisplay unit 407 for demonstration, which will be of a truly reflective value to human auditory appreciation, in response to audio distortions, and which is to be referred to as "auditory distortion", according to the present invention, which can be expressed in terms of % or dB. The reference value 0 dB of the auditory distortion is defined as follows: - Supposing the frequency response curve of the
secondary weighting filter 403 is identical to curve A as shown in Fig. 13, providing that the insertion loss of the notch filter is 0 dB for any frequencies, other than for notch frequency fl, and if the weighted and amplified output voltage ofamplifier 404 is equal to the voltage of the input signal fl + Σfn, then 0 dB of auditory distortion is obtained when the gain ofamplifier 404 is 70 dB. According to the results of numerous experiments conducted by the inventor, the lowest audible level of an auditory distortion, as appreciated by most people, is about 0 to -10 dB. - It has to be pointed out that
notch filter 401, as shown in Fig. 4, is not absolutely necessary, except when it is desirous to determine auditory distortion of a level that is lower than 10 dB, bereft of that, the margin of error will become large. - For the circuit, as illustrated in Fig. 4, if both the primary weighting network and the
secondary weighting network - Fig. 5 shows a block diagram of a second embodiment of the device of this invention, which comprises a
level control circuit 504, anotch filter 501, aprimary weighting filter 502, asecondary filter 503, ancomplifier 505, arectifier 506, and adisplay unit 507. -
Level control circuit 504 can be of the manual level control mode or automatic level control mode, both meant to convert the level of the input signal fl +' 1:fn into a constant value. The signal voltage at point P would then be a constant value, and, then the rectifier and filter 506 anddisplay unit 507, as shown in Fig. 5, will obtain the same function as dounits - It is advisable to draw % scale or dB scale on the scale plate of the display unit (meter), so as to indicate auditory distortion in terms of percentage or dB readings.
- The devices represented in Fig. 4 and Fig. 5 are most noticeably distinguished from conventional distortion meters in the filtering and weighting of harmonic components, the weighting can be accomplished alternatively by the method of digital procession, for which a block diagram is shown in Fig. 14.
- The illustrations of Fig. 14 include an anti-
aliasing filter 1401, a sample/hold circuitry S/H 1402, an analogue todigital converter 1403 and adata processing unit 1400 embodying both hardward and softward which includedigital filter 1404,r.m.s. converter program 1406 anddisplay unit 1407. - The incoming signal fl + rfn will go through anti-
aliasing filter 1401, S/H 1402 andADC 1403 for digitization, to be further subject to treatment bydigital filter 1404, that is, weighting processing, to yield aweighted data 1405, prior to being converted by said r.m.s. converter program to yield corresponding r.m.s. value and to be demonstrated bydisplay unit 1407. - Should the signals to be evaluated be harmonic components of higher orders, then the frequency response from the
digital filter 1404, as shown in Fig. 14, shall be identical to a composite frequency response that is a combination of the output from theprimary weighting network 20 and thesecondary weighting network 24 as shown in Fig. 2, but if the signals to be evaluated contains subharmonic components, thendigital filter 1404's performance shall correspond to that ofBPF 31, as shown in Fig. 3 and get the. subharmonic components, then, such subharmonic components will be weighted, by means of the frequency response characteristics, produce from thethird weighting network 32 as shown in Fig. 3. - In the circuits illustrated in Fig. 4 and Fig. 5 weighting is imposed on harmonic components of higher orders only, and where determinative measurements of subharmonic components are intended, the circuit disclosed in Example 3 below will have to be employed.
- As described in the foregoing, the circuit, as shown in Fig. 3, serves as a means of weighting the subharmonic component, so by connecting the circuit shown in Fig. 3 to the circuit shown in Fig. 4, one will get a circuit that is capable of determing a subharmonic component, as well as harmonic components of higher orders; an example of this is shown in Fig. 15.
- Fig. 15 illustrates a circuit that is entirely identical to that circuit shown in Fig. 4, with the additional incorporation of a
band pass filter 151, athird weighting network 152 and a summingamplifier 153. - As a rule, incoming signal fl + Σfn will have its fundamental frequency fl amply attenuated by
notch filter 150 before being fed to theBand pass filter 151 where only the subharmonic component will be fed through; and higher order harmonic components will be attenuated, the resonate frequency of theBand pass filter 151 should be exactly half of fl. The subharmonic component will be weighted byweighting filter 152, before being fed to Summingamplifier 153 via Rl for amplification. - The frequency response curve of the
weighting filter 152 should be the same as curve B, shown in Fig. 13. - Now suppose that the gain of the
band pass filter 151, relative to subharmonic components is taken to be 1, then the gain of the reference level in curve B of Fig. 13 is also 1, in which case Rl = R2 = R3/3162, that is, gain of A4 = 70 dB, and that is deemed to be a suitable combination, and accordingly, the auditory distortion, determined through the system, represented in Fig. 15 will then correspond totally to actual human auditory appreciation. - To obtain a reliably accurate measurement result, it is preferable to set the summation of the rejection ratio of both
notch filter 150 andband pass filter 151 relative to the fundamental frequency fl, individually and severally, to be of a value that is greater than -80 dB. - In Fig. 4, Fig. 5 and Fig. 15, the primary weighting network invariably adopted a three-order RC high pass filter arrangent. Nevertheless a four-order or even five-order high pass filter, for instance, a four-order stage can be comprised of two cascaded state variable filters, where it is intended to determine spurious noises produced by a loudspeaker, this is because a loudspeaker will usually suffer ample distortions for harmonics of the second or even third order, especially in frequencies lower than its natural resonant frequency; but, as a matter of fact, distortion of that nature is used to be tolerated by loudspeaker manufacturers, whereas spurious noises, owing to sand or dust that are carried into the gap of a voice coil, are typically of harmonics of higher orders, which would be less tolerable so it has been proposed to employ high pass flters of the fourth or fifth order, with a view to attenuate amply harmonic components of lower orders, while attenuating much less harmonics of higher orders, such a weighting process will prove more suitable for detection of spurious noises produced by loudspeakers than the weighting achieved by the high pass filter of the third order disclosed hereinbefore.
- The high pass filters that is employed in the illustrations of Fig. 4, Fig. 5 or Fig. 15 are alike, and all of the RC mode through manual tuning, and employment of a synchronous tracking filter will permit continuous measurement of auditory distortion for the entire audio frequency range, and also a recording of the curve of variation of auditory distortion, by means of a level recorder, using the frequency as the abscissa.
- To reach that objective, the
notch filter 150,band pass filter 151 and high pass filter, as illustrated in Fig. 15 must all be of type VCF (Voltage Controlled Filter), a typical instance for the execution of such a VCF is an embodiment using state variable filters, having three outputs each for the high pass filter, low pass filter and the band pass filter respectively; but if the high pass and low pass output are summed together by a summing amplifier, then the output of the summing amplifier will account for a notch filter. In the state variable filter there are incorporated two integrators, each provided with a pair of RC combinations to serve to determine the resonant frequency. It is permissible to replace both resistors in such RC combinations with two analogue multipliers to constitute for a voltage controld filter. - What is shown in Fig. 6 is one embodiment of the secondary weighting network, as illustrated in Fig. 2, Fig. 4, Fig. 5, or Fig. 15.
- The illustration, as shown in Fig. 6, includes a series of high pass filters 81, a
band dip filter 82 and a series of low pass filters 83, the most important filters of them all being the low pass filters 83.High pass filter 81 comprises capacitors Cl and C2, resisters Rl --- R4 and an amplifier Al; andband dip filter 82 comprises resisters R5 and Rs, a capacitor C3, and an inductor Ll; andlow pass filter 83 comprises resisters R6 --- R15, capacitors C4 to C13, and amplifiers A2 --- A5. - The purpose of the circuit, as shown in Fig. 6, is to produce a composite frequency response that will best correspond to the Curve A, as shown in Fig. 13. In Curve A, frequency response for frequencies lower than 4 KHz are achieved by high pass filters 81, whilst the dip in frequency response for frequency ranging from 500 Hz through 3 KHz are achieved through
band dip filter 82, and that frequency response for frequencies higher than 4 KHz are achieved through low pass filters 83. From Curve A it will be seen that the frequency response remains free from any substantial variation whatsoever, for frequencies lower than 4 KHz, but will decline sharply, which means a dractic attenuation. Thus it becomes apparent that the roll-off, namely, the sharp declination that is the frequency response for frequencies higher than 4 KHz, should deserve much considerations, and the reasons are as follows: - Supposing that the Curve A, as shown in Fig. 13 is revised to be such that the frequency response for frequencies lower than 6.6 KHz turns flat, and that frequency response for frequencies higher than 6.6 KHz remains unchanged, i.e.; like what is shown in Curve A Fig. 13, and the secondary weighting network as illustrated in Fig. 2, Fig. 4, Fig. 5 or Fig. 15 is replaced by such a network, for each of them respectively, having the characteristics of such a modified frequency response, the errors arising out of the evaluation of frequencies ranging from 100 Hz through 6.6 KHz would increase by plus/minus 4.5 dB at worst, and that is still permissible in applications.
- It is because the low pass filters 83, as shown in Fig. 6, serves to cause roll-offs in'the frequency responses for frequencies higher than 4 KHz, so that low pass filters 83 are of prime interest, in the circuit represented in Fig. 6, and if both
high pass filter 81 andband dip filter 82 are removed so that low pass filters 83 alone are left, and would but incur an additional tolerance of plus/minus 4.5 dB in the frequency response for frequencies ranging from 100 Hz through 6.6 KHz, as described above. - So a prerequisite condition for the secondary weighting network as set forth in the present invention, lies in the incorporation of the low pass filter which is a part of the claim of this invention.
- In order to achieve precise results, t is preferable to employ the circuit, as illustrated in Fig. 6, in order to obtain the frequency response exactly as depicted in Curve A of Fig. 13; by doing so, a weighting performance that can best match human auditory appreciation, will be effected. It should now be apparent that the secondary weighting network, as described above, is adapted for weighting harmonic components of higher orders.
- Regarding a third weighting network, serving as a weighting network for subharmonic components exclusively, which is another embodiment provided for, according to the invention, it is, as shown in Fig. 7.
- As shown in Fig. 7, the third weighting network comprises of a series of high pass filters 71, a
band dip filter 72 and a series of low pass filters 73, which, on the whole, resembles very much what is shown in Fig. 6. The frequency response of the circuit, as shown in Fig. 7, must correspond closely to the Curve B, as shown in Fig. 13. For the low pass filters 71, as shown in Fig. 7, the -3 dB cutoff frequency lies between 800 Hz and 3 KHz, from which the frequency response for low frequency band, that is, frequencies lower than 1 KHz, as represented in Curve B of Fig. 13, are derived, whereas theBand dip filter 72 serves to produce such a form of frequency response, in which a dip prevails, for frequencies of 1 KHz through 4 KHz, like what is shown in Curve B, and that low pass filters 73 are accountable for the frequency response for frequencies higher than 5 KHz, as covered in Curve B; while it has to be stressed that the -3 dB cutoff frequency for low pass filters 73 should be somewhere beten 3 KHz and 14 KHz. - The
band dip filter 72, as seen in Fig. 7, is not absolutely indispensable, which, if eliminated so that high pass filters 71 and low pass filters 73 remain in the circuit, then the composite frequency response to result therefrom, would be as if resulting from one band pass filter only. That is admittedly less than the precision requirement, but, when carefully designed, the result of a maximum tolerance of plus/minus 5 dB would be obtained, and that, will nevertheless be acceptable for usage. - A conclusion, therefore, is that for the third weighting network, as seen in Fig. 7, a necessary prerequisite is the proviso that a series of high pass filters 71, as well as a series of low pass filters 73, are adjoined to make up a series connection.
- The device for measuring auditory distortions, according to the present invention, may be used to evaluate preamplifiers, loudspeakers, headphones, power amplifiers, equalizers etc., so as to further improve on the accuracy of the evaluation. The magnitude of the auditory distortion data, measured or evaluated, thereby, will truly serve as an index representative of the amplitudes of distortions, as it is apprehended by human auditory faculties, and is distinguished from conventional approaches, regarding the evaluation of audio distortions, which can only yield results bearing physical meaning, without being representative of the true feelings apprehended by human auditory faculties.
- Accordingly, preferred embodiments of the device for evaluating auditory distortions have been described above, by means of example, and it should be understood that the construction and arrangement of the device of this invention can be otherwise modified, by persons skilled in electronics. So that the notch filter shown in Fig. 4 and Fig. 5, may be eliminated. RC-type filters employed in the primary, secondary and third weighting filters may be replaced by digital filters as set forth in the foregoing description, and the amplifier A4 shown in Fig. 4 and Fig. 5, may conveniently be eliminated in certain applications, without departing from the scope and spirit of this invention, as defined in the asppended claims.
Claims (10)
1. A method for evaluating auditory distortions of an audio system, comprising of the following steps:
(a) weighting an input audio signal produced by the audio system, first with a primary weighting means, comprising a series of high pass filters, and then, with a secondary weighting means to produce a weighted signal;
(b) rectifying and filtering the weighted signal by a first rectifier and a first ripple filter, to produce a first signal;
(c) rectifying and filtering the input audio signal by a second rectifier and a second ripple filter to produce a second signal;
(d) comparing the magnitude of said first signal with that of said second signal and displaying the ratio of the magnitudes of said first and second signals.
2. A method for evaluating auditory distortions of an audio system, comprising the steps of:
(a) applying an input audio signal produced by the audio system, having a fundamental frequency to a level control circuit to produce a constant level signal;
(b) weighting said constant level signal first with a primary weighting means, comprising a series of high pass filters, and then with a secondary weighting means to produce a weighted signal;
(c) rectifying and filtering said weighted signal by a rectifier and a ripple filter to produce an output signal; and
(d) displaying the magnitude of said output signal.
3. A method for evaluating auditory distortions of an audio system, comprising the steps of:
(a) weighting an input audio signal including a subharmonic component, produced by the audio system, first with a primary weighting means comprising a series of high pass filters, and then with a secondary weighting means, to produce a first weighted signal;
(b) applying said input audio signal to a band pass filter to allow only said subharmonic component to pass therethrough and then weighting said subharmonic component by a third weighting means to produce a second weighted signal;
(c) mixing said first weighted signal with said second weighted signal to produce a mixed signal;
(d) rectifying and filtering said mixed signal by a first rectifier and a first ripple filter to produce a first rectified signal;
(e) rectifying and filtering said input audio signal by a second rectifier and a second ripple filter to produce a second rectified signal;
(f) comparing the magnitude of said first rectified signal with that of said second rectified signal and displaying the ratio of the magnitudes of said first rectified signal and said second rectified signal.
4. An apparatus for evaluating auditory distortions of an audio system, comprising:
a primary weighting means for weighting an input audio signal, produced by the audio system; said primary weighting means comprising a series of high pass filters;
a sceondary weighting means for further weighting the weighted signal, produced by said primary weighting network;
a first rectifier and a ripple filter for rectifying and filtering said further weighted signal to produce a first output signal;
a second rectifier and a ripple filter for rectifying and filtering said input audio signal to produce a second output signal;
a ratio circuitry for comparing the magnitudes of said first output signal and that of said second output signal to produce a ratio signal;
a display unit for showing the magnitude of the ratio of said first output signal and said second output signal, in response to said ratio signal.
5. An apparatus for evaluating auditory distortions of an audio system, comprising:
(a) a level control circuit for maintaining an input audio signal produced by said audio system to become a constant level signal;
(b) a primary weighting means, for weighting said constant level signal, and said primary weighting means comprises of a series of high pass filters;
(c) a secondary weighting means for further weighting the weighted signal produced by said primary weighting means;
(d) a rectifier and a ripple filter for rectifying and filtering the second weighted signal to produce an output signal;
(e) a display unit for showing the magnitude of said output signal.
6. An apparatus for evaluating auditory distortions of an audio system, comprising:
(a) a primary weighting means for weigfhting an input audio signal including a subharmonic component, produced by the audio system; and said primary weighting device comprises of a series of high pass filters;
(b) a secondary weighting means for further weighting the weighted signal, produced by said primary weighting means;
(c) a band pass filter for filtering said input audio signal to allow only said subharmonic component to pass therethrough to produce a filtered signal;
(d) a third weighting means for we4ighting said filtered signal;
(e) a mixer through which the signals produced by said secondary weighting means and said third weighting means are mixed to produce a mixed signal;
(f) a first rectifier and ripple filter for rectifying and filtering the mixed signal, produced by said mixer to produce a first output signal;
(g) a second rectifier and ripple filter for rectifying and filtering said input audio signal, to produce a second output signal;
(h) a ratio circuity for comparing the magnitude of said first output signal, with that of said second output signal, to produce a ratio signal;
(i) a display unit for displaying the magnitude of the ratio of said first output signal and second output signal, in response to said ratio signal.
7. The method as recited in claim 1, 2, or 3, wherein said secondary weighting means comprises of a series of low pass filters adapted to produce a frequency response, characteristicly having a -3 dB cutoff frequency in the range of 2 KHz to 12 KHz, and a roll-off slope ranging from 18 dB/oct. to 150 dB/oct.
8. The method as recited in claim 3, wherein said third weighting means comprises a series of high pass filters and a series of low pass filters, connected in series, with said series of high ;ass filters being adapted for producing a frequency response characteristicly having a -3 dB cutoff frequency, ranging from 500 Hz to 3 KHz, and, said series of low pass filters being adapted for producing a frequency response characteristicly having a -3 dB cutoff frequency, ranging from 3 KHz to 14 KHz.
9. The apparatus as recited in claim 4, 5, or 6, wherein said secondary weighting means comprises of a series of low pass filters, adapted to produce a frequency response characteristicly having a -3 dB cutoff frequency, ranging from 2 KHz to 12 KHz, and a roll off slope ranging from 18 dB/oct. to 150 dB/oct.
10. The apparatus as recited in claim 6, wherein said third weighting means comprises a series of high pass filters and a series of low pass filters connected in series, with said series of high pass filters being adapted to produce a frequency response characteristicly having a -3 dB cutoff frequency ranging from 500 Hz to 3 KHz, and said series of low pass filters, being adapted to produce a frequency response characteristicly having a -3 dB cutoff frequency ranging from 3 KHz to 14 KHz.
Applications Claiming Priority (2)
| Application Number | Priority Date | Filing Date | Title |
|---|---|---|---|
| GB8425829 | 1984-10-12 | ||
| GB08425829A GB2165654B (en) | 1984-10-12 | 1984-10-12 | Method and apparatus for evaluating auditory distortions of an audio system |
Publications (1)
| Publication Number | Publication Date |
|---|---|
| EP0186936A1 true EP0186936A1 (en) | 1986-07-09 |
Family
ID=10568096
Family Applications (1)
| Application Number | Title | Priority Date | Filing Date |
|---|---|---|---|
| EP85306211A Withdrawn EP0186936A1 (en) | 1984-10-12 | 1985-09-02 | Method and apparatus for evaluating auditory distortions of an audio system |
Country Status (4)
| Country | Link |
|---|---|
| US (1) | US4706290A (en) |
| EP (1) | EP0186936A1 (en) |
| DK (1) | DK392385A (en) |
| GB (1) | GB2165654B (en) |
Cited By (4)
| Publication number | Priority date | Publication date | Assignee | Title |
|---|---|---|---|---|
| DE4008298A1 (en) * | 1990-03-15 | 1991-09-19 | Veba Kraftwerke Ruhr | Overshoot indicator for electrical mains network - passes mains voltage signal through fundamental frequency blocking filter for comparison with unfiltered main voltage |
| DE10043894A1 (en) * | 2000-07-28 | 2002-02-07 | Rohde & Schwarz | Method and measuring device for measuring the spectrum in adjacent channels |
| US6744247B2 (en) | 2000-07-28 | 2004-06-01 | Rohde & Schwarz Gmbh & Co. Kg | Method and measuring device for measuring the spectra in adjacent channels |
| RU2615016C2 (en) * | 2015-09-07 | 2017-04-03 | Федеральное государственное бюджетное образовательное учреждение высшего образования "Санкт-Петербургский государственный институт кино и телевидения" (СПбГУКиТ) | Device for measuring auditory-adapted harmonic distortions of electrical signal |
Families Citing this family (12)
| Publication number | Priority date | Publication date | Assignee | Title |
|---|---|---|---|---|
| US5247458A (en) * | 1990-09-11 | 1993-09-21 | Audio Precision, Inc. | Method and apparatus for testing a digital system for the occurrence of errors |
| KR950010340B1 (en) * | 1993-08-25 | 1995-09-14 | 대우전자주식회사 | Audio signal distortion calculating system using time masking effect |
| KR970005131B1 (en) * | 1994-01-18 | 1997-04-12 | 대우전자 주식회사 | Digital audio encoding apparatus adaptive to the human audatory characteristic |
| DE602005006973D1 (en) * | 2004-01-19 | 2008-07-03 | Nxp Bv | SYSTEM FOR AUDIO SIGNAL PROCESSING |
| JP2009044268A (en) * | 2007-08-06 | 2009-02-26 | Sharp Corp | Sound signal processing device, sound signal processing method, sound signal processing program, and recording medium |
| JP5992427B2 (en) * | 2010-11-10 | 2016-09-14 | コーニンクレッカ フィリップス エヌ ヴェKoninklijke Philips N.V. | Method and apparatus for estimating a pattern related to pitch and / or fundamental frequency in a signal |
| US8712066B1 (en) | 2013-03-14 | 2014-04-29 | Rockford Corporation | Audio signal clip detection |
| GB201518240D0 (en) | 2015-10-15 | 2015-12-02 | Rolls Royce Plc | A method of performing real time decomposition of a signal into components |
| US10397692B2 (en) * | 2017-03-08 | 2019-08-27 | Thomas A. Janes | Multi-driver array audio speaker system |
| US10524052B2 (en) * | 2018-05-04 | 2019-12-31 | Hewlett-Packard Development Company, L.P. | Dominant sub-band determination |
| JP7379988B2 (en) * | 2019-09-20 | 2023-11-15 | 株式会社ソシオネクスト | Fundamental frequency determining device, pseudo bass processing device, fundamental frequency determining method, and acoustic processing method |
| CN112133328B (en) * | 2020-08-03 | 2023-07-25 | 北京百度网讯科技有限公司 | Evaluation information generation method and device for audio data |
Citations (1)
| Publication number | Priority date | Publication date | Assignee | Title |
|---|---|---|---|---|
| DD152425A1 (en) * | 1980-07-28 | 1981-11-25 | Bernhard Mueller | DEVICE FOR MEASURING ELECTRICITY AND VOLTAGE OVEN HEATING IN ELECTRIC POWER SUPPLY NETWORKS |
Family Cites Families (4)
| Publication number | Priority date | Publication date | Assignee | Title |
|---|---|---|---|---|
| GB1169706A (en) * | 1966-09-29 | 1969-11-05 | English Electric Co Ltd | An Electrical Fault Detector |
| US3594506A (en) * | 1968-04-01 | 1971-07-20 | Columbia Broadcasting Systems | Loudness level indicator |
| US3696206A (en) * | 1970-11-27 | 1972-10-03 | Du Pont | Audio dosimeter |
| US4307385A (en) * | 1978-11-22 | 1981-12-22 | Sue Ann Evans | Noise monitoring apparatus |
-
1984
- 1984-10-12 GB GB08425829A patent/GB2165654B/en not_active Expired
-
1985
- 1985-08-29 DK DK392385A patent/DK392385A/en not_active Application Discontinuation
- 1985-09-02 EP EP85306211A patent/EP0186936A1/en not_active Withdrawn
- 1985-09-04 US US06/772,457 patent/US4706290A/en not_active Expired - Fee Related
Patent Citations (1)
| Publication number | Priority date | Publication date | Assignee | Title |
|---|---|---|---|---|
| DD152425A1 (en) * | 1980-07-28 | 1981-11-25 | Bernhard Mueller | DEVICE FOR MEASURING ELECTRICITY AND VOLTAGE OVEN HEATING IN ELECTRIC POWER SUPPLY NETWORKS |
Cited By (4)
| Publication number | Priority date | Publication date | Assignee | Title |
|---|---|---|---|---|
| DE4008298A1 (en) * | 1990-03-15 | 1991-09-19 | Veba Kraftwerke Ruhr | Overshoot indicator for electrical mains network - passes mains voltage signal through fundamental frequency blocking filter for comparison with unfiltered main voltage |
| DE10043894A1 (en) * | 2000-07-28 | 2002-02-07 | Rohde & Schwarz | Method and measuring device for measuring the spectrum in adjacent channels |
| US6744247B2 (en) | 2000-07-28 | 2004-06-01 | Rohde & Schwarz Gmbh & Co. Kg | Method and measuring device for measuring the spectra in adjacent channels |
| RU2615016C2 (en) * | 2015-09-07 | 2017-04-03 | Федеральное государственное бюджетное образовательное учреждение высшего образования "Санкт-Петербургский государственный институт кино и телевидения" (СПбГУКиТ) | Device for measuring auditory-adapted harmonic distortions of electrical signal |
Also Published As
| Publication number | Publication date |
|---|---|
| GB2165654A (en) | 1986-04-16 |
| DK392385D0 (en) | 1985-08-29 |
| DK392385A (en) | 1986-04-13 |
| GB8425829D0 (en) | 1984-11-21 |
| GB2165654B (en) | 1988-05-25 |
| US4706290A (en) | 1987-11-10 |
Similar Documents
| Publication | Publication Date | Title |
|---|---|---|
| US4706290A (en) | Method and apparatus evaluating auditory distortions of an audio system | |
| Churcher et al. | The performance of noise meters in terms of the primary standard | |
| JPH03500583A (en) | Equipment for inspecting audio signal processing systems | |
| Katalin | Studying noise measurement and analysis | |
| Cabrera et al. | Increasing robustness in the calculation of the speech transmission index from impulse responses | |
| CN103983345B (en) | A kind of single-frequency based on human hearing characteristic has voicing signal automatic monitoring method | |
| US4344028A (en) | Testing device for low-frequency amplifiers | |
| Fielder | Evaluation of the audible distortion and noise produced by digital audio converters | |
| Kob et al. | Band filters and short reverberation times | |
| JPS61107900A (en) | Method and device for evaluating aural strain of audio system | |
| Bodlund | On the use of the integrated impulse response method for laboratory reverberation measurements | |
| US3621404A (en) | Signal level control instrument for sound transmission systems | |
| US5134657A (en) | Vocal demodulator | |
| US11528558B2 (en) | Method and an audio processing unit for detecting a tone | |
| JP2963030B2 (en) | Audio amplifier switching noise measurement device | |
| Townsend et al. | Comparison of Total Harmonic Distortion Measures among Hearing Aid Test Systems | |
| Bordone | Some aspects of the non-linear distortion of loudspeakers | |
| Rabek | Instrumenting the Subjective Measurement of Product Noise | |
| Cabot | Audio measurements | |
| Lin | Measurement of auditory distortion with relation between harmonic distortion and human auditory sensation | |
| WILLIAMS | Instruments for Measuring Sound | |
| Kalbitz | Effect of Material Changes on the Total Harmonic Distortions Caused by Aluminum Electrolytic Capacitors | |
| JP2001013977A (en) | Formant stressing device of speech vector | |
| Berth-Jones | Intermodulation distortion—its significance | |
| CN115460527A (en) | Headphone distortion measuring method based on psychoacoustics, storage medium and headphone |
Legal Events
| Date | Code | Title | Description |
|---|---|---|---|
| PUAI | Public reference made under article 153(3) epc to a published international application that has entered the european phase |
Free format text: ORIGINAL CODE: 0009012 |
|
| AK | Designated contracting states |
Kind code of ref document: A1 Designated state(s): AT DE FR IT NL |
|
| 17P | Request for examination filed |
Effective date: 19860704 |
|
| 17Q | First examination report despatched |
Effective date: 19880321 |
|
| STAA | Information on the status of an ep patent application or granted ep patent |
Free format text: STATUS: THE APPLICATION IS DEEMED TO BE WITHDRAWN |
|
| 18D | Application deemed to be withdrawn |
Effective date: 19880802 |