EP0184428A2 - Optics system for emission spectrometer - Google Patents
Optics system for emission spectrometer Download PDFInfo
- Publication number
- EP0184428A2 EP0184428A2 EP85308799A EP85308799A EP0184428A2 EP 0184428 A2 EP0184428 A2 EP 0184428A2 EP 85308799 A EP85308799 A EP 85308799A EP 85308799 A EP85308799 A EP 85308799A EP 0184428 A2 EP0184428 A2 EP 0184428A2
- Authority
- EP
- European Patent Office
- Prior art keywords
- spectral
- regions
- spectral energy
- dispersed
- spectral regions
- Prior art date
- Legal status (The legal status is an assumption and is not a legal conclusion. Google has not performed a legal analysis and makes no representation as to the accuracy of the status listed.)
- Withdrawn
Links
- 230000003595 spectral effect Effects 0.000 claims abstract description 275
- 239000006185 dispersion Substances 0.000 claims abstract description 16
- 238000000034 method Methods 0.000 claims description 24
- 238000009826 distribution Methods 0.000 claims description 15
- 230000000903 blocking effect Effects 0.000 claims description 4
- 238000001228 spectrum Methods 0.000 abstract description 15
- 230000003287 optical effect Effects 0.000 abstract description 12
- 238000004611 spectroscopical analysis Methods 0.000 abstract description 6
- 238000004993 emission spectroscopy Methods 0.000 abstract description 3
- 238000004519 manufacturing process Methods 0.000 abstract description 3
- 238000004847 absorption spectroscopy Methods 0.000 abstract description 2
- 238000000149 argon plasma sintering Methods 0.000 abstract description 2
- 238000010141 design making Methods 0.000 abstract 1
- 230000000873 masking effect Effects 0.000 abstract 1
- 230000005855 radiation Effects 0.000 description 10
- 229910052729 chemical element Inorganic materials 0.000 description 8
- XEEYBQQBJWHFJM-UHFFFAOYSA-N Iron Chemical compound [Fe] XEEYBQQBJWHFJM-UHFFFAOYSA-N 0.000 description 6
- 238000005259 measurement Methods 0.000 description 6
- 238000004458 analytical method Methods 0.000 description 5
- 230000000875 corresponding effect Effects 0.000 description 4
- 238000010521 absorption reaction Methods 0.000 description 3
- 150000001875 compounds Chemical class 0.000 description 3
- 230000004907 flux Effects 0.000 description 3
- 230000006872 improvement Effects 0.000 description 3
- 229910052742 iron Inorganic materials 0.000 description 3
- RTAQQCXQSZGOHL-UHFFFAOYSA-N Titanium Chemical compound [Ti] RTAQQCXQSZGOHL-UHFFFAOYSA-N 0.000 description 2
- 229910052782 aluminium Inorganic materials 0.000 description 2
- XAGFODPZIPBFFR-UHFFFAOYSA-N aluminium Chemical compound [Al] XAGFODPZIPBFFR-UHFFFAOYSA-N 0.000 description 2
- 230000008901 benefit Effects 0.000 description 2
- 239000011159 matrix material Substances 0.000 description 2
- 239000003921 oil Substances 0.000 description 2
- 230000008569 process Effects 0.000 description 2
- 229910052719 titanium Inorganic materials 0.000 description 2
- 239000010936 titanium Substances 0.000 description 2
- VYZAMTAEIAYCRO-UHFFFAOYSA-N Chromium Chemical compound [Cr] VYZAMTAEIAYCRO-UHFFFAOYSA-N 0.000 description 1
- RYGMFSIKBFXOCR-UHFFFAOYSA-N Copper Chemical compound [Cu] RYGMFSIKBFXOCR-UHFFFAOYSA-N 0.000 description 1
- FYYHWMGAXLPEAU-UHFFFAOYSA-N Magnesium Chemical compound [Mg] FYYHWMGAXLPEAU-UHFFFAOYSA-N 0.000 description 1
- ZOKXTWBITQBERF-UHFFFAOYSA-N Molybdenum Chemical compound [Mo] ZOKXTWBITQBERF-UHFFFAOYSA-N 0.000 description 1
- XUIMIQQOPSSXEZ-UHFFFAOYSA-N Silicon Chemical compound [Si] XUIMIQQOPSSXEZ-UHFFFAOYSA-N 0.000 description 1
- BQCADISMDOOEFD-UHFFFAOYSA-N Silver Chemical compound [Ag] BQCADISMDOOEFD-UHFFFAOYSA-N 0.000 description 1
- 230000004913 activation Effects 0.000 description 1
- 238000003491 array Methods 0.000 description 1
- 230000005540 biological transmission Effects 0.000 description 1
- 229910052804 chromium Inorganic materials 0.000 description 1
- 239000011651 chromium Substances 0.000 description 1
- 238000010276 construction Methods 0.000 description 1
- 238000004320 controlled atmosphere Methods 0.000 description 1
- 229910052802 copper Inorganic materials 0.000 description 1
- 239000010949 copper Substances 0.000 description 1
- 230000002596 correlated effect Effects 0.000 description 1
- 238000005260 corrosion Methods 0.000 description 1
- 230000007797 corrosion Effects 0.000 description 1
- 238000013461 design Methods 0.000 description 1
- 238000001514 detection method Methods 0.000 description 1
- 238000011835 investigation Methods 0.000 description 1
- 229910052749 magnesium Inorganic materials 0.000 description 1
- 239000011777 magnesium Substances 0.000 description 1
- 239000000463 material Substances 0.000 description 1
- 239000000203 mixture Substances 0.000 description 1
- 229910052750 molybdenum Inorganic materials 0.000 description 1
- 239000011733 molybdenum Substances 0.000 description 1
- -1 nickle Chemical compound 0.000 description 1
- 230000008520 organization Effects 0.000 description 1
- 238000004451 qualitative analysis Methods 0.000 description 1
- 230000008439 repair process Effects 0.000 description 1
- 238000000926 separation method Methods 0.000 description 1
- 239000010703 silicon Substances 0.000 description 1
- 229910052710 silicon Inorganic materials 0.000 description 1
- 229910052709 silver Inorganic materials 0.000 description 1
- 239000004332 silver Substances 0.000 description 1
- 238000010561 standard procedure Methods 0.000 description 1
- 231100000331 toxic Toxicity 0.000 description 1
- 230000002588 toxic effect Effects 0.000 description 1
- 231100000701 toxic element Toxicity 0.000 description 1
Images


Classifications
-
- G—PHYSICS
- G01—MEASURING; TESTING
- G01J—MEASUREMENT OF INTENSITY, VELOCITY, SPECTRAL CONTENT, POLARISATION, PHASE OR PULSE CHARACTERISTICS OF INFRARED, VISIBLE OR ULTRAVIOLET LIGHT; COLORIMETRY; RADIATION PYROMETRY
- G01J3/00—Spectrometry; Spectrophotometry; Monochromators; Measuring colours
- G01J3/12—Generating the spectrum; Monochromators
- G01J3/18—Generating the spectrum; Monochromators using diffraction elements, e.g. grating
-
- G—PHYSICS
- G01—MEASURING; TESTING
- G01J—MEASUREMENT OF INTENSITY, VELOCITY, SPECTRAL CONTENT, POLARISATION, PHASE OR PULSE CHARACTERISTICS OF INFRARED, VISIBLE OR ULTRAVIOLET LIGHT; COLORIMETRY; RADIATION PYROMETRY
- G01J3/00—Spectrometry; Spectrophotometry; Monochromators; Measuring colours
- G01J3/02—Details
- G01J3/0205—Optical elements not provided otherwise, e.g. optical manifolds, diffusers, windows
- G01J3/0229—Optical elements not provided otherwise, e.g. optical manifolds, diffusers, windows using masks, aperture plates, spatial light modulators or spatial filters, e.g. reflective filters
-
- G—PHYSICS
- G01—MEASURING; TESTING
- G01J—MEASUREMENT OF INTENSITY, VELOCITY, SPECTRAL CONTENT, POLARISATION, PHASE OR PULSE CHARACTERISTICS OF INFRARED, VISIBLE OR ULTRAVIOLET LIGHT; COLORIMETRY; RADIATION PYROMETRY
- G01J3/00—Spectrometry; Spectrophotometry; Monochromators; Measuring colours
- G01J3/12—Generating the spectrum; Monochromators
- G01J3/18—Generating the spectrum; Monochromators using diffraction elements, e.g. grating
- G01J3/1809—Echelle gratings
-
- G—PHYSICS
- G01—MEASURING; TESTING
- G01J—MEASUREMENT OF INTENSITY, VELOCITY, SPECTRAL CONTENT, POLARISATION, PHASE OR PULSE CHARACTERISTICS OF INFRARED, VISIBLE OR ULTRAVIOLET LIGHT; COLORIMETRY; RADIATION PYROMETRY
- G01J3/00—Spectrometry; Spectrophotometry; Monochromators; Measuring colours
- G01J3/12—Generating the spectrum; Monochromators
- G01J2003/1278—Mask with spectral selection
-
- G—PHYSICS
- G01—MEASURING; TESTING
- G01J—MEASUREMENT OF INTENSITY, VELOCITY, SPECTRAL CONTENT, POLARISATION, PHASE OR PULSE CHARACTERISTICS OF INFRARED, VISIBLE OR ULTRAVIOLET LIGHT; COLORIMETRY; RADIATION PYROMETRY
- G01J3/00—Spectrometry; Spectrophotometry; Monochromators; Measuring colours
- G01J3/28—Investigating the spectrum
- G01J3/2803—Investigating the spectrum using photoelectric array detector
Definitions
- This invention relates to method and apparatus for sorting spectral energy and in particular, the sorting of spectral energy for use in association with spectroscopy.
- spectral lines For example, in absorption, emission or light scattering spectroscopy, the total region spanned by all sections of interest may be several thousands of Angstroms (100's of nanometers), while spectral measurements are actually needed for one or more narrow spectral regions having a span of less than one Angstrom at a resolution of the order of 0.1 Angstrom in the vicinity of particular spectral lines.
- the total number of measurements wanted may be rather large. A certain amount of time is generally needed to make each measurement with adequate precision and there is the additional need to search out the appropriate spectral region for each line. As a result, the total amount of time required to scan, locate spectral regions, and carry out measurements can become quite large.
- the scanning spectrometer sweeps all of the wavelengths of the spectrum using a single detector to determine the presence of spectral lines in the sample being analyzed.
- the scanning spectrometer is slow and can only sense one narrow spectral band at one time.
- Ancther form of spectrometer has a plurality of detectors which can simultaneously select spectral energy lines in regions of interest.
- This type of spectrometer sometimes uses a separate exit slit photodetector and amplifier channel for each of the spectral energy lines to be measured. Some scanning is generally needed to examine the spectral region surrounding each line. For a given spectral resolution, the first method is slow and the second method expensive and not versatile.
- An improvement in dispersive spectrometers is disclosed in United States patent 3,700,332. It is directed to an absorption spectrometer which involves the use of a controlled vibrating chopping mask.
- a photoelectric detector receives stepwise a series of chopped line and band flux intensities from different selected portions of the spectrum and generates a group of electrical values, each proportional to the total flux transmitted through each array.
- a Hadamard matrix is used to analyze the light flux for each spectral line. This system involves several moving components including the vibrating chopping mask. Thus, the system must be isolated from surrounding ambient vibration to provide the needed accuracy. It also requires the complex mathematical Hadamard analysis.
- a correlation absorption spectrometer is disclosed in United States patent 3,955,891.
- the spectrometer has first and second spatial filters with a chopping device to alternately block light from the first filter onto two filter portions of the second filter.
- a weighted linear combination of the intensities of the selected wavelength interval of light from the light source is used.
- a Hadamard matrix the results are analyzed.
- the cassette is used in conjunction with a two dimensional array of photomultiplier tubes to determine if spectral energy lines are present at the opening in the cassette.
- the use of a movable prism and Echelle grating in conjunction with the cassette requires extreme precision in set-up to avoid inaccuracy in readings.
- the machine is also very susceptible to vibration caused by the surroundings.
- the unit is not readily interchangeable to sense various elements because the cassette positioning has to be very accurate to decipher all the spectral energy information arriving at the cassette. This makes the cassette very expensive.
- the use of cross-dispersion also limits the allowable entrance slit height on this spectrometer. In turn, this reduces the light gathering capability of the instrument.
- a similar type of system is disclosed in United States patent 4,391,523 to Leeman Labs Inc.
- first monochromator is used to select a single spectral region of interest and pass that single spectral region to a second spectrometer which disperses that single region to analyze specific spectral energy lines of the single spectral region.
- the advantage is that the first monochromator selects a . narrow spectral region which is then resolved in higher resolution by the second spectrometer.
- the disadvantage is that only one narrow spectral region can be selected at any given time. Therefore, to determine spectral information in widely separated parts of a larger spectral region, the two monochromators must be scanned. This method is both slow and expensive.
- a new method for sorting spectral energy.
- the method comprises dispersing incident spectral energy, then simultaneously selecting multiple spectral regions of the dispersed spectral energy.
- the simultaneously selected spectral regions of spectral energy are then recombined and further dispersed and the dispersed selected spectral regions are organized into a detectable spectral energy distribution pattern.
- a method for spectrometrically determining the presence of one or more suspected components in a sample.
- the method comprises passing incident spectral energy from an energized source including the sample through a slit to select incident spectral energy from the source.
- the incident spectral energy is dispersed and focused at a focal plane.
- Predetermined spectral energy regions of the focused dispersed spectral energy are simultaneously selected at the focal plane.
- the unwanted spectral regions are rejected.
- the optical beam of the selected spectral regions is collimated and recombined and directed onto an Echelle grating to disperse with high resolution the selected spectral regions.
- the dispersed selected spectral regions are then focused onto a focal plane.
- the presence and relative location of the spectral energies are detected to confirm the presence of suspected one or more components in the sample.
- apparatus for sorting spectral energy.
- the apparatus comprises first means for dispersing incident spectral energy to form a spectrum.
- Means is provided for simultaneously selecting multiple spectral regions from the spectrum.
- Means is provided for recombining the simultaneously selected spectral regions.
- Second means is provided for the additional dispersion of and organization of the dispersed spectral regions in a detectable spectral energy distribution pattern.
- an Echelle spectrometer for spectrometrically determining the presence and amount of one or more suspected components in the sample.
- the apparatus comprises an entrance slit to select incident spectral energy from an energized source including the sample.
- First means is provided for dispersing the isolated incident spectral energy and focusing the dispersed spectral energy at a first focal plane.
- Means is provided for simultaneously transmitting only selected spectral regions at said focal plane of the dispersed incident spectral energy.
- Means is provided for collimating and recombining the selected spectral regions and directing them onto an Echelle grating to disperse with high resolution the existing selected spectral regions.
- Means is provided for focusing the selected spectral regions dispersed by the Echelle grating onto a second focal plane. Means is provided for detecting the presence and relative location of the spectral energy. The means for transmitting selected spectral regions only transmits spectral regions which avoids appreciable overlap of the important spectral energy lines of the organized spectral energy distribution pattern.
- the method and apparatus may also determine quantitatively the amount of suspected one or more components in the sample by detecting the intensity of the representative spectral line or lines of the suspected component.
- FIG. 1 shows the special relationship of the optics 10 for use in a spectrometer.
- a source of incident radiation 12 is, in accordance with this embodiment of the invention, developed by a plasma of the standard type used in emission spectrometry.
- the radiant energy, from the plasma jet 11, into which a sample to be analyzed has been injected, is focused by lens 13 towards entrance slit 14.
- the entrance slit 14 isolates the incident energy to provide a beam of light 16 which is directed towards a concave reflective grating 18.
- the concave grating 18 functions to disperse the isolated incident spectral energy and to focus the dispersed spectral energy at a curved focal surface at which is located a mask 20.
- the concave grating 18 is designed to provide low dispersion of the incident spectral energy with low resolution of the spectral energy lines. It is appreciated that low and high resolution are relative terms in the field of spectroscopy. Specific values for low and high resolution will depend on the particular apparatus used and the regions of the spectrum to be analyzed. For purposes of discussion with respect to particular optics for the apparatus of Figure 1, low resolution is considered to be in the order of 35 Angstroms/millimeter for the central wavelength of 3000 A.
- the mask 20 is located at the focal surface of the concave grating known as the Rowland Circle.
- the mask has a plurality of slots 22 provided therein which are oriented parallel to the image of the entrance slit 14 formed at the position of the mask 20.
- the slots 22 in the mask 20 are located so as to pass or transmit spectral radiation in regions of the spectral energy which are of interest, in accordance with a predetermined scheme to be discussed.
- the mask portions between the slots 22 reject all remaining spectral energy which is unwanted.
- the characteristics of the concave grating 18 fix the location along the focal plane and the mask 20 of the various spectral regions for any wavelength in the incident spectral energy of a compound of interest. By knowing in advance the wavelengths of the spectral regions which are of interest in the spectrometric analysis, it is possible to position the slots in the mask to pass only the desired spectral regions of energy.
- the mask 20 serves to select simultaneously spectral regions of the dispersed spectral energy incident on the mask along line 26.
- the simultaneously selected spectral regions which are present due to the existence of a suspected compound and which emerge from the mask 20, pass along line 28 onto a corrective mirror 30.
- the corrective mirror is a concave reflective surface for collimating the spectral regions and directing them towards the planar grating 32 along line 34.
- the planar grating 32 serves to orient all of the columns of the selected spectral regions so that the collimated light along line 34 is recombined into an essentially single column of light along line 36 which contains all of the selected spectral regions of energy.
- the selected spectral regions are dispersed by an Echelle grating 38 which disperses the radiation about line 40 providing high resolution of the spectral energy lines of the selected spectral regions.
- Echelle grating 38 which disperses the radiation about line 40 providing high resolution of the spectral energy lines of the selected spectral regions.
- particular values for high resolution cannot be defined without reference to the apparatus used and spectral region being considered.
- corresponding high resolution value is in the order of 0.9 Angstroms/millimeter for the central wavelength of 3000 A.
- the highly resolved spectral energy lines of the stacked orders of the spectral regions are directed along line 40 to a focusing mirror 42 which organizes by focusing all of the dispersed spectral energy regions along line 46 onto a focal plane at detector 44.
- the detector determines the presence of the spectral energy lines at various positions along the horizontal dimensional length of the focal plane at the detector 44.
- the optical characteristics of the system particularly the Echelle grating 38 and the wavelengths which should be present if the suspected components are in the energized source, determine where the spectral energy lines will fall at the focal plane at detector 44. If the detector registers the appearance of a spectral energy at a particular location along the length of the detector, it may confirm thereby the presence and possibly the amount of a suspected component in a sample.
- the design of the optical components is in accordance with spectrometric standards. It is appreciated that with the particular arrangement, the gratings 18 and 32 are nearly coincident, and placed near the centre of curvature of the corrective mirror 30. The concave grating 18 then has a radius of curvature one-half that of the corrective mirror 30, and has the same line spacing as the planar grating 32 to provide the proper dispersion compensation and collimation of the transmitted radiation.
- the Echelle grating has the characteristics of dispersing the selected spectral regions in numerous orders so that all orders of the spectral regions are dispersed one on top of the other.
- the selection of the spectral regions at the mask may, therefore, be affected by the scheme of stacked orders of the highly resolved spectral energy lines from the Echelle grating.
- the highly resolved spectral energy lines of the elements should not appreciably overlap in the stacked orders of spectral energy.
- this may be accomplished by locating a second mask near the first which physically blocks out selected spectral energy emerging from the slot of the first mask.
- the blocking of the unwanted order of spectral energy emerging from the mask may be accomplished with transmission filters.
- the detector 44 may be a simple photographic plate which, when developed and having a base line calibration, shows the relative location and intensity of various spectral energy lines so that upon measuring from the base line location, one can determine by presence and location of the spectral energy line that it is a positive identification of a suspected element in the sample.
- a television camera may also be suitably used for the detector 44.
- Multiple-anode microchannel photomultipliers will be very effective detectors when these become readily available.
- a linear diode array is particularly suitable for use as a detector located where the focusing mirror 42 focuses the highly resolved spectral energy lines of the selected spectral regions into a linear pattern.
- Linear diode arrays are now available containing many hundreds of detector elements.
- all of the spectral information is focused onto a single dimension plane which enables detection of all of the information across the width of a linear diode array having a plurality of sensitive regions.
- the Echelle grating effectively divides the spectrum into spectrally narrower regions or orders and disposes them all one on top of the other in the same direction.
- the linear diode array is used in combination with an Echelle grating to sense the presence of selected spectral energy lines which are produced by suspected components in the sample.
- This arrangement eliminates the need for former uses of cross-dispersing systems in combination with Echelle gratings, such as disclosed in the aforementioned United States patents and has the advantage of allowing a long entrance slit to be used. It further eliminates the need to provide a scanning device for scanning several spectral regions having wide separation.
- the optical arrangement of this invention overcomes various problems by using a low resolution spectrograph to isolate simultaneously desired spectral regions of interest and remove unwanted spectral regions.
- the masked radiation is then collected and sent to a high resolution Echelle spectrograph
- a linear detector array is placed at the Echelle spectrograph focus.
- the selected spectral regions appear at the Echelle focus in high dispersion generally falling on separate sections of the detector array.
- the width of the focused spectral energy lines on the detector is relatively narrow. In considering wavelength in the region of 2000 to 4000 Angstroms, the focused width of the spectral energy lines may be in the range of 25 mm.
- the invention provides a means of selecting sections from various orders of an Echelle spectrograph without movement of any optically sensitive components. That is, all optical components of the system are fixed, except for the possible use of an interchangeable mask, or the alternate covering and uncovering of sections of a given mask. However, the mask's angular position is always fixed relative to the other components for detecting the presence of one or more components in the source.
- the concave grating 18 may be replaced by a collimating lens and a prism and a second prism used in place of the plane grating to provide for the recombining of the selected spectral regions.
- the collimating mirror following the mask may be replaced by several mirrors placed immediately behind the slots so as to direct the light back to a second concave grating which functions to remove the dispersion from the reflected spectral regions and direct the combined light onto the Echelle grating.
- the second concave grating may be chosen to defract the light as a collimated beam which is sent directly to the Echelle grating.
- a linear detecting device may be used to determine the presence of spectral energy lines.
- the radiation from the selected spectral regions is collimated onto the Echelle grating.
- the various wavelengths are separated into modes but with no cross-dispersion as the orders of spectral energy lie one on top the other. This need not present a problem when the wavelength regions have been judiciously preselected so as to not cause a conflict in spectral energy lines piling up on each other.
- the full spectral range of any order of the spectral energy from the Echelle grating may be fit in the physical length of the preferred linear diode array.
- the plot of Figure 2 shows the relative location of spectral energy lines along the spectrum as dispersed by the concave grating 18.
- the mask has slots formed therein so as to only pass the selected spectral lines for silicon, iron, magnesium, copper, titanium, silver, chromium, nickle, molybdenum and aluminum, should they be present in the sample. It is appreciated that for each of these elements, there are many spectral lines in the dispersed spectral energy region from an excited source containing all of these elements.
- the location in the mask 20 of the slots 22 can be readily calculated to pass only the selected regions of dispersed spectral energy for the elements noted in Figure 2. Taking into consideration the curvature of mask 22, the relative location and width of the slots can be chosen. Should the mask be formed of suitable material, the slots can be accurately machined into the mask in accordance with the positioning shown in Figure 3.
- Figure 4 shows the spectral energy lines as dispersed by the Echelle grating when given further dispersion in the cross-direction to provide a two dimensional presentation of the orders of selected spectral regions.
- a prism is normally used to cross-disperse the radiation reflected from the Echelle grating producing a two dimensional spectrum.
- the output at the Echelle grating provides spectral lines which do not appreciably overlap when the Echelle spectrum is allowed to remain without cross-dispersion.
- the spectral energy lines are at predetermined locations along the focal plane.
- the selected wavelength of titanium is furthest to the left and the selected spectral wavelength for aluminum is furthest to the right.
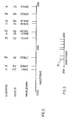
- the spectral orders of Figure 4 if vertically compressed, provide the relative location for the spectral energy lines as shown in Figure 5, which is the unaltered output from the Echelle grating according to this invention.
- the selected spectral lines when dispersed with high resolution by the Echelle grating do not appreciably overlap and are distinctly separate along the focal plane of Figure 5.
- the optics of the system 10 By knowing the characteristics of the optics of the system 10, one can determine, in accordance with standard procedures, the exact location along the linear array of the selected spectral lines. Thus, from a base line, a determination can be made as to whether or not the elements are present. For example, if there is no iron in the sample introduced to the plasma jet, then the line for iron having a wavelength of 2,599.70 Angstroms would not appear at the detector.
- the linear diode array having an overall length of approximately 20 to 30 mm with 1024 sensitive regions or detector elements can readily determine the presence of spectral energy lines in the spectrum to be analyzed. Knowing in advance which chemical elements are to be detected and knowing the characteristics of the optics, activation of particular detector elements along the length of the array determines the presence of the corresponding chemical element.
- the linear diode array may have 40 detector elements per millimeter of length of the detector. This provides a sufficient number of detector elements to determine the existence or non-existence of the selected spectral profile, also known as energy lines along the detector array.
- the locations in expanded view of the various selected spectral energy lines are the locations in expanded view of the various selected spectral energy lines.
- the location of the detector elements can be correlated with the spectral energy lines.
- the positions of detector elements which are actuated confirm the presence of a suspected chemical element in the source.
- the output from the linear diode array can be processed in many ways.
- a computer may be used having the necessary logic to process information from the linear diode array and correlate the particular numbered detector elements determined with the existence of chemical elements. In this manner, the computer may be used to confirm to the user the existence or non-existence of the suspected chemical elements in a source.
- the linear diode array and associated electronics may be obtained from various sources.
- a linear diode array having a cooled housing, for example, is obtained from Tracor-Northern of Wisconsin.
- the output of the linear diode array is interfaced with a computer.
- the analog signals from the linear diode array are converted to digital signals which are then processed by the computer to confirm which of the suspected chemical elements are present in the sample.
- the optical system has particular application in spectrometric analysis where one needs to determine if certain elements are in a source. For example, it may be important to determine if a food composition has harmful lead and other toxic elements present. The location of the slots 22 in the mask 20 are then determined. With the mask in position, if lead is present, the corresponding selected spectral energy line will appear at the linear diode array to confirm the presence of lead. Similarly, oils may be analyzed for certain chemical elements, such as those shown in Figure 2. A sample of oil may be injected into the plasma jet and a determination made as to whether or not the suspected components as listed in Figure 2 are present. The spectrometer, therefore, acts as a detective device in that it will determine if particular elements are present. Once it is desired to determine if certain elements are present in the sample for reasons of investigation of toxic susbstance, corrosion problems or utility of the sample, the spectral lines are selected and the appropriate mask is designed.
- the unit Due to the fixed nature of the optics for the spectrometer, the unit can be operated in areas where vibration is present. Furthermore, the unit does not require specially designed tables and the like to support the frame for the optics.
- the only device in the system which may be movable is the mask 20.
- a holder may be designed to receive the mask 20 and fix it relative to a base line position to thereby locate the slots 22 in the desired regions of the spectrum to permit only those spectral regions to pass through the mask. Therefore, depending upon what combination of chemical elements is to be analyzed, interchangeable masks may be used.
- the system provides a compact arrangement for the optics which may be readily housed and thereby provide a controlled atmosphere within which the system operates.
- the housing for the optics may be removed from time to time to permit ready repair. Due to the fixed nature of the optic components, replacement is readily achieved. Since spectral line selection is carried out in low resolution, mechanical tolerances are in general much less restrictive allowing a simpler and less expensive manufacturing process to be used in the construction of the
- the concentration of the detected element in the sample In addition to a qualitative analysis of elements present in the sample, it is also possible, depending upon the type of detector used, to quantitatively determine the concentration of the detected element in the sample. Depending upon the measured intensity of the spectral line for the sample present, it is possible to determine the concentration knowing the characteristics of the spectral energy emitted by the sample when present at certain concentrations in the plasma. By use of a linear diode array, it is possible to measure the intensity of each spectral profile and by analysis of the data, quantitatively determine the concentrations of the elements in the sample.
- the method and apparatus is normally used for sorting spectral energy in the electromagnetic spectrum in particular sorting spectral energy having a wavelength from 1,700 Angstroms to 8,000 Angstroms.
- the preferred embodiment of the system detects energies in the wavelength region from 2,000 Angstroms to 4,000 Angstroms. This is found to be the most common wavelength region of interest.
- the spectrometer optics provide a very compact arrangement which is inexpensive to manufacture and set up to analyze for a variety of elements in various samples. It involves the use of only a single detector array which is fixed relative to the other optics in the system.
Abstract
Description
- This invention relates to method and apparatus for sorting spectral energy and in particular, the sorting of spectral energy for use in association with spectroscopy.
- In many spectroscopy applications, it is desirable to measure the spectra of a number of narrow spectral regions with high resolution; the narrow spectral regions being distributed more or less at random throughout a much broader overall spectral region. These narrow spectral regions are often referred to as spectral lines. For example, in absorption, emission or light scattering spectroscopy, the total region spanned by all sections of interest may be several thousands of Angstroms (100's of nanometers), while spectral measurements are actually needed for one or more narrow spectral regions having a span of less than one Angstrom at a resolution of the order of 0.1 Angstrom in the vicinity of particular spectral lines.
- The total number of measurements wanted may be rather large. A certain amount of time is generally needed to make each measurement with adequate precision and there is the additional need to search out the appropriate spectral region for each line. As a result, the total amount of time required to scan, locate spectral regions, and carry out measurements can become quite large.
- To deal with this type of application, there are commercially available two basic forms of dispersive spectrometers. The scanning spectrometer sweeps all of the wavelengths of the spectrum using a single detector to determine the presence of spectral lines in the sample being analyzed. The scanning spectrometer is slow and can only sense one narrow spectral band at one time. Ancther form of spectrometer has a plurality of detectors which can simultaneously select spectral energy lines in regions of interest. This type of spectrometer sometimes uses a separate exit slit photodetector and amplifier channel for each of the spectral energy lines to be measured. Some scanning is generally needed to examine the spectral region surrounding each line. For a given spectral resolution, the first method is slow and the second method expensive and not versatile.
- An improvement in dispersive spectrometers is disclosed in United States patent 3,700,332. It is directed to an absorption spectrometer which involves the use of a controlled vibrating chopping mask. A photoelectric detector receives stepwise a series of chopped line and band flux intensities from different selected portions of the spectrum and generates a group of electrical values, each proportional to the total flux transmitted through each array. A Hadamard matrix is used to analyze the light flux for each spectral line. This system involves several moving components including the vibrating chopping mask. Thus, the system must be isolated from surrounding ambient vibration to provide the needed accuracy. It also requires the complex mathematical Hadamard analysis.
- A correlation absorption spectrometer is disclosed in United States patent 3,955,891. The spectrometer has first and second spatial filters with a chopping device to alternately block light from the first filter onto two filter portions of the second filter. A weighted linear combination of the intensities of the selected wavelength interval of light from the light source is used. By way of a Hadamard matrix, the results are analyzed.
- Another improvement in dispersive spectrometers is described in United States patents 3,752,585 and 4,049,353 and Canadian patent 896,652 which relate to various cross-dispersive spectrometer configurations using an Echelle grating for providing high resolution of the spectral energy lines. A rotatable prism is used in conjunction with a movable Echelle grating to provide a two dimensional spectral energy distribution in a rectangular focal plane. A cassette is used with an encoding disc to determine if spectral energy lines are present for atoms corresponding to the position of openings in the cassette. According to the improvement of United States patent 4,049,353, the cassette is used in conjunction with a two dimensional array of photomultiplier tubes to determine if spectral energy lines are present at the opening in the cassette. The use of a movable prism and Echelle grating in conjunction with the cassette requires extreme precision in set-up to avoid inaccuracy in readings. The machine is also very susceptible to vibration caused by the surroundings. The unit is not readily interchangeable to sense various elements because the cassette positioning has to be very accurate to decipher all the spectral energy information arriving at the cassette. This makes the cassette very expensive. The use of cross-dispersion also limits the allowable entrance slit height on this spectrometer. In turn, this reduces the light gathering capability of the instrument. A similar type of system is disclosed in United States patent 4,391,523 to Leeman Labs Inc.
- There also exists cascade spectrometer arrangements where the first monochromator is used to select a single spectral region of interest and pass that single spectral region to a second spectrometer which disperses that single region to analyze specific spectral energy lines of the single spectral region. The advantage is that the first monochromator selects a . narrow spectral region which is then resolved in higher resolution by the second spectrometer. The disadvantage is that only one narrow spectral region can be selected at any given time. Therefore, to determine spectral information in widely separated parts of a larger spectral region, the two monochromators must be scanned. This method is both slow and expensive.
- According to an aspect of the invention, a new method is provided for sorting spectral energy. The method comprises dispersing incident spectral energy, then simultaneously selecting multiple spectral regions of the dispersed spectral energy. The simultaneously selected spectral regions of spectral energy are then recombined and further dispersed and the dispersed selected spectral regions are organized into a detectable spectral energy distribution pattern.
- According to another aspect of the invention, a method is provided for spectrometrically determining the presence of one or more suspected components in a sample. The method comprises passing incident spectral energy from an energized source including the sample through a slit to select incident spectral energy from the source. The incident spectral energy is dispersed and focused at a focal plane. Predetermined spectral energy regions of the focused dispersed spectral energy are simultaneously selected at the focal plane. The unwanted spectral regions are rejected. The optical beam of the selected spectral regions is collimated and recombined and directed onto an Echelle grating to disperse with high resolution the selected spectral regions. The dispersed selected spectral regions are then focused onto a focal plane. The presence and relative location of the spectral energies are detected to confirm the presence of suspected one or more components in the sample.
- According to another aspect of the invention, apparatus is provided for sorting spectral energy. The apparatus comprises first means for dispersing incident spectral energy to form a spectrum. Means is provided for simultaneously selecting multiple spectral regions from the spectrum. Means is provided for recombining the simultaneously selected spectral regions. Second means is provided for the additional dispersion of and organization of the dispersed spectral regions in a detectable spectral energy distribution pattern.
- According to a further aspect of the invention, an Echelle spectrometer is provided for spectrometrically determining the presence and amount of one or more suspected components in the sample. The apparatus comprises an entrance slit to select incident spectral energy from an energized source including the sample. First means is provided for dispersing the isolated incident spectral energy and focusing the dispersed spectral energy at a first focal plane. Means is provided for simultaneously transmitting only selected spectral regions at said focal plane of the dispersed incident spectral energy. Means is provided for collimating and recombining the selected spectral regions and directing them onto an Echelle grating to disperse with high resolution the existing selected spectral regions. Means is provided for focusing the selected spectral regions dispersed by the Echelle grating onto a second focal plane. Means is provided for detecting the presence and relative location of the spectral energy. The means for transmitting selected spectral regions only transmits spectral regions which avoids appreciable overlap of the important spectral energy lines of the organized spectral energy distribution pattern.
- The method and apparatus, according to aspects of this invention, may also determine quantitatively the amount of suspected one or more components in the sample by detecting the intensity of the representative spectral line or lines of the suspected component.
- A preferred embodiment of the invention is shown in the drawings wherein:
- Figure 1 is a perspective of the optics of the apparatus according to this invention for sorting spectral energy;
- Figure 2 is a plot showing the relative positions of dispersed incident spectral radiation for a particular analytical analysis at the focal plane. The mask is situated at this focal plane;
- Figure 3 shows the actual position of slots in the mask for selecting regions of the dispersed radiation of Figure 2;
- Figure 4 is a representative plot of spectral orders dispersed from an Echelle grating showing the approximate positions of the spectral lines shown in Figure 2;
- Figure 5 is a plot showing the relative position of the selected dispersed and focused spectral lines at the detector; and
- Figure 6 shows the actual spectral line positions of Figure 5 as located along the plane of the detector.
- The perspective view of Figure 1 shows the special relationship of the
optics 10 for use in a spectrometer. A source ofincident radiation 12 is, in accordance with this embodiment of the invention, developed by a plasma of the standard type used in emission spectrometry. The radiant energy, from theplasma jet 11, into which a sample to be analyzed has been injected, is focused bylens 13 towards entrance slit 14. The entrance slit 14 isolates the incident energy to provide a beam of light 16 which is directed towards a concavereflective grating 18. Theconcave grating 18 functions to disperse the isolated incident spectral energy and to focus the dispersed spectral energy at a curved focal surface at which is located amask 20. Theconcave grating 18 is designed to provide low dispersion of the incident spectral energy with low resolution of the spectral energy lines. It is appreciated that low and high resolution are relative terms in the field of spectroscopy. Specific values for low and high resolution will depend on the particular apparatus used and the regions of the spectrum to be analyzed. For purposes of discussion with respect to particular optics for the apparatus of Figure 1, low resolution is considered to be in the order of 35 Angstroms/millimeter for the central wavelength of 3000 A. - The
mask 20 is located at the focal surface of the concave grating known as the Rowland Circle. The mask has a plurality ofslots 22 provided therein which are oriented parallel to the image of the entrance slit 14 formed at the position of themask 20. Theslots 22 in themask 20 are located so as to pass or transmit spectral radiation in regions of the spectral energy which are of interest, in accordance with a predetermined scheme to be discussed. The mask portions between theslots 22 reject all remaining spectral energy which is unwanted. The characteristics of theconcave grating 18 fix the location along the focal plane and themask 20 of the various spectral regions for any wavelength in the incident spectral energy of a compound of interest. By knowing in advance the wavelengths of the spectral regions which are of interest in the spectrometric analysis, it is possible to position the slots in the mask to pass only the desired spectral regions of energy. - Thus the
mask 20 serves to select simultaneously spectral regions of the dispersed spectral energy incident on the mask alongline 26. The simultaneously selected spectral regions, which are present due to the existence of a suspected compound and which emerge from themask 20, pass alongline 28 onto acorrective mirror 30. The corrective mirror is a concave reflective surface for collimating the spectral regions and directing them towards theplanar grating 32 alongline 34. Theplanar grating 32 serves to orient all of the columns of the selected spectral regions so that the collimated light alongline 34 is recombined into an essentially single column of light alongline 36 which contains all of the selected spectral regions of energy. - With all of the spectral regions collimated on top of each other along
line 36, the selected spectral regions are dispersed by an Echelle grating 38 which disperses the radiation aboutline 40 providing high resolution of the spectral energy lines of the selected spectral regions. As with particular values for low resolution of the spectrum, particular values for high resolution cannot be defined without reference to the apparatus used and spectral region being considered. However, for example, with the criteria for establishing low resolution value, corresponding high resolution value is in the order of 0.9 Angstroms/millimeter for the central wavelength of 3000 A. - The highly resolved spectral energy lines of the stacked orders of the spectral regions are directed along
line 40 to a focusingmirror 42 which organizes by focusing all of the dispersed spectral energy regions alongline 46 onto a focal plane atdetector 44. The detector determines the presence of the spectral energy lines at various positions along the horizontal dimensional length of the focal plane at thedetector 44. The optical characteristics of the system, particularly the Echelle grating 38 and the wavelengths which should be present if the suspected components are in the energized source, determine where the spectral energy lines will fall at the focal plane atdetector 44. If the detector registers the appearance of a spectral energy at a particular location along the length of the detector, it may confirm thereby the presence and possibly the amount of a suspected component in a sample. - The design of the optical components is in accordance with spectrometric standards. It is appreciated that with the particular arrangement, the
gratings corrective mirror 30. Theconcave grating 18 then has a radius of curvature one-half that of thecorrective mirror 30, and has the same line spacing as theplanar grating 32 to provide the proper dispersion compensation and collimation of the transmitted radiation. - The Echelle grating has the characteristics of dispersing the selected spectral regions in numerous orders so that all orders of the spectral regions are dispersed one on top of the other. The selection of the spectral regions at the mask may, therefore, be affected by the scheme of stacked orders of the highly resolved spectral energy lines from the Echelle grating. In order to provide clearest determination of suspected compounds or elements in a sample, the highly resolved spectral energy lines of the elements should not appreciably overlap in the stacked orders of spectral energy. Knowing the spectral emission or absorption characteristics of each suspected element to be detected and the optical characteristics of the Echelle, one can judiciously select the location of slots in the mask to ensure that the resultant highly resolved spectral energy lines of the elements present do not overlap appreciably in the stacked orders of spectral energy produced by the Echelle grating. One may also provide means to alternately block one or more of the slots, to alleviate overlap problems, due to overlapping of spectral lines in different spectral orders. It is appreciated that for any one selected spectral region, there can be inherent overlap of spectral energy lines. With respect to unimportant spectral energy lines, overlap is acceptable because these unimportant lines normally are not detected. Furthermore, in other circumstances, there may even be overlap of important spectral energy lines in either a selected spectral region or spectral energy lines from different orders of the dispersed spectral energy. Depending upon the use to which the spectrometer is put, overlap of important spectral energy lines may not be a problem because, for example, mathematical techniques can be employed to resolve the overlap and determine the presence of the components represented by the overlapping important spectral energy lines. Generally from an analytical standpoint, appreciable overlap of the important spectral energy lines can be avoided by this judicious selection of the location of the slots in the mask, or by blocking one or more of the slots during the process, or use of the apparatus according to this invention. As to the selective blocking of one or more slots in the mask to avoid overlap of orders of spectral energy lines, this may be accomplished by locating a second mask near the first which physically blocks out selected spectral energy emerging from the slot of the first mask. Alternately, the blocking of the unwanted order of spectral energy emerging from the mask may be accomplished with transmission filters.
- The
detector 44 may be a simple photographic plate which, when developed and having a base line calibration, shows the relative location and intensity of various spectral energy lines so that upon measuring from the base line location, one can determine by presence and location of the spectral energy line that it is a positive identification of a suspected element in the sample. A television camera may also be suitably used for thedetector 44. Multiple-anode microchannel photomultipliers will be very effective detectors when these become readily available. According to a preferred embodiment of the invention, a linear diode array is particularly suitable for use as a detector located where the focusingmirror 42 focuses the highly resolved spectral energy lines of the selected spectral regions into a linear pattern. - Linear diode arrays are now available containing many hundreds of detector elements. By use of the optics, according to this invention, all of the spectral information is focused onto a single dimension plane which enables detection of all of the information across the width of a linear diode array having a plurality of sensitive regions. The Echelle grating effectively divides the spectrum into spectrally narrower regions or orders and disposes them all one on top of the other in the same direction. By the judicious selection of the slot locations in the mask, the linear diode array is used in combination with an Echelle grating to sense the presence of selected spectral energy lines which are produced by suspected components in the sample.
- This arrangement eliminates the need for former uses of cross-dispersing systems in combination with Echelle gratings, such as disclosed in the aforementioned United States patents and has the advantage of allowing a long entrance slit to be used. It further eliminates the need to provide a scanning device for scanning several spectral regions having wide separation.
- Based on this discussion of the optics of Figure 1, the optical arrangement of this invention overcomes various problems by using a low resolution spectrograph to isolate simultaneously desired spectral regions of interest and remove unwanted spectral regions. The masked radiation is then collected and sent to a high resolution Echelle spectrograph A linear detector array is placed at the Echelle spectrograph focus. The selected spectral regions appear at the Echelle focus in high dispersion generally falling on separate sections of the detector array. Depending upon the characteristics of the optics used and the wavelength of the radiation being investigated, the width of the focused spectral energy lines on the detector is relatively narrow. In considering wavelength in the region of 2000 to 4000 Angstroms, the focused width of the spectral energy lines may be in the range of 25 mm.
- There is no need to carry out mechanical scanning by use of sensitive components to access the separate regions wanted for a particular set of measurements, provided the spectral energy lines of the selected regions do not appreciably overlap. Masks may be generated providing large numbers of slots to cover a wide range of measurements. The invention provides a means of selecting sections from various orders of an Echelle spectrograph without movement of any optically sensitive components. That is, all optical components of the system are fixed, except for the possible use of an interchangeable mask, or the alternate covering and uncovering of sections of a given mask. However, the mask's angular position is always fixed relative to the other components for detecting the presence of one or more components in the source.
- It is understood that many optical configurations can be implemented for the sorting of spectral energy. For example,-the
concave grating 18 may be replaced by a collimating lens and a prism and a second prism used in place of the plane grating to provide for the recombining of the selected spectral regions. The collimating mirror following the mask may be replaced by several mirrors placed immediately behind the slots so as to direct the light back to a second concave grating which functions to remove the dispersion from the reflected spectral regions and direct the combined light onto the Echelle grating. In that instance, the second concave grating may be chosen to defract the light as a collimated beam which is sent directly to the Echelle grating. In using the Echelle grating in accordance with this invention as a high resolution element without cross-dispersion, by proper preorganization of the spectral energy onto the Echelle grating, a linear detecting device may be used to determine the presence of spectral energy lines. The radiation from the selected spectral regions is collimated onto the Echelle grating. At the Echelle grating, the various wavelengths are separated into modes but with no cross-dispersion as the orders of spectral energy lie one on top the other. This need not present a problem when the wavelength regions have been judiciously preselected so as to not cause a conflict in spectral energy lines piling up on each other. By proper choice of the Echelle grating line spacing and the focal length of the focusingmirror 42, the full spectral range of any order of the spectral energy from the Echelle grating may be fit in the physical length of the preferred linear diode array. - The plot of Figure 2 shows the relative location of spectral energy lines along the spectrum as dispersed by the
concave grating 18. The mask has slots formed therein so as to only pass the selected spectral lines for silicon, iron, magnesium, copper, titanium, silver, chromium, nickle, molybdenum and aluminum, should they be present in the sample. It is appreciated that for each of these elements, there are many spectral lines in the dispersed spectral energy region from an excited source containing all of these elements. - As shown in Figure 3, the location in the
mask 20 of theslots 22 can be readily calculated to pass only the selected regions of dispersed spectral energy for the elements noted in Figure 2. Taking into consideration the curvature ofmask 22, the relative location and width of the slots can be chosen. Should the mask be formed of suitable material, the slots can be accurately machined into the mask in accordance with the positioning shown in Figure 3. - Figure 4 shows the spectral energy lines as dispersed by the Echelle grating when given further dispersion in the cross-direction to provide a two dimensional presentation of the orders of selected spectral regions. The spectral lines as simultaneously selected by the
mask 20, when they emerge from the Echelle grating, are located at various orders of the Echelle output. In accordance with standard Echelle spectrometry, a prism is normally used to cross-disperse the radiation reflected from the Echelle grating producing a two dimensional spectrum. On the other hand in accordance with this invention, because of a judicious preselection of the wavelengths to pass through the mask, the output at the Echelle grating provides spectral lines which do not appreciably overlap when the Echelle spectrum is allowed to remain without cross-dispersion. - As shown in Figure 5, to either side of the centre line of Figure 4, the spectral energy lines are at predetermined locations along the focal plane. As shown in Figure 4, the selected wavelength of titanium is furthest to the left and the selected spectral wavelength for aluminum is furthest to the right. The spectral orders of Figure 4, if vertically compressed, provide the relative location for the spectral energy lines as shown in Figure 5, which is the unaltered output from the Echelle grating according to this invention. Thus, by the judicious selection of wavelengths to be passed by the mask, assuming the presence of the elements, the selected spectral lines when dispersed with high resolution by the Echelle grating do not appreciably overlap and are distinctly separate along the focal plane of Figure 5.
- The enlarged scale for the spectral lines of Figure 5, as focused onto a single dimension plane, would appear as shown in Figure 6 on the preferred linear diode array detector having several sensitive regions which are marked 0 to 1024.
- By knowing the characteristics of the optics of the
system 10, one can determine, in accordance with standard procedures, the exact location along the linear array of the selected spectral lines. Thus, from a base line, a determination can be made as to whether or not the elements are present. For example, if there is no iron in the sample introduced to the plasma jet, then the line for iron having a wavelength of 2,599.70 Angstroms would not appear at the detector. - In using the optics according to a preferred embodiment of this invention, the linear diode array having an overall length of approximately 20 to 30 mm with 1024 sensitive regions or detector elements can readily determine the presence of spectral energy lines in the spectrum to be analyzed. Knowing in advance which chemical elements are to be detected and knowing the characteristics of the optics, activation of particular detector elements along the length of the array determines the presence of the corresponding chemical element. According to a preferred embodiment of this invention, the linear diode array may have 40 detector elements per millimeter of length of the detector. This provides a sufficient number of detector elements to determine the existence or non-existence of the selected spectral profile, also known as energy lines along the detector array.
- As shown in Figure 5, to either side of the centre line are the locations in expanded view of the various selected spectral energy lines. The location of the detector elements can be correlated with the spectral energy lines. The positions of detector elements which are actuated confirm the presence of a suspected chemical element in the source. The output from the linear diode array can be processed in many ways. For example, a computer may be used having the necessary logic to process information from the linear diode array and correlate the particular numbered detector elements determined with the existence of chemical elements. In this manner, the computer may be used to confirm to the user the existence or non-existence of the suspected chemical elements in a source.
- The linear diode array and associated electronics may be obtained from various sources. A linear diode array having a cooled housing, for example, is obtained from Tracor-Northern of Wisconsin. The output of the linear diode array is interfaced with a computer. The analog signals from the linear diode array are converted to digital signals which are then processed by the computer to confirm which of the suspected chemical elements are present in the sample.
- The optical system has particular application in spectrometric analysis where one needs to determine if certain elements are in a source. For example, it may be important to determine if a food composition has harmful lead and other toxic elements present. The location of the
slots 22 in themask 20 are then determined. With the mask in position, if lead is present, the corresponding selected spectral energy line will appear at the linear diode array to confirm the presence of lead. Similarly, oils may be analyzed for certain chemical elements, such as those shown in Figure 2. A sample of oil may be injected into the plasma jet and a determination made as to whether or not the suspected components as listed in Figure 2 are present. The spectrometer, therefore, acts as a detective device in that it will determine if particular elements are present. Once it is desired to determine if certain elements are present in the sample for reasons of investigation of toxic susbstance, corrosion problems or utility of the sample, the spectral lines are selected and the appropriate mask is designed. - Due to the fixed nature of the optics for the spectrometer, the unit can be operated in areas where vibration is present. Furthermore, the unit does not require specially designed tables and the like to support the frame for the optics. The only device in the system which may be movable is the
mask 20. A holder may be designed to receive themask 20 and fix it relative to a base line position to thereby locate theslots 22 in the desired regions of the spectrum to permit only those spectral regions to pass through the mask. Therefore, depending upon what combination of chemical elements is to be analyzed, interchangeable masks may be used. The system provides a compact arrangement for the optics which may be readily housed and thereby provide a controlled atmosphere within which the system operates. The housing for the optics may be removed from time to time to permit ready repair. Due to the fixed nature of the optic components, replacement is readily achieved. Since spectral line selection is carried out in low resolution, mechanical tolerances are in general much less restrictive allowing a simpler and less expensive manufacturing process to be used in the construction of the spectrometer. - In addition to a qualitative analysis of elements present in the sample, it is also possible, depending upon the type of detector used, to quantitatively determine the concentration of the detected element in the sample. Depending upon the measured intensity of the spectral line for the sample present, it is possible to determine the concentration knowing the characteristics of the spectral energy emitted by the sample when present at certain concentrations in the plasma. By use of a linear diode array, it is possible to measure the intensity of each spectral profile and by analysis of the data, quantitatively determine the concentrations of the elements in the sample.
- The method and apparatus is normally used for sorting spectral energy in the electromagnetic spectrum in particular sorting spectral energy having a wavelength from 1,700 Angstroms to 8,000 Angstroms. The preferred embodiment of the system detects energies in the wavelength region from 2,000 Angstroms to 4,000 Angstroms. This is found to be the most common wavelength region of interest.
- The spectrometer optics, according to this invention, provide a very compact arrangement which is inexpensive to manufacture and set up to analyze for a variety of elements in various samples. It involves the use of only a single detector array which is fixed relative to the other optics in the system.
Claims (23)
Applications Claiming Priority (2)
| Application Number | Priority Date | Filing Date | Title |
|---|---|---|---|
| CA000469200A CA1229897A (en) | 1984-12-03 | 1984-12-03 | Optics system for emission spectrometer |
| CA469200 | 1984-12-03 |
Publications (2)
| Publication Number | Publication Date |
|---|---|
| EP0184428A2 true EP0184428A2 (en) | 1986-06-11 |
| EP0184428A3 EP0184428A3 (en) | 1988-07-13 |
Family
ID=4129291
Family Applications (1)
| Application Number | Title | Priority Date | Filing Date |
|---|---|---|---|
| EP85308799A Withdrawn EP0184428A3 (en) | 1984-12-03 | 1985-12-03 | Optics system for emission spectrometer |
Country Status (4)
| Country | Link |
|---|---|
| US (1) | US4636074A (en) |
| EP (1) | EP0184428A3 (en) |
| JP (1) | JPS61134635A (en) |
| CA (1) | CA1229897A (en) |
Cited By (3)
| Publication number | Priority date | Publication date | Assignee | Title |
|---|---|---|---|---|
| FR2681941A1 (en) * | 1991-10-01 | 1993-04-02 | Dilor | DISPERSIVE SPECTROMETRY DEVICE WITH SPECTRAL BAND FILTERING. |
| CN104374474A (en) * | 2014-10-11 | 2015-02-25 | 北京振兴计量测试研究所 | High-precision ultraviolet spectral irradiance measuring system |
| CZ309152B6 (en) * | 2021-01-21 | 2022-03-16 | Ecom Spol. S R.O. | Equipment for narrowing the spectral half-width and selecting the exact wavelength |
Families Citing this family (19)
| Publication number | Priority date | Publication date | Assignee | Title |
|---|---|---|---|---|
| US4895445A (en) * | 1987-06-25 | 1990-01-23 | Eastman Kodak Company | Spectrophotometer |
| DE3927768A1 (en) * | 1989-08-23 | 1991-02-28 | Perkin Elmer Corp | METHOD FOR DETERMINING CONCENTRATION BY MEANS OF ATOMEMISSION SPECTROSCOPY |
| US4997281A (en) * | 1989-08-24 | 1991-03-05 | Stark Edward W | Grating spectrometer |
| US5088823A (en) * | 1989-09-29 | 1992-02-18 | Thermo Jarrell Ash Corporation | Spectroanalytical systems |
| US5384656A (en) * | 1991-10-16 | 1995-01-24 | Hyperfine, Inc. | Astigmatism corrected gratings for plane grating and spherical mirror spectrographs |
| EP0558216A1 (en) * | 1992-02-24 | 1993-09-01 | Thermo Jarrell Ash Corporation | Spectrometry |
| US5412468A (en) * | 1993-03-09 | 1995-05-02 | The Perkin-Elmer Corporation | Grouping of spectral bands for data acquisition in a spectrophotometer |
| US5410407A (en) * | 1993-04-30 | 1995-04-25 | Litton Systems, Inc. | Large aperture mirror testing apparatus and method |
| US5905571A (en) * | 1995-08-30 | 1999-05-18 | Sandia Corporation | Optical apparatus for forming correlation spectrometers and optical processors |
| DE19545178B4 (en) * | 1995-12-04 | 2008-04-10 | Berthold Gmbh & Co. Kg | spectral detector |
| US5995235A (en) * | 1997-02-13 | 1999-11-30 | Applied Materials, Inc. | Bandpass photon detector |
| US6151112A (en) * | 1997-11-17 | 2000-11-21 | Innovative Lasers Corp. | High-resolution, compact intracavity laser spectrometer |
| WO2000070331A1 (en) * | 1999-05-14 | 2000-11-23 | Gunther Krieg | Method and device for detecting and differentiating between contaminations and accepts as well as between different colors in solid particles |
| WO2001084098A1 (en) * | 2000-05-01 | 2001-11-08 | Nederlandse Organisatie Voor Toegepast-Natuurweten-Schappelijk Onderzoek Tno | Method and means of measuring wavelength change |
| DE10205142B4 (en) * | 2002-02-07 | 2004-01-15 | Gesellschaft zur Förderung angewandter Optik, Optoelektronik, Quantenelektronik und Spektroskopie e.V. | Arrangement and method for wavelength calibration in an Echelle spectrometer |
| US20090114822A1 (en) * | 2007-11-06 | 2009-05-07 | Honeywell International Inc. | Terahertz dispersive spectrometer system |
| US8981296B2 (en) | 2007-11-06 | 2015-03-17 | Honeywell International Inc. | Terahertz dispersive spectrometer system |
| EP2211154B1 (en) * | 2009-01-22 | 2017-03-15 | CSEM Centre Suisse d'Electronique et de Microtechnique SA - Recherche et Développement | Monochromator having a tunable grating |
| CN112764153B (en) * | 2021-01-07 | 2021-11-02 | 华中科技大学 | Band-stop filter suitable for any spectral shape, and preparation method and system thereof |
Citations (5)
| Publication number | Priority date | Publication date | Assignee | Title |
|---|---|---|---|---|
| GB766909A (en) * | 1954-07-02 | 1957-01-30 | Hilger & Watts Ltd | Improvements in spectrographs and monochromators |
| DE1096060B (en) * | 1958-09-06 | 1960-12-29 | Bodenseewerk Perkin Elmer Co | Spectral apparatus |
| US3247759A (en) * | 1962-03-06 | 1966-04-26 | Cons Electrodynamics Corp | Spectrometer with multiple entrance slits |
| US4049353A (en) * | 1976-08-11 | 1977-09-20 | Spectrametrics, Incorporated | Spectrometric system and cassette |
| DE1909841B2 (en) * | 1968-03-06 | 1977-11-17 | SpectraMetrics, Ine, Burlington, Mass. (V.St.A.) | SPECTROMETER |
Family Cites Families (11)
| Publication number | Priority date | Publication date | Assignee | Title |
|---|---|---|---|---|
| US3052154A (en) * | 1959-04-09 | 1962-09-04 | Bodenseewerk Perkin Elmer Co | Spectroscope |
| US3837744A (en) * | 1969-09-17 | 1974-09-24 | Environmental Data Corp | Spectrometers |
| US3958883A (en) * | 1974-07-10 | 1976-05-25 | Baird-Atomic, Inc. | Radio frequency induced plasma excitation of optical emission spectroscopic samples |
| US4025196A (en) * | 1974-07-29 | 1977-05-24 | Varian Associates | Asymmetric double pass grating monochromator |
| DE2513267C2 (en) * | 1975-03-26 | 1977-05-18 | Kloeckner Werke Ag | DEVICE FOR CONTROLLING THE GENERATION OF UNIPOLAR SPARK DISCHARGE FROM ALLOY COMPONENTS OF METAL MATERIAL SAMPLES AND / OR THE EVALUATION OF THE SPECTRAL LINES OF THE DIFFUSION SPECTRA GENERATED BY THE SPARK DISCHARGE |
| SU619805A1 (en) * | 1977-02-08 | 1978-08-15 | Предприятие П/Я Р-6681 | Double monochromator with subtraction of variance |
| US4193691A (en) * | 1977-05-02 | 1980-03-18 | Rca Corporation | Spectrometer |
| DE2730613C3 (en) * | 1977-07-07 | 1980-04-03 | Bodenseewerk Perkin-Elmer & Co Gmbh, 7770 Ueberlingen | Double monochromator |
| JPS5530635A (en) * | 1978-08-28 | 1980-03-04 | Nippon Kogaku Kk <Nikon> | Spectroscopic photometer with dark current compensator |
| JPS57108740A (en) * | 1980-12-26 | 1982-07-06 | Shimadzu Corp | Device to obtain beam having optional wavelength distribution |
| JPS57139647A (en) * | 1981-02-23 | 1982-08-28 | Shimadzu Corp | Chromatograph detecting device |
-
1984
- 1984-12-03 CA CA000469200A patent/CA1229897A/en not_active Expired
- 1984-12-06 US US06/679,080 patent/US4636074A/en not_active Expired - Lifetime
-
1985
- 1985-12-03 JP JP60270876A patent/JPS61134635A/en active Pending
- 1985-12-03 EP EP85308799A patent/EP0184428A3/en not_active Withdrawn
Patent Citations (5)
| Publication number | Priority date | Publication date | Assignee | Title |
|---|---|---|---|---|
| GB766909A (en) * | 1954-07-02 | 1957-01-30 | Hilger & Watts Ltd | Improvements in spectrographs and monochromators |
| DE1096060B (en) * | 1958-09-06 | 1960-12-29 | Bodenseewerk Perkin Elmer Co | Spectral apparatus |
| US3247759A (en) * | 1962-03-06 | 1966-04-26 | Cons Electrodynamics Corp | Spectrometer with multiple entrance slits |
| DE1909841B2 (en) * | 1968-03-06 | 1977-11-17 | SpectraMetrics, Ine, Burlington, Mass. (V.St.A.) | SPECTROMETER |
| US4049353A (en) * | 1976-08-11 | 1977-09-20 | Spectrametrics, Incorporated | Spectrometric system and cassette |
Cited By (6)
| Publication number | Priority date | Publication date | Assignee | Title |
|---|---|---|---|---|
| FR2681941A1 (en) * | 1991-10-01 | 1993-04-02 | Dilor | DISPERSIVE SPECTROMETRY DEVICE WITH SPECTRAL BAND FILTERING. |
| EP0535753A2 (en) * | 1991-10-01 | 1993-04-07 | Dilor | Device for spectrometry with spectral band filtering |
| EP0535753A3 (en) * | 1991-10-01 | 1993-05-12 | Dilor | Device for spectrometry with spectral band filtering |
| US5424825A (en) * | 1991-10-01 | 1995-06-13 | Dilor | Spectral-band filtration spectrometry apparatus |
| CN104374474A (en) * | 2014-10-11 | 2015-02-25 | 北京振兴计量测试研究所 | High-precision ultraviolet spectral irradiance measuring system |
| CZ309152B6 (en) * | 2021-01-21 | 2022-03-16 | Ecom Spol. S R.O. | Equipment for narrowing the spectral half-width and selecting the exact wavelength |
Also Published As
| Publication number | Publication date |
|---|---|
| EP0184428A3 (en) | 1988-07-13 |
| JPS61134635A (en) | 1986-06-21 |
| CA1229897A (en) | 1987-12-01 |
| US4636074A (en) | 1987-01-13 |
Similar Documents
| Publication | Publication Date | Title |
|---|---|---|
| US4636074A (en) | Optics system for emission spectrometer | |
| US5515169A (en) | Spectral wavelength discrimination system and method for using | |
| US4259014A (en) | Fiber optic polychromator | |
| JP4804727B2 (en) | Optical scanning confocal microscope | |
| US7265827B2 (en) | Double grating three dimensional spectrograph with multi-directional diffraction | |
| US4966458A (en) | Optical system for a multidetector array spectrograph | |
| HUT76508A (en) | Apparatus and method for detecting raman spectrum of a sample | |
| US6023496A (en) | X-ray fluorescence analyzing apparatus | |
| US4875773A (en) | Optical system for a multidetector array spectrograph | |
| US4049353A (en) | Spectrometric system and cassette | |
| US5963320A (en) | Active spectrometer | |
| JPH11218444A (en) | Compact laser spectrometer in cavity with high resolution | |
| US3936190A (en) | Fluorescence spectrophotometer for absorption spectrum analysis | |
| US3518001A (en) | Radiant energy analyzer | |
| EP0558216A1 (en) | Spectrometry | |
| US20210148756A1 (en) | High resolution and high throughput spectrometer | |
| EP0059836A1 (en) | Optical beam splitter | |
| EP0614073A1 (en) | Spectroscopic analysis | |
| US3752585A (en) | Spectrometer system containing an interchangeable encoding cassette | |
| EP0358830A1 (en) | Low noise optical system | |
| EP0120870B1 (en) | Apparatus for carrying out spectral analysis | |
| GB2080947A (en) | Multiple-wavelength spectrophotometer | |
| US4391523A (en) | Scannable detector system for echelle grating spectrometers | |
| US4468121A (en) | Spectrophotometric analyzer having dual monochromators | |
| JP3126718B2 (en) | Multi-channel fluorescence spectrometer |
Legal Events
| Date | Code | Title | Description |
|---|---|---|---|
| PUAI | Public reference made under article 153(3) epc to a published international application that has entered the european phase |
Free format text: ORIGINAL CODE: 0009012 |
|
| AK | Designated contracting states |
Kind code of ref document: A2 Designated state(s): AT BE CH DE FR GB IT LI LU NL SE |
|
| PUAL | Search report despatched |
Free format text: ORIGINAL CODE: 0009013 |
|
| AK | Designated contracting states |
Kind code of ref document: A3 Designated state(s): AT BE CH DE FR GB IT LI LU NL SE |
|
| 17P | Request for examination filed |
Effective date: 19881228 |
|
| RAP1 | Party data changed (applicant data changed or rights of an application transferred) |
Owner name: LECO INSTRUMENTS LIMITED |
|
| 17Q | First examination report despatched |
Effective date: 19900720 |
|
| STAA | Information on the status of an ep patent application or granted ep patent |
Free format text: STATUS: THE APPLICATION IS DEEMED TO BE WITHDRAWN |
|
| 18D | Application deemed to be withdrawn |
Effective date: 19920428 |
|
| RIN1 | Information on inventor provided before grant (corrected) |
Inventor name: QUAGLIA, ALEXANDER Inventor name: LAZURE, ROBERT E. Inventor name: LEVY, GILBERT M. |