EP0145602A2 - Process for visualizing physical quantities variable in time and system for realizing said process - Google Patents
Process for visualizing physical quantities variable in time and system for realizing said process Download PDFInfo
- Publication number
- EP0145602A2 EP0145602A2 EP84402541A EP84402541A EP0145602A2 EP 0145602 A2 EP0145602 A2 EP 0145602A2 EP 84402541 A EP84402541 A EP 84402541A EP 84402541 A EP84402541 A EP 84402541A EP 0145602 A2 EP0145602 A2 EP 0145602A2
- Authority
- EP
- European Patent Office
- Prior art keywords
- values
- evolution
- quantities
- frequency
- computer
- Prior art date
- Legal status (The legal status is an assumption and is not a legal conclusion. Google has not performed a legal analysis and makes no representation as to the accuracy of the status listed.)
- Granted
Links
Images
Classifications
-
- G—PHYSICS
- G01—MEASURING; TESTING
- G01R—MEASURING ELECTRIC VARIABLES; MEASURING MAGNETIC VARIABLES
- G01R13/00—Arrangements for displaying electric variables or waveforms
- G01R13/20—Cathode-ray oscilloscopes
Definitions
- the present invention relates to a method for displaying physical variables varying over time, as well as to a device allowing the implementation of this method.
- the invention also applies to the visualization of the graph representative of the relative evolution of physical quantities with respect to time.
- the values of physical quantities are acquired as a function of time.
- This method and this device can be used in particular in controlling the operation of any installation in which physical parameters are measured periodically, by choosing predetermined sampling frequencies; these measures make it possible to follow the evolution of the operation of this installation over time, and possibly to intervene in the event of an incident in this operation. This is the case, for example, in nuclear reactors where it is necessary to detect any axial imbalance in the power of the reactor in order to remedy it effectively.
- This imbalance is in fact detected by following, during operation, the change in the value of the power of the reactor as a function of the values of the high flow and the low flow generated by the fuel. Constant monitoring of this development makes it possible in particular to control the reactor so that it operates at its maximum power. It also allows rapid variations in power, such as the daily variation of the load.
- This command consists in modifying the level of the control rods, in the reactor vessel, or the concentration of boric acid.
- the invention aims to remedy these drawbacks and in particular to allow viewing of the relative evolution of the values of physical quantities, the frequency of sampling or acquisition of these quantities as well as the frequency of selection of the relative values of these quantities being adjustable, and the display scale of the graph representative of the evolution of these quantities can itself be chosen in a predetermined manner.
- the invention firstly relates to a method for displaying physical variables variable over time, consisting in recording, with at least a predetermined sampling or acquisition frequency, the values of each of these quantities over time, and to record simultaneously at the same sampling frequency, the evolution of the values of one of these quantities compared to the evolution of the values of another of these quantities and for possibly, the evolution of the values of l '' one of these quantities compared to the evolution of the values of another of these quantities, as a function of time, the method then consisting in viewing the graph or graphs representative of the said evolution (s), characterized in that the said (s) graphs are displayed on the basis of the values representative of the said evolution (s), recorded at the same frequency as the said predetermined sampling frequency, or from certain values selected from the va their representative of where said evolutions, these values being selected with a selection frequency which is multiple of the sampling frequency.
- the method also consists in applying to each of the values of the magnitudes, during the said evolution (s), multiplication coefficients, in order to obtain, in relation to the choice of each of these coefficients, a predetermined scale of visualization or said graphs.
- the invention also relates to a system for displaying physical variables varying over time, comprising a computer, a memory connected to this computer for recording the values of these quantities, a clock with adjustable frequency, connected to acquisition means. values of these quantities to fix at least one sampling or acquisition frequency of the values of these quantities, outputs of these acquisition means being connected to the computer, and display means connected to the computer, characterized in that '' it further comprises means for simultaneously recording in the computer memory and at the same frequency, the evolution of the values of one of these quantities compared to the evolution of the values of another of these quantities , or the evolution of the values of one of these quantities compared to the evolution of the values of another of these quantities as a function of time, the computer controlling the display means for obtaining reveal the image of the graph or graphs representative of the said evolution (s).
- system further comprises means for applying to each of the values recorded during the said evolution (s), multiplication coefficients to obtain, in relation to the choice of each of the coefficients, a predetermined scale for displaying the or said graphs.
- said adjustable clock is also connected to the computer to display the said graph or graphs, on the basis of the values recorded during the said evolution (s), these values being selected in memory with a selection frequency equal to the frequency d predetermined sampling, or from cer only some of the values recorded during the said evolution (s), these values being selected in memory with a selection frequency which is multiple of the sampling frequency.
- the means for recording the values of the quantities during the said evolution (s) include correspondence tables located in memory.
- the multiplication means comprise multiplication tables by coefficients located in memory.
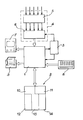
- the system of the invention comprises a computer 1, a memory 2 connected to this computer, a clock 3 with adjustable frequency, connected to the computer as well as to means 4 for acquiring physical variables variable over time.
- the acquisition means 4 can be constituted, for example, by an analog-to-digital converter 5 which receives the variable physical quantities and a multiplexer 6 whose outputs are connected to the computer 1 and whose inputs are connected to outputs of the converter 5.
- the adjustable clock 3 makes it possible to set at least one frequency for sampling or acquiring the values of the quantities supplied to the computer 1 by the multiplexer 6.
- the predetermined sampling frequency corresponds to the frequency of recording the values of the variable physical quantities in time, in memory 2.
- the system also includes display means 7, of the cathode type for example. This system may also include a claisse of data entry 8 to allow in particular to control the adjustment of the frequency of the clock 3 a printer 9 can also be connected to the computer 1.
- the system also includes means for simultaneously recording in the computer memory and at the same frequency as the sampling frequency, the change in the values of one of these quantities compared to the values of the other quantity, or l evolution of the values of one of these quantities compared to the values of the other and compared to time.
- the computer then controls the display means to obtain the graph representative of each of these changes, as will be seen in detail below.
- x e (y, t) .
- the sampling or acquisition frequency of the values of the physical quantities supplied by the acquisition means 4 can be modified at any time using the data input keyboard 8.
- the system also includes means for simultaneously applying to each of the recorded values of the magnitudes, multiplication coefficients which make it possible to obtain, in relation to the choice of each of these coefficients, a predetermined scale for viewing the graphs representative of the changes in the values. relative of acquired quantities.
- These means consist of a table 14 located in the memory 2 of the computer 1. This table allows the chosen sampling frequency to apply a multiplying coefficient to the values of the quantity x and / or to the values of the quantity y. This multiplying coefficient in fact makes it possible to enlarge or reduce the extent of the graph displayed on the screen of the visualization means 7.
- the system of the invention makes it possible to represent the evolution of the values of the quantity x with respect to the values of the quantity y and, possibly the evolution of the values of the value
- the keyboard 8 also makes it possible to modify the multiplication coefficient applied to the values of the acquired quantities. This multiplication is of course carried out with the same frequency as the predetermined sampling frequency.
- This selection frequency may be equal to the sampling frequency or may be a multiple of the latter.
- the graph obtained on the display screen represents the instantaneous evolution of the relative values of the quantities.
- the selection frequency is a multiple of the sampling frequency, the graph obtained on the display screen makes it possible to follow the evolution over time, of the relative values of the quantities.
- the method and the system of the invention can be applied for example to the control of a nuclear reactor, at its maximum power or in the event of a load variation.
- the power of the reactor is measured as a function of time and the corresponding data is acquired in the memory of the computer with a predetermined sampling frequency.
- the data concerning the axial imbalance vQf of the power are acquired as a function of time, with the same sampling frequency.
- the method and system of the invention then make it possible to view the graph representative of the variation in power of the reactor, as a function of its axial power imbalance. We will not describe here in detail the known methods of power and axial imbalance measurements of a reactor.
- the graph obtained makes it possible to monitor instantaneously or over time, the power of the reactor as a function of the axial imbalance and thus, to intervene quickly on the means of controlling this power; this control makes it possible to maintain the power-imbalance couple within an operating range whose limits are calculated in real time by the computer.
- urgent intervention is not possible since the operator must, from the graph representative of the power as a function of time and the graph representative of the axial imbalance of power as a function of time, consult abacuses allowing it to calculate at a given time the power as a function of the axial imbalance.
- This long and therefore harmful operation does not allow rapid intervention on the means for controlling the power of the reactor; moreover, the operator cannot visualize the graph representing this evolution over time and therefore cannot keep a history of operation.
Abstract
L'invention concerne un procédé et un système de visualisation de grandeurs variables dans le temps. Le système comprend un calculateur (1), une mémoire (2) pour enregistrer les valeurs des grandeurs, une horloge (3), des moyens d'acquisition (4) des valeurs des grandeurs, ces moyens d'acquisition (4) étant reliés au calculateur (1), et des moyens de visualisation (7) reliés au calculateur. Le système est caractérisé en ce qu'il comprend, en outre, des moyens (12, 13) pour enregistrer simultanément dans la mémoire du calculateur et à la même fréquence d'acquisition, l'évolution des valeurs de l'une de ces grandeurs par rapport à l'évolution des valeurs d'une autre de ces grandeurs, ou l'évolution des valeurs de l'une de ces grandeurs par rapport à l'évolution des valeurs d'une autre de ces grandeurs en fonction du temps, le calculateur (1) commandant les moyens de visualisation (7) pour obtenir l'image du ou des graphes représentatifs de la ou desdites évolutions. Application à la visualisation de l'évolution des valeurs de grandeurs physiques.The invention relates to a method and a system for displaying variables which vary over time. The system comprises a computer (1), a memory (2) for recording the values of the quantities, a clock (3), means of acquisition (4) of the values of the quantities, these means of acquisition (4) being connected to the computer (1), and display means (7) connected to the computer. The system is characterized in that it further comprises means (12, 13) for simultaneously recording in the computer memory and at the same acquisition frequency, the evolution of the values of one of these quantities compared to the evolution of the values of another of these quantities, or the evolution of the values of one of these quantities compared to the evolution of the values of another of these quantities as a function of time, the computer (1) controlling the display means (7) to obtain the image of the graph or graphs representative of the said evolution (s). Application to the visualization of the evolution of the values of physical quantities.
Description
La présente invention concerne un procédé de visualisation de grandeurs physiques variables dans le temps, ainsi qu'un dispositif permettant la mise en oeuvre de ce procédé.The present invention relates to a method for displaying physical variables varying over time, as well as to a device allowing the implementation of this method.
Elle s'applique notamment à la visualisation du graphe ou des graphes représentatifs de l'évolution des valeurs relatives de grandeurs physiques. L'invention s'applique aussi à la visualisation du graphe représentatif de l'évolution relative de grandeurs physiques par rapport au temps. Dans les deux applications citées ci-dessus, les valeurs de grandeurs physiques sont acquises en fonction du temps. Ce procédé et ce dispositif peuvent être utilisés notamment dans le contrôle du fonctionnement de toute installation dans laquelle des paramètres physiques sont mesurés périodiquement, en choisissant des fréquences d'échantillonnage prédéterminées ; ces mesures permettent de suivre l'évolution du fonctionnement de cette installation au cours du temps, et éventuellement, d'intervenir en cas d'incident dans ce fonctionnement. C'est le cas par exemple, dans les réacteurs nucléaires où il est nécessaire de détecter tout déséquilibre axial de la puissance du réacteur afin d'y remédier efficacement. Ce déséquilibre est en fait détecté en suivant, au cours du fonctionnement, l'évolution de la valeur de la puissance du réacteur en fonction des valeurs du flux haut et du flux bas générés par le combustible. Le suivi constant de cette évolution permet notamment de commander le réacteur pour qu'il fonctionne à sa puissance maximale. Il permet aussi d'effectuer des variations rapides de puissance, comme par exemple la variation journalière de la charge. Cette commande consiste à modifier le niveau des barres de contrôle, dans la cuve du réacteur, ou la concentration d'acide borique.It applies in particular to the visualization of the graph or graphs representative of the evolution of the relative values of physical quantities. The invention also applies to the visualization of the graph representative of the relative evolution of physical quantities with respect to time. In the two applications mentioned above, the values of physical quantities are acquired as a function of time. This method and this device can be used in particular in controlling the operation of any installation in which physical parameters are measured periodically, by choosing predetermined sampling frequencies; these measures make it possible to follow the evolution of the operation of this installation over time, and possibly to intervene in the event of an incident in this operation. This is the case, for example, in nuclear reactors where it is necessary to detect any axial imbalance in the power of the reactor in order to remedy it effectively. This imbalance is in fact detected by following, during operation, the change in the value of the power of the reactor as a function of the values of the high flow and the low flow generated by the fuel. Constant monitoring of this development makes it possible in particular to control the reactor so that it operates at its maximum power. It also allows rapid variations in power, such as the daily variation of the load. This command consists in modifying the level of the control rods, in the reactor vessel, or the concentration of boric acid.
On ne connaît pas actuellement de procédé et de système de visualisation de grandeurs variables dans le temps, avec lesquels il est possible de visualiser l'évolution des valeurs de l'une de ces grandeurs par rapport à l'autre aux valeurs d'une autre de ces grandeurs et, éventuellement, l'évolution des valeurs de l'une de ces grandeurs par rapport aux valeurs de l'autre grandeur, en fonction du temps, les valeurs de ces grandeurs étant fournies au départ, séparément, en fonction du temps. On ne connaît pas non plus de procédé ou de système qui permette de visualiser ces évolutions selon des échelles variables et selon des élections périodiques variables de ces grandeurs évoluant l'une par rapport à l'autre et éventuellement par rapport au temps.There is currently no known method and system for visualizing variables variable over time, with which it is possible to visualize the evolution of the values of one of these magnitudes with respect to the other to the values of another. of these quantities and, possibly, the evolution of the values of one of these quantities compared to the values of the other quantity, as a function of time, the values of these quantities being supplied at the start, separately, as a function of time . Neither is there a known process or system which makes it possible to visualize these evolutions according to variable scales and according to variable periodic elections of these quantities evolving one with respect to the other and possibly with respect to time.
On connaît seulement des tables traçantes ou des systèmes de visualisations multicourbes qui ne permettent de représenter simultanément que les variations des valeurs de deux grandeurs physiques par rapport au temps. Ces procédés et ces systèmes ne permettent pas de représenter aussi les variations de l'une de ces grandeurs par rapport à l'autre et, éventuellement par rapport au temps. Les procédés et les sytèmes connus ne permettent de plus, que très difficilement, de faire varier la fréquence d'échantillonnage ou d'acquisition de ces grandeurs, de faire varier l'échelle de visualisation du graphe représentatif de leur évolution relative, et de faire varier aussi la fréquence de sélection des valeurs relatives de ces grandeurs, pour visualiser le graphe représentatif de cette évolution sur une période plus ou moins importante. Ces systèmes ne permettent pas de déterminer avec certitude les trajectoires suivies lors des variations de paramètres produisant des boucles.Only plotters or multicurve visualization systems are known which only allow the variations of the values of two physical quantities to be represented simultaneously over time. These methods and these systems do not also make it possible to represent the variations of one of these quantities with respect to the other and, possibly with respect to time. The known methods and systems also make it very difficult to vary the frequency of sampling or acquisition of these quantities, to vary the scale of visualization of the graph representative of their relative evolution, and to make vary also the frequency of selection of the relative values of these quantities, to visualize the graph representative of this evolution over a more or less important period. These systems do not make it possible to determine with certainty the trajectories followed during variations of parameters producing loops.
L'invention a pour but de remédier à ces inconvénients et notamment de permettre la visualisation de l'évolution relative des valeurs de grandeurs physiques, la fréquence d'échantillonnage ou d'acquisition de ces grandeurs ainsi que la fréquence de sélection des valeurs relatives de ces grandeurs étant réglables, et l'échelle de visualisation du graphe représentatif de l'évolution de ces grandeurs pouvant être elle-même choisie de façon prédéterminée.The invention aims to remedy these drawbacks and in particular to allow viewing of the relative evolution of the values of physical quantities, the frequency of sampling or acquisition of these quantities as well as the frequency of selection of the relative values of these quantities being adjustable, and the display scale of the graph representative of the evolution of these quantities can itself be chosen in a predetermined manner.
L'invention vise tout d'abord un procédé de visualisation de grandeurs physiques variables dans le temps, consistant à enregistrer, avec au moins une fréquence d'échantillonnage ou d'acquisition prédéterminée, les valeurs de chacune de ces grandeurs au cours du temps, et à enregistrer simultanément à la même fréquence d'échantillonnage, l'évolution des valeurs de l'une de ces grandeurs par rapport à l'évolution des valeurs d'une autre de ces grandeurs et pour éventuellement, l'évolution des valeurs de l'une de ces grandeurs par rapport à l'évolution des valeurs d'une autre de ces grandeurs, en fonction du temps, le procédé consistant ensuite à visualiser le ou les graphes représentatifs de la ou lesdites évolutions, caractérisé en ce que le ou lesdits graphes sont visualisés à partir des valeurs représentatives de la ou desdites évolutions, enregistrées à la même fréquence que ladite fréquence d'échantillonnage prédéterminées, ou à partir de certaines valeurs sélectionnées parmi les valeurs représentatives de la où desdites évolutions, ces valeurs étant sélectionnées avec une fréquence de sélection qui est multiple de la fréquence d'échantillonnage.The invention firstly relates to a method for displaying physical variables variable over time, consisting in recording, with at least a predetermined sampling or acquisition frequency, the values of each of these quantities over time, and to record simultaneously at the same sampling frequency, the evolution of the values of one of these quantities compared to the evolution of the values of another of these quantities and for possibly, the evolution of the values of l '' one of these quantities compared to the evolution of the values of another of these quantities, as a function of time, the method then consisting in viewing the graph or graphs representative of the said evolution (s), characterized in that the said (s) graphs are displayed on the basis of the values representative of the said evolution (s), recorded at the same frequency as the said predetermined sampling frequency, or from certain values selected from the va their representative of where said evolutions, these values being selected with a selection frequency which is multiple of the sampling frequency.
Selon une autre caractéristique, le procédé consiste en outre à appliquer à chacune des valeurs des grandeurs, au cours de la ou desdites évolutions, des coefficients de multiplication, pour obtenir, en relation avec le choix de chacun de ces coefficients, une échelle prédéterminée de visualisation ou desdits graphes.According to another characteristic, the method also consists in applying to each of the values of the magnitudes, during the said evolution (s), multiplication coefficients, in order to obtain, in relation to the choice of each of these coefficients, a predetermined scale of visualization or said graphs.
L'invention a aussi pour objet un système de visualisation de grandeurs physiques variables dans le temps, comprenant un calculateur, une mémoire reliée à ce calculateur pour enregistrer les valeurs de ces grandeurs, une horloge à fréquence réglable, reliée à des moyens d'acquisition des valeurs de ces grandeurs pour fixer au moins une fréquence d'échantillonnage ou d'acquisition des valeurs de ces grandeurs, des sorties de ces moyens d'acquisition étant reliées au calculateur, et des moyens de visualisation reliés au calculateur, caractérisé en ce qu'il comprend, en outre, des moyens pour enregistrer simultanément dans la mémoire du calculateur et à la même fréquence, l'évolution des valeurs de l'une de ces grandeurs par rapport à l'évolution des valeurs d'une autre de ces grandeurs, ou l'évolution des valeurs de l'une de ces grandeurs par rapport à l'évolution des valeurs d'une autre de ces grandeurs en fonction du temps, le calculateur commandant les moyens de visualisation pour obtenir l'image du ou des graphes représentatifs de la ou desdites évolutions.The invention also relates to a system for displaying physical variables varying over time, comprising a computer, a memory connected to this computer for recording the values of these quantities, a clock with adjustable frequency, connected to acquisition means. values of these quantities to fix at least one sampling or acquisition frequency of the values of these quantities, outputs of these acquisition means being connected to the computer, and display means connected to the computer, characterized in that '' it further comprises means for simultaneously recording in the computer memory and at the same frequency, the evolution of the values of one of these quantities compared to the evolution of the values of another of these quantities , or the evolution of the values of one of these quantities compared to the evolution of the values of another of these quantities as a function of time, the computer controlling the display means for obtaining reveal the image of the graph or graphs representative of the said evolution (s).
Selon une autre caractéristique, le système comprend en outre des moyens pour appliquer à chacune des valeurs enregistrées au cours de la ou desdites évolutions, des coefficients de multiplication pour obtenir, en relation avec le choix de chacun des coefficients, une échelle prédéterminée de visualisation du ou desdits graphes.According to another characteristic, the system further comprises means for applying to each of the values recorded during the said evolution (s), multiplication coefficients to obtain, in relation to the choice of each of the coefficients, a predetermined scale for displaying the or said graphs.
Selon une autre caractéristique, ladite horloge réglable est en outre reliée au calculateur pour visualiser le ou lesdits graphes, à partir des valeurs enregistrées au cours de la ou desdites évolutions, ces valeurs étant sélectionnées en mémoire avec une fréquence de sélection égale à la fréquence d'échantillonnage prédéterminée, ou à partir de certaines seulement des valeurs enregistrées au cours de la ou desdites évolutions, ces valeurs étant sélectionnées en mémoire avec une fréquence de sélection qui est multiple de la fréquence d'échantillonnage.According to another characteristic, said adjustable clock is also connected to the computer to display the said graph or graphs, on the basis of the values recorded during the said evolution (s), these values being selected in memory with a selection frequency equal to the frequency d predetermined sampling, or from cer only some of the values recorded during the said evolution (s), these values being selected in memory with a selection frequency which is multiple of the sampling frequency.
Selon une autre caractéristique, les moyens pour enregistrer les valeurs des grandeurs au cours de la ou desdites évolutions comprennent des tables de correspondance situées en mémoire.According to another characteristic, the means for recording the values of the quantities during the said evolution (s) include correspondence tables located in memory.
Selon une autre caractéristique, les moyens de multiplication comprennent des tables de multiplication par des coefficients situés en mémoire.According to another characteristic, the multiplication means comprise multiplication tables by coefficients located in memory.
Les caractéristiques et avantages de l'invention ressortiront mieux de la description qui va suivre donnée en référence à la figure annexée qui représente schématiquement un système d'enregistement et de visualisation conforme à l'invention.The characteristics and advantages of the invention will emerge more clearly from the description which follows given with reference to the appended figure which schematically represents a recording and display system according to the invention.
Le système de l'invention comprend un calculateur 1, une mémoire 2 reliée à ce calculateur, une horloge 3 à fréquence réglable, reliée au calculateur ainsi qu'à des moyens 4 d'acquisition de grandeurs physiques variables dans le temps. Les moyens d'acquisition 4 peuvent être constitués par exemple par un convertisseur analogique numérique 5 qui reçoit les grandeurs physiques variables et un multiplexeur 6 dont les sorties sont reliées au calculateur 1 et dont les entrées sont reliées à des sorties du convertisseur 5. L'horloge réglable 3 permet de fixer au moins une fréquence d'échantillonnage ou d'acquisition des valeurs des grandeurs fournies au calculateur 1 par le multiplexeur 6. La fréquence prédéterminée d'échantillonnage correspond à la fréquence d'enregistrement des valeurs des grandeurs physiques variables dans le temps, dans la mémoire 2. Le système comprend aussi des moyens de visualisation 7, de type cathodique par exemple. Ce système peut également comporter un clavier d'introduction de données 8 pour permettre notamment, de commander le réglage de la fréquence de l'horloge 3 une imprimante 9 peut également être reliée au calculateur 1.The system of the invention comprises a
Le système comprend aussi des moyens pour enregistrer simultanément dans la mémoire du calculateur et à la même fréquence que la fréquence d'échantillonnage, l'évolution des valeurs de l'une de ces grandeurs par rapport aux valeurs de l'autre grandeur, ou l'évolution des valeurs de l'une de ces grandeurs par rapport aux valeurs de l'autre et par rapport au temps. Le calculateur commande alors les moyens de visualisation pour obtenir le graphe représentatif de chacune de ces évolutions, comme on le verra plus loin en détail.The system also includes means for simultaneously recording in the computer memory and at the same frequency as the sampling frequency, the change in the values of one of these quantities compared to the values of the other quantity, or l evolution of the values of one of these quantities compared to the values of the other and compared to time. The computer then controls the display means to obtain the graph representative of each of these changes, as will be seen in detail below.
En fait, si l'on suppose par exemple que deux grandeurs x et y dont les valeurs varient en fonction du temps (t) (x = f(t) et y = g(t)) sont acquises au départ, les moyens pour enregistrer l'évolution des valeurs relatives de ces grandeurs sont constitués par des tables 12, 13, localisées en mémoire. Ces tables permettent d'obtenir, pour la fréquence d'échantillonnage ou d'acquisition prédéterminée de ces grandeurs, soit l'évolution des valeurs de la grandeur x par rapport aux valeurs de la grandeur y, qui peut être notée x = h(y) (évolution relative des valeurs de ces grandeurs), soit l'évolution des valeurs de la grandeur x par rapport aux valeurs de la grandeur y, et par rapport au temps t, cette évolution pouvant être notée x = e (y, t). Les valeurs x = f(t) et y = g(t) fournies au calculateur 1 sous forme numérique par les moyens d'acquisition 4, peuvent être rangés respectivement dans les zones 10 et 11, de la mémoire vive 2 ; ensuite, les tables 12, 13 situées dans cette mémoire permettent d'établir les relations x = h(y) et/ou x = e(y, t). La fréquence d'échantillonnage ou d'acquisition des valeurs des grandeurs physiques fournies par les moyens d'acquisition 4, peut être à tout instant modifiée à l'aide du clavier d'entrée de données 8.In fact, if we suppose for example that two quantities x and y whose values vary as a function of time (t) (x = f (t) and y = g (t)) are acquired at the start, the means for recording the evolution of the relative values of these quantities are constituted by tables 12, 13, located in memory. These tables make it possible to obtain, for the predetermined sampling or acquisition frequency of these quantities, either the evolution of the values of the quantity x with respect to the values of the quantity y, which can be noted x = h (y ) (relative evolution of the values of these quantities), i.e. the evolution of the values of the quantity x with respect to the values of the quantity y, and with respect to time t, this evolution being able to be noted x = e (y, t) . The values x = f (t) and y = g (t) supplied to the
Le système comprend aussi des moyens pour appliquer simultanément à chacune des valeurs enregistrées des grandeurs, des coefficients de multiplication qui permettent d'obtenir, en relation avec le choix de chacun de ces coefficients, une échelle prédéterminée de visualisation des graphes représentatifs des évolutions des valeurs relatives des grandeurs acquises. Ces moyens sont constitués par une table 14 située dans la mémoire 2 du calculateur 1. Cette table permet à la fréquence d'échantillonnage choisie, d'apppliquer un coefficient multiplicateur aux valeurs de la grandeur x et/ou aux valeurs de la grandeur y. Ce coefficient multiplicateur permet en fait d'agrandir ou de diminuer l'étendue du graphe visualisé sur l'écran des moyens de visualisation 7. En fait, alors que dans les systèmes de visualisation classiques, il est simplement possible de visualiser l'évolution par rapport au temps, des valeurs de grandeurs x et y séparément, le système de l'invention permet de représenter l'évolution des valeurs de la grandeur x par rapport aux valeurs de la grandeur y et, éventuellement l'évolution des valeurs de la valeurThe system also includes means for simultaneously applying to each of the recorded values of the magnitudes, multiplication coefficients which make it possible to obtain, in relation to the choice of each of these coefficients, a predetermined scale for viewing the graphs representative of the changes in the values. relative of acquired quantities. These means consist of a table 14 located in the
x par rapport aux valeurs y de la grandeur et par rapport au temps t. Le clavier 8 permet également de modifier le coefficient de multiplication appliqué aux valeurs des grandeurs acquises. Cette multiplication est bien entendu effectuée avec la même fréquence que la fréquence d'échantillonnage prédéterminée.x with respect to the values y of the quantity and with respect to time t. The keyboard 8 also makes it possible to modify the multiplication coefficient applied to the values of the acquired quantities. This multiplication is of course carried out with the same frequency as the predetermined sampling frequency.
L'horloge 3 est aussi reliée au calculateur 1 pour visualiser avec le graphe x = h(y) et/ou le graphe x = e(y, t) avec une fréquence prédéterminée de sélection des valeurs relatives de ces grandeurs, fournies par les tables décrites plus haut. Cette fréquence de sélection peut être égale à la fréquence d'échantillonnage ou peut être un multiple de celle-ci. Lorsque la fréquence de sélection est égale à la fréquence d'échantillonnage, le graphe obtenu sur l'écran de visualisation représente l'évolution instantanée des valeurs relatives des grandeurs. Lorsque la fréquence de sélection est un multiple de la fréquence d'échantillonnage, le graphe obtenu sur l'écran de visualisation permet de suivre l'évolution dans le temps, des valeurs relatives des grandeurs. C'est ainsi par exemple que pour un processus dont la durée est importante (plusieurs heures par exemple), il est possible de ne sélectionner dans les tables de la mémoire que les valeurs relatives des grandeurs correspondant à une acquisition qui serait effectuée toutes les cinq ou dix minutes par exemple, ou selon tout autre période prédéterminée.Clock 3 is also connected to
Le procédé et le système de l'invention peuvent être appliqués par exemple au pilotage d'un réacteur nucléaire, à sa puissance maximale ou en cas de variation de charge. Dans ce cas, la puissance du réacteur est mesurée en fonction du temps et les données correspondantes sont acquises dans la mémoire du calculateur avec une fréquence d'échantillonnage prédéterminée. De la même manière, les données concernant le déséquilibre axial vQf de la puissance, sont acquises en fonction du temps, avec la même fréquence d'échantillonnage. Le procédé et le système de l'invention permettent alors de visualiser le graphe représentatif de la variation de puissance du réacteur, en fonction de son déséquilibre axial de puissance. On ne décrira pas ici en détail les méthodes connues de mesures de la puissance et du déséquilibre axial d'un réacteur. Le graphe obtenu permet de suivre de manière instantanée ou au cours du temps, la puissance du réacteur en fonction du déséquilibre axial et ainsi, d'intervenir rapidement sur les moyens de contrôle de cette puissance ; ce contrôle permet de maintenir le couple puissance-déséquilibre à l'intérieur d'un domaine de fonctionnement dont les limites sont calculées en temps réel par le calculateur. Avec les procédés et systèmes connus, l'intervention urgente n'est pas possible puisque l'opérateur doit, à partir du graphe représentatif de la puissance en fonction du temps et du graphe représentatif du déséquilibre axial de puissance en fonction du temps, consulter des abaques lui permettant de calculer à un instant donné la puissance en fonction du déséquilibre axial. Cette opération longue et donc préjudiciable ne permet pas d'intervenir rapidement sur les moyens de commande de la puissance du réacteur ; de plus l'opérateur ne peut visualiser le graphe représentant cette évolution au cours du temps et ne peut donc conserver un historique du fonctionnement. Ces inconvénients disparaissent grâce au procédé et au système de l'invention.The method and the system of the invention can be applied for example to the control of a nuclear reactor, at its maximum power or in the event of a load variation. In this case, the power of the reactor is measured as a function of time and the corresponding data is acquired in the memory of the computer with a predetermined sampling frequency. In the same way, the data concerning the axial imbalance vQf of the power, are acquired as a function of time, with the same sampling frequency. The method and system of the invention then make it possible to view the graph representative of the variation in power of the reactor, as a function of its axial power imbalance. We will not describe here in detail the known methods of power and axial imbalance measurements of a reactor. The graph obtained makes it possible to monitor instantaneously or over time, the power of the reactor as a function of the axial imbalance and thus, to intervene quickly on the means of controlling this power; this control makes it possible to maintain the power-imbalance couple within an operating range whose limits are calculated in real time by the computer. With known methods and systems, urgent intervention is not possible since the operator must, from the graph representative of the power as a function of time and the graph representative of the axial imbalance of power as a function of time, consult abacuses allowing it to calculate at a given time the power as a function of the axial imbalance. This long and therefore harmful operation does not allow rapid intervention on the means for controlling the power of the reactor; moreover, the operator cannot visualize the graph representing this evolution over time and therefore cannot keep a history of operation. These drawbacks disappear thanks to the method and system of the invention.
Claims (8)
Priority Applications (1)
| Application Number | Priority Date | Filing Date | Title |
|---|---|---|---|
| AT84402541T ATE38904T1 (en) | 1983-12-14 | 1984-12-10 | METHOD FOR ILLUSTRATION OF PHYSICAL QUANTITIES THAT VARY WITH TIME AND SYSTEM FOR CARRYING OUT THIS METHOD. |
Applications Claiming Priority (2)
| Application Number | Priority Date | Filing Date | Title |
|---|---|---|---|
| FR8320038 | 1983-12-14 | ||
| FR8320038A FR2556842B1 (en) | 1983-12-14 | 1983-12-14 | METHOD FOR VISUALIZATION OF PHYSICAL VARIABLES IN TIME, AND SYSTEM FOR CARRYING OUT SAID METHOD |
Publications (3)
| Publication Number | Publication Date |
|---|---|
| EP0145602A2 true EP0145602A2 (en) | 1985-06-19 |
| EP0145602A3 EP0145602A3 (en) | 1985-07-24 |
| EP0145602B1 EP0145602B1 (en) | 1988-11-23 |
Family
ID=9295175
Family Applications (1)
| Application Number | Title | Priority Date | Filing Date |
|---|---|---|---|
| EP84402541A Expired EP0145602B1 (en) | 1983-12-14 | 1984-12-10 | Process for visualizing physical quantities variable in time and system for realizing said process |
Country Status (9)
| Country | Link |
|---|---|
| US (1) | US4734867A (en) |
| EP (1) | EP0145602B1 (en) |
| JP (1) | JPS60177219A (en) |
| AT (1) | ATE38904T1 (en) |
| CA (1) | CA1242820A (en) |
| DE (1) | DE3475353D1 (en) |
| FR (1) | FR2556842B1 (en) |
| NO (1) | NO165616C (en) |
| ZA (1) | ZA849537B (en) |
Cited By (1)
| Publication number | Priority date | Publication date | Assignee | Title |
|---|---|---|---|---|
| ES2132023A1 (en) * | 1997-06-04 | 1999-08-01 | Cembranos Nistal Florencio Jes | Analogue/digital and digital/analogue converter for converting the computer into an oscilloscope and signal generator |
Families Citing this family (3)
| Publication number | Priority date | Publication date | Assignee | Title |
|---|---|---|---|---|
| US5307455A (en) * | 1990-04-11 | 1994-04-26 | Hewlett Packard Company | Display of multiple variable relationships |
| US7242403B2 (en) * | 2004-09-20 | 2007-07-10 | Timothy Phelan | Graphical display of multiple related variables |
| RU2726385C1 (en) * | 2019-12-06 | 2020-07-13 | Гарри Романович Аванесян | Method of visual control of levels of a group of sinusoidal signals of different frequencies |
Citations (3)
| Publication number | Priority date | Publication date | Assignee | Title |
|---|---|---|---|---|
| DE2013056A1 (en) * | 1970-03-19 | 1971-10-07 | Siemens Ag | Method and arrangement for displaying the course over time of series of measured values on the screen of a display device |
| GB2052077A (en) * | 1979-06-21 | 1981-01-21 | Martinez A | Monitoring Electrical Signals |
| FR2515358A1 (en) * | 1981-10-22 | 1983-04-29 | Tektronix Inc | INSTRUMENT FOR SIGNAL MEASUREMENT |
Family Cites Families (5)
| Publication number | Priority date | Publication date | Assignee | Title |
|---|---|---|---|---|
| US4303973A (en) * | 1976-10-29 | 1981-12-01 | The Foxboro Company | Industrial process control system |
| US4325223A (en) * | 1981-03-16 | 1982-04-20 | Cantley Robert J | Energy management system for refrigeration systems |
| US4504920A (en) * | 1981-08-12 | 1985-03-12 | John Mickowski | Data analysis and display method for reciprocating equipment in industrial processes |
| US4482861A (en) * | 1982-06-14 | 1984-11-13 | Tektronix, Inc. | Waveform measurement and display apparatus |
| JPS5968696A (en) * | 1982-10-14 | 1984-04-18 | 株式会社東芝 | Reactor state monitoring device |
-
1983
- 1983-12-14 FR FR8320038A patent/FR2556842B1/en not_active Expired
-
1984
- 1984-12-07 ZA ZA849537A patent/ZA849537B/en unknown
- 1984-12-07 NO NO844919A patent/NO165616C/en unknown
- 1984-12-10 AT AT84402541T patent/ATE38904T1/en not_active IP Right Cessation
- 1984-12-10 EP EP84402541A patent/EP0145602B1/en not_active Expired
- 1984-12-10 DE DE8484402541T patent/DE3475353D1/en not_active Expired
- 1984-12-12 CA CA000469878A patent/CA1242820A/en not_active Expired
- 1984-12-12 JP JP59262641A patent/JPS60177219A/en active Pending
- 1984-12-13 US US06/681,224 patent/US4734867A/en not_active Expired - Fee Related
Patent Citations (3)
| Publication number | Priority date | Publication date | Assignee | Title |
|---|---|---|---|---|
| DE2013056A1 (en) * | 1970-03-19 | 1971-10-07 | Siemens Ag | Method and arrangement for displaying the course over time of series of measured values on the screen of a display device |
| GB2052077A (en) * | 1979-06-21 | 1981-01-21 | Martinez A | Monitoring Electrical Signals |
| FR2515358A1 (en) * | 1981-10-22 | 1983-04-29 | Tektronix Inc | INSTRUMENT FOR SIGNAL MEASUREMENT |
Non-Patent Citations (2)
| Title |
|---|
| ELEKTRONIK, vol. 22, no. 8, août 1973, pages 271-276, Munich, DE; K. LIPINSKI et al.: "Der rechnergesteuerte Oszillograf" * |
| TOUTE L'ELECTRONIQUE, no. 456, août-septembre 1980, pages 15-18, Paris, FR; Y. PACHEU: "Possibilités de l'oscilloscope "calculateur" " * |
Cited By (1)
| Publication number | Priority date | Publication date | Assignee | Title |
|---|---|---|---|---|
| ES2132023A1 (en) * | 1997-06-04 | 1999-08-01 | Cembranos Nistal Florencio Jes | Analogue/digital and digital/analogue converter for converting the computer into an oscilloscope and signal generator |
Also Published As
| Publication number | Publication date |
|---|---|
| CA1242820A (en) | 1988-10-04 |
| NO165616B (en) | 1990-11-26 |
| EP0145602B1 (en) | 1988-11-23 |
| NO844919L (en) | 1985-06-17 |
| FR2556842A1 (en) | 1985-06-21 |
| FR2556842B1 (en) | 1986-05-16 |
| US4734867A (en) | 1988-03-29 |
| DE3475353D1 (en) | 1988-12-29 |
| ZA849537B (en) | 1985-07-31 |
| JPS60177219A (en) | 1985-09-11 |
| NO165616C (en) | 1991-03-06 |
| EP0145602A3 (en) | 1985-07-24 |
| ATE38904T1 (en) | 1988-12-15 |
Similar Documents
| Publication | Publication Date | Title |
|---|---|---|
| US5477730A (en) | Rolling element bearing condition testing method and apparatus | |
| US10386339B2 (en) | Modal vibration analysis system | |
| EP1049862B1 (en) | Device for estimating richness in an injection system for an internal combustion engine | |
| FR2994745A1 (en) | METHOD FOR ESTIMATING THE AGING OF A BATTERY | |
| FR2573530A1 (en) | APPARATUS FOR THE RAPID DETERMINATION OF THE MOISTURE RATE OF A MATERIAL. | |
| Deo et al. | A correlation-locking adaptive filtering technique for minimum variance integral control in adaptive optics | |
| EP0145602B1 (en) | Process for visualizing physical quantities variable in time and system for realizing said process | |
| EP0204593B1 (en) | Method for regulating a grey scale in digital image reproduction, and apparatus for carrying out this method | |
| Saichev et al. | Generic multifractality in exponentials of long memory processes | |
| US7130052B1 (en) | Real-time measurement of ultrashort laser pulses | |
| EP0406075A1 (en) | Procedure for determining the power distribution in a nuclear reactor core and calibration procedure of neutron detectors around a nuclear reactor core | |
| Mitzkus et al. | Surface brightness fluctuation spectrum: a new probe of evolved stars in unresolved stellar populations | |
| Piazzo | Least squares image estimation for large data in the presence of noise and irregular sampling | |
| JP2575754B2 (en) | Frequency response function measurement method | |
| US20040143565A1 (en) | Deconvolution technique employing hermite functions | |
| US6545454B1 (en) | System and method for testing an integrated circuit device using FFT analysis based on a non-iterative FFT coherency analysis algorithm | |
| CN100473175C (en) | Method for determining envelope lines of modulation signals | |
| FR2536863A1 (en) | WAVEFORM VISUALIZATION APPARATUS, AND ASSOCIATED METHOD | |
| JP4283968B2 (en) | Moderator temperature coefficient measuring method and moderator temperature coefficient measuring apparatus for nuclear reactor | |
| Kane et al. | Real-time inversion of polarization gate frequency-resolved optical gating spectrograms | |
| KR100996109B1 (en) | Apparauts and method for recording analogous data | |
| RU2104495C1 (en) | Process of measurement of physical quantities | |
| JPH06129882A (en) | Plant monitoring apparatus | |
| JP2509154B2 (en) | Optical spectrum analyzer | |
| Gabriel et al. | From a calibration tool to a full scientific analysis and pipeline system: the ISOPHOT Interactive Analysis (PIA) |
Legal Events
| Date | Code | Title | Description |
|---|---|---|---|
| PUAI | Public reference made under article 153(3) epc to a published international application that has entered the european phase |
Free format text: ORIGINAL CODE: 0009012 |
|
| PUAL | Search report despatched |
Free format text: ORIGINAL CODE: 0009013 |
|
| AK | Designated contracting states |
Designated state(s): AT BE CH DE GB IT LI LU NL SE |
|
| AK | Designated contracting states |
Designated state(s): AT BE CH DE GB IT LI LU NL SE |
|
| 17P | Request for examination filed |
Effective date: 19851223 |
|
| 17Q | First examination report despatched |
Effective date: 19861222 |
|
| R17C | First examination report despatched (corrected) |
Effective date: 19870515 |
|
| GRAA | (expected) grant |
Free format text: ORIGINAL CODE: 0009210 |
|
| AK | Designated contracting states |
Kind code of ref document: B1 Designated state(s): AT BE CH DE GB IT LI LU NL SE |
|
| REF | Corresponds to: |
Ref document number: 38904 Country of ref document: AT Date of ref document: 19881215 Kind code of ref document: T |
|
| ITF | It: translation for a ep patent filed |
Owner name: JACOBACCI & PERANI S.P.A. |
|
| REF | Corresponds to: |
Ref document number: 3475353 Country of ref document: DE Date of ref document: 19881229 |
|
| GBT | Gb: translation of ep patent filed (gb section 77(6)(a)/1977) | ||
| PLBE | No opposition filed within time limit |
Free format text: ORIGINAL CODE: 0009261 |
|
| STAA | Information on the status of an ep patent application or granted ep patent |
Free format text: STATUS: NO OPPOSITION FILED WITHIN TIME LIMIT |
|
| 26N | No opposition filed | ||
| PGFP | Annual fee paid to national office [announced via postgrant information from national office to epo] |
Ref country code: SE Payment date: 19921124 Year of fee payment: 9 |
|
| PGFP | Annual fee paid to national office [announced via postgrant information from national office to epo] |
Ref country code: LU Payment date: 19921125 Year of fee payment: 9 |
|
| PGFP | Annual fee paid to national office [announced via postgrant information from national office to epo] |
Ref country code: DE Payment date: 19921203 Year of fee payment: 9 Ref country code: BE Payment date: 19921203 Year of fee payment: 9 |
|
| PGFP | Annual fee paid to national office [announced via postgrant information from national office to epo] |
Ref country code: CH Payment date: 19921204 Year of fee payment: 9 |
|
| PGFP | Annual fee paid to national office [announced via postgrant information from national office to epo] |
Ref country code: GB Payment date: 19921207 Year of fee payment: 9 |
|
| PGFP | Annual fee paid to national office [announced via postgrant information from national office to epo] |
Ref country code: AT Payment date: 19921214 Year of fee payment: 9 |
|
| ITTA | It: last paid annual fee | ||
| PGFP | Annual fee paid to national office [announced via postgrant information from national office to epo] |
Ref country code: NL Payment date: 19921231 Year of fee payment: 9 |
|
| EPTA | Lu: last paid annual fee | ||
| PG25 | Lapsed in a contracting state [announced via postgrant information from national office to epo] |
Ref country code: LU Free format text: LAPSE BECAUSE OF NON-PAYMENT OF DUE FEES Effective date: 19931210 Ref country code: GB Effective date: 19931210 Ref country code: AT Effective date: 19931210 |
|
| PG25 | Lapsed in a contracting state [announced via postgrant information from national office to epo] |
Ref country code: SE Effective date: 19931211 |
|
| PG25 | Lapsed in a contracting state [announced via postgrant information from national office to epo] |
Ref country code: LI Effective date: 19931231 Ref country code: CH Effective date: 19931231 Ref country code: BE Effective date: 19931231 |
|
| BERE | Be: lapsed |
Owner name: ELECTRICITE DE FRANCE SERVICE NATIONAL Effective date: 19931231 |
|
| PG25 | Lapsed in a contracting state [announced via postgrant information from national office to epo] |
Ref country code: NL Effective date: 19940701 |
|
| GBPC | Gb: european patent ceased through non-payment of renewal fee |
Effective date: 19931210 |
|
| NLV4 | Nl: lapsed or anulled due to non-payment of the annual fee | ||
| REG | Reference to a national code |
Ref country code: CH Ref legal event code: PL |
|
| PG25 | Lapsed in a contracting state [announced via postgrant information from national office to epo] |
Ref country code: DE Effective date: 19940901 |
|
| EUG | Se: european patent has lapsed |
Ref document number: 84402541.1 Effective date: 19940710 |