EP0143664A2 - Ultrasonic characterisation of a Medium - Google Patents
Ultrasonic characterisation of a Medium Download PDFInfo
- Publication number
- EP0143664A2 EP0143664A2 EP84308285A EP84308285A EP0143664A2 EP 0143664 A2 EP0143664 A2 EP 0143664A2 EP 84308285 A EP84308285 A EP 84308285A EP 84308285 A EP84308285 A EP 84308285A EP 0143664 A2 EP0143664 A2 EP 0143664A2
- Authority
- EP
- European Patent Office
- Prior art keywords
- medium
- observed
- obtaining
- value
- region
- Prior art date
- Legal status (The legal status is an assumption and is not a legal conclusion. Google has not performed a legal analysis and makes no representation as to the accuracy of the status listed.)
- Granted
Links
- 238000012512 characterization method Methods 0.000 title description 6
- 238000001228 spectrum Methods 0.000 claims description 39
- 230000001419 dependent effect Effects 0.000 claims description 12
- 238000000034 method Methods 0.000 claims description 11
- 230000000694 effects Effects 0.000 claims description 4
- 238000004364 calculation method Methods 0.000 abstract description 6
- 210000001519 tissue Anatomy 0.000 description 29
- 230000015654 memory Effects 0.000 description 22
- 238000009826 distribution Methods 0.000 description 13
- 238000003745 diagnosis Methods 0.000 description 11
- 230000009466 transformation Effects 0.000 description 11
- 238000010586 diagram Methods 0.000 description 10
- 230000003534 oscillatory effect Effects 0.000 description 9
- 230000010355 oscillation Effects 0.000 description 5
- 239000000523 sample Substances 0.000 description 5
- 230000003321 amplification Effects 0.000 description 4
- 239000003086 colorant Substances 0.000 description 4
- 208000010125 myocardial infarction Diseases 0.000 description 4
- 238000003199 nucleic acid amplification method Methods 0.000 description 4
- 230000002238 attenuated effect Effects 0.000 description 3
- 201000010099 disease Diseases 0.000 description 3
- 208000037265 diseases, disorders, signs and symptoms Diseases 0.000 description 3
- 210000004165 myocardium Anatomy 0.000 description 3
- 230000005540 biological transmission Effects 0.000 description 2
- 230000008859 change Effects 0.000 description 2
- 238000002405 diagnostic procedure Methods 0.000 description 2
- 206010016654 Fibrosis Diseases 0.000 description 1
- 230000002159 abnormal effect Effects 0.000 description 1
- 230000007882 cirrhosis Effects 0.000 description 1
- 208000019425 cirrhosis of liver Diseases 0.000 description 1
- 239000002131 composite material Substances 0.000 description 1
- 238000005314 correlation function Methods 0.000 description 1
- 230000000593 degrading effect Effects 0.000 description 1
- 230000003111 delayed effect Effects 0.000 description 1
- 239000006185 dispersion Substances 0.000 description 1
- 239000000835 fiber Substances 0.000 description 1
- 230000006870 function Effects 0.000 description 1
- 210000004185 liver Anatomy 0.000 description 1
- 238000013507 mapping Methods 0.000 description 1
- 238000005259 measurement Methods 0.000 description 1
- 210000003205 muscle Anatomy 0.000 description 1
- 230000008569 process Effects 0.000 description 1
- 230000004044 response Effects 0.000 description 1
Images


Classifications
-
- G—PHYSICS
- G01—MEASURING; TESTING
- G01S—RADIO DIRECTION-FINDING; RADIO NAVIGATION; DETERMINING DISTANCE OR VELOCITY BY USE OF RADIO WAVES; LOCATING OR PRESENCE-DETECTING BY USE OF THE REFLECTION OR RERADIATION OF RADIO WAVES; ANALOGOUS ARRANGEMENTS USING OTHER WAVES
- G01S15/00—Systems using the reflection or reradiation of acoustic waves, e.g. sonar systems
- G01S15/88—Sonar systems specially adapted for specific applications
- G01S15/89—Sonar systems specially adapted for specific applications for mapping or imaging
- G01S15/8906—Short-range imaging systems; Acoustic microscope systems using pulse-echo techniques
- G01S15/8977—Short-range imaging systems; Acoustic microscope systems using pulse-echo techniques using special techniques for image reconstruction, e.g. FFT, geometrical transformations, spatial deconvolution, time deconvolution
-
- G—PHYSICS
- G01—MEASURING; TESTING
- G01S—RADIO DIRECTION-FINDING; RADIO NAVIGATION; DETERMINING DISTANCE OR VELOCITY BY USE OF RADIO WAVES; LOCATING OR PRESENCE-DETECTING BY USE OF THE REFLECTION OR RERADIATION OF RADIO WAVES; ANALOGOUS ARRANGEMENTS USING OTHER WAVES
- G01S7/00—Details of systems according to groups G01S13/00, G01S15/00, G01S17/00
- G01S7/52—Details of systems according to groups G01S13/00, G01S15/00, G01S17/00 of systems according to group G01S15/00
- G01S7/52017—Details of systems according to groups G01S13/00, G01S15/00, G01S17/00 of systems according to group G01S15/00 particularly adapted to short-range imaging
- G01S7/52023—Details of receivers
- G01S7/52025—Details of receivers for pulse systems
-
- G—PHYSICS
- G01—MEASURING; TESTING
- G01S—RADIO DIRECTION-FINDING; RADIO NAVIGATION; DETERMINING DISTANCE OR VELOCITY BY USE OF RADIO WAVES; LOCATING OR PRESENCE-DETECTING BY USE OF THE REFLECTION OR RERADIATION OF RADIO WAVES; ANALOGOUS ARRANGEMENTS USING OTHER WAVES
- G01S7/00—Details of systems according to groups G01S13/00, G01S15/00, G01S17/00
- G01S7/52—Details of systems according to groups G01S13/00, G01S15/00, G01S17/00 of systems according to group G01S15/00
- G01S7/52017—Details of systems according to groups G01S13/00, G01S15/00, G01S17/00 of systems according to group G01S15/00 particularly adapted to short-range imaging
- G01S7/52023—Details of receivers
- G01S7/52036—Details of receivers using analysis of echo signal for target characterisation
Landscapes
- Engineering & Computer Science (AREA)
- Physics & Mathematics (AREA)
- Radar, Positioning & Navigation (AREA)
- Remote Sensing (AREA)
- Computer Networks & Wireless Communication (AREA)
- General Physics & Mathematics (AREA)
- Acoustics & Sound (AREA)
- Ultra Sonic Daignosis Equipment (AREA)
Abstract
Description
- This invention relates to ultrasonic characterisation of a medium, for example living tissue, and particularly to ultrasonic diagnostic apparatus providing so-called tissue characterisation by reflected ultrasonic waves (hereinafter referred to as "reflection type ultrasonic wave TC") which is capable of characterising an ultrasonic wave medium to be observed, more definitely living tissue, using the ultrasonic waves reflected from the ultrasonic wave medium to be observed.
- Recently, efforts are being made to provide for TC which is capable of discriminating kinds of tissues and good or bad characteristics of tissues, rather than so-called B mode ultrasonic diagnosis apparatus which assists diagnosis by indicating shapes of tissues for example within a human body.
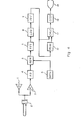
- Previous reflection type ultrasonic TC has most often involved the use of attenuation characteristics as the parameters employed for discriminating characteristics of living tissues, for example for discriminating whether a liver is healthy or is suffering from cirrhosis. The basis for this is found in the phenomenon that as an ultrasonic wave travels a distance Az in a medium, sound pressure of the wave is attenuated by EXP{-α(z,f)Δz}, with α(z,f) taken to be a factor (constant) which changes depending on place (location in the medium) and frequency (of the ultrasonic wave). For example, as shown in Fig.l, in order to determine the attenuation characteristic of a
region 104 between reflectingsurfaces ultrasonic vibration unit 105 placed at a position corresponding to Z = 0 and ultrasonic waves reflected from the reflectingsurfaces reflecting surface 101 is taken to be A(Zl,f) and the power spectrum of a received signal corresponding to reflection from the reflectingsurface 102 is taken to be A(Z2,f), and if the characteristics of the reflecting surfaces (reflection coefficients, etc) are the same, an attenuation characteristic α(z,f) can be obtained from the following:-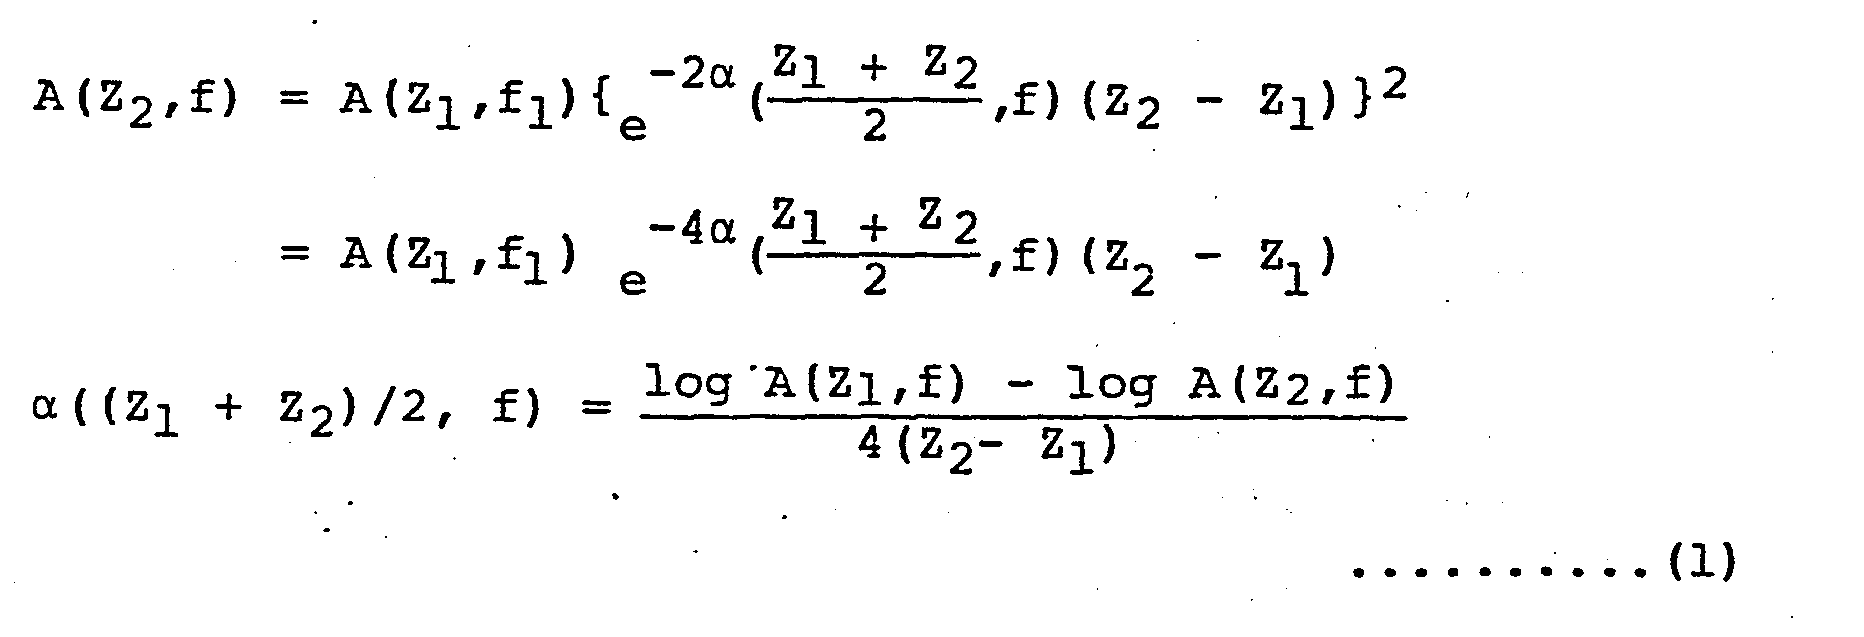
- It is possible also to obtain this attenuation characteristic without obtaining the power spectrums involved in the above equations.
- However, the use of such attenuation characteristics as the parameters employed for medium (tissue) characterisation involves the following difficult problems.
- First, in a case in which the
reflecting surfaces region 104 to be observed. - Second, an attenuation characteristic has a dependency on frequency of about 1 dB/MHz/cm in ordinary living tissue. However, an attenuation difference of only 2 dB or so occurs between the upper and lower limits of (most attenuated wave and least attenuated wave from) the region to be observed (such as
region 104 in Fig.l) even when an ultrasonic wave having a bandwidth of about 1 MHz is used and travels out and returns through living tissue of about 1 cm thickness. The attenuation difference can therefore be hidden by spectrum disturbances arising due to disturbances of ultrasonic wave beam pattern and it is difficult to obtain a meaningful attenuation characteristic in this context. for practical use, it is necessary that the tissue observed must be thick and an average of a large amount of data must be obtained, thus degrading space and time resolution. - According to the present invention there is provided apparatus for transmitting an ultrasonic wave into a medium and for receiving and processing the ultrasonic wave as reflected in the medium, for obtaining a value of a parameter which value characterises a region of the medium to be observed, the apparatus comprising
- a) means for extracting a time section of a receiving signal corresponding to the ultrasonic wave as reflected in the medium, and
- b) means for obtaining from the extracted signal time section a value dependent upon the spacing between small reflecting bodies dispersedly distributed in the region of the medium to be observed.
- An embodiment of this invention can provide for discrimination between normal and abnormal conditions of tissues, using characteristic values related to tissue structure, such as average interval of fine structure in the tissues, etc, as parameters for the discrimination, in place of attenuation characteristics. This is applicable for example in relation to tissues the fine structure of which changes due to a disease. For example, in the case of the myocardium, the fibrous nature thereof increases when myocardial infarction occurs.
- An embodiment of this invention can provide that parameters indicating fine structure of tissue are obtained easily with good accuracy.
- An embodiment of the present invention is based on the phenomenon that when an ultrasonic wave is reflected from adjacent reflecting bodies in a medium (e.g. living tissue) superposed reflected waveforms are received and a characteristic waving or oscillatory phenomenon called scalloping appears on the power spectrum of a received signal. In an embodiment of this invention a degree of superposition (intervals between reflecting bodies) is estimated from the intervals between peaks and troughs of the power spectrum of the received signal. The degree of superposition may also be estimated by calculating a self-correlation in relating to a received signal in which such superposition effects appear. Also a power cepstrum may be used.
- Reference is made, by way of example, to the accompanying drawings, in which:
- Fig.l is a schematic diagram for assistance in explanation of ultrasonic wave reflection in a medium, for assistance in the explanation of ultrasonic characterisation on the basis of attenuation characteristics,
- Fig.2A is a schematic diagram of ultrasonic wave reflection in a medium, for assistance in explanation of the present invention,
- Figs.2B to 2D are respective graphs for assistance in explaining the form of power spectrum of a received signal that has been subject to ultrasonic wave reflection as illustrated in Fig.2A,
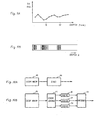
- Fig.3 is a graph illustrating the power spectrum of a received signal that has been subject to ultrasonic wave reflection in a medium containing many fine reflecting bodies,
- Fig.4 is a schematic block diagram of apparatus in accordance with an embodiment of the present invention,
- Fig.5 is a graph illustrating the cepstrum corresponding to the power spectrum of Fig.3,
- Fig.6 is a schematic block diagram of apparatus in accordance with another embodiment of the present invention,
- Fig.7 is a waveform diagram of a received signal, for assistance in explanation of another embodiment of the present invention, using a "sliding window"
- Fig.8 is a schematic block diagram of apparatus in accordance with another embodiment of the present invention, for obtaining a uni-dimensional distributiion of medium characterising parameters along an ultrasonic scanning line,
- Figs.9A and 9B are respective schematic diagrams illustrating examples of forms of displays which can be provided with the apparatus of Fig.8,
- Figs.lOA and 10B are schematic block diagrams of respective examples of arrangements which can be employed for providing a display as illustrated in Fig.9B, and
- Fig.ll is a schematic block diagram of apparatus in accordance with another embodiment of the present invention, for obtaining a two or three dimensional distribution of medium characterising parameters.
- First a principle employed in the present invention will be described, then embodiments of the invention will be described, with reference to the drawings.
- In general, as shown in Fig.2A, when an incoming wave (incident wave) f(t) is reflected by consecutive reflecting surfaces 101,102, a receiving signal r(t) corresponding to the superimp;osition of a wave g(t) reflected from the
surface 101 and a wave g(t-τ) reflected from thesurface 102 can be obtained. (Attenuation by transmission is neglected here). Thus
reflecting surfaces - Equation (2) can be modified by Fourier transformation.

- Where, R(f) is the Fourier transformation of r(t) and G(f) is the Fourier transformation of g(t).
- Accordingly, the power spectrum of the receiving signal can be expressed as follows:-
- |R(f)|2 = |G(f)|2(2 + 2 cos2πft) .......... (4)
- This corresponds to a power spectrum |G(f)|2 as shown in Fig.2B with distortion, corresponding to the
factor 2 + 2 cos2π fτ in equation (4), as shown in Fig.2C and the result is that the power spectrum of the receiving signal is subject to a waving phenomenon or oscillatory effect, as shown in Fig.2D. This waving phenomenon or oscillatory effect is called scalloping. In this case, a period Δf of the oscillations of the oscillatory effect is expressed as,
- Actual living tissue, for example, does not have a simple double-layer reflecting structure as described above; many fine reflecting bodies having different reflection coefficients are arranged with a variety of . different spacings between the bodies, and a power spectrum as shown in Fig.3 can be observed. An average period of oscillations in the spectrum almost corresponds to the average interval of reflecting bodies in the tissue. That is, oscillation periods Δf1 to Δfn can be seen in the spectrum of Fig.3, and the average

Δf of the waving phenomenon or oscillatory effect and an effective diagnostic method can be provided in respect of a region where the effects of disease cause a difference or change in the average interval (spacing) of reflecting bodies. Such a diagnostic method is effective for diagnosis relating to a region such as the myocardium and a disease such as myocardial infarction. The myocardium generally has almost homogeneous muscle layering. In its normal condition, an average interval d of reflecting bodies appears very small and since in this case an average valueΔf of the scalloping period is very large, the waving phenomenon or oscillatory effect is not very pronounced in the power spectrum of a receiving signal. However, if myocardial infarction occurs, the tissue becomes fibrous and moreover since the intervals (spacings) of fibers have a certain size, the waving phenomenon or oscillatory effect becomes manifest or distinctive in the spectrum. The degree of myocardial infarction can be estimated by determining the interval bf of the waving phenomenon or oscillatory effect. - The intervals Afi appearing due to the waving phenomenon or oscillatory effect in the spectrum actually differ slightly from each other. Either average values of such intervals or values representing the degree of variation or fluctuation of the sizes of the intervals can be used in accordance with embodiments of the present invention for medium (tissue) characterisation (and diagnosis). For example, frequencies corresponding to peaks and valleys in the shape of the spectrum are detected, differencesAfi between these frequencies are obtained and moreover an average of these differences Δfi is obtained. However, these calculations are comparatively troublesome and each peak of spectrum is not always single. Namely, each peak may itself suffer waving or oscillations and it is therefore difficult in some cases to accurately determine the position (frequency) of the peak.
- Embodiments of the present invention provide for the use of the cepstrum, and for the use of self-correlation, for accurately and easily obtaining
Δf . - A cepstrum is obtained when a spectrum is logarithmically compressed and then transformed by Fourier transformation. Since the cepstrum is a known concept, detailed explanation thereof will be omitted. For details, refer to A.V. Oppenheim, R.W. Schafer, "Digital Signal Processing", pp500 to 507, Prentice-Hall, 1975.
- Fig.4 is a schematic block diagram of apparatus in accordance with an embodiment of the present invention using a cepstrum. In response to a driving signal sent from a
transmitter 1, avibration unit 2 sends an ultrasonic wave into a medium (living tissue) to be observed. Reflected waves are received again by thevibration unit 2 and amplified by areceiver 3 and thereafter sent to an analog-to-digital converter (hereinafter referred to as an AD converter). It is a matter of course that so-called TGC (Time Gain Control) amplification, logarithmic amplification or AGC (Auto-Gain Control) amplification may be employed for the amplification process. An output ofAD converter 4 is, for example, stored in amemory 6, only in respect of a period designated by an output of a gatetiming generating circuit 5 which turns ON only when a reflected wave is being received from a region of interest in the medium, for example the wall of the heart. In this case, the AD converter must naturally be operated with a frequency (for example, 3.5 MHz x 4 = 14 MHz or more) which is sufficiently higher than the ultrasonic wave frequency (for example, 3.5 MHz) used. The content ofmemory 6 is sent to aFourier transformation circuit 7 for calculation of a power spectrum. The Fourier transformation circuit 7 (andFourier transformation circuit 9 referred to below) can be realized, for example, by an LSI for signal processing comprising a multiplier, accumulator, data memory and a control memory, etc. An output ofFourier transformation circuit 7 is sent again to anotherFourier transformation circuit 9 through a logarithmic converter 8 and thereby a power cepstrum |C(t)|2 can be obtained as an output ofcircuit 9. Fig.5 shows a power cepstrum |C(t)|2 corresponding to power spectrum of Fig.3. Apeak detector 10 obtains a quefrency t0 which corresponds almost (approximately) to a peak value (other than the origin) of the power cepstrum. to is shown for the cepstrum of Fig.5. Since |C(t)|2 is obtained by Fourier transformation of the logarithms of |G(f)|2, to is almost (approximately or substantially) equal to an inverse of an average periodΔf of scalloping of the power spectrum shown in Fig.3. - In the calculating circuit 11, an average value of the scalloping interval (the period of oscillations of the power spectrum), which is employed as a medium (e.g. tissue) characterising parameter, can be obtained from the equation indicated below.

- It is also possible to obtain

- The spread of the cepstrum around the peak value, as indicated by Δt of Fig.5, corresponds to fluctuation of the frequency intervals Δfi (i = 1 to n, see Fig.3) of the scalloping of the power spectrum of Fig.3. Accordingly, the fluctuation of Δfi can be estimated by obtaining the dispersion of the cepstrum around t0 in a range (to - T, t0 + T, where T is predetermined constant) of time duration predetermined around t0, namely the secondary moment

- Moreover, an nth order moment (n = 1, 2, 3, ...) can also be used as a characterising parameter.
- The calculation circuit 11 of Fig.4 performs calculation of such a moment with the cepstrum which is output from the
Fourier transformation circuit 9 as input. A result obtained by the calculation circuit 11 is sent to adisplay circuit 12 and is finally sent to adisplay 13. - The logarithmic converter 8 of Fig.4 can be provided as a code converter using ROM (Read Only Memory), whilst the
peak detector 10 can be provided as an LSI for signal processing as in the case of theFourier transformers - The value t0 in Fig.5 indicates almost (approximately or substantially) an average value of the intervals between reflecting bodies in the medium observed and therefore if a self-correlation function of a receiving signal is obtained, a peak of the self-correlation must appear when a time deviation τ is equal almost (approximately or substantially) to t0,
- Fig.6 illustrates apparatus in accordance with another embodiment of the present invention in which self-correlation is employed. In Fig.6,
items 1 to 6, 12 and 13, correspond generally to items given similar reference signs in Fig.4. - In the apparatus of Fig.6, a receiving signal f(t) corresponding to a selected region to be observed is stored in the
memory 6 and a self-correlation as expressed by the following equation is obtained at asignal processing circuit 14 in respect of such memory content:
signal processing circuit 14 to be prepared for obtaining a self-correlation and also for obtaining a time deviation (τ) which gives the first peak value except for the origin. - Regarding display of results obtained, t0,
Δf , m2 τ0 may be displayed as numerals (in units of sec, MHz, etc). Such a display can easily be realized by providing a character pattern generating function in thedisplay control circuit 12 of Fig.4 or Fig.6. - Furthermore, distributions of t0,
Δf , m2. τ0 along an ultrasonic scanning line can also be obtained. As illustrated in Fig.7, this can be achieved using a so-called sliding window method in which portions of receiving signals r(t), sequentially delayed, like I1, I2, I3, ... in Fig.7, with a small delay time ΔI and the transmission time is divided into the superimposing time sections. When values of parameters such as t0,Δf , m2 τ0 obtained as described above using signals corresponding to each time section are displayed on the assumption that these values relate to the center of each section, a parameter distribution along an ultrasonic scanning line can thus be obtained. - When using such a method, not only the reflected wave data of one processing section (e.g.Il or I2 etc) but all data relating to a scanning line is first stored in the memory (e.g. memory 6) and thereafter toi,
Δf i, m2i' τ0i(i -1, 2, 3, ...) are obtained in respect only of signals pertaining to the required time sections Ii (i = 1, 2, 3, ....) and the obtained results are sent to a memory for display. - Constitution of an apparatus in accordance with an embodiment of the present invention in which distribution over a scanning line is obtained is shown in Fig.8. This embodiment is different from that of Fig.6 in that the gate
timing generating circuit 5 of Fig.6, which picks out which particular time section of receiving signals for storage inmemory 6, is eliminated and the receiving signals are all stored for each time section of interest. - Regarding the display of distributions of t0,
Δf , m2 and to, these can be displayed in graphical form with a diagnostic distance (depth from the surface of the medium (e.g. body) observed) plotted on one axis of a rectangular coordinate plot as shown in Fig.9A and values of a parameter (to,bf, etc) obtained by signal processing plotted on the other axis. Changes in value of a parameter in dependence upon the diagnostic distance can easily be recognised with such a display method. To provide such a display with an embodiment similar to that of Fig.8 it is necessary to provide a so-called frame memory for bit mapping thedisplay 12 of Fig.8 in order to store a graphic pattern as shown in Fig.9. - As shown in Fig.9B, it is also possible that distribution of parameters on an ultrasonic wave scanning line can be displayed by assigning corresponding brightnesses or colors to parameter values obtained by signal processing. To provide such a display with an embodiment similar to that of Fig.8, a circuit for brightness modulation or colour modulation is required in the
display control circuit 12. - In the case of brightness modulation, as shown in Fig.lOA a digital-to-analog converter (hereinafter referred to as a DA converter) 16 for generating a voltage of an amplitude corresponding to a parameter value is provided after a
display data memory 15 which stores parameter values obtained by the signal processing circuit, and thereby such voltage is sent as an image signal to thedisplay 13. - In the case of displaying parameter values with colors, as shown in Fig.lOB a
code converting circuit 17 for the primaries (primary colours) of a colour display (usually, a color television receiver), which is required for expressing the colors assigned to values of parameters, is provided after adata memory 15 for display. DAconverters 18 to 20 for converting outputs ofcode converting circuit 17 relating to each primary colour are provided after suchcode converting circuit 17 and moreover, if the display requires, acolor encoder 21 is provided for generating a composite color signal in correspondence to the output voltages of each DA converter in order to send a signal to thecolor display 13 of Fig.6 or 8. A synchronization signal is naturally necessary for display on the TV. - Provision of distribution of parameters such as t 0,
Δf , m 2, τ0 obtained on a single-dimensional ultrasonic scanning line is described above, but a two-or three-dimensional distribution can also be provided. - Fig.ll illustrates an embodiment of the present invention for providing such distribution. In Fig.11, component elements corresponding to elements in Fig.8 (or Fig.6) are given the same reference signs. Fig.ll shows an embodiment which is a so-called electronic scanning ultrasonic diagnosis apparatus. In Fig.11, 25 is a probe for electronic scanning consisting of an arrangement of vibration units 241,242,...., 24K and vibration unit selection switches 231, 232,....,23K. 22 is a scanning control circuit which causes the ultrasonic wave beam to be scanned in a direction through the arrangement by turning the
switches display 12 by a method described above, for each change of position of ultrasonic wave beam with the control of scanning control circuit. A two dimensional display of a parameter (e.g. t0,Δf , etc) is obtained by writing parameter values into a frame memory of thedisplay 12 in locations corresponding to the scanning lines, and positions along each scanning lines, to which the values refer. - Such a frame memory may be provided in place of the data memory for display in Fig.10A or 10B in order to store two-dimensional parameter data. Although omitted from the above explanation, a beam focusing means such as a dynamic focussing can, of course, be executed for the control of ultrasonic wave beam.
- The above explanation concerns electronic scanning but, of course, a mechanical scanning system can be adopted. Two-dimensional distributions of parameters can be obtained as described above, but three-dimensional distributions of parameters can further be obtained by moving the
probe 25 in a direction at a right angle to the arrangement of vibration units (e.g. by moving theprobe 25 transversely of a line along which the vibration units are arranged one after another in turn). The pitch of movement of the probe is controlled or measured. Two-dimensional distributions of parameters are stored in different frame memories for each movement - for each position of the probe at which ultrasonic wave beams are sent out by the vibration units - (or in different blocks formed by dividing one frame memory into a plurality of blocks),and a result is displayed in line on the same screen. - The waveform and spectrum, etc, of a reflected ultrasonic wave can be altered greatly but only a small difference in the structure of the reflecting medium (tissues). Therefore, it is often required, for obtaining stable data (parameter values), to obtain an average data value corresponding to a range of several millimeters square, even if space resolution is a little degraded. In cases where average data values are obtained embodiments of the present invention with constitutions as illustrated in Figs. 6 and 8 to 11 can be used: it is required only to modify the programming of the signal processing circuit 14 (and scanning control circuit 22).
- As indicated above, with embodiments of this invention, discrimination in relation to thin tissue regions can be realized more accurately than previously by using the frequency intervals appearing in spectrum scalloping, which indicate "roughness" of the structure of the tissue region, or by using the inverse of such frequency intervals, in place of an attenuation characteristic. In other words, measurement with high resolution can be realised in the depth direction of a medium (body) to be observed.
- The present invention provides an ultrasonic diagnosis apparatus which makes diagnosis by transmitting the ultrasonic wave to the region to be observed and by receiving and processing the reflected ultrasonic wave, comprising;
- a) a means for extracting the signal in the particular time section of the receiving signal, and
- b) a means for obtaining an average value of mutual intervals of small reflecting bodies dispersely distributed in the region to be observed from said extracted signal.
- The present invention provides an ultrasonic diagnosis apparatus which makes diagnosis by transmitting the ultrasonic wave to the region to be observed and by receiving and processing the reflected ultrasonic wave, comprising;
- a) a means for extracting the signal in the particular time section of the receiving signal,
- b) a means for obtaining a power spectrum of said extracted signal,
- c) a means for obtaining average value of intervals of scalloping of said power spectrum or inverse numbers of them, and
- d) a means for displaying average value of intervals of said detected scalloping or inverse numbers of them.
- In such apparatus the means for obtaining average value of interval of above scalloping or inverse number of it may be capable of obtaining a cepstrum of obtained power spectrum and also capable of obtaining an inverse number l/to of Quefrency which gives almost the peak value except for the origin, or the Quefrency to which gives almost the peak value.
- The present invention provides an ultrasonic diagnosis apparatus which makes diagnosis by transmitting the ultrasonic wave to the region to be observed and by receiving and processing the reflected wave wherein comprising;
- a) a means for extracting the signals in the particular time section of the receiving signal,
- b) a means for obtaining a self-correlation of said extracted signal,
- c) a means for obtaining time deviation τi (i = 1, 2, 3,....) of said self-correlation which gives almost the peak value exept for the origin, and
- d) a means for displaying said detected time deviation τ i.
Claims (10)
Applications Claiming Priority (2)
| Application Number | Priority Date | Filing Date | Title |
|---|---|---|---|
| JP225666/83 | 1983-11-30 | ||
| JP58225666A JPS60116345A (en) | 1983-11-30 | 1983-11-30 | Ultrasonic diagnostic apparatus |
Publications (3)
| Publication Number | Publication Date |
|---|---|
| EP0143664A2 true EP0143664A2 (en) | 1985-06-05 |
| EP0143664A3 EP0143664A3 (en) | 1986-02-19 |
| EP0143664B1 EP0143664B1 (en) | 1990-06-13 |
Family
ID=16832873
Family Applications (1)
| Application Number | Title | Priority Date | Filing Date |
|---|---|---|---|
| EP84308285A Expired EP0143664B1 (en) | 1983-11-30 | 1984-11-29 | Ultrasonic characterisation of a medium |
Country Status (4)
| Country | Link |
|---|---|
| US (1) | US4655228A (en) |
| EP (1) | EP0143664B1 (en) |
| JP (1) | JPS60116345A (en) |
| DE (1) | DE3482497D1 (en) |
Cited By (3)
| Publication number | Priority date | Publication date | Assignee | Title |
|---|---|---|---|---|
| EP0288115A1 (en) * | 1987-04-21 | 1988-10-26 | Laboratoires D'electronique Philips | Method and apparatus for the examination of media by ultrasonic echography |
| EP0327645A1 (en) * | 1986-09-27 | 1989-08-16 | Hitachi Construction Machinery Co., Ltd. | Apparatus for measuring intracranial pressure |
| EP0413816A1 (en) * | 1986-09-27 | 1991-02-27 | Hitachi Construction Machinery Co., Ltd. | Method for recording intracranial pressure |
Families Citing this family (21)
| Publication number | Priority date | Publication date | Assignee | Title |
|---|---|---|---|---|
| US4884247A (en) * | 1987-03-09 | 1989-11-28 | Mobil Oil Company | Method of processing geophysical data to compensate for earth filter attenuation |
| EP0299906A3 (en) * | 1987-07-16 | 1990-06-13 | The University Of Melbourne | In-vivo bone quality measurement |
| US4855911A (en) * | 1987-11-16 | 1989-08-08 | Massachusetts Institute Of Technology | Ultrasonic tissue characterization |
| JPH0640096B2 (en) * | 1989-05-22 | 1994-05-25 | 工業技術院長 | Method and apparatus for measuring spatial distribution of minute scatterers |
| IL91929A (en) * | 1989-10-08 | 1995-03-30 | Irt Inspection Res & Tech | Apparatus and method for the acquisition and processing of data for analyzing flaws in material |
| JPH04188058A (en) * | 1990-11-21 | 1992-07-06 | Olympus Optical Co Ltd | Ultrasonic-wave flaw detecting apparatus |
| JPH05176926A (en) * | 1991-12-27 | 1993-07-20 | Shimadzu Corp | Ultrasonic diagnostic system |
| FR2752461B1 (en) * | 1996-08-14 | 1998-11-06 | Dory Jacques | METHOD AND DEVICE FOR THE PROCESSING OF REPRESENTATIVE SIGNALS OF WAVES REFLECTED OR TRANSMITTED BY A VOLUME STRUCTURE WITH A VIEW TO PERFORMING AN EXPLORATION AND ANALYSIS OF THE STRUCTURE |
| AU1454699A (en) | 1997-11-14 | 1999-06-07 | Colorado Seminary | Ultrasonic system for grading meat |
| US6333986B1 (en) | 1998-05-08 | 2001-12-25 | Lockheed Martin Corporation | Cepstral method and system for detecting/classifying objects from air-based or space-based images |
| IT1306874B1 (en) * | 1999-06-25 | 2001-10-11 | Consiglio Nazionale Ricerche | NON-INVASIVE ACOUSTIC METHOD FOR THE DETECTION AND MAPPING OF THE POST-PAINTINGS IN FRESCO PAINTINGS AND WALL PAINTS IN GENERAL, AND |
| US6427536B1 (en) | 1999-12-13 | 2002-08-06 | International Business Machines Corporation | Method and system for measuring anisotropic material properties |
| US6785570B2 (en) * | 2000-12-22 | 2004-08-31 | Md Medical Diagnostics Inc. | System and method for analysis of a tissue |
| US20040039273A1 (en) * | 2002-02-22 | 2004-02-26 | Terry Alvin Mark | Cepstral domain pulse oximetry |
| EP1485015A1 (en) * | 2002-02-22 | 2004-12-15 | Datex-Ohmeda, Inc. | Cepstral domain pulse oximetry |
| US6943724B1 (en) | 2002-10-30 | 2005-09-13 | Lockheed Martin Corporation | Identification and tracking of moving objects in detected synthetic aperture imagery |
| US6864828B1 (en) | 2003-02-18 | 2005-03-08 | Lockheed Martin Corporation | Method and apparatus for collection and processing of interferometric synthetic aperture radar data |
| US20070043290A1 (en) * | 2005-08-03 | 2007-02-22 | Goepp Julius G | Method and apparatus for the detection of a bone fracture |
| US8259830B1 (en) | 2009-10-14 | 2012-09-04 | Google Inc. | Simultaneous use of multiple radio frequency channels |
| US8923364B1 (en) | 2013-03-13 | 2014-12-30 | Google Inc. | Transmitting data over discontiguous portions of radio frequency spectrum |
| US10571390B2 (en) * | 2015-12-21 | 2020-02-25 | The Boeing Company | Composite inspection |
Citations (1)
| Publication number | Priority date | Publication date | Assignee | Title |
|---|---|---|---|---|
| US4052889A (en) * | 1976-06-10 | 1977-10-11 | Adaptronics, Inc. | System for measurement of subsurface fatigue crack size |
Family Cites Families (5)
| Publication number | Priority date | Publication date | Assignee | Title |
|---|---|---|---|---|
| US4154114A (en) * | 1977-12-02 | 1979-05-15 | Sonometrics Systems, Inc. | Biometric measuring device |
| DE2818768C2 (en) * | 1978-04-28 | 1986-07-24 | Hewlett-Packard GmbH, 7030 Böblingen | Method and device for measuring the frequency or the period duration of the fundamental oscillation of an approximately periodic input signal |
| US4453550A (en) * | 1982-04-19 | 1984-06-12 | General Electric Company | Method and means for detecting a periodic wave structure |
| US4441368A (en) * | 1982-04-19 | 1984-04-10 | General Electric Company | Method and means for determining ultrasonic wave attenuation in tissue |
| JPS5919852A (en) * | 1982-07-26 | 1984-02-01 | Fujitsu Ltd | Method for measuring ultasonic characteristic of bio-tissue |
-
1983
- 1983-11-30 JP JP58225666A patent/JPS60116345A/en active Granted
-
1984
- 1984-11-28 US US06/675,869 patent/US4655228A/en not_active Expired - Fee Related
- 1984-11-29 DE DE8484308285T patent/DE3482497D1/en not_active Expired - Fee Related
- 1984-11-29 EP EP84308285A patent/EP0143664B1/en not_active Expired
Patent Citations (1)
| Publication number | Priority date | Publication date | Assignee | Title |
|---|---|---|---|---|
| US4052889A (en) * | 1976-06-10 | 1977-10-11 | Adaptronics, Inc. | System for measurement of subsurface fatigue crack size |
Non-Patent Citations (7)
| Title |
|---|
| 1978 IEEE INTERNATIONAL CONFERENCE ON ACOUSTICS, SPEECH & SIGNAL PROCESSING: RECORD, 10th-12th April 1978, Oklahoma, IEEE, New York, US; R. SHANKAR et al.: "Ultrasonic measurement of defects in metals using cepstral processing" * |
| IEEE TRANSACTIONS ON AUDIO AND ELETROACOUSTICS, vol. AU-16, no. 3, September 1968, pages 437-466, IEEE, New York, US; A.V. OPPENHEIM et al.: "Nonlinear filtering of multiplied and convolved signals" * |
| IEEE TRANSACTIONS ON INFORMATION THEORY, vol. IT-18, no. 6, November 1972, pages 745-759, IEEE, New York, US; R.C. KEMERAIT et al.: "Signal detection and extraction by cepstrum techniques" * |
| IEEE TRANSACTIONS ON SONICS AND ULTRASONICS, vol. SU-23, no. 5, September 1976, pages 329-333, IEEE, New York, US; N.M. BILGUTAY et al.: "Evaluation of a random signal correlation system for ultrasonic flaw detection" * |
| PHYSICS IN MEDICINE AND BIOLOGY, vol. 22, no. 3, 1977, pages 431-443, US; J.C. GORE et al.: "Echo structure in medical ultrasonic pulse-echo scanning" * |
| ULTRASONIC TISSUE CHARACTERIZATIOBN II, special publication, no. 525, 1979, pages 287-295, National Bureau of Standards, Washington, DC, US; J. FRASER et al.: "Cepstral signal processing for tissue signature analysis" * |
| ULTRASONICS, vol. 20, no. 2, February 1982, pages 82-86, Butterworth & Co. Publishers Ltd., Guilford, Surrey, GB; F.G. SOMMER et al.: "Stochastic frequency-domain tissue characterization: application to human spleens 'in vivo'" * |
Cited By (6)
| Publication number | Priority date | Publication date | Assignee | Title |
|---|---|---|---|---|
| EP0327645A1 (en) * | 1986-09-27 | 1989-08-16 | Hitachi Construction Machinery Co., Ltd. | Apparatus for measuring intracranial pressure |
| EP0413816A1 (en) * | 1986-09-27 | 1991-02-27 | Hitachi Construction Machinery Co., Ltd. | Method for recording intracranial pressure |
| EP0327645B1 (en) * | 1986-09-27 | 1994-08-10 | Hitachi Construction Machinery Co., Ltd. | Apparatus for measuring intracranial pressure |
| EP0413816B1 (en) * | 1986-09-27 | 1994-12-07 | Hitachi Construction Machinery Co., Ltd. | Method for recording intracranial pressure |
| EP0288115A1 (en) * | 1987-04-21 | 1988-10-26 | Laboratoires D'electronique Philips | Method and apparatus for the examination of media by ultrasonic echography |
| FR2614450A1 (en) * | 1987-04-21 | 1988-10-28 | Labo Electronique Physique | METHOD AND APPARATUS FOR EXAMINING MEDIA BY ULTRASONIC ULTRASONOGRAPHY |
Also Published As
| Publication number | Publication date |
|---|---|
| JPS60116345A (en) | 1985-06-22 |
| US4655228A (en) | 1987-04-07 |
| DE3482497D1 (en) | 1990-07-19 |
| EP0143664A3 (en) | 1986-02-19 |
| EP0143664B1 (en) | 1990-06-13 |
| JPH0249102B2 (en) | 1990-10-29 |
Similar Documents
| Publication | Publication Date | Title |
|---|---|---|
| EP0143664A2 (en) | Ultrasonic characterisation of a Medium | |
| US4070905A (en) | Ultrasonic beam scanning | |
| US4305296A (en) | Ultrasonic imaging method and apparatus with electronic beam focusing and scanning | |
| EP1194920B1 (en) | Recursive ultrasound imaging | |
| EP0154869B1 (en) | Ultrasonic measurement apparatus | |
| US4771786A (en) | Ultrasonic method and apparatus for tissue characterization and imaging of nonlinear parameter | |
| EP0147955B1 (en) | Ultrasonic non-linear parameter measuring system | |
| CN1196446C (en) | Ultrasonic image coherent filtering method and device | |
| US20070293764A1 (en) | Ultrasonograph | |
| US5817023A (en) | Ultrasound imaging system with dynamic window function generator | |
| US5231573A (en) | Method and system for acquiring flow velocities in ultrasound diagnosis apparatus | |
| JPH09289988A (en) | Method for adjusting speckle of image and method for ultrasonic imaging of object | |
| EP0146073B1 (en) | Ultrasonic diagnosing apparatus | |
| EP0535962A1 (en) | Ultrasonic diagnosing apparatus | |
| US4442713A (en) | Frequency varied ultrasonic imaging array | |
| US20050080329A1 (en) | Ultrasound doppler diagnostic apparatus and image date generating method | |
| EP0035387A2 (en) | Ultrasonic imaging apparatus | |
| US20150141828A1 (en) | Ultrasonic diagnostic apparatus and ultrasonic diagnostic method | |
| US4688428A (en) | Method of and device for scanning objects by means of ultrasound echography | |
| CN104349720B (en) | Ultrasonic signal blood processor and ultrasonic signal processing method | |
| US4099419A (en) | Ultrasonic tomography apparatus | |
| US5476098A (en) | Partially coherent imaging for large-aperture phased arrays | |
| EP0362820B1 (en) | Ultrasonic imaging apparatus | |
| US4676251A (en) | Improved method and device for measuring frequency dependent parameters of objects by means of ultrasound echography | |
| US7481769B2 (en) | Ultrasonic diagnosing apparatus |
Legal Events
| Date | Code | Title | Description |
|---|---|---|---|
| PUAI | Public reference made under article 153(3) epc to a published international application that has entered the european phase |
Free format text: ORIGINAL CODE: 0009012 |
|
| AK | Designated contracting states |
Designated state(s): DE FR GB NL SE |
|
| PUAL | Search report despatched |
Free format text: ORIGINAL CODE: 0009013 |
|
| AK | Designated contracting states |
Designated state(s): DE FR GB NL SE |
|
| 17P | Request for examination filed |
Effective date: 19860806 |
|
| 17Q | First examination report despatched |
Effective date: 19880623 |
|
| GRAA | (expected) grant |
Free format text: ORIGINAL CODE: 0009210 |
|
| AK | Designated contracting states |
Kind code of ref document: B1 Designated state(s): DE FR GB NL SE |
|
| REF | Corresponds to: |
Ref document number: 3482497 Country of ref document: DE Date of ref document: 19900719 |
|
| ET | Fr: translation filed | ||
| PGFP | Annual fee paid to national office [announced via postgrant information from national office to epo] |
Ref country code: GB Payment date: 19901002 Year of fee payment: 7 |
|
| PGFP | Annual fee paid to national office [announced via postgrant information from national office to epo] |
Ref country code: SE Payment date: 19901121 Year of fee payment: 7 |
|
| PGFP | Annual fee paid to national office [announced via postgrant information from national office to epo] |
Ref country code: FR Payment date: 19901129 Year of fee payment: 7 |
|
| PLBE | No opposition filed within time limit |
Free format text: ORIGINAL CODE: 0009261 |
|
| STAA | Information on the status of an ep patent application or granted ep patent |
Free format text: STATUS: NO OPPOSITION FILED WITHIN TIME LIMIT |
|
| 26N | No opposition filed | ||
| PG25 | Lapsed in a contracting state [announced via postgrant information from national office to epo] |
Ref country code: GB Effective date: 19911129 |
|
| PG25 | Lapsed in a contracting state [announced via postgrant information from national office to epo] |
Ref country code: SE Effective date: 19911130 |
|
| GBPC | Gb: european patent ceased through non-payment of renewal fee | ||
| PG25 | Lapsed in a contracting state [announced via postgrant information from national office to epo] |
Ref country code: FR Effective date: 19920731 |
|
| REG | Reference to a national code |
Ref country code: FR Ref legal event code: ST |
|
| PGFP | Annual fee paid to national office [announced via postgrant information from national office to epo] |
Ref country code: NL Payment date: 19921130 Year of fee payment: 9 |
|
| PGFP | Annual fee paid to national office [announced via postgrant information from national office to epo] |
Ref country code: DE Payment date: 19930129 Year of fee payment: 9 |
|
| PG25 | Lapsed in a contracting state [announced via postgrant information from national office to epo] |
Ref country code: NL Effective date: 19940601 |
|
| NLV4 | Nl: lapsed or anulled due to non-payment of the annual fee | ||
| PG25 | Lapsed in a contracting state [announced via postgrant information from national office to epo] |
Ref country code: DE Effective date: 19940802 |
|
| EUG | Se: european patent has lapsed |
Ref document number: 84308285.0 Effective date: 19920604 |