CN1708765A - Display for computer-aided diagnosis of mammograms - Google Patents
Display for computer-aided diagnosis of mammograms Download PDFInfo
- Publication number
- CN1708765A CN1708765A CNA2003801021683A CN200380102168A CN1708765A CN 1708765 A CN1708765 A CN 1708765A CN A2003801021683 A CNA2003801021683 A CN A2003801021683A CN 200380102168 A CN200380102168 A CN 200380102168A CN 1708765 A CN1708765 A CN 1708765A
- Authority
- CN
- China
- Prior art keywords
- display
- diagnostic data
- diagnostic
- image
- malignant tumour
- Prior art date
- Legal status (The legal status is an assumption and is not a legal conclusion. Google has not performed a legal analysis and makes no representation as to the accuracy of the status listed.)
- Pending
Links
Images


Classifications
-
- G—PHYSICS
- G06—COMPUTING; CALCULATING OR COUNTING
- G06T—IMAGE DATA PROCESSING OR GENERATION, IN GENERAL
- G06T7/00—Image analysis
- G06T7/0002—Inspection of images, e.g. flaw detection
- G06T7/0012—Biomedical image inspection
-
- G—PHYSICS
- G06—COMPUTING; CALCULATING OR COUNTING
- G06V—IMAGE OR VIDEO RECOGNITION OR UNDERSTANDING
- G06V10/00—Arrangements for image or video recognition or understanding
- G06V10/98—Detection or correction of errors, e.g. by rescanning the pattern or by human intervention; Evaluation of the quality of the acquired patterns
- G06V10/987—Detection or correction of errors, e.g. by rescanning the pattern or by human intervention; Evaluation of the quality of the acquired patterns with the intervention of an operator
-
- G—PHYSICS
- G06—COMPUTING; CALCULATING OR COUNTING
- G06T—IMAGE DATA PROCESSING OR GENERATION, IN GENERAL
- G06T2207/00—Indexing scheme for image analysis or image enhancement
- G06T2207/30—Subject of image; Context of image processing
- G06T2207/30004—Biomedical image processing
- G06T2207/30068—Mammography; Breast
-
- G—PHYSICS
- G06—COMPUTING; CALCULATING OR COUNTING
- G06V—IMAGE OR VIDEO RECOGNITION OR UNDERSTANDING
- G06V2201/00—Indexing scheme relating to image or video recognition or understanding
- G06V2201/03—Recognition of patterns in medical or anatomical images
Abstract
A method for displaying a computer-generated determination of the likelihood of malignancy in a mammogram lesion. The method requires providing a digitized image of a mammogram, displaying the digitized image, and selecting a region of interest (ROI) directly on the displayed digitized image. The digitized image is then processed so that classifier data of the lesion in the user-selected region of interest are generated and displayed. A system for displaying a determination of the likelihood of malignancy in a mammogram lesion. The system includes a display for presenting a digitized mammogram and an input device in communication with the display for selectably indicating a region of interest on the displayed mammogram. The system also includes a processor for generating classifier data related to a characterization feature within the region of interest. The classifier data is presented on the display.
Description
Invention field
The present invention shows that with a kind of the method and system of assessment/diagnostic message is relevant, is optimum or pernicious in order to the focus on the auxiliary diagnosis fluoroscopic image.
Technical background
Breast cancer is Western society most common tumor disease.According to estimates, 1940, have a people to suffer from breast cancer in 40 American Women, and nineteen ninety-five this ratio rise in per 8 American Women and have a people to suffer from this disease.ACS estimates that there are 183,000 breast cancer new cases nineteen ninety-five.In the U.S., there are every year 46,000 women to die from breast cancer.Today, people generally believe that the best approach of diagnosis early-stage breast cancer is to take a picture by the women more than 40 years old being carried out mammary gland.
Metastatic breast cancer patient's 5 annual survival rates are not 93%.Shift if tumour is local when diagnosis, 5 annual survival rates reduce to 72%.As tumour when diagnosing DISTANT METASTASES IN, then 5 annual survival rates only are 18%.Therefore early diagnosis is most important for breast cancer treatment.Because the focus of analyzing in the image is relatively more difficult, therefore advanced diagnostic tool is very necessary.
The performance of breast cancer on fluoroscopic image is mainly:
1, lump and tubercle pathology
2, calcification point
Whether diagnosis is that the lump feature of malignant tumour comprises: a), lump shape (whether rule); B), lump edge (whether obvious); C) burr (slice that the lump edge stretches out).
Whether diagnosis is that the calcification point feature of malignant tumour comprises: the dysmorphism of size, form, calcification point, calcification point shape (whether being linearity or dendroid), space density (whether troop or sparse) and with the relation of lump.
At present, the radiologist generally uses lamp box in the range estimation mode image to be analyzed, and their analysis has subjectivity to a great extent.Cover film and be used to outstanding detail section.Under many circumstances, the radiologist also adopts aids such as magnifier and intense light source to analyze part very dark in the image.If still can't reach a conclusion according to image, the radiologist also can adopt following method to make film to patient again:
1. take a picture again from different perspectives.
2. carry out macrophotography by the distance that changes breast and film.
3. the breast portion that pathology is arranged is suspected in extruding.
Even if adopted said method, doctor's analysis still mainly is a subjective judgement.
The statistics relevant with traditional perspective method all has been published in scientific literature, but only relates to the population of the U.S..Can infer, these data also are applicable to the population beyond the U.S..
1. mostly count the women of suggestion more than 40 years old of professional institution and should carry out one time fluoroscopic examination every year.
2. the number that need check again is about 20%.What this ratio reflected is to need the further number of patients of inspection, mainly is to carry out fluoroscopic examination again.
3. after carrying out fluoroscopic examination, there is 3% women to be proposed approximately and carries out biopsy.
4. after carrying out fluoroscopic examination, there are 60 people to be diagnosed as approximately in 10,000 cases and suffer from malignant tumour.
5. the negative error rate of fluoroscopic examination is difficult to estimate.Generally believe in finally being diagnosed as the women who suffers from breast cancer, having 15% people in Dec before, to carry out fluoroscopic examination approximately, but do not find the women who suffers from malignant tumour.
6. the positive of fluoroscopic examination (the biopsy result is negative) error rate is about 80%.
In order to help the radiologist to reduce negative error rate in the fluoroscopic examination, people utilize professional software and hardware development to go out computer system.These are commonly called computer-aided diagnosis system and have had a lot of years, and a large amount of relevant reports are arranged.As described below, in patent and the technical literature to said system the use in image analysing computer carried out a large amount of discussion.
To a large amount of image analyses is a difficulty and hard work.According to above-mentioned some reported literatures of mentioning, unacceptable higher negative error rate has appearred.The auxiliary analytic system that uses a computer provides a kind of independently analysis tool for the radiologist, and helps to obtain higher diagnosis of malignant tumor rate, just reduces negative error rate.
Yet well-known, computer assisted analytic system is almost diagnosed out more suspected abnormality than the radiologist who was subjected to training without any exception.The number of suspected abnormality is often too big, thereby can't screen like a cork.Therefore the radiologist not only will analyze the suspected abnormality of finding from image, but also the bigger suspected abnormality of the number of wanting the anacom backup system to find also must be ignored some suspected abnormality simultaneously.If the number of the suspected abnormality that computer-aided diagnosis system is found on display or recognized is bigger, analyze and the work of ignoring these extra focuses may postpone diagnostic procedure.Even adopt usually inadequately in detail and can not embody " level of trust " of trickle difference, numerous error flag ratio that analytic system shows anatomizes indivedual suspected abnormality and more bothers.
Many disclosed patents are discussed area of computer aided fluoroscopic examination and diagnostic system.By consulting United States Patent (USP) the 5729620th (WANG), 5815591 (ROEHRIG etc.), 5828774 (WANG), 5854851 (BAMBERGER etc.), 5970164 (BAMBERGER etc.), 6075879 (ROEHRIG etc.), 6198838 (ROEHRIG etc.), 6266435 (WANG) and 6432262 (WANG), can understand the overview in present technique field.These patents comprise that this instructions fails to mention one by one other lists of references, constitute this instructions
Technical background.
Definition
The following term that this specification and claims are used is defined as follows:
Focus: with suspected abnormality speech alternative each other, two speech are as broad as long.Focus in the image is diagnosed with the feature that defines below usually.
Diagnostic characteristic: whether and focus that be commonly used in diagnosis imaging together typical with malignant tumour is dissection (tissue) feature of malignant tumour.The diagnostic characteristic that is commonly used to diagnosing malignant tumor comprises burr, calcification point, lump or tubercle edge.These diagnostic characteristics are the typicalness feature, can not think that diagnostic characteristic only limits to this.
Parameter: the characteristic of the algorithm relevant (quantification) expression with diagnostic characteristic.These quantized characters are used for determining whether the diagnostic characteristic of a certain focus constitutes pernicious or carcinoid index.The canonical parameter that is used for analyzing the focus diagnostic characteristic comprises:
Burr: burr quantity, symmetry and directional property;
Calcification point: the number and the density of the otherness of mean size, brightness, the area difference opposite sex, the length difference opposite sex, mean distance, contiguous calcification point;
These parameters have typicalness, but unrestriction.The definition of parameter be calculated as on algorithm relevant each other.
The quantization parameter of diagnostic data _ above-mentioned definition or quantize and the assessment total of weight sum of parameters to tumour based on one group.Diagnostic data is the index that suspected abnormality becomes the malignant tumour possibility.The overall evaluation bar chart table that this instructions is described later (other is referring to Fig. 3 A of back) is to a kind of typical case of malignant tumour possibility multianalysis but is not unique method.
Sum of parameters after the quantization weight of overall evaluation of malignancy _ demonstration malignant tumour possibility.Can with phrase speech alternative each other such as " malignant tumour possibility overall evaluation ", " overall evaluation of malignancy ", as broad as long between them.
Summary of the invention
The present invention aims to provide a kind of system and method for video data,, especially is difficult to see or the focus analyzed is diagnosed to the suspected abnormality on the image with the doctor of auxiliary radiation section.
The present invention also aims to provide a kind of system and method, and the diagnostic data that fluoroscopic image is shown helps to reduce negative error rate and positive error rate.
The present invention also aim to provide a kind of radiologist when diagnosis need to the assessment in every possible way of malignant tumour possibility.The diagnosis of malignant tumour is based upon polynary parameter, rather than on the single numerical value of simple sign the " whether ".
The present invention also aims to provide the diagnostic data relevant with fluoroscopic image, with more easily to focus the variation in one period analyze.
Therefore the invention provides a kind of method that shows the focus malignant tumour possibility of finding on the diagnosing and penetrating image of computing machine generation.This method comprises steps such as digitized video that image is provided and display digit image.
The present invention need use an input media, directly to select interesting areas from the digitized video that shows.The position of above-mentioned zone is sent to computer processor.Computer processor is handled digitized image, and the fractional data of focus diagnostic characteristic is quantized in the area-of-interest of user's selection like this.Diagnostic data comprises the weight summation of a plurality of parameters and these parameters, and the latter is exactly the overall evaluation to the malignant tumour possibility that computing machine generates.At last, the present invention need show the relevant diagnostic data of quantification of diagnostic characteristic in the selected area-of-interest.The diagnostic data that shows generally comprises the overall evaluation to the malignant tumour possibility that computing machine generates.
In addition, corresponding with the imbody form of the present invention's tendency, the diagnostic characteristic that diagnostic characteristic is selected for the user.Generally speaking, diagnostic data is presented at the zone that is independent of digitized video on the display.But the diagnostic data following modes that shows shows: the overall evaluation of the summation of quantization parameter, the nominal malignant tumour possibility that shows with the color histogram table usually, with the weight summation of the overall evaluation of numerical value or color histogram or the polynary parameter of representing with both simultaneously, the sign malignant tumour possibility that shows with color histogram and polynary parameter usually.Be generally nonlinear relationship between the quantity of color histogram table and their expressions.
As a kind of example of the present invention, the one or more parameters in the diagnostic data were shown as numerical value in the demonstration stage.Can be in one period, promptly in a series of perspectives process (for example, the period of some months) of taking pictures, retrieve the numerical value of one or more parameters.In every fluoroscopic image, one or more parameters show with assisted diagnosis malignant tumour focus according to the method described above at the numerical value of different times.
As another kind of imbody of the present invention, it provides and shows the digitized image of fluoroscopic image.It requires with computing machine processor processing digitized image, so that all diagnostic characteristic diagnostic datas of digitized image can quantize and store, inquires about for the later stage.The diagnostic data of each diagnostic characteristic includes polynary parameter.An input media is used for directly selecting interesting areas in the digitized image that shows.The position in selected zone is transmitted to computer processor.The quantification diagnostic data relevant with diagnostic characteristic in the selected zone can recover from storage.At last, the quantification diagnostic data that the diagnostic characteristic in the selected zone is relevant is shown.Usually, the diagnostic data of demonstration comprises the overall evaluation of the malignant tumour possibility that computing machine generates, and helps the user to determine the malignant tumour possibility of focus in the fluoroscopic image.
Another example of the present invention provides a kind of system that shows the diagnostic result of focus malignant tumour possibility in the fluoroscopic image that computing machine generates.Native system comprises a setting that generates fluoroscopic image, and an alternative digital converter so that be under the situation of simulation model at former fluoroscopic image, shows the fluoroscopic image that generates with figure pattern, and the display device that shows digital fluoroscopic image.It also comprises an input media that is connected with display, so that indicate interesting areas selectively on the digitized mammogram that shows.In addition, it comprises a processor that is connected with display.Processor by calculate with mode such as classification handle with digitized mammogram in the relevant diagnostic data of focus diagnostic characteristic.The area-of-interest of display digit image and selection on the display.Display also is presented at the relevant quantification diagnostic data of finding in the area-of-interest of user's selection of diagnostic characteristic simultaneously.The diagnostic data that shows generally includes the comprehensive diagnostic to focus malignant tumour possibility that computing machine generates.
Another embodiment of the present invention is to comprise a storage unit.Storage unit is connected with processor with display.The diagnostic data of all diagnostic characteristics on the fluoroscopic image is at first handled by the calculating and the classification of processor, is stored in storage unit then.Afterwards, relevant with diagnostic characteristic in selecteed area-of-interest diagnostic data can and be sent to display from the storage unit retrieval.Storage unit can be understood that the part of processor itself.
Description of drawings
By the detailed description of following drawing to technical specification, can more fully understand the present invention:
Figure 1A and 1B are the sketches of the exemplary system of installation according to the present invention;
Fig. 2 A-2F is the digitized image correlated digital image of the demonstration according to the present invention and the summary diagram of diagnostic data;
Fig. 3 A-3E is example according to the present invention, is used for indicating focus malignant tumour possibility overall evaluation and obtains the diagram of histogram of each parameter of this overall evaluation;
The process flow diagram of Fig. 4 A and two examples of 4B the inventive method.
Each similar parts all is marked with similar numbering among the figure.
Embodiment
The present invention is relevant with the method and system that a kind of display digit fluoroscopic image reaches the information of passing through analysis image auxiliary diagnosis.More particularly, the present invention with a kind of to anatomy focus in the digitizing fluoroscopic image the malignant tumour assessment or that diagnostic data is classified is relevant with computer-aided diagnosis (after this abbreviating " CAD " as) method and system that shows.The diagnostic characteristic of the suspected abnormality in the area-of-interest (ROI) that the user selects is shown on display with the overall evaluation of malignant tumour, the quantification polynary parameter relevant with diagnostic characteristic in addition that shows simultaneously usually.After this polynary parameter of the overall evaluation of malignant tumour and/or quantification all is called diagnostic data.Show, assessment or classification diagnostic characteristic select by the user.
The overall evaluation of the suspected abnormality in the fluoroscopic image indicates with histogram usually, but not necessarily must indicate with histogram.Histogram indicates the weight of the relevant predetermined polynary parameter of the diagnostic characteristic of suspected abnormality among the ROI that selects with the user and sues for peace.
The present invention is not intended to find the focus in the fluoroscopic image.The present invention is intended to: the pernicious or benign character of focus is assessed and is classified among A, the ROI that the user selected with statistical method; The quantized result of B, demonstration assessment.The demonstration of diagnostic data is used for the doctor of auxiliary radiation section especially the focus that is difficult to naked eyes find or assess is diagnosed.
Method and system of the present invention has following advantage:
Generally speaking, formerly technology does not provide enough information to provide suitable auxiliary for radiologist's diagnosis.In the present invention, because the numerical value of the polynary parameter of doubtful anatomy focus is shown, each parameter all has histogram simultaneously, and the diagnostician has the information that more complete sum is detailed and diagnoses.It is pointed out that if do not use a computer system the radiologist is difficult to draw some by calculating the numerical value that just can obtain by intuition or estimation.
1, according to technology formerly, the radiologist directly analyzes the position that computing machine marks in fluoroscopic image.In the present invention, the radiologist determines that he thinks the ROI that contains focus, and wishes that computing machine provides auxiliary at this point.Therefore the radiologist selects a ROI and analyzes the diagnostic data relevant with suspected abnormality, and computing machine not necessarily indicates above-mentioned ROI.Like this, just reduced the number of uncared-for malignant tumour.
2, generally speaking, the focus of the system of technology demonstration formerly is too much, and can not provide enough information to the radiologist, for its analysis provides suitable assisting.Owing to the invention provides the numerical value of the polynary parameter that indicates the focus characteristic of finding and the histogram of each parameter, thereby reduced positive error rate.
3, by observing the numerical value of parameter, the density of calcification point for example, and compare with the numerical value of this parameter on before the fluoroscopic image, just can in one period, possible malignant tumour variation diagnose.The present invention provides an extra diagnostic tool for the radiologist.
Figure 1A has described the system of suspected abnormality diagnostic characteristic in the display digit fluoroscopic image according to example of the present invention.Relevant diagnostic data promptly to the Diagnostic parameters of focus malignant tumour possibility quantification and/or the overall evaluation or the diagnosis of quantification, also is shown simultaneously.System's (being numbered 100 usually) requires a radiography device (110A or 110B) that fluoroscopic image is provided.The radiography device can provide the film system 110A of analog image.Digital converter 114 becomes digitized image 118 with video conversion.The radiography device can select digital image system 110B (will continue afterwards to set forth) that digitized image 118 directly is provided.If use digital image system 110B, carry out digital conversion with regard to not needing digital converter 114.Usually, digitized video converter 114 is high-resolution connection device (CCD) or laser image digital converter, but is not limited to this two kinds of equipment.Digitized image 118 is sent to display 134 and processor 142.Those skilled in the art are appreciated that if after image 118 at first was sent to processor 142, it can be sent to display 134 from processor 142.
Be numbered the input media of 138 user operation,, be connected with display 134 as computer mouse or touch-screen.The user uses input media directly to mark certain zone of breast in the digitized image on display 134---interesting areas (ROI)-and require auxiliary to the diagnosis in this zone.Use input media can delimit the zone of breast suspected abnormality, delimit with closed curve usually.Curve includes, but not limited to circle, polygon or ellipse, and it is a kind of to be generally the back.The information of the ROI position of selecting in digitized video is sent to processor 142 by display 134.Processor 142 is handled the relevant parameter preset of diagnostic characteristic among the ROI of user's selection with the form of quantification and classification, and determines the overall evaluation to malignant tumour.Processor 142 is sent to display 134 with the overall evaluation of malignancy of suspected abnormality and/or each quantization parameter relevant with suspected abnormality.The latter shows related data, so that the user observes.
The diagnostic data that shows on the display is generally, but is not limited to, and column Figure 150 of a colour or colored column Figure 150 add subsidiary parameter information 146 and 147.Column Figure 150 is made up of three colored region usually, a colored region represents one may represent one may be pernicious tumour for optimum tumour, a colored region, and the colored region between optimum and malignant tumour is regional is represented a focus that is difficult to determine.The malignant tumour zone is generally the nonlinear area of amplification, so that more clear, the complete and detailed image of a sign malignant tumour possibility is provided for the user.Position on column Figure 150 next door that computing machine is determined has one to indicate line.
Column Figure 150 represents the overall evaluation of the malignant tumour of suspected abnormality.It also represents the summation of the numerical value of polynary parameter.These parameters are why selected to be because be sure of that there are correlativity in their numerical value and the malignant tumour of breast lesion.Each parameter is adjusted by the database of the fluoroscopic image that the radiologist had checked.Each diagnostic characteristic of breast lesion is as burr, calcification point and lump, all based on different parameter presets.
Satellite information, promptly relevant, and by calculating the information of the overall evaluation of malignancy that color histogram 150 indicates with individual parameter, also can numerical value 146 and/or column Figure 147 form shown.As mentioned above, compare technology formerly, these extraneous informations of demonstration provide more information for the radiologist, make things convenient for it to make diagnosis more accurately.
The displaying contents that this instructions is mentioned is a histogram, yet those skilled in the art are readily appreciated that: also can adopt other similar figures or view form, as histogram, pie chart etc.Equally, the column diagram of this instructions discussion is a kind of of many kinds of column diagrams.
As mentioned above, the user at first uses input media 138 to select ROI, and the diagnostic data among 142 couples of selecteed ROI of processor calculates and handles.Processor is at first handled, is calculated and sort out the diagnostic data of selected ROI, and sends it to display 134.In the example optionally of the present invention of Figure 1B, 160 the system of being numbered handles, calculates and sort out the relevant parameter of all diagnostic characteristics of whole digitized image.These information can be stored in and be independent of processor 142, but coupled storage unit 130.Those skilled in the art are readily appreciated that: storage unit 130 optional apparatus are processor 142 indivisible parts.After selecting ROI, evaluation/classification information relevant with ROI and parameter information are retrieved and are sent to display 134 from storage unit 130.
Another exemplary system of the present invention can be considered the commingled system of the example of Figure 1A and 1B introduction.Storage unit 130 is connected with processor 142.When display 134 was sent to processor 142 with the selection information of user ROI, relevant diagnostic data was retrieved from storage unit 130, and is back to processor 142 according to the instruction of processor 142.At last, the diagnostic data of retrieval can be sent to display 134 from processor 142.
Fig. 2 A-2C and Fig. 2 D-2F are that the typical case who can be used to assess two diagnostic characteristics of breast lesion malignant tumour shows.Typical case's demonstration (Fig. 2 C) of burr in selected ROI154 (Fig. 2 B) that Fig. 2 A-2C is the digitized image (Fig. 2 A) that has burr among the ROI154 who marks with ellipse, system's burr tool image shows and the diagnostic data relevant with burr.It is pointed out that the burr tool image is not an independently instrument, but the morphological analysis of carrying out to be quantified as purpose in the ROI154.The diagnostic data (Fig. 2 C) that shows comprises numerical value 146 and column Figure 147 of several different parameters relevant with burr, and sign is to column Figure 150 of burr focus overall evaluation of malignancy.Generally speaking, diagnostic data is presented at the below or the outside of burr imagery zone, in order to avoid influence the display effect of image.
The amplification that Fig. 2 D-2F is the digitized image (Fig. 2 D) that has one group of calcification point among the ROI152 who marks with ellipse, have the ROI152 of calcification point shows typical case's demonstration (Fig. 2 F) of (Fig. 2 E) and the diagnostic data relevant with calcification point.The diagnostic data (Fig. 2 F) that shows comprise sign to the color histogram 150 of calcification point focus overall evaluation of malignancy, be used for numerical value 146 and column Figure 147 to numerous different parameters of overall evaluation of malignancy.
Overall evaluation of malignancy among Fig. 2 C and the 2F (shown in histogram) is determined by the weight summation to default polynary parameter.CALCULATION OF PARAMETERS is carried out according to the specific algorithm of the processor among Figure 1A and the 1B 142.Each parameter preestablishes according to the statistics correlativity of itself and focus.The degree of and correlativity malignant tumour default according to each parameter draws its weight in total value.
In Fig. 2 C and 2F, each parameter all shows with numerical value 146 and column Figure 147.Each independent column Figure 147 only indicates the malignant tumour possibility based on this parameter.Whether the additional information that this demonstration provides is pernicious or optimum very valuable for the diagnosis focus.With respect to only showing a total value, the overall evaluation that column Figure 150 represents adds that the information of each parameter that numerical value 146 and column Figure 147 provide can guarantee that diagnosis is more accurate.
As mentioned above, numerical value is more convenient for observing the variation of a focus in a period, thereby guarantees that diagnosis is more accurate.Generally speaking, in the time of some months, the patient can do repeatedly fluoroscopic examination.To pernicious or optimum assessment of focus the time, can compare the numerical value in one period of the special parameter of suspected abnormality diagnostic characteristic.
Fig. 3 A-3E is that pernicious overall evaluation column Figure 150 of describing of the above-mentioned Fig. 2 C that mentions and 2F and each parameter column Figure 147 are according to example of the present invention.Column Figure 150 among Fig. 3 A represents the overall evaluation of malignant tumour, and it is made up of 6 colour cell lattice: one for green, one for yellow, four for red.According to the result of the malignant tumour possibility that calculates, a cursor that is used for indicating is arranged below chart.
As mentioned above, carry out weight calculation and summation, draw the total value of malignant tumour possibility according to algorithm parameter.The weight summing value is reflected in the cursor position of column Figure 150.The parameter of calculating the malignant tumour possibility is an algorithmic function, and the weight key element is determined with statistical method, the possibility of reflection malignant tumour.The parameter of each diagnostic characteristic and weight key element are all different.The overall evaluation value is by the original value of parameter that calculate to select, and carries out weight on the basis of and statistics correlativity malignant breast tumor known at it and draw.Numerical value after the weight is sued for peace then.
Overall evaluation cylindricality Figure 150 shown in Fig. 3 A is common, but is not limited to, and is the colored stick of six kinds of colors, and leftmost stick is green, and the second from left is yellow, and four on the right is red.Overall evaluation/the diagnostic value relevant with the weight total value shows with the black line in one of them stick.Black line is turned right more, and the possibility of malignant tumour is big more.The histogram of malignant tumour overall evaluation is non-linear, and is based upon on the basis of distribution function of pernicious and benign tumour diagnostic data.Distribution function is a histogram, indicates the frequency of the malignant tumour of each numerical value of diagnostic data.With respect to technology formerly, the form of expression of the overall evaluation of malignant tumour is more effective, because it provides about malignant tumour possibility Useful Information more for the radiologist.
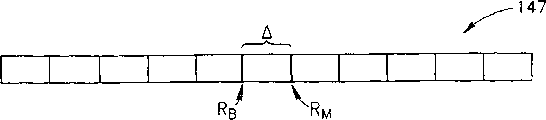
Shown in Fig. 3 B, each parameter is all represented by one 11 horizontal column Figure 147 of stick, shows the lines of two reference points, and one is optimum reference point (Rb), and one is pernicious reference point (Rm).Difference between optimum reference point Rb and the pernicious reference point Rm is appointed as Δ.5 sticks on the optimum reference point Rb left side are represented optimum numerical value, and 5 sticks on pernicious reference point Rm the right are represented pernicious numerical value.Middle stick is represented a value that is difficult to determine.Remove rightmost and leftmost stick, each stick representative equals poor between the numerical value of Δ.The initial value of leftmost stick is optimum reference point Rb, deducts the 4* Δ, and trend is infinitely small.Rightmost stick initial value is pernicious reference point Rm, adds the 4* Δ, and trend is infinitely great.
If actual value is less than low reference point, on behalf of stick such as Fig. 3 C between optimum reference point Rb and the actual value, promptly optimum reference point Rb then be depicted as green.Fig. 3 C result displayed is a focus that " very " is optimum.Similarly, if actual value greater than high reference point, promptly pernicious reference point Rm, then stick such as Fig. 3 D between representative pernicious reference point Rm and actual value is depicted as redness.What Fig. 3 D represented is " appropriateness " pernicious focus.If the malignant tumour possibility of a parameter is determined for being difficult to, promptly be lower than pernicious reference point Rm, and be higher than optimum reference point Rb, then Zhong Jian stick such as Fig. 3 E are depicted as yellow.
Those skilled in the art can appreciate that except that the histogram shown in Fig. 3 A and the 3B, also can adopt other graphical representation methods.Similarly, the color of this instructions Fig. 3 A-3E sign is only as example.Above-mentioned method for expressing is a typical case, does not have restricted.For example, as the variation pattern of color showing method and only as example explanation, redness can be deep to the malignant tumour overall evaluation of representing possibility bigger from representing the light color of the less malignant tumour overall evaluation of possibility, adding gradually.The most important thing is that this method for expressing can mark the quantification diagnostic data, overall evaluation bar chart especially, nuance.The radiologist can notice these difference at an easy rate.
In another example of the present invention, the diagnostic characteristic of the focus of analyzing as burr or calcification point, can mark color, to represent the degree of its malignant tumour on display.The mark color of diagnostic characteristic is identical with the mark color of malignant tumour overall evaluation, and is similar with the histogram shown in Fig. 3 A generally speaking.
Fig. 4 A and 4B have described two examples of the present invention.In Fig. 4 A, system is numbered 300, adopts described digital image system of above-mentioned Figure 1A or perspective film system to obtain fluoroscopic image 310.Mammographic image is a digitized video 314, and is shown.If the digitized video of fluoroscopic image for generating by the described digital image system of above-mentioned Figure 1A then needn't carry out step 314, image can directly show.
The user selects ROI318 in the digitized mammogram that shows, and requires diagnosis auxiliary.Generally, select ROI on display, to indicate, but method is not limited thereto with closed curve.It should be noted that the diagnostician as the user selects ROI, rather than CAD system.Correspondingly, use suspected abnormality number that CAD shows and user's needs to adapt, and can drop into the energy that focus is analyzed with the user and adapt.
Next be step 322.This step comprises the diagnostic characteristic among the ROI that selects of identification user in step 318.Its also comprise calculate all parameter presets relevant with diagnostic characteristic, to single parameter and the malignant tumour correlativity is sorted out and in the overall evaluation of parameter being carried out draw on the basis that weight calculation sues for peace malignant tumour.
For the ROI that selects in the step 318, the overall evaluation of malignant tumour is shown as 326 on display.Select the overall evaluation of malignancy on the basis of diagnostic characteristic among the ROI generally to show the user, but display mode is not limited thereto with histogram.As mentioned above, can adopt other colored display modes.Generally, the additional information relevant with the suspected abnormality diagnostic characteristic shows or shows with two kinds of forms with numerical value or color histogram form, but can select not display additional information.Above-mentioned Fig. 2 C and 2F discuss this demonstration.
Fig. 4 B has described and has been numbered 350 of the present invention another kind of example.Example among this example and Fig. 4 A is closely similar.Yet in second kind of example, step 316 was carried out before selection step 318.Step 316 comprises searches diagnostic characteristic, calculates relevant parameter and calculate the overall evaluation of malignancy of each feature on the basis of correlation parameter.Whole digitized image all needs to operate this step.After this step was finished, the correlation parameter of diagnostic characteristic, each diagnostic characteristic and the overall evaluation of malignant tumour all were stored in the system memory unit 317.Identical with the selection step 318 in Fig. 4 A example, the user selects ROI.Then, the diagnostic characteristic of the suspected abnormality among the ROI of selection and correlation parameter are retrieved 327 from storage unit, and are shown on the display 328.
Those skilled in the art are appreciated that, the invention is not restricted to the above-mentioned special diagram and the description of instructions.Protection scope of the present invention should be determined by following claim.
Claims
(according to the modification of the 19th of treaty)
1, a kind of method that shows that the computing machine generation is diagnosed the malignant tumour possibility in the fluoroscopic image is characterized in that: comprise the steps:
The digitized video and the display digit image of fluoroscopic image are provided;
Adopt input media in digitized video, directly to select ROI;
Use a computer to handle and handle with digitized video, the diagnostic data of the diagnostic characteristic among the ROI that the user is selected quantizes, and diagnostic data comprises polynary parameter;
Show the quantification diagnostic data of diagnostic characteristic among the ROI, the diagnostic data assisted user of demonstration is diagnosed the malignant tumour possibility in the focus.
2, according to a kind of method of claim 1, diagnostic characteristic is selected for the user in the method.
3, according to a kind of method of claim 1, the diagnostic data of Liang Huaing is presented at the display area outside the digitized video on the display in the method.
4, according to a kind of method of claim 1, the diagnostic data that shows in the step display is as the overall evaluation of the malignant tumour possibility of computing machine generation in the method.
5, according to a kind of method of claim 4, the overall evaluation of malignant tumour possibility shows with the color histogram pattern in the method.
6, according to a kind of method of claim 5, the overall evaluation of the malignant tumour possibility represented of cromogram is a nonlinear model in the method.
7, according to a kind of method of claim 1, the diagnostic data that shows in step display in the method is shown as polynary parameter.
8, according to a kind of method of claim 7, polynary in the method parameter is shown with following a kind of pattern at least:
Numerical value;
Cromogram.
9, according to a kind of method of right 1, the step display diagnostic data is shown as two kinds of forms of the overall evaluation of polynary parameter and malignant tumour possibility in the method.
10, according to a kind of method of claim 1, the overall evaluation of the malignant tumour of diagnostic characteristic among the ROI of user's selection and sign shows with color of the same race in the method, and the latter shows with the cromogram pattern.
11, according to a kind of method of claim 1, polynary parameter at the step display diagnostic data has at least one to be shown as numerical value, this numerical value can be retrieved in the fluoroscopic image in one period, thereby assisted user is diagnosed the malignant tumour possibility in the focus.
12, according to a kind of method of claim 1, image at first is sent to processor in the method, and then the display digit image.
13, according to a kind of method of claim 1, digitized video directly is sent to display and is shown in the method.
14, a kind of method that shows that the computing machine generation is diagnosed the malignant tumour possibility in the fluoroscopic image comprises the steps:
The digitized video and the display digit image of fluoroscopic image are provided;
Use a computer to handle digitized video is handled, all diagnostic datas of all diagnostic characteristics in the digitized video are quantized and store, so that later retrieval, each diagnostic data is formed by polynary parameter;
Adopt input media in the digitized video that shows, directly to select ROI;
From storage unit the retrieval with the selection ROI in the relevant quantification diagnostic data of diagnostic characteristic;
Show the relevant quantification diagnostic data of diagnostic characteristic among the ROI that selects, the diagnostic data assisted user of demonstration is diagnosed the malignant tumour possibility of focus.
15, according to a kind of method of claim 14, diagnostic characteristic is selected for the user in the method.
16, according to a kind of method of claim 14, the diagnostic data of Liang Huaing is presented at the display area outside the digitized video on the display in the method.
17, according to a kind of method of claim 14, the searching step in this method is: before diagnostic data was sent to display from processor, the diagnostic data of storage was retrieved from storage unit and passes processor back.
18, according to a kind of method of claim 14, the searching step in this method is: the diagnostic data of retrieve stored and directly be sent to display and show from storage unit.
19, according to a kind of method of claim 14, the diagnostic data of step display demonstration is the overall evaluation of the malignant tumour possibility of computing machine generation in the method.
20, according to a kind of method of claim 19, the overall evaluation of malignant tumour possibility is shown as the cromogram pattern in the method.
21, according to a kind of method of claim 20, the overall evaluation of the malignant tumour possibility represented of cromogram is a nonlinear model in the method.
22, according to a kind of method of claim 14, the diagnostic data that shows in step display in the method is shown as polynary parameter.
23, according to a kind of method of claim 22, polynary in the method parameter is shown with following a kind of pattern at least:
Numerical value;
Cromogram.
24, according to a kind of method of right 14, the step display diagnostic data is shown as two kinds of forms of the overall evaluation of polynary parameter and malignant tumour possibility in the method.
25, according to a kind of method of claim 14, the overall evaluation of the malignant tumour of diagnostic characteristic among the ROI of user's selection and sign shows with color of the same race in the method, and the latter shows with the cromogram pattern.
26, according to a kind of method of claim 14, polynary parameter at the step display diagnostic data has at least one to be shown as numerical value, this numerical value can be retrieved in the fluoroscopic image in one period, thereby assisted user is diagnosed the malignant tumour possibility in the focus.
27, according to a kind of method of claim 14, image at first is sent to processor in the method, and then the display digit image.
28, according to a kind of method of claim 14, digitized video directly is sent to display and is shown in the method.
29, one shows that computing machine generates the system that the malignant tumour possibility is diagnosed in the fluoroscopic image, and this system comprises:
Digitized video generates equipment;
The display of display digit image;
The input media that is connected with aforementioned display device is so that indicate ROI selectively on the digitized video that shows;
To the processor that the relevant diagnostic data of focus diagnostic characteristic in the digitized video quantizes, this processor also is connected with display, and diagnostic data is made up of polynary parameter.
In this system, the ROI of digitized video and selection all is presented on the display, the quantification diagnostic data that diagnostic characteristic is relevant in the ROI that the user selects is presented on the display, and the diagnostic data of demonstration provides the overall evaluation of the focus malignant tumour possibility of computing machine generation.
30, according to a system of claim 29, diagnostic characteristic is selected for the user in this system.
31, according to a system of claim 14, the diagnostic data that quantizes in this system is presented at the display area outside the digitizing scene on the display.
32, according to a system of claim 29, this system comprises a storage unit that is connected with processor with display in addition, stores storage unit into after the at first treated device of the diagnostic data of all quantifications of all diagnostic characteristics in this system in the digitized video is handled.Afterwards, the diagnostic data relevant with diagnostic characteristic among the ROI is retrieved and directly is sent to display.
33, according to a system of claim 32, storage unit is the part of processor.
34, according to a system of claim 29, this system comprises a storage unit that is connected with processor with display in addition, stores storage unit into after the at first treated device of the diagnostic data of all quantifications of all diagnostic characteristics in this system in the digitized video is handled.Afterwards, relevant with diagnostic characteristic among ROI diagnostic data is sent to display by processor retrieval and treated device.
35, according to a system of claim 34, storage unit is the part of processor.
36, according to a system of claim 29, the diagnostic data that shows in this system comprises the overall evaluation of the malignant tumour possibility that computing machine generates.
37, according to a system of claim 29, the diagnostic data that shows in this system shows as polynary parameter.
38, according to a system of claim 29, the diagnostic data that shows in this system is with the overall evaluation of the malignant tumour possibility of polynary parameter and computing machine generation.
39, according to a kind of system of claim 29, digitized mammogram generation equipment comprises that the simulation model fluoroscopic image generates equipment, also comprises the digital conversion equipment that analog image is carried out digital decoding in this system.
40, according to a kind of system of claim 29, the digitized mammogram in this system generates equipment for the digital image system of image digital pattern directly is provided.
Claims (38)
1, a kind of method that shows that the computing machine generation is diagnosed the malignant tumour possibility in the fluoroscopic image is characterized in that: comprise the steps:
The digitized image and the display digit image of fluoroscopic image are provided;
Adopt input media in digitized image, directly to select ROI;
Use a computer to handle and handle with digitized image, the diagnostic data of the diagnostic characteristic among the ROI that the user is selected quantizes, and diagnostic data comprises polynary parameter;
Show the quantification diagnostic data of diagnostic characteristic among the ROI, the diagnostic data assisted user of demonstration is diagnosed the malignant tumour possibility in the focus.
2, according to a kind of method of claim 1, diagnostic characteristic is selected for the user in the method.
3, according to a kind of method of claim 1, the diagnostic data of Liang Huaing is presented at the display area outside the digitized image on the display in the method.
4, according to a kind of method of claim 1, the diagnostic data that shows in the step display is as the overall evaluation of the malignant tumour possibility of computing machine generation in the method.
5, according to a kind of method of claim 4, the overall evaluation of malignant tumour possibility shows with the color histogram pattern in the method.
6, according to a kind of method of claim 5, the overall evaluation of the malignant tumour possibility represented of cromogram is a nonlinear model in the method.
7, according to a kind of method of claim 1, the diagnostic data that shows in step display in the method is shown as polynary parameter.
8, according to a kind of method of claim 7, polynary in the method parameter is shown with following a kind of pattern at least:
Numerical value;
Cromogram.
9, according to a kind of method of right 1, the step display diagnostic data is shown as two kinds of forms of the overall evaluation of polynary parameter and malignant tumour possibility in the method.
10, according to a kind of method of claim 1, the overall evaluation of the malignant tumour of diagnostic characteristic among the ROI of user's selection and sign shows with color of the same race in the method, and the latter shows with the cromogram pattern.
11, according to a kind of method of claim 1, polynary parameter at the step display diagnostic data has at least one to be shown as numerical value, this numerical value can be retrieved in the fluoroscopic image in one period, thereby assisted user is diagnosed the malignant tumour possibility in the focus.
12, according to a kind of method of claim 1, image at first is sent to processor in the method, and then the display digit image.
13, according to a kind of method of claim 1, digitized image directly is sent to display and is shown in the method.
14, a kind of method that shows that the computing machine generation is diagnosed the malignant tumour possibility in the fluoroscopic image comprises the steps:
The digitized image and the display digit image of fluoroscopic image are provided;
Use a computer to handle digitized image is handled, all diagnostic datas of all diagnostic characteristics in the digitized image are quantized and store, so that later retrieval, each diagnostic data is formed by polynary parameter;
Adopt input media in the digitized image that shows, directly to select ROI;
From storage unit the retrieval with the selection ROI in the relevant quantification diagnostic data of diagnostic characteristic;
Show the relevant quantification diagnostic data of diagnostic characteristic among the ROI that selects, the diagnostic data assisted user of demonstration is diagnosed the malignant tumour possibility of focus.
15, according to a kind of method of claim 14, diagnostic characteristic is selected for the user in the method.
16, according to a kind of method of claim 14, the diagnostic data of Liang Huaing is presented at the display area outside the digitized image on the display in the method.
17, according to a kind of method of claim 14, the searching step in this method is: before diagnostic data was sent to display from processor, the diagnostic data of storage was retrieved from storage unit and passes processor back.
18, according to a kind of method of claim 14, the searching step in this method is: the diagnostic data of retrieve stored and directly be sent to display and show from storage unit.
19, according to a kind of method of claim 14, the diagnostic data of step display demonstration is the overall evaluation of the malignant tumour possibility of computing machine generation in the method.
20, according to a kind of method of claim 19, the overall evaluation of malignant tumour possibility is shown as the cromogram pattern in the method.
21, according to a kind of method of claim 20, the overall evaluation of the malignant tumour possibility represented of cromogram is a nonlinear model in the method.
22, according to a kind of method of claim 14, the diagnostic data that shows in step display in the method is shown as polynary parameter.
23, according to a kind of method of claim 22, polynary in the method parameter is shown with following a kind of pattern at least:
Numerical value;
Cromogram.
24, according to a kind of method of right 14, the step display diagnostic data is shown as two kinds of forms of the overall evaluation of polynary parameter and malignant tumour possibility in the method.
25, according to a kind of method of claim 14, the overall evaluation of the malignant tumour of diagnostic characteristic among the ROI of user's selection and sign shows with color of the same race in the method, and the latter shows with the cromogram pattern.
26, according to a kind of method of claim 14, polynary parameter at the step display diagnostic data has at least one to be shown as numerical value, this numerical value can be retrieved in the fluoroscopic image in one period, thereby assisted user is diagnosed the malignant tumour possibility in the focus.
27, according to a kind of method of claim 14, image at first is sent to processor in the method, and then the display digit image.
28, according to a kind of method of claim 14, digitized image directly is sent to display and is shown in the method.
29, one shows that computing machine generates the system that the malignant tumour possibility is diagnosed in the fluoroscopic image, and this system comprises:
Image generates equipment;
Digital decoder optionally, so as when the image that generates to be simulation model with the figure pattern show image;
The display of display digit image;
The input media that is connected with aforementioned display device is so that indicate ROI selectively on the digitized image that shows;
To the processor that the relevant diagnostic data of focus diagnostic characteristic in the digitized image quantizes, this processor also is connected with display, and diagnostic data is made up of polynary parameter.
In this system, the ROI of digitized image and selection all is presented on the display, the quantification diagnostic data that diagnostic characteristic is relevant in the ROI that the user selects is presented on the display, and the diagnostic data of demonstration provides the overall evaluation of the focus malignant tumour possibility of computing machine generation.
30, according to a system of claim 29, diagnostic characteristic is selected for the user in this system.
31, according to a system of claim 14, the diagnostic data that quantizes in this system is presented at the display area outside the digitized image on the display.
32, according to a system of claim 29, this system comprises a storage unit that is connected with processor with display in addition, stores storage unit into after the at first treated device of the diagnostic data of all quantifications of all diagnostic characteristics in this system in the digitized image is handled.Afterwards, the diagnostic data relevant with diagnostic characteristic among the ROI is retrieved and directly is sent to display.
33, according to a system of claim 32, storage unit is the part of processor.
34, according to a system of claim 29, this system comprises a storage unit that is connected with processor with display in addition, stores storage unit into after the at first treated device of the diagnostic data of all quantifications of all diagnostic characteristics in this system in the digitized image is handled.Afterwards, relevant with diagnostic characteristic among ROI diagnostic data is sent to display by processor retrieval and treated device.
35, according to a system of claim 34, storage unit is the part of processor.
36, according to a system of claim 29, the diagnostic data that shows in this system comprises the overall evaluation of the malignant tumour possibility that computing machine generates.
37, according to a system of claim 29, the diagnostic data that shows in this system shows as polynary parameter.
38, according to a system of claim 29, the diagnostic data that shows in this system is with the overall evaluation of the malignant tumour possibility of polynary parameter and computing machine generation.
Applications Claiming Priority (2)
| Application Number | Priority Date | Filing Date | Title |
|---|---|---|---|
| US10/284,213 US7203350B2 (en) | 2002-10-31 | 2002-10-31 | Display for computer-aided diagnosis of mammograms |
| US10/284,213 | 2002-10-31 |
Publications (1)
| Publication Number | Publication Date |
|---|---|
| CN1708765A true CN1708765A (en) | 2005-12-14 |
Family
ID=32174820
Family Applications (1)
| Application Number | Title | Priority Date | Filing Date |
|---|---|---|---|
| CNA2003801021683A Pending CN1708765A (en) | 2002-10-31 | 2003-10-30 | Display for computer-aided diagnosis of mammograms |
Country Status (6)
| Country | Link |
|---|---|
| US (1) | US7203350B2 (en) |
| EP (1) | EP1556827A4 (en) |
| JP (1) | JP2006504464A (en) |
| CN (1) | CN1708765A (en) |
| AU (1) | AU2003276651A1 (en) |
| WO (1) | WO2004040500A1 (en) |
Cited By (1)
| Publication number | Priority date | Publication date | Assignee | Title |
|---|---|---|---|---|
| CN110534182A (en) * | 2019-08-30 | 2019-12-03 | 杭州依图医疗技术有限公司 | Display methods, display equipment and the storage medium of medical image |
Families Citing this family (21)
| Publication number | Priority date | Publication date | Assignee | Title |
|---|---|---|---|---|
| US20050156942A1 (en) * | 2002-11-01 | 2005-07-21 | Jones Peter W.J. | System and method for identifying at least one color for a user |
| GB2398379A (en) * | 2003-02-11 | 2004-08-18 | Qinetiq Ltd | Automated digital image analysis |
| EP1636731A2 (en) * | 2003-06-25 | 2006-03-22 | Siemens Medical Solutions USA, Inc. | Systems and methods for automated diagnosis and decision support for breast imaging |
| US20050089205A1 (en) * | 2003-10-23 | 2005-04-28 | Ajay Kapur | Systems and methods for viewing an abnormality in different kinds of images |
| US20050111721A1 (en) * | 2003-11-25 | 2005-05-26 | Bamberger Philippe N. | Workstation for computerized analysis in mammography and methods for use thereof |
| US7660448B2 (en) | 2003-11-26 | 2010-02-09 | Icad, Inc. | Automated lesion characterization |
| US7460716B2 (en) * | 2004-09-13 | 2008-12-02 | Boston Scientific Scimed, Inc. | Systems and methods for producing a dynamic classified image |
| DE102006018413A1 (en) * | 2006-04-20 | 2007-10-25 | Siemens Ag | MR tomograph with a system for contrast optimization of MRI images |
| US20080031408A1 (en) * | 2006-08-07 | 2008-02-07 | Predrag Sukovic | Quantification of sinus problems in a patient |
| US8150192B2 (en) * | 2006-11-27 | 2012-04-03 | Merge Cad Inc. | System and method for feature score mapping and visualization of medical images |
| US8358820B2 (en) * | 2007-03-12 | 2013-01-22 | Siemens Computer Aided Diagnosis Ltd. | Modifying software to cope with changing machinery |
| US20090046907A1 (en) * | 2007-08-17 | 2009-02-19 | Siemens Medical Solutions Usa, Inc. | Parallel Execution Of All Image Processing Workflow Features |
| US20090276392A1 (en) * | 2008-05-02 | 2009-11-05 | John Yan | Dynamic sequencing display protocols for medical imaging data |
| GB2460857A (en) * | 2008-06-12 | 2009-12-16 | Geoffrey Mark Timothy Cross | Detecting objects of interest in the frames of a video sequence by a distributed human workforce employing a hybrid human/computing arrangement |
| US10013638B2 (en) | 2008-08-14 | 2018-07-03 | Ping Zhang | Cancer diagnostic method and system |
| US8799013B2 (en) * | 2009-11-24 | 2014-08-05 | Penrad Technologies, Inc. | Mammography information system |
| US9183355B2 (en) * | 2009-11-24 | 2015-11-10 | Penrad Technologies, Inc. | Mammography information system |
| US10524741B2 (en) | 2010-03-31 | 2020-01-07 | Koninklijke Philips N.V. | Automated identification of an anatomy part |
| KR20140138501A (en) * | 2013-05-24 | 2014-12-04 | 삼성전자주식회사 | Lesion classification apparatus, and method for modifying a lesion classification data |
| KR102307356B1 (en) | 2014-12-11 | 2021-09-30 | 삼성전자주식회사 | Apparatus and method for computer aided diagnosis |
| AU2019285392A1 (en) * | 2018-06-14 | 2021-01-07 | Kheiron Medical Technologies Ltd | Immediate workup |
Family Cites Families (18)
| Publication number | Priority date | Publication date | Assignee | Title |
|---|---|---|---|---|
| IL106691A (en) * | 1993-08-13 | 1998-02-08 | Sophis View Tech Ltd | System and method for diagnosis of living tissue diseases |
| US6266435B1 (en) | 1993-09-29 | 2001-07-24 | Shih-Ping Wang | Computer-aided diagnosis method and system |
| US6075879A (en) | 1993-09-29 | 2000-06-13 | R2 Technology, Inc. | Method and system for computer-aided lesion detection using information from multiple images |
| US6434262B2 (en) | 1993-09-29 | 2002-08-13 | Shih-Ping Wang | Computer-aided diagnosis system and method |
| US5729620A (en) | 1993-09-29 | 1998-03-17 | Wang; Shih-Ping | Computer-aided diagnosis system and method |
| US20020097902A1 (en) * | 1993-09-29 | 2002-07-25 | Roehrig Jimmy R. | Method and system for the display of regions of interest in medical images |
| CA2132138C (en) | 1993-09-29 | 2004-01-06 | Shih-Ping Wang | Computer-aided diagnosis system and method |
| AU687958B2 (en) * | 1993-11-29 | 1998-03-05 | Arch Development Corporation | Automated method and system for improved computerized detection and classification of masses in mammograms |
| WO1996016534A2 (en) | 1994-11-25 | 1996-06-06 | Sophisview Technologies, Ltd. | System and method for diagnosis of living tissue diseases |
| US5627907A (en) * | 1994-12-01 | 1997-05-06 | University Of Pittsburgh | Computerized detection of masses and microcalcifications in digital mammograms |
| US5815591A (en) | 1996-07-10 | 1998-09-29 | R2 Technology, Inc. | Method and apparatus for fast detection of spiculated lesions in digital mammograms |
| US6198838B1 (en) * | 1996-07-10 | 2001-03-06 | R2 Technology, Inc. | Method and system for detection of suspicious lesions in digital mammograms using a combination of spiculation and density signals |
| US6058322A (en) * | 1997-07-25 | 2000-05-02 | Arch Development Corporation | Methods for improving the accuracy in differential diagnosis on radiologic examinations |
| US5999639A (en) * | 1997-09-04 | 1999-12-07 | Qualia Computing, Inc. | Method and system for automated detection of clustered microcalcifications from digital mammograms |
| US6285992B1 (en) * | 1997-11-25 | 2001-09-04 | Stanley C. Kwasny | Neural network based methods and systems for analyzing complex data |
| US6075878A (en) * | 1997-11-28 | 2000-06-13 | Arch Development Corporation | Method for determining an optimally weighted wavelet transform based on supervised training for detection of microcalcifications in digital mammograms |
| US6282305B1 (en) * | 1998-06-05 | 2001-08-28 | Arch Development Corporation | Method and system for the computerized assessment of breast cancer risk |
| US6470092B1 (en) * | 2000-11-21 | 2002-10-22 | Arch Development Corporation | Process, system and computer readable medium for pulmonary nodule detection using multiple-templates matching |
-
2002
- 2002-10-31 US US10/284,213 patent/US7203350B2/en not_active Expired - Lifetime
-
2003
- 2003-10-30 JP JP2004547946A patent/JP2006504464A/en active Pending
- 2003-10-30 AU AU2003276651A patent/AU2003276651A1/en not_active Abandoned
- 2003-10-30 WO PCT/IL2003/000892 patent/WO2004040500A1/en active Application Filing
- 2003-10-30 EP EP03809827A patent/EP1556827A4/en not_active Withdrawn
- 2003-10-30 CN CNA2003801021683A patent/CN1708765A/en active Pending
Cited By (1)
| Publication number | Priority date | Publication date | Assignee | Title |
|---|---|---|---|---|
| CN110534182A (en) * | 2019-08-30 | 2019-12-03 | 杭州依图医疗技术有限公司 | Display methods, display equipment and the storage medium of medical image |
Also Published As
| Publication number | Publication date |
|---|---|
| WO2004040500B1 (en) | 2004-06-24 |
| WO2004040500A1 (en) | 2004-05-13 |
| US7203350B2 (en) | 2007-04-10 |
| JP2006504464A (en) | 2006-02-09 |
| AU2003276651A1 (en) | 2004-05-25 |
| EP1556827A1 (en) | 2005-07-27 |
| US20040086158A1 (en) | 2004-05-06 |
| EP1556827A4 (en) | 2009-09-09 |
Similar Documents
| Publication | Publication Date | Title |
|---|---|---|
| CN1708765A (en) | Display for computer-aided diagnosis of mammograms | |
| EP2888686B1 (en) | Automatic detection and retrieval of prior annotations relevant for an imaging study for efficient viewing and reporting | |
| US7418119B2 (en) | Display for computer-aided evaluation of medical images and for establishing clinical recommendation therefrom | |
| JP5026939B2 (en) | Image processing apparatus and program thereof | |
| US8233964B2 (en) | System and method for color-coding segmented chest image airways for assessment | |
| Garnavi et al. | Automatic segmentation of dermoscopy images using histogram thresholding on optimal color channels | |
| US7865000B2 (en) | Medical image processing apparatus for analyzing properties of living body based on image data thereof | |
| CN1670769A (en) | Methods and systems for computer aided targeting | |
| JP2004105729A (en) | Analysis of tomographic mammography data supported by computer | |
| JP2003305028A (en) | Method and apparatus for providing mammographic image metrics to clinician | |
| CN112529834A (en) | Spatial distribution of pathological image patterns in 3D image data | |
| JP2004216008A (en) | Image diagnosis support device | |
| EP1782384B1 (en) | System and method for colon wall extraction in the presence of tagged fecal matter or collapsed colon regions | |
| Garnavi et al. | Weighted performance index for objective evaluation of border detection methods in dermoscopy images | |
| Shiri et al. | COLI-NET: Fully Automated COVID-19 Lung and Infection Pneumonia Lesion Detection and Segmentation from Chest CT Images | |
| Santos et al. | Radiomics in bone pathology of the jaws | |
| Kumar et al. | A lightweight asymmetric U-Net framework for acute ischemic stroke lesion segmentation in CT and CTP images | |
| Wiesmüller et al. | Content based mammogram retrieval using gray level aura matrix | |
| Ashafuddula et al. | Melanoma skin cancer and nevus mole classification using intensity value estimation with convolutional neural network | |
| Siddiqi et al. | Classification of abdominal CT images bearing liver tumor using structural similarity index and support vector machine | |
| CN113222009A (en) | Method for estimating nodule aspect ratio based on thyroid ultrasound video | |
| JP4438305B2 (en) | Medical image processing device | |
| US20040028275A1 (en) | Image processing method and apparatus | |
| Zheng et al. | Evaluation of an interactive computer-aided diagnosis (ICAD) system for mammography: A pilot study | |
| Yuchen et al. | Lung cancer diagnosis system based on 3D CNN |
Legal Events
| Date | Code | Title | Description |
|---|---|---|---|
| C06 | Publication | ||
| PB01 | Publication | ||
| C10 | Entry into substantive examination | ||
| SE01 | Entry into force of request for substantive examination | ||
| C12 | Rejection of a patent application after its publication | ||
| RJ01 | Rejection of invention patent application after publication |
Open date: 20051214 |