CN116183929A - Compositions, devices and methods for ulcerative colitis sensitivity testing - Google Patents
Compositions, devices and methods for ulcerative colitis sensitivity testing Download PDFInfo
- Publication number
- CN116183929A CN116183929A CN202211651675.3A CN202211651675A CN116183929A CN 116183929 A CN116183929 A CN 116183929A CN 202211651675 A CN202211651675 A CN 202211651675A CN 116183929 A CN116183929 A CN 116183929A
- Authority
- CN
- China
- Prior art keywords
- value
- corrected
- determined
- food preparations
- less
- Prior art date
- Legal status (The legal status is an assumption and is not a legal conclusion. Google has not performed a legal analysis and makes no representation as to the accuracy of the status listed.)
- Pending
Links
Images


Classifications
-
- G—PHYSICS
- G01—MEASURING; TESTING
- G01N—INVESTIGATING OR ANALYSING MATERIALS BY DETERMINING THEIR CHEMICAL OR PHYSICAL PROPERTIES
- G01N33/00—Investigating or analysing materials by specific methods not covered by groups G01N1/00 - G01N31/00
- G01N33/48—Biological material, e.g. blood, urine; Haemocytometers
- G01N33/50—Chemical analysis of biological material, e.g. blood, urine; Testing involving biospecific ligand binding methods; Immunological testing
- G01N33/68—Chemical analysis of biological material, e.g. blood, urine; Testing involving biospecific ligand binding methods; Immunological testing involving proteins, peptides or amino acids
- G01N33/6854—Immunoglobulins
-
- A—HUMAN NECESSITIES
- A61—MEDICAL OR VETERINARY SCIENCE; HYGIENE
- A61B—DIAGNOSIS; SURGERY; IDENTIFICATION
- A61B5/00—Measuring for diagnostic purposes; Identification of persons
- A61B5/145—Measuring characteristics of blood in vivo, e.g. gas concentration, pH value; Measuring characteristics of body fluids or tissues, e.g. interstitial fluid, cerebral tissue
- A61B5/14507—Measuring characteristics of blood in vivo, e.g. gas concentration, pH value; Measuring characteristics of body fluids or tissues, e.g. interstitial fluid, cerebral tissue specially adapted for measuring characteristics of body fluids other than blood
-
- A—HUMAN NECESSITIES
- A61—MEDICAL OR VETERINARY SCIENCE; HYGIENE
- A61B—DIAGNOSIS; SURGERY; IDENTIFICATION
- A61B5/00—Measuring for diagnostic purposes; Identification of persons
- A61B5/42—Detecting, measuring or recording for evaluating the gastrointestinal, the endocrine or the exocrine systems
- A61B5/4222—Evaluating particular parts, e.g. particular organs
- A61B5/4255—Intestines, colon or appendix
-
- G—PHYSICS
- G01—MEASURING; TESTING
- G01N—INVESTIGATING OR ANALYSING MATERIALS BY DETERMINING THEIR CHEMICAL OR PHYSICAL PROPERTIES
- G01N2800/00—Detection or diagnosis of diseases
- G01N2800/06—Gastro-intestinal diseases
- G01N2800/065—Bowel diseases, e.g. Crohn, ulcerative colitis, IBS
Abstract
Contemplated kits and methods for food sensitivity are based on rational selection of food preparations with established discrimination p-values. Particularly preferred kits include kits having a minimum number of food preparations having an average discrimination p-value of 0.07 or less as determined by their original p-values, or an average discrimination p-value of 0.10 or less as determined by FDR multiply corrected p-values. In further contemplated aspects, the compositions and methods for food sensitivity are further stratified according to gender to further enhance the predictive value.
Description
The present application is a divisional application of patent application with application number 201780026191.0, application date 2017, month 4, day 20, and entitled "composition, device, and method for ulcerative colitis sensitivity test".
RELATED APPLICATIONS
This application claims priority from U.S. provisional patent application serial No. 62/327,932 filed on month 2016, 04, 26, which provisional patent application is incorporated herein by reference in its entirety.
Technical Field
The field of the invention is a sensitive test (sensitivity testing) for food intolerance, and especially when it relates to testing and possibly excludes selected food items (food items) as induced foods (trigger foods) for patients diagnosed or suspected to suffer from ulcerative colitis (Ulcerative Colitis).
Background
This background description contains information that may be used to understand the present invention. The description in this background is not an admission that any of the information provided herein is prior art or relevant to the presently claimed invention, or that a publication specifically or implicitly referenced is prior art.
Food sensitivity, particularly when it is associated with ulcerative colitis, an inflammatory bowel disease, often manifests as diarrhea mixed with blood and mucus and the underlying cause of ulcerative colitis is not well understood in the medical community. Most typically, ulcerative colitis is diagnosed by endoscopic and radiological examination, with blood or electrolyte examination to determine inflammatory conditions. Unfortunately, the treatment of ulcerative colitis is generally less effective and may present new difficulties due to immunosuppressive or regulatory effects. Exclusion of other food item(s) has also been shown to be promising in at least reducing morbidity and/or reducing severity of symptoms. However, ulcerative colitis is very diverse in terms of symptom-inducing dietary items, and standard tests that help identify food-inducing items with a reasonable degree of certainty have not been known, making such patients often subject to trial and error.
Although there are some commercial tests and laboratories to help identify induced foods, the quality of the test results of these laboratories is often poor, as reported by the consumer rights protection organization (e.g., http:// www.which.co.uk/news/2008/08/food-all-test-could-risk-you-health-154711 /). More significantly, problems associated with these tests and laboratories are high false positive rates, high false negative rates, high intra-patient variability, and variability from experiment to experiment, making such tests nearly useless. Similarly, otherwise indeterminate and highly variable test results have been reported elsewhere (Alternative Medicine Review, volume 9, phase 2, 2004: pages 198-207), and the authors concluded that this may be due to food reaction and food sensitivity occurring via a number of different mechanisms. For example, not all ulcerative colitis patients show a positive response to food a and not all ulcerative colitis patients show a negative response to food B. Thus, even if a patient with ulcerative colitis shows a positive response to food a, eliminating food a from the patient's recipe may not alleviate the patient's symptoms of ulcerative colitis. In other words, it has not been sufficiently determined whether food samples employed in currently available tests are properly selected based on a high likelihood of correlating sensitivity to those food samples with ulcerative colitis.
All publications herein are incorporated by reference to the following extent: as if each individual publication or patent application was specifically and individually indicated to be incorporated by reference. If the definition or application of a term in an incorporated reference does not conform to or is contrary to the definition of that term provided herein, then the definition of that term provided herein applies and the definition of that term in the reference does not apply.
Thus, even though various tests for food sensitivity are known in the art, all or nearly all of these tests suffer from one or more deficiencies. Thus, there remains a need for improved compositions, devices and methods for food sensitivity testing, in particular for identifying and possibly excluding induced foods for patients identified or suspected to suffer from ulcerative colitis.
Disclosure of Invention
The subject matter described herein provides systems and methods for testing food intolerance in patients diagnosed with or suspected of suffering from ulcerative colitis. One aspect of the disclosure is a kit (test kit) for testing food intolerance in patients diagnosed with or suspected of suffering from ulcerative colitis. The kit includes a plurality of different food preparations coupled to individually addressable solid phase carriers (solid carriers). The plurality of different food preparations have an average discrimination p-value of 0.07 or less determined from the original p-value or an average discrimination p-value of 0.10 or less determined from the FDR multiply corrected p-values. In some embodiments, the mean discrimination p-value is determined by a process comprising comparing the measured value of a first patient test group diagnosed with ulcerative colitis or suspected to be suffering from ulcerative colitis to the measured value of a second patient test group not diagnosed with ulcerative colitis or not suspected to be suffering from ulcerative colitis.
Another aspect of the embodiments described herein includes a method for testing food intolerance in patients diagnosed with or suspected of suffering from ulcerative colitis. The method comprises the step of contacting the food preparation with a body fluid of a patient diagnosed with or suspected of suffering from ulcerative colitis. Body fluids are associated with gender confirmation. In certain embodiments, the contacting step is performed under conditions that allow IgG from the bodily fluid to bind to at least one component of the food preparation. The method continues with the steps of: igG bound to at least one component of the food preparation is measured to obtain a signal, and the signal is then compared to a reference value for gender stratification of the food preparation using gender confirmation to obtain a result. The method then further comprises the step of updating or generating a report using the result.
Another aspect of the embodiments described herein includes a method of generating a test of food intolerance in patients diagnosed with or suspected of suffering from ulcerative colitis. The method includes the step of obtaining test results for a plurality of different food preparations. The test results are based on body fluids of patients diagnosed with or suspected of suffering from ulcerative colitis and body fluids of a control group not diagnosed with or suspected of suffering from ulcerative colitis. The method further comprises the step of layering the test results according to gender for each different food preparation. Subsequently, the method continues with the steps of: for each different food preparation, a different demarcation value (cutoff value) for male and female patients is assigned to a predetermined percentile ranking.
Other aspects of the embodiments described herein include the use of multiple different food preparations coupled to individually addressable solid supports in diagnosing ulcerative colitis. A plurality of different food preparations are selected based on their average discrimination p-value of 0.07 or less determined from the original p-value, or 0.10 or less determined from the FDR multiply corrected p-value.
Various objects, features, aspects and advantages of the embodiments described herein will become more apparent from the following detailed description of preferred embodiments along with the accompanying drawings in which like numerals represent like parts.
Drawings
Table 1 shows a list of food items from which a food preparation can be prepared.
Table 2 shows statistics of foods ranked according to p-value of double-tailed FDR multiple correction.
Table 3 shows the statistics of ELISA fractions according to food and gender.
Table 4 shows demarcation values for foods for a predetermined percentile ranking.
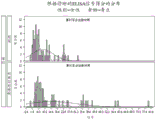
Figure 1A illustrates ELISA signal scores for male ulcerative colitis patients and controls tested with green beans.
Figure 1B illustrates the percentage distribution of male ulcerative colitis subjects tested with green beans exceeding the 90 th percentile and 95 th percentile.
Fig. 1C illustrates the signal distribution of females tested with green beans and the 95 th percentile split determined by the female control population.
Figure 1D illustrates the percentage distribution of female ulcerative colitis subjects tested with green beans exceeding the 90 th percentile and 95 th percentile.
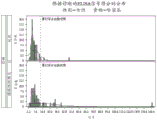
Figure 2A illustrates ELISA signal scores for male ulcerative colitis patients and controls tested with hami melon.
Figure 2B illustrates the percentage distribution of male ulcerative colitis subjects tested with hami melon exceeding the 90 th percentile and 95 th percentile.
Fig. 2C illustrates the signal distribution of females tested with cantaloupe and the 95 th percentile split determined by the female control population.
Figure 2D illustrates the percentage distribution of female ulcerative colitis subjects tested with hami melon exceeding the 90 th percentile and the 95 th percentile.
Figure 3A illustrates ELISA signal scores for male ulcerative colitis patients and controls tested with black white beans.
Figure 3B illustrates the percentage distribution of male ulcerative colitis subjects tested with white black beans exceeding the 90 th percentile and 95 th percentile.
Fig. 3C illustrates the signal distribution of females tested with black and white beans as defined by the 95 th percentile split determined by the female control population.
Figure 3D illustrates the percentage distribution of female ulcerative colitis subjects tested with white black beans exceeding the 90 th percentile and 95 th percentile.
Figure 4A illustrates ELISA signal scores for male ulcerative colitis patients and controls tested with cucumber.
Figure 4B illustrates the percentage distribution of male ulcerative colitis subjects tested with cucumber exceeding the 90 th percentile and 95 th percentile.
Fig. 4C illustrates the signal distribution of females tested with cucumber and the 95 th percentile split determined by the female control population.
Figure 4D illustrates the percentage distribution of female ulcerative colitis subjects tested with cucumber exceeding the 90 th percentile and 95 th percentile.
Fig. 5A illustrates a distribution of the number of foods confirmed to be induced foods according to the 90 th percentile in ulcerative colitis subjects
Fig. 5B illustrates a distribution of the number of foods confirmed to be food-induced according to the 95 th percentile in ulcerative colitis subjects.
Table 5A shows raw data for ulcerative colitis patients and controls with a positive number of results based on the 90 th percentile.
Table 5B shows raw data for ulcerative colitis patients and controls with a positive number of results based on the 95 th percentile.
Table 6A shows statistics summarizing the raw data for the patient population with ulcerative colitis shown in table 5A.
Table 6B shows statistics summarizing the raw data for the patient population with ulcerative colitis shown in table 5B.
Table 7A shows statistics summarizing the raw data of the control population shown in table 5A.
Table 7B shows statistics summarizing the raw data for the control population shown in table 5B.
Table 8A shows statistics from a summary of log transformed raw data from the patient population for ulcerative colitis shown in table 5A.
Table 8B shows statistics from log-transformed raw data summarizing the ulcerative colitis patient population shown in table 5B.
Table 9A shows statistics from log-transformed raw data summarizing the control population shown in table 5A.
Table 9B shows statistics from log transformed raw data summarizing the control population shown in table 5B.
Table 10A shows statistics of independent T-tests comparing geometric mean of positive foods between ulcerative colitis samples and non-ulcerative colitis samples based on the 90 th percentile.
Table 10B shows statistics of independent T-tests comparing geometric mean of positive foods between ulcerative colitis samples and non-ulcerative colitis samples based on 95 th percentile.
Table 11A shows statistics comparing Mann-Whitney test based on geometric mean of positive foods between ulcerative colitis samples and non-ulcerative colitis samples of the 90 th percentile.
Table 11B shows statistics of Mann-Whitney test comparing geometric mean of positive foods between ulcerative colitis samples and non-ulcerative colitis samples based on 95 th percentile.
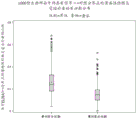
Fig. 6A illustrates box and whisker plots of the data shown in table 5A.
Fig. 6B illustrates a notched box (notched box) diagram and whisker diagram of the data shown in table 5A.
Fig. 6C illustrates box and whisker plots of the data shown in table 5B.
Fig. 6D illustrates a notched box plot and whisker plot of the data shown in table 5B.
Table 12A shows statistics of subject operating characteristic (ROC) curve analysis of the data shown in tables 5A-11A.
Table 12B shows statistics of subject operating characteristic (ROC) curve analysis for the data shown in tables 5B-11B.
Fig. 7A illustrates ROC curves corresponding to the statistics shown in table 12A.
Fig. 7B illustrates ROC curves corresponding to the statistics shown in table 12B.
Table 13A shows statistics of performance indicators predicting ulcerative colitis status in female patients from the number of positive foods based on the 90 th percentile.
Table 13B shows statistics of performance indicators predicting ulcerative colitis status in male patients from the number of positive foods based on the 90 th percentile.
Table 14A shows statistics of performance indicators predicting ulcerative colitis status in female patients from the number of positive foods based on the 95 th percentile.
Table 14B shows statistics of performance indicators predicting ulcerative colitis status in male patients from the number of positive foods based on the 95 th percentile.
Detailed Description
The inventors have found that the food preparation employed in the food test for identifying induced foods of patients diagnosed with or suspected to suffer from ulcerative colitis is not necessarily equally well predictive and/or associated with ulcerative colitis/ulcerative colitis symptoms. Indeed, various experiments have revealed that among a very broad range of food items, some are highly predictive/associated with ulcerative colitis, while others are not statistically significant.
Even more unexpectedly, the inventors found that in addition to the high degree of variation in food items, sex variability in response in the test also plays an important role in determining the relevance of food items to ulcerative colitis. Thus, based on the findings and additional assumptions of the inventors, kits and methods are now provided that have significantly higher predictive capabilities in selecting food items that can be excluded due to the reduction of ulcerative colitis symptoms and symptoms.
The following discussion provides a number of exemplary embodiments. Although each embodiment represents a single combination of certain elements, the concepts described herein are considered to include all possible combinations of the disclosed elements. Thus, if one embodiment includes elements A, B and C and a second embodiment includes elements B and D, then the embodiments described herein are considered to include other remaining combinations of A, B, C or D, even if not explicitly disclosed.
In some embodiments, numbers expressing quantities or ranges used to describe and claim certain embodiments of the invention are to be understood as being modified in some instances by the term "about". Accordingly, in some embodiments, the numerical parameters set forth in the written description and attached claims are approximations that may vary depending upon the desired properties sought to be obtained by the particular embodiment. In some embodiments, numerical parameters should be construed in light of the number of reported significant digits and by applying ordinary rounding techniques. Notwithstanding that the numerical ranges and parameters setting forth the broad scope of certain embodiments of the invention are approximations, the numerical values set forth in the specific examples are reported as precisely as possible. The numerical values set forth in some embodiments of the present invention may contain some error that necessarily results from standard deviation found in their respective test measurements. Unless the context indicates to the contrary, all ranges described herein should be construed to include their endpoints and open ended ranges should be construed to include only commercially viable values. Similarly, all values listed should be considered as including intermediate values unless the context indicates to the contrary.
As used in the specification herein and throughout the claims that follow, the meaning of "a," "an," and "the" includes plural referents unless the context clearly dictates otherwise. Furthermore, as used in the specification herein, unless the context clearly dictates otherwise, the meaning of "within … (in)" includes "within … (in)" and "on … (on)".
All methods described herein can be performed in any suitable order unless otherwise indicated herein or otherwise clearly contradicted by context. The use of any and all examples, or exemplary language (e.g., "such as") provided with respect to certain embodiments herein, is intended merely to better illuminate the invention and does not pose a limitation on the scope of the invention claimed. No language in the specification should be construed as indicating any non-claimed element as essential to the practice of the invention.
The grouping of alternative elements or embodiments of the invention disclosed herein should not be construed as limiting. Each group member may be cited and claimed either alone or in any combination with other members of the group or other elements found herein. For brevity and/or patentability reasons, one or more members of a group may be included in or deleted from the group. When any such inclusion or deletion occurs, the specification is considered to include a modified group so as to satisfy the written description of all markush combinations used in the appended claims.
In one aspect, the inventors therefore contemplate a kit or test panel suitable for testing food intolerance in patients diagnosed with or suspected of suffering from ulcerative colitis. Most preferably, such a kit or plate will comprise a plurality of different food preparations (e.g., untreated or treated extracts, preferably aqueous extracts with optional co-solvents, which may or may not be filtered, etc.) coupled to each individually addressable solid phase support (e.g., in the form of an array or microplate), wherein the different food preparations have an average discrimination p-value of 0.07 or less as determined by the original p-value, or an average discrimination p-value of 0.10 or less as determined by FDR multiply corrected p-values.
In some embodiments, the numbers expressing quantities of ingredients, properties such as concentration, reaction conditions, and so forth used to describe and claim certain embodiments of the present invention are understood as being modified in some instances by the term "about". Accordingly, in some embodiments, the numerical parameters set forth in the written description and attached claims are approximations that may vary depending upon the desired properties sought to be obtained by the particular embodiment. In some embodiments, numerical parameters should be construed in light of the number of reported significant digits and by applying ordinary rounding techniques. Notwithstanding that the numerical ranges and parameters setting forth the broad scope of certain embodiments of the invention are approximations, the numerical values set forth in the specific examples are reported as precisely as possible. The numerical values set forth in some embodiments of the present invention may include certain errors necessarily arising from standard deviation found in their respective test measurements. Moreover, unless the context indicates to the contrary, all ranges described herein should be construed to include their endpoints and open ended ranges should be construed to include only commercially viable values. Similarly, all values listed should be considered as including intermediate values unless the context indicates to the contrary.
Although not limiting to the subject matter of the present invention, the food preparation will generally be derived from foods commonly known or suspected to be symptomatic or symptomatic of inducing ulcerative colitis. Particularly suitable food preparations can be identified by the experimental procedure outlined below. Thus, it should be understood that food items need not be limited to the items described herein, but rather all items may be contemplated and may be identified by the methods provided herein. Thus, exemplary food preparations include at least two, at least four, at least eight, or at least twelve food preparations prepared from foods 1-58 in table 2. Still further particularly contemplated food items and food additives from which food preparations may be prepared are listed in table 1.
Many additional food items can be identified using body fluids from patients diagnosed with or suspected of suffering from ulcerative colitis and body fluids from healthy control individuals (i.e., those not diagnosed with or not suspected of suffering from ulcerative colitis). Preferably, the food item so identified has a high discrimination capability and thus has a p-value determined from the original p-value of 0.15 or less, more preferably 0.10 or less, and most preferably 0.05 or less, and/or has a p-value determined from the p-value of multiple correction of False Discovery Rate (FDR) of 0.10 or less, more preferably 0.08 or less, and most preferably 0.07 or less.
In certain embodiments, the food item so identified will have a high discrimination capability and thus a p-value of 0.15 or 0.10 or even 0.05 or less, as determined by the original p-value, and/or a p-value of 0.10 or 0.08 or even 0.07 or less, as determined by the p-value of multiple corrections of the False Discovery Rate (FDR).
Thus, if the plate has a plurality of food preparations, it is contemplated that a plurality of different food preparations have an average discrimination p value of 0.05 or less determined from the original p value, or an average discrimination p value of 0.08 or less determined from the FDR multiply corrected p value, or even more preferably, an average discrimination p value of 0.025 or less determined from the original p value, or an average discrimination p value of 0.07 or less determined from the FDR multiply corrected p value. In further preferred aspects, it is to be understood that the FDR multiply corrected p-value may be corrected according to at least one of age or gender, and most preferably, according to both age and gender. On the other hand, if the kit or plate is layered for use with a single gender, it is also contemplated that in the kit or plate, at least 50% (and more typically 70% or all) of the plurality of different food preparations have an average discrimination p-value of less than or equal to 0.07 as determined by the original p-value, or an average discrimination p-value of less than or equal to 0.10 as determined by the FDR multiply corrected p-value when corrected for a single gender. Furthermore, it should be understood that other hierarchies (such as dietary preferences, ethnicities, habitat, genetic predispositions, or family history, etc.) are also contemplated and that one of skill in the art (PHOSITA) will be readily aware of the appropriate hierarchy selection.
Recitation of ranges of values herein are merely intended to serve as a shorthand method of referring individually to each separate value falling within the range. Unless otherwise indicated herein, each separate value is incorporated into the specification as if it were individually recited herein. All methods described herein can be performed in any suitable order unless otherwise indicated herein or otherwise clearly contradicted by context. The use of any and all examples, or exemplary language (e.g., "such as") provided with respect to certain embodiments herein, is intended merely to better illuminate the invention and does not pose a limitation on the scope of the invention otherwise claimed. No language in the specification should be construed as indicating any non-claimed element as essential to the practice of the invention.
Of course, it should be noted that the particular format of the kit or plate may vary significantly and contemplated formats include microwell plates, dipsticks, membrane-bound arrays, and the like. Thus, the solid support coupled to the food preparation may comprise wells of a multi-well plate, beads (e.g., color coded or magnetic), an adsorption membrane (e.g., nitrocellulose or microporous/nanoporous polymer membranes, etc.), or an electrical sensor (e.g., a printed copper sensor or microchip).
Accordingly, the inventors also contemplate a method of testing food intolerance in patients diagnosed with or suspected of suffering from ulcerative colitis. More typically, such methods will include the step of contacting the food preparation with a bodily fluid (such as whole blood, plasma, serum, saliva, or fecal suspension) of a patient diagnosed with or suspected of suffering from ulcerative colitis, and wherein the bodily fluid is associated with gender confirmation. As previously described, the contacting step may be performed under conditions that allow IgG (or IgE or IgA or IgM) from the bodily fluid to bind to at least one component of the food preparation, and the IgG bound to the component of the food preparation is then quantified/measured to obtain a signal. In some embodiments, the signal is then compared to a reference value (e.g., a value of at least the 90 th percentile) for gender stratification of the food preparation using gender confirmation to obtain a result, which is then used to update or generate a report (e.g., a written medical report, an oral result report from doctor to patient, a written or oral instruction from doctor based on the result).
In certain embodiments, such methods will not be limited to a single food preparation, but will employ a plurality of different food preparations. As previously mentioned, suitable food preparations may be identified using various methods described below; however, particularly preferred food preparations include foods 1-58 in table 2 and/or the items in table 1. As also noted above, it is generally preferred that at least some or all of the different food preparations have an average discrimination p-value of 0.07 (or 0.05 or 0.025) or less, as determined by the original p-value, and/or an average discrimination p-value of 0.10 (or 0.08 or 0.07) or less, as determined by the FDR multiply corrected p-value.
In certain embodiments, while the food preparation is prepared from a single food item that is an untreated extract, or a coarsely filtered extract, it is contemplated that the food preparation may be prepared from a mixture of multiple food items (e.g., a mixture of citrus including lemon, orange, and grapefruit, a mixture of yeast including baker's yeast and brewer's yeast, a mixture of rice including brown rice and white rice, a mixture of sugar including honey, malt, and sucrose). In some embodiments, it is also contemplated that the food preparation may be prepared from a purified food antigen or a recombinant food antigen.
As is generally preferred, the food preparation is immobilized onto a solid surface (typically in an addressable manner), it is envisaged that the step of measuring IgG or other types of antibodies bound to components of the food preparation is performed via an ELISA test. Exemplary solid surfaces include, but are not limited to, holes in a multi-well plate such that each food preparation can be isolated from an individual microwell. In certain embodiments, the food preparation will be coupled to or immobilized on a solid surface. In other embodiments, the food preparation will be coupled to a molecular tag that allows binding to human immunoglobulins (e.g., igG, etc.) in solution.
From a different perspective, the inventors also contemplate a method of generating a test for food intolerance in patients diagnosed with or suspected to suffer from ulcerative colitis. Since the test is applied to patients who have been diagnosed with or suspected of suffering from ulcerative colitis, the authors do not contemplate that the method has diagnostic purposes. In contrast, the method is used to confirm an induced food item in a patient with established or suspected ulcerative colitis. Such testing will typically include obtaining one or more test results (e.g., ELISA) for a plurality of different food preparations, wherein the test results are based on body fluids (e.g., blood, saliva, fecal suspension) of patients diagnosed with or suspected of having ulcerative colitis and body fluids of a control group not diagnosed with or suspected of having ulcerative colitis. Most preferably, the test results are stratified according to gender for each different food preparation, and for each different food preparation, different demarcation values for male and female patients (e.g., demarcation values for male and female patients having a difference of at least 10% (absolute value)) are assigned to a predetermined percentile ranking (e.g., 90 th percentile or 95 th percentile, etc.).
As noted previously and although not limiting to the inventive subject matter, it is contemplated that the different food preparations include at least two (or six, or ten, or fifteen) food preparations selected from the group consisting of foods 1-58 in table 2 and/or the items in table 1. On the other hand, if a new food item is tested, it will be appreciated that a different food preparation includes food preparations prepared from food items other than foods 1-58 in Table 2. Regardless of the specific choice of food item, however, it is generally preferred that different food preparations will have an average discrimination p-value of 0.07 (or 0.05 or 0.025) or less, or an average discrimination p-value of 0.10 (or 0.08 or 0.07) or less, as determined by FDR multiply corrected p-values. Exemplary aspects and protocols and considerations are provided in the experimental description below.
Thus, it should be appreciated that by having a high confidence test system as described herein, the false positive rate and the false negative rate may be significantly reduced, and especially if the test system and method are gender stratified or corrected for gender differences, as shown below. Accordingly, such advantages have not been recognized and it is expected that the systems and methods provided herein will significantly enhance the predictive capability of food sensitivity tests for patients diagnosed with or suspected of suffering from ulcerative colitis.
Experiment
General protocol for producing food preparations: commercially available food extracts (available from Biomerica inc.,17571Von Karman Ave,Irvine,CA 92614) prepared from edible parts of various fresh foods were used to prepare ELISA plates according to the manufacturer's instructions.
For some food extracts, the inventors expect that food extracts prepared by the specific process of producing the food extract provide superior results than commercially available food extracts in detecting elevated IgG reactivity in ulcerative colitis patients. For example, for cereals and nuts, a three-step process of producing a food extract is preferred. The first step is a degreasing step. In this step, lipids in the grains and nuts are extracted by contacting the powders of the grains and nuts with a nonpolar solvent and collecting the residue. The defatted cereal or nut powder is then extracted by contacting the powder with an elevated pH to obtain a mixture and removing solids from the mixture to obtain a liquid extract. Once the liquid extract is produced, an aqueous formulation is added to stabilize the liquid extract. In a preferred embodiment, the aqueous formulation comprises a sugar alcohol, a metal chelator, a protease inhibitor, a mineral salt and 20-50mM of a buffer component buffered at a pH of 4-9. The formulation allows long-term storage at-70 ℃ and multiple freeze thawing without loss of activity.
For another embodiment, a two-step process of producing a food extract is preferred for meats and fish. The first step is the extraction step. In this step, an extract of raw uncooked meat or fish of autogenous origin is produced by emulsifying the raw uncooked meat or fish in an aqueous buffer formulation in a high impact pressure processor. Next, the solid material is removed to obtain a liquid extract. Once the liquid extract is produced, an aqueous formulation is added to stabilize the liquid extract. In a preferred embodiment, the aqueous formulation comprises a sugar alcohol, a metal chelator, a protease inhibitor, a mineral salt and 20-50mM of a buffer component buffered at a pH of 4-9. The formulation allows long-term storage at-70 ℃ and multiple freeze thawing without loss of activity.
For further embodiments, a two-step process of producing a food extract is preferred for fruits and vegetables. The first step is the extraction step. In this step, an extractor (e.g., juice extractor, etc.) is used to crush the food and extract the juice to produce a liquid extract derived from the fruit or vegetable. Next, the solid material is removed to obtain a liquid extract. Once the liquid extract is produced, an aqueous formulation is added to stabilize the liquid extract. In a preferred embodiment, the aqueous formulation comprises a sugar alcohol, a metal chelator, a protease inhibitor, a mineral salt and 20-50mM of a buffer component buffered at a pH of 4-9. The formulation allows long-term storage at-70 ℃ and multiple freeze thawing without loss of activity.
Blocking of ELISA plates: to optimize signal to noise, the plates will be blocked with proprietary blocking buffers. In a preferred embodiment, the blocking buffer comprises 20-50mM buffer of pH 4-9, animal derived proteins, and short chain alcohols. Other blocking buffers including several commercial preparations that do not meet the aforementioned criteria have also been tried, but fail to provide adequate signal-to-noise and low assay variability required.
ELISA preparation and sample testing: food antigen preparations were fixed to each microassay well according to the manufacturer's instructions. For the assay, food antigens are reacted with antibodies present in the patient's serum and excess serum proteins are removed by a washing step. To detect IgG antibody binding, an enzyme-labeled anti-IgG antibody conjugate is reacted with an antigen-antibody complex. Color is developed by adding a substrate that reacts with the coupled enzyme. The intensity of the color was measured and was proportional to the concentration of IgG antibodies specific for the particular food antigen.
Determination of the order of the ability to differentiate ELISA signals of ulcerative colitis from control subjectsFood of the name Method for object list: from the initial selection (e.g., 100 food items or 150 food items, or even more), some samples may be excluded prior to analysis due to the low consumption of the expected population. Furthermore, a particular food item may be used as a representation of a larger range of co-genus food groups, especially if existing tests have established a correlation between different substances within the co-genus group (most preferably with respect to both sexes, but also applicable to single gender correlations). For example, green peppers may be removed to support red peppers as representative of "pepper" food groups, or sweet potatoes may be removed to support potatoes as representative of "potato" food groups. In a further preferred aspect, the final list of food items is less than 50 food items, and more preferably equal to or less than 40 food items.
A gender-neutral list of foods is required as the final selected foods for the food intolerance panel will not be specific to a particular gender. Since the observed samples will at least initially be gender unbalanced (e.g., control: 40% women, ulcerative colitis: 55% women), differences in ELISA signal amplitude due to gender entirely are eliminated by modeling the signal score for gender using a two-sample t-test and storing the residue for further analysis. For each of those foods tested, a two-sample t-test permutation test (perstraction test) with a relatively high number of resamples (e.g., >1,000, more preferably >10,000, even more preferably >50,000) was used to compare residual signal scores between ulcerative colitis and controls. Satterthwaite (Satterthwaite) approximation is used in the denominator degree of freedom to account for the lack of variance alignment, and the (2-tailed admissified) p-value of the two-tailed arrangement will represent the original p-value for each diet. The error discovery rate (FDR) in the comparison is corrected by any acceptable statistical procedure, such as Benjamini-Hochberg, family error rate (FWER), error rate Per Comparison (PCER), etc.
Food was ranked according to p-value of double tail FDR multiplex correction of food. Foods with corrected p-values equal to or less than the desired FDR threshold are considered to have significantly higher signal scores in ulcerative colitis than in control subjects, and are therefore considered candidates for inclusion in the food intolerance panel. Table 2 provides typical results representative of the results of the statistical procedure. Here, ranking of foods is the p-value according to FDR corrected two-tailed permutation T-test.
Based on early experiments (data not shown herein; see US 62/327932), the inventors contemplate that even for the same food preparation tested, the ELISA scores of at least several food items vary significantly, and exemplary raw data are provided in table 3. Therefore, as will be readily appreciated, if the same demarcation value is applied to the raw data of male and female data, the data that is not stratified according to gender will lose significant interpretation ability. To overcome this drawback, the inventors therefore conceived layering data according to gender as described below.
Statistical method of demarcation point (cutpoint) selection for each food:it may be determined which ELISA signal score will constitute a "positive" response by summing the distribution of signal scores in control subjects. Ulcerative colitis subjects with an observed score greater than or equal to the selected score of the control subject distribution will be considered "positive" for each diet. To reduce the impact of any subject on the determination of the split-point, each food-specific and gender-specific dataset would be resampled 1000 times by self-service (boottrap). In each self-help repeat (bootstrap replicate), the 90 th percentile and 95 th percentile of the control signal scores will be determined. Each ulcerative colitis subject in the self-service sample will be compared to the 90 th percentile and the 95 th percentile to determine if he/she has a "positive" response. The final 90 th and 95 th percentile-based demarcation point for each food and gender was calculated as the average 90 th and 95 th percentiles over the 1000 samples. The number of foods that each ulcerative colitis subject considered "positive" for food was calculated by pooling (pooling) the data of the entire food. In this way, the inventors will now be able to confirm the pre-preparation The demarcation value of the percentile ranking, which is significantly different in most cases, can be seen from table 4.
Fig. 1A-1D show a typical example of sex differences in IgG response in blood relative to green beans, wherein fig. 1A shows the signal distribution of men and 95 th percentile split determined by the male control population. Fig. 1B shows the percentage distribution of male ulcerative colitis subjects exceeding the 90 th percentile and 95 th percentile, while fig. 1C shows the signal distribution of females and the 95 th percentile split determined by the female control population. Figure 1D shows the percentage distribution of female ulcerative colitis subjects exceeding the 90 th percentile and 95 th percentile. In the same manner, fig. 2A-2D schematically depict different responses to cantaloupe, fig. 3A-3D schematically depict different responses to black and white specks and fig. 4A-4D schematically depict different responses to cucumber. Figures 5A-5B show the distribution of the number of foods according to what was identified as induction foods at the 90 th percentile (5A) and 95 th percentile (5B) in ulcerative colitis subjects. The inventors contemplate that the male and female responses are significantly different regardless of the particular food item.
It should be noted that the art does not provide any predictable food group that is sexed in connection with ulcerative colitis. Thus, it was found that food items exhibiting different responses to gender were unexpected results, which could not be expected significantly for all of the techniques previously available. In other words, the selection of food items based on gender stratification provides unexpected technical effects such that the statistical significance of specific food items as induced foods for male or female ulcerative colitis patients is significantly improved.
Normalization of IgG response data: while raw data of the patient's IgG response results can be used to compare the intensity of response between given foods, it is also contemplated that the patient's IgG response results are normalized and indexed (indexed) to produce dimensionless values to compare the relative intensity of response to a given food. For example, the patient's food-specific IgG results (e.g., specific to citrusSpecific IgG and IgG specific for malt) may be normalized to the total IgG of the patient. The normalized value of the patient's IgG specific for citrus may be 0.1 and the normalized value of the patient's IgG specific for malt may be 0.3. In this case, the relative intensity of the patient's response to malt is 3 times that of citrus. Thus, the sensitivity of the patient to malt and citrus can be indexed as such.
In other embodiments, one or more of the patient's food-specific IgG results (e.g., prawn-specific IgG and pork-specific IgG, etc.) can be normalized to a global average of the patient's food-specific IgG results. The global average of the patient's food-specific IgG may be measured by the total amount of the patient's food-specific IgG. In this case, the patient's prawn specific IgG may be normalized to the average of the patient's total food specific IgG (e.g., average of IgG levels of prawn, pork, precious crab, chicken, pea, etc.). However, it is also contemplated that the global average of a patient's food-specific IgG may be measured by multiple tests via the patient's IgG level for a particular class of food. If 5 tests of shrimp sensitivity and 7 tests of pork sensitivity have been previously performed on the patient, then the patient's shrimp or new IgG value for pork is normalized to the average of 5 tests of shrimp or the average of 7 tests of pork. The normalized value of the patient's prawn-specific IgG may be 6.0 and the normalized value of the patient's pork-specific IgG may be 1.0. In this case, the patient is now 6 times more sensitive to the shrimp than to the average of the shrimp, but has a substantially similar sensitivity to pork. The sensitivity of the patient to shrimp and pork can then be indexed based on such comparison.
A method of determining a subset of ulcerative colitis patients having food sensitivity underlying ulcerative colitis: although food sensitivity is suspected to play an important role in the signs and symptoms of ulcerative colitis, some ulcerative colitis patients may not have food sensitivity reflecting ulcerative colitis. Those patients will not benefit from dietary intervention to treat the signs and symptoms of ulcerative colitis. To determine a subset of such patients, body fluid samples of ulcerative colitis patients and non-ulcerative colitis patients may be tested using ELISA tests using test equipment with up to 58 food samples.
Tables 5A and 5B provide exemplary raw data. As should be readily appreciated, the data represent the number of positive results in 58 sample foods based on the 90 th percentile value (table 5A) or based on the 95 th percentile value (table 5B). According to ICD-10 coding, column 1 is ulcerative colitis (n=103); the second column is non-ulcerative colitis (n=163). The mean and median numbers of ulcerative colitis patients and non-ulcerative colitis patients were calculated. From the raw data shown in tables 5A and 5B, the mean and standard deviation of the number of positive foods for ulcerative colitis patients and non-ulcerative colitis patients were calculated. In addition, the number and percentage of patients with zero positive diet for ulcerative colitis patients and non-ulcerative colitis patients were calculated. The number and percentage of patients with zero positive diet in the ulcerative colitis population based on the 90 th percentile value (table 5A) was less than one sixth (3% versus 19% respectively) of the patients with zero positive diet in the non-ulcerative colitis population, and this percentage in the ulcerative colitis population based on the 95 th percentile value (table 5B) was also less than one half (12% versus 31% respectively) of the non-ulcerative colitis population. Thus, it can be readily appreciated that ulcerative colitis patients who are sensitive to zero-positive foods are unlikely to have food sensitivity reflecting their signs and symptoms of ulcerative colitis.
Tables 6A and 7A show exemplary statistics summarizing the raw data for the two patient populations shown in table 5A. Statistical data included normal (normal), arithmetic mean, median, percentile, and 95% Confidence Intervals (CIs) representing the mean and median of the number of positive foods in the ulcerative and non-ulcerative colitis populations. Tables 6B and 7B show exemplary statistics summarizing the raw data for the two patient populations shown in table 5B. Statistical data included normal, arithmetic mean, median, percentile, and 95% Confidence Intervals (CI) representing the mean and median of the number of positive foods in the ulcerative and non-ulcerative colitis populations
Tables 8A and 9A show another exemplary statistical data summarizing the raw data for the two patient populations shown in table 5A. In tables 8A and 9A, the raw data is transformed by logarithmic transformation to improve data interpretation. Tables 8B and 9B show another exemplary statistical data summarizing the raw data for the two patient populations shown in table 5B. In tables 8B and 9B, the raw data is transformed by logarithmic transformation to improve data interpretation.
Tables 10A and 11A show exemplary statistics of independent T-test (table 10A, log transformed data) and Mann-Whitney test (table 11A) to compare geometric mean of positive foods between ulcerative and non-ulcerative colitis samples. The data shown in tables 10A and 11A demonstrate significant statistical differences in geometric mean of the number of positives of food between ulcerative and non-ulcerative colitis populations. In both statistical tests, the number of positive responses for 58 food samples was shown to be significantly higher in the ulcerative colitis population than in the non-ulcerative colitis population and the average discrimination p-value was less than or equal to 0.0001. These statistics are also illustrated as box and whisker plots in fig. 6A, and as notched box and whisker plots in fig. 6B.
Tables 10B and 11B show exemplary statistics of independent T-test (table 10A, log transformed data) and Mann-Whitney test (table 11B) to compare geometric mean of positive foods between ulcerative and non-ulcerative colitis samples. The data shown in tables 10B and 11B demonstrate significant statistical differences in geometric mean of the number of positives of food between ulcerative and non-ulcerative colitis populations. In both statistical tests, the number of positive responses for 58 food samples was shown to be significantly higher in the ulcerative colitis population than in the non-ulcerative colitis population and the average discrimination p-value was less than or equal to 0.0001. These statistics are also illustrated as box and whisker plots in fig. 6C, and as notched box and whisker plots in fig. 6D.
Table 12A shows exemplary statistics of subject operating characteristic (ROC) curve analysis of the data shown in tables 5A-11A to determine the diagnostic capabilities of the test employed in table 5 in distinguishing ulcerative colitis subjects from non-ulcerative colitis subjects. When the demarcation criteria for more than 5 positive foods were used, the test resulted in data of 66% sensitivity and 68% specificity, with an area under the curve (AUROC) of 0.720. The p-value of ROC is significant at p-values < 0.0001. Fig. 7A illustrates ROC curves corresponding to the statistics shown in table 12A. Since the statistical difference between the population of ulcerative colitis and the population of non-ulcerative colitis is significant, when the test results are demarcated by a number of 5 positives, the number of foods tested positive by the patient can be used as a confirmation of the preliminary clinical diagnosis of ulcerative colitis, and whether or not the sensitivity to foods can reflect the signs and symptoms of ulcerative colitis in the patient. Thus, the above test can be used as another "rule in" test to add to the clinical criteria currently available for diagnosing ulcerative colitis.
As shown in tables 5A-12A and fig. 7A based on the 90 th percentile data, the number of positive foods seen in ulcerative versus non-ulcerative colitis subjects was significantly different, whether the data was compared to the geometric mean or median. The number of positive foods that 1 person had indicates the presence of ulcerative colitis in the subject. The test has the distinguishing capability of detecting ulcerative colitis, and has sensitivity of 66% and specificity of 68%. In addition, the absolute numbers and percentages of subjects with 0-positive diet also were very different in ulcerative colitis subjects versus non-ulcerative colitis subjects, with the percentage of ulcerative colitis subjects with 0-positive diet (3%) being much lower than the percentage of non-ulcerative colitis subjects with 0-positive diet (19%). This data suggests that a subset of ulcerative colitis patients may suffer from ulcerative colitis due to other non-dietary factors and may not benefit from dietary restrictions.
Table 12B shows exemplary statistics of subject operating characteristic (ROC) curve analysis of the data shown in tables 5B-11B to determine the diagnostic capabilities of the test employed in table 5 in distinguishing ulcerative colitis subjects from non-ulcerative colitis subjects. When the demarcation criteria for more than 3 positive foods were used, the test resulted in data of 60.2% sensitivity and 75.5% specificity, with an area under the curve (AUROC) of 0.719. The p-value of ROC is significant at p-values < 0.0001. Fig. 7B illustrates ROC curves corresponding to the statistics shown in table 12B. Since the statistical difference between the population of ulcerative colitis and the population of non-ulcerative colitis is significant, when the test results are demarcated by a number of greater than 3 positives, the number of foods tested positive by the patient can be used as a confirmation of preliminary clinical diagnosis of ulcerative colitis, and whether sensitivity to foods can reflect signs and symptoms of ulcerative colitis in the patient. Thus, the above test may be used as another "scratch-in" test to add to the clinical criteria currently available for diagnosing ulcerative colitis.
As shown in tables 5B-12B and fig. 7B based on the 95 th percentile data, the number of positive foods seen in ulcerative versus non-ulcerative colitis subjects was significantly different, whether the geometric mean or median of the data was compared. The number of positive foods that 1 person had indicates the presence of ulcerative colitis in the subject. Has sensitivity of 60% and specificity of 76%, and the test has the distinguishing capability of detecting ulcerative colitis. In addition, the absolute numbers and percentages of subjects with 0-positive diet also were very different in ulcerative colitis subjects versus non-ulcerative colitis subjects, with the percentage of ulcerative colitis subjects with 0-positive diet (-19%) being much lower than the percentage of non-ulcerative colitis subjects with 0-positive diet (-31%). This data suggests that a subset of ulcerative colitis patients may have ulcerative colitis due to other non-dietary factors and may not benefit from dietary restrictions.
A method for determining the distribution of the number of foods per person, called "positive": to determine the number distribution of "positive" foods per person and measure diagnostic performance, analysis was performed with the 58 food items in table 2, which shows the most positive response to ulcerative colitis patients. To reduce the impact of any subject on this analysis, each food-specific and gender-specific dataset was self-sampled 1000 times. Next, for each food item in this self-service sample, the 90 th percentile and 95 th percentile of the control population were used to determine the specific demarcation point. Once the sex-specific demarcation point is determined, the sex-specific demarcation point is compared to the ELISA signal scores of the observed control and ulcerative colitis subjects. In this comparison, a "positive" diet is considered if the observed signal is equal to or greater than the demarcation point value, and a "negative" diet is considered if the observed signal is less than the demarcation point value.
Once all food items were considered positive or negative, the results of 116 (58 foods x 2 demarcation points) calls (calls) per subject were saved in each self-service repeat. Then, for each subject, 58 calls were summed using the 90 th percentile as the demarcation point to get "number of positive foods (90 th)" and the remaining 58 calls were summed using the 95 th percentile to get "number of positive foods (95 th)". Next, in each repetition, the "number of positive foods (90 th) and" number of positive foods (95 th) "of the entire subject are summed to obtain descriptive statistics for each repetition as follows: 1) The overall average value is equal to the average value of the average values; 2) The overall standard deviation is equal to the average of the standard deviations; 3) The overall median value is equal to the average of the median values; 4) The overall minimum value is equal to the minimum value of the minimum values; and 5) the overall maximum value is equal to the maximum value of the maximum values. In this analysis, to avoid non-integer "number of positive foods" when calculating the frequency distribution and histogram, the authors assumed that 1000 replicates of the same original dataset were actually new subjects with the same scale 999 sets added to the original sample. Once the summary of the data is completed, the frequency distribution and histogram of the "number of positive foods (90 th)" and the "number of positive foods (95 th)" for both sexes and for ulcerative colitis subjects and control subjects are generated using the programs "a_pos_foods. Sas, a_pos_foods_by_dx.sas".
Method for measuring diagnostic properties: to measure the diagnostic performance of each subject for each food item, we used the data of "number of positive foods (90 th)" and "number of positive foods (95 th)" for each subject in each self-help repeat described above. In this analysis, the demarcation point is set to 1. Thus, if the subject has one or more "number of positive foods (90 th)" the subject is called "suffering from ulcerative colitis". If the subject has less than 1 "number of positive foods (90 th)" the subject is called "does not suffer from ulcerative colitis". When all calls are established, the call is compared to the actual diagnosis to determine whether the call is True Positive (TP), true Negative (TN), false Positive (FP), or False Negative (FN). When the cut-off point was set to 1 for each method, the comparisons of the whole subjects were summarized to obtain the performance indicators of sensitivity, specificity, positive predictive value, and negative predictive value of "number of positive foods (90 th)" and "number of positive foods (95 th)". Each (sensitivity, 1-specificity) pair becomes a point on the ROC curve for this repetition.
To improve accuracy, the above analysis was repeated by increasing the demarcation point from 2 up to 58 and repeating for each of the 1000 self-service repetitions. Thus, the performance indicators in 1000 self-service replicates are summarized by calculating the average using the program "t_pos_foods_by_dx. The results of the diagnostic performance of females and males are shown in tables 13A and 13B (90 th percentile) and tables 14A and 14B (95 th percentile).
Of course, it should be understood that certain changes may be made to the food preparation without altering the subject matter of the invention provided herein. For example, if the food item is a yellow onion, the item should be understood to also include other onion species that have been demonstrated to have equivalent activity in the test. Indeed, the inventors noted that for each food preparation tested, certain other relevant food preparations were also tested in the same or equivalent manner (data not shown). Thus, it is to be understood that each tested and claimed food preparation will have equivalents associated with it preparations having the same or equivalent reaction in a validated test.
It should be apparent to those skilled in the art that many more modifications besides those already described are possible without departing from the inventive concepts herein. The inventive subject matter, therefore, is not to be restricted except in the spirit of the appended claims. Furthermore, in interpreting both the specification and the claims, all terms should be interpreted in the broadest possible manner consistent with the context. In particular, the terms "comprises" and "comprising" should be interpreted as referring to elements, components, or steps in a non-exclusive manner, indicating that the referenced elements, components, or steps may be present, or utilized, or combined with other elements, components, or steps that are not expressly referenced. If the specification states that at least one selected from the group consisting of A, B, C … and N is referred to, the text should be interpreted as requiring only one element of the group, not a plus N or B plus N, etc.


Table 1 ranking of foods according to FDR corrected two-tailed arrangement T-test p-value


TABLE 2
Comparing ulcerative colitis to control based on basic descriptive statistics of ELISA fractions of diet and gender


Table 3 upper quantiles of ELISA signal scores of control subjects as candidates top 58 foods ranked in descending order of discriminatory power for determining test demarcation points of "positive" or "negative" using a permutation test


TABLE 4 Table 4


TABLE 5A


TABLE 5B


TABLE 6A


TABLE 6B


TABLE 7A


TABLE 7B

TABLE 8A

TABLE 8B


TABLE 9A


TABLE 9B


TABLE 10A


TABLE 10B


TABLE 11A


TABLE 11B


Table 12A


Table 12B
Predicting performance indicators of ulcerative colitis status from the number of positive foods using the 90 th percentile of ELISA signals to determine positives


TABLE 13A


TABLE 13B
Predicting performance indicators of ulcerative colitis status from the number of positive foods using the 95 th percentile of ELISA signals to determine positives


TABLE 14A


TABLE 14B
Claims (100)
1. A kit for testing food intolerance in patients diagnosed with or suspected of suffering from ulcerative colitis, the kit comprising:
one or more different food preparations, wherein each food preparation is independently coupled to an individually addressable solid carrier; and
wherein each different food preparation has an average discrimination p-value of less than or equal to 0.07 as determined by the original p-value, or has an average discrimination p-value of less than or equal to 0.10 as determined by FDR multiply corrected p-values, wherein the average discrimination p-value is determined by a process comprising comparing the measured value of a first test group of patients diagnosed with ulcerative colitis or suspected ulcerative colitis to the measured value of a second test group of patients not diagnosed with ulcerative colitis or suspected ulcerative colitis.
2. The kit of claim 1, wherein the plurality of food preparations comprises at least two food preparations prepared from the food items of table 1 or selected from foods 1-58 of table 2.
3. The kit of claim 1, wherein the plurality of food preparations comprises at least four food preparations prepared from the food items of table 1 or selected from foods 1-58 of table 2.
4. The kit of claim 1, wherein the plurality of food preparations comprises at least eight food preparations prepared from the food items of table 1 or selected from foods 1-58 of table 2.
5. The kit of claim 1, wherein the plurality of food preparations comprises at least twelve food preparations prepared from the food items of table 1 or selected from foods 1-58 of table 2.
6. The kit of claim 1, wherein the plurality of different food preparations have an average discrimination p-value of 0.05 or less determined from the original p-value or have an average discrimination p-value of 0.08 or less determined from FDR multiply corrected p-values.
7. The kit of any one of claims 1-5, wherein the plurality of different food preparations have an average discrimination p-value of 0.05 or less determined from the original p-value, or have an average discrimination p-value of 0.08 or less determined from FDR multiply corrected p-values.
8. The kit of claim 1, wherein the plurality of different food preparations have an average discrimination p-value of 0.025 or less determined by the original p-value or have an average discrimination p-value of 0.07 or less determined by the FDR multiply corrected p-value.
9. The kit of any one of claims 1-5, wherein the plurality of different food preparations have an average discrimination p-value of 0.025 or less determined by the original p-value or an average discrimination p-value of 0.07 or less determined by the FDR multiply corrected p-value.
10. The kit of claim 1, wherein the FDR multiply corrected p-value is corrected for at least one of age and gender.
11. The kit of any one of claims 1-8, wherein the FDR multiply corrected p-value is corrected for at least one of age and gender.
12. The kit of claim 1, wherein the FDR multiplex corrected p-value is corrected for age and gender.
13. The kit of any one of claims 1-8, wherein the FDR multiplex corrected p-value is corrected for age and gender.
14. The kit of claim 1, wherein at least 50% of the plurality of different food preparations have an average discrimination p-value of 0.07 or less determined from the original p-value or an average discrimination p-value of 0.10 or less determined from the FDR multiply corrected p-values when corrected for a single gender.
15. The kit of any one of claims 1-13, wherein at least 50% of the plurality of different food preparations have an average discrimination p-value of 0.07 or less determined from the original p-value or an average discrimination p-value of 0.10 or less determined from the FDR multiply corrected p-values when corrected for a single gender.
16. The kit of claim 1, wherein at least 70% of the plurality of different food preparations have an average discrimination p-value of 0.07 or less determined from the original p-value or an average discrimination p-value of 0.10 or less determined from the FDR multiply corrected p-values when corrected for a single gender.
17. The kit of any one of claims 1-13, wherein at least 70% of the plurality of different food preparations have an average discrimination p-value of 0.07 or less determined from the original p-value or an average discrimination p-value of 0.10 or less determined from the FDR multiply corrected p-values when corrected for a single gender.
18. The kit of claim 1, wherein when corrected for a single gender, the plurality of different food preparations all have an average discrimination p-value of 0.07 or less determined from the original p-value, or have an average discrimination p-value of 0.10 or less determined from the FDR multiply corrected p-values.
19. The kit of any one of claims 1-17, wherein when corrected for a single gender, the plurality of different food preparations all have an average discrimination p-value of less than or equal to 0.07 as determined by the original p-value, or have an average discrimination p-value of less than or equal to 0.10 as determined by the FDR multiply corrected p-value.
20. The kit of claim 1, wherein the plurality of different food preparations are coarsely filtered aqueous extracts.
21. The kit of any one of claims 1-19, wherein the plurality of different food preparations are coarsely filtered aqueous extracts.
22. The kit of claim 1, wherein the plurality of different food preparations are treated aqueous extracts.
23. The kit of any one of claims 1-21, wherein the plurality of different food preparations are treated aqueous extracts.
24. The kit of claim 1, wherein the solid support is a well of a multi-well plate, a bead, an electrical sensor, a chemical sensor, a microchip, or an adsorption membrane.
25. The kit of any one of claims 1-23, wherein the solid support is a well of a multi-well plate, a bead, an electrical sensor, a chemical sensor, a microchip, or an adsorption membrane.
26. A method of testing food intolerance in patients diagnosed with or suspected of suffering from ulcerative colitis, comprising:
contacting a food preparation with a body fluid of a patient diagnosed with or suspected of suffering from ulcerative colitis, and wherein the body fluid is associated with gender confirmation;
wherein the contacting step is performed under conditions that allow IgG from said bodily fluid to bind to at least one component of said food preparation;
measuring IgG bound to the at least one component of the food preparation to obtain a signal;
comparing the signal to a reference value of gender stratification of the food preparation using the gender confirmation to obtain a result; and
and updating or generating a report by using the result.
27. The method of claim 26, wherein the bodily fluid of the patient is whole blood, plasma, serum, saliva, or fecal suspension.
28. The method of claim 26, wherein the step of contacting the food preparation is performed by a plurality of different food preparations.
29. The method of claim 26 or claim 27, wherein the step of contacting the food preparation is performed by a plurality of different food preparations.
30. The method of claim 28, wherein the plurality of different food preparations are prepared from the food items of table 1 or selected from foods 1-58 of table 2.
31. The method of any one of claims 28-29, wherein the plurality of different food preparations are prepared from the food items of table 1 or selected from foods 1-58 of table 2.
32. The method of claim 28, wherein the plurality of different food preparations have an average discrimination p-value of 0.07 or less determined from the original p-value or an average discrimination p-value of 0.10 or less determined from FDR multiply corrected p-values.
33. The method of any one of claims 28-29, wherein the plurality of different food preparations have an average discrimination p-value of 0.07 or less determined from the original p-value or an average discrimination p-value of 0.10 or less determined from FDR multiply corrected p-values.
34. The method of claim 28, wherein the plurality of different food preparations have an average discrimination p-value of 0.05 or less determined from the original p-value or an average discrimination p-value of 0.08 or less determined from FDR multiply corrected p-values.
35. The method of any one of claims 28-29, wherein the plurality of different food preparations have an average discrimination p-value of 0.05 or less determined from the original p-value or an average discrimination p-value of 0.08 or less determined from FDR multiply corrected p-values.
36. The method of claim 28, wherein the plurality of different food preparations have an average discrimination p-value of 0.025 or less determined by an original p-value or an average discrimination p-value of 0.07 or less determined by FDR multiply corrected p-values.
37. The method of any one of claims 28-29, wherein the plurality of different food preparations have an average discrimination p-value of 0.025 or less determined by an original p-value or an average discrimination p-value of 0.07 or less determined by FDR multiply corrected p-values.
38. The method of claim 28, wherein the plurality of different food preparations all have an average discrimination p-value of 0.07 or less determined from the original p-value or an average discrimination p-value of 0.10 or less determined from FDR multiply corrected p-values.
39. The method of any one of claims 28-29, wherein the plurality of different food preparations all have an average discrimination p-value of 0.07 or less determined from the original p-value or an average discrimination p-value of 0.10 or less determined from FDR multiply corrected p-values.
40. The method of claim 26, wherein the food preparation is immobilized on a solid surface, optionally in an addressable manner.
41. The method of any one of claims 26-39, wherein the food preparation is immobilized on a solid surface, optionally in an addressable manner.
42. The method of claim 26, wherein the step of measuring IgG bound to the at least one component of the food preparation is performed via an immunoassay test.
43. The method of any one of claims 26-41, wherein the step of measuring IgG bound to the at least one component of the food preparation is performed via an immunoassay test.
44. The method of claim 26, wherein the reference value for the gender stratification of the food preparation is at least the 90 th percentile value.
45. The method of any one of claims 26-43, wherein the reference value for the gender stratification of the food preparation is at least the 90 th percentile value.
46. A method of generating a test for food intolerance in patients diagnosed with or suspected of suffering from ulcerative colitis, comprising:
obtaining test results for a plurality of different food preparations, wherein the test results are based on body fluids of patients diagnosed with or suspected of suffering from ulcerative colitis and body fluids of a control group that are not diagnosed with or suspected of suffering from ulcerative colitis;
layering the test results according to gender component for each of the different food preparations; and
for each of the different food preparations, a different demarcation value for male and female patients is assigned for a predetermined percentile ranking.
47. The method of claim 46, wherein the test result is an ELISA result.
48. The method of claim 46, wherein the plurality of different food preparations comprises at least two food preparations prepared from the food items of table 1 or selected from foods 1-58 of table 2.
49. The method of claim 46 or claim 47, wherein the plurality of different food preparations comprises at least two food preparations prepared from food items of Table 1 or selected from foods 1-58 of Table 2.
50. The method of claim 46, wherein the plurality of different food preparations comprises at least six food preparations prepared from the food items of table 1 or selected from the group consisting of foods 1-58 of table 2.
51. The method of claim 46 or claim 47, wherein the plurality of different food preparations comprises at least six food preparations prepared from the food items of Table 1 or selected from foods 1-58 of Table 2.
52. The method of claim 46, wherein the plurality of different food preparations comprises food preparations prepared from the food items of table 1 or selected from foods 1-58 of table 2.
53. The method of claim 46 or claim 47, wherein the plurality of different food preparations comprises food preparations prepared from food items of Table 1 or selected from foods 1-58 of Table 2.
54. The method of claim 46, wherein the plurality of different food preparations have an average discrimination p-value of 0.07 or less determined from the original p-value or an average discrimination p-value of 0.10 or less determined from the FDR multiply corrected p-values.
55. The method of any one of claims 46-53, wherein the plurality of different food preparations have an average discrimination p-value of 0.07 or less determined from the original p-value or an average discrimination p-value of 0.10 or less determined from FDR multiply corrected p-values.
56. The method of claim 46, wherein the plurality of different food preparations have an average discrimination p-value of 0.05 or less determined from the original p-value or an average discrimination p-value of 0.08 or less determined from the FDR multiply corrected p-values.
57. The method of any one of claims 46-53, wherein the plurality of different food preparations have an average discrimination p-value of 0.05 or less determined from the original p-value or an average discrimination p-value of 0.08 or less determined from FDR multiply corrected p-values.
58. The method of claim 46, wherein the plurality of different food preparations have an average discrimination p-value of 0.025 or less determined by the original p-value or an average discrimination p-value of 0.07 or less determined by the FDR multiply corrected p-value.
59. The method of any one of claims 46-53, wherein the plurality of different food preparations have an average discrimination p-value of 0.025 or less determined by an original p-value or an average discrimination p-value of 0.07 or less determined by an FDR multiply corrected p-value.
60. The method of claim 46, wherein the body fluid of the patient is whole blood, plasma, serum, saliva, or fecal suspension.
61. The method of any one of claims 46-59, wherein the bodily fluid of the patient is whole blood, plasma, serum, saliva, or fecal suspension.
62. The method of claim 46, wherein the predetermined percentile ranking is at least a 90 th percentile ranking.
63. The method of any of claims 46-61, wherein the predetermined percentile ranking is at least a 90 th percentile ranking.
64. The method of claim 46, wherein the demarcation value for the male and female patients has a difference of at least 10% (absolute value).
65. The method of any one of claims 46-63, wherein the demarcation values for the male and female patients have a difference of at least 10% (absolute value).
66. The method of claim 26 or 46, further comprising the step of normalizing the results to total IgG of the patient.
67. The method of any one of claims 26-65, further comprising the step of normalizing the results to total IgG of the patient.
68. The method of claim 26 or 46, further comprising the step of normalizing the results to a global average of the patient's food-specific IgG results.
69. The method of any one of claims 26-65, further comprising the step of normalizing the results to a global average of the patient's food-specific IgG results.
70. The method of claim 26 or 46, further comprising the step of identifying a subset of patients, wherein p-value is less than or equal to 0.01 based on the raw p-value or average discrimination, said subset of patients being sensitive to said food preparation reflecting ulcerative colitis.
71. The method of any one of claims 26-65, further comprising the step of identifying a subset of patients, wherein the subset of patients is sensitive to the food preparation reflecting ulcerative colitis based on the raw p-value or average discriminatory p-value +.0.01.
72. The method of claim 26 or 46, further comprising the step of determining the quantity of the food preparation, wherein the quantity of the food preparation can be used to confirm ulcerative colitis based on an original p-value or an average discrimination p-value of 0.01 or less.
73. The method of any one of claims 26-65, further comprising the step of determining the quantity of the food preparation, wherein the quantity of the food preparation is usable to confirm ulcerative colitis from the raw p-value or average discriminatory p-value +.0.01.
74. Use of a plurality of different food preparations coupled to individually, individually addressable solid supports, wherein the plurality of different food preparations have an average discrimination p-value of 0.07 or less determined from an original p-value or an average discrimination p-value of 0.10 or less determined from FDR multiply corrected p-values, in the diagnosis of ulcerative colitis.
75. The use of claim 74, wherein the plurality of food preparations comprises at least two food preparations prepared from the food items of table 1 or selected from foods 1-58 of table 2.
76. The use of claim 74, wherein the plurality of food preparations comprises at least four food preparations prepared from the food items of table 1 or selected from foods 1-58 of table 2.
77. The use of claim 74, wherein the plurality of food preparations comprises at least eight food preparations prepared from the food items of table 1 or selected from foods 1-58 of table 2.
78. The use of claim 74, wherein the plurality of food preparations comprises at least twelve food preparations prepared from the food items of table 1 or selected from foods 1-58 of table 2.
79. The use of claim 74, wherein said plurality of different food preparations have an average discrimination p-value of 0.05 or less determined from the original p-value or an average discrimination p-value of 0.08 or less determined from the FDR multiply corrected p-values.
80. The use of any one of claims 74-78, wherein the plurality of different food preparations have an average discrimination p-value of less than or equal to 0.05 determined from the original p-value, or an average discrimination p-value of less than or equal to 0.08 determined from FDR multiply corrected p-values.
81. The use of claim 74, wherein said plurality of different food preparations have an average discrimination p-value of less than or equal to 0.025 determined by the original p-value or an average discrimination p-value of less than or equal to 0.07 determined by the FDR multiply corrected p-value.
82. The use of any one of claims 74-78, wherein the plurality of different food preparations have an average discrimination p-value of less than or equal to 0.025 determined by the original p-value, or an average discrimination p-value of less than or equal to 0.07 determined by FDR multiply corrected p-values.
83. The use of claim 74, wherein the FDR multiply corrected p-value is corrected for at least one of age and gender.
84. The use of any one of claims 74-82, wherein the FDR multiply corrected p-value is corrected for at least one of age and gender.
85. The use of claim 74, wherein the FDR multiply corrected p values are corrected for age and gender.
86. The use of any one of claims 74-82, wherein FDR multiply corrected p-values are corrected for age and gender.
87. The use of claim 74, wherein at least 50% of said plurality of different food preparations have an average discrimination p-value of less than or equal to 0.07 determined from the original p-value or an average discrimination p-value of less than or equal to 0.10 determined from FDR multiply corrected p-values when corrected for a single gender.
88. The use of any one of claims 74-86, wherein at least 50% of the plurality of different food preparations have an average discrimination p-value of ∈0.07 determined from the original p-value or an average discrimination p-value of ∈0.10 determined from the FDR multiply corrected p-values when corrected for a single gender.
89. The use of claim 74, wherein at least 70% of said plurality of different food preparations have an average discrimination p-value of less than or equal to 0.07 determined from the original p-value or an average discrimination p-value of less than or equal to 0.10 determined from FDR multiply corrected p-values when corrected for a single gender.
90. The use of any one of claims 74-86, wherein at least 70% of the plurality of different food preparations have an average discrimination p-value of ∈0.07 determined from the original p-value or an average discrimination p-value of ∈0.10 determined from the FDR multiply corrected p-values when corrected for a single gender.
91. The use of claim 74, wherein when corrected for a single gender, the plurality of different food preparations all have an average discrimination p-value of less than or equal to 0.07 determined from the original p-value, or an average discrimination p-value of less than or equal to 0.10 determined from the FDR multiply corrected p-values.
92. The use of any one of claims 74-86, wherein when corrected for a single gender, the plurality of different food preparations all have an average discrimination p-value of less than or equal to 0.07 determined from the original p-value, or an average discrimination p-value of less than or equal to 0.10 determined from FDR multiply corrected p-values.
93. The use of claim 74, wherein said plurality of different food preparations are coarsely filtered aqueous extracts.
94. The use of any one of claims 74-92, wherein the plurality of different food preparations are coarsely filtered aqueous extracts.
95. The use of claim 74, wherein said plurality of different food preparations are treated aqueous extracts.
96. The use of any one of claims 74-94, wherein the plurality of different food preparations are treated aqueous extracts.
97. The use of claim 74, wherein the solid support is a well of a multiwell plate, a bead, an electrical sensor, a chemical sensor, a microchip or an adsorption membrane.
98. The use of any one of claims 74-96, wherein the solid support is a well of a multi-well plate, a bead, an electrical sensor, a chemical sensor, a microchip, or an adsorption membrane.
99. The use of any one of claims 74-96, wherein the mean discrimination p-value is determined by a process comprising comparing a measured value of a first patient test group diagnosed with or suspected of having ulcerative colitis to a measured value of a second patient test group not diagnosed with or suspected of having ulcerative colitis.
100. The method of claim 46, wherein the test results are ELISA results obtained from a process comprising contacting each different food preparation with the body fluid of each patient separately.
Applications Claiming Priority (4)
| Application Number | Priority Date | Filing Date | Title |
|---|---|---|---|
| US201662327932P | 2016-04-26 | 2016-04-26 | |
| US62/327,932 | 2016-04-26 | ||
| PCT/US2017/028696 WO2017189338A2 (en) | 2016-04-26 | 2017-04-20 | Compositions, devices, and methods of ulcerative colitis sensitivity testing |
| CN201780026191.0A CN109073645A (en) | 2016-04-26 | 2017-04-20 | Composition, equipment and the method for ulcerative colitis sensitivity test |
Related Parent Applications (1)
| Application Number | Title | Priority Date | Filing Date |
|---|---|---|---|
| CN201780026191.0A Division CN109073645A (en) | 2016-04-26 | 2017-04-20 | Composition, equipment and the method for ulcerative colitis sensitivity test |
Publications (1)
| Publication Number | Publication Date |
|---|---|
| CN116183929A true CN116183929A (en) | 2023-05-30 |
Family
ID=60161054
Family Applications (3)
| Application Number | Title | Priority Date | Filing Date |
|---|---|---|---|
| CN201780026191.0A Pending CN109073645A (en) | 2016-04-26 | 2017-04-20 | Composition, equipment and the method for ulcerative colitis sensitivity test |
| CN202211646353.XA Pending CN116183928A (en) | 2016-04-26 | 2017-04-20 | Compositions, devices and methods for ulcerative colitis sensitivity testing |
| CN202211651675.3A Pending CN116183929A (en) | 2016-04-26 | 2017-04-20 | Compositions, devices and methods for ulcerative colitis sensitivity testing |
Family Applications Before (2)
| Application Number | Title | Priority Date | Filing Date |
|---|---|---|---|
| CN201780026191.0A Pending CN109073645A (en) | 2016-04-26 | 2017-04-20 | Composition, equipment and the method for ulcerative colitis sensitivity test |
| CN202211646353.XA Pending CN116183928A (en) | 2016-04-26 | 2017-04-20 | Compositions, devices and methods for ulcerative colitis sensitivity testing |
Country Status (8)
| Country | Link |
|---|---|
| US (1) | US20190170767A1 (en) |
| EP (1) | EP3449255A4 (en) |
| JP (2) | JP2019515275A (en) |
| CN (3) | CN109073645A (en) |
| AU (1) | AU2017257281A1 (en) |
| CA (1) | CA3062890A1 (en) |
| MX (1) | MX2018013120A (en) |
| WO (1) | WO2017189338A2 (en) |
Families Citing this family (2)
| Publication number | Priority date | Publication date | Assignee | Title |
|---|---|---|---|---|
| KR20220038183A (en) | 2014-11-14 | 2022-03-25 | 바이오메리카인코포레이티드 | Compositions, devices, and methods of ibs sensitivity testing |
| JP2019515275A (en) * | 2016-04-26 | 2019-06-06 | バイオメリカ・インコーポレイテッドBiomerica, Inc. | Compositions, devices and methods for ulcerative colitis susceptibility testing |
Family Cites Families (9)
| Publication number | Priority date | Publication date | Assignee | Title |
|---|---|---|---|---|
| EP0162896A1 (en) * | 1983-11-10 | 1985-12-04 | Ventrex Laboratories Inc. | Multiple allergen-bearing matrixes useful for qualitative allergy screening |
| CA2319317C (en) * | 1998-01-30 | 2006-04-18 | Hugh A. Sampson | Prognostic allergy or inflammation test |
| US6667160B2 (en) * | 2000-03-15 | 2003-12-23 | Kenneth D. Fine | Method for diagnosing immunologic food sensitivity |
| US8361460B2 (en) * | 2001-09-05 | 2013-01-29 | Nippon Meat Packers, Inc. | Food allergens, method of detecting food allergens and method of detecting food allergy-inducing foods |
| GB0310522D0 (en) * | 2003-05-08 | 2003-06-11 | Yorktest Lab Ltd | Assay panel |
| US20050255533A1 (en) * | 2004-02-10 | 2005-11-17 | Brendan Bioscience, Llc | Comprehensive food allergy test |
| US7601509B2 (en) * | 2004-07-15 | 2009-10-13 | Power Laura W | Biotype diets system: predicting food allergies by blood type |
| KR20110131262A (en) * | 2009-03-05 | 2011-12-06 | 아지노모토 가부시키가이샤 | Diagnostic reagent for crohn's disease |
| JP2019515275A (en) * | 2016-04-26 | 2019-06-06 | バイオメリカ・インコーポレイテッドBiomerica, Inc. | Compositions, devices and methods for ulcerative colitis susceptibility testing |
-
2017
- 2017-04-20 JP JP2018556307A patent/JP2019515275A/en active Pending
- 2017-04-20 CN CN201780026191.0A patent/CN109073645A/en active Pending
- 2017-04-20 EP EP17790144.4A patent/EP3449255A4/en active Pending
- 2017-04-20 WO PCT/US2017/028696 patent/WO2017189338A2/en active Application Filing
- 2017-04-20 CA CA3062890A patent/CA3062890A1/en active Pending
- 2017-04-20 MX MX2018013120A patent/MX2018013120A/en unknown
- 2017-04-20 CN CN202211646353.XA patent/CN116183928A/en active Pending
- 2017-04-20 AU AU2017257281A patent/AU2017257281A1/en active Pending
- 2017-04-20 CN CN202211651675.3A patent/CN116183929A/en active Pending
-
2018
- 2018-10-25 US US16/170,969 patent/US20190170767A1/en active Pending
-
2022
- 2022-03-09 JP JP2022036566A patent/JP2022066524A/en active Pending
Also Published As
| Publication number | Publication date |
|---|---|
| CA3062890A1 (en) | 2017-11-02 |
| JP2019515275A (en) | 2019-06-06 |
| WO2017189338A3 (en) | 2018-02-01 |
| CN109073645A (en) | 2018-12-21 |
| AU2017257281A1 (en) | 2018-10-25 |
| CN116183928A (en) | 2023-05-30 |
| WO2017189338A2 (en) | 2017-11-02 |
| JP2022066524A (en) | 2022-04-28 |
| EP3449255A2 (en) | 2019-03-06 |
| US20190170767A1 (en) | 2019-06-06 |
| MX2018013120A (en) | 2019-03-28 |
| EP3449255A4 (en) | 2019-11-27 |
Similar Documents
| Publication | Publication Date | Title |
|---|---|---|
| JP6876338B2 (en) | Compositions, Devices and Methods for IBS Sensitivity Testing | |
| JP2022066524A (en) | Composition, device and method for testing ulcerative colitis susceptibility | |
| JP2022031342A (en) | Compositions, devices, and methods of functional dyspepsia sensitivity testing | |
| JP2021192047A (en) | Compositions, devices, and methods for depression sensitivity testing | |
| CN116660539A (en) | Compositions, devices and methods for psoriasis food sensitivity testing | |
| EP4116713A2 (en) | Compositions, devices, and methods of osteoarthritis sensitivity testing | |
| CN116735859A (en) | Compositions, devices and methods for Crohn's disease susceptibility testing | |
| AU2017283493B2 (en) | Compositions, devices, and methods of gastroesophageal reflux disease sensitivity testing | |
| CN116735858A (en) | Composition, device and method for migraine food sensitivity testing | |
| CN116047083A (en) | Compositions, devices and methods for attention deficit disorder/attention deficit hyperactivity disorder (ADD/ADHD) susceptibility testing | |
| JP2024060100A (en) | Methods for preparing a food sensitivity test panel in patients with ulcerative colitis |
Legal Events
| Date | Code | Title | Description |
|---|---|---|---|
| PB01 | Publication | ||
| PB01 | Publication | ||
| SE01 | Entry into force of request for substantive examination | ||
| SE01 | Entry into force of request for substantive examination |