Detailed Description
The present application is described in further detail below with reference to the drawings and examples. It is to be understood that the specific embodiments described herein are merely illustrative of the invention and are not limiting of the invention. It should be noted that, for convenience of description, only the portions related to the invention are shown in the drawings.
It should be noted that, in the case of no conflict, the embodiments and features in the embodiments may be combined with each other. The present application will be described in detail below with reference to the accompanying drawings in conjunction with embodiments.
(1) Euclidean distance: the Euclidean distance or Euclidean metric is the straight line distance before two points in Euclidean space; the euclidean distance in the embodiments of the present application is used to represent the straight line distance between two distribution vectors.
(2) DS evidence theory: an uncertainty reasoning method has the capability of processing uncertainty information; since the prediction operation data obtained in the embodiment of the application are uncertain information, the prediction result of the escalator fault can be obtained by carrying out evidence fusion through a D-S evidence theory.
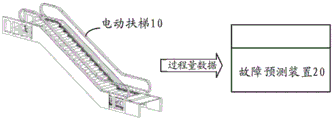
Fig. 1 is an implementation environment architecture diagram of a prediction method for escalator faults provided in an embodiment of the present application. As shown in fig. 1, the implementation environment architecture includes: an escalator 10 and a failure prediction device 20. The handrail part of the escalator 10 is provided with a temperature sensor measuring point, so that the temperature of the handrail belt can be measured in real time. The fault prediction device 20 can predict the faults of the escalator according to the collected process quantity data in the running process of the escalator 10.
The fault prediction device 20 can be deployed on the escalator 10, or can be deployed on a remote computer device, and the remote receiving and processing of the escalator process quantity data can be realized through the computer device.
In a specific implementation, an acquisition module, a working condition identification module, a trend prediction module, a fault evaluation module, a display module and the like may be disposed in the fault prediction device 20. For example, the process quantity data of the escalator 10 can be acquired through the acquisition module, and the process quantity data is analyzed through the working condition identification module to determine the working condition state of the escalator 10; under the condition that the working condition of the escalator is not changed, predicting the operation data of the escalator 10 through a trend prediction module, and inputting the predicted operation data into a fault evaluation module, so as to evaluate the fault degree of the escalator 10; after the fault evaluation is finished, the fault evaluation result is displayed on the fault prediction device 20 through the display module.
Currently, failure trend prediction is a key technology for avoiding serious accidents of electromechanical equipment and realizing predictive maintenance. In the prior art, the operation data of the escalator can be recorded by utilizing a sensor or an electromechanical system of the escalator, and the prediction result of the escalator fault can be obtained according to the trend prediction of the operation data. However, the working conditions of the escalator unit are complex, and according to different running conditions, the working conditions of the escalator can be divided into a constant speed working condition, a variable speed working condition and a rotating speed working condition. Therefore, in order to adapt to the running environment, the working conditions of the escalator can be subjected to irregular switching, and the running data under different working conditions have larger difference, so that the difficulty of predicting the failure trend is increased, and the prediction efficiency of the escalator failure is reduced.
Based on the above, the application provides a prediction method, a device, equipment and a medium for escalator faults, which can predict escalator faults under the condition that the working conditions of the escalator are not changed, and improve the prediction efficiency of the escalator faults.
Fig. 2 is a flow chart of a method for predicting an escalator fault, which may be performed by the fault predicting device 20 according to an embodiment of the present application. As shown in fig. 2, the method comprises the steps of:
s201, acquiring operation data of the escalator at a plurality of sampling times, and determining a plurality of distribution vectors corresponding to the operation data; the distribution vector is used to characterize the time domain distribution characteristics of the operational data over a time unit comprising a plurality of sampling times.
The escalator operation data under different working conditions are mixed together to make the performed escalator fault prediction work lose meaning, so that the escalator fault can be predicted under the condition that the escalator working conditions are not changed. In order to more intuitively reflect the operation state of the escalator, the embodiment of the application can analyze the actual operation data of the escalator, so that the accuracy of judging the working condition of the escalator is improved.
In one possible implementation, operation data of the escalator in a plurality of sampling times can be obtained based on a preset sampling frequency. The operation data can be process quantity data of the escalator in the operation process, such as motor rotation speed, key phase value, motor power, motor current, handrail temperature, handrail left-right temperature difference and the like.
For example, the operation data can be collected by measuring points arranged at different parts of the escalator. For example, the measuring points can be arranged at the positions of the handrail belt, the motor, the reduction gearbox, the main driving wheel, the step chain tensioner and the like. The collected data may be automatically uploaded from the measurement points or manually recorded to a terminal device, which may be the fault prediction device 20 described above. The operation data collected by the measuring points can be the temperature of the handrail belt, the temperature difference between the left and right sides of the handrail belt and the like.
Alternatively, the operating data can also be automatically conducted to the terminal device after measurement by the electromechanical system of the escalator. The operational data conducted by the electromechanical system measurement may be the motor speed, key phase values, motor power, motor current, etc. as described above.
The escalator operation data is used as physical parameters of the escalator, is less affected by environment, has a stable trend, and can intuitively reflect the operation state of the escalator.
The sampling time may be set to any time or any period of time, for example. When the sampling time is any time period, the sampling frequency of the measurement operation data of each measuring point and the sampling frequency of the measurement operation data of each electromechanical system in the sampling time period can be the same or different. For example, when the sampling time is one minute and the sampling frequency is 20 s/time and 10 s/time, each measuring point can measure 3 sets of operation data, and each electromechanical system can measure 6 sets of data. In order to improve the collection efficiency of the operation data, the sampling frequency of each measuring point and each electromechanical system can be set to be in the same state in a rectifying mode.
For example, the acquired escalator operation data may be stored in a database with a time stamp, so that the operation data for failure prediction may be directly read in the database. For example, the database may be operational data collected in one minute, and may be a data stamp every ten seconds.
In one possible implementation, a time domain feature value of the operation data in a plurality of continuous sampling times can be obtained to form a plurality of distribution vectors corresponding to the operation data. Wherein a plurality of consecutive sample times constitutes a time unit.
It should be noted that the distribution vector is a plurality of distribution vectors corresponding to one type of operation data. For example, motor current in one time unit corresponds to one set of distribution vectors, and handrail belt temperature difference in the same time unit corresponds to another set of distribution vectors.
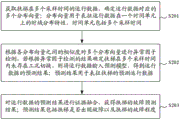
S202, detecting abnormal factors of a plurality of distribution vectors according to the similarity among the distribution vectors, and if the escalator is determined to have no working condition switching in a plurality of sampling times according to the abnormal factor detection result, inputting operation data into a prediction model to obtain a prediction result of the operation data; the prediction result is used for representing the prediction operation data of the escalator.
In the embodiment of the application, in order to further determine whether the working condition of the escalator is changed, each distribution vector of the operation data of the escalator can be regarded as different points, and abnormal factors in the distribution vectors are obtained by detecting outliers of each distribution vector, so that a switching result of the working condition of the escalator is obtained. According to the embodiment of the application, the distribution vector reflecting the data characteristics of each stage of the escalator is analyzed, so that the accuracy of the escalator working condition judgment result is more guaranteed.
In one possible implementation, the degree of similarity between the distribution vectors during the sampling time may be substituted into the LOF (Local Outlier Factor, outlier detection algorithm) to perform outlier detection on the distribution vectors. For example, each distribution vector may be considered as a point, and LOF outlier detection may be performed based on euclidean distance between points of each distribution vector. When the LOF value of the distribution vector is larger than a preset threshold, the escalator working condition in the sampling time is judged to be changed.
In the embodiment of the application, under the condition that the working condition of the escalator is not changed, trend prediction is carried out on the acquired escalator operation data through the prediction model, so that a data foundation is laid for the prediction of faults and fault degrees of follow-up escalator.
In one possible implementation manner, when the working condition of the escalator in the sampling time is not switched, the operation data acquired in the sampling time can be input into the prediction model, so that the prediction operation data of the escalator can be obtained.
For example, operational data over a sampling time may be input into an ARMA (autoregressive moving average model) for data prediction. It should be noted that the operation data input into the ARMA model is expressed in a sequence form.
It should be noted that, the prediction process of the operation data may be to predict a single operation data, or may predict each operation data sequentially. For example, when the operation data input to the predictive model is motor current, then the predicted operation data obtained is also only the predicted motor current value.
In one possible implementation, the sequence of operational data may be smoothed prior to being input into the predictive model at the sampling time, thereby eliminating noise present in the data.
For example, a sliding window averaging process may be performed on the run data sequence and the smoothness of the check sequence checked using ADF (Augmented Dickey-FullerTest). When the running data sequence does not meet the stability condition in ADF test, the sequence can be subjected to differential processing until the stability condition is met, and the differential times i meeting the stability condition are recorded.
For example, when the running data sequence satisfies the stationarity condition, an AR (Auto Regression model) order p suitable for the sequence and an MA (Moving Average model) order q suitable for the sequence may be obtained according to an AIC (Akaike informationcriterion) information amount of the sequence, thereby constructing an ARMA model using the orders p, q.
Note that the ARMA model can be expressed as:
wherein,,
can be a white noise sequence, and any AR autocorrelation coefficient +.>
Less than 1, arbitrary MA partial autocorrelation coefficient +.>
And is also less than 1.
Exemplary, after the ARMA model is constructed successfully, sequence prediction is performed by using the ARMA model, and the original input operation data sequence is restored by the difference times i recorded previously, so that the predicted operation data of the escalator under the 95% confidence level is obtained. The predicted operation data may be predicted operation data at any given time length.
In one possible implementation, operational data outside of a specified length of time may be predicted based on fault level discrimination criteria and evaluated for fault level. For example, when the predicted operating data is motor power, three hours of motor power in the future may be predicted by the ARMA model. Based on the predicted motor power of three hours in the future, the motor power of 24 hours in the future can be predicted according to the fault degree discrimination standard of the fixed limit or the self-adaptive limit, and the probability of abnormality of the motor power in 24 hours in the future can be generated.
The fault degree discrimination standard may be an alarm limit value which can be set autonomously, or an adaptive self-fitting dynamic threshold value.
S203, carrying out evidence fusion on the prediction result of the operation data to obtain a fault prediction result of the escalator; the prediction result comprises whether the escalator has faults or not and the fault degree of the escalator.
In the embodiment of the application, according to the evidence fusion of the predicted operation data, the prediction results of the faults and the fault degree of the escalator are obtained. Compared with the predicted result which is expressed in the form of data after the data trend prediction in the prior art, the predicted result which is expressed in the form of fault type and fault degree is more visual, and is more beneficial to avoiding the occurrence of malignant accidents.
In one possible implementation manner, based on DS evidence theory, the prediction results of different types of operation data are subjected to evidence fusion, so that the prediction results of the escalator faults are generated.
It should be noted that, the prediction result in the step S202 is only for a single operation data in the operation process of the escalator, and the prediction result in the step S203 is for the whole escalator.
In the prediction method for escalator faults, firstly, the switching condition of the escalator working conditions is determined by utilizing the time domain distribution characteristics of the actual operation data of the escalator, and compared with single operation data, the method has the advantages that the data characteristics of the operation data in each stage can be reflected by utilizing the different time domain distribution characteristics in the operation data, so that the judgment result of the escalator working conditions is more accurate; under the condition that the working conditions of the escalator are not switched, the actual operation data of the escalator are predicted to obtain predicted operation data, compared with the prior art that the operation data are predicted under the condition of unknown working conditions, the method can avoid that the escalator operation data under different working conditions are mixed so that the prediction process is meaningless, and the prediction efficiency of the escalator operation data is improved; finally, according to the predicted operation data of the escalator, evidence fusion processing is carried out, and the prediction result of the escalator fault is obtained, so that the escalator fault degree is more definite.
In another embodiment of the present application, a specific implementation of obtaining a distribution vector is also provided. Exemplary, the specific implementation of "determining a plurality of distribution vectors corresponding to the operation data" referred to above includes: for each time unit, performing time domain feature extraction on operation data corresponding to a plurality of sampling times included in the time unit to obtain a plurality of feature values corresponding to the time unit; and determining a distribution vector corresponding to the time unit according to the characteristic value corresponding to the time unit.
In one possible implementation manner, time domain feature extraction may be performed on the operation data in one unit time, so that a plurality of distribution vectors corresponding to the operation data in the time unit are formed by using the time domain feature values.
By way of example, the time-domain eigenvalues may be used to characterize the time-domain distribution characteristics of the operating data, and may include, in particular, mean, standard deviation, effective value, peak-to-peak, kurtosis, skew. Taking the handrail temperature as an example, when a time unit includes three continuous sampling times, seven time domain feature values (mean value, standard deviation, effective value, peak-to-peak value, kurtosis and skewness) corresponding to the three handrail temperatures in the three sampling times can be obtained, the seven time domain feature values are sequentially arranged to form feature vectors, one feature vector is one distribution vector, and then the arrangement of a plurality of distribution vectors can be understood as a feature matrix of N x 7 formed by a plurality of feature vectors.
Since each distribution vector is composed of a characteristic value having a time characteristic, each distribution vector may be regarded as a time-stamped process quantity data effective information point. Second, the order of eigenvalues in the different distribution vectors is the same.
In another embodiment of the present application, a specific implementation of anomaly factor detection for a distribution vector is also provided. Exemplary, the specific implementation of the foregoing "anomaly factor detection for a plurality of distribution vectors according to the similarity between the distribution vectors" includes: determining, for each distribution vector, euclidean distances between the distribution vector and other distribution vectors; determining the adjacent vector of the distribution vector, the reachable distance between the distribution vector and other distribution vectors according to the Euclidean distance; determining outlier factors of the distribution vectors according to the close vectors of the distribution vectors and the reachable distances between the distribution vectors and other distribution vectors; the outlier factor is used for characterizing a difference of the distribution vector from an average level of the plurality of distribution vectors; and determining whether working condition switching exists in the escalator in a plurality of sampling times according to outlier factors of the distribution vectors.
In the embodiment of the application, the distribution vectors corresponding to the operation data can be synthesized, and the LOF algorithm is utilized to judge the switching condition of the working condition of the escalator.
In one possible implementation, the zscore normalization may be performed on the plurality of distribution vectors prior to anomaly factor detection on the plurality of distribution vectors.
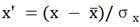
Exemplary, can utilize
And carrying out normalization processing on the plurality of distribution vectors. Wherein,,
the mean and standard deviation of x, respectively. For example, when the plurality of distribution vectors are feature matrices of n×7, the feature matrices may be used to represent all time domain feature values within N time units of certain operation data, where one time unit corresponds to 7 time domain feature values. Then->
The mean value and standard deviation of the same type of time domain characteristic values in N time units are respectively, and one time domain characteristic value corresponds to one mean value and standard deviation.
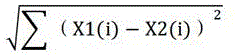
In one possible implementation, the Euclidean distance between a distribution vector and other distribution vectors may be determined by a calculation between a plurality of distribution vector row vectors. For example, the distribution vector corresponding to each time unit can be regarded as a point in the two-dimensional space, and the distance between the two distribution vector points is determined according to a distance measurement formula between the points in the two-dimensional space. Wherein the distance between two distribution vector points can be expressed as:
wherein, X1 and X2 respectively represent a distribution vector 1 and a distribution vector 2, and i represents an ith column. Thus, the first and second substrates are bonded together,
characteristic value for characterizing distribution vector 1 in column i,>
for characterizing the eigenvalue of the distribution vector 2 in the ith column.
In one possible implementation, after the euclidean distance between any two distribution vectors is obtained, one distribution vector may be arbitrarily selected from a plurality of distribution vectors, and the adjacent vector of the distribution vector and the reachable distance between the distribution vector and any other distribution vector may be determined.
Illustratively, one distribution vector p is selected from a plurality of distribution vectors, the adjacent vector of the distribution vector p is the kth distribution vector nearest to the distribution vector p, and the euclidean distance between the distribution vector p and the adjacent vector thereof may be defined as the K distance. The K distance may be denoted as K-distance (q). Thus when there is no more euclidean distance between a distribution vector q and a distribution vector p than between a distribution vector p and its neighboring vector, the set of such distribution vectors q may be referred to as a K-distance neighborhood. The K-distance neighborhood can be expressed as
. Where d (p, q) may be used to characterize the euclidean distance between the distribution vector p and the distribution vector q.
For example, after determining the adjacent vector of the distribution vector p, one distribution vector q may be selected from the plurality of distribution vectors, and the reachable distance between the distribution vector p and the distribution vector q may be the distance between the distribution vector p and the adjacent vectorThe K distance, or euclidean distance between the distribution vectors p, q. When the Euclidean distance between the distribution vectors p and q is larger than the K distance between the distribution vector p and the adjacent vector, the reachable distance between the distribution vectors p and q is the Euclidean distance between the distribution vectors p and q; when the Euclidean distance between the distribution vectors p and q is smaller than or equal to the K distance between the distribution vector p and the adjacent vector, the reachable distance of the distribution vectors p and q is the K distance. The reach distance can be expressed as
。
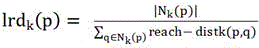
In one possible implementation, the outlier factor of a distribution vector may be determined by determining the local reachable density of the distribution vector based on the K distance between the distribution vector and its neighboring vector, and the reachable distances between the distribution vector and other distribution vectors.
Illustratively, the local reachable density of the distribution vector p may be the inverse of the average reachable distance between the distribution vector p and all remaining distribution vectors. The local reachable density of p can be expressed as
. Wherein (1)>
The number of all distribution vectors in the K-distance neighborhood of the distribution vector p. If->
The larger the value, the greater the density of the distribution vector p, the more consistent the distribution vector p is with the average level of the distribution vector. Local reachable density of distribution vector q>
The same is true.
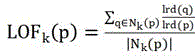
Exemplary, whether each distribution vector deviates from the average level of the distribution vectors can be determined according to the local reachable density, and the outlier factor of each distribution vector can be further determined by utilizing the local reachable density of each of the different distribution vectors, which can be specifically determined by
And judging.
It should be noted that, the process of determining the outlier factor is to determine each distribution vector sequentially according to the time unit sequence.
In another embodiment of the present application, a specific implementation manner for determining a condition switching situation is also provided. Exemplary, the specific implementation of determining whether the escalator has working condition switching in a plurality of sampling times according to the outlier factor of each distribution vector includes: if the outlier factors larger than the preset threshold do not exist continuously in the outlier factors of the distribution vectors, determining that the working condition of the escalator is not switched.
In the embodiment of the application, after the condition switching of the escalator is determined not to occur, a new distribution vector can be timely input to continue the condition judgment, so that the judgment efficiency of the condition switching condition of the escalator is improved.
In one possible implementation, when an outlier factor of a distribution vector of one kind of operation data exists is greater than a preset threshold, the distribution vector is indicated to deviate from the average level of the distribution vector seriously, and when the distribution vector does not continuously appear according to the time unit sequence, the escalator working condition is indicated to not be switched.
For example, the average level of the plurality of distribution vectors may be preset to 1. When the outlier factor LOF of the distribution vector p is far greater than 1, the distribution vector p is shown to deviate from the average level seriously, and can be judged as an outlier distribution vector; when the outlier factor LOF of the distribution vector p is close to 1, it indicates that the distribution vector p is a normal distribution vector. When the outlier distribution vector is not continuously generated, the working condition of the escalator is unchanged.
In one possible implementation manner, when the working condition of the escalator is not changed, a new feature vector of the same kind of operation data can be input for outlier factor detection.
In another embodiment of the present application, another specific implementation manner of determining the condition switching condition is also provided. Exemplary implementations include: when the operation data comprises a plurality of types of data, if each type of operation data has an outlier factor larger than a preset threshold, determining that the working condition of the escalator is switched.
In one possible implementation manner, when outliers larger than a preset threshold continuously appear in all operation data, the working condition of the escalator is indicated to be switched. For example, the average level of the plurality of distribution vectors is preset to be 1, and when the outlier factor of the distribution vector appears in each operation data, which is far greater than 1, and continuously appears according to the time unit sequence, the working condition of the escalator is switched.
Optionally, when the outlier factor greater than the preset threshold is not continuously present in all the operation data, it indicates that the sampling signal abnormality is caused by the continuous presence of the individual operation data greater than the preset threshold outlier factor.
For a better understanding of the embodiments of the present application, the following further describes a specific flow of another escalator fault prediction method proposed in the present application.
As shown, the method may include the steps of:
step 301, operation data of the escalator is obtained.
In a possible implementation manner, based on preset sampling time and sampling frequency, the temperature of each handrail belt can be obtained through automatic sampling of a temperature sensor arranged on the escalator, so that operation data such as temperature difference of each handrail belt can be obtained; the electromechanical system can automatically upload the running data such as motor power, motor current and the like.
Step 302, a plurality of distribution vectors of operational data is obtained.
In one possible implementation manner, the time domain feature values of each operation data in one time unit are respectively obtained, and all the time domain feature values are arranged into a feature vector, wherein one feature vector is a distribution vector of each operation data. Wherein a time unit comprises a plurality of sampling times.
In one possible implementation, the feature matrix is composed using a plurality of distribution vectors for each operational data. The column vectors of the feature matrix correspond to time domain feature values of the operation data, and the number of the time domain feature values of the operation data corresponds to the number of the feature matrix array vectors.
Step 303, performing outlier detection on a plurality of distribution vectors of the operation data, and determining whether an outlier distribution vector exists in the distribution vectors.
In one possible implementation, zscore normalization is performed on a plurality of distribution vectors for each operational data. And obtaining the existence condition of the outlier distribution vector by using an LOF algorithm according to Euclidean distance between the distribution vectors.
Step 304, judging whether the working condition of the escalator is switched or not based on the existence condition of the outlier distribution vector.
In one possible implementation manner, when the outlier distribution vectors do not continuously appear according to the time unit sequence, the escalator working condition is indicated to be not switched; when the outlier distribution vector continuously appears in all the operation data, the working condition of the escalator is indicated to be switched; when the outlier distribution vector does not continuously appear in all the operation data, the abnormal sampling signal appears in the individual operation data of which the outlier distribution vector continuously appears.
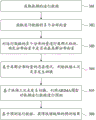
And 305, predicting the operation data of the escalator by using an ARIMA model based on the condition of the escalator without switching.
In one possible implementation manner, before the escalator operation data is predicted, sliding window averaging processing can be performed on the acquired operation data, so that noise in the data is eliminated.
In one possible implementation manner, the ADF test is used to perform stability test on the sequence of the averaged escalator operation data, if the sequence does not meet the stability, the sequence is differentiated until the behavior of the sequence does not change with time, and the difference number i is recorded.
In one possible implementation manner, the ARMA model is utilized to predict the sequence of the operation data meeting the stability, and the original sequence of the operation data before the differential processing is restored according to the differential times i, so that the predicted value of the operation data in the specified time length is obtained.
Step 306, obtaining the prediction result of the escalator fault based on the prediction operation data.
In one possible implementation manner, based on the predicted operation data, a numerical value of the operation data in a subsequent unspecified time length is predicted by using a fixed limit or an adaptive limit fault degree discrimination standard, and a corresponding fault degree of the operation data is predicted.
In a possible implementation manner, the DS evidence theory is applied to conduct evidence fusion on the prediction results of the various operation data, so that the probability of faults of the escalator and the corresponding fault degree are predicted.
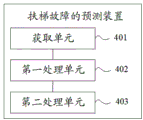
In the foregoing embodiments, another specific flow of the staircase fault prediction method is described. Fig. 4 is a block schematic diagram of an escalator fault prediction device according to an embodiment of the present application, which may be deployed in the fault prediction device 20 described above. Referring to fig. 4, the apparatus includes an acquisition unit 401, a first processing unit 402, and a second processing unit 403.
An obtaining unit 401, configured to obtain operation data of the escalator at a plurality of sampling times, and determine a plurality of distribution vectors corresponding to the operation data; the distribution vector is used for representing the time domain distribution characteristic of the operation data on a time unit, and the time unit comprises a plurality of sampling times;
the first processing unit 402 is configured to perform anomaly factor detection on a plurality of distribution vectors according to the similarity between the distribution vectors, and if it is determined that the escalator has no working condition switching in a plurality of sampling times according to the result of anomaly factor detection, input the operation data into the prediction model to obtain a prediction result of the operation data; the prediction result is used for representing prediction operation data of the escalator;
the second processing unit 403 is configured to perform evidence fusion on the prediction result of the operation data, so as to obtain a fault prediction result of the escalator; the prediction result comprises whether the escalator has faults or not and the fault degree of the escalator.
In a possible embodiment, the obtaining unit 401 is further configured to perform, for each time unit, time domain feature extraction on operation data corresponding to a plurality of sampling times included in the time unit, to obtain a plurality of feature values corresponding to the time unit; and determining a distribution vector corresponding to the time unit according to the characteristic value corresponding to the time unit.
In a possible embodiment, the first processing unit 402 is further configured to determine, for each distribution vector, a euclidean distance between the distribution vector and the other distribution vectors; determining the adjacent vector of the distribution vector, the reachable distance between the distribution vector and other distribution vectors according to the Euclidean distance; determining outlier factors of the distribution vectors according to the close vectors of the distribution vectors and the reachable distances between the distribution vectors and other distribution vectors; the outlier factor is used for characterizing a difference of the distribution vector from an average level of the plurality of distribution vectors; and determining whether working condition switching exists in the escalator in a plurality of sampling times according to outlier factors of the distribution vectors.
In a possible embodiment, the first processing unit 402 is further configured to determine that the working condition of the escalator is not switched if there is no outlier factor greater than the preset threshold continuously in the outlier factors of the distribution vectors.
In a possible embodiment, when the operation data includes a plurality of types of data, the first processing unit 402 is further configured to determine that the working condition of the escalator is switched if each type of operation data has an outlier factor greater than a preset threshold.
In summary, according to the prediction device for escalator faults provided by the embodiment of the application, firstly, the switching condition of the escalator working condition is determined by utilizing the time domain distribution characteristics of the actual operation data of the escalator, and compared with single operation data, the data characteristics of the operation data in each stage can be reflected by utilizing the different time domain distribution characteristics in the operation data, so that the judgment result of the escalator working condition is more accurate; under the condition that the working conditions of the escalator are not switched, the actual operation data of the escalator are predicted to obtain predicted operation data, compared with the prior art that the operation data are predicted under the condition of unknown working conditions, the method can avoid that the escalator operation data under different working conditions are mixed so that the prediction process is meaningless, and the prediction efficiency of the escalator operation data is improved; finally, according to the predicted operation data of the escalator, evidence fusion processing is carried out, and the prediction result of the escalator fault is obtained, so that the escalator fault degree is more definite.
In one embodiment, a computer device is provided. Fig. 5 is a block diagram of a computer device according to an embodiment of the present application. Referring to fig. 5, the computing device includes a memory in which a computer program is stored and a processor which, when executing the computer program, performs the steps of:
acquiring operation data of the escalator at a plurality of sampling times, and determining a plurality of distribution vectors corresponding to the operation data; the distribution vector is used for representing the time domain distribution characteristic of the operation data on a time unit, and the time unit comprises a plurality of sampling times; detecting abnormal factors of the distribution vectors according to the similarity among the distribution vectors, and if the escalator is determined to have no working condition switching in a plurality of sampling times according to the abnormal factor detection results, inputting the operation data into a prediction model to obtain a prediction result of the operation data; the prediction result is used for representing prediction operation data of the escalator; performing evidence fusion on the prediction result of the operation data to obtain a fault prediction result of the escalator; the prediction result comprises whether the escalator has faults or not and the fault degree of the escalator.
Those skilled in the art will appreciate that implementing all or part of the above-described methods may be accomplished by way of a computer program, which may be stored on a non-transitory computer readable storage medium and which, when executed, may comprise the steps of the above-described embodiments of the methods. Any reference to memory, storage, database, or other medium used in embodiments provided herein may include at least one of non-volatile and volatile memory. The nonvolatile Memory may include Read-Only Memory (ROM), magnetic tape, floppy disk, flash Memory, optical Memory, or the like. Volatile memory can include random access memory (Random Access Memory, RAM) or external cache memory. By way of illustration, and not limitation, RAM can be in various forms such as Static Random access memory (Static Random access memory AccessMemory, SRAM) or Dynamic Random access memory (Dynamic Random access memory AccessMemory, DRAM) and the like.
The technical features of the above embodiments may be arbitrarily combined, and all possible combinations of the technical features in the above embodiments are not described for brevity of description, however, as long as there is no contradiction between the combinations of the technical features, they should be considered as the scope of the description.
The foregoing examples represent only a few embodiments of the present application, which are described in more detail and are not to be construed as limiting the scope of the invention. It should be noted that it would be apparent to those skilled in the art that various modifications and improvements could be made without departing from the spirit of the present application, which would be within the scope of the present application. Accordingly, the scope of protection of the present application is to be determined by the claims appended hereto.