CN115153473A - Non-contact heart rate detection method based on multivariate singular spectrum analysis - Google Patents
Non-contact heart rate detection method based on multivariate singular spectrum analysis Download PDFInfo
- Publication number
- CN115153473A CN115153473A CN202210655752.6A CN202210655752A CN115153473A CN 115153473 A CN115153473 A CN 115153473A CN 202210655752 A CN202210655752 A CN 202210655752A CN 115153473 A CN115153473 A CN 115153473A
- Authority
- CN
- China
- Prior art keywords
- heart rate
- value
- signal
- ith
- matrix
- Prior art date
- Legal status (The legal status is an assumption and is not a legal conclusion. Google has not performed a legal analysis and makes no representation as to the accuracy of the status listed.)
- Granted
Links
- 238000001514 detection method Methods 0.000 title claims abstract description 15
- 238000010183 spectrum analysis Methods 0.000 title abstract description 16
- 238000000034 method Methods 0.000 claims abstract description 41
- 238000001914 filtration Methods 0.000 claims abstract description 15
- 230000002159 abnormal effect Effects 0.000 claims abstract description 11
- 238000005286 illumination Methods 0.000 claims abstract description 11
- 239000011159 matrix material Substances 0.000 claims description 39
- 238000000354 decomposition reaction Methods 0.000 claims description 24
- 238000001228 spectrum Methods 0.000 claims description 13
- 238000012545 processing Methods 0.000 claims description 7
- 230000003044 adaptive effect Effects 0.000 claims description 4
- 238000012935 Averaging Methods 0.000 claims description 3
- 239000000126 substance Substances 0.000 claims description 3
- 238000012216 screening Methods 0.000 abstract description 13
- 230000004886 head movement Effects 0.000 abstract 1
- 230000000875 corresponding effect Effects 0.000 description 4
- 238000010586 diagram Methods 0.000 description 4
- 238000004458 analytical method Methods 0.000 description 3
- 238000011156 evaluation Methods 0.000 description 3
- 239000000284 extract Substances 0.000 description 3
- 238000009532 heart rate measurement Methods 0.000 description 3
- 101001056160 Homo sapiens Methylcrotonoyl-CoA carboxylase subunit alpha, mitochondrial Proteins 0.000 description 2
- 102100026552 Methylcrotonoyl-CoA carboxylase subunit alpha, mitochondrial Human genes 0.000 description 2
- 238000006243 chemical reaction Methods 0.000 description 2
- 230000007547 defect Effects 0.000 description 2
- 230000001419 dependent effect Effects 0.000 description 2
- 238000000605 extraction Methods 0.000 description 2
- 230000001815 facial effect Effects 0.000 description 2
- 238000005259 measurement Methods 0.000 description 2
- 238000013459 approach Methods 0.000 description 1
- 230000009286 beneficial effect Effects 0.000 description 1
- 230000015572 biosynthetic process Effects 0.000 description 1
- 239000008280 blood Substances 0.000 description 1
- 210000004369 blood Anatomy 0.000 description 1
- 230000017531 blood circulation Effects 0.000 description 1
- 238000004364 calculation method Methods 0.000 description 1
- 208000016252 change in skin color Diseases 0.000 description 1
- 230000002596 correlated effect Effects 0.000 description 1
- 230000000694 effects Effects 0.000 description 1
- 238000005516 engineering process Methods 0.000 description 1
- 230000007774 longterm Effects 0.000 description 1
- 238000000691 measurement method Methods 0.000 description 1
- 238000002156 mixing Methods 0.000 description 1
- 238000012544 monitoring process Methods 0.000 description 1
- 238000005192 partition Methods 0.000 description 1
- 238000013186 photoplethysmography Methods 0.000 description 1
- 230000037081 physical activity Effects 0.000 description 1
- 238000003672 processing method Methods 0.000 description 1
- 238000011160 research Methods 0.000 description 1
- 230000003595 spectral effect Effects 0.000 description 1
- 238000012795 verification Methods 0.000 description 1
Images


Classifications
-
- A—HUMAN NECESSITIES
- A61—MEDICAL OR VETERINARY SCIENCE; HYGIENE
- A61B—DIAGNOSIS; SURGERY; IDENTIFICATION
- A61B5/00—Measuring for diagnostic purposes; Identification of persons
- A61B5/02—Detecting, measuring or recording pulse, heart rate, blood pressure or blood flow; Combined pulse/heart-rate/blood pressure determination; Evaluating a cardiovascular condition not otherwise provided for, e.g. using combinations of techniques provided for in this group with electrocardiography or electroauscultation; Heart catheters for measuring blood pressure
- A61B5/024—Detecting, measuring or recording pulse rate or heart rate
-
- A—HUMAN NECESSITIES
- A61—MEDICAL OR VETERINARY SCIENCE; HYGIENE
- A61B—DIAGNOSIS; SURGERY; IDENTIFICATION
- A61B5/00—Measuring for diagnostic purposes; Identification of persons
- A61B5/0059—Measuring for diagnostic purposes; Identification of persons using light, e.g. diagnosis by transillumination, diascopy, fluorescence
-
- A—HUMAN NECESSITIES
- A61—MEDICAL OR VETERINARY SCIENCE; HYGIENE
- A61B—DIAGNOSIS; SURGERY; IDENTIFICATION
- A61B5/00—Measuring for diagnostic purposes; Identification of persons
- A61B5/72—Signal processing specially adapted for physiological signals or for diagnostic purposes
- A61B5/7203—Signal processing specially adapted for physiological signals or for diagnostic purposes for noise prevention, reduction or removal
- A61B5/7207—Signal processing specially adapted for physiological signals or for diagnostic purposes for noise prevention, reduction or removal of noise induced by motion artifacts
-
- G—PHYSICS
- G06—COMPUTING; CALCULATING OR COUNTING
- G06V—IMAGE OR VIDEO RECOGNITION OR UNDERSTANDING
- G06V10/00—Arrangements for image or video recognition or understanding
- G06V10/20—Image preprocessing
- G06V10/25—Determination of region of interest [ROI] or a volume of interest [VOI]
-
- G—PHYSICS
- G06—COMPUTING; CALCULATING OR COUNTING
- G06V—IMAGE OR VIDEO RECOGNITION OR UNDERSTANDING
- G06V10/00—Arrangements for image or video recognition or understanding
- G06V10/20—Image preprocessing
- G06V10/30—Noise filtering
-
- G—PHYSICS
- G06—COMPUTING; CALCULATING OR COUNTING
- G06V—IMAGE OR VIDEO RECOGNITION OR UNDERSTANDING
- G06V10/00—Arrangements for image or video recognition or understanding
- G06V10/40—Extraction of image or video features
- G06V10/56—Extraction of image or video features relating to colour
-
- G—PHYSICS
- G06—COMPUTING; CALCULATING OR COUNTING
- G06V—IMAGE OR VIDEO RECOGNITION OR UNDERSTANDING
- G06V20/00—Scenes; Scene-specific elements
- G06V20/40—Scenes; Scene-specific elements in video content
- G06V20/46—Extracting features or characteristics from the video content, e.g. video fingerprints, representative shots or key frames
-
- G—PHYSICS
- G06—COMPUTING; CALCULATING OR COUNTING
- G06V—IMAGE OR VIDEO RECOGNITION OR UNDERSTANDING
- G06V40/00—Recognition of biometric, human-related or animal-related patterns in image or video data
- G06V40/10—Human or animal bodies, e.g. vehicle occupants or pedestrians; Body parts, e.g. hands
- G06V40/16—Human faces, e.g. facial parts, sketches or expressions
- G06V40/168—Feature extraction; Face representation
Abstract
The invention discloses a non-contact heart rate detection method based on multivariate singular spectrum analysis, which comprises the following steps: 1. firstly, acquiring a video image and determining a face region of interest; 2. screening four optimal sub-areas from the region of interest, extracting a chrominance signal of each sub-area, and taking a motion track of a nose tip part as a motion signal; 3. self-adaptive filtering removes the motion artifact in the chrominance signal, and the motion artifact is used as an input signal; 4. adopting multivariate singular spectrum analysis to process input signals, and screening out pulse signals from the input signals; 5. extracting the heart rate from the pulse signal by adopting a frequency spectrum analysis method; 6. and finally, finding out abnormal heart rate values according to the heart rate continuity and replacing the abnormal heart rate values with correct heart rate values. The method can simultaneously remove the influence of illumination change and the interference of head movement, thereby improving the accuracy of non-contact video heart rate detection.
Description
Technical Field
The invention belongs to the technical field of biomedical signal processing, and particularly relates to a non-contact heart rate detection method based on multivariate singular spectrum analysis.
Background
The current heart rate measuring methods are mainly divided into a contact type and a non-contact type. The contact detection method monitors the blood volume pulse by conventional measuring instruments such as electrocardiographs, pulse oximeters, etc. However, the skin of the subject needs to be directly contacted during measurement, so that the human body activity is limited to a certain extent, and the subject may be uncomfortable due to long-term measurement, and the method is not suitable for special people such as infants, burn patients and the like. The non-contact measurement method, also called remote photoplethysmography (rPPG), uses a camera to capture the change in skin color due to blood flow, thereby extracting the heart rate. The defect of traditional contact type heart rate monitoring can be overcome, and the method has the characteristics of no wound, portability, easiness in implementation and the like.
There are two major challenges in rPPG technology-illumination variation and motion noise. At present, most research scenes are under indoor light sources or natural light sources, and a subject is kept still under the condition of small illumination change. Rencheng Song et al adopts an ensemble empirical mode decomposition to decompose the green channel of the screened optimal region of interest, and then extracts a common information method (EEMD-MCCA), which can effectively reduce the influence of ambient light variation on video heart rate extraction. Whereas EEMD-MCCA is a two-step process, the use of EEMD is primarily to construct the MCCA's multi-channel input set. But the number of IMFs obtained in each ROI is different and needs to be selected and filled to keep the number of channels per set the same. The selection process of IMF is heuristic and may lose useful terms due to modal mixing. This will reduce the effectiveness of the MCCA algorithm. In an actual scene, a subject is difficult to avoid motion, so that it is also a challenge to eliminate the interference of motion noise under the condition of light variation, so as to obtain an accurate heart rate.
Disclosure of Invention
The invention provides a non-contact heart rate detection method based on multivariate singular spectrum analysis for solving the defects of the technology, so as to remove the influence of ambient light change and the interference of motion noise, thereby improving the accuracy of non-contact video heart rate detection.
The invention adopts the following technical scheme for solving the technical problems:
the invention relates to a non-contact video heart rate detection method based on multivariate singular spectrum decomposition, which is characterized by comprising the following steps of:
step 1: acquiring T frame video data of a subject, dividing the T frame video data into L data in an overlapped manner, wherein each data comprises N frame video images;
and 2, step: determining a face region of interest of the first N frames of video images by adopting a face detection and face tracking method, dividing the face region of interest in each frame of video image into Q sub-regions, wherein L is more than or equal to 1 and less than or equal to L;
and step 3: calculating the pixel mean value of each sub-region in the l N frame video image frame by frame, calculating the illumination intensity, illumination change and signal-to-noise ratio of each sub-region as the judged quality indexes according to the pixel mean value of each sub-region, selecting P optimal sub-regions from Q sub-regions according to the quality indexes of each sub-region, extracting RGB channel mean value signals from the P optimal sub-regions and converting the RGB channel mean value signals into HSV signals, extracting chrominance signals in the HSV signals and recording the chrominance signals as H l ={h l,1 ,h l,2 ,...,h l,p ,...,h l,P },h l,p The chrominance signal of the P-th optimal subregion of the l N-frame video image is more than 1 and more than P and more than P;
and 4, step 4: detecting human face characteristic points of the first N frames of video images frame by adopting an Openface method, and recording motion track signals of the nose tip position characteristic points of the first N frames of video images as V l ={v l,1 ,v l,2 ,...,v l,j ,...,v l,N }; wherein v is l,j The position coordinates of the nose tip position feature points in the ith frame video image are obtained;
and 5: using the first motion track signal V l Chrominance signal h for the ith optimum subregion of the l l,p Performing adaptive filtering LMS processing to remove the first chrominance signal h l,p To obtain the first p-th filtered chrominance signal And is
 Representing pixel values of the P chrominance signals filtered in the jth frame of video image to obtain the P chrominance signals filtered in the jth frame
 And as the ith input signal data set;
step 6: using singular spectrum decomposition method to make said I input signal data set X l Decomposition into several components:
step 6.1: setting the length of a window to be M, wherein M is less than N/2, defining a parameter K = N-M +1, and filtering the ith p-th chrominance signal according to the length M of the window and the parameter K With formation dimension of M × KFirst p track matrix
 Then splicing the first P track matrixes to form a Hankel track matrix with dimension of PM multiplied by K
Step 6.2: calculating the first trace matrix Y l Y l T Characteristic value of (D) is noted as lambda l,1 ,...,λ l,i ,...,λ l,PM Wherein λ is l,i Represents the l trace matrix Y l Y l T The ith feature value of (a); calculating the first trace matrix Y l Y l T Characteristic value λ of l,1 ,...,λ l,i ,...,λ l,PM Is denoted as U l,1 ,...,U l,i ,...,U l,PM Wherein, U l,i Representing a characteristic value λ l,i A corresponding orthonormal vector; calculate R = rank (Y) l ) R represents a matrix Y l Rank of (1), calculating principal component
The first hankel locus matrix Y l Decomposition into Y l =Y l,1 +...+Y l,i +...+Y l,R Wherein, Y l,i Represents the ith trace matrix Y l Y l T Ith characteristic value lambda i A corresponding decomposition matrix, and
step 6.3: divide the first index set { 1. -, R } into R disjoint subsets I l,i ={i},i=1,2,...,R,I l,i Represents the ith subset of the first batch; for the Hankel locus matrix Y according to the subset l Grouping to obtain the first R group matrix { Y } l,i |1≤i≤R},Y l,i Obtained by step 6.2;
step 6.4: to pairFirst R group matrix Y l,i Carrying out diagonal line averaging to obtain the first reconstructed signal Wherein the content of the first and second substances,
 denotes the ith grouping matrix Y l,i Carrying out diagonal line average on the processed one-dimensional signals;
and 7: the first reconstructed signal Grouping, each group containing four signals, the first group of signals
 As a candidate pulse set, calculating the ith candidate heart rate signal of the first group
 The ratio of the energy of the main frequency and the second harmonic frequency, thereby selecting the candidate heart rate signal with the maximum energy ratio as the pulse signal, and converting the pulse signal into a frequency domain form by utilizing fast Fourier transform, thereby obtaining the main frequency f of the pulse signal main Calculating the average heart rate value of the subject of the first N frames of video images to obtain a first heart rate value HR l =f main ×60;
And step 8: obtaining L heart rate value sets { HR ] of L N frame video images according to the processes from the step 2 to the step 7 l |l=1,2,…,L};
And step 9: calculating heart rate value HR of the first N frames of video images l Heart rate values HR of N frames of video images of k-th part of the same subject k Whether or not the absolute error therebetween is smaller than the set threshold value Th 1 If the value is less than the preset value, the counting value is S +1; otherwise, keeping the count value S unchanged, wherein the initial value of the count value S is 0;
step 10: judging whether the count value S is larger than the set threshold Th 2 If, ifIf it is greater than the first heart rate value HR l Taking the heart rate as an effective value and recording the effective value into a heart rate candidate set HR, otherwise, judging the next heart rate value; so as to obtain the final heart rate candidate set HR, and calculating the average value thereof as the reference value HR ref ;
Step 11: according to the reference value HR ref And L heart rate value sets { HR } l } (l=1,2,...,L) Calculating the first heart rate value HR l And reference HR ref Absolute error between HR and HR error,l If the absolute error HR error,l Less than or equal to a predetermined threshold value Th 1 The ith heart rate value HR l As target HR T Otherwise, the value is regarded as an abnormal value;
if the first heart rate value HR l If the value is abnormal, the signal is decomposed from the rest To calculate the closest reference value HR ref Heart rate value HR of n,new As target HR T 。
Compared with the prior art, the invention has the beneficial effects that:
1. the invention selects the chrominance signal: most studies have chosen a green channel signal, which has the advantage of containing a greater heart rate signal intensity compared to the red and blue channels. However, in the case of varying light, the color space of the green channel depends not only on the color of the object, but also on the intensity of the reflected light from the surface. In contrast, the chrominance signal is not dependent on luminance, which means that the chrominance signal is more resistant to changes in ambient light than the green signal, thereby reducing the effect of ambient light changes on the extraction heart rate.
2. The invention adopts a self-adaptive filtering method to remove motion noise: the Openface method is adopted to detect the human face characteristic points frame by frame, the motion trail of the nose tip position is used as a motion signal, the self-adaptive filtering is utilized to effectively remove the motion artifact caused by head motion in the chrominance signal, and the accuracy of heart rate measurement is improved.
3. The invention divides the face interesting area into a plurality of sub-areas and carries out optimal screening: the information of the heart beats contained in different facial interesting regions is the same, compared with the method for extracting the heart rate signal source from a single interesting region, the method emphasizes common signal source components contained in a plurality of interesting regions, and the joint analysis of the plurality of interesting regions can extract the heart rate more accurately.
4. The invention adopts a multivariate singular spectrum decomposition method to extract the heart rate: the multivariate singular spectrum decomposition avoids the mode aliasing problem of the traditional empirical mode decomposition method, can directly decompose a plurality of signals, considers the internal correlation among the signals and can effectively reduce the heart rate signal distortion rate.
Drawings
FIG. 1 is a flow chart of the method of the present invention;
FIG. 2a is a schematic view of a facial region of interest in accordance with the present invention;
FIG. 2b is a schematic diagram of the present invention for screening the optimal region of interest of the face;
FIG. 3a is a candidate heart rate signal 1 obtained by screening multivariate singular spectrum analysis according to the present invention;
fig. 3b is a candidate heart rate signal 2 obtained by screening multivariate singular spectrum analysis according to the present invention;
FIG. 3c is a candidate heart rate signal 3 obtained by filtering the multivariate singular spectrum analysis according to the present invention;
FIG. 3d is a candidate heart rate signal 4 obtained by filtering the multivariate singular spectrum analysis according to the present invention;
FIG. 4a is a frequency spectrum diagram of a candidate heart rate signal 1 obtained by screening multivariate singular spectrum analysis according to the present invention;
FIG. 4b is a frequency spectrum diagram of a candidate heart rate signal 2 obtained by filtering the multivariate singular spectrum analysis according to the present invention;
fig. 4c is a frequency spectrum diagram of a candidate heart rate signal 3 obtained by screening multivariate singular spectrum analysis according to the present invention;
FIG. 4d is a graph of a spectrum of a candidate heart rate signal 4 obtained by screening a multivariate singular spectrum analysis according to the present invention;
FIG. 5a is a flow chart of heart rate calculation according to the present invention;
FIG. 5b is a flowchart of the method for screening outliers of the present invention.
Detailed Description
In the embodiment, a non-contact video heart rate detection method based on multivariate singular spectrum decomposition is disclosed, as shown in fig. 1, a face video image sequence is obtained first, and a face region of interest is determined; then dividing the region of interest of the face into a plurality of sub-regions, screening an optimal sub-region according to the illumination intensity, illumination change and signal-to-noise ratio, extracting RGB signals of the optimal sub-region, converting the RGB signals into HSV signals, and taking the motion trail of the nose tip part as motion signals; carrying out self-adaptive filtering on the chrominance signal and the motion signal, and taking the filtered chrominance signal as an input signal of each subregion; then, processing input signals of all sub-regions by adopting multivariate singular spectrum decomposition and obtaining decomposed signal data sets of all sub-regions; screening a first decomposition signal of each subarea, recording the first decomposition signal as a candidate heart rate signal, then calculating the energy ratio of main frequency and second harmonic frequency of all candidate heart rate signals, screening the candidate heart rate signal with the largest energy ratio as a pulse signal, calculating a heart rate value according to the main frequency value of the signal, and then selecting an abnormal value according to heart rate continuity and replacing the abnormal value with a correct heart rate value. Specifically, the method comprises the following steps:
step 1: the method comprises the steps of acquiring 60s T frames of video data of a subject, dividing the video data into L parts, wherein L =7, and each part of the data comprises N frames of video images.
Step 2: for the l N frame video image, a rectangular frame was obtained using the Viola-Jones face Detector scaled to 60% to remove non-skin areas such as background and hair. The entire ROI region is then divided into Q =4 × 4 block sub-regions, and the four vertices of each block sub-region are tracked along the video frame using the Kanade-Lucas-Tomasi algorithm as shown in fig. 2 a.
And 3, step 3: calculating the pixel mean value of each sub-region in the l N-th frame of video image frame by frame, calculating the illumination intensity, illumination change and signal-to-noise ratio of each sub-region as the quality index of judgment according to the pixel mean value of each sub-region, and selecting P =4 optimal sub-regions from Q sub-regions, as shown in FIG. 2 b. And extracting RGB channel mean value signals from the P optimal sub-regions and converting the RGB channel mean value signals into HSV signals, wherein the HSV signals are compared with the RGB image domain to the HSV image domainCompared with the conversion, the conversion speed between the signals is faster, and the real-time application can be realized. Extracting a chrominance signal in the HSV signal and recording the chrominance signal as H l ={h l,1 ,h l,2 ,...,h l,p ,...,h l,P },h l,p The chroma signal of the P-th optimal subarea of the l N-frame video image is 1 < P < P. The chrominance signal is selected to replace the green signal because the chrominance signal is more resistant to variations in light. In the case of varying light, the color space of the green channel depends not only on the color of the object, but also on the intensity of the reflected light from the surface. In contrast, chrominance signals are not dependent on luminance. This means that the tint signal is more tolerant of changes in ambient light.
And 4, step 4: detecting human face characteristic points of the first N frames of video images frame by adopting an Openface method, and recording motion track signals of the nose tip position characteristic points of the first N frames of video images as V l ={v l,1 ,v l,2 ,...,v l,j ,...,v l,N }; wherein v is l,j The position coordinates of the nose tip position feature points in the ith frame video image are obtained;
and 5: using the first motion track signal V l Chrominance signal h for the ith best subregion l,p Performing adaptive filtering LMS processing to remove the first chrominance signal h l,p Due to motion artifacts of the head. Under the condition that the adaptive filtering does not have prior statistical knowledge about the information to be extracted, the processing parameters are continuously updated recursively in the observation process by directly utilizing observation data according to certain criteria, and the change of statistical properties is automatically tracked so as to gradually approach to a certain optimal processing result. Such a processing method is more suitable for the requirements of non-stationary situations and has also proven to be an effective noise cancellation method. Obtaining the first p-th chrominance signal after self-adaptive filtering And is provided with
 Representing pixel values of the P-th chrominance signal after being filtered in the ith frame video image to obtain the P-th chrominance signals after being filtered
 And as the ith input signal data set;
step 6: using singular spectrum decomposition method to make said I input signal data set X l Decomposition into several components:
step 6.1: setting the length of a window to be M, wherein M is less than N/2, defining a parameter K = N-M +1, and filtering the ith p-th chrominance signal according to the length M of the window and the parameter K Generating the ith trace matrix with dimension of M × K
 Then splicing the first P track matrixes to form a Hankel track matrix with dimension of PM multiplied by K
Step 6.2: calculating the first trace matrix Y l Y l T Characteristic value of (D), noted as λ l,1 ,...,λ l,i ,...,λ l,PM Wherein λ is l,i Represents the l trace matrix Y l Y l T The ith eigenvalue of (a); calculating the first trace matrix Y l Y l T Characteristic value λ of l,1 ,...,λ l,i ,...,λ l,PM Is denoted as U l,1 ,...,U l,i ,...,U l,PM Wherein, U l,i Representing the characteristic value lambda l,i The corresponding orthonormal vector. Calculate R = rank (Y) l ) R represents a matrix Y l Rank of (2), calculating principal component
The first hankel locus matrix Y l Decomposition into Y l =Y l,1 +...+Y l,i +...+Y l,R Wherein Y is l,i Represents the ith trace matrix Y l Y l T Ith eigenvalue lambda i A corresponding decomposition matrix, and
step 6.3: partition the I < th > index set { 1., R } into R disjoint subsets I l,i ={i},i=1,2,...,R,I l,i The ith subset is indicated. According to the subset, for the Hankel locus matrix Y l Grouping to obtain the first R group matrix { Y } l,i |1≤i≤R},Y l,i Obtained by step 6.2;
step 6.4: to convert the grouped matrices into time series, the first R is grouped into matrix Y l,i Carrying out diagonal line averaging to obtain the first reconstructed signal Wherein the content of the first and second substances,
 denotes the ith grouping matrix Y l,i Carrying out diagonal line average on the processed one-dimensional signals; in this example, the input signal is decomposed into components using the multivariate singular spectral decomposition method described above. The method can fully utilize the relevance of input signals of different regions and overcome the influence of mode aliasing of the traditional empirical mode decomposition method.
And 7: the first reconstructed signal Grouping, each group containing four signals, the first group of signals
 As the candidate pulse sets, as shown in FIG. 3a, FIG. 3b, FIG. 3c, FIG. 3d, in this exampleFour decomposed signals are extracted to form a candidate pulse set. Calculating the ith candidate heart rate signal of the first group
 And the energy ratio of the second harmonic frequency, thereby selecting the candidate heart rate signal with the largest energy ratio as the pulse signal. As shown in fig. 4a, 4b, 4c, and 4d, each graph corresponds to a single candidate heart rate signal frequency spectrogram, and the black circles correspond to peak frequency points, that is, main frequency points. Converting the pulse signal into a frequency domain form by using fast Fourier transform, thereby obtaining a main frequency f of the pulse signal main Calculating the average heart rate value of the subject of the first N frames of video images to obtain a first heart rate value HR l =f main X 60. The first set of decomposed signals is chosen as candidate pulses and because most of the noise in the chrominance channels has been removed in the previous operation step. Thus, the heartbeat signal is the most significant and correlated oscillating signal in the chrominance channel.
And 8: as shown in FIG. 5a, according to the process from step 2 to step 7, L heart rate value sets { HR } of L video images of N frames are obtained l |l=1,2,…,L};
And step 9: calculating heart rate value HR of the first N frames of video images l Heart rate values HR of N frames of video images of k-th part of the same subject k Absolute error therebetween, is less than the set threshold Th 1 If the value is less than the preset value, the counting value is S +1; otherwise, keeping the count value S unchanged, wherein the initial value of the count value S is 0;
step 10: judging whether the value S is larger than the set threshold Th 2 If yes, then the current HR is set l Considered as valid value and counted in the heart rate candidate set HR, otherwise, the current HR l Not counting the heart rate candidate set HR, and finally determining the reference value HR ref Is the average value of the heart rate candidate set HR;
step 11: obtaining a reference value HR ref And L heart rate value sets { HR l } (l=1,2,...,L) Calculating the current HR l And reference HR ref Absolute error HR therebetween error,l If the absolute error HR error,l Less than or equal to a predetermined threshold value Th 1 Then current HR l Considered as the target HR T Otherwise, the signal is regarded as an abnormal value, and if the signal is an abnormal value, the residual decomposed signal is used as a reference signal Calculating the closest reference value HR ref Heart rate value HR of n,new As target HR T . As shown in FIG. 5b, the target HR from which the abnormal value is removed is obtained according to the heart rate continuity T 。
In order to verify the robustness of the video heart rate algorithm provided by the invention, the invention adopts a public data set COHFACE and a self-acquisition data set BSIPL to perform algorithm verification. In the embodiment, the experimental result is analyzed by comparing the error between the real heart rate of the two data set acquisition videos and the heart rate measured by the algorithm to be tested, and the robustness of the algorithm is evaluated by adopting four evaluation indexes, namely Root Mean Square Error (RMSE), mean Absolute Error (MAE), standard deviation (sd) and correlation coefficient. The method proposed by the present invention was compared with the EEMD-MCCA method, and the results are shown in tables 1 and 2.
TABLE 1 analysis of heart rate measurements by two methods of CoHFACE
| Evaluation index | EEMD-MCCA | MSSA-H |
| Root mean square error (bpm) | 4.81 | 2.19 |
| Mean absolute error (bpm) | 2.08 | 1.25 |
| Standard deviation (bpm) | 4.33 | 1.81 |
| Correlation coefficient | 0.91 | 0.98 |
TABLE 2 analysis of heart rate measurements by BSIPL two methods
| Evaluation index | EEMD-MCCA | MSSA-H |
| Root mean square error (bpm) | 6.14 | 4.00 |
| Mean absolute error (bpm) | 2.95 | 1.81 |
| Standard deviation (bpm) | 5.39 | 3.56 |
| Correlation coefficient | 0.86 | 0.94 |
As can be seen from Table 1, the MSSA-H method has significant improvements in the three indexes of root mean square error, mean absolute error and standard deviation, which are 2.62bpm,0.83bpm and 2.52bpm respectively, and the correlation coefficient is also improved from 0.91 to 0.98, and the results in Table 2 show that the four indexes of MSSA-H are all superior to EEMD-MCCA. The obtained results show that the heart rate value calculated by the method is closer to the heart rate true value, and has better robustness compared with EEMD-MCCA.
In conclusion, the non-contact heart rate detection method based on multivariate singular spectrum analysis, which is provided by the invention, can accurately extract the human heart rate from the video and acquire the video heart rate detection result, and has good robustness.
Claims (1)
1. A non-contact video heart rate detection method based on multivariate singular spectrum decomposition is characterized by comprising the following steps:
step 1: acquiring T frame video data of a subject, dividing the T frame video data into L data in an overlapped manner, wherein each data comprises N frame video images;
step 2: determining a face interested area of the first N frames of video images by adopting a face detection and face tracking method, and dividing the face interested area in each frame of video image into Q sub-areas, wherein L is more than or equal to 1 and less than or equal to L;
and step 3: calculating the pixel mean value of each sub-region in the l N frame video image frame by frame, calculating the illumination intensity, illumination change and signal-to-noise ratio of each sub-region as the judged quality indexes according to the pixel mean value of each sub-region, selecting P optimal sub-regions from Q sub-regions according to the quality indexes of each sub-region, extracting RGB channel mean value signals from the P optimal sub-regions, converting the RGB channel mean value signals into HSV signals, and extracting the HSV signalsChrominance signal, denoted as H l ={h l,1 ,h l,2 ,...,h l,p ,...,h l,P },h l,p The chrominance signal of the P-th optimal subregion of the l N-frame video image is more than 1 and more than P and more than P;
and 4, step 4: detecting human face characteristic points of the first N frames of video images frame by adopting an Openface method, and recording motion track signals of the nose tip position characteristic points of the first N frames of video images as V l ={v l,1 ,v l,2 ,...,v l,j ,...,v l,N }; wherein v is l,j The position coordinates of the nose tip position feature points in the ith frame video image are obtained;
and 5: using the first motion track signal V l Chrominance signal h for the ith optimum subregion of the l l,p Performing adaptive filtering LMS processing to remove the first chrominance signal h l,p To obtain the first p-th filtered chrominance signal And is provided with
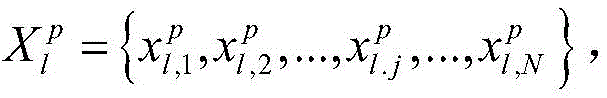
 Representing pixel values of the P-th chrominance signal after being filtered in the ith frame video image to obtain the P-th chrominance signals after being filtered
 And as the ith input signal data set;
step 6: using singular spectrum decomposition method to make said I input signal data set X l Decomposition into several components:
step 6.1: setting the length of a window to be M, wherein M is less than N/2, defining a parameter K = N-M +1, and filtering the ith p-th chrominance signal according to the length M of the window and the parameter K Generating the ith trace matrix with dimension of M × K
 Then splicing the first P track matrixes to form a Hankel track matrix with dimension of PM multiplied by K
Step 6.2: calculating the first trace matrix Y l Y l T Characteristic value of (D), noted as λ l,1 ,...,λ l,i ,...,λ l,PM Wherein λ is l,i Represents the ith trace matrix Y l Y l T The ith feature value of (a); calculating the first trace matrix Y l Y l T Characteristic value λ of l,1 ,...,λ l,i ,...,λ l,PM Is denoted as U l,1 ,...,U l,i ,...,U l,PM Wherein, U l,i Representing a characteristic value λ l,i A corresponding orthonormal vector; calculate R = rank (Y) l ) R represents a matrix Y l Rank of (1), calculating principal component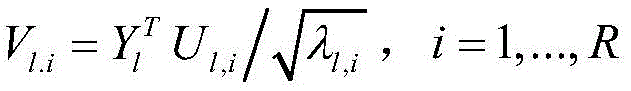
The first hankel locus matrix Y l Decomposition into Y l =Y l,1 +...+Y l,i +...+Y l,R Wherein Y is l,i Represents the l trace matrix Y l Y l T Ith eigenvalue lambda i A corresponding decomposition matrix, and
step 6.3: divide the first index set { 1. -, R } into R disjoint subsets I l,i ={i},i=1,2,...,R,I l,i Represents the ith subset of the first batch; for the Hankel locus matrix Y according to the subset l Is divided intoObtaining the first R group matrix { Y } l,i |1≤i≤R},Y l,i Obtained by step 6.2;
step 6.4: for the first R set of matrix Y l,i Carrying out diagonal line averaging to obtain the first reconstructed signal Wherein the content of the first and second substances,
 denotes the ith grouping matrix Y l,i Carrying out diagonal line average on the processed one-dimensional signals;
and 7: the first reconstructed signal Grouping each group containing four signals, and dividing the first group into four groups
 As a candidate pulse set, calculating the ith candidate heart rate signal of the first group
 The ratio of the energy of the main frequency and the second harmonic frequency, thereby selecting the candidate heart rate signal with the maximum energy ratio as the pulse signal, and converting the pulse signal into a frequency domain form by utilizing fast Fourier transform, thereby obtaining the main frequency f of the pulse signal main Calculating the average heart rate value of the subject of the first N frames of video images to obtain a first heart rate value HR l =f main ×60;
And 8: for the process according to the steps 2 to 7, obtaining L heart rate value sets { HR ] of L N frame video images l |l=1,2,…,L};
And step 9: calculating the heart rate value HR of the first N frames of video images l Heart rate values HR of N frames of video images of k-th part of the same subject k Whether or not the absolute error therebetween is smaller than the set threshold value Th 1 If the ratio is less than the above range,the counting value S +1 is set; otherwise, keeping the count value S unchanged, wherein the initial value of the count value S is 0;
step 10: judging whether the count value S is larger than the set threshold Th 2 If yes, then the first heart rate value HR is set l Taking the heart rate as an effective value and recording the effective value into a heart rate candidate set HR, otherwise, judging the next heart rate value; so as to obtain the final heart rate candidate set HR, and calculating the average value thereof as the reference value HR ref ;
Step 11: according to the reference value HR ref And L heart rate value sets { HR l } (l=1,2,...,L) Calculating the first heart rate value HR l And reference HR ref Absolute error HR therebetween error,l If the absolute error HR is large error,l Less than or equal to a predetermined threshold value Th 1 The ith heart rate value HR l As target HR T Otherwise, the value is regarded as an abnormal value;
if the first heart rate value HR l If the value is abnormal, the signal is decomposed from the rest To calculate the closest reference value HR ref Heart rate value HR of n,new As a target HR T 。
Priority Applications (1)
| Application Number | Priority Date | Filing Date | Title |
|---|---|---|---|
| CN202210655752.6A CN115153473B (en) | 2022-06-10 | 2022-06-10 | Non-contact heart rate detection method based on multivariate singular spectrum analysis |
Applications Claiming Priority (1)
| Application Number | Priority Date | Filing Date | Title |
|---|---|---|---|
| CN202210655752.6A CN115153473B (en) | 2022-06-10 | 2022-06-10 | Non-contact heart rate detection method based on multivariate singular spectrum analysis |
Publications (2)
| Publication Number | Publication Date |
|---|---|
| CN115153473A true CN115153473A (en) | 2022-10-11 |
| CN115153473B CN115153473B (en) | 2024-04-19 |
Family
ID=83485307
Family Applications (1)
| Application Number | Title | Priority Date | Filing Date |
|---|---|---|---|
| CN202210655752.6A Active CN115153473B (en) | 2022-06-10 | 2022-06-10 | Non-contact heart rate detection method based on multivariate singular spectrum analysis |
Country Status (1)
| Country | Link |
|---|---|
| CN (1) | CN115153473B (en) |
Cited By (1)
| Publication number | Priority date | Publication date | Assignee | Title |
|---|---|---|---|---|
| CN116433538A (en) * | 2023-06-15 | 2023-07-14 | 加之创(厦门)科技有限公司 | Image processing method, medium and device for video image health monitoring |
Citations (9)
| Publication number | Priority date | Publication date | Assignee | Title |
|---|---|---|---|---|
| US20170367590A1 (en) * | 2016-06-24 | 2017-12-28 | Universita' degli Studi di Trento (University of Trento) | Self-adaptive matrix completion for heart rate estimation from face videos under realistic conditions |
| KR20180055020A (en) * | 2016-11-15 | 2018-05-25 | 금오공과대학교 산학협력단 | Noncontact bio-signal measurement method using SVD(Singular Value Decomposition) |
| CN110269600A (en) * | 2019-08-06 | 2019-09-24 | 合肥工业大学 | Based on polynary empirical mode decomposition and the contactless video heart rate detection method for combining blind source separating |
| WO2019202671A1 (en) * | 2018-04-17 | 2019-10-24 | Nec Corporation | Pulse rate estimation apparatus, pulse rate estimation method, and computer-readable storage medium |
| CN112001862A (en) * | 2020-08-26 | 2020-11-27 | 合肥工业大学 | Non-contact type apparent heart rate detection method for eliminating motion noise of video impact signal |
| CN112043257A (en) * | 2020-09-18 | 2020-12-08 | 合肥工业大学 | Non-contact video heart rate detection method for motion robustness |
| KR102215557B1 (en) * | 2019-12-18 | 2021-02-15 | (주)감성과학연구센터 | Heart rate estimation based on facial color variance and micro-movement |
| CN113786191A (en) * | 2021-09-22 | 2021-12-14 | 吉林大学 | Heart impact signal denoising method based on multi-channel singular spectrum analysis |
| US20210386307A1 (en) * | 2017-09-15 | 2021-12-16 | University Of Maryland, College Park | System and method for heart rate measurement using facial video |
-
2022
- 2022-06-10 CN CN202210655752.6A patent/CN115153473B/en active Active
Patent Citations (9)
| Publication number | Priority date | Publication date | Assignee | Title |
|---|---|---|---|---|
| US20170367590A1 (en) * | 2016-06-24 | 2017-12-28 | Universita' degli Studi di Trento (University of Trento) | Self-adaptive matrix completion for heart rate estimation from face videos under realistic conditions |
| KR20180055020A (en) * | 2016-11-15 | 2018-05-25 | 금오공과대학교 산학협력단 | Noncontact bio-signal measurement method using SVD(Singular Value Decomposition) |
| US20210386307A1 (en) * | 2017-09-15 | 2021-12-16 | University Of Maryland, College Park | System and method for heart rate measurement using facial video |
| WO2019202671A1 (en) * | 2018-04-17 | 2019-10-24 | Nec Corporation | Pulse rate estimation apparatus, pulse rate estimation method, and computer-readable storage medium |
| CN110269600A (en) * | 2019-08-06 | 2019-09-24 | 合肥工业大学 | Based on polynary empirical mode decomposition and the contactless video heart rate detection method for combining blind source separating |
| KR102215557B1 (en) * | 2019-12-18 | 2021-02-15 | (주)감성과학연구센터 | Heart rate estimation based on facial color variance and micro-movement |
| CN112001862A (en) * | 2020-08-26 | 2020-11-27 | 合肥工业大学 | Non-contact type apparent heart rate detection method for eliminating motion noise of video impact signal |
| CN112043257A (en) * | 2020-09-18 | 2020-12-08 | 合肥工业大学 | Non-contact video heart rate detection method for motion robustness |
| CN113786191A (en) * | 2021-09-22 | 2021-12-14 | 吉林大学 | Heart impact signal denoising method based on multi-channel singular spectrum analysis |
Non-Patent Citations (4)
| Title |
|---|
| XUN CHEN等: "Video-Based Heart Rate Measurement: Recent Advances and Future Prospects", IEEE TRANSACTIONS ON INSTRUMENTATION AND MEASUREMENT, 1 October 2019 (2019-10-01), pages 3600 - 3615, XP011745595, DOI: 10.1109/TIM.2018.2879706 * |
| 张家成;邱天爽;马济通;: "基于改进色度模型的非接触式心率检测与估计", 中国生物医学工程学报, no. 06, 20 December 2017 (2017-12-20), pages 4 - 9 * |
| 成娟 等: "基于多区域分析的非接触式热红外视频心率检测方法", 生物医学工程研究, 25 March 2021 (2021-03-25), pages 21 - 27 * |
| 欧卫华;刘萍;周永辉;曹永锋;熊祥光;: "视频心率检测中兴趣区域选择研究", 贵州师范大学学报(自然科学版), no. 03, 12 May 2018 (2018-05-12), pages 82 - 87 * |
Cited By (1)
| Publication number | Priority date | Publication date | Assignee | Title |
|---|---|---|---|---|
| CN116433538A (en) * | 2023-06-15 | 2023-07-14 | 加之创(厦门)科技有限公司 | Image processing method, medium and device for video image health monitoring |
Also Published As
| Publication number | Publication date |
|---|---|
| CN115153473B (en) | 2024-04-19 |
Similar Documents
| Publication | Publication Date | Title |
|---|---|---|
| CN110269600B (en) | Non-contact video heart rate detection method based on multivariate empirical mode decomposition and combined blind source separation | |
| Feng et al. | Dynamic ROI based on K-means for remote photoplethysmography | |
| CN109820499B (en) | High anti-interference heart rate detection method based on video, electronic equipment and storage medium | |
| CN110367950A (en) | Contactless physiologic information detection method and system | |
| CN105989357A (en) | Human face video processing-based heart rate detection method | |
| Song et al. | Remote photoplethysmography with an EEMD-MCCA method robust against spatially uneven illuminations | |
| CN111243739A (en) | Anti-interference physiological parameter telemetering method and system | |
| CN112043257B (en) | Non-contact video heart rate detection method for motion robustness | |
| CN111387959A (en) | Non-contact physiological parameter detection method based on IPPG | |
| Wedekind et al. | Automated identification of cardiac signals after blind source separation for camera-based photoplethysmography | |
| CN115153473B (en) | Non-contact heart rate detection method based on multivariate singular spectrum analysis | |
| CN113591769B (en) | Non-contact heart rate detection method based on photoplethysmography | |
| CN111839492A (en) | Heart rate non-contact type measuring method based on face video sequence | |
| CN112001862B (en) | Non-contact type apparent heart rate detection method for eliminating motion noise of video heart impact signal | |
| US11701015B2 (en) | Computer-implemented method and system for direct photoplethysmography (PPG) with multiple sensors | |
| US20200359922A1 (en) | Computer-implemented method and system for contact photoplethysmography (ppg) | |
| CN110602978A (en) | System and method for extracting physiological information from video sequence | |
| Hu et al. | Illumination robust heart-rate extraction from single-wavelength infrared camera using spatial-channel expansion | |
| CN114246570B (en) | Near-infrared heart rate detection method by fusing peak signal-to-noise ratio and Peerson correlation coefficient | |
| CN114387479A (en) | Non-contact heart rate measurement method and system based on face video | |
| KR20220098701A (en) | Device and method for camera based photoplethysmogram estimation using chrominance | |
| Ben Salah et al. | Contactless heart rate estimation from facial video using skin detection and multi-resolution analysis | |
| Borzov et al. | Heart rate intellectual analysis by structural decomposition methods of photoplethysmography signals | |
| CN114431849B (en) | Aquatic animal heart rate detection method based on video image processing | |
| Wu et al. | Roi selected by pixel2pixel for measuring heart rate based on ippg |
Legal Events
| Date | Code | Title | Description |
|---|---|---|---|
| PB01 | Publication | ||
| PB01 | Publication | ||
| SE01 | Entry into force of request for substantive examination | ||
| SE01 | Entry into force of request for substantive examination | ||
| GR01 | Patent grant |