CN114830175A - Automated tumor identification and segmentation using medical images - Google Patents
Automated tumor identification and segmentation using medical images Download PDFInfo
- Publication number
- CN114830175A CN114830175A CN202080087958.2A CN202080087958A CN114830175A CN 114830175 A CN114830175 A CN 114830175A CN 202080087958 A CN202080087958 A CN 202080087958A CN 114830175 A CN114830175 A CN 114830175A
- Authority
- CN
- China
- Prior art keywords
- tumor
- segmentation
- subject
- organ
- medical images
- Prior art date
- Legal status (The legal status is an assumption and is not a legal conclusion. Google has not performed a legal analysis and makes no representation as to the accuracy of the status listed.)
- Pending
Links
Images


Classifications
-
- G—PHYSICS
- G06—COMPUTING; CALCULATING OR COUNTING
- G06T—IMAGE DATA PROCESSING OR GENERATION, IN GENERAL
- G06T7/00—Image analysis
- G06T7/0002—Inspection of images, e.g. flaw detection
- G06T7/0012—Biomedical image inspection
- G06T7/0014—Biomedical image inspection using an image reference approach
- G06T7/0016—Biomedical image inspection using an image reference approach involving temporal comparison
-
- G—PHYSICS
- G06—COMPUTING; CALCULATING OR COUNTING
- G06T—IMAGE DATA PROCESSING OR GENERATION, IN GENERAL
- G06T7/00—Image analysis
- G06T7/0002—Inspection of images, e.g. flaw detection
- G06T7/0012—Biomedical image inspection
-
- A—HUMAN NECESSITIES
- A61—MEDICAL OR VETERINARY SCIENCE; HYGIENE
- A61B—DIAGNOSIS; SURGERY; IDENTIFICATION
- A61B5/00—Measuring for diagnostic purposes; Identification of persons
- A61B5/48—Other medical applications
- A61B5/4848—Monitoring or testing the effects of treatment, e.g. of medication
-
- G—PHYSICS
- G06—COMPUTING; CALCULATING OR COUNTING
- G06T—IMAGE DATA PROCESSING OR GENERATION, IN GENERAL
- G06T7/00—Image analysis
- G06T7/10—Segmentation; Edge detection
- G06T7/11—Region-based segmentation
-
- G—PHYSICS
- G06—COMPUTING; CALCULATING OR COUNTING
- G06T—IMAGE DATA PROCESSING OR GENERATION, IN GENERAL
- G06T7/00—Image analysis
- G06T7/10—Segmentation; Edge detection
- G06T7/12—Edge-based segmentation
-
- G—PHYSICS
- G06—COMPUTING; CALCULATING OR COUNTING
- G06T—IMAGE DATA PROCESSING OR GENERATION, IN GENERAL
- G06T7/00—Image analysis
- G06T7/10—Segmentation; Edge detection
- G06T7/136—Segmentation; Edge detection involving thresholding
-
- G—PHYSICS
- G06—COMPUTING; CALCULATING OR COUNTING
- G06T—IMAGE DATA PROCESSING OR GENERATION, IN GENERAL
- G06T7/00—Image analysis
- G06T7/60—Analysis of geometric attributes
- G06T7/62—Analysis of geometric attributes of area, perimeter, diameter or volume
-
- G—PHYSICS
- G06—COMPUTING; CALCULATING OR COUNTING
- G06T—IMAGE DATA PROCESSING OR GENERATION, IN GENERAL
- G06T7/00—Image analysis
- G06T7/70—Determining position or orientation of objects or cameras
-
- G—PHYSICS
- G06—COMPUTING; CALCULATING OR COUNTING
- G06T—IMAGE DATA PROCESSING OR GENERATION, IN GENERAL
- G06T2207/00—Indexing scheme for image analysis or image enhancement
- G06T2207/10—Image acquisition modality
- G06T2207/10072—Tomographic images
- G06T2207/10081—Computed x-ray tomography [CT]
-
- G—PHYSICS
- G06—COMPUTING; CALCULATING OR COUNTING
- G06T—IMAGE DATA PROCESSING OR GENERATION, IN GENERAL
- G06T2207/00—Indexing scheme for image analysis or image enhancement
- G06T2207/10—Image acquisition modality
- G06T2207/10072—Tomographic images
- G06T2207/10088—Magnetic resonance imaging [MRI]
-
- G—PHYSICS
- G06—COMPUTING; CALCULATING OR COUNTING
- G06T—IMAGE DATA PROCESSING OR GENERATION, IN GENERAL
- G06T2207/00—Indexing scheme for image analysis or image enhancement
- G06T2207/20—Special algorithmic details
- G06T2207/20021—Dividing image into blocks, subimages or windows
-
- G—PHYSICS
- G06—COMPUTING; CALCULATING OR COUNTING
- G06T—IMAGE DATA PROCESSING OR GENERATION, IN GENERAL
- G06T2207/00—Indexing scheme for image analysis or image enhancement
- G06T2207/20—Special algorithmic details
- G06T2207/20076—Probabilistic image processing
-
- G—PHYSICS
- G06—COMPUTING; CALCULATING OR COUNTING
- G06T—IMAGE DATA PROCESSING OR GENERATION, IN GENERAL
- G06T2207/00—Indexing scheme for image analysis or image enhancement
- G06T2207/20—Special algorithmic details
- G06T2207/20081—Training; Learning
-
- G—PHYSICS
- G06—COMPUTING; CALCULATING OR COUNTING
- G06T—IMAGE DATA PROCESSING OR GENERATION, IN GENERAL
- G06T2207/00—Indexing scheme for image analysis or image enhancement
- G06T2207/20—Special algorithmic details
- G06T2207/20084—Artificial neural networks [ANN]
-
- G—PHYSICS
- G06—COMPUTING; CALCULATING OR COUNTING
- G06T—IMAGE DATA PROCESSING OR GENERATION, IN GENERAL
- G06T2207/00—Indexing scheme for image analysis or image enhancement
- G06T2207/30—Subject of image; Context of image processing
- G06T2207/30004—Biomedical image processing
- G06T2207/30096—Tumor; Lesion
Abstract
Inputting the medical image into a detection network to generate a mask identifying a set of regions within the medical image, wherein the detection network predicts that each region identified in the mask includes a delineation of a tumor of the one or more tumors within the subject. For each region, processing the region of the medical image using a tumor segmentation network to generate one or more tumor segmentation boundaries for the tumor present within a subject. For each tumor and by using a plurality of organ-specific segmentation networks, an organ within which at least a portion of the tumor is located is determined. Generating an output based on the one or more tumor segmentation boundaries and a location of the organ within which at least a portion of the one or more tumors are located.
Description
Cross Reference to Related Applications
This application claims benefit and priority from U.S. provisional application No. 62/952,008 filed on 20/12/2019 and U.S. provisional application No. 62/990,348 filed on 16/3/2020. Each of these applications is hereby incorporated by reference herein in its entirety for all purposes.
Background
Medical imaging (e.g., CT scan, X-ray or MRI scan) is widely used for tumor detection to aid in the diagnosis and treatment of cancers (e.g., lung cancer, breast cancer, etc.). In many cases, health care professionals assess the efficacy of drugs and/or treatment regimens by measuring changes in tumor size or volume. Solid tumor efficacy evaluation criteria (RECIST) is a standardized method for assessing efficacy in cancer subjects and is part of regulatory standards for the approval of new tumor drugs. RECIST requires a significant amount of time for a trained professional (e.g., a radiologist). In particular, the annotator is manually operated (e.g. by a radiologist) to identify up to 5 target lesions and up to 10 non-target lesions. The annotator will identify the perimeter of each target lesion in each scan depicting a cross section of the target lesion and record the cross-sectional diameter of each target lesion. A quantitative measure (e.g., the sum of the longest diameters) is then determined for all target lesions. Non-target lesions were assessed qualitatively, indicating whether non-target lesions were observed in the scan, and whether there was a clear change. Scans may be acquired at multiple time points, and metrics for target and non-target lesions may be determined for each time point. Changes in the metric over a period of time can then be used to assess disease progression and/or to what extent effective treatment is.
RECIST, however, includes several limitations. That is, this approach does not consider the overall disease "burden" as RECIST often measures only a small fraction of the tumors per subject (e.g., less than 5-10). Given that only up to 5 tumors are tracked in size, this technique cannot accurately assess disease progression and/or treatment efficacy in subjects where the cancer has metastasized to a large number of lesions (e.g., more than 5 lesions). Furthermore, there is also inconsistency in the selection of target lesions due to variability in lesion selection, which leads to significant variability within and between readers, resulting in different assessments of tumor burden even in the same subject. For example, a set of different lesions may be identified (e.g., inadvertently) at different points in time. Many tumors often have heterogeneous appearances in CT and vary in location, size, and shape. For example, lung lesions may be cavitated or calcified, and bone metastases may take the form of hemolysis (destruction of bone tissue) or blowout (abnormal bone growth), for example, where each lesion type is associated with a different structural and visual appearance, making it difficult to assess the stage of the disease and/or each lesion of that lesion type without obtaining a complete reading due to the high variability of the lesion. Therefore, it would be advantageous to use a more comprehensive data set and more objective techniques to identify automated techniques for assessing tumor growth and/or metastasis.
The present disclosure attempts to address at least the above limitations by providing an automated method of tumor detection and measurement that is both consistent and takes into account the overall disease burden of the subject.
Disclosure of Invention
The technology described herein discloses a method of identifying and segmenting a biological object using one or more medical images.
In some embodiments, a computer-implemented method is provided in which at least one or more medical images of a subject are accessed. The one or more medical images are processed
The input is into a detection network to generate one or more masks that identify a set of regions within the one or more images. The detection network predicts that each region in the set of regions identified in the one or more masks includes a delineation of a tumor within the subject. For each region of the set of regions, the region of the one or more medical images is processed using a tumor segmentation network to generate one or more tumor segmentation boundaries for a tumor present within the subject. For each of the one or more tumors and by using the plurality of organ-specific segmentation networks, an organ within which at least a portion of the tumor is located is determined. An output is then generated based on the one or more tumor segmentation boundaries and the organ location.
In some embodiments, another computer-implemented method is provided in which one or more medical images of a subject are accessed. A set of organ locations for a set of tumor lesions present in one or more medical images is also accessed. One or more medical images and a set of organ positions are input into a network associated with one of a plurality of therapeutic treatments to generate a score that indicates whether the subject is a good candidate for a particular treatment relative to other previous subjects that have undergone the treatment. The score is then returned to assess the feasibility of the subject and each of the plurality of treatments.
In some embodiments, a system is provided, comprising: one or more data processors; and a non-transitory computer-readable storage medium containing instructions that, when executed on the one or more data processors, cause the one or more data processors to perform some or all of one or more methods disclosed herein.
In some embodiments, a computer program product is provided that is tangibly embodied in a non-transitory machine-readable storage medium and that includes instructions configured to cause one or more data processors to perform some or all of one or more methods disclosed herein.
Drawings
The disclosure is described in connection with the following figures:
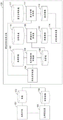
FIG. 1A illustrates an exemplary interactive system for using, acquiring, and processing medical images using a multi-stage neural network platform.
FIG. 1B illustrates an exemplary image stack including a set of patches and bounding boxes for a detected biological object.
Fig. 2 illustrates an exemplary system for generating one or more pairwise comparisons between two or more subjects.
Fig. 3 illustrates an exemplary method for processing medical images using a multi-stage neural network platform.
Fig. 4 shows an exemplary set of images for tumor detection. The left-most plot depicts a whole-body scan of the pre-processed axial slice, while the right plot depicts the detected bounding box that is automatically generated and labeled by the bounding box detection network for the lung, liver, and mediastinal regions within the axial slice.
Fig. 5 shows an example of tumor segmentation using an axial CT scan. Each of the top panels depicts a defined region of the tumor. The corresponding bottom graph depicts an exemplary segmentation boundary of a tumor.
Fig. 6A-6B illustrate graphs comparing manual evaluation using RECIST with an automated method for an exemplary training set. FIG. A: comparison of the number of lesions identified, panel B: comparison of the determined Longest Diameter Sums (SLDs).
7A-7B illustrate graphs comparing manual evaluation using RECIST with an automated method for an exemplary test set. FIG. A: comparison of the number of lesions identified, panel B: comparison of the determined SLD.
Fig. 8 illustrates a graph comparing the number of lesions identified using a full read performed by a radiologist to the number of lesions identified using an automated method of an exemplary training set.
Fig. 9 illustrates a graph comparing the volume of a lesion identified using a full read performed by one or more radiologists to the volume of a lesion identified using an automated method of an exemplary training set.
10A-10B illustrate graphs comparing mean and median volumes of lesions identified using a complete read to volumes of lesions identified using an automated method of an exemplary training set. FIG. A: the volume data were averaged. And B: median volume data.
11A-11C illustrate Kaplan-Meier curves for an exemplary training set. FIG. A: RECIST-derived SLD by manual evaluation, divided into quartiles based on derived SLD, panel B: the number of lesions, derived by RECIST, assessed manually, was divided into quartiles based on the number of lesions. And (C) figure: the total SLD, derived by an automated method, is not quartile based on the derived total SLD.
FIGS. 12A-12B illustrate Kaplan-Meier curves for an exemplary training set. FIG. A: the total volume obtained by the automated method is divided by quartiles, graph B: the number of lesions obtained by an automated method is divided by quartiles.
Fig. 13A-13B illustrate Kaplan-Meier curves for an exemplary training set using lesions located within the lung region. FIG. A: volume of lung lesions obtained by automated method, divided by quartile, graph B: the number of lung lesions obtained by an automated method is divided by quartiles.
FIGS. 14A-14B illustrate Kaplan-Meier curves for an exemplary training set. FIG. A: liver involvement measures, derived by automated methods, were divided by quartile, panel B: bone involvement measurements, derived by automated methods, were divided by quartile.
FIGS. 15A-15B illustrate Kaplan-Meier curves for an exemplary validation set. FIG. A: SLD by RECIST of manual evaluation, divided by quartile, panel B: the number of lesions, obtained by RECIST by manual assessment, was divided by quartile.
FIGS. 16A-16C illustrate Kaplan-Meier curves for an exemplary validation set. FIG. A: SLD by manual evaluation RECIST, divided by quartile, panel B: total SLD, obtained by an automated method, is divided by quartile, graph C: the total volume obtained by the automated method is divided by quartiles.
FIGS. 17A-17B illustrate Kaplan-Meier curves for an exemplary validation set. FIG. A: total tumor volume, obtained by automated methods, was divided by quartile, panel B: the number of lesions obtained by an automated method is divided by quartiles.
18A-18B illustrate Kaplan-Meier curves using lesions located within lung regions for an exemplary validation set. FIG. A: volume of lung lesions obtained by automated method, divided by quartile, graph B: the number of lung lesions obtained by an automated method is divided by quartiles.
FIG. 19 illustrates a Kaplan-Meier curve for kidney involvement metrics derived by an automated method for an exemplary validation set. Kidney affected data is divided by quartiles.
Fig. 20 shows an example of tumor detection and segmentation from an axial CT scan using an automated detection and segmentation method. The upper left figure shows three lesions detected in the liver and the associated lesion segmentation in the lower figure. Likewise, the top right diagram shows four lesions detected in the lung/mediastinum and their associated segmentation. The two examples in the bottom panel show lesions detected in the renal and pulmonary spaces, respectively.
FIG. 21 illustrates an example of segmentation, with each row from left to right: radiologist annotation, probability. UNet β ═ 10, probability. UNet β ═ 2, the union of the tumor segmentation networks, implemented as probability UNet.
FIGS. 22A-22B illustrate Kaplan-Meier curves for another exemplary test set. FIG. A: SLD by manual evaluation RECIST, divided by quartile, panel B: SLD by an automated method, divided by quartile.
In the drawings, similar parts and/or features may have the same reference numerals. Further, various parts of the same type may be distinguished by following the reference label by a dash and a second label that distinguishes among the similar parts. If only the first reference label is used in the specification, the description is applicable to any one of the similar parts having the same first reference label irrespective of the second reference label.
Detailed Description
I.SUMMARY
Recent image analysis efforts have focused on developing automated algorithms that can assist radiologists' workflow by performing tumor detection and segmentation. Recent approaches have focused on detecting and/or segmenting RECIST lesions in a single axial CT partition. These recent efforts have been limited due to tumor screening by dividing tumors only on a single slice or in a single organ (e.g., lung), while later-stage subjects will suffer from higher and more variable tumor burden.
As described herein, techniques are used to analyze one or more image scans (e.g., such as CT scans or MRI scans) of a subject. Each image scan may include a set of images corresponding to a different slice (e.g., a different axial slice). For each of the images of the image scan, the first neural network may be used to detect each region that includes a depiction of a particular type of biological object (e.g., a tumor). The first neural network (i.e., the bounding box detection neural network) may include a convolutional neural network and/or a three-dimensional neural network, such as RetinaNet. The first neural network may be configured to define each region as a bounding box that includes the depicted biological object and a potential predefined size of padding (e.g., such that the width of the box is defined as the estimated maximum width of the biological-object delineation plus twice the padding). The first neural network may be configured to process image scans with individual focal points (e.g., define regions for each individual image), but to provide context using a scan depicting a slice above the individual scan and another scan depicting a slice below the individual scan.
A second neural network (e.g., a segmentation neural network) may be configured to process a smaller portion of the image scan to segment the individual objects. More specifically, one or more cropped portions of the image processed by the first neural network may be input to the second neural network. Each crop may correspond to a bounding box defined for a particular image. The cropped portion may have, for example, an area equal to the area of the bounding box or an area equal to the area of the bounding box plus padding. The second neural network may be configured to receive corresponding portions from other images representing adjacent slices. The second neural network may include a convolutional and/or three-dimensional neural network, such as UNet. For each box, the output of the second neural network may identify a set of pixels estimated to correspond to a perimeter or area of a cross section of the object cross section depicted in the image.
In some cases, the object segmentation is aligned and/or smoothed over the image. A three-dimensional representation of the individual objects may then be obtained.
A neural network (e.g., a first neural network, a second neural network, or another neural network) may be configured to estimate an environment of the subject. For example, the network may output a probability that the biological object is within a lung, liver, bone, mediastinum, or other location of the subject. The probabilities can be evaluated independently (e.g., then the probabilities need not sum to 1 among the various probabilities). The prediction context may facilitate segmentation, alignment, and/or other processing. For example, a particular type of biological object (e.g., a tumor) may often have different characteristics in different environments. Thus, the environment prediction may inform what type of image features are used to generate object segmentation and/or perform other image processing. In some cases, the network outputs an estimated probability that the image truly depicts an object of a particular type.
In some cases, the third neural network may determine the environment of the biological object by performing a second segmentation of the target location within the image. For example, the third neural network may output a segmentation (e.g., in the form of a two-dimensional and/or three-dimensional mask) of the lung, liver, kidney, and/or another location corresponding to the subject. In some cases, a third neural network may be trained to segment a single target location, and additional neural networks may be configured to segment additional target locations. For example, a third neural network may output a segmentation of the lungs, a fourth neural network may output a segmentation of the liver, and a fifth neural network may output a segmentation of the kidneys.
Using two-dimensional segmentation or three-dimensional segmentation, one or more object-specific statistics may be generated to characterize each estimated object depiction. The one or more object-specific statistics may include, for example, an area, a length of a longest dimension, or a circumference boundary. One or more scan specific statistics may be generated for each scan. The scan-specific statistics may include, for example, a number of objects detected per scan, statistics based on the number of objects detected per scan (e.g., an average, median, or maximum), statistics based on the object-specific statistics (e.g., an average, median, or maximum), or statistics based on the volume of objects detected in each scan (e.g., an average, median, or maximum). Subject-level statistics may further be generated for a given subject, such as, for example, a total number of objects detected in all scans (e.g., associated with the given subject), a sum of longest dimension lengths of the objects detected in all scans, and/or a cumulative volume of the objects detected in all scans.
Scan-specific, object-specific statistics and/or subject-level statistics may be output. In some cases, the statistical data may be stored in association with a time point and a subject identifier. The statistics can then be tracked and compared over time to estimate the extent of progression of the medical condition, the efficacy of a given treatment, and/or the prognosis for a given subject.
Definition of
As used herein, "medical image" refers to an image of the internal body of a subject. The medical image may include a CT image, an MRI image, and/or an X-ray image. The medical image may depict a portion of a tissue, organ, and/or entire anatomical region of a subject. The medical image may depict a portion of the torso, chest, abdomen, and/or pelvis of the subject. The medical image may depict the whole body of the subject. The medical image may comprise a two-dimensional image.
As used herein, "whole-body imaging" refers to the acquisition of a set of images that collectively depict the whole body of a subject. The set of images may include images associated with a virtual "slice" spanning from a first end (e.g., a front end) to a second end (e.g., a back end) of the subject. The set of images may include virtual slices of at least a brain region, a chest region, an abdominal region, and a pelvic region of the subject.
As used herein, an "image stack" refers to a set of images depicting a set of adjacent virtual slices. Thus, the set of images may be associated with different depths (for example). The image stack may comprise, for example, at least 2 images or at least 3 images. The image stack may include a bottom image, an intermediate image, and a top image, wherein a depth associated with the intermediate image is between a depth of the bottom image and a depth of the top image. The bottom image and the top image may be used to provide context information related to intermediate image processing.
As used herein, a "biological object" (e.g., also referred to as a "subject") refers to a biological structure and/or one or more target regions associated with the biological structure. Exemplary biological structures may include one or more biological cells, organs, and/or tissues of a subject. Objects may include, but are not limited to, these identified biological structures and/or similar structures within or attached to the identified biological structures (e.g., a plurality of tumor cells and/or tissues identified within a larger normal cell body, an organ and/or tissue of a subject).
As used herein, "mask" refers to an image or other data file representing a surface region or other target region of an object under inspection. The mask may include pixels with non-zero intensity to indicate one or more target regions (e.g., one or more detected objects) and pixels with zero intensity to indicate the background.
As used herein, a "binary mask" refers to a mask in which each pixel value is one of two values (e.g., 0 or 1). A zero intensity value may indicate that the corresponding pixel is part of the background, and a non-zero intensity value (e.g., a 1 value) may indicate that the corresponding pixel is part of the target region.
As used herein, a "3D mask" refers to the complete surface area of an object within a 3-dimensional image. Multiple binary masks of an object may be combined to form a 3D mask. The 3D mask may additionally provide information about the volume, density and spatial location of the object or other target region.
As used herein, "segmentation" refers to determining the position and shape of an object or target region within a (2-dimensional or 3-dimensional) image or other data file. Segmentation may involve determining a set of pixels that delineate a region or perimeter of an object within an image. Segmentation may involve generating a binary mask of the object. The segmentation may further involve processing a plurality of binary masks corresponding to the object to generate a 3D mask of the object.
As used herein, "segmentation boundary" refers to an estimated perimeter of an object within an image. The segmentation boundary may be generated in a segmentation process in which features of the image are analyzed to determine the location of the object edges. The segmentation boundary may further be represented by a binary mask.
As used herein, "treating" refers to prescribing or administering treatment, medication, and/or radiation, and/or prescribing or performing surgery to treat a medical condition (e.g., to slow the progression of the medical condition, stop the progression of the medical condition, reduce the severity and/or extent of the medical condition, and/or cure the medical condition).
Exemplary interaction System
FIG. 1A illustrates an exemplary interaction system for using, acquiring, and processing medical images to use a multi-level neural network platform. In this particular example, the interactive system is specifically configured to locate and segment a delineation of tumor biological structures and organs within the medical image.
A. Inputting data
One or more imaging systems 101 (e.g., CT machines, MRI machines, and/or X-ray machines) may be used to generate one or more sets of medical images 102 (e.g., CT images, MRI images, and/or X-ray images). The imaging system 101 may be configured to iteratively adjust the focus and/or position as the plurality of images are acquired such that each image of a set of images is associated with a different depth, position, and/or perspective relative to the other images of the set. The imaging system 201 may include a light source (e.g., an electrically powered and/or X-ray source), a light detector (e.g., a camera), lenses, an objective lens, filters, magnets, shim coils (e.g., to correct for inhomogeneities in the magnetic field), a gradient system (e.g., to locate magnetic resonance signals), and/or an RF system (e.g., to excite a sample and detect resulting magnetic resonance signals).
Each set of images 102 may correspond to an imaging session, a session date, and a subject. The subject may comprise a human or animal subject. The subject may have been diagnosed with a particular disease (e.g., cancer) and/or with one or more tumors.
Each set of images 102 may depict the interior of a corresponding subject. In some cases, each image depicts at least one target region of the subject (e.g., one or more organs, a chest region, an abdominal region, and/or a pelvic region).
Each image in the set of images 102 may additionally have the same perspective, such that each image depicts a plane that is parallel to other planes depicted in other images in the set. In some cases, each image in the set of images may correspond to a different distance along an axis that is not parallel (e.g., perpendicular) to the plane. For example, the set of images 102 may correspond to a set of horizontal virtual slices corresponding to different positions along the anterior-posterior axis of the subject. The set of images 102 may be pre-processed (e.g., collectively or individually). For example, the pre-processing may include normalizing pixel intensities, aligning the images with each other or with another reference point/image, cropping the images to a uniform size, and/or adjusting contrast to distinguish between light and dark pixels. In some cases, the set of images 102 may be processed to generate a 3-dimensional (3D) image structure. The 3D image structure may then be used to generate another set of images corresponding to different angles of the virtual slice.
B. Training data
Some of the medical images acquired by at least one of the imaging systems 101 may include training images to be included in a training dataset to train one or more neural networks (e.g., a bounding box detection network and a segmentation network). The training images may be associated with other subjects compared to subjects using the trained network.
Each training image may have one or more characteristics of the medical image 102 described herein and may be associated with annotation data that indicates whether and/or where the image depicts a tumor and/or organ. To identify this annotation data, the images acquired by the imaging system 101 may be used (e.g., transmitted) to the annotator device 103.
The image may be presented at an annotator device 103, and an annotator user (such as a radiologist, for example) may provide input using a mouse, track pad, stylus, and/or keyboard, for example, that indicates whether the image depicts any tumor (or organ of a particular type or types); the number of tumors depicted in the image; the number of tumors that the annotator is annotating (e.g., summarizing); a perimeter of each of one or more tumors and/or one or more organs of a particular type.
Spatial features may additionally be identified for multiple objects. In some cases, the label data 104 may (but need not) identify spatial features of all tumors, organs, and/or other biological objects depicted within the training image. For example, if the training image depicts 10 tumors, the label data 104 may identify the perimeter of each of the 10 tumors, or only the perimeters of 2 of the depicted tumors. In this case, an incomplete subset of objects may be (but need not be) selected based on predefined selection criteria. For example, the annotator user may have been instructed to mark only tumor depictions that meet a threshold tumor length and/or a threshold tumor volume and/or within a target region (e.g., within one or more specific organs).
The tag data 104 may further identify a tumor classification, which may represent the type, location, and/or size of a tumor identified based on input from the annotator. For example, a particular label may indicate that the delineated tumor is within a region of the image 102, such as corresponding to a particular organ (e.g., liver). The tag data 104 may further include a probability that a particular tag actually corresponds to a tumor or target organ. Probability values may be calculated based on tumor length, tumor volume, location with the subject, and/or the number of annotated users that identify a particular tag as corresponding to a tumor or organ.
The label data 104 may be used to train one or more neural networks to detect each region including delineation of a tumor or organ for each image in an image scan. The trained neural network may be configured to describe each region identified as including the delineated tumor or organ by processing image scans having a separate focus using an image stack corresponding to each of the scans (e.g., to define a particular region for each separate image).
C. Bounding box detection network
The neural network processing system 120 may be configured to receive one or more sets of images 102 and corresponding label data 104. Each image of the one or more sets of images may be initially pre-processed by the pre-processing controller 105. For example, one or more images depicting different regions of the subject may be stitched to generate an aggregate image depicting all of the different regions. In some cases, the aggregate image depicts a "whole-body" view of the subject. As another example, one or more images may be scaled and/or cropped to a predefined size. In yet another example, one or more images may be aligned with another image included within the group or a reference image (e.g., using alignment marks in the images, correlation-based techniques, or entropy-based techniques). In another example, the pixel intensities of one or more images may be adjusted via a normalization or normalization method. In some cases, the set of images 102 is not subjected to any preprocessing techniques.
The pre-processed image may be used by the bounding box detection controller 106, which may control and/or perform all of the functions and operations of the bounding box detection network, as described herein. The bounding box detection network may be a convolutional neural network, an inverse-convolutional neural network, or a three-dimensional neural network configured to identify regions (e.g., bounding boxes) within the set of images 102 that include delineations of tumors. The region identified by the bounding box detecting neural network may include one or more rectangular or hyper-rectangular regions.
The bounding box detection controller 106 may train the bounding box detection network using the training images and corresponding annotations to learn a set of detection parameters 107. The detection parameters 107 may include weights between nodes in the convolutional network. A penalty function may be set to introduce a penalty when a portion of the detected bounding box fails to fully encompass delineation of the tumor and/or when fill between another horizontal and/or vertical point is less than a lower threshold and/or greater than an upper threshold. In some cases, the penalty function is configured to penalize bounding boxes that are greater than or less than a predefined scaling range. The penalty function may include a focus loss. Loss of focus (as defined in Lin, t.y., Goyal, p., Girshick, r., He, k., Dollar, p. "Focal loss for dense object detection." ICCV 2017, pp.2980-2988 (2017)), which is incorporated herein by reference in its entirety for all purposes, can be used to address both class imbalances and difficult-to-predict cases resulting from the tag-perceived variability that "refocuses" the training of the detection task into the tumor.
One or more fixed hyper-parameters may be used to train and/or define bounding box detection networks. For example, the hyper-parameters may include a learning rate, a number of nodes per layer, a number of layers, and the like.
The bounding box detection network may detect one or more bounding boxes 108 corresponding to potential delineations of tumors within each of the images 102. The detection of the bounding box may include using the image stack for each image to locate the bounding box. For example, if 100 images (numbered sequentially according to imaging depth) were acquired during a particular imaging session, the image stack may be defined to include a sixth image, a seventh image, and an eighth image when detecting a bounding box within the seventh image. The image stack may include more than one adjacent image in one or more directions (e.g., to include the third through eleventh images when detecting a bounding box within the seventh image).
Features of the image stack are used to provide context information in determining whether and/or where one or more regions include a tumor and/or organ. The features may include three-dimensional features extending across the images within the image stack. For example, if a feature (e.g., a learned feature) exists in a similar location in the entire image stack (e.g., a combination of the top virtual slice, the bottom virtual slice, and the center virtual slice), the bounding box detection network may determine that the image region corresponding to (e.g., including) the feature represents a bounding box of the tumor. As an alternative example, if a feature of a center slice of the image stack is not present in a top slice or a bottom slice of the image stack, the bounding box detection network may determine that the image region corresponding to the feature corresponds to the background of the image (i.e., any biological structure other than a tumor) and does not indicate a bounding box. In some cases, the bounding box detection network may additionally assign a probability value to each detected bounding box. If the probability value of the bounding box does not exceed the threshold, the bounding box may be discarded as background.
The bounding box detection network may further process each detected bounding box 108 such that the margins of the bounding box include at least some amount of fill (e.g., 10px, 15px, or other suitable amount) from each edge of the region corresponding to the tumor. In some cases, the amount of fill is predefined (e.g., to generate an initial box that intersects pixels farthest to the left, top, right, and bottom of the detected object depiction, and to expand the box using the predefined fill or until an image boundary is encountered). In other cases, different degrees of padding are added in order to maintain a uniform bounding box size.
The bounding box data 108 can include a definition for each bounding box (e.g., as two or more angular coordinates, coordinates of one or more edges, etc.) and/or one or more identifiers for the corresponding image or set of images (e.g., identifiers for images, subjects, imaging dates, etc.).
It should be understood that the position of the bounding box in one image may be related to the position of the bounding box in another image. The image stack may be used to convey this dependency, although other processing may be used in addition or alternatively. For example, the input to the bounding box detection neural network may include an identification of each of one or more bounding boxes detected from a previously processed image (corresponding to the same imaging session and the same subject). As another example, the bounding box output may be post-processed to modify (e.g., translate, resize, delete, or add) the bounding box detection corresponding to one image based on the bounding box detection from one or more other adjacent images.
FIG. 1B illustrates an exemplary image stack depicting a set of bounding boxes for a single biological object 125. The image stack may include at least image 121, image 122, and image 123, where each image of the image stack depicts a different axial rendering of a region of the subject. In some cases, the image stack may include additional images not shown in the figures. Each image within the image stack may further include bounding boxes describing possible locations of the biological object 125 within the particular image, such that each bounding box may be related to a corresponding bounding box included in other images within the image stack, as each bounding box identifies the presence of the same biological object 125. For example, image 121 includes a bounding box 121A that covers at least a portion of image 121, and image 122 includes a bounding box 122A that covers at least a corresponding portion of image 122, such that bounding box 121A and bounding box 122A are related bounding boxes and include regions that have been predicted to depict a first possible location and a second possible location of biological object 125 from a first axial perspective and a second axial perspective, respectively. In other cases, the biological object 125 may not be detected within at least a subset (e.g., one or more) of the images within the image stack, and thus the subset of images within the image stack may not include the relevant bounding box of the biological object 125.
Differences may also exist within the exact location (e.g., represented by a set of coordinates), surface area, and/or shape of the relevant bounding box within the image stack. In this example, the surface area of bounding box 121A may be less than the surface area of bounding box 122A because it is estimated that a majority of biological object 125 is located within image 122. The position of each of the relevant bounding boxes may additionally include one or more changes (e.g., in the x-plane, the y-plane, or both) that account for the corresponding position of the same biological object 125 from one or more different axial perspectives of images within the image stack.
In some cases, in response to identifying a set of relevant bounding boxes of the image stack, a detection region is determined for each bounding box in the relevant bounding boxes. For example, the image 121 may include a detection area 121B surrounding a bounding box 121A. The detection region may be the same size and within the same location for each image within the image stack. In some embodiments, the size and location of the detection region may be determined from the location of a bounding box within the center slice of the image stack (e.g., image 122 in this case). The detection region may be configured to include the entirety of each of the identified bounding boxes as well as additional padding. In some cases, the detection region may be determined by another neural network separate from the bounding box detection network.
D. Tumor segmentation network
Referring back to fig. 1A, the bounding box data 108 may be transmitted to a lesion segmentation controller 109, which may control and/or perform all functions or operations of a lesion segmentation network, as described herein. The tumor segmentation network may be trained using a training data set of at least predicted bounding box data determined during training of the bounding box detection network. A set of segmentation parameters 110 (e.g., weights) may be learned during training. In the depicted example, the tumor segmentation network may be, for example, a neuroconvolutional neural network or a three-dimensional neural network configured to detect and segment the delineation of the tumor. In some cases, the tumor segmentation network does not include a neural network, but may use, for example, clustering techniques (e.g., K-means techniques), histogram-based techniques, edge detection techniques, region growing techniques, and/or graph partitioning techniques. The lesion segmentation network may be configured to segment the lesion within each of the detected bounding boxes 108.
For each medical image within the set of images 102, the bounding box 108 includes one or more portions of the image, or the entirety of the image, corresponding to the bounding box, for example, and an identification of the bounding box (e.g., coordinates of vertices and/or edge coordinates) associated with the respective image. In some embodiments, an intermediate process (not shown) may be performed to generate a set of cropped images (e.g., referred to herein as detection regions) that correspond only to the region of the image 102 enclosed by the bounding box 108. In instances where multiple bounding boxes are defined for a given image, the tumor segmentation network may receive each corresponding detection region as input and process the detection regions separately.
The detection region may provide a focused view of the target tumor as depicted in fig. 1B. In some cases, the detection area may have a predefined size. In this case, the detection area may include another set of areas adjacent to the area corresponding to the bounding box as additional padding to maintain the predefined size of the detection area. In other cases, if the bounding box is larger than a predefined size (e.g., 400 pixels or 200 pixels by 200 pixels), the area corresponding to the bounding box is divided into more than one window (e.g., and/or not larger than the predefined size) such that each window corresponds to a separate detection area. In this case, the detection area corresponding to a single bounding box may include an overlapping portion of the image.
If the bounding box extends across the entire image stack (as shown in FIG. 1B), a separate detection region may be defined for each image within the image stack. In some embodiments, the processing of the detection region is performed by the bounding box detection network prior to transmitting the bounding box data 108 to the lesion segmentation controller 109.
The lesion segmentation controller 109 implements a lesion segmentation network configured to further identify and evaluate features (e.g., variations in pixel intensity) of each detection region to identify a perimeter, a set of edges, and/or contours corresponding to the lesion. The features identified by the tumor segmentation network may be similar and/or different than the features identified by the bounding box detection network. Although both networks may be trained to identify regions in the image corresponding to the tumor, different features may help detect relatively small structures compared to relatively large structures. In some cases, the tumor segmentation network may learn the location of the detected object by, for example, analyzing pixel intensity, pixel color, and/or any other suitable image features. As an example, a tumor segmentation network may identify edges of an object by analyzing an image to detect regions with high contrast, large intensity range, and/or high intensity variation (e.g., determined by comparing a region-specific metric to a predetermined threshold). The tumor segmentation network may include nodes (and thus representations of different sets of pixels) corresponding to different receptive fields. Thus, the network may learn to detect and use at least some of the different types of features.
In some cases, the tumor segmentation network may utilize the spatial context provided by other images within the image stack to identify a set of edges and/or contours corresponding to the tumor. The image stack may comprise, for example, three images, wherein the central image is the image in which the tumor is to be detected.
The tumor segmentation network may further generate a 2-dimensional (e.g., binary) tumor mask 110 corresponding to the entire surface area of the tumor within a given detection region using the identified edges and/or contours. The tumor mask 110 may be defined to have a zero value on pixels not identified as delineating any portion of the tumor. Pixels identified as depicting a portion of a tumor may be assigned a value of one (e.g., for a binary mask) or another value.
In some cases, a binary tumor mask 110 is generated for each image in the image stack such that each binary tumor mask 110 corresponds to a different axial perspective of the tumor. In this case, the post-processing controller 111 may aggregate the set of binary tumor masks 110 to construct a 3D tumor mask 110 representing the 3-dimensional location and shape of the tumor.
E. Organ-specific segmentation network
In some cases, the neural network processing system 120 may include an organ segmentation controller 111 configured to implement an organ-specific segmentation network. The organ-specific segmentation network may comprise, for example, a convolutional neural network and/or a three-dimensional neural network. Exemplary convolutional neural networks may include VGG16, U-Net, and/or ResNet18 networks. The organ-specific segmentation network may be configured to analyze a medical image corresponding to a subject and segment one or more organs depicted within the image. In this case, each of the one or more organ-specific segmentation networks may be configured (e.g., via parameters learned during training) to segment a particular type of organ. Exemplary target organs may be, for example, liver, lung, kidney, pancreas, or the like.
In some cases, the organ-specific segmentation network may be configured to perform a series of convolutions, such as depth-wise and point-wise convolutions, as part of the segmentation process. In this case, one or more expansions along a particular dimension may be further performed. The particular dimension may be a third dimension, a fourth dimension, and so on. In some cases, the tumor segmentation network may also apply one or more filters, such as a replication filter.
In the depicted example, the organ segmentation controller 111 may control an organ specific segmentation network configured to detect a specific type of organ. An organ-specific segmentation network may be trained using a training data set comprising training images and annotations indicating which portions within each of at least some of the training images depict a particular type of organ. The training data set may be separate from the training data set used by the bounding box detection network and the tumor segmentation network. The training data set may include a plurality of medical images and corresponding annotations and/or segmentation boundaries (e.g., generated by the annotator device 103) for a particular target organ. A set of organ segmentation parameters 112 (e.g., weights) may be learned during training. In some cases, the pre-processing controller 105 may transmit the same set of medical images 102 to both the bounding box detection controller 106 and the organ segmentation controller 111.
The trained organ-specific segmentation network may be used to process a set of images and/or pre-process each image in the images to detect the organ. The images used to detect a particular type of organ may be the same (or different) than the set of images 102 provided to the bounding box detection controller 106, such that the images are provided to the organ segmentation controller 111 simultaneously. The set of images may be divided into a plurality of (e.g., overlapping) subsets including 1, 2, or 3 images. For example, subsets may be defined as having three images per subset, and each subset is shifted by one image. In some cases, the images may be pre-processed to align the images into a 3D image depicting a "whole-body" view of the subject.
Within each image, the organ-specific segmentation network may indicate whether a given image depicts a particular type of organ, and further identify a perimeter of the depiction of the organ. The output of the organ-specific segmentation network may include an organ mask 113 that has, for example, zero values for pixels that do not depict the organ of the particular type and non-zero values for pixels that depict the organ of the particular type. In some cases, multiple 2-dimensional organ masks may be generated that correspond to different virtual slices (e.g., perspective views) of the target organ. These 2-dimensional organ masks may be aggregated to generate a 3D organ mask for each organ.
The post-processing controller 114 may process the tumor mask 110 and the organ mask 113 individually and/or collectively to generate statistics and/or descriptors. For example, for each tumor, the post-processing controller 114 may identify the volume of the tumor and may further identify whether the tumor is within any organ (and if so, which type of organ). The post-processing controller 114 can further process (2-dimensional or 3-dimensional tumor mask) to calculate subject-level tumor statistics, such as the total tumor volume and/or density and/or the sum of the longest dimensions of the subject. In some cases, the sum of the longest dimensions may be the sum of the longest diameters, such that the longest diameters are calculated for each tumor and summed to form the sum of the longest diameters. In some cases, the post-processing controller 114 may identify a percentage of tumor mass relative to a corresponding target organ mass as another exemplary statistic.
The neural network processing system 120 may output the descriptors and/or statistical data to the user device. Furthermore, a representation of one or more tumor masks and/or one or more organ masks may be transmitted. For example, an image may be generated that includes a depiction of the original image with an overlay that identifies a perimeter of each detected tumor and/or organ of the subject. In some cases, post-processing controller 114 may further process (e.g., or transmit to another model and/or controller for processing) subject-level tumor statistics to generate a score for probability of survival using one or more treatment methods.
Although the interactive system depicted in fig. 1A involves detecting tumors and determining whether each tumor is within a different organ, alternative embodiments may involve detecting other types of biological objects. For example, a first network may be trained to detect brain lesions and other networks may be trained to detect individual brain regions so that it can be determined in which brain region a lesion is located. Likewise, alternative embodiments may replace at least the tumor segmentation network with a different segmented neural network trained to segment other biological structures within the medical image.
Prediction network system
Fig. 2 illustrates an exemplary predictive neural network system 200 that can use one or more output elements (e.g., organ masks) from the neural network processing system 120 to predict a score for a survival probability of a subject based on the efficacy of a treatment method. Prior to administration of the treatment method, efficacy may be determined by one or more characteristics of the subject (e.g., disease progression as measured by tumor volume or density).
In instances where it is desirable to predict these scores, the neural network processing system 120 may use one or more medical images 202 and organ masks 204 to predict the neural network system 200. The image 202 may be a subset of the same image used by the bounding box detection network and the tumor segmentation network, as discussed in section III. In some cases, the image 202 may additionally include corresponding metrics, such as a count, volume, and/or location of a tumor. Organ masks 204 may additionally include at least one or more organ masks generated by the organ-specific segmented neural network. In some cases, the neural network processing system 120 may additionally use a tumor mask (not depicted in the figures) that has been generated by the tumor segmentation network for predicting the neural network system 200.
In the depicted example, the predictive network controller 206 may be configured to control and/or perform any operation of the predictive neural network, which, as described herein, may be a neural network other than the bounding box detection network and the tumor segmentation network described in the neural network processing system 120. The predictive network controller 206 may train the predictive neural network using images corresponding to one or more sets of comparable subject pairs to predict survival or mortality associated with one or more treatment methods for the subject.
A pair of subjects can be considered comparable if, for example, both the first subject and the second subject received the same treatment and the first subject had a different survival time after receiving the treatment as compared to the second subject. Conversely, if the first survival of the first subject is indeterminate, the pair of subjects is not considered comparable, such that the first survival is tracked only for a particular time period (e.g., the length of the clinical trial), but no additional data related to the first survival is collected after the particular time period, and the second subject has a second survival at least after the particular time period following the first survival. Thus, not all possible subject pairings may be considered comparable.
During training, a set of prediction parameters 208 (e.g., weights) may be determined for the predictive neural network. The training data element may include at least one or more input images or metrics associated with each subject in the comparable subject pair (e.g., cumulative volume of all detected biological objects) and metrics that measure the survival of each subject after the treatment has been administered. Scores and/or rankings based on the survival of each subject may also be included within the training data elements. The score and/or ranking may correspond to the likelihood of survival of the subject using the administered treatment. The training may utilize a loss function that maximizes the difference in scores between the pair of subjects during the training such that a first subject is determined to have the best chance of survival to use the treatment as compared to a second subject.
The reference subject data 210 can be a database including at least the administered treatment, survival, and one or more subject-level metrics (e.g., number of tumors, location of tumors, SLD, or volume of tumors) for each subject in a plurality of reference subjects, such that each subject in the plurality of reference subjects can further include subject-level statistics, e.g., based on a ranking of survival for a single subject compared to the plurality of reference subjects. For each reference subject in the plurality of reference subjects, the ranking can be a value k from 1 to the total number of subjects within the plurality of reference subjects predicted to be at risk of relative death (e.g., expressed as the likelihood of survival of the subject after treatment, or the expected survival of the subject). The survival of each subject can be measured from the diagnosis of the disease or the beginning of the treatment period of the subject. In some cases, at least some of the plurality of reference subjects may have died. The reference subject data 210 may specifically group reference subjects by the therapy administered.
When predicting survival of a target subject using a particular treatment method, the predictive neural network can select one or more reference subjects from the reference subject data 210 that meet criteria for comparability with the target subject to form at least one or more subject pairs, such that each pair includes the target subject and a different reference subject.
The predictive network may then determine a predictive score for the given subject by comparing the target subject to each of the selected reference subjects 212. The predictive score 212 can be any suitable metric (e.g., percentage or time period) indicative of the probability and/or length of survival of the target subject. The comparison to the reference subjects may involve comparing one or more characteristics associated with each reference subject to the same characteristics associated with the target subject prior to receiving the treatment method. In some cases, a ranking may be generated for one or more subject pairs such that a ranking value of a subject may indicate a likelihood of survival of the subject. For example, the subject with the lowest ranking value may be predicted to have the worst likelihood of survival using the treatment method. For each subject in one or more subject pairs, a ranking value may be determined from the total tumor count, volume or density, and/or location of the tumor.
A predicted score 212 for the target subject may be calculated based at least on where the target subject falls within the ranking as compared to the reference subject. It can then be predicted whether and/or to what extent the treatment method is effective in the target subject.
Exemplary advanced Process
Fig. 3 illustrates a flow diagram of an exemplary process 300 for processing a medical image using a multi-stage neural network platform. Process 300 may be performed using one or more computing systems.
The process 300 begins at block 305, where a training data set is accessed. The training data set includes a plurality of training elements. The training element includes a set of medical images (e.g., CT images) corresponding to the subject and annotation data identifying the presence of a biological object within the set of medical images. The annotation data includes a tag indicating the presence of the biological object and, if present, the general location of the biological object (e.g., liver, kidney, pancreas, etc.). The annotation data may not be complete and therefore does not include the presence of one or more biological objects. In some cases, the medical images may correspond to two or more different sets of annotation data based on annotations from at least two or more radiologists. In this case, different sets of annotation data corresponding to the same image include differences, such as identification of one or more additional biological objects or lack thereof and/or differences in annotation size and/or object perimeter for one or more biological objects. The training data set may have been generated using one or more imaging systems and one or more annotating devices, as disclosed in section III.
At block 310, the multi-stage neural network platform is trained using a training data set. The multi-stage neural network platform may include a bounding box detection network and a biological structure segmentation network. In some cases, the neural network platform additionally includes one or more organ-specific segmentation networks.
The bounding box detection network may be trained to detect bounding boxes corresponding to regions of the biological object. In particular, training the bounding box detection network involves defining a bounding box for each region corresponding to a biological object within the image. Each of the biological objects may be further marked to indicate that the bounded region corresponds to a given object (e.g., when multiple objects are identified across the set of images). In some cases, the tag may also include the location of the biological object within the subject.
A biological structure segmentation network (which is similar to the tumor segmentation network described in fig. 1A) is trained to identify the boundaries and total area of the depicted biological object. Training of the segmented network may include accessing additional training data sets. The additional training data set may include all of the training data elements of the initially accessed training data set as well as labeled segmentation data generated by the radiologist. The labeled segmentation data may include a binary mask or a 3-dimensional mask of the biological object. In some cases, the segmentation network is trained to further correct false positives generated by the detection network (e.g., false labeling of background regions as objects).
Further training may be performed using pixel-by-pixel cross-entropy loss, Dice coefficient loss, or composite loss. The loss function may be based on, but is not limited to, mean square error, median square error, mean absolute error, and/or entropy-based error.
The validation dataset may also be accessed to evaluate the performance of the multi-stage neural network platform with which it is trained. The validation data set may be another set of medical images and corresponding annotation data separate from the training data set. If the recognition and segmentation of the biological object within the medical image of the verification dataset both reach the target accuracy, the training session may be terminated.
At block 315, a set of medical images corresponding to the subject and/or a single imaging session is accessed. The set of medical images may depict a chest region, an abdominal region, and/or a "whole body" region of the subject. In some cases, a first medical image corresponding to the chest region, a second medical image corresponding to the abdominal region, and a third medical image corresponding to the pelvic region may be stitched to generate a fourth medical image corresponding to the "whole-body" region of the subject.
Medical images may be generated using one or more imaging systems as disclosed in section iii.a. In some cases, one or more imaging systems may be configured to generate images corresponding to different perspectives of a region of a subject. In this case, the plurality of medical images may depict different virtual slices of the particular region.
At block 320, the set of medical images may be used for bounding box detection of the network. Each image is analyzed to identify one or more bounding boxes. Each bounding box may identify an image region corresponding to a target biological object. The analysis of the image may include using a first virtual slice corresponding to a region and/or view above the image and a second virtual slice corresponding to a region and/or view below the image, such that the first virtual slice and the second virtual slice provide additional spatial context for determining the region corresponding to the target biological object.
In some cases, the bounding box may include a set of margins (e.g., 10px of fills, for example) around the identified region corresponding to the target biological object. The bounding box detection network may identify more than one bounding box of the image if more than one region corresponding to the biological object is identified within the image.
At block 325, one or more bounding boxes corresponding to the medical image may be used to segment the network. The segmentation network may crop the medical image to generate a set of detection regions that depict a magnified view of each region corresponding to the bounding box. The detection region may be assigned a uniform size such that if the region is smaller than the uniform size, the detection region may include additional padding and a region corresponding to the bounding box. In the case where the area is larger than a uniform size, the area corresponding to the bounding box may be divided into more than one detection area. In the case where multiple detection regions correspond to a bounding box, the regions corresponding to the bounding box may be divided into a set of sliding windows such that some of the windows include overlapping subsets of the regions.
For each detection region associated with the bounding box, the biological structure segmentation network may evaluate image features of the detection region to locate the biological object and generate a first binary mask corresponding to the biological object. If multiple bounding boxes are identified for a given image, the biological structure segmentation network may identify regions within each of the bounding boxes that delineate corresponding biological objects. A binary mask may be generated for each biological object. In some cases, more than one binary mask may be generated for a biological object using images depicting different perspectives of the biological object.
At block 330, one or more binary masks corresponding to the same object may be processed (e.g., via post-processing) to generate a 3D mask. Each binary mask and each 3D mask of the one or more binary masks may correspond to a single biological object. Thus, for example, a plurality of 3D masks may be generated for an imaging session of a given subject, where each 3D mask corresponds to one of a plurality of biological objects.
Processing the set of binary masks may include aggregating the binary masks to form a 3D structure of the object, as described in section iii.d. Since some binary masks may further include overlapping regions, the segmentation network may adjust the regions of one or more binary masks to account for the overlapping regions and/or select a binary mask that does not include one or more possibly delineated redundant perspectives.
At block 335, the medical image corresponding to the one or more masks (e.g., as accessed from block 315) may be used for one or more organ-specific segmentation networks to determine the location of the biological object. Each organ-specific segmentation network may correspond to a particular target organ (e.g., liver, kidney, etc.) and may be trained to identify the particular target organ within the image. The organ-specific segmentation network may receive and process the set of images to identify a location of a corresponding target organ. If a corresponding target organ is detected, the network may additionally generate a mask for the corresponding organ. The generated organ mask may be a binary mask and/or a 3-dimensional mask.
At block 340, one or more masks (e.g., one or more 3D biological object masks, one or more 2-dimensional object masks, and/or one or more organ masks) are analyzed to determine one or more metrics. The metric may include a characteristic of the biological object. For example, the metrics may include an object count, a location and/or type of object, an object count for a particular location and/or type, a size of one or more objects, an average size of objects, a cumulative size of objects, and/or a number of objects within each of one or more types of tumors.
In some cases, the metric includes one or more spatial attributes of the object, such as a volume of the object, a length of a longest dimension of the object, and/or a cross-sectional area of the object. The one or more spatial attributes may further be used to generate subject-level statistics for all objects detected within a given subject. Subject-level statistics can include, for example, a cumulative object volume for a given subject, a sum of object lengths for a longest dimension of a given subject (e.g., such as a sum of longest diameters), and/or a cumulative cross-sectional area of detected objects for a given subject.
In some cases, the metric is compared to another metric associated with a medical image of the same subject acquired during a previous imaging date to generate a relative metric (e.g., a percentage or absolute change). The metric may be output (e.g., transmitted to another device and/or presented to a user). The output may then be analyzed by, for example, a medical professional and/or radiologist. In some cases, the metric is output with a depiction of one or more masks.
The metrics can be used to predict (e.g., at a computing system and/or via a user using one or more stored rules) a diagnosis and/or treatment outcome of the subject. For example, subject-level statistics, such as cumulative biological object volumes, can be used to determine disease stage (e.g., by determining a range corresponding to the cumulative volume). As another example, relative changes in biological object volume and/or count may be compared to one or more thresholds to estimate whether current and/or previous treatments are effective.
In some cases, the metric may be used to predict a score for one or more treatment methods based on the probability of survival of the subject calculated by the predictive neural network. The score may be predicted using one or more spatial attributes such as the cumulative object volume and/or the sum of the lengths of the longest dimensions of the object. In some cases, one or more scores for the probability of survival may be generated to rank a group of subjects and/or treatments. In this case, the score of the subject and/or treatment may be compared to one or more scores of another subject and/or another treatment to determine a ranking. The subject-specific ranking may identify at least one or more subjects with the highest probability of survival for the given treatment relative to other previous subjects to whom the given treatment has been administered. The treatment-specific ranking may identify the treatment for which a given subject has the highest likelihood of success (e.g., survival) relative to other treatments. In some cases, subject-specific ranking and/or treatment-specific ranking are also returned as output.
Exemplary embodiments
Vi.a. embodiment 1
VI.A.1. pipeline for automated identification and segmentation of tumors
Tumor segmentation is performed from a whole-body CT scan using an automated detection and segmentation method consisting of a bounding box detection network (discussed in step 1 below) and a tumor segmentation network (discussed in steps 2-3).
Vi.a.1.a. step 1: bounding box detection
A bounding box detection network with RetinaNet architecture (referred to herein as a "detection network") is used to predict whether a region of a medical image depicts a tumor, generate a bounding box that identifies the general spatial location of the tumor within the image region, and provide a probability of a region label for each general spatial location depicting the tumor. When the detection network is trained, the issued RetinaNet architecture is modified, and all convolutions are changed into separable convolutions. For each medical image, an image stack comprising a set of three consecutive axial CT slices (without fixed resolution) is used as input to the detection network. The detection network is trained to detect regions including tumors within each of the slices (included within the image stack), generate bounding boxes for each of the detected regions, and attribute them to one of the following available site labels: lung, mediastinum, bone, liver, etc. FIG. 4 illustrates an example set of images depicting: (i) a pre-treatment whole-body scan of the subject; (ii) identifying a bounding box predicted to correspond to a tumor of a mediastinal site and identifying a bounding box predicted to correspond to a tumor of a lung site within an axial slice of the subject; (iii) a bounding box is identified that is predicted to correspond to a tumor of a liver site within another axial slice of the subject.
The detection network outputs (i) proposed coordinates of the bounding box, which represent the general spatial location of the tumor on the medial axial slice; (ii) probability of each site label (lung, mediastinum, bone, liver, etc.) class. The outputs are connected to have a bounding box in each slice of the CT scan as shown in fig. 4. Each of the three consecutive axial CT slices is 512x512 in size. 48000 radiologist annotated images of axial CT slices were trained with corresponding site locations from 1202 subjects of the IMPower150 clinical trial, with a bounding box surrounding the radiologist-identified RECIST target and non-target lesions. The hyper-parameters include batch size 0.16, learning rate 0.01 and use of optimizer ADAM. The detection network was validated on an IMpower131 clinical trial (969 subjects). The lesion level sensitivity to RECIST reading was 0.94. The voxel level sensitivity was 0.89.
Vi.a.1.b. step 2: tumor segmentation
The lesion segmentation network (e.g., implemented as a probabilistic U-Net for this example) is used to identify regions (e.g., and/or corresponding portions of regions within which the mask value is positive and/or equal to 1) within each bounding box identified by the detection network that delineates the lesion. As shown in fig. 5, each of the 6 images corresponds to a bounding box identified by the detection network, and each of the contour regions identifies a tumor segmentation determined using the tumor segmentation network. In training the tumor segmentation network, the published probabilistic U-Net architecture is modified, where all convolutions are replaced by separable convolutions. The tumor segmentation network was configured to average 16 predictions for the region within each bounding box to model inter-reading variability and reduce the variance of the predictions. Thus, each prediction corresponds to a different method or criteria used by a different radiologist when annotating (or choosing not to annotate) the same lesion, and then if the mean prediction is greater than 5 or some other threshold, 16 mean predictions are used to generate a "consensus" by averaging the predictions for each voxel within the image and determining each voxel as part of the tumor. Three axial slices (i.e. 256x256 pixels) of size 0.7x0.7mm are used as input to the tumor segmentation network, such that each of the axial slices is related to a detected bounding box that has been subjected to one or more temporary pre-processing techniques (e.g. cropping).
The tumor segmentation network outputs a segmentation of the medial axial slice that identifies regions delineating the tumor within each bounding box. From a volume RECIST reading and 2DRECIST from one radiologist, a tumor segmentation network was trained on 67340 tumor-masked images from 1091 subjects in IMpower 150. Example hyper-parameters include batch size 4, learning rate 0.0001, and use of optimizer ADAM. The example network was validated on an IMpower131(969 subjects; 51000 256x256 images and 0.7x0.7mm images). Assuming no false positives in the validation dataset (51000 images from IMpower131), the calculated dice score (using the average of 16 predictions from the network) was 0.82.
Vi.a.1.c. step 3: organ specific segmentation
The segmentation output by the tumor segmentation network in step 2 is used to confirm/correct the general spatial location of the tumor provided by the bounding box detection network in step 1.A whole-body CT scan of the subject is taken as input for processing by a separate organ segmentation network. In this embodiment, the organ segmentation network is composed of a plurality of convolutional neural networks. Each of the individual organ segmentation networks is trained to perform organ-specific segmentation and to return an organ mask identifying the location of the organ in the whole-body CT scan. Organ-specific segmentation is accomplished by training a different organ segmentation network for each of the target organs (e.g., right lung, left lung, liver, spleen, kidney, bone, and pancreas). Each of the organ-specific segmentation networks has a 3D U-Net architecture that includes batch normalization and leaky ReLU activation per layer. Organ-specific segmentation networks of The Kidney, spleen and pancreas were trained using publicly available datasets, particularly to complete datasets in Kits19 for The Kidney (e.g., Heller, N. et al, "The KiTS19 Challenge Data:300Kidney Tumor Cases with Clinical Context, CT Semantic Segmentations, and Clinical Outcome." (2019), which is incorporated herein by reference in its entirety for all purposes) and in The medical ten-fold competencies for The spleen and pancreas (e.g., Simpson, A.L. et al, "A large expressed medical Data set for The differentiation and evaluation of segmentation algorithms" (2019), which is incorporated herein by reference in its entirety for all purposes). The basic fact that bone segmentation networks are based on morphological operations.
For each of the organ-specific segmentation networks, the input is a 256x256x256 CT volume (concatenated of axial slices of step 1-2) resampled to a voxel size of 2x2x2 mm. The output of each organ-specific segmentation network in the organ-specific segmentation network is an organ mask of the same size for each organ. The basic fact of each network is that 256x256x256 corresponding organ masks have the same voxel size. The hyper-parameters include batch size 4, learning rate 0.0001, and use of optimizer ADAM. Data enhancement with a combination of rotation, translation and scaling is used to enhance the data set for more robust segmentation and to avoid overfitting. The initial version of the organ-specific segmentation network trained as described herein produced the following results: lung: 0.951; liver: 0.964; kidney: 0.938; spleen: 0.932; pancreas: 0.815; bone: 0.917 (basic fact generated using morphological operations).
VI.A.2. time-separated pairwise comparisons
Summary of vi.a.2.a
CT scans, organ-specific segmentation, and the techniques described herein are further used in conjunction with automated detection and segmentation of tumors to generate many other predictions and estimates to help clinicians decide which treatments to prescribe. In identifying one or more tumors and/or a "whole-body" tumor burden using an automated pipeline, the model predicts the survival opportunity of the subject from one of a plurality of metrics, such as overall survival, progression-free survival, or other similar metrics, given a plurality of potential treatments for a given oncology indication. The model outputs a ranking of treatments for a given subject to identify the treatment that provides the longest survival time. Alternatively, the model outputs a ranking of subjects to identify the subject likely to experience the longest survival time in a given therapy.
Model architecture and training for VI.A.2.b
Given 2 subjects a and B, it is assumed that at least one subject's outcome (overall survival) will be observed. Without loss of generality, it is assumed that the results of subject A (denoted T) are observed A ) And subject B (denoted T) B ) At T B >T A Is examined or killed.
The inputs to the network are a CT scan and organ masks (e.g., liver, lung, kidney, bone, pancreas, and spleen) obtained using one or more organ-specific segmentation networks of subjects a and B. The architecture of the organ-specific segmentation network is an expanded VGG16, ResNet18, or similar network, where separable convolutions output a fractional vector with N elements (e.g., 1000) for each subject. Inflation is generally performed according to the techniques described In Carreira, J and Zisserman, A. "Que Vadis, Action Recognition A New Model and the Kinetics Dataset" In: CVPR (2017), which is incorporated herein by reference In its entirety for all purposes. However, in this embodiment, separable volume integration is performed in 2 steps (first depth convolution followed by point convolution); however, instead of the conventional convolution only performing the dilation along the 3 rd dimension, the dilation is divided into 2 steps. For depth-wise convolution, dilation is performed along the third dimension, then a copy filter is applied once, and the average is calculated along the fourth dimension (the number of input filters). For point-by-point convolution, the mean is determined in the first 2 dimensions, the dilation is performed along the 3 rd dimension, and the replication is performed along the 4 th dimension. The above modifications facilitate processing large (pixel/voxel count) 3D full-body CT using a network while achieving functional model performance.
During training, the scores obtained by subjects A and B are compared (S) A And S B ). The training process aims to minimize the loss L ═ exp (S) on the data samples B )/exp(S B )+exp(S A ). The training data included 42195 comparable subject pairs from 818 subjects from the IMpower150 clinical trial separated by treatment groups. The selected hyper-parameters include learning rate (lr) 0.0001, batch size 4 and use of optimizer ADAM. The results of the example model for pair-wise comparison show that 74% of the pair-wise comparisons are accurate in the test (validation) set of 143 subjects from the 3 treatment groups of GO29436 (impuwer 150). For these results, only subjects within the treatment group were compared.
VI.A.3. results
The performance of the automated method on the training data set and the test data set was determined using RECIST and manual annotation of "whole body" tumor burden. RECIST readings were performed on both data sets as baseline solutions for the number of lesions identified per subject and the volume of all lesions.
Fig. 6A shows a correlation plot comparing the number of lesions read by RECIST (shown on the x-axis of the plot) with the number of lesions determined by the automated detection and segmentation method used to train the data set (imputer 150) (shown on the y-axis). Fig. 6B shows another graph comparing tumor burden (e.g., measured as the total volume of all identified lesions) derived by RECIST (shown on the x-axis of the graph) with tumor burden (shown on the y-axis of the graph) of tumors identified by automated methods. Both plots depict a right-hand skew, which indicates that RECIST readings have the highest correlation with data from the automated method for lower range lesion numbers and total lesion volumes. The standard deviation and standard error calculated for the predicted difference in lesion number based on the two techniques were 2.95 and 0.091, respectively. The standard deviation and standard error calculated based on the predicted difference in total tumor volume for both techniques was 5.2we +01 and 2.40, respectively. Figures 7A-7B depict similar correlation plots of test data sets (imputer 131) in which the mean number of lesions determined using RECIST reads is depicted on the x-axis and the number of lesions determined using an automated method is depicted on the y-axis. As for the test data set, the standard deviation and standard error calculated based on the predicted difference in lesion number for the two techniques were 6.05 and 0.24, respectively; the standard deviation and standard error calculated for the predicted difference in total lesion volume based on both techniques were 5.22e +01 and 2.40, respectively.
The full read is further performed using a training data set (imputer 150), which involves determining the overall tumor burden of the subject via manual annotation of each tumor by the radiologist, rather than annotating only a single slice as was performed in the RECIST read. Fig. 8 depicts a graph in which the y-axis corresponds to the number of lesions determined by a radiologist (e.g., for a complete reading) and the x-axis corresponds to the number of lesions for a group of subjects determined by RECIST. Each point in the graph represents a subject within the training data set, and a total of 15 subjects received a complete reading and a RECIST reading. The figure shows that there is little agreement between RECIST reads and full reads, as full reads identify more lesions than RECIST reads. The standard deviation and standard error calculated based on the difference between the predictions for the two techniques were 6.64 and 0.30.
The automated method and the complete reading performed by the radiologist are further compared to determine the overall tumor burden of the subject. Figure 9 depicts a correlation between the total lesion volume determined by a complete read performed by a radiologist (shown on the y-axis) and the total lesion volume determined by an automated method (shown on the x-axis), such that each point represents a subject within the imputer 150 training data set. As shown, a plurality of readings is calculated for each subject in a training set of subjects. Figures 10A-10B show graphs comparing the mean and median total lesion volumes determined by the automated method (shown on the x-axis, respectively) and the mean and median total lesion volumes determined from a complete reading of each subject (shown on the y-axis, respectively). Similar to fig. 8-9, each point in the two plots represents a subject within the training data set. As shown, automated methods typically identify lesions of the same or greater volume than a full read.
Prognostic data is also acquired for the subject represented in the training and testing data sets, using the number of lesions identified and the calculated total volume of lesions to predict the probability of survival of the subject over a given time period. More specifically, based on various statistics of lesions detected using RECIST techniques, subjects in the training dataset are assigned to specific clusters and a survival curve is calculated for each cluster to demonstrate whether the various statistics can predict survival. 11A-14B show Kaplan-Meier curves depicting exemplary prognostic data for a training data set.
Fig. 11A illustrates the survival probability of subjects who have clustered based on SLD calculations of lesions identified by RECIST. Figure 11B illustrates the survival probability of subjects who have been clustered based on the number of lesions identified by RECIST. The Y-axis of the graph corresponds to the survival probability and the x-axis corresponds to the elapsed time period (e.g., in days). Clustering was determined such that the first quartile (Q1) corresponded to subjects whose number of lesions and/or SLD score was within the first 25%, the second quartile (Q2) corresponded to subjects within the next 25%, the third quartile (Q3) corresponded to subjects within the next 25%, and the fourth quartile (Q4) corresponded to subjects within the last 25%. As shown, subjects within the first quartile of the diameter sum SLD and subjects within the first quartile of the number of lesions have a lower probability of survival than subjects within the fourth quartile. Thus, spatial statistics of automatically detected lesions appear to predict survival prognosis.
In contrast, fig. 11C shows a Kaplan-Meier curve illustrating the survival probability of a subject determined from the disclosed automated method. Fig. 11C shows a graph depicting the survival probability of a subject over a period of time, as determined by an automated method. As for the clustering associated with fig. 11C, subjects were clustered based on the total SLD of the overall tumor burden. Fig. 12A-12B further depict graphs of survival probability of a subject based on the total volume and number of lesions identified, also determined by an automated method. It is clear that a high tumor burden, measured by a large volume of lesions or a large number of lesions, correlates with a lower probability of survival of the subject.
As depicted in fig. 13A-14B, the location of identified lesions is also used to assess the degree of prognosis (e.g., survival probability) predicted by statistical data based on automatic tumor detection and segmentation for subjects within the training data set. In particular, fig. 13A-13B show a set of Kaplan-Meier curves depicting percent survival of subjects. A subject group was defined based on the volume of lung lesions (shown in corresponding panel a) and the number of lung lesions (shown in corresponding panel B). Notably, the survival curves of the subject groups were different, indicating that lesion volume and number of lesions can predict the survival metric. Fig. 14A-14B show the percent survival of a subject based on the spread of a lesion (e.g., metastasis) to the lung and bone regions, respectively, of the subject. The percent survival is reported to be higher when no lesions are present in the lung or bone regions of the subject.
FIGS. 15A-19 similarly depict Kaplan-Meier curves for exemplary prognostic data pertaining to the test data set. Fig. 15, 16, 17, and 18 correspond to the same tag variables (e.g., y-axis corresponding to survival probability and x-axis corresponding to elapsed days) and methods as fig. 10, 11, 12, and 13, respectively. Figure 19 shows the subject survival probability based on renal region metastasis of the subject in the test data set.
It will be appreciated that the test data set comprises different images from a different set of subjects than the training data set and is used to externally validate the results derived from the retained portion of the training data set. In particular, the graphs depicted in fig. 15A-19 depict the prognosis of a subject, showing a higher correlation between survival and location and/or total amount or volume of tumor when determined by an automated method compared to RECIST reads or complete reads.
Vi.b. embodiment 2
Summary of vi.b.1
This embodiment uses an automated bounding box detection and tumor segmentation method to identify a complete 3D tumor burden in a whole-body diagnostic CT scan of subjects with advanced metastatic disease (i.e., lesions distributed over multiple organs). This method differs from embodiment 1 in that organ-specific segmentation is not used to identify the location of segmented tumors or to generate organ masks.
The implemented method is based on a bounding box detection network implemented as a RetinaNet for detecting and labeling lesions, followed by a tumor segmentation network implemented as a set of probabilistic unets, capable of segmenting the detected lesions.
The proposed work was developed using 2 multi-site clinical trials, of which there were over 84000 identified RECIST lesions in 2171 subjects with advanced non-small cell lung cancer at 364 clinical sites. Thus, the method takes into account inter-reading variability and heterogeneity of scan acquisitions across hospital sites. Tumors identified using the automatic bounding box detection and tumor segmentation techniques described in this disclosure were compared to manually identified RECIST tumors and target lesions manually segmented at the voxel level. In addition, a fully automated estimate of baseline tumor burden is compared to a prognostic value of the radiologist's manual measurement of tumor burden versus total survival of the subject.
The results showed that in the retention set of 969 subjects (including over 35000 tumors), the detection and segmentation performance of RECIST target lesions was the most advanced. Furthermore, the results indicate that systemic tumor burden may have clinical utility as a prognostic factor for overall survival of the subject. The proposed method can be used to simplify tumor assessment in diagnostic radiology workflows, possibly enabling radiologists to assess the response to treatment when administered sequentially, if developed further.
VI.B.2. Process
The techniques described in this disclosure are used to identify total tumor burden from a whole-body CT scan. The method comprises three steps: the bounding box detection, tumor segmentation and post-processing, and the resulting end-to-end approach captures the different properties of available CT data and RECIST annotations.
The detecting step utilizes a bounding box detection network implemented as RetinaNet and identifies both the target lesion and the non-target lesion using a bounding box and a lesion label. RetinaNet uses a single-stage detection method that provides very rapid object detection. Since whole-body CT scans typically contain more than 200 axial slices, efficient processing is highly advantageous.
In the segmentation step, based on only 2D segmentation of the target lesion, a tumor segmentation network implemented as a set of probabilistic UNet yields a reasonable set of axial lesion segmentations.
Tumor segmentation in metastatic cancer subjects is susceptible to reading subjectivity, so there may not be a single fundamental fact for a given lesion. Probabilistic UNet [8] enables memory-efficient generative partitioning, which allows for sampling partition variants from a low-dimensional potential space. The use of probabilistic UNet for segmentation is further described in Kohl, S.et al, "A probabilistic U-Net for segmentation of ambiguous images," Advances in Neural Information Processing Systems (NIPS 2018) page 6965-6975 (2018), which is incorporated herein by reference in its entirety for all purposes. Therefore, a probabilistic UNet is chosen to model the reading-to-reading annotation variability.
This portion of the model allows for the generation of a set of tradeoffs between inter-reading variability and overall consistency across the segmentation by the radiologist. The post-processing step incorporates predictive 2D segmentation to generate a uniform whole-body 3D tumor mask. In addition, post-processing also accounts for variability in image acquisition parameters encountered in our multi-site data set (which results in different information limiting and making different the signal-to-noise ratio of the scan). Tumors detected via this automated technique are compared to tumors detected via a manual technique, wherein the radiologist delineates the selected target lesion and marks a bounding box around the non-target lesion.
Tumor detection in vi.b.2.a
In the data evaluated in this embodiment, the tumor location tags were highly imbalanced between organs, with lung lesions accounting for 45% and 40% of the training and test data sets, respectively, but with 128 locations accounting for less than 0.5% of the tags. The focus loss is used to handle class imbalance.
RetinaNet with ResNet-50-FPN was used for axial detection of tumors. (see Lin, t.y., doller, p., Girshick, r., He, k., harihanan, b., Belongie, s. "Feature pyramid networks for object detection." CVPR (2017), which is incorporated herein by reference in its entirety for all purposes.) in non-maximum suppression, the maximum number of objects per image is set to 32 and the number of anchor points is set to 9. Here, 32 represents an upper limit on the number of tumors that can reasonably be expected within a single axial slice. To provide a spatial context around the central slice, the model is configured to receive as input three axial slices fed as three eigen-channels. Due to the low prevalence of many tags, the classification is simplified to lung, liver, bone, mediastinum and other locations.
In the test setup, RetinaNet was applied to all axial slices in sequence. The predicted bounding box is extended to the previous and next slices to minimize false negatives.
Vi.b.2.b. tumor segmentation
The experiments were performed with β ═ 2, 5, and 10, and may be independent, or may be cross-linked or combined. The best result is to use
β 2 and β 10 are obtained in combination with 2 masks.
Training different β in loss allows different weights to be provided for the Kullback-Leibler divergence term in loss, and thus gives different importance to the underlying space across the segmentation variants. This parameter allows the generation of tumor segmentation variants that mimic the variability of human readings or the generation of consensus segmentations.
Using RECIST target lesion segmentation, a training data set was constructed from 2 radiologists per scan and 3D segmentation for some scans. The image was resampled to 0.7x0.7mm in-plane resolution and a 256x256x3 pixel patch was constructed around these lesions. The previous and next slices are used as spatial contexts. With a larger patch than the input, 0.5x0.5mm in-plane resolution of 180x180 pixels. This choice was made because the data to be evaluated represents advanced cancer, where the data depicts many large lesions.
In the test setup, the patches are focused on the detected lesion (e.g., provided by the detected bounding box) and then resampled to the input resolution of the probabilistic UNet, segmented as shown in fig. 20. When the detected lesion is larger than the patch size, a sliding window is used to segment the detected lesion as a whole.
Vi.b.2.c. systemic assessment
Acquisition protocols vary from hospital to hospital and even from machine to machine within the same institution. Thus, the voxel size in the dataset is variable (from 0.6 to 1.45mm in plane and the slice thickness from 0.62 to 5 mm). These differences lead to variability in the signal-to-noise ratio (SNR) and may lead to segmentation of tumors that can only be detected in high resolution scans. To homogenize the information extracted from all CT scans, binary closure was applied to the tumor mask using cubic 3x3x5mm structural elements to account for SNR differences and only tumors with a height greater than 10mm were retained.
Vi.b.3. experiments and results
Vi.b.3.a. data
The data set consisted of more than 84000 lesions for a total of 14205 diagnostic computed tomography scans from two randomized clinical trials. Training data and test data were separated in each trial. The First trial (clinical trial NCT02366143, described in Socinski, M.A., et al, "Atozolizumab for First-Line Treatment of Metastatic Nonsquad NSCLC." N Engl J Med 378, 2288-. This first trial dataset was used for training. The second trial (clinical trial NCT02367794) included 969 advanced squamous non-small cell lung cancer subjects and was used as the retention set. The data was collected at 364 unique sites (238 in the training set and 237 in the test set), with 27 different radiologists providing comments. Thus, this data provides significant subject variability, image acquisition variability, and inter-reading variability.
Subjects averaged 6.5 visits for each trial, 7861 total scans in the training set, and 6344 scans in the test set. Two radiologists read each scan according to RECIST 1.1 criteria. Tumor annotation consists of 2D lesion segmentation of the target lesion and bounding box of the non-target lesion. Overall, there were 48470 annotated tumors in the training set and 35247 in the test data, among all visits and radiologists. In addition, for each identified target and non-target tumor, available lesion labels are identified from the 140 possible location labels, as shown in table 1. In addition to the 2D annotation, 4342 visits (2 visits per subject) only volume segmented the target tumor. Whole body coverage can be used for whole body assessment of 1127 subjects at screening in the training set and 914 subjects in the test set.

Table 1. frequency of lesion locations in training dataset and test dataset. Sensitivity and accuracy.
Vi.b.3.b. results
And (5) realizing. RetinaNet for tumor detection and labeling was implemented using PyTorch and ADAM optimizers. The ResNet-50-FPN was initialized using the ImageNet pre-training model. The learning rate is set to 1e-4 and the batch size is set to 16. The network was trained over 416000 iterations.
The probabilistic UNet is implemented using PyTorch and ADAM optimizers. The learning rate is set to 1e-5 and the batch size is set to 4. Two versions are retained, β ═ 2 and 10 in the training loss. The network was trained over 50 periods.
Detection and segmentation capabilities. Average lesion and category level sensitivities for each image detected in table 2 and table 1. Sensitivity was obtained with an average of 0.89 "false positives" (FP) per image. Due to the incompleteness of RECIST annotation, these FPs may actually be unannotated lesions. Average sensitivities (88.4%) were derived from 0.5, 1, 2, and 4 FPs per image, as described in Yan, K., et al, MULAN: Multitask Universal Session Analysis Network for Joint Vision Detection, Tagging, and Segmentation. Frangi, A.F., Schnabel, J.A., Davatzikos, C., Alberola-Lopez, C., Fichtinger, G. (eds.) MICCAI 2019.LNCS, Vol. 11769, p. 194-202. Springer, Cham (2019) and Liao, F., Liang, et al, evaluation the magic of driving nondudes using the 3D deep noise-or network IEEE trans.

Table 2 accuracy and segmentation performance.
For segmentation, the statistical data includes the average voxel-level sensitivity in the test set and the average error of the estimated RECIST lesion longest dimension.
Survival was predicted from baseline scans. Using a tumor detection and segmentation model estimated from the training data, the length along the longest dimension of all detected and segmented lesions is calculated from the baseline scan of each subject in the test dataset. With survival time as the outcome variable, the right panel of fig. 22 shows a Kaplan-Meier plot (for subjects in the test set) based on the empirical quartile of the model-extracted baseline SLD. For comparison, on the same subject, the left panel shows a Kaplan-Meier plot of the empirical quartile of SLD based on RECIST. It can be seen that the automated method reproduces to a large extent the survival risk profile before tumor burden treatment compared to that generated by radiologist annotation according to RECIST criteria.
Vi.b.4. explanation
The results illustrate the powerful performance of a multi-level split platform. The fully automated algorithm successfully identified and performed 3D segmentation of tumors in standard diagnostic whole-body CT scans. This method shows a powerful performance in detection and segmentation compared to radiologists, and importantly it works well for tumors in many different organs. These results indicate that by providing an initial tumor burden assessment for radiologist review, the technique can provide a powerful support tool for radiologists, which will improve accuracy, reproducibility, and speed. Furthermore, the algorithm generates metrics such as total tumor volume (which is often too time consuming for a radiologist to assess), which can be valuable as a prognostic tool or new endpoint for clinical trials, and provides a more complete view of the subject's disease for clinical radiology practice.
Additional considerations VII
Some embodiments of the present disclosure include a system comprising one or more data processors. In some embodiments, the system includes a non-transitory computer-readable storage medium containing instructions that, when executed on the one or more data processors, cause the one or more data processors to perform part or all of one or more methods disclosed herein and/or part or all of one or more processes disclosed herein. Some embodiments of the present disclosure include a computer program product, tangibly embodied in a non-transitory machine-readable storage medium, comprising instructions configured to cause one or more data processors to perform part or all of one or more methods disclosed herein and/or part or all of one or more processes disclosed herein.
The terms and expressions which have been employed are used as terms of description and not of limitation, and there is no intention in the use of such terms and expressions of excluding any equivalents of the features shown and described or portions thereof, but it is recognized that various modifications are possible within the scope of the invention claimed. Thus, it should be understood that although the claimed invention has been specifically disclosed by embodiments and optional features, modification and variation of the concepts herein disclosed may be resorted to by those skilled in the art, and that such modifications and variations are considered to be within the scope of this invention as defined by the appended claims.
The following description provides preferred exemplary embodiments only, and is not intended to limit the scope, applicability, or configuration of the disclosure. Rather, the ensuing description of the preferred exemplary embodiment(s) will provide those skilled in the art with an enabling description for implementing various embodiments. It being understood that various changes may be made in the function and arrangement of elements without departing from the spirit and scope as set forth in the appended claims.
In the following description specific details are given to provide a thorough understanding of the embodiments. However, it is understood that embodiments may be practiced without these specific details. For example, circuits, systems, networks, processes, and other components may be shown in block diagram form in order not to obscure the embodiments in unnecessary detail. In other instances, well-known circuits, processes, algorithms, structures, and techniques may be shown without unnecessary detail in order to avoid obscuring the embodiments.
Claims (33)
1.A computer-implemented method, comprising:
accessing one or more medical images of a subject;
inputting the one or more medical images into a detection network to generate one or more masks that identify a set of regions within the one or more medical images, wherein the detection network predicts that each region of the set of regions identified in the one or more masks comprises a depiction of a tumor of one or more tumors within the subject;
for each region of the set of regions, processing the region of the one or more medical images using a tumor segmentation network to generate one or more tumor segmentation boundaries for the tumor present within the subject;
for each of the one or more tumors and using a plurality of organ-specific segmentation networks, determining an organ within which at least a portion of the tumor is located; and
generating an output based on the one or more tumor segmentation boundaries and a location of the organ within which at least a portion of the one or more tumors are located.
2. The method of claim 1, wherein processing the region to generate the one or more tumor segmentation boundaries comprises:
for each 2D medical image of a plurality of 2D medical images, identifying a segmentation boundary of the tumor within a tumor segmentation boundary of the one or more tumor segmentation boundaries; and
defining a three-dimensional segmentation boundary based on segmentation boundaries associated with a plurality of 2D medical images, wherein the output includes or depicts the three-dimensional segmentation boundary.
3. The method of claim 1, wherein each tumor segmentation boundary of the one or more tumor segmentation boundaries is defined as a segmentation perimeter of a two-dimensional cross-section of the delineated tumor, wherein the output comprises or delineates the one or more tumor segmentation boundaries.
4. The method of claim 1, further comprising:
determining, for each of the one or more lesions and based on a lesion segmentation boundary of the one or more lesion segmentation boundaries, a spatial attribute comprising:
the volume of the tumor;
a length of the tumor along a particular or longest dimension; and/or
The cross-sectional area of the tumor;
calculating subject-level lesion statistics for the one or more lesions based on the spatial attributes, wherein the output comprises the subject-level lesion statistics.
5. The method of claim 4, wherein the one or more tumors comprise a plurality of tumors, wherein the spatial attributes determined for each of the one or more tumors comprise a length of the tumor along a longest dimension, and wherein the subject-level tumor statistics comprise a sum of the lengths of the tumors.
6. The method of claim 1, further comprising:
determining a percentage or absolute difference between subject-level tumor statistics and further tumor statistics associated with the subject, the further tumor statistics having been generated based on an analysis of one or more other medical images of the subject, each medical image of the one or more other medical images having been acquired at a reference time prior to a time at which the one or more medical images were acquired, wherein the output comprises or is based on the percentage or absolute difference.
7. The method of claim 6, further comprising:
comparing the percentage or absolute difference to each of one or more predetermined thresholds;
determining an estimate for the prognosis, response to treatment, or disease state based on the threshold comparison, wherein the output comprises the estimated prognosis, response to treatment, or disease state.
8. The method of claim 1, wherein the one or more medical images comprise one or more Computed Tomography (CT) images.
9. The method of claim 1, wherein the one or more medical images comprise whole body or torso CT images.
10. The method of claim 1, wherein the one or more medical images comprise one or more MRI images.
11. The method of claim 1, wherein the detection network is configured to use loss of focus.
12. The method of claim 1, wherein the tumor segmentation network comprises a modified U-Net comprising separable convolutions.
13. The method of claim 1, wherein each organ-specific segmentation network of the plurality of organ-specific segmentation networks comprises a modified U-Net comprising a separable convolution.
14. The method of claim 1, further comprising:
determining, for each of the one or more tumors and based on being located within the organ, wherein the output comprises an organ-specific count value.
15. The method of claim 1, further comprising:
inputting, by a user, the one or more medical images into a computer; and
presenting, by the computer, a visual representation of at least one of the lesion segmentation boundaries.
16. The method of claim 1, further comprising:
capturing the one or more medical images with a CT machine.
17. The method of claim 1, further comprising:
providing, by a physician, a preliminary diagnosis of the presence or absence of cancer, which has been determined based on the output, and any associated organ locations.
18. The method of claim 1, further comprising:
providing, by the physician, a treatment recommendation based on the output.
19. A computer-implemented method, comprising:
transmitting one or more medical images of the subject from the local computer to a remote computer located on a computer network, the remote computer configured to:
inputting the one or more medical images into a detection network to generate one or more masks that identify a set of regions within the one or more medical images, wherein the detection network predicts that each region of the set of regions identified in the one or more masks comprises a depiction of a tumor of one or more tumors within the subject;
for each region of the set of regions, processing the region of the one or more medical images using a tumor segmentation network to generate one or more tumor segmentation boundaries for the tumor present within the subject; and
for each of the one or more tumors and using a plurality of organ-specific segmentation networks, determining an organ within which at least a portion of the tumor is located; and receiving results based on the one or more tumor segmentation boundaries and a location of an organ within which at least a portion of the one or more tumors are located.
20. The method of claim 19, further comprising:
the one or more medical images are captured with an MRI machine or a CT machine.
21. A computer-implemented method, comprising:
accessing one or more medical images of a subject;
accessing a set of organ locations for a set of tumor lesions present in the one or more medical images;
inputting the one or more medical images and the set of organ positions into a network associated with one therapeutic treatment of a plurality of therapeutic treatments to generate a score representing whether the subject is a good candidate for a particular therapeutic treatment relative to other therapeutic treatments; and
and returning the score.
22. The method of claim 21, wherein accessing the set of organ locations for the set of tumor lesions present in the one or more medical images comprises:
inputting at least one of the one or more medical images into a detection network to generate one or more masks identifying a set of regions of the one or more medical images, the set of regions indicative of one or more neoplastic lesions predicted to delineate within the subject; and
for each tumor of the set of tumor lesions and by using a plurality of organ-specific segmentation networks, an organ within which at least a portion of the tumor is located is determined.
23. The method of claim 22, wherein the detection network is trained with a set of comparable pairs of subjects that have received the therapeutic treatment and have survived for different time periods after receiving the therapeutic treatment, the training comprising using a loss function that maximizes the difference in the scores between subjects in the pair during training.
24. The method of claim 23, wherein the loss function used during training comprises L ═ -exp (S) B )/exp(S B )+exp(S A )。
25. The method of claim 22, wherein each organ-specific segmentation network of the plurality of organ-specific segmentation networks comprises an inflated VGG16 network or an inflated ResNet18 network.
26. The method of claim 22, wherein each organ-specific segmentation network of the plurality of organ-specific segmentation networks comprises a deep convolution followed by a point-by-point convolution.
27. The method of claim 22, further comprising:
inputting the one or more medical images into a computer by a user; and
presenting, by the computer, a recommendation of whether the therapeutic treatment is appropriate for the subject.
28. The method of claim 22, further comprising:
the one or more medical images are captured with an MRI machine or a CT machine.
29. The method of claim 22, further comprising:
prescribing, by a physician, the therapeutic treatment in response to a score indicating that the therapeutic treatment will be beneficial to the subject.
30. A computer-implemented method, comprising:
transmitting one or more medical images of the subject from the local computer to a remote computer located on a computer network, the remote computer configured to:
accessing a set of organ locations for a set of tumor lesions present in the one or more medical images; and
inputting the one or more medical images and the set of organ positions into a network associated with one therapeutic treatment of a plurality of therapeutic treatments to generate a score representing whether the subject is a good candidate for a particular therapeutic treatment relative to other therapeutic treatments; and
receiving, at the local computer, the score from the remote computer.
31. The method of claim 30, further comprising:
the one or more medical images are captured with a CT machine or with an MRI machine.
32. A system, comprising:
one or more data processors; and
a non-transitory computer-readable storage medium containing instructions that, when executed on the one or more data processors, cause the one or more data processors to perform a portion or all of one or more methods disclosed herein.
33. A computer program product, tangibly embodied in a non-transitory machine-readable storage medium, comprising instructions configured to cause one or more data processors to perform a portion or all of one or more methods disclosed herein.
Applications Claiming Priority (5)
| Application Number | Priority Date | Filing Date | Title |
|---|---|---|---|
| US201962952008P | 2019-12-20 | 2019-12-20 | |
| US62/952,008 | 2019-12-20 | ||
| US202062990348P | 2020-03-16 | 2020-03-16 | |
| US62/990,348 | 2020-03-16 | ||
| PCT/US2020/057542 WO2021126370A1 (en) | 2019-12-20 | 2020-10-27 | Automated tumor identification and segmentation with medical images |
Publications (1)
| Publication Number | Publication Date |
|---|---|
| CN114830175A true CN114830175A (en) | 2022-07-29 |
Family
ID=73452323
Family Applications (1)
| Application Number | Title | Priority Date | Filing Date |
|---|---|---|---|
| CN202080087958.2A Pending CN114830175A (en) | 2019-12-20 | 2020-10-27 | Automated tumor identification and segmentation using medical images |
Country Status (6)
| Country | Link |
|---|---|
| US (1) | US20220319008A1 (en) |
| EP (1) | EP4078510A1 (en) |
| JP (1) | JP2023507109A (en) |
| KR (1) | KR20220117236A (en) |
| CN (1) | CN114830175A (en) |
| WO (1) | WO2021126370A1 (en) |
Cited By (2)
| Publication number | Priority date | Publication date | Assignee | Title |
|---|---|---|---|---|
| CN115439473A (en) * | 2022-11-04 | 2022-12-06 | 北京精诊医疗科技有限公司 | Multi-phase occupation classification method based on interactive grouping attention mechanism |
| CN116416239A (en) * | 2023-04-13 | 2023-07-11 | 中国人民解放军海军军医大学第一附属医院 | Pancreatic CT image classification method, image classification model, electronic equipment and medium |
Families Citing this family (12)
| Publication number | Priority date | Publication date | Assignee | Title |
|---|---|---|---|---|
| US11636592B2 (en) * | 2020-07-17 | 2023-04-25 | International Business Machines Corporation | Medical object detection and identification via machine learning |
| US11580337B2 (en) * | 2020-11-16 | 2023-02-14 | International Business Machines Corporation | Medical object detection and identification |
| CN113538530B (en) * | 2021-07-09 | 2024-03-01 | 深圳市深光粟科技有限公司 | Ear medical image segmentation method and device, electronic equipment and storage medium |
| CN113554642B (en) * | 2021-08-12 | 2022-03-11 | 北京安德医智科技有限公司 | Focus robust brain region positioning method and device, electronic equipment and storage medium |
| CN114027794B (en) * | 2021-11-09 | 2023-06-30 | 新乡医学院 | Pathological image breast cancer area detection method and system based on DenseNet network |
| CN114170206B (en) * | 2021-12-13 | 2023-01-24 | 上海派影医疗科技有限公司 | Breast pathology image canceration property interpretation method and device considering spatial information correlation |
| WO2023114364A1 (en) * | 2021-12-17 | 2023-06-22 | Bluware, Inc. | Probability cube to probability cube enhancement for deep learning artificial intelligence |
| CN114565761B (en) * | 2022-02-25 | 2023-01-17 | 无锡市第二人民医院 | Deep learning-based method for segmenting tumor region of renal clear cell carcinoma pathological image |
| WO2024010882A1 (en) * | 2022-07-06 | 2024-01-11 | The Johns Hopkins University | System and method for coarse-to-fine segmentation of images to detect kidney and renal growths |
| CN115919464B (en) * | 2023-03-02 | 2023-06-23 | 四川爱麓智能科技有限公司 | Tumor positioning method, system, device and tumor development prediction method |
| CN116703837B (en) * | 2023-05-24 | 2024-02-06 | 北京大学第三医院(北京大学第三临床医学院) | MRI image-based rotator cuff injury intelligent identification method and device |
| CN116758048B (en) * | 2023-07-06 | 2024-02-27 | 河北大学 | PET/CT tumor periphery feature extraction system and extraction method based on transducer |
Family Cites Families (2)
| Publication number | Priority date | Publication date | Assignee | Title |
|---|---|---|---|---|
| US11094058B2 (en) * | 2015-08-14 | 2021-08-17 | Elucid Bioimaging Inc. | Systems and method for computer-aided phenotyping (CAP) using radiologic images |
| WO2019103912A2 (en) * | 2017-11-22 | 2019-05-31 | Arterys Inc. | Content based image retrieval for lesion analysis |
-
2020
- 2020-10-27 JP JP2022536546A patent/JP2023507109A/en active Pending
- 2020-10-27 WO PCT/US2020/057542 patent/WO2021126370A1/en unknown
- 2020-10-27 EP EP20807986.3A patent/EP4078510A1/en active Pending
- 2020-10-27 CN CN202080087958.2A patent/CN114830175A/en active Pending
- 2020-10-27 KR KR1020227020883A patent/KR20220117236A/en unknown
-
2022
- 2022-06-16 US US17/842,542 patent/US20220319008A1/en active Pending
Cited By (4)
| Publication number | Priority date | Publication date | Assignee | Title |
|---|---|---|---|---|
| CN115439473A (en) * | 2022-11-04 | 2022-12-06 | 北京精诊医疗科技有限公司 | Multi-phase occupation classification method based on interactive grouping attention mechanism |
| CN115439473B (en) * | 2022-11-04 | 2023-04-07 | 北京精诊医疗科技有限公司 | Multi-phase occupation classification method based on interactive grouping attention mechanism |
| CN116416239A (en) * | 2023-04-13 | 2023-07-11 | 中国人民解放军海军军医大学第一附属医院 | Pancreatic CT image classification method, image classification model, electronic equipment and medium |
| CN116416239B (en) * | 2023-04-13 | 2024-03-12 | 中国人民解放军海军军医大学第一附属医院 | Pancreatic CT image classification method, image classification model, electronic equipment and medium |
Also Published As
| Publication number | Publication date |
|---|---|
| KR20220117236A (en) | 2022-08-23 |
| US20220319008A1 (en) | 2022-10-06 |
| WO2021126370A1 (en) | 2021-06-24 |
| JP2023507109A (en) | 2023-02-21 |
| EP4078510A1 (en) | 2022-10-26 |
Similar Documents
| Publication | Publication Date | Title |
|---|---|---|
| US20220319008A1 (en) | Automated tumor identification and segmentation with medical images | |
| Vivanti et al. | Automatic detection of new tumors and tumor burden evaluation in longitudinal liver CT scan studies | |
| Diciotti et al. | 3-D segmentation algorithm of small lung nodules in spiral CT images | |
| US11937962B2 (en) | Systems and methods for automated and interactive analysis of bone scan images for detection of metastases | |
| Gonçalves et al. | Hessian based approaches for 3D lung nodule segmentation | |
| US11443433B2 (en) | Quantification and staging of body-wide tissue composition and of abnormal states on medical images via automatic anatomy recognition | |
| Zhou et al. | Automatic multiscale enhancement and segmentation of pulmonary vessels in CT pulmonary angiography images for CAD applications | |
| NL1024869C2 (en) | Method and system for measuring tissue changes relevant to disease. | |
| JP2023116486A (en) | System for and method of segmenting image on high-speed neural network basis and determining intake of radiopharmaceutical | |
| US8953856B2 (en) | Method and system for registering a medical image | |
| Abdolali et al. | Automatic segmentation of maxillofacial cysts in cone beam CT images | |
| Vivanti et al. | Patient-specific and global convolutional neural networks for robust automatic liver tumor delineation in follow-up CT studies | |
| US20080021301A1 (en) | Methods and Apparatus for Volume Computer Assisted Reading Management and Review | |
| Dodia et al. | Recent advancements in deep learning based lung cancer detection: A systematic review | |
| US20150065868A1 (en) | System, method, and computer accessible medium for volumetric texture analysis for computer aided detection and diagnosis of polyps | |
| Sun et al. | Juxta-vascular nodule segmentation based on flow entropy and geodesic distance | |
| González et al. | An approach for thyroid nodule analysis using thermographic images | |
| Zhai et al. | Automatic quantitative analysis of pulmonary vascular morphology in CT images | |
| CN115210755A (en) | Resolving class-diverse loss functions of missing annotations in training data | |
| Shi et al. | Pulmonary nodule registration in serial CT scans based on rib anatomy and nodule template matching | |
| Diciotti et al. | The ${LoG} $ characteristic scale: A consistent measurement of lung nodule size in CT imaging | |
| Pengiran Mohamad et al. | Transition of traditional method to deep learning based computer-aided system for breast cancer using Automated Breast Ultrasound System (ABUS) images: a review | |
| Dhalia Sweetlin et al. | Patient-Specific Model Based Segmentation of Lung Computed Tomographic Images. | |
| CN112529900A (en) | Method, device, terminal and storage medium for matching ROI in mammary gland image | |
| Chauvie et al. | Automatic liver detection and standardised uptake value evaluation in whole-body positron emission tomography/computed tomography scans |
Legal Events
| Date | Code | Title | Description |
|---|---|---|---|
| PB01 | Publication | ||
| PB01 | Publication | ||
| SE01 | Entry into force of request for substantive examination | ||
| SE01 | Entry into force of request for substantive examination |