CN114792309A - Information processing apparatus, control method of information processing apparatus, and storage medium - Google Patents
Information processing apparatus, control method of information processing apparatus, and storage medium Download PDFInfo
- Publication number
- CN114792309A CN114792309A CN202210449427.4A CN202210449427A CN114792309A CN 114792309 A CN114792309 A CN 114792309A CN 202210449427 A CN202210449427 A CN 202210449427A CN 114792309 A CN114792309 A CN 114792309A
- Authority
- CN
- China
- Prior art keywords
- data
- defect
- defect data
- processing apparatus
- information processing
- Prior art date
- Legal status (The legal status is an assumption and is not a legal conclusion. Google has not performed a legal analysis and makes no representation as to the accuracy of the status listed.)
- Pending
Links
- 230000010365 information processing Effects 0.000 title claims abstract description 100
- 238000000034 method Methods 0.000 title claims abstract description 39
- 230000007547 defect Effects 0.000 claims abstract description 442
- 230000007847 structural defect Effects 0.000 claims abstract 3
- 238000001514 detection method Methods 0.000 claims description 28
- 230000008569 process Effects 0.000 claims description 15
- 238000004364 calculation method Methods 0.000 claims description 7
- 239000003086 colorant Substances 0.000 claims description 2
- 238000010586 diagram Methods 0.000 description 34
- 230000008859 change Effects 0.000 description 28
- 230000002950 deficient Effects 0.000 description 22
- 238000012545 processing Methods 0.000 description 18
- 238000013500 data storage Methods 0.000 description 14
- 239000002244 precipitate Substances 0.000 description 12
- 238000012986 modification Methods 0.000 description 11
- 230000004048 modification Effects 0.000 description 11
- 238000007689 inspection Methods 0.000 description 8
- 238000012790 confirmation Methods 0.000 description 7
- 238000013523 data management Methods 0.000 description 6
- 230000004044 response Effects 0.000 description 6
- 238000010276 construction Methods 0.000 description 5
- 210000004204 blood vessel Anatomy 0.000 description 3
- 238000006073 displacement reaction Methods 0.000 description 3
- 230000006870 function Effects 0.000 description 3
- 238000007726 management method Methods 0.000 description 3
- 238000010187 selection method Methods 0.000 description 3
- 238000012937 correction Methods 0.000 description 2
- 238000003708 edge detection Methods 0.000 description 2
- 238000001914 filtration Methods 0.000 description 2
- 230000000737 periodic effect Effects 0.000 description 2
- 238000003672 processing method Methods 0.000 description 2
- 235000008733 Citrus aurantifolia Nutrition 0.000 description 1
- 241000264877 Hippospongia communis Species 0.000 description 1
- 229910001294 Reinforcing steel Inorganic materials 0.000 description 1
- 235000011941 Tilia x europaea Nutrition 0.000 description 1
- 230000032683 aging Effects 0.000 description 1
- 238000013459 approach Methods 0.000 description 1
- 239000010426 asphalt Substances 0.000 description 1
- 230000004397 blinking Effects 0.000 description 1
- 238000004891 communication Methods 0.000 description 1
- 238000007796 conventional method Methods 0.000 description 1
- 238000005336 cracking Methods 0.000 description 1
- 238000009792 diffusion process Methods 0.000 description 1
- 230000000694 effects Effects 0.000 description 1
- 238000011835 investigation Methods 0.000 description 1
- 239000004571 lime Substances 0.000 description 1
- 238000012544 monitoring process Methods 0.000 description 1
- 210000000056 organ Anatomy 0.000 description 1
- 238000001556 precipitation Methods 0.000 description 1
- 238000003825 pressing Methods 0.000 description 1
- 230000009466 transformation Effects 0.000 description 1
- 238000012795 verification Methods 0.000 description 1
- 238000011179 visual inspection Methods 0.000 description 1
Images


Classifications
-
- G—PHYSICS
- G06—COMPUTING; CALCULATING OR COUNTING
- G06T—IMAGE DATA PROCESSING OR GENERATION, IN GENERAL
- G06T7/00—Image analysis
- G06T7/0002—Inspection of images, e.g. flaw detection
- G06T7/0004—Industrial image inspection
-
- G—PHYSICS
- G01—MEASURING; TESTING
- G01N—INVESTIGATING OR ANALYSING MATERIALS BY DETERMINING THEIR CHEMICAL OR PHYSICAL PROPERTIES
- G01N33/00—Investigating or analysing materials by specific methods not covered by groups G01N1/00 - G01N31/00
- G01N33/38—Concrete; Lime; Mortar; Gypsum; Bricks; Ceramics; Glass
- G01N33/383—Concrete or cement
-
- G—PHYSICS
- G01—MEASURING; TESTING
- G01N—INVESTIGATING OR ANALYSING MATERIALS BY DETERMINING THEIR CHEMICAL OR PHYSICAL PROPERTIES
- G01N21/00—Investigating or analysing materials by the use of optical means, i.e. using sub-millimetre waves, infrared, visible or ultraviolet light
- G01N21/84—Systems specially adapted for particular applications
- G01N21/88—Investigating the presence of flaws or contamination
- G01N21/8851—Scan or image signal processing specially adapted therefor, e.g. for scan signal adjustment, for detecting different kinds of defects, for compensating for structures, markings, edges
-
- G—PHYSICS
- G01—MEASURING; TESTING
- G01N—INVESTIGATING OR ANALYSING MATERIALS BY DETERMINING THEIR CHEMICAL OR PHYSICAL PROPERTIES
- G01N29/00—Investigating or analysing materials by the use of ultrasonic, sonic or infrasonic waves; Visualisation of the interior of objects by transmitting ultrasonic or sonic waves through the object
- G01N29/04—Analysing solids
- G01N29/06—Visualisation of the interior, e.g. acoustic microscopy
- G01N29/0609—Display arrangements, e.g. colour displays
-
- G—PHYSICS
- G06—COMPUTING; CALCULATING OR COUNTING
- G06F—ELECTRIC DIGITAL DATA PROCESSING
- G06F3/00—Input arrangements for transferring data to be processed into a form capable of being handled by the computer; Output arrangements for transferring data from processing unit to output unit, e.g. interface arrangements
- G06F3/01—Input arrangements or combined input and output arrangements for interaction between user and computer
- G06F3/048—Interaction techniques based on graphical user interfaces [GUI]
- G06F3/0481—Interaction techniques based on graphical user interfaces [GUI] based on specific properties of the displayed interaction object or a metaphor-based environment, e.g. interaction with desktop elements like windows or icons, or assisted by a cursor's changing behaviour or appearance
-
- G—PHYSICS
- G06—COMPUTING; CALCULATING OR COUNTING
- G06T—IMAGE DATA PROCESSING OR GENERATION, IN GENERAL
- G06T1/00—General purpose image data processing
-
- G—PHYSICS
- G06—COMPUTING; CALCULATING OR COUNTING
- G06T—IMAGE DATA PROCESSING OR GENERATION, IN GENERAL
- G06T1/00—General purpose image data processing
- G06T1/0007—Image acquisition
-
- G—PHYSICS
- G06—COMPUTING; CALCULATING OR COUNTING
- G06T—IMAGE DATA PROCESSING OR GENERATION, IN GENERAL
- G06T11/00—2D [Two Dimensional] image generation
- G06T11/001—Texturing; Colouring; Generation of texture or colour
-
- G—PHYSICS
- G06—COMPUTING; CALCULATING OR COUNTING
- G06T—IMAGE DATA PROCESSING OR GENERATION, IN GENERAL
- G06T7/00—Image analysis
- G06T7/10—Segmentation; Edge detection
- G06T7/13—Edge detection
-
- G—PHYSICS
- G01—MEASURING; TESTING
- G01N—INVESTIGATING OR ANALYSING MATERIALS BY DETERMINING THEIR CHEMICAL OR PHYSICAL PROPERTIES
- G01N21/00—Investigating or analysing materials by the use of optical means, i.e. using sub-millimetre waves, infrared, visible or ultraviolet light
- G01N21/84—Systems specially adapted for particular applications
- G01N21/88—Investigating the presence of flaws or contamination
- G01N21/8851—Scan or image signal processing specially adapted therefor, e.g. for scan signal adjustment, for detecting different kinds of defects, for compensating for structures, markings, edges
- G01N2021/8854—Grading and classifying of flaws
- G01N2021/8861—Determining coordinates of flaws
-
- G—PHYSICS
- G01—MEASURING; TESTING
- G01N—INVESTIGATING OR ANALYSING MATERIALS BY DETERMINING THEIR CHEMICAL OR PHYSICAL PROPERTIES
- G01N21/00—Investigating or analysing materials by the use of optical means, i.e. using sub-millimetre waves, infrared, visible or ultraviolet light
- G01N21/84—Systems specially adapted for particular applications
- G01N21/88—Investigating the presence of flaws or contamination
- G01N21/8851—Scan or image signal processing specially adapted therefor, e.g. for scan signal adjustment, for detecting different kinds of defects, for compensating for structures, markings, edges
- G01N2021/8887—Scan or image signal processing specially adapted therefor, e.g. for scan signal adjustment, for detecting different kinds of defects, for compensating for structures, markings, edges based on image processing techniques
-
- G—PHYSICS
- G06—COMPUTING; CALCULATING OR COUNTING
- G06T—IMAGE DATA PROCESSING OR GENERATION, IN GENERAL
- G06T2200/00—Indexing scheme for image data processing or generation, in general
- G06T2200/24—Indexing scheme for image data processing or generation, in general involving graphical user interfaces [GUIs]
-
- G—PHYSICS
- G06—COMPUTING; CALCULATING OR COUNTING
- G06T—IMAGE DATA PROCESSING OR GENERATION, IN GENERAL
- G06T2207/00—Indexing scheme for image analysis or image enhancement
- G06T2207/10—Image acquisition modality
- G06T2207/10004—Still image; Photographic image
-
- G—PHYSICS
- G06—COMPUTING; CALCULATING OR COUNTING
- G06T—IMAGE DATA PROCESSING OR GENERATION, IN GENERAL
- G06T2207/00—Indexing scheme for image analysis or image enhancement
- G06T2207/30—Subject of image; Context of image processing
- G06T2207/30108—Industrial image inspection
- G06T2207/30132—Masonry; Concrete
Landscapes
- Engineering & Computer Science (AREA)
- Physics & Mathematics (AREA)
- General Physics & Mathematics (AREA)
- Theoretical Computer Science (AREA)
- Health & Medical Sciences (AREA)
- Life Sciences & Earth Sciences (AREA)
- Chemical & Material Sciences (AREA)
- Analytical Chemistry (AREA)
- Biochemistry (AREA)
- General Health & Medical Sciences (AREA)
- Immunology (AREA)
- Pathology (AREA)
- Computer Vision & Pattern Recognition (AREA)
- Quality & Reliability (AREA)
- General Engineering & Computer Science (AREA)
- Signal Processing (AREA)
- Food Science & Technology (AREA)
- Medicinal Chemistry (AREA)
- Ceramic Engineering (AREA)
- Acoustics & Sound (AREA)
- Human Computer Interaction (AREA)
- Investigating Materials By The Use Of Optical Means Adapted For Particular Applications (AREA)
- Image Analysis (AREA)
- Image Processing (AREA)
- Processing Or Creating Images (AREA)
Abstract
The invention provides an information processing apparatus and a control method of the information processing apparatus. The information processing apparatus includes: an obtaining unit configured to obtain first data indicating a first defect photographed at a first time and second data corresponding to the first defect photographed at a second time before the first time, the first defect being a structural defect; and a display control unit configured to display area information for determining an area including the first data, the second data, and the first defect in structure so that the first data and the second data are displayed simultaneously.
Description
The present application is a divisional application of an invention patent application having an application date of 2017, 6/19/No. of 2017, an application number of 201780042334.7 (international application number of PCT/JP2017/022444), and an invention name of "information processing apparatus, information processing method, and program".
Technical Field
The invention relates to an information processing apparatus, an information processing method, and a storage medium.
Background
Conventionally, in inspecting a concrete wall surface of a bridge, a dam, a tunnel, or the like, an investigation engineer approaches the concrete wall surface and records defects such as cracks by visual inspection. The work cost of such an inspection operation called a close-up vision inspection is high. For this reason, a method of automatically detecting defects from an image obtained by photographing a concrete surface is proposed. Patent document 1 discloses a technique of automatically detecting cracks from a concrete wall surface image by using wavelet transform.
In addition, since the accuracy of such automatic detection is insufficient, erroneous detection and non-detection may occur. For this reason, the survey engineer and/or the survey person in charge must confirm and appropriately correct the defect data indicating the automatic inspection result, and the concrete wall image. In order to simultaneously view the concrete wall image and the defect data when performing the verification and correction, the defect data is usually displayed on the concrete wall image in a superimposed manner.
Patent document 2 discloses the following technique: in order to determine whether or not the contour line of the organ extracted from the medical image is correct, an operation is instructed based on the movement of the user, and the contour line is moved, deformed, and displayed.
Documents of the prior art
Patent literature
Patent document 1: japanese patent laid-open publication No. 2014-228357
Patent document 2: japanese laid-open patent publication No. 10-105678
Disclosure of Invention
Technical problem
However, when the defect data is superimposed and displayed on the image, it is difficult to view the image of a portion corresponding to the defect data, so that there is a case where it is difficult to judge whether the defect data is correct. Browsing can be facilitated by moving and deforming the defect data using the method disclosed in patent document 2. However, in the method of patent document 2, the user has to manually adjust the parameters of the movement and deformation of the contour line. For this reason, the user must adjust an appropriate parameter for facilitating browsing every time the image being displayed, which complicates the browsing operation for the user.
The present invention has been made in view of such problems as described above, and aims to provide a user interface that facilitates a confirmation operation of defect data (object) in an image and an image showing the object without requiring a complicated operation by a user.
Solution to the problem
Accordingly, the present invention provides an information processing apparatus comprising: an obtaining unit configured to obtain a first image including a plurality of objects and information related to respective positions of the plurality of objects in the first image; and a determination unit configured to determine, based on the obtained positions of the plurality of objects, a position in a case where a second image indicating the plurality of objects is shift-displayed with respect to the first image.
Advantageous effects of the invention
According to the present invention, it is possible to provide a user interface that facilitates a confirmation operation for an area in an image and associated data corresponding to the area without requiring a complicated operation by a user.
Drawings
Fig. 1A is a diagram showing a display example of a window of a GUI application of an information processing apparatus.
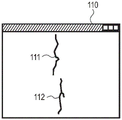
Fig. 1B is a diagram showing an example of display of a window of a GUI application of the information processing apparatus.
Fig. 1C is a diagram showing an example of display of a window of a GUI application of the information processing apparatus.
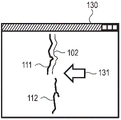
Fig. 1D is a diagram showing an example of display of a window of a GUI application of the information processing apparatus.
Fig. 2 is a diagram showing a hardware configuration of the information processing apparatus.
Fig. 3 is a diagram showing a software configuration of the information processing apparatus.
Fig. 4 is a diagram for explaining defect data.
Fig. 5 is a diagram for explaining a relationship between a captured image and defect data.
Fig. 6 is a flowchart showing the display processing.
Fig. 7A is a diagram for explaining another example of a selection method of object defect data.
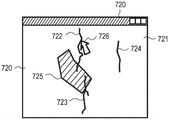
Fig. 7B is a diagram for explaining another example of a selection method of object defect data.
Fig. 8 is a diagram for explaining shift parameters.
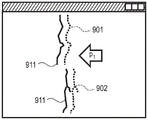
Fig. 9A is a diagram for explaining a relationship between a shift parameter and a shift cost (offset cost).
Fig. 9B is a diagram for explaining a relationship between a shift parameter and a shift cost.
Fig. 10 is a diagram for explaining another example of a determination method of a shift parameter.
Fig. 11 is a diagram showing an example of a display window.
Fig. 12 is a diagram showing an example of a display window.
Fig. 13 is a diagram for explaining a calculation method of a shift parameter.
Fig. 14A is a diagram showing an example of a display window.
Fig. 14B is a diagram showing an example of a display window.
Fig. 15A is a diagram showing an example of a display window.
Fig. 15B is a diagram showing an example of a display window.
Fig. 16 is a diagram showing an example of a display window.
Detailed Description
Hereinafter, preferred embodiments of the present invention will be described in detail with reference to the accompanying drawings.
(first embodiment)
For example, in order to support inspection and management of a wall surface or the like of a concrete structure such as a bridge, a dam, a tunnel, or the like, the information processing apparatus according to the first embodiment stores and displays a wall surface captured image. In addition, the information processing apparatus displays a defective area that is a confirmation target that must be visually confirmed by a manager at the time of inspection and management.
Incidentally, the object to be managed is not limited to the wall surface of the concrete structure. That is, as another example of the object of the inspection and management, road asphalt is used. Further, the defective area to be managed is an area where defect, that is, a state change is occurring. As defects, there are cracks in the concrete structure, free lime precipitation, honeycombs, cold joints, exposed reinforcing steel bars, and the like. However, the defects are not limited to those described in the embodiments. Further, it is assumed that the captured image is a visible light image (RGB image), but the type of image is not limited thereto. As another example, the captured image may be a thermal image captured by an infrared camera, an image captured by a line sensor camera, or the like. Incidentally, the photographed image of the wall surface of the concrete structure is an example of an image.
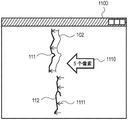
Fig. 1A to 1D are diagrams illustrating display examples of a window of a GUI application of an information processing apparatus. An outline of an information processing apparatus according to the present embodiment will be described with reference to fig. 1A to 1D. In the window 100 shown in fig. 1A, a photographed image 101 of a concrete wall surface is displayed, the photographed image 101 including a crack defect region 102.
Further, in the window 110 shown in fig. 1B, defect data 111 and 112 obtained by the automatic detection process according to the captured image 101 of fig. 1A are visualized and displayed. Here, it is assumed that there is virtually no change in the region of the captured image 101 corresponding to the defect data 111, and the defect data 111 is an erroneous detection result. Incidentally, in the drawings of the present embodiment, thin lines indicate actual cracks that can be observed on the concrete wall surface image, and thick lines indicate deformation data displayed in the application window. The defect data is represented by a thick line for convenience of display on paper, but on an actual application window, it is preferable to display the defect data by using a display method such as displaying the defect data by color.
A user such as a defect manager, a data inputter, or the like visually observes the defect data and confirms whether the defect data corresponds to a defect of the captured image. In this case, in order to allow the user to view the defect of the captured image and the visualized defect data at the same time, it is preferable to visualize the defect data and display the visualized defect data superimposed on the captured image. In the window 120 shown in fig. 1C, an image (first display mode) obtained by superimposing the following image (second image) on the captured image (first image) 101 of fig. 1A is displayed: in the image, defect data 111 and 112 are visualized and indicate the positions of defects. Here, since the defect region 102 corresponding to the actual crack in the photographed image and the defect data 111 substantially overlap each other, it is difficult for the user to confirm the crack region in the photographed image. Similarly, it is difficult to browse the area of the captured image corresponding to the defect data 112 based on the erroneous detection result.
In the window 130 shown in fig. 1D, an image obtained by moving the display positions of the defect data 111 and 112 in the direction of the arrow 131 and then superimposing these data on the captured image 101 is displayed (second display mode). By displaying the data as shown in fig. 1D, it is easy to browse the defective area 102, and the image portion of the defect data 112. In this way, shift display in which defect data is moved and displayed in a superimposed manner is an effective display method. However, when the defect data is moved and displayed as in fig. 1D, it is necessary to move the defect data by setting an appropriate moving direction and moving amount (arrow 131 in fig. 1D) according to the captured image and the defect data. On the other hand, the information processing apparatus according to the present embodiment automatically or semi-automatically determines an appropriate display position of the defect data, and displays a captured image in which the defect data is superimposed on the display position.
Fig. 2 is a diagram showing a hardware configuration of an information processing apparatus 200 according to the first embodiment. The information processing apparatus 200 includes a CPU201, a ROM202, a RAM203, an HDD204, a display unit 205, an input unit 206, and a communication unit. The CPU201 reads a control program stored in the ROM202 and performs various processes based on the read program. The RAM203 is used as a temporary storage area of the CPU201 such as a main memory, a work area, and the like. The HDD204 stores various data, various programs, and the like. When the CPU201 reads a program stored in the ROM202 or the HDD204 and executes the read program, functions and processing, which will be described later, of the information processing apparatus 200 are realized. The display unit 205 displays various information. The input unit 206 includes a keyboard and a mouse, and accepts various operations by the user. As other examples, the input unit 206 may be a tablet device, and the display unit 205 and the input unit 206 may be combined into a tablet device.
Fig. 3 is a diagram showing a software configuration of the information processing apparatus 200. The information processing apparatus 200 includes a captured image storage unit 301, a defect data storage unit 302, an acceptance unit 303, a detection unit 304, a data management unit 305, a display control unit 306, a selection unit 307, and a determination unit 308. The photographed image storage unit 301 stores the photographed image. In the present embodiment, it is assumed that the captured image is a facing image that faces the concrete wall surface, that is, an image captured in a direction perpendicular to the concrete wall surface as the capturing direction. Depending on the location and orientation of the structure when it is captured, it is often not possible to capture an image of the concrete wall face. In this case, the information processing apparatus 200 generates a facing image by geometric transformation processing on the image and stores the facing image as a captured image in the captured image storage section 301.
The defect data storage section 302 stores defect data. As shown in fig. 4, the defect data storage section 302 stores the ID, the defect type, and the display position in association. Here, the ID is identification information of the defect data. The defect type is information indicating the type of defect including cracks, precipitates, and the like. The coordinates are information for identifying a position on the captured image in which the defect is detected, and specifically, the coordinates are coordinate values in a coordinate system of the captured image.
For crack defects, record the number from (x) C001_1 ,y C001_1 ) To (x) C001_n ,y C001_n ) The two-dimensional coordinates of the n points. Incidentally, the coordinate values are not limited to coordinates in the coordinate system of the captured image, but may be values in the coordinate system of the real space in which the structure is located. Further, as a remark, information on the thickness of the crack is also stored as crack defect data included in the defect type.
ID — E00 corresponds to a defect in the precipitate. Unlike cracks, precipitates are defects having regions. Therefore, will be selected from (x) E001_1 ,y E001_1 ) To (x) E001_q ,y E001_q ) The coordinates of (2) are recorded as display positions, and the range of the defect data is a range surrounded by these coordinates (range of E001 in fig. 5).
Next, referring to fig. 5, the relationship between the captured image and the defect data will be described. The photographed image is a high-resolution image to observe a minute defect such as a crack. Therefore, the entire captured image of a specific structure is generally an image having a very large data size. The captured image 500 shown in fig. 5 is a large image (for example, an image of 100,000 × 100,000 pixels or more) of the wall surface of the structure, and has an image coordinate system of x-axis and y-axis. Even if the entire captured image 500 of such a size is viewed, it is difficult to confirm a fine defect on the concrete wall surface. Therefore, in general, a part of the browsing captured image 500 is enlarged.
For example, the window 510 in fig. 5 is application software that displays only a part of the captured image 500. In the window 510, a part of the captured image 500 is displayed in an enlarged manner, and in correspondence with this, the defect data C002 superimposed on the defective region is also displayed in an enlarged manner. Thus, the user can confirm the detailed status. Typically, upon identifying the defect, the user magnifies and views any portion of the image of the concrete wall surface in this manner. During the confirmation operation by the user, the information processing apparatus 200 causes the local area of the captured image to be displayed in the window in an enlarged manner.
By slave (x) C001_1 ,y C001_1 ) To (x) C001_n ,y C001_n ) The broken line defined by the coordinate values of n points (six points in the figure) of the same represents the crack C001 shown in fig. 5. As just described, in the present embodiment, it is assumed that the crack defect data is represented by a broken line. Incidentally, the crack defect data may be represented by lines having a thickness corresponding to the crack thickness, or may be represented by lines having a color corresponding to the crack thickness. The defect data is not limited to being represented by a broken line, but may be represented by a curved line. When the defect data is represented by a curve, although detailed image representation can be performed, the data capacity increases.
Returning to fig. 3, the receiving unit 303 receives an input of a captured image and stores the captured image in the captured image storage unit 301. Incidentally, the captured image may be input from an external device via a network or the like, and as another example, the information processing apparatus 200 may include a capturing unit (not shown), and the captured image may be input from the capturing unit.
The detection unit 304 automatically detects a defective region from the captured image. Although the automatic detection method of the defective region is not particularly limited, for example, the conventional technique described in patent document 1 may be used. Further, as another example of the automatic detection method, a method of learning the features of a defect in advance from a defect image and detecting the defect based on the result of such learning may also be used. As an automatic defect detection method based on learning, for example, the following documents can be referred to.
Zhang,Wenyu,et al.“Automatic crack detection and classification method for subway tunnel safety monitoring”Sensors 14.10(2014):19307-19328
Based on the detection result of the detection section 304, the data management section 305 records information about the defective area as defect data in the defect data storage section 302. More specifically, the data management section 305 assigns a new ID to the defect data and records the new ID in the defect data storage section 302. Further, the data management section 305 identifies the type of defect based on the shape of the detected defect, and records the identified defect data in the defect data storage section 302 in association with the new ID. The data management section 305 also identifies the position of the defective area in the captured image, and records the identified position in the defect data storage section 302 in association with the new ID.
As another example, the defective region may be identified according to an operation input by a user. In this case, the information processing apparatus 200 records defect data corresponding to a user operation. More specifically, the display unit 205 displays a captured image. Then, the user visually confirms the position of the defect such as a crack, and specifies the defect region by specifying the position on the captured image via the input unit 206. Then, the data management section 305 records information about the defective area specified by the user as defect data in the defect data storage section 302. Incidentally, the defect data storage section 302 only has to store defect data, and the generation method of the defect data is not limited to the method described in the embodiment. The defect data storage section 302 may store a plurality of defect data each obtained by a different method such as automatic inspection, user input, or the like.
The user performs an operation of confirming whether or not the defect data is correct. For example, the user must confirm whether the input result is correct after inputting the defect data, or whether the automatic detection result is correct after the automatic detection process of the defect. Further, there are cases where it is desirable to confirm the defect data input by the user himself/herself even during the input operation of the defect data. In this case, based on the defect data that has been input, processing described later may be performed to generate a display image and present the display image to the user. In this case, when the user instructs a display change, the information processing apparatus 200 calculates display parameters based on the defect data that has been input, and performs display for browsing the captured image and the defect data.
The display control section 306 controls image display on the display unit 205. The selection unit 307 selects at least one piece of defect data from the plurality of pieces of defect data displayed superimposed on the captured image. The defect data selected by the selection section 307 is defect data to be referred to at the time of calculation processing of display parameters of the defect data. Hereinafter, the defect data selected by the selection unit 307 is referred to as target defect data. Here, the object defect data is an example of object data and object-related data. Further, the defect data that is displayed on the captured image and is defect data other than the target defect data (i.e., related data other than the target data) is referred to as other defect data (other related data). Incidentally, the object defect data is an example of object data to be processed. The determination unit 308 calculates display parameters based on the target defect data.
Fig. 6 is a flowchart showing the display processing of the information processing apparatus 200. Incidentally, as a premise of this processing, it is assumed that a captured image is stored in the captured image storage section 301, and defect data corresponding to the captured image is stored in the defect data storage section 302. In S601, the display control unit 306 reads the captured image from the captured image storage unit 301. In addition, the display control section 306 reads the defect data from the defect data storage section 302. Next, in S602, the display control section 306 superimposes and displays corresponding defect data on the defect area of the captured image based on the defect data. More specifically, the display control section 306 superimposes the defect data on the position of the coordinates of the defect data. At this time, the defect data displayed on the display unit 205 is superimposed on the defect area as shown in fig. 1B, for example. For this reason, the defective region of the captured image is in a state of being difficult to see.
Next, in S603, the CPU201 confirms whether or not the display change command is accepted in response to the user operation on the input unit 206. This processing is an example of the acceptance processing of the change command. In a case where the display change command is accepted (yes in S603), the CPU201 advances the process to S604. In a case where the display change command is not accepted (no in S603), the CPU201 continues the display state. In S604, the selection section 307 selects the target defect data from among the plurality of defect data based on the user' S browsing state or the user instruction. In S605, the determination unit 308 determines a shift parameter. Here, the shift parameter is an example of a display parameter, and is a value indicating a moving direction and a moving amount when moving the display position of the defect data.
Next, in S606, the display control unit 306 controls to move the defect data to the display position of the captured image determined by the shift parameter, and superimpose and display the moved defect data. When displaying the plurality of defect data, the display control unit 306 controls to move and display each of the plurality of defect data in an overlapping manner. This process is an example of the display control process. Next, in S607, the CPU201 confirms whether or not the display change end command is accepted in response to the user operation on the input unit 206. In a case where the display change end command is accepted (yes in S607), the CPU201 advances the process to S608. In a case where the display change end command is not accepted (no in S607), the CPU201 continues the display state.
In S608, the display control unit 306 returns the display position of the defect data to the display position before the movement. Next, in S609, the CPU201 confirms whether or not a display end command is accepted in response to a user operation on the input unit 206. When the display end command is received (yes in S609), the CPU201 ends the display processing. If the display end command is not accepted (no in S609), the CPU201 advances the process to S603.
Hereinafter, details of the display processing will be described. The display change command accepted in S603 and the display change end command accepted in S607 may be a user operation of pressing a predetermined key and a user operation of releasing the predetermined key in a pressed state, respectively. As another example, when the user presses a key once, the CPU201 may accept a display change command, and when the user presses the key again, the CPU201 may accept a display change end command.
The user operation for inputting the respective commands is not limited to the user operation described in the embodiment. As another example, when an icon on a predetermined GUI is clicked with a mouse or the like instead of a key, the CPU201 may accept a display change command. Further, the user may specify defect data desired to be browsed in detail by clicking or mouse-over. In this case, the CPU201 accepts a display change command (designation including defect data), and in S604, the selection section 307 selects defect data related to the designation as target defect data.
Next, this defect data selection processing in S604 will be described. For example, as shown in fig. 5, a plurality of defect data are superimposed on the captured image. If the shift parameters are set in consideration of all of these defect data, it is not necessarily possible to obtain a display of the defect data suitable for the user's attention. Therefore, in S604, from among the plurality of defect data, defect data to be used when determining the shift parameter is selected as the target defect data.
The selection unit 307 selects the target defect data based on, for example, the browsing state of the user when the display change command is input. As described with reference to fig. 5, in the captured image 500, the user is browsing the defect data C002. In this case, the selection section 307 selects the defect data C002 as the target defect data. That is, the selection unit 307 selects the displayed defect data as the target defect data. In this manner, by selecting the target defect data according to the browsing state of the user, the shift parameter corresponding to the target defect data can be specified.
The method of selecting the target defect data is not limited to the above, and other methods may be used. Fig. 7A and 7B are diagrams for explaining other examples of a selection method of object defect data. In each of the window 710 of fig. 7A and the window 720 of fig. 7B, a photographed image of a concrete wall surface is displayed. In the captured image shown in the window 710 of fig. 7A, cracks 712, 713, and 714 exist. For this image, the selection section 307 may select the target defect data based on the relationship between the captured image being displayed and the display position of each defect data. For example, the selection unit 307 selects the target defect data according to the distance between the center of the window 710 and the display position. In the example of fig. 7A, the crack defect data 712 and 713, whose display positions overlap with the central region 715, are selected as the object defect data, and the defect data 714 is not selected.
It is considered that the user tends to arrange defect data and defect areas, which the user pays particular attention to, in the center of the window and browse them. Therefore, it is assumed that the defect data existing in the vicinity of the center of the captured image being displayed is selected in this manner. Thus, defect data of which the user is particularly aware can be selected as the target defect data.
As another example, the information processing apparatus 200 may further include a camera (not shown), and the selection section 307 may obtain a gaze direction of the user from the captured image and select defect data displayed in front of the gaze direction as the target defect data.
As another example, the selection section 307 may select the object defect data in response to a user operation. When the user selects defect data by using the mouse cursor, the selection section 307 selects the selected defect data as target defect data. Further, as described above, in a case where the user selects (clicks) the defect data or performs mouse-over on the defect data, the information processing apparatus 200 may receive the display change command and further select the selected defect data as the target defect data.
Further, the number of object data is not limited to one. For example, the selection section 307 may select all of the plurality of defect data displayed on the display unit 205 as the target defect data. In the case where the user selects a plurality of defect data by range designation, all of the selected defect data may be selected as the target defect data.
As another example, in response to a defect data selection by the user, the selection part 307 may also select other defect data related to the selected defect data as the target defect data. For example, the selection section 307 selects defect data overlapping the selected defect data and adjacent defect data as target defect data. In the captured image shown by the window 720 of fig. 7B, there are cracks 722, 723, and 724 and a precipitate 725. Here, it is assumed that the user selects the crack 722. In this case, the selection portion 307 selects, as the target defect data, the defect data of the precipitates 725 overlapping with the cracks 722 in addition to the cracks 722. Further, when the user selects the precipitate defect data 725, the selection part 307 selects not only the defect data 725 but also the crack defect data 722 and 723 overlapping the defect data 725 as the object defect data.
As another example, the selection part 307 may also select other defect data as the target defect data in consideration of continuity with the defect data selected by the user. For example, in the example of fig. 7B, since the respective end points of the crack defect data 722 and 723 are close to each other and the respective directions of the crack defect data 722 and 723 are similar to each other, there is a possibility that the crack defect data 722 and 723 are actually continuous cracks. In such a case where there is an adjacent crack, when the user selects the crack defect data 722, the selection section 307 selects not only the crack defect data 722 but also the defect data 723 as the target defect data.
Next, the shift parameter determination processing in S605 will be described. The shift parameter p is a parameter by which the defect data moves in the plane of the captured image, and is defined as equation 1.
[ number 1]

Fig. 8 is a diagram for explaining the shift parameter p. If it is assumed that the display position of the defect data 800 indicated by the broken line in fig. 8 is a and the position of the moving destination of the defect data 800 is B, the position B can be identified by the moving amount r and the moving direction θ from the position a. The determination unit 308 calculates a shift cost C based on the shift parameter p n (p) to obtain appropriate shift parameters (which can make it easy for the user to browse the shifts of the captured image and the defect data while comparing the captured image and the defect data). Then, the determination section 308 obtains the shift parameter p that minimizes the shift cost according to equation 2.
[ number 2]

Cost of displacement C n (p) shift costs for several different criteria including the following. Here, w n Are weights that are applicable to various shift costs. Hereinafter, in the present embodiment, the shift cost C is set to n (p), three kinds of shifts will be described. However, the shift cost calculation method is not limited thereto, and other methods may be used.
First, the first shift cost C will be described 1 (p) of the formula (I). Cost C of the first shift 1 (p) is defined as an overlap cost with the initial position of the object defect data. The reason for moving the display position of the object defect data is to facilitate viewing of the captured image of the area superimposed by the object defect data. Therefore, when moving the target defect data from the initial position of the target defect data, it is not preferable to move the target defect data to a destination which is a defective area corresponding to the target defect data or to a destination which is a defective area corresponding to other defect data. Therefore, when the object defect data is shifted by the shift parameter p, the shift cost C is added 1 (p) is set to a value proportional to the number of overlapped pixels between the display position after the movement and the display position before the movement.
FIGS. 9A and 9B are diagrams for explaining the shift parameter p and the shift cost C 1 (p) a graph of the relationship between. First, in each of fig. 9A and 9B, positions 901 and 902 indicated by broken lines are display positions corresponding to a defective region. On the other hand, positions 911 and 912 indicated by solid lines in fig. 9A are the shift parameter p with the object defect data 1 Corresponding to the moved position. Likewise, the positions 921 and 922 indicated by the solid lines in fig. 9B are associated with the shift parameter p 2 Corresponding to the moved position. In each of fig. 9A and 9B, the shift cost C 1 (p) is a value proportional to the number of overlapping pixels between the object defect data arranged at the shifted position and the defective region.
In the example of fig. 9A and 9B, the number of overlapping pixels at positions 921 and 922 of fig. 9B is greater than the number of overlapping pixels at positions 911 and 912 of fig. 9A. Therefore, if it is assumed that the shift cost corresponding to the example of fig. 9A and the shift cost corresponding to the example of fig. 9B are C1 (p), respectively 1 ) And C1 (p) 2 ) Then the relation C1 (p) is obtained 1 )<C1(p 2 ). That is, it can be understood that the shift parameter p at the position a of fig. 8 1 Is a desired parameter, so that as shown in equation (2), a shift parameter p for reducing the shift cost is finally selected 1 。
Next, the description will be given ofTwo shift cost C 2 (p) of the formula (I). Second shift cost C 2 (p) is a value calculated based on the position of the image edge located at the moved position of the defect data, and becomes larger as the overlap with the edge portion becomes larger. There is a possibility that an image edge portion of a captured image of a concrete wall surface is a defect such as a crack, a deposit, or the like. Therefore, the possibility that the image edge portion like this is an image portion that the user wants to observe is high, so that it is preferable that the relevant image edge portion is not superimposed by the defect data.
To calculate the shift cost C 2 (p), first, edge pixels of the captured image must be identified. For this reason, the information processing apparatus 200 first performs edge detection processing on the captured image. For the edge detection method, a known method such as Sobel filtering, Canny, or the like can be used. The determination section 308 sets a value proportional to the number of overlapping pixels overlapping the edge pixel and the defect data shifted by the shift parameter p as the shift cost C 2 The output value of (p).
Next, the third shift cost C will be described 3 (p) of the formula (I). Calculating a third shift cost C according to a distance from a defective area corresponding to the defect data 3 (p) of the formula (I). When the moving amount r of the defect data is small, there is a case where the overlap with the defect region cannot be eliminated. On the other hand, when the moving amount r is too large, it is difficult to understand the correspondence between the defect area and the defect data, so that it is difficult to compare the images. Cost of displacement C 3 (p) is a cost for adjusting the amount of movement of the defect data to be within a predetermined range.
For example, the shift cost C can be calculated by equation 3 3 (p)。
[ number 3]
C 3 (p)=(r-β) 2 … formula 3
In equation 3, β is a standard shift amount and is given as a constant. Here, β may be set in an arbitrary manner. For example, the determination section 308 may determine the amount according to the resolution (display magnification) of the captured image and the defect data at the time of browsing. More specifically, the determination section 308 may set β to a relatively large value when displayed in an enlarged manner, and may set β to a relatively small value when displayed in a reduced manner.
As another example, the determination section 308 may select an optimal shift parameter p as the shift parameter p from predetermined shift parameters p for the purpose of simplifying the calculation. For example, as shown in fig. 10, m shift parameters p are preset in the HDD204 or the like 1 To p m The determination section 308 obtains a shift parameter p for minimizing expression 2 from among the m shift parameters.
At a shift parameter C 1 (p) and C 2 In (p), the movement amount r and the movement direction θ of the shift parameter p are obtained. As another example, the determination section 308 may calculate the shift parameter while setting one of these movement amounts and movement directions to a fixed value. For example, the determination section 308 may obtain the shift parameter p in a manner to optimize the movement amount r while always fixing the movement direction θ. Further, the user may specify the movement direction θ, and the determination section 308 may calculate only the movement amount r with respect to the movement direction θ specified by the user. Conversely, the user may specify the amount of movement, and the determination section 308 may calculate only the movement direction θ with respect to the amount of movement r specified by the user.
Next, the display position changing process of the object defect data in S606 will be described. In S606, the display control unit 306 moves the defect data to the display position determined by the shift parameter determined in S605. In the present embodiment, the display control unit 306 moves all the defect data being displayed.
As another example, the display control section 306 may move only the object defect data. Further, as another example, the display control section 306 may change the positional relationship between the captured image and the defect data by moving the captured image without moving the defect data according to the shift parameter p.
The generated display image is displayed on the display unit 205. Fig. 11 is a diagram showing an example in which a display image is displayed on the application window 1100. In comparison with fig. 1C, the defect data 111 and 112 of fig. 11 are in a shift display state corresponding to the shift parameter p. As a result, the portion of the defective region 102 that is difficult to confirm in the simple overlap display (fig. 1C) is in an easy-to-view state. Accordingly, the user can compare and confirm the defect area 102 of the photographed image of the concrete wall surface and the corresponding defect data 111. In addition, the user can compare and confirm the area of the captured image corresponding to the defect data 112 (the defect data 112 corresponds to the error detection) and the defect data 112.
In addition, the display control section 306 may display the defect data together with information such as a shift parameter or the like. In the example of fig. 11, the amount of movement and the direction of movement are indicated by the length and direction of arrow 1110, respectively. The display control section 306 may also display information indicating a correspondence relationship between the defect data and the initial position of the defect data displayed shifted. In the example of fig. 11, the relationship with the initial position of the defect data of the shifted display is indicated by a small arrow 1111. Further, as shown in fig. 11, the display control section 306 may display a numerical value "5 pixels" indicating the shift amount. As another example, the display control section 306 may represent the magnitude of the movement amount by brightness or color.
As described above, the information processing apparatus 200 according to the present embodiment selects target defect data from the defect data, determines the display position of the target defect data after movement based on the target defect data, moves the target defect data to the determined display position, and displays the target defect data. Thus, the user can compare and confirm the defective area and the corresponding defect data. In other words, the information processing apparatus 200 can provide a user interface that facilitates confirmation operations for a defect (object) in an image and an image showing the defect (object) without requiring complicated operations by the user.
As a first modification of the first embodiment, the information processing apparatus 200 is capable of performing the embodiment-related processing not only on a defective area of a captured image and corresponding defect data, but also on a predetermined area of the captured image and related data related to the predetermined area.
Further, as a second modification, the information processing apparatus 200 may switch and display the display position of the defect data by referring to the plurality of shift parameters p. For example, the determination unit 308 calculates a shift cost for each of the m shift parameter candidates shown in fig. 10. Then, the shift parameters having the costs equal to or less than the predetermined value are arranged in descending order of the costs. Then, the display control section 306 first determines the display position based on the shift parameter having the lowest cost, and controls to display the image in which the defect data is arranged at the determined display position.
Here, when a shift display change instruction is accepted from the user, the display control section 306 determines a display position based on the second shift parameter, and controls to display the image in which the defect data is arranged at the determined display position. As just described, the display control section 306 may change the display position of the defect data by changing the shift parameter in the arrangement order each time an instruction is received from the user. Thus, the user can cause the defect data to be displayed at a desired position.
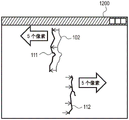
Further, as a third modification, when a plurality of object defect data are selected, the information processing apparatus 200 may calculate the shift parameter of each object defect data individually. Then, the information processing apparatus 200 can determine the moved display position of the defect data by using the shift parameter corresponding to each defect data. The defect data 111 and 112 in the window 1200 of fig. 12 are respectively moved based on the appropriate shift parameters. This is the case: for example, due to the influence of the image edge of the captured image of the concrete wall surface, etc., a shift parameter in the direction opposite to the defect data 111 is calculated for the defect data 112.
Further, as a fourth modification, the determination section 308 may correct the automatically calculated shift parameter in response to a user operation. The display control unit 306 displays the automatically calculated shift amount r and shift direction θ of the shift parameter in a field on the GUI. It is desirable that the user who displays the defect data with a shift parameter different from the automatically calculated shift parameter inputs in order to change the values of the movement amount r and the movement direction θ displayed in the field. Thus, the user can browse by correcting the automatically calculated shift parameter. In addition, the processing related to correction of the shift parameter by the user is not limited to numerical value input to the GUI field. As another example, the display control section 306 may display the parameter in a GUI bar so that the user can correct the parameter by moving the bar.
(second embodiment)
Next, the information processing apparatus 200 according to the second embodiment will be described. The information processing apparatus 200 according to the second embodiment obtains the main line direction of the object defect data, and calculates the shift parameter based on the obtained main line direction. Hereinafter, this operation will be described by taking cracking as an example. Incidentally, the information processing apparatus 200 according to the second embodiment determines the shift parameter p by fixing the movement amount r and obtaining the movement direction θ.
Fig. 13 is a diagram for explaining a calculation method of the displacement parameter p in the case where the crack object defect data 1300 is selected. First, the determination unit 308 calculates the main line direction of the target defect data 1300. In fig. 13, a main line direction of the object defect data 1300 is indicated by a dotted line 1301. Although the dominant line direction 1301 may be calculated in any manner, the direction may be obtained simply by connecting the start point and the end point of the object defect data 1300, for example.
Then, the determination section 308 obtains a direction orthogonal to the main line direction 1301 as the movement direction θ. For the crack 1300, two moving directions are obtained, and corresponding to these directions, the shift parameters p3 and p4 are calculated as shown in fig. 13.
Subsequently, the display control section 306 controls to generate an image in which the defect data is shifted by one of the shift parameters and display the generated image on the display unit 205. Then, when the user inputs a change of the shift parameter, the display control section 306 controls to generate an image in which the defect data is shifted by another shift parameter and display the generated image.
Incidentally, other configurations, constructions, and processes of the information processing apparatus 200 according to the second embodiment are similar to those of the information processing apparatus 200 according to the first embodiment. As just described, the information processing apparatus 200 according to the present embodiment can determine the shift parameter according to the main line direction of the defect. Accordingly, the defect data can be made to be displayed at an appropriate position.
As a modification of the second embodiment, a plurality of defect data may be selected as the target defect data. In this case, the determination section 308 calculates the main line direction of each of the plurality of target defect data (cracks). Then, the determination section 308 determines the shift parameter p having a direction orthogonal to the statistical dominant line direction obtained from the plurality of dominant line directions as the movement direction θ. Here, the statistical dominant line direction is a direction obtained by taking an average value or a median value of a plurality of dominant line directions, for example.
(third embodiment)
Next, the information processing apparatus 200 according to the third embodiment will be described. The information processing apparatus 200 according to the third embodiment automatically selects the target defect data based on the attribute of the defect data. The attributes of the defect data referred to are as follows. First, it is assumed that the defects are cracks, and each crack has crack thickness attribute information as shown in fig. 4. In this case, the selection unit 307 refers to the thickness attribute, and selects a relatively thin crack as the target defect data for the following reasons. That is, since it is difficult to determine whether or not a fine crack is a crack, an input operator error and an automatic detection error are likely to occur for the fine crack. Therefore, the fine cracks are defects that should be confirmed in detail.
In addition, it is generally difficult to judge whether or not a crack overlapping with a precipitate or the like is a crack. Therefore, the determination section 308 refers to the attribute information indicating whether or not the crack overlaps with the precipitate, and selects the crack having the overlap as the target defect data. In this case, it is assumed that attribute information indicating whether or not a crack overlaps with a precipitate is stored in the defect data storage section 302 as defect data.
Further, the detection section 304 may automatically detect the defect data and thereby obtain a score indicating the reliability of the detection result. Further, the selection section 307 may select, as the target defect data, defect data corresponding to a defect region of a relatively low score such as a score smaller than a threshold value. When the reliability score is low, it is preferable for the user to confirm the automatic detection result. By selecting the corresponding defect data as the target defect data, detailed confirmation can be preferentially performed.
Incidentally, other configurations, constructions, and processes of the information processing apparatus 200 according to the third embodiment are similar to those of the information processing apparatus 200 according to other embodiments. In the information processing apparatus 200 according to the third embodiment, an appropriate defective area can be selected without a user operation.
As a modification of the third embodiment, the selection portion 307 may determine attribute information to be referred to when selecting object defect data according to the browsing state of the user. For example, the selection unit 307 selects the crack defect data when the captured image is being viewed at a high resolution (enlarged size), and selects the defect data of the region having the deposit or the like when the captured image is being viewed at a low resolution (reduced size). When a captured image is being browsed at high resolution, it is likely that a user is confirming a minute defect such as a crack. In contrast, when a captured image is being browsed at a low resolution, since a wide area is being browsed, it is highly likely that the user is confirming a diffusion defect such as a precipitate or the like. In this case, the object data to be selected may be changed according to the browsing state of the user.
(fourth embodiment)
Next, an information processing apparatus 200 according to a fourth embodiment will be described. In the fourth embodiment, as an example of a display parameter other than the shift parameter, the transparency α will be described. The display control section 306 calculates transparency α as a display parameter, and changes the transparency of the defect data located around the object defect data. Thus, the user can more easily view the object defect data. Here, the display parameter is a parameter for making the display form of the target defect data different from that of the other defect data.
Fig. 14A and 14B are diagrams for explaining the present embodiment. Fig. 14A is an example showing that a plurality of defect data are displayed close to each other, that is, crack defect data 1401, 1402, and 1403 and precipitate defect data 1404 are displayed close to each other. Here, it is assumed that the defect data 1401 is selected as the target defect data by the selection of the user or the like. In this regard, the display control section 306 sets the display parameter of the transparency α of the defect data (i.e., other defect data) other than the target defect data. It is assumed that the transparency α is set by the user through numerical input or is input by the user through a parameter bar on the GUI. The transparency α is a value indicating the degree of transparent display, and is a parameter having a value of 0% to 100%. The display control part 306 sets the transparency α of the other defect data to a preset value (for example, 50%). Thus, a display image through which other defect data is transmitted can be generated.
Fig. 14B is a diagram showing a state in which defect data other than the target defect data 1411 is displayed in a transparent state by the processing described above. The other defect data 1412, 1413, and 1414 indicated by dotted lines indicate that these other defect data are displayed in a transparent state. By displaying in this way, it is possible for the user to confirm only the target defect data 1411 in detail. Specifically, the object defect data 1411 overlaps with other defect data (precipitates) 1414. Therefore, by making the display of the other defect data 1414 transparent, the overlapping portion can be confirmed in detail.
Further, the display control unit 306 may set the transparency α according to the distance between the target defect data and the other defect data. For example, the display control unit 306 sets a higher transparency as the distance from the target defect data is shorter. Thus, the display control section 306 can generate the following display image: in the display image, other defect data located in the vicinity of the object defect data is transparent (non-displayed), and the other defect data can be displayed as it is distant to the periphery. As a result, the user can easily browse the target defect data and can confirm the surrounding defect data. Incidentally, other configurations, constructions, and processes of the information processing apparatus 200 according to the fourth embodiment are similar to those of the information processing apparatus 200 according to the other embodiments. As just described, the information processing apparatus 200 according to the fourth embodiment can improve the visibility of the object defect data by increasing the transparency of the other defect data.
As a first modification of the fourth embodiment, the display control section 306 may change the transparency of the object defect data without changing the transparency of the other defect data. As just described, the transparency of the object defect data may be made different from the transparency of the other defect data. As another example, the display control section 306 may select whether to change the transparent object to the object defect data or other defect data according to a user instruction.
As described above, in the fourth embodiment, an example of using the transparency α as a display parameter other than the shift parameter is described. As a second modification, the display parameter other than the shift parameter is not limited to the transparency α, and other parameters may be used. For example, the information processing apparatus 200 may change the blurring strength σ as the display parameter. The blurring strength σ is a parameter indicating the width of Gaussian filtering, and when a large value is set, a blurred image can be generated. The display control unit 306 sets a larger value for the blurring strength σ of the other defect data as the distance from the target defect data is closer. Thus, a display image that blurs other defect data can be generated.
(fifth embodiment)
Next, the information processing apparatus 200 according to the fifth embodiment will be described. In the information processing apparatus 200 according to the fifth embodiment, the determination section 308 first calculates the shift parameter p. At this time, the movement amount r of the shift parameter p may become a small value. When the movement amount r is a small value, the defect data is hardly moved from its initial position. Therefore, it is difficult to browse the captured image of the area superimposed by the defect data. In this case, in the present embodiment, when the movement amount r is equal to or smaller than the threshold, the display control section 306 changes the transparency α of the object defect data.
For example, the display control unit 306 sets the transparency α to the target defect data to be higher as the movement amount r is smaller. The reason why the higher transparency α is set as the movement amount r is smaller is to facilitate viewing of the captured image of the region superimposed by the object defect data. Thus, the object defect data slightly moves corresponding to the shift parameter p, and is displayed in a transparent state corresponding to the transparency α. Thus, even when the moving amount from the initial position is small, it is possible to facilitate browsing of the captured image of the region superimposed by the object defect data.
Incidentally, other configurations, constructions, and processes of the information processing apparatus 200 according to the fifth embodiment are similar to those of the information processing apparatus 200 according to the other embodiments. As just described, the information processing apparatus 200 according to the fifth embodiment changes the transparency of the object defect data while changing the shift parameter, so that it is possible to facilitate browsing of the photographed image of the area superimposed by the object defect data.
As a modified example of the fifth embodiment, the display parameter is not limited to the transparency α. Another example is the blur strength σ. As another display parameter, the display control section 306 may use a periodic display flag that periodically presents (on) and shields (off) the object display image. In this case, when the shift parameter with the small movement amount r is calculated, the display control unit 306 sets the periodic display of the target defect data to be on, and controls the target defect data to be displayed in a blinking manner. Thus, even when the moving amount r is small, it is possible to facilitate browsing of the captured image of the region superimposed by the object defect data.
(sixth embodiment)
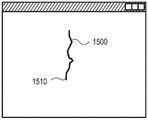
Next, an information processing apparatus 200 according to a sixth embodiment will be described. The information processing apparatus 200 according to the sixth embodiment arranges and displays a plurality of defect data of different sources in the vicinity of a defect region (array and display). Fig. 15A and 15B are diagrams showing an example of shift display of defect data arrangements respectively generated at different times. For example, it is assumed that defect data corresponding to the results of two-year-once inspection in 2012, 2014, and 2016 of the concrete wall surface of the object structure is stored. In order to confirm the aging defect of the structure, defect data of different times is recorded as described above. As such, it is assumed that such defect data of different sources is stored in the defect data storage section 302.
In fig. 15A, first, defect data 1510 corresponding to the defect data recorded in 2016 is superimposed and displayed on a defect area 1500 of the concrete wall surface image. Fig. 15B shows a display image displayed when the user issues a display change command in the state where the defect data 1510 is selected as the target defect data in fig. 15A. In fig. 15B, three defect data 1510, 1511, and 1512 are shown with respect to the defective area 1500. The defect data 1511 is defect data corresponding to the recording in 2014, and the defect data 1512 is defect data corresponding to the recording in 2012. The defect data 1510, 1511, and 1512 are displayed shifted in the order of the recording year.
The information processing apparatus 200 according to the sixth embodiment calculates the shift parameter p of the defect data 1510 corresponding to the latest record through the processing described in the first embodiment, and displays the defect data 1510. Further, the information processing apparatus 200 displays the defect data 1511 and 1512 by further shifting the past defect data 1511 and 1512 in the direction in which the shift parameter p of the defect data 1510 is shifted in the direction of the shift direction θ. When there are a plurality of past defect data, it is preferable to display the plurality of defect data in chronological order, as shown in fig. 15B.
Further, the information processing apparatus 200 may display the plurality of defect data along the time series with the same interval, or may display the plurality of defect data with intervals corresponding to respective shooting times of the plurality of defect data. Thus, the user can easily confirm the secular change of the defective region. Incidentally, other configurations, constructions, and processes of the information processing apparatus 200 according to the sixth embodiment are similar to those of the information processing apparatus 200 according to other embodiments.
A modification of the sixth embodiment will be described. In a case where the input result of the input operator and the automatic detection result are recorded in the same defect area, respectively, the information processing apparatus 200 may display two defect data corresponding to the two detection results. Fig. 16 is a diagram showing an example in which defect data 1610 corresponding to defect data input by an input operator and defect data 1611 corresponding to an automatic detection result are simultaneously displayed shifted in a defect area 1600 of a captured image.
In fig. 16, defect data 1610 and 1611 are displayedOn opposite sides of defect region 1600. In order to display the two defect data in this manner, for example, the shift parameter p described in the second embodiment may be applied 3 And p 4 . As another example, the information processing apparatus 200 may arrange and display the defect data 1610 corresponding to the defect data input by the input operator and the defect data 1611 corresponding to the automatic detection result in the same direction.
Incidentally, the defect data to be simultaneously arranged and displayed are not limited to those in the embodiment. As another example, the information processing apparatus 200 may simultaneously display defect data input by a plurality of different input operators. Thus, a plurality of defect data having different generation steps can be compared and confirmed.
As a second modification, the information processing apparatus 200 may display defect data generated at different times or display defect data of different sources, respectively, in a display method other than shift display. For example, the information processing apparatus 200 may assign and display different colors to defect data generated at different times or defect data of different sources. More specifically, for example, the information processing apparatus 200 color-codes defect data respectively generated at different times, sets new defect data as a lower layer, sets old defect data as an upper layer, and displays them. Thus, the state of the defect progress can be confirmed.
As just described, according to the above embodiments, it is possible to provide a user interface that facilitates a confirmation operation of an area in an image and associated data corresponding to the area without requiring a complicated operation by a user.
Although the present invention has been described in detail based on the preferred embodiments of the present invention, the present invention is not limited to these specific embodiments. That is, various embodiments within a scope not departing from the gist of the present invention are also included in the present invention. For example, a part of the above embodiments may be appropriately combined. That is, by combining the second embodiment with the second modification of the first embodiment, individual shift parameters corresponding to the dominant line direction can be set for each of the plurality of object regions.
Further, in each of the above embodiments, the case where the image indicating the defect is displayed superimposed on the captured image obtained by capturing the infrastructure structure is described. However, the present invention is not limited to these embodiments. For example, the present invention can also be applied to a case where an image indicating the position of a blood vessel is displayed superimposed in a medical image including a blood vessel. That is, the present invention can be widely applied to an embodiment in which a map indicating the positions of a plurality of objects (defects in a structure, blood vessels, and the like) is superimposed and displayed on an image including the plurality of objects. Therefore, the "defect" in each of the above embodiments is an example of the "object" in the present invention.
(other embodiments)
The present invention can also be realized by: a program for realizing one or more functions in the above embodiments is supplied to a system or an apparatus via a network or a storage medium, and one or more processors in the system or the apparatus read and execute the supplied program. Furthermore, the present invention can also be implemented by a circuit (e.g., ASIC) that implements one or more functions.
Priority of japanese patent application No. 2016-.
Description of the reference numerals
200 information processing apparatus
304 detection part
306 display control unit
307 selection part
308 determination unit
Claims (21)
1. An information processing apparatus, comprising:
an obtaining unit configured to obtain first data indicating a first defect photographed at a first time and second data corresponding to the first defect photographed at a second time before the first time, the first defect being a structural defect; and
a display control unit configured to display area information for determining an area including a first defect in a structure, the first data, and the second data such that the first data and the second data are simultaneously displayed.
2. The information processing apparatus according to claim 1, wherein the display control unit displays the first data and the second data such that the first data does not overlap with the second data.
3. The information processing apparatus according to claim 1 or 2, wherein the first defect includes a crack on the structure.
4. The information processing apparatus according to claim 1 or 2,
wherein the first defect comprises a crack on the structure, and
wherein the display control unit displays: first data represented by a color line corresponding to a crack thickness of the first defect indicated by the first data, and second data represented by a color line corresponding to a crack thickness of the first defect indicated by the second data.
5. The information processing apparatus according to claim 1 or 2,
wherein the obtaining unit further obtains third data corresponding to a first defect photographed at a third time before the second time,
wherein the display control unit displays the first data, the second data, and the third data in order of the photographing times of the first data, the second data, and the third data.
6. The information processing apparatus according to claim 1 or 2, wherein the region information is an image of a first defect taken at the first time.
7. The information processing apparatus according to claim 6, wherein the display control unit displays the first data, the second data, and the region information such that the first data, the second data, and the first defect included in the region information do not overlap with each other.
8. The information processing apparatus according to claim 1 or 2, wherein the display control unit displays first data and second data that overlap with the region information.
9. The information processing apparatus according to claim 8, the information processing apparatus further comprising:
a determination unit configured to determine a positional relationship between the first data, the second data, and the region information to overlap the first data and the second data with the region information such that an overlapping area by overlapping the first data or the second data with a first defect of the region information is smaller than an overlapping area by overlapping the first data or the second data with a position of the first defect of the region information,
wherein the display control unit displays the first data, the second data, and the area information according to the positional relationship determined by the determination unit.
10. The information processing apparatus according to claim 9, wherein the determination unit determines a position shifted from a position of the first defect of the area information in a direction determined based on a main line direction of the first defect, as a position for overlapping the first data or the second data with the area information.
11. The information processing apparatus according to claim 9, further comprising:
a calculation unit configured to calculate a score of a positional relationship between the first data, the second data, and the area information,
wherein the determination unit determines a position at which the first data or the second data overlaps the region information based on the score.
12. The information processing apparatus according to claim 11,
wherein the calculation unit calculates respective scores for a plurality of candidates, an
Wherein the determination unit determines a position indicated by a candidate selected based on each score of the plurality of candidates as a position at which the first data or the second data overlaps the region information.
13. The information processing apparatus according to claim 11, wherein the score is calculated based on at least one of a value relating to overlapping of the first data or the second data with the first defect included in the area information and a value relating to a distance from the first data or the second data to the first defect included in the area information.
14. The information processing apparatus according to claim 1 or 2, further comprising:
an identification unit configured to identify a predetermined area among areas indicated by the area information,
wherein the obtaining unit obtains data indicating a first defect included in the predetermined area identified by the identifying unit.
15. The information processing apparatus according to claim 14, wherein the identifying unit identifies the predetermined area based on an area specified by a user in the area information.
16. The information processing apparatus according to claim 1 or 2, wherein the first data or the second data is data indicating a detection result of a predetermined detection process of detecting a defect from an image.
17. The information processing apparatus according to claim 1 or 2,
wherein the first data or the second data is data representing a defect, an
Wherein the display control unit displays the first data or the second data by representation according to the data.
18. The information processing apparatus according to claim 1 or 2, wherein the display control unit displays the first data and the second data such that an interval between a point of the first data and a point of the second data is an interval corresponding to a time difference between the first time and the second time, the point of the first data corresponding to the point of the second data.
19. The information processing apparatus according to claim 1 or 2,
wherein the obtaining unit further obtains third data corresponding to the first defect photographed at a third time before the second time, an
Wherein the display control unit displays the first data, the second data, and the third data so that the same interval is provided between a point of the first data and a point of the second data and between a point of the second data and a point of the third data.
20. The information processing apparatus according to claim 1 or 2, wherein the display control unit displays the first data and the second data represented by different colors from each other based on a shooting time of the first defect indicated by the first data and the second data.
21. A method of controlling an information processing apparatus, the method comprising:
obtaining first data and second data, the first data indicating a first defect taken at a first time, the second data corresponding to a first defect taken at a second time prior to the first time, the first defect being a structural defect; and
displaying region information, the first data, and the second data such that the first data and the second data are simultaneously displayed, the region information being used to determine a region including a first defect on the structure.
Applications Claiming Priority (4)
| Application Number | Priority Date | Filing Date | Title |
|---|---|---|---|
| JP2016-134421 | 2016-07-06 | ||
| JP2016134421A JP6833366B2 (en) | 2016-07-06 | 2016-07-06 | Information processing device, control method and program of information processing device |
| CN201780042334.7A CN109477800A (en) | 2016-07-06 | 2017-06-19 | Information processing unit, information processing method and program |
| PCT/JP2017/022444 WO2018008370A1 (en) | 2016-07-06 | 2017-06-19 | Information processing device, information processing method and program |
Related Parent Applications (1)
| Application Number | Title | Priority Date | Filing Date |
|---|---|---|---|
| CN201780042334.7A Division CN109477800A (en) | 2016-07-06 | 2017-06-19 | Information processing unit, information processing method and program |
Publications (1)
| Publication Number | Publication Date |
|---|---|
| CN114792309A true CN114792309A (en) | 2022-07-26 |
Family
ID=60912714
Family Applications (2)
| Application Number | Title | Priority Date | Filing Date |
|---|---|---|---|
| CN202210449427.4A Pending CN114792309A (en) | 2016-07-06 | 2017-06-19 | Information processing apparatus, control method of information processing apparatus, and storage medium |
| CN201780042334.7A Pending CN109477800A (en) | 2016-07-06 | 2017-06-19 | Information processing unit, information processing method and program |
Family Applications After (1)
| Application Number | Title | Priority Date | Filing Date |
|---|---|---|---|
| CN201780042334.7A Pending CN109477800A (en) | 2016-07-06 | 2017-06-19 | Information processing unit, information processing method and program |
Country Status (5)
| Country | Link |
|---|---|
| US (2) | US11105749B2 (en) |
| EP (2) | EP3483594A4 (en) |
| JP (1) | JP6833366B2 (en) |
| CN (2) | CN114792309A (en) |
| WO (1) | WO2018008370A1 (en) |
Families Citing this family (17)
| Publication number | Priority date | Publication date | Assignee | Title |
|---|---|---|---|---|
| JP6833366B2 (en) | 2016-07-06 | 2021-02-24 | キヤノン株式会社 | Information processing device, control method and program of information processing device |
| JP6936957B2 (en) * | 2017-11-07 | 2021-09-22 | オムロン株式会社 | Inspection device, data generation device, data generation method and data generation program |
| CN111684267B (en) * | 2018-02-02 | 2024-06-28 | 富士胶片株式会社 | Image processing apparatus and image processing method |
| JP7330710B2 (en) * | 2018-04-26 | 2023-08-22 | キヤノン株式会社 | Information processing device, information processing method and program |
| JP7095418B2 (en) * | 2018-06-08 | 2022-07-05 | 株式会社リコー | Drawing device, diagnostic system, drawing method, and program |
| JP7187830B2 (en) * | 2018-06-13 | 2022-12-13 | 富士通株式会社 | Image processing program, image processing apparatus, and image processing method |
| CN109493331B (en) * | 2018-11-06 | 2021-09-28 | 中国林业科学研究院资源信息研究所 | Method for rapidly acquiring overlapping area of two images based on parallel computing algorithm |
| JP7517641B2 (en) * | 2018-11-19 | 2024-07-17 | 国立研究開発法人産業技術総合研究所 | Structure inspection and repair support system |
| JP7305509B2 (en) * | 2018-12-07 | 2023-07-10 | キヤノン株式会社 | Information processing device, its control method, program, and storage medium |
| JP7282551B2 (en) * | 2019-03-01 | 2023-05-29 | キヤノン株式会社 | Information processing device, information processing method and program |
| WO2021200675A1 (en) * | 2020-04-01 | 2021-10-07 | 富士フイルム株式会社 | Three-dimensional display device, three-dimensional display method, and program |
| JP7547069B2 (en) | 2020-04-06 | 2024-09-09 | キヤノン株式会社 | Information processing device, information processing method and program for information processing device |
| JP2022056085A (en) * | 2020-09-29 | 2022-04-08 | キヤノン株式会社 | Information processing device, information processing method, and program |
| JP7510472B2 (en) | 2021-12-03 | 2024-07-03 | キヤノン株式会社 | Information processing device, information processing method, and program |
| JP2023168950A (en) * | 2022-05-16 | 2023-11-29 | キヤノン株式会社 | Image processor, method for processing image, and program |
| EP4431921A1 (en) * | 2023-03-17 | 2024-09-18 | Ricoh Company, Ltd. | Information processing apparatus, information processing method, carrier means, and information processing system |
| CN116385434B (en) * | 2023-06-02 | 2023-08-08 | 同济检测(济宁)有限公司 | Intelligent detection method for precast beam cracks |
Family Cites Families (35)
| Publication number | Priority date | Publication date | Assignee | Title |
|---|---|---|---|---|
| JPS5766345A (en) * | 1980-10-09 | 1982-04-22 | Hitachi Ltd | Inspection device for defect |
| JPH05242178A (en) * | 1992-02-27 | 1993-09-21 | Meidensha Corp | Recognition result display and correction system of automatic drawing input device |
| US5389789A (en) * | 1992-05-20 | 1995-02-14 | Union Camp Corporation | Portable edge crack detector for detecting size and shape of a crack and a portable edge detector |
| US5517861A (en) * | 1994-10-11 | 1996-05-21 | United Technologies Corporation | High temperature crack monitoring apparatus |
| JPH10105678A (en) | 1996-09-26 | 1998-04-24 | Toshiba Corp | Device and method for processing image |
| JPH11132961A (en) * | 1997-10-29 | 1999-05-21 | Nikon Corp | Inspection apparatus for structure |
| US6427024B1 (en) * | 1999-04-02 | 2002-07-30 | Beltronics, Inc. | Apparatus for and method of automatic optical inspection of electronic circuit boards, wafers and the like for defects, using skeletal reference inspection and separately programmable alignment tolerance and detection parameters |
| US7050087B2 (en) * | 2000-12-06 | 2006-05-23 | Bioview Ltd. | Data acquisition and display system and method |
| JP4588901B2 (en) * | 2001-03-02 | 2010-12-01 | 株式会社竹中工務店 | Defect inspection method for concrete and defect inspection apparatus for concrete |
| JP3759110B2 (en) * | 2003-01-16 | 2006-03-22 | 川崎重工業株式会社 | Ultrasonic flaw detection method and apparatus |
| JP4695508B2 (en) * | 2005-12-28 | 2011-06-08 | 三星電子株式会社 | Imaging apparatus and imaging method |
| US8102522B2 (en) * | 2006-06-30 | 2012-01-24 | Hitachi High-Technologies Corporation | Inspection apparatus and inspection method |
| JP4848532B2 (en) * | 2006-08-21 | 2011-12-28 | 名古屋市 | Road surface image creation method and road surface image creation device |
| US8134554B1 (en) * | 2007-05-04 | 2012-03-13 | Topcon Medical Systems, Inc. | Method and apparatus for spatially mapping three-dimensional optical coherence tomography data with two-dimensional images |
| JP5523681B2 (en) * | 2007-07-05 | 2014-06-18 | 株式会社東芝 | Medical image processing device |
| JP5324181B2 (en) * | 2008-10-07 | 2013-10-23 | 日清紡ホールディングス株式会社 | Solar cell inspection device, solar cell inspection method, program, solar cell inspection system |
| JP5479782B2 (en) * | 2009-06-02 | 2014-04-23 | 株式会社日立ハイテクノロジーズ | Defect image processing apparatus, defect image processing method, semiconductor defect classification apparatus, and semiconductor defect classification method |
| JP2011232110A (en) * | 2010-04-26 | 2011-11-17 | Olympus Corp | Inspection device and defect detection method using inspection device |
| JP5324537B2 (en) * | 2010-09-06 | 2013-10-23 | 富士フイルム株式会社 | Stereoscopic image display control device, operation control method thereof, and operation control program thereof |
| KR101806964B1 (en) * | 2011-12-02 | 2017-12-11 | 삼성전자주식회사 | Method for manufacturing photomask and photomask of manufacturing using it |
| JP6080379B2 (en) * | 2012-04-23 | 2017-02-15 | 株式会社日立ハイテクノロジーズ | Semiconductor defect classification device and program for semiconductor defect classification device |
| JP6029870B2 (en) * | 2012-06-27 | 2016-11-24 | 公益財団法人鉄道総合技術研究所 | Method and apparatus for detecting deformation of concrete surface |
| JP5957357B2 (en) * | 2012-10-15 | 2016-07-27 | 株式会社日立ハイテクノロジーズ | Pattern inspection / measurement apparatus and program |
| JP5948262B2 (en) * | 2013-01-30 | 2016-07-06 | 株式会社日立ハイテクノロジーズ | Defect observation method and defect observation apparatus |
| JP5919212B2 (en) * | 2013-03-26 | 2016-05-18 | 富士フイルム株式会社 | Visual verification support device and control method thereof |
| JP2014207110A (en) * | 2013-04-12 | 2014-10-30 | 株式会社日立ハイテクノロジーズ | Observation apparatus and observation method |
| JP6099479B2 (en) | 2013-05-21 | 2017-03-22 | 大成建設株式会社 | Crack detection method |
| CN103364408B (en) * | 2013-07-10 | 2015-09-09 | 三峡大学 | A kind of underwater robot system that adopts is to the method for Hydro-concrete Structures underwater surface Crack Detection |
| JP6022423B2 (en) * | 2013-07-31 | 2016-11-09 | Toa株式会社 | Monitoring device and monitoring device control program |
| JP6264834B2 (en) * | 2013-10-24 | 2018-01-24 | 富士通株式会社 | Guide method, information processing apparatus, and guide program |
| WO2015159469A1 (en) * | 2014-04-16 | 2015-10-22 | 日本電気株式会社 | Information processing device |
| JP2016058637A (en) * | 2014-09-11 | 2016-04-21 | 株式会社日立ハイテクノロジーズ | Overlay measurement method, device and display device |
| JP6192880B2 (en) * | 2015-05-26 | 2017-09-06 | 三菱電機株式会社 | Detection apparatus and detection method |
| CN105606030B (en) * | 2015-12-30 | 2018-08-24 | 浙江建设职业技术学院 | One kind being based on Embedded building surface crack detecting device |
| JP6833366B2 (en) | 2016-07-06 | 2021-02-24 | キヤノン株式会社 | Information processing device, control method and program of information processing device |
-
2016
- 2016-07-06 JP JP2016134421A patent/JP6833366B2/en active Active
-
2017
- 2017-06-19 WO PCT/JP2017/022444 patent/WO2018008370A1/en unknown
- 2017-06-19 CN CN202210449427.4A patent/CN114792309A/en active Pending
- 2017-06-19 CN CN201780042334.7A patent/CN109477800A/en active Pending
- 2017-06-19 EP EP17823977.8A patent/EP3483594A4/en active Pending
- 2017-06-19 EP EP21210837.7A patent/EP4006835A1/en active Pending
-
2019
- 2019-01-04 US US16/240,352 patent/US11105749B2/en active Active
-
2021
- 2021-08-11 US US17/399,913 patent/US20210372939A1/en not_active Abandoned
Also Published As
| Publication number | Publication date |
|---|---|
| EP3483594A4 (en) | 2020-01-01 |
| WO2018008370A1 (en) | 2018-01-11 |
| US20190137409A1 (en) | 2019-05-09 |
| US11105749B2 (en) | 2021-08-31 |
| EP3483594A1 (en) | 2019-05-15 |
| US20210372939A1 (en) | 2021-12-02 |
| JP2018004541A (en) | 2018-01-11 |
| CN109477800A (en) | 2019-03-15 |
| EP4006835A1 (en) | 2022-06-01 |
| JP6833366B2 (en) | 2021-02-24 |
Similar Documents
| Publication | Publication Date | Title |
|---|---|---|
| CN114792309A (en) | Information processing apparatus, control method of information processing apparatus, and storage medium | |
| JP7330710B2 (en) | Information processing device, information processing method and program | |
| KR100785594B1 (en) | Image process apparatus | |
| JP4616120B2 (en) | Image processing apparatus and inspection apparatus | |
| WO2006022184A1 (en) | Camera calibration device and camera calibration method | |
| JPH11132961A (en) | Inspection apparatus for structure | |
| JP7051616B2 (en) | Image display system and method | |
| JP2021196705A (en) | Image processing system, image processing method and program | |
| JP2005016991A (en) | Infrared structure diagnosis system | |
| JP2005016995A (en) | Infrared structure diagnosis method | |
| JP2019053050A (en) | Information processing apparatus, information processing method and program | |
| EP3734540A1 (en) | Image processing apparatus and control method therefor | |
| JP2024040370A (en) | Information processing apparatus, information processing method, and program | |
| JP2024019350A (en) | Information processing apparatus, information processing method, and program | |
| JP7329951B2 (en) | Image processing device and its control method | |
| JP7005799B2 (en) | Information processing equipment, control methods and programs for information processing equipment | |
| JP2005310044A (en) | Apparatus, method and program for data processing | |
| US11830177B2 (en) | Image processing apparatus, control method and non-transitory computer-readable recording medium therefor | |
| JP2010078424A (en) | Image processing device and method for supporting parameter concerning detection of defect on image | |
| US11408831B2 (en) | Information processing apparatus, information processing method, and recording medium | |
| JP2019191638A (en) | Inspection method of construction and inspection system of construction | |
| KR102343123B1 (en) | Tracking management System based on photodata for construction field | |
| JP2017224196A (en) | Information processing apparatus, information processing method, and program | |
| JP2005044077A (en) | Method for composing plurality of images | |
| JP2007051956A (en) | Method or apparatus for measuring diameter |
Legal Events
| Date | Code | Title | Description |
|---|---|---|---|
| PB01 | Publication | ||
| PB01 | Publication | ||
| SE01 | Entry into force of request for substantive examination | ||
| SE01 | Entry into force of request for substantive examination |