CN113683698B - Methods and kits for predicting response of esophageal cancer to anti-ERBB 3 antibody therapy - Google Patents
Methods and kits for predicting response of esophageal cancer to anti-ERBB 3 antibody therapy Download PDFInfo
- Publication number
- CN113683698B CN113683698B CN202110986587.8A CN202110986587A CN113683698B CN 113683698 B CN113683698 B CN 113683698B CN 202110986587 A CN202110986587 A CN 202110986587A CN 113683698 B CN113683698 B CN 113683698B
- Authority
- CN
- China
- Prior art keywords
- seq
- amino acid
- acid sequence
- variable region
- cdr
- Prior art date
- Legal status (The legal status is an assumption and is not a legal conclusion. Google has not performed a legal analysis and makes no representation as to the accuracy of the status listed.)
- Active
Links
Images


Classifications
-
- C—CHEMISTRY; METALLURGY
- C12—BIOCHEMISTRY; BEER; SPIRITS; WINE; VINEGAR; MICROBIOLOGY; ENZYMOLOGY; MUTATION OR GENETIC ENGINEERING
- C12Q—MEASURING OR TESTING PROCESSES INVOLVING ENZYMES, NUCLEIC ACIDS OR MICROORGANISMS; COMPOSITIONS OR TEST PAPERS THEREFOR; PROCESSES OF PREPARING SUCH COMPOSITIONS; CONDITION-RESPONSIVE CONTROL IN MICROBIOLOGICAL OR ENZYMOLOGICAL PROCESSES
- C12Q1/00—Measuring or testing processes involving enzymes, nucleic acids or microorganisms; Compositions therefor; Processes of preparing such compositions
- C12Q1/68—Measuring or testing processes involving enzymes, nucleic acids or microorganisms; Compositions therefor; Processes of preparing such compositions involving nucleic acids
- C12Q1/6876—Nucleic acid products used in the analysis of nucleic acids, e.g. primers or probes
- C12Q1/6883—Nucleic acid products used in the analysis of nucleic acids, e.g. primers or probes for diseases caused by alterations of genetic material
- C12Q1/6886—Nucleic acid products used in the analysis of nucleic acids, e.g. primers or probes for diseases caused by alterations of genetic material for cancer
-
- A—HUMAN NECESSITIES
- A61—MEDICAL OR VETERINARY SCIENCE; HYGIENE
- A61K—PREPARATIONS FOR MEDICAL, DENTAL OR TOILETRY PURPOSES
- A61K39/00—Medicinal preparations containing antigens or antibodies
- A61K39/395—Antibodies; Immunoglobulins; Immune serum, e.g. antilymphocytic serum
-
- C—CHEMISTRY; METALLURGY
- C07—ORGANIC CHEMISTRY
- C07K—PEPTIDES
- C07K16/00—Immunoglobulins [IG], e.g. monoclonal or polyclonal antibodies
- C07K16/18—Immunoglobulins [IG], e.g. monoclonal or polyclonal antibodies against material from animals or humans
- C07K16/32—Immunoglobulins [IG], e.g. monoclonal or polyclonal antibodies against material from animals or humans against translation products of oncogenes
-
- G—PHYSICS
- G01—MEASURING; TESTING
- G01N—INVESTIGATING OR ANALYSING MATERIALS BY DETERMINING THEIR CHEMICAL OR PHYSICAL PROPERTIES
- G01N33/00—Investigating or analysing materials by specific methods not covered by groups G01N1/00 - G01N31/00
- G01N33/48—Biological material, e.g. blood, urine; Haemocytometers
- G01N33/50—Chemical analysis of biological material, e.g. blood, urine; Testing involving biospecific ligand binding methods; Immunological testing
- G01N33/53—Immunoassay; Biospecific binding assay; Materials therefor
- G01N33/575—Immunoassay; Biospecific binding assay; Materials therefor for cancer
- G01N33/57557—Immunoassay; Biospecific binding assay; Materials therefor for cancer of other specific parts of the body, e.g. brain
-
- G—PHYSICS
- G01—MEASURING; TESTING
- G01N—INVESTIGATING OR ANALYSING MATERIALS BY DETERMINING THEIR CHEMICAL OR PHYSICAL PROPERTIES
- G01N33/00—Investigating or analysing materials by specific methods not covered by groups G01N1/00 - G01N31/00
- G01N33/48—Biological material, e.g. blood, urine; Haemocytometers
- G01N33/50—Chemical analysis of biological material, e.g. blood, urine; Testing involving biospecific ligand binding methods; Immunological testing
- G01N33/53—Immunoassay; Biospecific binding assay; Materials therefor
- G01N33/575—Immunoassay; Biospecific binding assay; Materials therefor for cancer
- G01N33/5758—Immunoassay; Biospecific binding assay; Materials therefor for cancer involving compounds serving as markers for tumours, cancers or neoplasias, e.g. cellular determinants, receptors, heat shock/stress proteins, A-protein, oligosaccharides or metabolites
-
- G—PHYSICS
- G01—MEASURING; TESTING
- G01N—INVESTIGATING OR ANALYSING MATERIALS BY DETERMINING THEIR CHEMICAL OR PHYSICAL PROPERTIES
- G01N33/00—Investigating or analysing materials by specific methods not covered by groups G01N1/00 - G01N31/00
- G01N33/48—Biological material, e.g. blood, urine; Haemocytometers
- G01N33/50—Chemical analysis of biological material, e.g. blood, urine; Testing involving biospecific ligand binding methods; Immunological testing
- G01N33/68—Chemical analysis of biological material, e.g. blood, urine; Testing involving biospecific ligand binding methods; Immunological testing involving proteins, peptides or amino acids
-
- C—CHEMISTRY; METALLURGY
- C07—ORGANIC CHEMISTRY
- C07K—PEPTIDES
- C07K2317/00—Immunoglobulins specific features
- C07K2317/50—Immunoglobulins specific features characterized by immunoglobulin fragments
- C07K2317/56—Immunoglobulins specific features characterized by immunoglobulin fragments variable (Fv) region, i.e. VH and/or VL
- C07K2317/565—Complementarity determining region [CDR]
-
- C—CHEMISTRY; METALLURGY
- C12—BIOCHEMISTRY; BEER; SPIRITS; WINE; VINEGAR; MICROBIOLOGY; ENZYMOLOGY; MUTATION OR GENETIC ENGINEERING
- C12Q—MEASURING OR TESTING PROCESSES INVOLVING ENZYMES, NUCLEIC ACIDS OR MICROORGANISMS; COMPOSITIONS OR TEST PAPERS THEREFOR; PROCESSES OF PREPARING SUCH COMPOSITIONS; CONDITION-RESPONSIVE CONTROL IN MICROBIOLOGICAL OR ENZYMOLOGICAL PROCESSES
- C12Q2600/00—Oligonucleotides characterized by their use
- C12Q2600/106—Pharmacogenomics, i.e. genetic variability in individual responses to drugs and drug metabolism
-
- C—CHEMISTRY; METALLURGY
- C12—BIOCHEMISTRY; BEER; SPIRITS; WINE; VINEGAR; MICROBIOLOGY; ENZYMOLOGY; MUTATION OR GENETIC ENGINEERING
- C12Q—MEASURING OR TESTING PROCESSES INVOLVING ENZYMES, NUCLEIC ACIDS OR MICROORGANISMS; COMPOSITIONS OR TEST PAPERS THEREFOR; PROCESSES OF PREPARING SUCH COMPOSITIONS; CONDITION-RESPONSIVE CONTROL IN MICROBIOLOGICAL OR ENZYMOLOGICAL PROCESSES
- C12Q2600/00—Oligonucleotides characterized by their use
- C12Q2600/158—Expression markers
-
- G—PHYSICS
- G01—MEASURING; TESTING
- G01N—INVESTIGATING OR ANALYSING MATERIALS BY DETERMINING THEIR CHEMICAL OR PHYSICAL PROPERTIES
- G01N2333/00—Assays involving biological materials from specific organisms or of a specific nature
- G01N2333/435—Assays involving biological materials from specific organisms or of a specific nature from animals; from humans
- G01N2333/475—Assays involving growth factors
- G01N2333/485—Epidermal growth factor [EGF] (urogastrone)
Landscapes
- Health & Medical Sciences (AREA)
- Life Sciences & Earth Sciences (AREA)
- Chemical & Material Sciences (AREA)
- Immunology (AREA)
- Engineering & Computer Science (AREA)
- Molecular Biology (AREA)
- Biomedical Technology (AREA)
- Hematology (AREA)
- Urology & Nephrology (AREA)
- General Health & Medical Sciences (AREA)
- Medicinal Chemistry (AREA)
- Biochemistry (AREA)
- Organic Chemistry (AREA)
- Analytical Chemistry (AREA)
- Pathology (AREA)
- Microbiology (AREA)
- Proteomics, Peptides & Aminoacids (AREA)
- Physics & Mathematics (AREA)
- Biotechnology (AREA)
- Cell Biology (AREA)
- Food Science & Technology (AREA)
- General Physics & Mathematics (AREA)
- Genetics & Genomics (AREA)
- Oncology (AREA)
- Biophysics (AREA)
- Wood Science & Technology (AREA)
- Zoology (AREA)
- Bioinformatics & Cheminformatics (AREA)
- Hospice & Palliative Care (AREA)
- General Engineering & Computer Science (AREA)
- Epidemiology (AREA)
- Pharmacology & Pharmacy (AREA)
- Mycology (AREA)
- Animal Behavior & Ethology (AREA)
- Public Health (AREA)
- Veterinary Medicine (AREA)
- Peptides Or Proteins (AREA)
- Medicines Containing Antibodies Or Antigens For Use As Internal Diagnostic Agents (AREA)
- Measuring Or Testing Involving Enzymes Or Micro-Organisms (AREA)
- Investigating Or Analysing Biological Materials (AREA)
Abstract
The present invention discloses a method for predicting whether esophageal cancer is sensitive or resistant to treatment with an ERBB3 inhibitor (e.g., an anti-ERBB 3 antibody). In particular, the method predicts RNA levels or protein levels in a tumor sample by measuring the expression of at least one marker selected from SDC, PTGES, NCF2, NOXA1, CARD6, GNAZ.
Description
The application is a divisional application of an invention patent application with application date of 2017, 6 and 22 months, application number of 201710485107.3 and invented name of a method and a kit for predicting response of esophageal cancer to anti-ERBB 3 antibody treatment.
Technical Field
The field of the invention relates to clinical molecular diagnosis of tumors.
Background
Most antineoplastic drugs are effective in some patients with tumors, but are ineffective in others. This is because there are genetic changes between tumors, which can be observed even in different tumors of the same patient. Patients respond more differently with respect to targeted therapies. Thus, the full potential of targeted therapy cannot be achieved without a suitable method to predict which patients will benefit from which drugs. According to the National Institutes of Health (NIH), the term "biomarker" is defined as "objectively measurable feature and this feature is evaluated as an indicator of the pharmacological response of a normal organism to a pathogenic process, or to a therapeutic intervention" (biomakers Definitions Working Group,2001, clin.
The advance identification of which patients are most likely to show a clinical response to a given drug can accelerate the development of new drugs. At the same time, this would also significantly reduce the size, duration and cost of clinical trials. Currently, technologies such as genomics, proteomics, and molecular imaging are capable of detecting specific gene mutations, the expression levels of particular genes, and other molecular biomarkers quickly, sensitively, and with confidence. Although a variety of techniques are available for characterizing tumor molecules, clinical applications of cancer biomarkers remain largely unfulfilled due to the few known cancer biomarkers. For example, recent review articles show that: there is a great need to accelerate the development of biomarkers and their use to improve the diagnosis and treatment of cancer (Cho, 2007, molecular cancer 6.
Another recent review article on cancer biomarkers indicates that: the current challenge is to find cancer biomarkers. Although the use of molecularly targeted agents in various types of tumors (e.g., chronic myeloid leukemia, gastrointestinal stromal tumors, lung cancer, and glioblastoma multiforme) has been clinically successful, the widespread use of these molecularly targeted agents has been limited due to the lack of effective strategies to assess patient response to the targeted agents. The problem is mainly that patients on clinical trials cannot be selected to evaluate new drugs using molecularly defined cancers. There is therefore a need for biomarkers that reliably identify those patients most likely to benefit from a particular agent (Sawyers, 2008, nature 452.
Documents such as those mentioned above indicate that there is a need to find biomarkers for clinical use and diagnostic methods based on such biomarkers.
Three different types of cancer biomarkers are known: (1) prognostic biomarkers; (2) predictive biomarkers; and (3) a Pharmacodynamic (PD) biomarker. Prognostic biomarkers are used to classify cancers, such as solid tumors, according to aggressiveness (i.e., rate of growth and/or metastasis, and unresponsiveness to treatment). This is sometimes referred to as a "good effect" tumor to distinguish a "bad effect" tumor. Predictive biomarkers are used to assess the likelihood that a particular patient will benefit from treatment with a particular drug. For example, patients with breast cancer, whose ERBB2 (HER 2) gene is amplified, may benefit from treatment with trastuzumab, whereas patients without ERBB2 gene amplification may not benefit from treatment with trastuzumab. When a patient takes a drug, the PD biomarker indicates the effect of the drug on its molecular target. Thus, PD biomarkers are often used to guide dose levels and dosing frequency during the early stages of clinical development of new drugs. For a discussion of cancer biomarkers, see Sawyers,2008, nature452, 548-552.
Tumors driven by EGFR or HER2 typically respond to treatment with inhibitors of EGFR or HER2, but these tumors invariably develop resistance to these inhibitors. One of the mechanisms that result in resistance to anti-EGFR or anti-HER 2 therapy is activation of ERBB3 (also known as HER 3) signaling. See, e.g., engelman et al, 2006, clin cancer res.12; ritter et al, 2007, clin. Cancer res.13; sergina et al, 2007, nature445. Furthermore, NRG 1-induced activation of HER2-ERBB3 heterodimers is also associated with resistance to EGFR inhibitors (Zhou et al, 2006, cancer cell 10. Thus, ERBB3 plays an important role in the development of drug resistance and is involved in tumor inhibition and maintenance through heterodimers with EGFR and HER 2. Due to the lack of kinase activity of ERBB3, interest has been directed to the development of ERBB3 inhibitors, particularly anti-ERBB 3 antibodies.
As with other types of targeted therapies, some, but not all, tumors respond to anti-ERBB 3 therapy. Thus, there is a need for methods based on predictive biomarkers that can be used to identify patients in which tumors may (or may not) respond to treatment with an ERBB3 inhibitor (e.g., an anti-ERBB 3 antibody).
Recently, it has been found that expression of neuregulin-1 (NRG 1) correlates with the sensitivity of tumors to treatment with ERBB3 inhibitors (e.g., anti-ERBB 3 antibodies). As a primary ligand of ERBB3, NRG1 is capable of promoting heterodimerization of ERBB3 with other ERBB family members, thereby activating various intracellular signaling pathways. Meetze et al report that the Tumor Growth Inhibition (TGI) caused by anti-ERBB 3 antibodies is not correlated with the expression level of ERBB3, but rather is significantly correlated with the expression level of NRG1, i.e., when the expression level of NRG1 in a tumor sample is equal to or above a certain threshold, the tumor may respond to treatment with anti-ERBB 3 antibodies. NRG1 is therefore promising as a potent biomarker for predicting whether a tumor will respond to treatment with an ERBB3 inhibitor (e.g. an anti-ERBB 3 antibody) (see CN103959065A and Sergina et al, 2015, clin Cancer res 21 (5), 1106-1113.
However, the present inventors found that, in the esophageal cancer xenograft model, although the model with a low NRG1 expression level was always insensitive to anti-ERBB 3 antibody, the model with a high NRG1 expression level may respond or not respond to anti-ERBB 3 antibody treatment (see example 2), indicating that using NRG1 alone as a biomarker to predict whether esophageal cancer responds to treatment with ERBB3 antibody is not very effective.
Therefore, there is a need to provide further biomarkers that, when used alone or together with NRG1, are able to accurately predict whether esophageal cancer will respond to treatment with ERBB3 antibodies.
Brief description of the invention
The present invention is based, in part, on the discovery that: in tissue samples derived from esophageal cancer, the expression levels of SDC2, PTGES, NCF2, NOXA1, CARD6, GNAZ correlated with the sensitivity of esophageal cancer to treatment with ERBB3 antibodies. Surprisingly, the inventors found that this correlation was so strong that each of the six biomarkers SDC2, PTGES, NCF2, NOXA1, CARD6 and GNAZ described above alone expressed a level sufficient for predicting whether esophageal cancer is sensitive or resistant to treatment with ERBB3 antibodies. The present inventors have further found that the combined use of the above biomarkers (i.e. using two or more biomarkers) will further improve the effectiveness of predicting the sensitivity of esophageal cancer to treatment with ERBB3 antibodies. Accordingly, the present invention provides methods for predicting whether esophageal cancer is sensitive or resistant to treatment with an ERBB3 inhibitor (e.g., an anti-ERBB 3 antibody). The method comprises the following steps: (a) Measuring the expression level of one or more biomarkers selected from SDC2, PTGES, NCF2, NOXA1, CARD6, and GNAZ in an esophageal cancer sample; and (b) comparing the expression level to a threshold expression level for a corresponding biomarker, wherein an expression level of the SDC2 and/or GNAZ equal to or below the threshold expression level, and/or an expression level of one or more biomarkers selected from PTGES, NCF2, NOXA1, or CARD6 equal to or above the threshold expression level indicates that the esophageal cancer is sensitive to treatment with an ERBB3 inhibitor (e.g., an anti-ERBB 3 antibody). Conversely, an expression level of the SDC2 and/or GNAZ above the threshold expression level, and/or an expression level of one or more biomarkers selected from PTGES, NCF2, NOXA1, or CARD6 below the threshold expression level indicates that the esophageal cancer is resistant to treatment with an ERBB3 inhibitor (e.g., an anti-ERBB 3 antibody).
In one embodiment, the method of the invention further comprises measuring the expression level of the NRG1 gene, wherein an NRG1 expression level equal to or above its threshold expression level indicates that the esophageal cancer is sensitive to treatment with an ERBB3 inhibitor (e.g., an anti-ERBB 3 antibody).
In one embodiment, the method of the invention comprises: (a) Measuring the expression level of one or more biomarkers selected from SDC2, PTGES, NCF2, NOXA1, CARD6, and GNAZ in an esophageal cancer sample; and (b) comparing the expression level to a threshold expression level for a corresponding biomarker, wherein an expression level of the SDC2 and/or GNAZ equal to or below the threshold expression level and an expression level of one or more biomarkers selected from PTGES, NCF2, NOXA1, or CARD6 equal to or above the threshold expression level indicates that the esophageal cancer is sensitive to treatment with an ERBB3 inhibitor (e.g., an anti-ERBB 3 antibody).
The expression level of the biomarkers of the invention (i.e., SDC2, PTGES, NCF2, NOXA1, CARD6, and GNAZ, and NRG 1) refers to the expression level of the protein or the expression level of the mRNA. Expression of a protein can be measured by various methods well known to those skilled in the art, such as Immunohistochemical (IHC) analysis, enzyme-linked immunosorbent assay (ELISA), western blotting, immunofluorescence, and the like. The expression level of mRNA can also be measured by various methods well known to those skilled in the art, such as fluorescent quantitative PCR, microarray, digital PCR, transcriptome sequencing technology (RNAseq), and the like.
Another aspect of the invention provides the use of an agent that measures the level of expression of one or more biomarkers selected from SDC2, PTGES, NCF2, NOXA1, CARD6 and GNAZ in an esophageal cancer sample in the preparation of a diagnostic test kit for identifying esophageal cancer as sensitive or resistant to anti-ERBB 3 antibody treatment. In one embodiment, the above biomarker further comprises NRG1.
Another aspect of the invention provides a diagnostic test kit for predicting whether esophageal cancer is sensitive or resistant to anti-ERBB 3 antibody treatment, the kit comprising reagents for measuring the expression level of one or more biomarkers selected from SDC2, PTGES, NCF2, NOXA1, CARD6 and GNAZ in an esophageal cancer sample. In one embodiment, the kit of the present invention further comprises a reagent for measuring the expression level of NRG1. The reagents are reagents known to those skilled in the art for measuring the mRNA or protein expression level of a gene. For example, when the mRNA expression level is measured by fluorescent real-time quantitative PCR, the reagents include primers for specifically amplifying the biomarkers of the present invention, DNA polymerase, and buffers, reagents, and the like for measuring the expression level thereof. When the expression level of the protein is measured by IHC analysis, the reagent includes an antibody against the biomarker of the present invention (primary antibody), a detection antibody bound to the primary antibody (secondary antibody), and the like. In one embodiment, the kit of the invention further comprises reagents for measuring the expression level of one or more other genes used as controls.
Drawings
FIG. 1 is a CDR showing the immunoglobulin heavy chain variable region sequence of an anti-ERBB 3 antibody H1 、CDR H2 And CDR H3 Schematic representation of the sequence (Kabat definition) and the antibodies are represented as CAN017, 04D01, 09D03, 11G01, 12a07, 18H02 and 22a02 (which correspond to the boxes in fig. 2)The shown area).
Fig. 2 is a schematic diagram showing the amino acid sequence of the entire immunoglobulin heavy chain variable region of an anti-ERBB 3 antibody, which is represented by CAN017, 04D01, 09D03, 11G01, 12a07, 18H02, and 22a02. Aligning the amino acid sequences, complementarity Determining Sequences (CDRs) (Kabat definition), CDRs of each antibody H1 、CDR H2 And CDR H3 Indicated by a square box. The sequences outside the box represent Framework (FR) sequences.
FIG. 3 is a CDR showing the immunoglobulin light chain variable region sequence of an anti-ERBB 3 antibody L1 、CDR L2 And CDR L3 Schematic representation of the sequence (Kabat definition) and the antibodies are represented as CAN017, 04D01, 09D03, 11G01, 12a07, 18H02 and 22a02 (which correspond to the regions indicated by the boxes in fig. 4).
FIG. 4 is a schematic diagram showing the amino acid sequence of the entire immunoglobulin light chain variable region of an anti-ERBB 3 antibody, which is represented by CAN017, 04D01, 09D03, 11G01, 12A07, 18H02, and 22A02. Aligning the amino acid sequences of each antibody with each other, the Complementarity Determining Sequences (CDRs) (Kabat definition), CDRs L1 、CDR L2 And CDR L3 Indicated by a square box. The sequences outside the box represent Framework (FR) sequences.
FIG. 5 provides the amino acid sequences defining (A) a full-length CAN017 immunoglobulin heavy chain and (B) a full-length CAN017 immunoglobulin light chain.
Fig. 6 provides amino acid sequences defining (a) a full-length 04D01 immunoglobulin heavy chain and (B) a full-length 04D01 immunoglobulin light chain.
Fig. 7 provides amino acid sequences defining (a) a full-length 09D03 immunoglobulin heavy chain and (B) a full-length 09D03 immunoglobulin light chain.
FIG. 8 provides the amino acid sequences defining (A) a full-length 11G01 immunoglobulin heavy chain and (B) a full-length 11G01 immunoglobulin light chain.
Figure 9 provides the amino acid sequences defining (a) a full-length 12a07 immunoglobulin heavy chain and (B) a full-length 12a07 immunoglobulin light chain.
Figure 10 provides amino acid sequences defining (a) a full-length 18H02 immunoglobulin heavy chain and (B) a full-length 18H02 immunoglobulin light chain.
Fig. 11 provides the amino acid sequences defining (a) a full-length 22a02 immunoglobulin heavy chain and (B) a full-length 22a02 immunoglobulin light chain.
FIG. 12 summarizes the results of experiments measuring the tumor-inhibiting activity of hIgG (20 mg/kg) and the anti-ERBB 3 antibody CAN017 (20 mg/kg) in the esophageal cancer xenograft model.
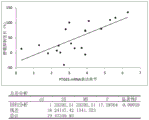
The upper panel of figure 13 is a scatter plot showing the in vivo efficacy of CAN017 in 20 xenograft models, expressed as percentage of Tumor Growth Inhibition (TGI), versus the mRNA expression level of SDC 2. The 20 data points are represented by (\9679;), where the solid line indicates the correlation of SDC2 mRNA expression levels with tumor growth inhibition. The lower panel of figure 13 is a significant analysis of the correlation of SDC2 mRNA expression levels with tumor growth inhibition.
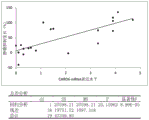
The upper panel of figure 14 is a scatter plot showing the in vivo efficacy of CAN017 in 20 xenograft models, expressed as percentage of Tumor Growth Inhibition (TGI), versus mRNA expression levels of GNAZ. The 20 data points are represented by (\9679;), where the solid line indicates the correlation of GNAZ mRNA expression levels with tumor growth inhibition. The bottom panel of fig. 14 is a significant analysis of the correlation of GNAZ mRNA expression levels with tumor growth inhibition.
The upper panel of figure 15 is a scatter plot showing the in vivo efficacy of CAN017 in 20 xenograft models, expressed as percentage of Tumor Growth Inhibition (TGI), versus the mRNA expression level of NCF 2. The 20 data points are represented by (\9679;), where the solid line indicates the correlation of NCF2 mRNA expression levels with tumor growth inhibition. The lower panel of fig. 15 is a significant analysis of the correlation of NCF2 mRNA expression levels with tumor growth inhibition.
The upper panel of figure 16 is a scatter plot showing the relationship between in vivo efficacy of CAN017 in 20 xenograft models, expressed as percentage of Tumor Growth Inhibition (TGI), and the mRNA expression level of NOXA1. The 20 data points are represented by (\9679;), where the solid line indicates the correlation of NOXA1 mRNA expression levels with tumor growth inhibition. The lower panel of fig. 16 is a significant analysis of the correlation of NOXA1 mRNA expression levels with tumor growth inhibition.
The upper panel of figure 17 is a scatter plot showing the relationship between in vivo efficacy of CAN017 as a percentage of Tumor Growth Inhibition (TGI) and mRNA expression levels of PTGES in 20 xenograft models. The 20 data points are represented by (\9679;), where the solid line indicates the correlation of PTGES mRNA expression levels with tumor growth inhibition. The lower panel of figure 17 is a significant analysis of the correlation of PTGES mRNA expression levels with tumor growth inhibition.
The upper panel of figure 18 is a scatter plot showing the relationship between in vivo efficacy of CAN017 in 20 xenograft models, expressed as percentage of Tumor Growth Inhibition (TGI), and the mRNA expression level of CARD 6. The 20 data points are indicated by (\9679;), where the solid line indicates the correlation of the mRNA expression level of CARD6 with tumor growth inhibition. The lower panel of figure 18 is a significant analysis of the correlation of the mRNA expression level of CARD6 with tumor growth inhibition.
FIG. 19 shows a graphical representation of the expression levels of GNAZ and NRG1 as a function of percent Tumor Growth Inhibition (TGI). Wherein the solid line parallel to the Y-axis represents the threshold expression level of NRG1 of 2.05 and the solid line parallel to the X-axis represents the threshold expression level of GNAZ of 1.1. Indicates TGI <70%; Δ represents TGI >70%.
Detailed Description
Definition of
As used herein, "CAN017" refers to a humanized anti-human ERBB3 monoclonal antibody whose full-length heavy chain amino acid sequence is SEQ ID NO.9 and whose full-length light chain amino acid sequence is SEQ ID NO. 10.
As used herein, "ERBB3" (also known as HER 3) refers to a human protein encoded by a Gene identified as Entrez Gene ID No.2065 and allelic variants thereof.
As used herein, "ERBB3 inhibitor" refers to a molecule (small molecule or macromolecule, such as an antibody or antigen-binding fragment thereof) that binds to ERBB3 and inhibits, neutralizes, prevents, or eliminates the biological activity of ERBB3 in tumor cells.
As used herein, "NRG1" (also known as neuregulin-1, heregulin, HRG, or HRG 1) refers to the human protein encoded by Entrez Gene ID No.3084 and allelic variants thereof.
As used herein, "SDC2" (also referred to as syndecan 2) refers to the human protein encoded by Entrez Gene ID No.6383 and allelic variants thereof.
As used herein, "NCF2" (also known as neutrophil cytoplasmic factor 2) refers to the human protein encoded by Entrez Gene ID No.4688 and allelic variants thereof.
As used herein, "NOXA1" (also referred to as NADPH oxidase activator 1) refers to a human protein encoded by Entrez Gene ID No.10811 and allelic variants thereof.
As used herein, "GNAZ" (also referred to as G protein subunit. Alpha.Z) refers to the human protein encoded by Entrez Gene ID No.2781 and allelic variants thereof.
As used herein, "PTGES" (also known as prostaglandin E synthase) refers to a human protein encoded by Entrez Gene ID No.9536 and allelic variants thereof.
As used herein, "CARD6" (also referred to as caspase recruitment domain family member 6) refers to a human protein encoded by Entrez Gene ID No.84674 and allelic variants thereof.
As used herein, a "response" or "response" to a treatment means that, with respect to the treated tumor, the tumor exhibits: (a) Slow growth, (b) stop growth, or (C) decline.
As used herein, "expression level" refers to the level of expression of a biomarker of the invention in an esophageal cancer sample. For example, the expression level can be expressed as (1) mRNA expression level measured by RNAseq (normalized with FPKM), or (2) staining intensity in IHC test. The expression level of a biomarker of the invention may be explained by a threshold expression level, which may be determined empirically in a threshold determination assay, for example using ROC curve analysis.
As used herein, "thresholding analysis" refers to the analysis of a data set of esophageal cancer to determine a threshold expression level of the biomarker in an esophageal cancer sample.
As used herein, "threshold expression level" refers to an expression level at which: at or above this expression level (for NRG1, NCF2, NOXA1, PTGES and CARD 6), or at or below this expression level (for SDC2 and GNAZ), esophageal cancer tumors will be classified as sensitive to treatment with ERBB3 inhibitors.
ERBB3 antibodies
The methods disclosed herein can be used to predict the response of esophageal cancer to treatment with an ERBB3 inhibitor, such as an anti-ERBB 3 antibody or an antigen-binding fragment of an anti-ERBB 3 antibody. In some embodiments, the esophageal cancer is classified as sensitive or resistant to an ERBB3 antibody (or antigen-binding fragment thereof), wherein the antibody inhibits or prevents binding of NRG1 (e.g., NRG1- β 1) to ERBB3, thereby indirectly inhibiting or preventing ligand-induced dimerization of ERBB3 (e.g., anti-ERBB 3 antibodies CAN017, 04D01, 12a07, 18H02, and 22a 02). In other embodiments, the tumor is classified as sensitive or resistant to an antibody (or antigen-binding fragment thereof) that inhibits or prevents dimerization of ERBB3 under conditions that do not prevent NRG1 from binding to ERBB3 (e.g., anti-ERBB 3 antibodies 09D03 and 11G 01).
In an exemplary embodiment, the ERBB3 inhibitor is one of the following antibodies: CAN017, 04D01, 12a07, 18H02, 22a02, 11G01 and 09D03.
anti-ERBB 3 antibody CAN017 comprising an immunoglobulin heavy chain variable region and an immunoglobulin light chain variable region, wherein said immunoglobulin heavy chain variable region comprises: 1 of the amino acid sequence of SEQ ID NO H1 CDR shown by the amino acid sequence of SEQ ID NO.2 H2 And CDR shown by the amino acid sequence of SEQ ID NO.3 H3 As shown in fig. 1; wherein the immunoglobulin light chain variable region comprises: CDR shown by amino acid sequence of SEQ ID NO.4 L1 CDR shown by the amino acid sequence of SEQ ID NO. 5 L2 And CDR shown by the amino acid sequence of SEQ ID NO 6 L3 As shown in fig. 3. In an exemplary embodiment, antibody CAN017 comprises an immunoglobulin heavy chain variable region and an immunoglobulin light chain variable region, wherein said immunoglobulin heavy chain variable regionThe variable region comprises the amino acid sequence of SEQ ID NO 7, as shown in FIG. 2; wherein the immunoglobulin light chain variable region comprises the amino acid sequence of SEQ ID NO.8, as shown in FIG. 4. In another exemplary embodiment, antibody CAN017 comprises the immunoglobulin heavy chain amino acid sequence of SEQ ID NO 9 and the immunoglobulin light chain amino acid sequence of SEQ ID NO 10 as shown in FIG. 5.
anti-ERBB 3 antibody 04D01 comprises an immunoglobulin heavy chain variable region and an immunoglobulin light chain variable region, wherein said immunoglobulin heavy chain variable region comprises: CDR shown by amino acid sequence of SEQ ID NO. 11 H1 CDR shown by the amino acid sequence of SEQ ID NO. 12 H2 And CDR shown by the amino acid sequence of SEQ ID NO. 13 H3 As shown in fig. 1; wherein the immunoglobulin light chain variable region comprises: CDR shown by amino acid sequence of SEQ ID NO. 14 L1 CDR shown by amino acid sequence of SEQ ID NO. 15 L2 And CDR shown by the amino acid sequence of SEQ ID NO. 16 L3 As shown in fig. 3. In exemplary embodiments, antibody 04D01 comprises an immunoglobulin heavy chain variable region and an immunoglobulin light chain variable region, wherein said immunoglobulin heavy chain variable region comprises the amino acid sequence of SEQ ID No. 17, as depicted in figure 2; wherein the variable region of the immunoglobulin light chain comprises the amino acid sequence of SEQ ID NO 18, as shown in FIG. 4. In another exemplary embodiment, antibody 04D01 includes the immunoglobulin heavy chain amino acid sequence of SEQ ID NO 19, and the immunoglobulin light chain amino acid sequence of SEQ ID NO 20, as shown in FIG. 6.
anti-ERBB 3 antibody 09D03 comprises an immunoglobulin heavy chain variable region and an immunoglobulin light chain variable region, wherein said immunoglobulin heavy chain variable region comprises: CDR shown by amino acid sequence of SEQ ID NO. 21 H1 CDR shown by amino acid sequence of SEQ ID NO. 22 H2 And CDR shown by the amino acid sequence of SEQ ID NO. 23 H3 As shown in fig. 1; wherein the immunoglobulin light chain variable region comprises: CDR shown by amino acid sequence of SEQ ID NO. 24 L1 CDR shown by amino acid sequence of SEQ ID NO. 25 L2 And SEQ ID NO26 the CDR shown by the amino acid sequence L3 As shown in fig. 3. In an exemplary embodiment, antibody 09D03 comprises an immunoglobulin heavy chain variable region and an immunoglobulin light chain variable region, wherein said immunoglobulin heavy chain variable region comprises the amino acid sequence of SEQ ID No.27, as depicted in figure 2; wherein the variable region of the immunoglobulin light chain comprises the amino acid sequence of SEQ ID NO 28, as shown in FIG. 4. In another exemplary embodiment, antibody 09D03 comprises the immunoglobulin heavy chain amino acid sequence of SEQ ID NO. 29 and the immunoglobulin light chain amino acid sequence of SEQ ID NO.30, as shown in FIG. 7.
anti-ERBB 3 antibody 11G01 comprises an immunoglobulin heavy chain variable region and an immunoglobulin light chain variable region, wherein said immunoglobulin heavy chain variable region comprises: CDR shown by amino acid sequence of SEQ ID NO. 31 H1 CDR shown by the amino acid sequence of SEQ ID NO. 32 H2 And CDR shown by the amino acid sequence of SEQ ID NO. 33 H3 As shown in fig. 1; wherein the immunoglobulin light chain variable region comprises: CDR shown by amino acid sequence of SEQ ID NO. 34 L1 CDR shown by amino acid sequence of SEQ ID NO. 15 L2 And CDR shown by amino acid sequence of SEQ ID NO. 35 L3 As shown in fig. 3. In exemplary embodiments, antibody 11G01 comprises an immunoglobulin heavy chain variable region and an immunoglobulin light chain variable region, wherein the immunoglobulin heavy chain variable region comprises the amino acid sequence of SEQ ID NO:36, as shown in FIG. 2; wherein the variable region of the immunoglobulin light chain comprises the amino acid sequence of SEQ ID NO 37, as shown in FIG. 4. In another exemplary embodiment, antibody 11G01 comprises the immunoglobulin heavy chain amino acid sequence of SEQ ID NO 38 and the immunoglobulin light chain amino acid sequence of SEQ ID NO 39, as shown in FIG. 8.
anti-ERBB 3 antibody 12a07 comprises an immunoglobulin heavy chain variable region and an immunoglobulin light chain variable region, wherein said immunoglobulin heavy chain variable region comprises: CDR shown by amino acid sequence of SEQ ID NO. 40 H1 CDR shown by the amino acid sequence of SEQ ID NO. 41 H2 And CDR shown by the amino acid sequence of SEQ ID NO. 42 H3 As shown in fig. 1; wherein the immunoglobulin light chain variable region comprises: CDR shown by amino acid sequence of SEQ ID NO. 14 L1 CDR shown by amino acid sequence of SEQ ID NO. 15 L2 And CDR shown by the amino acid sequence of SEQ ID NO. 16 L3 As shown in fig. 3. In an exemplary embodiment, antibody 12a07 comprises an immunoglobulin heavy chain variable region and an immunoglobulin light chain variable region, wherein the immunoglobulin heavy chain variable region comprises the amino acid sequence of SEQ ID NO:43, as shown in figure 2; wherein the immunoglobulin light chain variable region comprises the amino acid sequence of SEQ ID NO:44, as shown in FIG. 4. In another exemplary embodiment, antibody 12A07 comprises the immunoglobulin heavy chain amino acid sequence of SEQ ID NO 45 and the immunoglobulin light chain amino acid sequence of SEQ ID NO 46, as shown in FIG. 9.
anti-ERBB 3 antibody 18H02 comprises an immunoglobulin heavy chain variable region and an immunoglobulin light chain variable region, wherein said immunoglobulin heavy chain variable region comprises: 47 of the amino acid sequence of SEQ ID NO H1 CDR shown by amino acid sequence of SEQ ID NO. 48 H2 And CDR shown by the amino acid sequence of SEQ ID NO. 49 H3 As shown in fig. 1; wherein the immunoglobulin light chain variable region comprises: CDR shown by amino acid sequence of SEQ ID NO. 50 L1 51 of the amino acid sequence of SEQ ID NO L2 And CDR shown by amino acid sequence of SEQ ID NO. 52 L3 As shown in fig. 3. In an exemplary embodiment, antibody 18H02 comprises an immunoglobulin heavy chain variable region and an immunoglobulin light chain variable region, wherein said immunoglobulin heavy chain variable region comprises the amino acid sequence of SEQ ID NO:53, as shown in figure 2; wherein the immunoglobulin light chain variable region comprises the amino acid sequence of SEQ ID NO 54, as shown in FIG. 4. In another exemplary embodiment, antibody 18H02 includes the immunoglobulin heavy chain amino acid sequence of SEQ ID NO:55 and the immunoglobulin light chain amino acid sequence of SEQ ID NO:56, as shown in FIG. 10.
anti-ERBB 3 antibody 22A02 comprises an immunoglobulin heavy chain variable region and an immunoglobulin light chain variable region, whichThe immunoglobulin heavy chain variable region of (1) comprises: CDR shown by amino acid sequence of SEQ ID NO. 57 H1 CDR shown by amino acid sequence of SEQ ID NO. 58 H2 And CDR shown by the amino acid sequence of SEQ ID NO. 42 H3 As shown in fig. 1; wherein the immunoglobulin light chain variable region comprises: CDR shown by amino acid sequence of SEQ ID NO. 14 L1 CDR shown by amino acid sequence of SEQ ID NO. 15 L2 And CDR shown by the amino acid sequence of SEQ ID NO. 16 L3 As shown in fig. 3. In an exemplary embodiment, antibody 22a02 comprises an immunoglobulin heavy chain variable region and an immunoglobulin light chain variable region, wherein the immunoglobulin heavy chain variable region comprises the amino acid sequence of SEQ ID NO:59, as shown in figure 2; wherein the immunoglobulin light chain variable region comprises the amino acid sequence of SEQ ID NO 60, as shown in FIG. 4. In another exemplary embodiment, antibody 22A02 includes the immunoglobulin heavy chain amino acid sequence of SEQ ID NO 61, and the immunoglobulin light chain amino acid sequence of SEQ ID NO 62, as shown in FIG. 11.
It is contemplated that the skilled artisan will understand that the entire heavy or kappa light antibody sequence may be created by joining the variable regions described above to the respective constant region sequences to form active full-length immunoglobulin heavy and light chains. For example, a complete heavy chain includes a heavy chain variable region followed by a murine or human IgG1 or IgG2b heavy chain constant sequence (as known in the art), and a complete kappa chain includes a kappa variable sequence followed by a murine or human kappa light chain constant sequence (as known in the art). It is further contemplated that the CDR1, CDR2, and CDR3 sequences derived from immunoglobulin heavy and light chains may be placed in human or humanized immunoglobulin framework regions.
Sample (I)
Tissue samples derived from esophageal cancer (e.g., human esophageal cancer tissue samples obtained from human patients, such as those contemplated for treatment with ERBB3 inhibitors) can be used as a source of RNA, a source of protein, or a source of thin sections for Immunohistochemistry (IHC), such that the levels of the biomarkers of the invention in the samples can be determined in practicing the disclosed methods. Tissue samples can be obtained by using conventional tumor tissue biopsy instruments and procedures. Endoscopic tissue biopsy, resected tissue biopsy, incisional tissue biopsy, fine needle biopsy, bite tissue biopsy, scraped tissue biopsy, and skin tissue biopsy are examples of recognized medical procedures that may be used by one of skill in the art to obtain a tumor sample. The tumor tissue sample should be large enough to provide enough RNA, protein, or thin sections for measuring gene expression of the biomarkers.
The tumor tissue sample may be in any form that allows for measurement of the expression or amount of the biomarker. In general, tissue samples must be sufficient for RNA extraction, protein extraction or thin section preparation. Thus, the tissue sample may be fresh, preserved by suitable cryotechniques, or preserved by non-cryotechniques. The standard method for processing clinical tissue biopsy samples is to fix the tissue sample in formalin and then embed it in paraffin. This form of sample is commonly referred to as formalin-fixed paraffin-embedded (FFPE) tissue. Suitable techniques for tissue preparation for subsequent analysis are well known to those skilled in the art.
Expression of biomarkers
The expression level of a biomarker in a tissue sample obtained from a tumor can be determined or measured by any suitable method, as described herein. A variety of such methods are known in the art. For example, the expression level of a biomarker can be determined by measuring the level or amount of protein of the biomarker in a sample, or measuring the level or amount of RNA of the biomarker in a sample.
In some embodiments, the esophageal cancer is classified as sensitive or resistant to treatment with the ERBB3 inhibitor based solely on the expression of the biomarker in a tissue sample obtained from the esophageal cancer. In another embodiment, the expression of one or more other genes is measured in addition to the expression of the biomarkers of the invention, thereby classifying the tumor as sensitive or resistant to treatment with an ERBB3 inhibitor. It is contemplated in the present invention that in some embodiments, when the expression of one or more other genes is measured in addition to the biomarkers of the invention, the one or more other genes do not include ErbB1, erbB2, and ErbB3 (e.g., any monomeric, heterodimeric, and/or homodimeric form of ErbB1, erbB2, and ErbB3, and/or phosphorylated ErbB1, erbB2, and ErbB3 in monomeric or dimeric form). It is further contemplated herein that measuring the expression of one or more other genes in addition to the biomarkers of the invention may include genes that function as controls or standards, e.g., for normalization of data.
RNA analysis
Methods for determining the mRNA expression level of the biomarkers of the invention include, but are not limited to, conventional microarray analysis, digital PCR, RNAseq, and quantitative Polymerase Chain Reaction (PCR). In some embodiments, RNA is extracted from the target cell, tumor, or tissue using standard protocols. In other embodiments, the RNA analysis is performed using techniques that do not require the isolation of RNA.
Methods for the rapid and efficient extraction of eukaryotic mRNA from tissue samples are well known to those skilled in the art. See, for example, ausubel et al, 1997, current Protocols of Molecular biology, john Wiley &sons. The tissue sample may be a fresh, frozen or fixed paraffin-embedded (FFPE) sample, such as a clinically studied esophageal cancer patient sample. In general, RNA isolated from fresh or frozen tissue samples tends to form fewer fragments than RNA from FFPE samples. However, FFPE samples of tumor material are more readily available and are suitable sources of RNA for use in the methods of the invention. For a discussion of FFPE samples as a source of RNA for gene expression profiling by RT-PCR, see, e.g., clark-Langone et al, 2007, bmc genomics 8. See also De andres et al, 1995, biotechniques 18; and Baker et al, U.S. patent application publication No. 2005/0095634. Commercially available kits (with the instructions for RNA extraction and preparation provided by the supplier) can be used. Commercial suppliers of various RNA isolates and complete kits include Qiagen (Valencia, CA), invitrogen (Carlsbad, CA), ambion (Austin, TX), and Exiqon (Woburn, MA).
Typically, isolation of RNA begins with tissue/cell disruption. It is desirable to reduce RNA degradation by Rnase during tissue/cell disruption. One way to limit Rnase activity during RNA isolation is to ensure that once the cells are disrupted, the denaturant is contacted with the cell contents. Another common practice is to include one or more proteases in the RNA isolation process. Optionally, once a fresh tissue sample is collected, it is immersed in an RNA stabilizing solution at room temperature. The stabilizing solution rapidly permeates the cells, thereby stabilizing the RNA for storage at 4 ℃ for subsequent isolation. One such stabilizing solution is commercially available (Ambion,Austin,TX)。
In some embodiments, total RNA is isolated from the disrupted tumor material by cesium chloride density gradient centrifugation. Typically, mRNA comprises about 1% to 5% of the total RNA of a cell. Immobilized Oligo (dT), such as Oligo (dT) cellulose, is commonly used to separate mRNA from ribosomal RNA and transfer RNA. If stored after isolation, the RNA must be stored in the absence of RNase. Methods for stable storage of isolated RNA are known in the art. A variety of commercially available products are available for stable storage of RNA.
Microarray
The mRNA expression levels of the biomarkers can be measured using conventional DNA microarray expression profiling techniques. A DNA microarray is a collection of specific DNA segments or probes, which are immobilized on a solid surface or substrate, such as glass, plastic or silicon; and each specific DNA segment occupies a known position in the array. Hybridization to labeled RNA samples is typically performed under stringent hybridization conditions that allow for the detection and quantification of RNA molecules corresponding to each probe in the array. Following stringent washing to remove non-specifically bound sample material, the microarray is scanned by confocal laser microscopy or other suitable detection methods. DNA microarrays (also referred to as DNA chips) that are commercially available today typically include tens of thousands of probes and thus can measure the expression of tens of thousands of genes simultaneously. Such arrays may be used to practice the invention. Alternatively, custom chips comprising a few probes necessary for measuring NRG1, plus necessary controls or standards (e.g., for normalization of data), can be used to implement the disclosed methods.
To facilitate standardization of the data, a two-color microarray reader may be used. In a two-color (dual channel) system, a sample is labeled with a first fluorophore that emits at a first wavelength, while an RNA or cDNA standard is labeled with a second fluorophore that emits at a different wavelength. For example, cy3 (570 nm) and Cy5 (670 nm) are commonly used together in two-color microarray systems.
DNA microarray technology is well developed, commercially available and widely used. Thus, in practicing the disclosed methods, one of ordinary skill in the art can measure the expression levels of genes encoding biomarker proteins using microarray technology without undue experimentation. DNA microarray chips, reagents (such as those used for RNA or cDNA preparation, RNA or cDNA labeling, hybridization, and wash solutions), instruments (such as microarray readers), and protocols are well known in the art and are available from a variety of commercial sources. Commercial suppliers of microarray systems include Agilent Technologies (Santa Clara, CA) and Affymetrix (Santa Clara, CA), but other PCR systems may be used.
Quantitative PCR
The mRNA levels of the biomarkers of the invention can be measured using conventional quantitative reverse transcriptase polymer chain reaction (qRT-PCR) techniques. The advantages of qRT-PCR include sensitivity, flexibility, quantitative accuracy, and the ability to resolve closely related mrnas. Guidance regarding the processing of tissue samples for quantitative PCR can be obtained from a variety of sources, including manufacturers and suppliers of commercially available instruments and reagents for qRT-PCR (e.g., qiagen (Valencia, CA) and Ambion (Austin, TX)). Instruments and systems for automated performance of qRT-PCR are commercially available and are routinely used in many laboratories. An example of a well-known commercially available System is the Applied Biosystems7900HT Fast Real-Time PCR System (Applied Biosystems, foster City, calif.).
Once the mRNA is isolated, the first step in gene expression measurements by RT-PCR is to reverse transcribe the mRNA template into cDNA, which is then amplified exponentially in a PCR reaction. Two commonly used reverse transcriptases are avian myeloblastosis Virus reverse transcriptase (AMV-RT) and Moloney murine leukemia Virus reverse transcriptase (MMLV-RT). Reverse transcription reactions typically use specific primers, random hexamer or oligo (dT) primers as primers. Suitable introductions are commercially available, for example RNA PCR kit (Perkin Elmer, waltham, MA). The resulting cDNA product is used as a template in a subsequent polymerase chain reaction.
The PCR step is performed using a thermostable DNA-dependent DNA polymerase. Most commonly used polymerases in PCR systems are Thermus aquaticus (Taq) polymerase. The selectivity of PCR results from the use of primers that are complementary to the region of DNA targeted for amplification, i.e., the region of cDNA reverse transcribed from the gene encoding the protein of interest. Thus, when the present invention uses qRT-PCR, the primer specific for each marker gene is based on the cDNA sequence of that gene. Such as may be used in accordance with the instructions provided by the supplier green or>
 (Applied Biosystems, foster City, calif.). Messenger RNA levels can be normalized to differences in loaded samples by comparing levels of housekeeping genes (e.g., beta actin or GAPDH). The expression level of the mRNA can be expressed relative to any single control sample, e.g., mRNA from normal, non-tumor tissue or cells. Alternatively, it may be expressed relative to mRNA obtained from a set of tumor samples or tumor cell lines, or from a commercially available set of control mrnas.
Sets of suitable primers for PCR analysis of expression of NRG1 and/or the biomarkers of the invention can be designed and synthesized by any one of skill in the art without undue experimentation. Alternatively, sets of PCR primers useful in practicing the invention can be purchased from a variety of commercially available sources, such as Applied Biosystems. The PCR primers are preferably about 17 to 25 nucleotides in length. Primers can be designed to have a specific melting temperature (Tm) using conventional algorithms for estimating Tm. Software for designing primers and estimating Tm is commercially available, e.g., primer ExpressTM (Applied Biosystems), and is also available on the Internet, e.g., primer3 (Massachusetts Institute of Technology). By applying the established principles of PCR primer design, a large number of different primers can be used to measure the expression level of any given gene, including NRG1 and the biomarkers of the invention.
RNAseq
The mRNA expression level of the biomarkers of the invention can also be measured using RNAseq technique. The RNAseq can be used for gene expression difference research at the whole genome level and has the following advantages: (1) The accuracy of the single nucleotide resolution of each transcript fragment sequence is directly determined, and the problems of cross reaction and background noise (namely, digital signals) caused by the fluorescent analog signals of the traditional microarray hybridization do not exist; (2) The ability to detect as few as a few copies of rare transcripts in a cell (i.e., very high sensitivity); (3) capable of whole genome analysis; (4) A dynamic detection range of more than 6 orders of magnitude enables simultaneous identification and quantification of rare and normal transcripts (i.e., a broad detection range). Based on the above advantages, RNAseq has become a powerful tool for accurately measuring RNA expression levels.
The rationale for RNAseq is: extracting RNA, purifying, performing reverse transcription to form cDNA, and sequencing to obtain short reads (short reads); and comparing the short reads to corresponding positions of the genome, splicing the comparison result at the gene level, the exon level and the transcription level, performing data statistics on the splicing result, and standardizing to obtain the expression level of the gene at the mRNA level. Wherein the alignment step, the stitching and statistics step, and the normalization step can be performed using various software known to those skilled in the art. For example, the alignment step can be performed by BFAST, BOWTIE, GNUmap, cloudBurst, GMAP/GSNAP, rzaers, spliceMap, topHat, MIRA, soap, etc. software; the splicing and counting steps can be carried out by software such as Cufflinks, ALEXA-seq and the like; the normalization step can be performed by ERAGE, myrna, etc. software. A more commonly used method of normalising RNAseq data included: RPKM (reads per kill of exon model per milliont reads), FPKM (fragments per kill of exon model per milliont reads), and TPM (tag per milliont).
Common RNAseq platforms include Illumina GA/HiSeq, SOLID and Roche454.
qNPA TM
In some embodiments, RNA analysis is performed using techniques that do not involve RNA extraction or isolation. One such technique is a quantitative nuclease protection assay, which is commercially available under the trade name qnptat (High Throughput Genomics, inc., tucson, AZ). The described technique is advantageous when the tumor tissue sample to be analyzed is in the form of FFPE material. See, e.g., roberts et al, 2007, laboratory investigation 87.
Protein analysis
In other embodiments, the expression of the biomarkers of the invention may be detected at the protein level. Methods for measuring the protein expression level of the biomarker of the present invention include enzyme linked immunosorbent assay (ELISA), IHC assay, western blot, immunofluorescence, and the like.
ELISA
Performing an ELISA requires at least one antibody against a biomarker of the invention, i.e. a detection antibody. The following description will be given by taking NRG1 as an example. The NRG1 protein obtained from a sample to be analyzed is immobilized on a solid support, such as a polystyrene microtiter plate. This immobilization is non-specific binding, i.e. by adsorption on the surface. Alternatively, it may be immobilized by specific binding, i.e., in a "sandwich" ELISA, NRG1 obtained from a sample is bound to a capture antibody (an anti-NRG 1 antibody different from the detection antibody). After NRG1 immobilization, a detection antibody is added, and the detection antibody forms a complex with the bound NRG1. The detection antibody is linked to the enzyme in a direct or indirect manner (e.g., via a second antibody that specifically recognizes the detection antibody). Typically, between steps, the microtiter plate with bound NRG1 is washed using a mild detergent solution. Typical ELISA protocols also include one or more blocking steps involving the use of non-specifically binding proteins such as bovine serum albumin to block unwanted protein reagents that bind non-specifically to the titer plate. After the final washing step, the plate is developed by adding a suitable enzyme substrate, thereby generating a visible signal, which is indicative of the amount of NRG1 in the sample. The substrate may be, for example, a chromogenic substrate or a fluorogenic substrate. ELISA methods, reagents and equipment are well known in the art and are commercially available.
Immunohistochemistry (IHC)
The presence and level of NRG1 in a tumor tissue sample or clinical specimen can be determined (e.g., visualized) by Immunohistochemistry (IHC) or Immunofluorescence (IF) assays. IHC and IF are particularly useful for measuring NRG1 protein in clinical samples, since clinical samples are usually preserved in the form of formalin-fixed paraffin-embedded (FFPE) blocks. NRG1 requires at least one antibody against NRG1 as determined by IHC or IF. anti-NRG 1 antibodies suitable for IHC and IF are commercially available. For example, suitable antibodies can be purchased from R & DSystems (Minneapolis, MN), abcam (Cambridge, MA), santa Cruz Biotechnology, inc. (Santa Cruz, CA), or Novus Biologicals (Littleton, CO). Using standard techniques, anti-NRG 1 antibodies can be used to detect the presence of NRG1 protein in thin sections (e.g., 5 micron sections, including FFPE sections and frozen tumor sections) obtained from tumors. The initial treatment of the tumor sections is usually carried out in such a way that the antigenic structure of the proteins immobilized during the initial process of collecting and preserving the tumor material is restored. The slides were then blocked to prevent non-specific binding of the anti-NRG 1 detection antibody. Then, the presence of NRG1 protein is detected by the binding of an anti-NRG 1 antibody (primary antibody) to NRG1 protein. The detection antibody (secondary antibody) that recognizes and binds to the primary antibody is linked to a detectable enzyme or fluorophore. Typically, non-specific proteins (e.g., bovine serum albumin) are used to wash and block tumor sections between steps. If the detection antibody is linked to a detectable enzyme, the slide is developed using an appropriate enzyme substrate, thereby generating a visible signal. If the detection antibody is attached to the fluorophore, the slide is viewed by using a fluorescence microscope. Samples can be counterstained with hematoxylin.
Data interpretation
The threshold expression level may be used to explain the expression level of the biomarkers of the invention. For example, if the expression level of SDC2 and/or GNAZ is at or below its corresponding threshold expression level in a sample of esophageal cancer, then the esophageal cancer is sensitive (responsive) to treatment with an ERBB3 inhibitor (e.g., an ERBB3 antibody). Alternatively, when the expression level of SDC2 and/or GNAZ is above its corresponding threshold expression level, it indicates that the esophageal cancer is resistant (non-responsive) to treatment with an ERBB3 inhibitor (e.g., ERBB3 antibody). For NRG1, NCF2, NOXA1, PTGES and CARD6, if the expression level of one or more of them is equal to or above its respective threshold expression level, the esophageal cancer is sensitive (responsive) to treatment with an ERBB3 inhibitor (e.g., ERBB3 antibody); conversely, when the expression level of one or more of them is below its corresponding threshold expression level, it indicates that the esophageal cancer is resistant (non-responsive) to treatment with an ERBB3 inhibitor (e.g., ERBB3 antibody).
Threshold determination analysis
The threshold expression level of each biomarker can be determined by thresholding analysis. Preferably, the thresholding analysis comprises a Receiver Operating Characteristic (ROC) curve analysis. ROC curve analysis is an established statistical technique, the application of which is within the knowledge of one of ordinary skill in the art. For a discussion of ROC curve analysis, see generally Zweig et al, 1993, "Receiver Operating Characterization (ROC) spots: a fundamental evaluation tool in a clinical media," clin. Chem.39:561-577; and Pepe,2003, the statistical evaluation of the statistical tests for classification and prediction, oxford Press, new York.
The data set for the thresholding analysis includes: (a) Acute response data (responsive or non-responsive), and (b) the expression level of a biomarker of the invention for each tumor sample obtained from a panel of tumors. In certain embodiments, the threshold expression level is determined by measuring the expression level of a biomarker in a tissue sample of a tumor, wherein the tumor is obtained from a human patient having: esophageal cancer patients who have been previously treated with an anti-ERBB 3 inhibitor and have been shown to be sensitive to anti-ERBB 3 inhibitors; and esophageal cancer patients previously treated with an anti-ERBB 3 inhibitor and shown to be resistant to the anti-ERBB 3 inhibitor.
ROC curve analysis (taking NRG1 as an example) can be performed in the following manner. Any sample with an NRG1 expression level greater than or equal to the threshold is classified as a responder (sensitive), and any sample with an NRG1 expression level below the threshold is classified as a non-responder (resistant). For each expression level of NRG1 obtained from the test group of samples, the samples were classified as "responders" and "non-responders" (hypothetical calls) using the expression level as a threshold. The method is able to calculate the TPR (y value) and FPR (x value) for each potential threshold by comparing the hypothetical calls to the actual response data for the data set. An ROC curve was then constructed by making a dot plot using TPR and FPR. If the ROC curve is higher than the slope from point (0, 0) to point (1.0, 0.5), it shows that the NRG1 test results are better than the random test results.
The ROC curve can be used to identify the optimal threshold point. The optimal threshold point is the point at which: it produces the best balance between false positive cost versus false negative cost. These costs need not be equal. In ROC space, the average expected cost (C) of classification at points x, y is determined by:
C=(1-p)α*x+p*β(1-y)
wherein: α = false positive cost, β = missed positive (false negative) cost, and p = rate of positive cases.
False positives and false negatives may be weighted differently by assigning different values to alpha and beta. For example, if it is decided to include more patients in the responder group (at the cost of treating more non-responder patients), a higher weight may be given to α. In this case, the false positive and false negative costs are assumed to be the same (α equals β). Thus, in ROC space, the average expected cost of classification at points x, y is:
C’=(1-p)*x+p*(1-y)。
the minimum C' can be calculated after using all pairs of false positives and false negatives (x, y). The optimal threshold is calculated as the value under C (x, y).
Generally, the higher the NRG1 expression level, the more likely the tumor is to be sensitive to ERBB3 inhibitors; whereas the lower the expression level of NRG1, the more likely the tumor is to be resistant to ERBB3 inhibitors. The above-described thresholding assay can also be used to determine threshold expression levels of other biomarkers of the invention.
Test kit
In addition, the present invention also provides diagnostic test kits comprising specific components for carrying out the methods of the invention. Diagnostic test kits increase convenience, speed and repeatability in conducting diagnostic assays. For example, in an exemplary qRT-PCR-based embodiment, a basic diagnostic test kit includes PCR primers for analyzing the expression of the biomarkers of the invention. In other embodiments, more complex test kits include not only PCR primers, but also buffers, reagents and detailed instructions for measuring biomarker expression levels using PCR techniques. In some embodiments, the kit includes, in addition to the RNA sample, a test protocol and all consumable components necessary for the test.
In an exemplary DNA microarray-based embodiment, the test kit includes a microfluidic card (array) designed for use with a particular instrument. Optionally, the microfluidic card is a custom device specifically designed for measuring the biomarkers of the invention. Such custom microfluidic cards are commercially available. For example, taqMan is a 384-well microfluidic card (array) designed for use with the Applied Biosystems7900HT Fast Real Time PCR System (Applied Biosystems, foster City, calif.). It will be appreciated that other probes may optionally be included on the microfluidic card to measure the expression of one or more other genes. Such other genes may be included to function as controls or standards (e.g., for normalization of data), or may be informative in addition to the above.
In some embodiments, the test kit comprises materials for determining the amount of a biomarker of the invention by IHC. For example, the IHC kit may include a primary antibody directed to a biomarker of the present invention, and a secondary antibody conjugated to a reporter enzyme (e.g., horseradish peroxidase). In some embodiments, a conjugated polymer is used in place of the secondary antibody, wherein the polymer specifically recognizes the primary antibody.
Detailed Description
The invention is further illustrated by the following examples. The following examples are provided for illustration only and should not be construed to limit the scope or content of the present invention in any way.
Example 1: response of esophageal cancer xenograft growth to CAN017
The response of esophageal cancer to CAN017 was assessed in the following manner.
Fresh tumor tissue obtained from esophageal cancer patients after surgery was divided into small tumor masses, which were inoculated subcutaneously into immunodeficient mice (BALB/c nude mice), and the tumor growth state was observed periodically. After the tumor reached a certain volume, the mice were sacrificed humanely and the tumors were inoculated subcutaneously into new BALB/c nude mice. Growth curves were drawn according to tumor growth status while tumor samples were collected, cryopreserved and tumor tissue observed, and then revived as needed for next generation vaccination. After several generations of optimization, the esophageal cancer xenograft model is successfully established. The model was inoculated subcutaneously to the right of 9-11 week old female BALB/c nude mice, the diameter of the inoculated model was 2-3mm.
Tumors were measured twice weekly using a vernier caliper. Tumor volume was calculated using the formula: width x width x length/2. When the tumor reaches about 158mm 3 At the time, the mice were randomly divided into 3 groups of 10 mice each. One group received saline and one group received a hIgG control (20mg/kg body weight), the other group received CAN017 (20 mg/kg body weight). Once every three days, 3 weeks by intraperitoneal injection. Tumor volume and mouse body weight were recorded twice weekly. Tumor growth was expressed as percent inhibition compared to saline control.
In summary, 20 esophageal cancer xenograft models (10 mice per model) were treated with CAN017 and the statistics are shown in fig. 12. The average percent inhibition by CAN017 was around 43.6% for all 20 xenograft models, while the average percent inhibition by control hIgG was-5.5% for all 20 xenograft models. Statistical analysis results show that the percent inhibition of the esophageal cancer xenograft model by CAN017 reaches a significant level (P < 0.01) compared with hIgG. These results indicate that CAN017 is effective in inhibiting the growth of esophageal cancer tumors.
The response of a single esophageal cancer xenograft model to CAN017 was further analyzed and found to be variable, ranging from-40% Tumor Growth Inhibition (TGI) to tumor regression. By "tumor regression" is meant that at the end of the evaluation period the tumor is smaller compared to the size of the tumor at the beginning of the evaluation period prior to treatment. Responders (defined as those with a TGI > 70%) and non-responders (defined as those with a TGI < 70%) were identified based on the tumor growth inhibition achieved. Of the 20 models evaluated, 9 were found to be responders and 11 were non-responders (table 1). These panels were able to identify molecular markers of CAN017 response.
TABLE 1 results of tumor growth inhibition by CAN017 on 20 esophageal cancer xenograft models and mean mRNA expression level of NRG1 therein


Example 2: expression level and threshold determination of biomarker NRG1
By RNAseq according to the following protocolTo determine the expression level of NRG 1: after tumor tissue was snap frozen, RNA was extracted and purified using RNeasy Mini Kit (Qiagen, no. 74106), and then according to TruSeq TM RNA Sample Preparation Guide (Illumina, accession number RS-930-2001) purified RNA was pre-treated, followed by sequencing on HiSeq X System (Illumina) according to the manufacturer's instructions, and the data was normalized with FPKM (log 2 (FPKM + 1)) to obtain the expression level of NRG1.
NRG1 expression level values were determined in 20 esophageal cancer xenograft models (average 10 mice per model) before treatment with CAN017, and the average NRG1 expression level per model is shown in table 1. A Receiver Operating Characteristic (ROC) curve was generated from the obtained NRG1 expression level values, and a threshold expression level of NRG1 for predicting CAN017 tumor response was determined. The ROC analysis results showed that the threshold expression level of NRG1 was 2.05. I.e., above the threshold expression level, CAN017 tumor response is predicted. In fact, the expression level of NRG1 was consistent with the response results of CAN017 in most xenograft models tested (i.e., an expression level equal to or above 2.05 indicating a response to CAN 017; an expression level below 2.05 indicating no response to CAN 017). However, in esophageal cancer xenograft models ES0026, ES2356 and ES0215, although the expression level of NRG1 was higher than the threshold expression level, these three xenograft models were not actually responsive to CAN 017. It follows that although NRG1 as a biomarker may predict to some extent whether esophageal cancer will respond to treatment with ERBB3 antibodies, the effectiveness of prediction using NRG1 alone is limited.
Example 3: relationship between expression level of the biomarkers of the invention and CAN017 response
Expression levels of SDC2, GNAZ, PTGES, NCF2, NOX1 and CARD6 were determined in 20 esophageal cancer xenograft models (average 10 mice per model) separately according to the RNAseq method described in example 2, and the threshold expression level of each biomarker was determined by ROC curve. The threshold expression level results for each biomarker were as follows: SDC2 had a threshold expression level of 4.9, GNAZ had a threshold expression level of 1.1, PTGES had a threshold expression level of 2.75, NCF2 had a threshold expression level of 2.6, NOX1 had a threshold expression level of 2.7, CARD6 had a threshold expression level of 1.0.
The inhibition of tumor growth by CAN017 in each model was plotted on the basis of the average expression level of each biomarker in each model, and the significance of the correlation between the expression level of each biomarker and the inhibition of tumor growth was examined by regression analysis. The results are shown in FIGS. 13-18.
Specifically, as shown in figure 13, a negative correlation was observed between tumor growth inhibition and SDC2 expression. More specifically, an increase in tumor growth inhibition following treatment with CAN017 was associated with a decrease in SDC2 expression. Regression analysis found that this correlation was highly statistically significant (significance F < 0.05). Figure 14 shows that a negative correlation between tumor growth inhibition and GNAZ expression is present, i.e. tumor growth inhibition decreases with increasing levels of GNAZ expression, and that this correlation is also statistically significant (significance F < 0.05).
FIGS. 15-18 show that positive correlations between tumor growth inhibition and NCF2, NOXA1, PTGES, CARD6 expression, respectively, were present, i.e., tumor growth inhibition increased with increased expression levels of these biomarkers, and that the correlations were also statistically significant (significance F < 0.05).
The above results indicate that the expression level of each of the biomarkers SDC2, GNAZ, PTGES, NCF2, NOX1 and CARD6 of the invention significantly correlates with tumor growth inhibition. Thus, both of these biomarkers CAN be used to predict whether a tumor will respond to CAN017 treatment.
Example 4: response of esophageal cancer xenograft model to anti-ERBB 3 antibody CAN017
Based on the threshold expression levels of each biomarker obtained in example 3, a xenograft model predicted to respond to CAN017 was selected, while a xenograft model predicted not to respond to CAN017 was selected. Specifically, for SDC2 with a threshold expression level of 4.9, high-expression xenograft models ES0195 and ES0204 (SDC 2 expression levels of 5.8 and 5.2, respectively) were selected and predicted to not respond to CAN 017; low-expressing xenograft models ES0042 and ES0190 (SDC 2 expression levels of 0.6 and 4.3, respectively) were also selected and predicted to respond to CAN 017. Similarly, for GNAZ with a threshold expression level of 1.1, high-expression xenograft models ES0201 and ES2411 (GNAZ expression levels of 1.3 and 1.9, respectively) were selected and predicted to not respond to CAN 017; simultaneously, low-expression xenograft models ES0184 and ES0199 (GNAZ expression level is 0.2 and 0.5 respectively) were selected and predicted to respond to CAN 017. For NCF2 with a threshold expression level of 2.6, high-expression xenograft models ES0191 and ES0176 (NCF 2 expression levels of 5.1 and 3.2, respectively) were selected and predicted to respond to CAN 017; simultaneously, low-expressing xenograft models ES0204 and ES0026 (NCF 2 expression levels of 0.1 and 0.9, respectively) were selected and predicted not to respond to CAN 017. For NOXA1 with a threshold expression level of 2.7, high expressing xenograft models ES2311 and ES0214 (NOXA 1 expression levels of 2.98 and 3.9, respectively) were selected and predicted to respond to CAN 017; the low-expression xenograft models ES11087 and ES0148 (NOXA 1 expression levels of 2.14 and 1.6, respectively) were also selected and predicted not to respond to CAN 017. For PTGES with a threshold expression level of 2.75, high expressing xenograft models ES0159 and ES0141 (PTGES expression levels of 5.69 and 3.9, respectively) were selected and predicted to respond to CAN 017; low-expressing xenograft models ES10084 and ES0172 (PTGES expression levels 0.55 and 1.7, respectively) were also selected and predicted not to respond to CAN 017. For CARD6 with a threshold expression level of 1.0, high-expression xenograft models ES11069 and ES0147 (CARD 6 expression levels of 4.01 and 1.1, respectively) were selected and predicted to respond to CAN 017; meanwhile, low-expression xenograft models ES0212 and ES0136 (CARD 6 expression levels are 0.09 and 0.1, respectively) were selected and predicted not to respond to CAN 017.
The xenograft model selected above (5 mice per model) was treated with 20mg/kg of the antibody CAN017 according to the method described in example 1, and the tumor growth inhibition of each model was counted after 3 weeks, and the results are shown in Table 3.
Table 3 statistics of results of xenograft model treated with antibody CAN 017.


The above data indicate that the response of tumors to treatment with CAN017 CAN be effectively predicted by measuring the expression levels of SDC2, GNAZ, PTGES, NCF2, NOX1 and CARD 6.
Example 5: use of the biomarkers of the invention in combination with NRG1
The inventors have also found that the combined use of the biomarkers of the invention and NRG1 will further improve the accuracy of predicting whether a tumor will respond to CAN017 treatment. As described above, NRG1 alone as a marker does not accurately predict the response of esophageal cancer xenograft models ES0026, ES2356 and ES0215 (i.e., although the expression level of NRG1 is above the threshold, it does not respond after treatment with CAN017 (TGI < 70%)). The present inventors determined the expression levels of the biomarkers of the present invention in these three models, and the results are shown in table 4 below.
TABLE 4 expression levels of biomarkers in xenograft models ES0026, ES2356 and ES 0215.
| Model numbering | SDC2 | GNAZ | NCF2 | NOXA1 | PTGES | CARD6 |
| ES0026 | 6.1 | 1.7 | 0.9 | 1.9 | 2.3 | 0.8 |
| ES2356 | 7.7 | 1.4 | 2.4 | 1.8 | 3.1 | 3.3 |
| ES0215 | 8.1 | 2.4 | 2.5 | 0.4 | 1.8 | 2.1 |
The above data show that the levels of expression for SDC2 and GNAZ were above their respective threshold expression levels and the levels of expression for NCF2 and NOXA1 were below their respective threshold expression levels in these three models, indicating that xenograft models ES0026, ES2356, and ES0215 will be predicted to be non-responsive to CAN017 treatment when predicted using these biomarkers. In other words, measuring the expression level of the inventive biomarkers CAN further improve the accuracy of predicting whether a tumor is responsive to CAN017 treatment when NRG1 is above its threshold expression level (e.g., in the case of xenograft models ES0026, ES2356, and ES0215, considering that the inventive biomarkers CAN accurately predict that they are not responsive to CAN017 treatment).
The present inventors have also found that the prediction accuracy is further improved when at least one biomarker positively correlated to TGI and one biomarker negatively correlated to TGI are used simultaneously. In 20 esophageal cancer xenograft models, NRG1 alone as a marker predicted 85% and GNAZ alone as a marker predicted 90% accuracy. However, when NRG1 and GNAZ were used as markers for prediction, the accuracy was 95% (FIG. 19).
Example 6: response of esophageal cancer xenograft model to antibody 11G01 to ERBB3
To demonstrate a predictive approach to response to other anti-ERBB 3 antibodies, the 12 esophageal cancer xenograft models selected in example 4 were treated with an anti-ERBB 3 antibody (antibody 11G 01) with a different mechanism of action than CAN 017. Specifically, selected 12 esophageal cancer xenograft models were treated with 20mg/kg antibody 11G01 in the manner described in example 1, and the percentage of tumor growth inhibition was counted for each model after 3 weeks, with results similar to example 4 (i.e., the predicted response of the tumor to the antibody based on each biomarker was consistent with the actually observed response of the tumor to the antibody, data not shown). This indicates that the biomarkers of the invention CAN effectively predict esophageal cancer response to treatment with other anti-ERBB 3 antibodies with a mechanism of action different from CAN 017.
Is incorporated by reference
The complete disclosure of each of the patent documents and scientific articles referred to herein is incorporated by reference for all purposes.
Equivalents of the formula
The present invention may be embodied in other specific forms without departing from its spirit or essential characteristics. The embodiments described above must therefore be considered in all respects as illustrative and not restrictive on the invention described herein. The scope of the invention is, therefore, indicated by the appended claims rather than by the foregoing description, and all changes that come within the meaning and range of equivalency of the claims are intended to be embraced therein.


Claims (11)
1. Use of a reagent for measuring the level of expression of a biomarker in an esophageal cancer sample, wherein the biomarker comprises NOXA1, in the manufacture of a kit for predicting that esophageal cancer is sensitive or resistant to anti-ERBB 3 antibody treatment.
2. The use of claim 1, wherein the kit predicts sensitivity or resistance of esophageal cancer to anti-ERBB 3 antibody treatment by:
(a) Measuring the expression level of the NOXA1 in an esophageal cancer sample using the reagent; and
(b) Comparing the expression level to a threshold expression level of the NOXA1,
wherein an expression level of the NOXA1 equal to or above the threshold expression level indicates that the esophageal cancer is sensitive to anti-ERBB 3 antibody treatment.
3. The use of claim 1, wherein the biomarker further comprises NRG1 and the expression level of NRG1 is equal to or above the threshold expression level, then the esophageal cancer is predicted to be sensitive to anti-ERBB 3 antibody treatment.
4. The use of any one of claims 1-3, wherein the anti-ERBB 3 antibody is an antibody selected from the group consisting of an immunoglobulin heavy chain variable region and an immunoglobulin light chain variable region comprising:
(a) (i) an immunoglobulin heavy chain variable region,it includes: 1 of the amino acid sequence of SEQ ID NO 1 H1 CDR shown by the amino acid sequence of SEQ ID NO.2 H2 And CDR shown by the amino acid sequence of SEQ ID NO.3 H3 (ii) a And
(ii) An immunoglobulin light chain variable region comprising: CDR shown by amino acid sequence of SEQ ID NO.4 L1 CDR shown by the amino acid sequence of SEQ ID NO. 5 L2 And CDR shown by the amino acid sequence of SEQ ID NO 6 L3 ;
(b) (i) an immunoglobulin heavy chain variable region comprising: CDR shown by amino acid sequence of SEQ ID NO. 11 H1 CDR shown by amino acid sequence of SEQ ID NO. 12 H2 And CDR shown by the amino acid sequence of SEQ ID NO. 13 H3 (ii) a And
(ii) An immunoglobulin light chain variable region comprising: CDR shown by amino acid sequence of SEQ ID NO. 14 L1 CDR shown by amino acid sequence of SEQ ID NO. 15 L2 And CDR shown by the amino acid sequence of SEQ ID NO. 16 L3 ;
(c) (i) an immunoglobulin heavy chain variable region comprising: CDR shown by amino acid sequence of SEQ ID NO. 21 H1 CDR shown by amino acid sequence of SEQ ID NO. 22 H2 And CDR shown by the amino acid sequence of SEQ ID NO. 23 H3 (ii) a And
(ii) An immunoglobulin light chain variable region comprising: CDR shown by amino acid sequence of SEQ ID NO. 24 L1 CDR shown by amino acid sequence of SEQ ID NO. 25 L2 And CDR shown by the amino acid sequence of SEQ ID NO. 26 L3 ;
(d) (i) an immunoglobulin heavy chain variable region comprising: CDR shown by amino acid sequence of SEQ ID NO. 31 H1 CDR shown by the amino acid sequence of SEQ ID NO. 32 H2 And CDR shown by the amino acid sequence of SEQ ID NO. 33 H3 (ii) a And
(ii) An immunoglobulin light chain variable region comprising: CDR shown by amino acid sequence of SEQ ID NO. 34 L1 CDR shown by amino acid sequence of SEQ ID NO. 15 L2 And CDR shown by amino acid sequence of SEQ ID NO. 35 L3 ;
(e) (i) an immunoglobulin heavy chain variable region comprising: CDR shown by amino acid sequence of SEQ ID NO. 40 H1 CDR shown by the amino acid sequence of SEQ ID NO. 41 H2 And CDR shown by amino acid sequence of SEQ ID NO. 42 H3 (ii) a And
(ii) An immunoglobulin light chain variable region comprising: CDR shown by amino acid sequence of SEQ ID NO. 14 L1 CDR shown by the amino acid sequence of SEQ ID NO. 15 L2 And CDR shown by the amino acid sequence of SEQ ID NO. 16 L3 ;
(f) (i) an immunoglobulin heavy chain variable region comprising: 47 of the amino acid sequence of SEQ ID NO H1 CDR shown by amino acid sequence of SEQ ID NO. 48 H2 And CDR shown by the amino acid sequence of SEQ ID NO. 49 H3 (ii) a And
(ii) An immunoglobulin light chain variable region comprising: CDR shown by amino acid sequence of SEQ ID NO. 50 L1 51 of the amino acid sequence of SEQ ID NO L2 And CDR shown by the amino acid sequence of SEQ ID NO. 52 L3 (ii) a Or
(g) (i) an immunoglobulin heavy chain variable region comprising: CDR shown by amino acid sequence of SEQ ID NO. 57 H1 CDR shown by amino acid sequence of SEQ ID NO. 58 H2 And CDR shown by the amino acid sequence of SEQ ID NO. 42 H3 (ii) a And
(ii) An immunoglobulin light chain variable region comprising: CDR shown by amino acid sequence of SEQ ID NO. 14 L1 CDR shown by amino acid sequence of SEQ ID NO. 15 L2 And CDR shown by the amino acid sequence of SEQ ID NO. 16 L3 。
5. The use of any one of claims 1-3, wherein the anti-ERBB 3 antibody is an antibody selected from the group consisting of an immunoglobulin heavy chain variable region and an immunoglobulin light chain variable region comprising:
(a) The heavy chain variable region of the immunoglobulin shown by the amino acid sequence of SEQ ID NO. 7 and the light chain variable region of the immunoglobulin shown by the amino acid sequence of SEQ ID NO. 8;
(b) The immunoglobulin heavy chain variable region shown by the amino acid sequence of SEQ ID NO. 17 and the immunoglobulin light chain variable region shown by the amino acid sequence of SEQ ID NO. 18;
(c) The variable region of the immunoglobulin heavy chain shown by the amino acid sequence of SEQ ID NO.27 and the variable region of the immunoglobulin light chain shown by the amino acid sequence of SEQ ID NO. 28;
(d) The variable region of the immunoglobulin heavy chain shown by the amino acid sequence of SEQ ID NO. 36 and the variable region of the immunoglobulin light chain shown by the amino acid sequence of SEQ ID NO. 37;
(e) The variable region of the immunoglobulin heavy chain shown by the amino acid sequence of SEQ ID NO. 43 and the variable region of the immunoglobulin light chain shown by the amino acid sequence of SEQ ID NO. 44;
(f) The immunoglobulin heavy chain variable region represented by the amino acid sequence of SEQ ID NO. 53 and the immunoglobulin light chain variable region represented by the amino acid sequence of SEQ ID NO. 54; or
(g) The variable region of the immunoglobulin heavy chain shown by the amino acid sequence of SEQ ID NO. 59 and the variable region of the immunoglobulin light chain shown by the amino acid sequence of SEQ ID NO. 60.
6. The use of any one of claims 1 to 3, wherein the anti-ERBB 3 antibody is an antibody selected from the group consisting of an immunoglobulin heavy chain and an immunoglobulin light chain comprising:
(a) An immunoglobulin heavy chain represented by the amino acid sequence of SEQ ID NO.9 and an immunoglobulin light chain represented by the amino acid sequence of SEQ ID NO. 10;
(b) An immunoglobulin heavy chain as set forth in the amino acid sequence of SEQ ID NO. 19 and an immunoglobulin light chain as set forth in the amino acid sequence of SEQ ID NO. 20;
(c) An immunoglobulin heavy chain represented by the amino acid sequence of SEQ ID NO. 29 and an immunoglobulin light chain represented by the amino acid sequence of SEQ ID NO. 30;
(d) An immunoglobulin heavy chain represented by the amino acid sequence of SEQ ID NO. 38 and an immunoglobulin light chain represented by the amino acid sequence of SEQ ID NO. 39;
(e) An immunoglobulin heavy chain represented by the amino acid sequence of SEQ ID NO. 45 and an immunoglobulin light chain represented by the amino acid sequence of SEQ ID NO. 46;
(f) An immunoglobulin heavy chain represented by the amino acid sequence of SEQ ID NO. 55, and an immunoglobulin light chain represented by the amino acid sequence of SEQ ID NO. 56; or
(g) An immunoglobulin heavy chain represented by the amino acid sequence of SEQ ID NO. 61, and an immunoglobulin light chain represented by the amino acid sequence of SEQ ID NO. 62.
7. The use of claim 2, wherein the anti-ERBB 3 antibody comprises:
(i) An immunoglobulin heavy chain variable region comprising: CDR of the amino acid sequence of SEQ ID NO.1 H1 CDR of the amino acid sequence of SEQ ID NO 2 H2 And CDR of the amino acid sequence of SEQ ID NO.3 H3 (ii) a And
(ii) An immunoglobulin light chain variable region comprising: CDR of the amino acid sequence of SEQ ID NO.4 L1 CDR of the amino acid sequence of SEQ ID NO. 5 L2 And CDR of the amino acid sequence of SEQ ID NO 6 L3 。
8. The use of claim 2, wherein the anti-ERBB 3 antibody comprises: the heavy chain variable region of the immunoglobulin shown by the amino acid sequence of SEQ ID NO. 7 and the light chain variable region of the immunoglobulin shown by the amino acid sequence of SEQ ID NO. 8.
9. The use of claim 2, wherein the anti-ERBB 3 antibody comprises: an immunoglobulin heavy chain represented by the amino acid sequence of SEQ ID NO.9, and an immunoglobulin light chain represented by the amino acid sequence of SEQ ID NO. 10.
10. The use of claim 2, wherein the expression level of NOXA1 is the protein expression level of NOXA1.
11. The use of claim 2, wherein the expression level of NOXA1 is the mRNA expression level of NOXA1.
Priority Applications (1)
| Application Number | Priority Date | Filing Date | Title |
|---|---|---|---|
| CN202110986587.8A CN113683698B (en) | 2017-06-22 | 2017-06-22 | Methods and kits for predicting response of esophageal cancer to anti-ERBB 3 antibody therapy |
Applications Claiming Priority (2)
| Application Number | Priority Date | Filing Date | Title |
|---|---|---|---|
| CN202110986587.8A CN113683698B (en) | 2017-06-22 | 2017-06-22 | Methods and kits for predicting response of esophageal cancer to anti-ERBB 3 antibody therapy |
| CN201710485107.3A CN109111522B (en) | 2017-06-22 | 2017-06-22 | Methods and kits for predicting response of esophageal cancer to anti-ERBB 3 antibody therapy |
Related Parent Applications (1)
| Application Number | Title | Priority Date | Filing Date |
|---|---|---|---|
| CN201710485107.3A Division CN109111522B (en) | 2017-06-22 | 2017-06-22 | Methods and kits for predicting response of esophageal cancer to anti-ERBB 3 antibody therapy |
Publications (2)
| Publication Number | Publication Date |
|---|---|
| CN113683698A CN113683698A (en) | 2021-11-23 |
| CN113683698B true CN113683698B (en) | 2023-03-31 |
Family
ID=64733118
Family Applications (6)
| Application Number | Title | Priority Date | Filing Date |
|---|---|---|---|
| CN202110986455.5A Active CN113621706B (en) | 2017-06-22 | 2017-06-22 | Methods and kits for predicting the response of esophageal cancer to anti-ERBB 3 antibody therapy |
| CN202110986404.2A Active CN113684275B (en) | 2017-06-22 | 2017-06-22 | Methods and kits for predicting response to anti-ERBB3 antibody treatment in esophageal cancer |
| CN202110986640.4A Active CN113683700B (en) | 2017-06-22 | 2017-06-22 | Methods and kits for predicting the response of esophageal cancer to anti-ERBB 3 antibody therapy |
| CN202110986601.4A Active CN113683699B (en) | 2017-06-22 | 2017-06-22 | Methods and kits for predicting response of esophageal cancer to anti-ERBB 3 antibody therapy |
| CN201710485107.3A Active CN109111522B (en) | 2017-06-22 | 2017-06-22 | Methods and kits for predicting response of esophageal cancer to anti-ERBB 3 antibody therapy |
| CN202110986587.8A Active CN113683698B (en) | 2017-06-22 | 2017-06-22 | Methods and kits for predicting response of esophageal cancer to anti-ERBB 3 antibody therapy |
Family Applications Before (5)
| Application Number | Title | Priority Date | Filing Date |
|---|---|---|---|
| CN202110986455.5A Active CN113621706B (en) | 2017-06-22 | 2017-06-22 | Methods and kits for predicting the response of esophageal cancer to anti-ERBB 3 antibody therapy |
| CN202110986404.2A Active CN113684275B (en) | 2017-06-22 | 2017-06-22 | Methods and kits for predicting response to anti-ERBB3 antibody treatment in esophageal cancer |
| CN202110986640.4A Active CN113683700B (en) | 2017-06-22 | 2017-06-22 | Methods and kits for predicting the response of esophageal cancer to anti-ERBB 3 antibody therapy |
| CN202110986601.4A Active CN113683699B (en) | 2017-06-22 | 2017-06-22 | Methods and kits for predicting response of esophageal cancer to anti-ERBB 3 antibody therapy |
| CN201710485107.3A Active CN109111522B (en) | 2017-06-22 | 2017-06-22 | Methods and kits for predicting response of esophageal cancer to anti-ERBB 3 antibody therapy |
Country Status (5)
| Country | Link |
|---|---|
| US (1) | US11834716B2 (en) |
| EP (1) | EP3644062B1 (en) |
| JP (6) | JP7181290B2 (en) |
| CN (6) | CN113621706B (en) |
| WO (1) | WO2018233511A1 (en) |
Families Citing this family (7)
| Publication number | Priority date | Publication date | Assignee | Title |
|---|---|---|---|---|
| CN113528656B (en) * | 2020-04-21 | 2024-04-26 | 北京仁诚神经肿瘤生物技术工程研究中心有限公司 | Kit and system for evaluating prognosis of glioma and/or gastric adenocarcinoma |
| AU2021261681A1 (en) * | 2020-04-24 | 2022-12-08 | Merus B.V. | Treatment of cancers with an antibody that binds LGR5 and EGFR |
| CN111733151B (en) * | 2020-07-13 | 2021-11-12 | 山东新创生物科技有限公司 | Antigen and antibody prepared based on PADI4 as tumor marker and application |
| CN116333118B (en) * | 2021-12-16 | 2024-04-19 | 徕特康(苏州)生物制药有限公司 | Anti-EGF receptor antibody, preparation method and application thereof |
| CA3258344A1 (en) | 2022-06-07 | 2023-12-14 | Actinium Pharmaceuticals, Inc. | Bifunctional chelators and conjugates |
| CN115025226B (en) * | 2022-06-30 | 2023-05-23 | 中国人民解放军空军军医大学 | Application of PTGES expression inhibitor in preparation of medicine for improving sensitivity of tumor cells to chemotherapeutic drugs |
| KR20250031313A (en) * | 2023-08-28 | 2025-03-07 | 연세대학교 산학협력단 | Composition for prediction of response and of prognosis for cancer immunotherapy in gastric cancer and use thereof |
Citations (2)
| Publication number | Priority date | Publication date | Assignee | Title |
|---|---|---|---|---|
| CN103959065A (en) * | 2011-10-06 | 2014-07-30 | Aveo制药公司 | Predicting Tumor Responses to Anti-ERBB3 Antibodies |
| WO2016127220A1 (en) * | 2015-02-13 | 2016-08-18 | The University Of Queensland | Methods for classifying tumors and uses therefor |
Family Cites Families (21)
| Publication number | Priority date | Publication date | Assignee | Title |
|---|---|---|---|---|
| CN1852974A (en) * | 2003-06-09 | 2006-10-25 | 密歇根大学董事会 | Compositions and methods for treating and diagnosing cancer |
| AU2004284434A1 (en) | 2003-10-16 | 2005-05-06 | Genomic Health, Inc. | qRT-PCR assay system for gene expression profiling |
| FR2874622B1 (en) * | 2004-08-30 | 2011-01-14 | Diagnogene S A | BIOPUCE FOR DETERMINING A SENSITIVITY TO AN ANTICANCER DRUG AND METHOD FOR USING SAME |
| CN101541977A (en) * | 2006-09-19 | 2009-09-23 | 诺瓦提斯公司 | Biomarkers of target modulation, efficacy, diagnosis and/or prognosis for RAF inhibitors |
| US8093000B2 (en) * | 2008-05-09 | 2012-01-10 | The Regents Of The University Of California | Methods for predicting and treating tumors resistant to drug, immunotherapy, and radiation |
| CA2753119A1 (en) * | 2009-02-24 | 2010-09-02 | F. Hoffmann-La Roche Ag | Use of s-erbb-3 as a marker for cancer |
| WO2010102195A2 (en) | 2009-03-06 | 2010-09-10 | The Johns Hopkins University | Annexin a11 and associated genes as biomarkers for cancer |
| BRPI1010576A2 (en) * | 2009-05-11 | 2016-03-15 | Berg Biosystems Llc | methods for treating oncological disorders using epimetabolic protractors, multidimensional intracellular molecules or environmental influencers. |
| US10095829B2 (en) * | 2009-07-08 | 2018-10-09 | Worldwide Innovative Network | Computer implemented methods of treating lung cancer |
| EP2556166A1 (en) * | 2010-04-08 | 2013-02-13 | Institut Gustave Roussy | Methods for predicting or monitoring whether a patient affected by a cancer is responsive to a treatment with a molecule of the taxoid family |
| BR112012025730B1 (en) * | 2010-04-09 | 2020-12-08 | Aveo Pharmaceuticals, Inc | isolated antibody that binds to human erbb3, its uses, its production process and expression vector |
| CA2818976A1 (en) * | 2010-11-26 | 2012-05-31 | Oncolab Diagnostics Gmbh | Multimarker panel |
| JP2015505959A (en) * | 2011-12-05 | 2015-02-26 | ネステク ソシエテ アノニム | Methods of selecting treatment for patients with cancer |
| JP2015503330A (en) * | 2011-12-22 | 2015-02-02 | アベオ ファーマシューティカルズ, インコーポレイテッド | Identification of multigene biomarkers |
| EP3117030B1 (en) * | 2014-03-14 | 2022-04-27 | Hancock, Robert, E.W. | Diagnostic for sepsis |
| US20150320754A1 (en) * | 2014-04-16 | 2015-11-12 | Infinity Pharmaceuticals, Inc. | Combination therapies |
| CN104131095A (en) * | 2014-07-25 | 2014-11-05 | 封志纯 | Primer composition for primary immunodeficiency disease gene screening and kit using the same |
| CN105572355B (en) * | 2015-03-13 | 2018-04-13 | 中国医学科学院肿瘤医院 | Detect the biomarker of the cancer of the esophagus |
| WO2016201365A2 (en) * | 2015-06-12 | 2016-12-15 | Visani Giuseppe | Methods for treating cancers |
| US20180291459A1 (en) | 2015-10-08 | 2018-10-11 | Genomedx Biosciences, Inc. | Use of a genetic signature diagnostically to evaluate treatment strategies for prostate cancer |
| CN106692969B (en) * | 2016-12-08 | 2021-08-10 | 北海康成(北京)医药科技有限公司 | anti-ERBB 3 antibodies and uses thereof |
-
2017
- 2017-06-22 CN CN202110986455.5A patent/CN113621706B/en active Active
- 2017-06-22 CN CN202110986404.2A patent/CN113684275B/en active Active
- 2017-06-22 CN CN202110986640.4A patent/CN113683700B/en active Active
- 2017-06-22 CN CN202110986601.4A patent/CN113683699B/en active Active
- 2017-06-22 CN CN201710485107.3A patent/CN109111522B/en active Active
- 2017-06-22 CN CN202110986587.8A patent/CN113683698B/en active Active
-
2018
- 2018-06-12 WO PCT/CN2018/090790 patent/WO2018233511A1/en not_active Ceased
- 2018-06-12 US US16/626,147 patent/US11834716B2/en active Active
- 2018-06-12 JP JP2020520701A patent/JP7181290B2/en active Active
- 2018-06-12 EP EP18820791.4A patent/EP3644062B1/en active Active
-
2022
- 2022-11-15 JP JP2022182894A patent/JP7392083B2/en active Active
- 2022-11-15 JP JP2022182891A patent/JP7392082B2/en active Active
- 2022-11-16 JP JP2022183664A patent/JP7392086B2/en active Active
- 2022-11-16 JP JP2022183631A patent/JP7392085B2/en active Active
- 2022-11-16 JP JP2022183625A patent/JP7411055B2/en active Active
Patent Citations (2)
| Publication number | Priority date | Publication date | Assignee | Title |
|---|---|---|---|---|
| CN103959065A (en) * | 2011-10-06 | 2014-07-30 | Aveo制药公司 | Predicting Tumor Responses to Anti-ERBB3 Antibodies |
| WO2016127220A1 (en) * | 2015-02-13 | 2016-08-18 | The University Of Queensland | Methods for classifying tumors and uses therefor |
Non-Patent Citations (3)
| Title |
|---|
| Expression of NADPH oxidase homologues and accessory genes in human cancer cell lines, tumours and adjacent normal tissues;Juhasz A等;《Free Radic Res》;20100322;第43卷(第06期);第523-532页 * |
| Juhasz A等.Expression of NADPH oxidase homologues and accessory genes in human cancer cell lines, tumours and adjacent normal tissues.《Free Radic Res》.2010,第43卷(第06期),第523-532页. * |
| NOX家族蛋白的研究进展;韩晓燕等;《生命科学》;20120615;第24卷(第06期);第568-577页 * |
Also Published As
| Publication number | Publication date |
|---|---|
| JP7392082B2 (en) | 2023-12-05 |
| CN113683700A (en) | 2021-11-23 |
| CN113683698A (en) | 2021-11-23 |
| EP3644062C0 (en) | 2023-12-13 |
| US11834716B2 (en) | 2023-12-05 |
| CN109111522A (en) | 2019-01-01 |
| JP2023022104A (en) | 2023-02-14 |
| JP2023022113A (en) | 2023-02-14 |
| CN113684275A (en) | 2021-11-23 |
| WO2018233511A1 (en) | 2018-12-27 |
| JP2020524808A (en) | 2020-08-20 |
| CN113621706A (en) | 2021-11-09 |
| CN113684275B (en) | 2024-02-27 |
| CN113683699B (en) | 2023-04-18 |
| JP7181290B2 (en) | 2022-11-30 |
| JP7392085B2 (en) | 2023-12-05 |
| EP3644062B1 (en) | 2023-12-13 |
| JP7392086B2 (en) | 2023-12-05 |
| JP2023022112A (en) | 2023-02-14 |
| EP3644062A4 (en) | 2021-06-09 |
| CN109111522B (en) | 2022-02-01 |
| JP2023022105A (en) | 2023-02-14 |
| CN113683700B (en) | 2023-05-02 |
| JP7392083B2 (en) | 2023-12-05 |
| EP3644062A1 (en) | 2020-04-29 |
| JP2023022111A (en) | 2023-02-14 |
| US20210025006A1 (en) | 2021-01-28 |
| CN113621706B (en) | 2024-05-10 |
| CN113683699A (en) | 2021-11-23 |
| JP7411055B2 (en) | 2024-01-10 |
Similar Documents
| Publication | Publication Date | Title |
|---|---|---|
| AU2018204889B2 (en) | Predicting Tumor Response to Anti-ERBB3 Antibodies | |
| JP7392085B2 (en) | Method and kit for predicting esophageal cancer response to anti-ERBB3 antibody treatment | |
| HK40026223A (en) | Method for predicting esophagus cancer response to anti-erbb3 antibody treatment | |
| HK40026223B (en) | Method for predicting esophagus cancer response to anti-erbb3 antibody treatment | |
| HK1261117A1 (en) | Predicting tumor response to anti-erbb3 antibodies | |
| HK1200530B (en) | Predicting tumor response to anti-erbb3 antibodies |
Legal Events
| Date | Code | Title | Description |
|---|---|---|---|
| PB01 | Publication | ||
| PB01 | Publication | ||
| SE01 | Entry into force of request for substantive examination | ||
| SE01 | Entry into force of request for substantive examination | ||
| GR01 | Patent grant | ||
| GR01 | Patent grant |