CN113408884B - Method for determining load of gas leakage explosion of underground comprehensive pipe gallery - Google Patents
Method for determining load of gas leakage explosion of underground comprehensive pipe gallery Download PDFInfo
- Publication number
- CN113408884B CN113408884B CN202110644845.4A CN202110644845A CN113408884B CN 113408884 B CN113408884 B CN 113408884B CN 202110644845 A CN202110644845 A CN 202110644845A CN 113408884 B CN113408884 B CN 113408884B
- Authority
- CN
- China
- Prior art keywords
- leakage
- gas
- explosion
- ignition
- probability
- Prior art date
- Legal status (The legal status is an assumption and is not a legal conclusion. Google has not performed a legal analysis and makes no representation as to the accuracy of the status listed.)
- Active
Links
- 238000004880 explosion Methods 0.000 title claims abstract description 62
- 238000000034 method Methods 0.000 title claims abstract description 38
- 238000004088 simulation Methods 0.000 claims abstract description 32
- 238000013461 design Methods 0.000 claims abstract description 8
- 238000010187 selection method Methods 0.000 claims abstract description 5
- 239000007789 gas Substances 0.000 claims description 105
- VNWKTOKETHGBQD-UHFFFAOYSA-N methane Chemical compound C VNWKTOKETHGBQD-UHFFFAOYSA-N 0.000 claims description 40
- 239000003345 natural gas Substances 0.000 claims description 20
- 230000001186 cumulative effect Effects 0.000 claims description 16
- 238000009792 diffusion process Methods 0.000 claims description 10
- 238000009826 distribution Methods 0.000 claims description 10
- CGIGDMFJXJATDK-UHFFFAOYSA-N indomethacin Chemical compound CC1=C(CC(O)=O)C2=CC(OC)=CC=C2N1C(=O)C1=CC=C(Cl)C=C1 CGIGDMFJXJATDK-UHFFFAOYSA-N 0.000 claims description 6
- 238000005070 sampling Methods 0.000 claims description 6
- 230000000694 effects Effects 0.000 claims description 5
- 239000002360 explosive Substances 0.000 claims description 5
- 238000011161 development Methods 0.000 claims description 4
- 238000000342 Monte Carlo simulation Methods 0.000 claims description 3
- 238000010276 construction Methods 0.000 claims description 3
- 230000007423 decrease Effects 0.000 claims description 3
- 239000000203 mixture Substances 0.000 claims description 3
- 230000008520 organization Effects 0.000 claims description 3
- 238000009827 uniform distribution Methods 0.000 claims 1
- 238000011160 research Methods 0.000 abstract description 5
- 238000012502 risk assessment Methods 0.000 description 13
- 238000004364 calculation method Methods 0.000 description 8
- 238000010586 diagram Methods 0.000 description 8
- 238000011156 evaluation Methods 0.000 description 6
- 239000011148 porous material Substances 0.000 description 4
- 239000000446 fuel Substances 0.000 description 3
- 238000005192 partition Methods 0.000 description 3
- 238000004458 analytical method Methods 0.000 description 2
- 238000013459 approach Methods 0.000 description 2
- 230000033228 biological regulation Effects 0.000 description 2
- 238000002485 combustion reaction Methods 0.000 description 2
- 238000005034 decoration Methods 0.000 description 2
- 238000005516 engineering process Methods 0.000 description 2
- 239000003063 flame retardant Substances 0.000 description 2
- 238000012986 modification Methods 0.000 description 2
- 230000004048 modification Effects 0.000 description 2
- 238000007619 statistical method Methods 0.000 description 2
- 238000011144 upstream manufacturing Methods 0.000 description 2
- 238000009423 ventilation Methods 0.000 description 2
- 239000013256 coordination polymer Substances 0.000 description 1
- 238000012937 correction Methods 0.000 description 1
- 230000007547 defect Effects 0.000 description 1
- 238000005474 detonation Methods 0.000 description 1
- 238000000605 extraction Methods 0.000 description 1
- 239000012530 fluid Substances 0.000 description 1
- 238000009440 infrastructure construction Methods 0.000 description 1
- 230000001737 promoting effect Effects 0.000 description 1
- 230000000630 rising effect Effects 0.000 description 1
- 239000000126 substance Substances 0.000 description 1
Images


Classifications
-
- G—PHYSICS
- G06—COMPUTING; CALCULATING OR COUNTING
- G06Q—INFORMATION AND COMMUNICATION TECHNOLOGY [ICT] SPECIALLY ADAPTED FOR ADMINISTRATIVE, COMMERCIAL, FINANCIAL, MANAGERIAL OR SUPERVISORY PURPOSES; SYSTEMS OR METHODS SPECIALLY ADAPTED FOR ADMINISTRATIVE, COMMERCIAL, FINANCIAL, MANAGERIAL OR SUPERVISORY PURPOSES, NOT OTHERWISE PROVIDED FOR
- G06Q10/00—Administration; Management
- G06Q10/06—Resources, workflows, human or project management; Enterprise or organisation planning; Enterprise or organisation modelling
- G06Q10/063—Operations research, analysis or management
- G06Q10/0635—Risk analysis of enterprise or organisation activities
-
- G—PHYSICS
- G06—COMPUTING; CALCULATING OR COUNTING
- G06Q—INFORMATION AND COMMUNICATION TECHNOLOGY [ICT] SPECIALLY ADAPTED FOR ADMINISTRATIVE, COMMERCIAL, FINANCIAL, MANAGERIAL OR SUPERVISORY PURPOSES; SYSTEMS OR METHODS SPECIALLY ADAPTED FOR ADMINISTRATIVE, COMMERCIAL, FINANCIAL, MANAGERIAL OR SUPERVISORY PURPOSES, NOT OTHERWISE PROVIDED FOR
- G06Q10/00—Administration; Management
- G06Q10/06—Resources, workflows, human or project management; Enterprise or organisation planning; Enterprise or organisation modelling
- G06Q10/063—Operations research, analysis or management
- G06Q10/0639—Performance analysis of employees; Performance analysis of enterprise or organisation operations
- G06Q10/06393—Score-carding, benchmarking or key performance indicator [KPI] analysis
-
- G—PHYSICS
- G06—COMPUTING; CALCULATING OR COUNTING
- G06Q—INFORMATION AND COMMUNICATION TECHNOLOGY [ICT] SPECIALLY ADAPTED FOR ADMINISTRATIVE, COMMERCIAL, FINANCIAL, MANAGERIAL OR SUPERVISORY PURPOSES; SYSTEMS OR METHODS SPECIALLY ADAPTED FOR ADMINISTRATIVE, COMMERCIAL, FINANCIAL, MANAGERIAL OR SUPERVISORY PURPOSES, NOT OTHERWISE PROVIDED FOR
- G06Q50/00—Information and communication technology [ICT] specially adapted for implementation of business processes of specific business sectors, e.g. utilities or tourism
- G06Q50/06—Energy or water supply
Landscapes
- Business, Economics & Management (AREA)
- Human Resources & Organizations (AREA)
- Engineering & Computer Science (AREA)
- Economics (AREA)
- Strategic Management (AREA)
- Entrepreneurship & Innovation (AREA)
- General Physics & Mathematics (AREA)
- General Business, Economics & Management (AREA)
- Educational Administration (AREA)
- Marketing (AREA)
- Theoretical Computer Science (AREA)
- Development Economics (AREA)
- Tourism & Hospitality (AREA)
- Physics & Mathematics (AREA)
- Quality & Reliability (AREA)
- Game Theory and Decision Science (AREA)
- Operations Research (AREA)
- Health & Medical Sciences (AREA)
- Public Health (AREA)
- Water Supply & Treatment (AREA)
- General Health & Medical Sciences (AREA)
- Primary Health Care (AREA)
- Examining Or Testing Airtightness (AREA)
Abstract
The invention relates to the technical field of underground comprehensive pipe gallery (gas gallery) structure design, in particular to a load determination method for gas leakage and explosion of an underground comprehensive pipe gallery. The realization process is as follows: 1. the whole process; 2. a failure frequency model; 3. a sample selection method; 4. accumulating the ignition frequency; 5. and (4) leakage and explosion. The combined simulation research method and conclusion can provide important reference for the load value of gas leakage and explosion of the underground comprehensive pipe gallery (gas inlet gallery).
Description
Technical Field
The invention relates to the technical field of structural design of underground comprehensive pipe galleries (gas gallery), in particular to a load determination method for gas leakage and explosion of the underground comprehensive pipe galleries.
Background
At present, china is greatly promoting the infrastructure construction of comprehensive pipe galleries, encouraging gas to enter the galleries, and the unified management is facilitated. Because utility tunnel has been equipped with modern control, early warning and control system, can reduce the quantity of gas incident to a certain extent. However, in the case of a gas leakage explosion in the closed gas compartment, the consequences can be even more serious. Therefore, the natural gas leakage explosion of the comprehensive pipe gallery has the characteristics of low accident risk value and serious accident consequence, and when the anti-explosion design is carried out, a load value taking method related to gas explosion in the specification is not applicable any more, and related research needs to be carried out.
As a commonly used method of load evaluation, quantitative Risk Assessment (QRA) uses a limited number of calculations to quantitatively describe the impact of an event and its likely extent. The risk level calculation facing various facilities in the chemical industry is explained in detail in the specification, and the CFD result is recommended to be used for supporting when explosive load risk evaluation is carried out. Hansen et al first propose to use CFD technology to carry out risk analysis of gas explosion; yet et al used FLACS gas explosion software to make quantitative risk assessment of heat, overpressure peaks and momentum in petrochemical storage tanks and given individual risk values in different areas. Thereafter, as the computer level develops, more related researches are spread around various factors influencing the risk evaluation result, such as the number of simulation scenes and the representativeness of the simulation scenes. And the method aims to improve the refinement degree of the existing risk evaluation system and enhance the robustness of the prediction result. However, the related research is limited to the field of process industry, and the conclusion that the related research can be directly applied to the antiknock design of the comprehensive pipe gallery is less. And the leakage diffusion and explosion of gas are a whole process, and the leakage diffusion and explosion of gas are combined together and are only considered, so that the method has certain limitation on the application of a new scene, and a gas leakage explosion load value taking method aiming at the comprehensive pipe gallery needs to be proposed urgently.
Disclosure of Invention
The invention aims to overcome the defects of the technology and provide a method for determining the load of gas leakage and explosion of an underground comprehensive pipe gallery.
In order to achieve the purpose, the invention adopts the technical scheme that the comprehensive pipe gallery gas leakage explosion load value taking method based on risk assessment is implemented by the following steps:
1. integrated process
Risk assessment is a statistical method to quantitatively assess the impact of an event and its likely extent. In the discretized risk indicator space, each element R integrates a certain dangerous scene and the information it carries.
R={<S i ,L i ,C i >} (1)
Wherein R is the risk degree, S i For the ith dangerous scene, C i Is S i As a result of (A), L i Is C i The possibility of the occurrence of a short circuit,
and defining the natural gas leakage explosion of the comprehensive pipe gallery as a dangerous scene set S. The "explosion overpressure peak and impulse" are taken as the outcome sets CP and CI, respectively.
2. Failure frequency model
Because no data about the failure and leakage of the natural gas pipeline in the comprehensive pipe rack exists at present, a long-distance natural gas pipeline accident database of the European gas pipeline accident data organization (EGIG) is selected as a reference. Unexpected that caused one accidental gas leak in EGIG was defined as one failure, and failure types were classified into three types of small hole (d <20 mm), large hole (20mm < -d < -300mm), and rupture (d = pipe diameter) depending on the equivalent leak diameter d. The following three factors are considered for reasonably selecting and correcting the EGIG statistical data for use:
(1) Frequency of failure F f The statistics of the last decade from 2007 to 2016 are chosen as reference because of the year-by-year decline and the stability at a lower level since the beginning of this century.
(2) The utility tunnel natural gas pipeline diameter d is typically between 300 and 600mm, so statistics between 279.4 and 584.2mm were chosen as a reference.
(3) After the gas enters the corridor, the failure caused by the damage of the third party is basically avoided, and the effect of natural disasters can be reduced to a great extent, so that the influences of the damage of the third party and the natural disasters are respectively reduced by 90% and 60% and then calculated.
And combining the consideration, and finally calculating the failure frequency according to the EGIG statistical data to be used as the failure frequency of the leakage of the natural gas pipeline in the comprehensive pipe gallery.
According to the regulations of the design and construction of gas pipeline and cabin supporting facilities of the comprehensive pipe gallery (18 GL 502), an emergency cut-off system is required to be equipped when gas enters the gallery. Thus, when the emergency shut-off system is in operation, an unsteady leak will occur at the leak orifice and, starting from the upstream shut-off valve position, the leaking pipe section will be reduced to a fixed volume rigid vessel, and the leak flow Q (t) can be calculated according to the leak model in the documents Montiel H, V i lchez J A, casal J, et al.
3. Sample selection method
Theoretically, the number of elements in the dangerous scene set S is infinite, and it is impossible to calculate and analyze all dangerous scenes. Therefore, a limited number of dangerous scenes need to be scientifically selected for calculation and analysis, so as to obtain reliable risk assessment results. Determining a certain danger scenario S i At least three parameters of the leakage position, the leakage direction and the leakage flow are required and are recorded as S i (X1,X2,X3)。
Due to the long and narrow characteristic of the comprehensive pipe gallery, the leakage occurrence position can be defined only by the X coordinate along the length direction. In a fire zone 200m long, the location of the leak is random, assuming X1 is at 0,200]And uniformly distributed. The direct use of the Monte Carlo method may cause a large difference between the sampling result and the original distribution, so according to the hierarchical sampling principle, firstly [0,200%]The leakage can only occur along the directions of +/-X, +/-Y and +/-Z in a rectangular space coordinate system for simplifying the problem. Wherein the X direction is taken to mean alpha<45 deg., so that X2 is a discrete random variable, randomly valued in X, Y, Z, and the probability of being chosen in each direction is 1/6. The ratio of small pore, large pore to failure frequency at break is approximately 14. Therefore, X3 is a random variable that reflects the above proportional relationship. When large bore leakage is considered, the difference in leakage flow due to 20mm and 300mm respectively may be closeTwo orders of magnitude, so the value range can be divided into a plurality of cells according to the equal ratio principle, and then the selection is carried out in each cell. Thus, S i Can be regarded as a ternary random variable, the dimensions are independent of each other and obey different distributions.
4. Cumulative ignition frequency
It is assumed that the probability of an ignition source occurring at various locations in the piping lane is the same and that the volume of the flammable gas cloud is constantly evolving as the leaking gas gradually diffuses. In the relatively closed space of the pipe gallery, ignition takes place while the ignition source is present and the mixture gas concentration there is within the explosive limits, so that the basic probability of ignition p is:

in the formula, s p The possibility of fire sources; FLAM is the volume of the combustible gas cloud (m) 3 ) (ii) a V is total volume (m) of fire-retardant subareas 3 )。
Constructing an ignition event tree, judging whether to ignite at the end of each second, and calculating the ignition probability at a certain moment by using conditional probability, namely the probability P of being ignited at the very tth second 0t Comprises the following steps:

in general, we are more concerned about the cumulative probability of ignition P within t seconds t Is composed of

The accumulated ignition probability constructed by the method has only one empirical parameter s p It has practicability. And simultaneously considers the development process of the real combustible gas cloud and the characteristics of the real combustible gas cloud which grows along with the time.
5. Joint simulation of leakage and explosion
And performing combined simulation of gas leakage diffusion and explosion according to the calculated leakage flow and the selected proper number of simulation working conditions, and corresponding the explosion consequences under each leakage amount one to one.
5.1 cloud cumulative frequency curve for combustible gas
After the FLACS leakage diffusion simulation calculation is finished, in the rt.fuel file, not only a combustible region volume FLAM but also an equivalent combustible gas cloud volume Q9 is generated. Q9 is equivalent to the even combustible gas cloud volume that can burn completely according to certain rule with the inhomogeneous combustible gas cloud volume that obtains, and Q9 is:

in the formula, V i (i =1,2, \ 8230; n) is the volume of each control grid occupied by a combustible region in the flow field (m) 3 );ER i Is where the mixed gas equivalence ratio of the ith control grid; ERfac (ER) i ) Reflects the influence of the combustion rate of the laminar flame; ve (ER) i ) Reflecting the effect of the gas expansion capacity.
5.2 correlation of equivalent combustible gas cloud and explosion consequence
In a data result file generated by the leakage diffusion simulation, a certain quantity of the data result files are randomly extracted to carry out real gas cloud explosion simulation, and the purpose is to establish the correlation between combustible gas cloud and explosion consequences. Such a treatment has two advantages: firstly, because many factors such as the size of gas cloud, the shape of gas cloud, the position of gas cloud, the ignition position and the equivalence ratio can influence the result of gas explosion, a large number of samples are needed for carrying out quantitative risk assessment directly through gas explosion simulation; second, in a new environment where the cumulative frequency distribution of the combustible gas cloud is not substantially grasped, directly assuming the distribution of the combustible gas cloud sizes may lead to erroneous evaluation results.
5.3 overrun probability curve of explosion overpressure peak value and impulse
Comprehensively considering the failure frequency of the natural gas pipeline, the cumulative frequency curve of the equivalent combustible gas cloud Q9, the cumulative ignition probability curve of each sample and the inside of the comprehensive pipe galleryConsequences of natural gas leakage explosion C i The possibilities of (A) are:
L i (C i )=F f ×Cum(Q9 i )×P ti (6)
when mixing C i Defined as the explosion overpressure peak P max Time, ignition source parameter s p =0.01, 0.05 and 0.1, and all (P) were calculated according to equation (6) max ,L i ) And extracting an upper envelope curve of the sample point, drawing an over-pressure probability curve of an over-pressure peak value, representing the maximum probability of causing a certain over-pressure peak value, and similarly, calculating an impulse over-pressure probability curve.
Compared with the prior art, the method has the advantages that the method is based on the computational fluid dynamics software FLACS simulation, considers the real scene and is more accurate in determination of the explosive load compared with the traditional method; the invention considers the influence of random factors such as gas leakage position, leakage amount, ignition position and the like on the explosion load, and the calculation result is more accurate.
Drawings
FIG. 1 is a main flow diagram of the present invention;
FIG. 2 is a graph of different types of failure frequencies before and after correction of EGIG statistical data;
FIG. 3 is a leak location zone diagram;
FIG. 4 is a leakage direction selection diagram;
FIG. 5 is a diagram of a FLACS numerical simulation complete flow and file information;
FIG. 6 is a diagram of a gas explosion simulation ignition location selection method;
FIG. 7a is a utility tunnel layout;
FIG. 7b is a diagram of a collection model;
FIG. 8a is a plot of unsteady flow time course of orifice leakage;
FIG. 8b is a plot of unsteady flow time course of large hole 1 leakage;
FIG. 8c is a plot of unsteady flow time course for large bore 2 leakage;
FIG. 8d is a plot of unsteady state leakage flow time history at a pipe break;
FIG. 9 is a calculated operating condition selection map;
FIG. 10 is a graph of cumulative frequency of a cloud of combustible gas;
FIG. 11 is a graph of cloud values for combustible gas at a cumulative frequency;
FIG. 12 is a Q9 diagram of a different leak hole;
FIG. 13a is a graph relating Q9 to an overpressure peak;
FIG. 13b is a graph of Q9 versus detonation impulse;
FIG. 14a is an overrun probability plot of an explosion overpressure spike
Fig. 14b is a transcendental probability plot of the explosion impulse.
Detailed Description
The following detailed description of the preferred embodiments will be made with reference to the accompanying drawings. A comprehensive pipe gallery gas leakage explosion load value taking method based on risk assessment comprises the following implementation processes:
1. integrated process
Risk assessment is a statistical method to quantitatively assess the impact of an event and its likely extent. In the discretized risk indicator space, each element R integrates a certain dangerous scene and the information it carries.
R={<S i ,L i ,C i >} (1)
Wherein R is the risk degree, S i For the ith dangerous scene, C i Is S i As a result of (A), L i Is C i The possibility of the occurrence of the above-mentioned problems,
and defining the natural gas leakage explosion of the comprehensive pipe gallery as a dangerous scene set S. Respectively using 'explosion overpressure peak value and impulse' as result set C P And C I . The overall flow of the comprehensive pipe gallery natural gas leakage explosion quantitative risk assessment is shown in figure 1.
2. Failure frequency model
Because no data about the failure and leakage of the natural gas pipeline in the comprehensive pipe rack exists at present, a long-distance natural gas pipeline accident database of the European gas pipeline accident data organization (EGIG) is selected as a reference. Unexpected that caused one accidental gas leak in EGIG was defined as one failure, and failure types were classified into three types of small hole (d <20 mm), large hole (20mm < -d < -300mm), and rupture (d = pipe diameter) depending on the equivalent leak diameter d. The following three factors are considered for reasonably selecting and correcting the EGIG statistical data for use:
(1) Frequency of failure F f The statistics of the last decade from 2007 to 2016 are selected as a reference because of the decline year by year and the stability at a lower level since the beginning of the century.
(2) The utility tunnel natural gas pipeline diameter d is typically between 300 and 600mm, so statistics from 279.4 to 584.2mm were chosen as a reference.
(3) After the gas enters the corridor, the failure caused by the damage of the third party is basically avoided, and the effect of natural disasters can be reduced to a great extent, so that the influences of the damage of the third party and the natural disasters are respectively reduced by 90% and 60% and then calculated.
In combination with the above considerations, the failure frequency finally calculated from the EGIG statistical data is shown in fig. 2, and is taken as the failure frequency of the natural gas pipeline in the utility tunnel with leakage.
According to the regulations of the design and construction of gas pipeline and cabin supporting facilities of the comprehensive pipe gallery (18 GL 502), an emergency cut-off system is required to be equipped when gas enters the gallery. Thus, when the emergency shut-off system is in operation, an unsteady leak will occur at the leak orifice and, starting from the upstream shut-off valve position, the leaking pipe section will be reduced to a fixed volume rigid vessel, and the leak flow Q (t) can be calculated according to the leak model in the documents Montiel H, V i lchez J A, casal J, et al.
3. Sample selection method
Theoretically, the number of elements in the dangerous scene set S is infinite, and it is impossible to calculate and analyze all dangerous scenes. Therefore, a limited number of dangerous scenes need to be scientifically selected for calculation and analysis, so as to obtain reliable risk assessment results. Determining a certain danger scenario S i At least three of the position of the leakage, the leakage direction and the leakage flow rate are requiredParameter, denoted as S i (X1,X2,X3)。
Due to the long and narrow characteristic of the comprehensive pipe gallery, the leakage occurrence position can be defined only by the X coordinate along the length direction. In a fire zone 200m long, the location of the leak is random, assuming X1 is at [0,200%]And uniformly distributed. The direct use of the Monte Carlo method may cause a large difference between the sampling result and the original distribution, so according to the hierarchical sampling principle, firstly [0,200%]The fire-proof partition is divided into five sections, namely a middle section, an inner section and an end section from the central axis to two sides of the fire-proof partition in sequence, as shown in figure 3. Theoretically, leakage can occur in any direction, but for simplicity, it is believed that leakage can only occur in the + -X, + -Y and + -Z directions in a spatial rectangular coordinate system. Wherein the X direction is taken to mean alpha<45 deg., as shown in fig. 4. Therefore, X2 is a discrete random variable, randomly valued in { + -X, + -Y, + -Z } and the probability of being chosen in each direction is 1/6. The ratio of small pore, large pore to failure frequency at break is approximately 14. Therefore, X3 is a random variable that reflects the above proportional relationship. When large hole leakage is considered, the difference of the leakage flow rates corresponding to 20mm and 300mm can approach two orders of magnitude, so the value range can be divided into a plurality of small intervals according to the equal ratio principle, and then selection is performed from each small interval. Thus, S i Can be regarded as a ternary random variable, with dimensions that are independent of each other and subject to different distributions.
4. Cumulative ignition frequency
It is assumed that the probability of an ignition source occurring at various locations in the piping lane is the same, and as the leaking gas gradually diffuses, the volume of the flammable gas cloud continues to evolve. In the relatively closed space of the pipe gallery, ignition takes place while the ignition source is present and the mixture gas concentration there is within the explosive limits, so that the basic probability of ignition p is:

in the formula, s p The possibility of fire sources; FLAM is the volume of the combustible gas cloud (m) 3 ) (ii) a V is total volume (m) of fire-retardant subareas 3 )。
Constructing an ignition event tree, judging whether to ignite at the end of each second, and calculating the ignition probability at a certain moment by using conditional probability, namely the probability P of being ignited at the very tth second 0t Comprises the following steps:

in general, we are more concerned about the cumulative probability of ignition P within t seconds t Is composed of

The cumulative probability of ignition constructed by the above method has only one empirical parameter s p It has practicability. And simultaneously considers the development process of the real combustible gas cloud and the characteristics of the real combustible gas cloud which grows along with the time.
5. Joint simulation of leakage and explosion
And performing combined simulation of gas leakage diffusion and explosion according to the calculated leakage flow and the selected simulation working conditions with proper quantity, wherein the explosion consequences under each leakage amount are in one-to-one correspondence, and the specific flow is shown in fig. 5.
5.1 cloud cumulative frequency curve for combustible gas
After the FLACS leakage diffusion simulation calculation is finished, in the rt.fuel file, not only a combustible region volume FLAM but also an equivalent combustible gas cloud volume Q9 is generated. Q9 is equivalent to the even combustible gas cloud volume that can burn completely according to certain rule with the inhomogeneous combustible gas cloud volume that obtains, and Q9 is:

in the formula, V i (i =1,2, \ 8230; n) is the volume of each control grid occupied by a combustible region in the flow field (m) 3 );ER i Is the ith oneControlling the equivalence ratio of the mixed gas of the grids; ERfac (ER) i ) The influence of the combustion rate of the laminar flame is reflected; ve (ER) i ) Reflecting the effect of the gas expansion capacity.
5.2 correlation of equivalent combustible gas cloud and explosion consequence
In a data result file generated by the leakage diffusion simulation, a certain number of data are randomly extracted to perform real gas cloud explosion simulation, and the process is shown as fig. 6 and aims to establish the correlation between combustible gas cloud and explosion consequences. Such a treatment has two advantages: firstly, because many factors such as the size of gas cloud, the shape of gas cloud, the position of gas cloud, the ignition position and the equivalence ratio can influence the result of gas explosion, a large number of samples are needed for carrying out quantitative risk assessment directly through gas explosion simulation; second, in a new environment where the cumulative frequency distribution of the combustible gas cloud is not substantially grasped, directly assuming the distribution of the combustible gas cloud sizes may lead to erroneous evaluation results.
5.3 overrun probability curve of explosion overpressure peak value and impulse
Comprehensively considering the failure frequency of the natural gas pipeline, the cumulative frequency curve of the equivalent combustible gas cloud Q9, the cumulative ignition probability curve of each sample and the natural gas leakage explosion consequence C in the comprehensive pipe gallery i The possibilities of (a) are:
L i (C i )=F f ×Cum(Q9 i )×P ti (6)
when mixing C i Defined as the explosion overpressure peak P max Time, ignition source parameter s p =0.01, 0.05 and 0.1, and all (P) were calculated according to equation (6) max ,L i ) The upper envelope of the sample points is extracted and the transcendental probability curve of an overpressure peak is plotted as shown in fig. 12, representing the maximum probability of causing a certain overpressure peak, and similarly the overpressure probability curve of the impulse can be calculated.
According to the comprehensive pipe gallery design diagram shown in fig. 7 (a), a geometric model shown in fig. 7 (b) is established, in order to make the numerical model more accurate, escape openings at two ends of a gas cabin (200 x2 x 4 m), self-service and standby ventilation openings (0.8 x 0.8 m) and a wind pavilion at the upper part are considered, and a DN300 medium-pressure (0.4 MPa) gas pipeline, buttresses and a ladder stand are included inside the comprehensive pipe gallery as typical conventional facilities.
The range of the steady-state leakage flow of the large holes calculated according to the leakage model is between 0.26 and 13.60kg/s, and 4 representative values of the leakage flow of the large holes are selected in the range according to an equal ratio principle in order to reduce the number of times of grid re-division in the simulation process. The 2-hole leakage flow rate was selected in the range of less than 0.26kg/s, and 13.60kg/s was used as the fracture leakage flow rate. Considering emergency brake valve operation at 1km intervals to isolate the leaking pipe section, the resulting unsteady leakage flow used in the simulation is shown in figures 8a-8 d. In order to keep the proportion of different leakage flows in the sample consistent with the proportion of failure frequency, geometric interpolation is carried out on the simulation results (combustible gas clouds) of the two types of small hole leakage flows. Since the + Y and-Y leakage directions have little difference, only the + Y direction is calculated in the simulation. The total number of simulation conditions and the total number of samples are shown in fig. 9.
The maximum values of FLAM and Q9 of each sample of risk assessment are counted, an accumulated frequency curve is respectively drawn as shown in figure 10, and the value under certain accumulated frequency is shown in figure 11. It can be seen that the maximum value of Q9 is 903.8m within the calculation time of 180s 3 Only 5% of the probability will exceed 300m 3 Half of the probability is not more than 84.5m 3 In comparison to 200 × 2 × 4=1600m 3 The fire partition size of (2) is small, the value of Q9 is not large generally, and a relatively stable flow field of 0.5-1 m/s can be formed in the cabin already at the accident ventilation rate of 5m/s, and the combustible gas cloud is further limited as time goes on. The volume of the combustible gas cloud that can be formed is therefore limited, given the complete safety system. In the confined space of the comprehensive pipe rack, the leakage flow and the size of combustible gas cloud are not in positive correlation, and the equivalent combustible gas cloud generated by the leakage of a large hole with the diameter of 20-42 mm is the largest, as shown in figure 12.
In 700 data result files generated in the leakage diffusion simulation, 420 data are randomly extracted to carry out real gas cloud explosion simulation, and the purpose is to establish the correlation between combustible gas cloud and explosion consequences. 294 samples were successfully ignited at the end of 420 real gas cloud ignition positions randomly selected. Extraction of overpressure peaks in all sample calculationsThe relationship between the value and the equivalent combustible gas cloud Q9 is shown in fig. 11. Due to the influence of the factors on the explosion consequences, phenomena such as two pressure peaks or incomplete consumption of fuel can occur in the explosion simulation of the real combustible gas cloud, and it can also be observed through the simulation result that the explosion overpressure peak value is generally large when the middle part of the massive combustible gas cloud is ignited, so that the correlation between Q9 and the overpressure peak value is established by selecting 31 upper-bound results of the sample points, which is conservative, as shown in fig. 13 (a). The fitting result is (R) 2 =0.96):
P max =3.749×(Q9) 0.719 (7)
Q9 dependence on the explosion impulse is shown in FIG. 13 (b), and all samples were fitted to yield (R) 2 =0.88):
I=1.624×(Q9) 0.746 (8)
The transcendental probability curve of an overpressure peak is plotted according to equation 7, representing the maximum probability of causing a certain overpressure peak, as shown in fig. 14 (a). It can be seen that with s p Gradually increasing, and gradually slowing the rising speed of the transcendental probability curve. When the control of the fire source in the pipe gallery is poor(s) p = 0.1), the transcendental probability curve approaches a certain upper bound. When the ignition factor can be effectively controlled, sp =0.01 may be desirable, otherwise, sp may be set conservatively to a larger value. The transcendental probability curve of the explosion impulse obtained according to the same principle is shown in fig. 14 (b).
The foregoing is only a preferred embodiment of the present invention, and it should be noted that, for those skilled in the art, various modifications and decorations can be made without departing from the principle of the present invention, and these modifications and decorations should also be regarded as the protection scope of the present invention.
Claims (2)
1. The utility model provides a load determination method of underground utility tunnel gas leakage explosion which characterized in that: the realization process is as follows:
1. integrated process
In the discretized risk indicator space, each element R integrates a certain dangerous scene and the information carried by the dangerous scene,
R={<S i ,L i ,C i >} (1)
wherein R is the risk degree, S i For the ith dangerous scene, C i Is S i As a result of (A), L i Is C i The possibility of the occurrence of the above-mentioned problems,
defining 'natural gas leakage explosion of the comprehensive pipe gallery' as a dangerous scene set S, and respectively using 'explosion overpressure peak value and impulse' as a consequence set C P And C I ;
2. Failure frequency model
Selecting a long-distance natural gas pipeline accident database of an European gas pipeline accident data organization EGIG as a reference, defining an accident causing one-time accidental gas leakage in the EGIG as one-time failure, dividing failure types into three types of small holes with d <20mm, large holes with mm < d <300mm and fracture with d = pipe diameter according to different equivalent leakage diameters d, and finally calculating failure frequency according to EGIG statistical data to be used as the failure frequency of leakage of the natural gas pipeline in the comprehensive pipe rack;
according to the stipulation of 'design and construction of gas pipeline cabin supporting facilities of a comprehensive pipe gallery', an emergency cut-off system is required to be equipped when gas enters the gallery, and leakage flow Q (t) is calculated according to a leakage model of a public document;
3. sample selection method
Determining a certain dangerous scene Si, at least needing three parameters of leakage occurrence position, leakage direction and leakage flow, and recording as S i (X1,X2,X3);
In a fire zone 200m long, the location of the leak is random, assuming X1 is at [0,200%]Subject to uniform distribution, the direct adoption of the Monte Carlo method may cause the sampling result to have great difference from the original distribution, so according to the layered sampling principle, firstly [0,200%]The leakage can only occur along the directions of +/-X, +/-Y and +/-Z under a space rectangular coordinate system for simplifying the problem, wherein the X direction is used for expressing alpha<45°In the case of (1), therefore, X2 is a discrete random variable, and takes a value randomly in { ± X, ± Y, ± Z }, and the probability of being selected in each direction is 1/6, and the ratio of the small hole, the large hole and the failure frequency of fracture is approximately 14 i The method can be regarded as a ternary random variable, the dimensions are independent and obey different distributions;
4. cumulative ignition frequency
It is assumed that the probability of an ignition source occurring at various locations in the piping lane is the same, and as the leaking gas gradually diffuses, the volume of the flammable gas cloud continues to evolve. In the relatively closed space of the tube lane, the ignition takes place while the ignition source is present and the mixture gas concentration there is within the explosive limits, so that the basic ignition probability p is:

in the formula, S p The possibility of fire sources; FLAM is the volume of the combustible gas cloud (m) 3 ) (ii) a V is total volume of fire-proof subareas (m) 3 );
Constructing an ignition event tree, judging whether to ignite at the end of each second, and calculating the ignition probability at a certain moment by using conditional probability, namely the probability P of being ignited at the very tth second 0t Comprises the following steps:
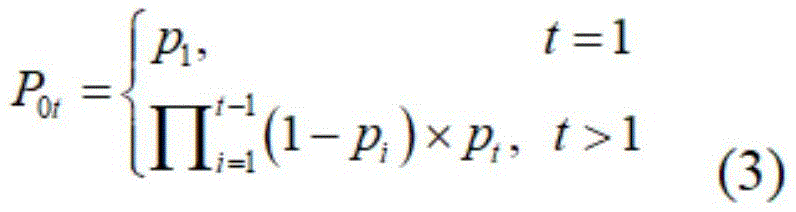
in general, the probability of ignition P is accumulated within t seconds t Is composed of

The accumulated ignition probability constructed by the method has only one empirical parameter s p The method has practicability, and simultaneously considers the characteristics of the real combustible gas cloud development process and the time growth of the real combustible gas cloud development process;
5. joint simulation of leakage and explosion
And performing combined simulation of gas leakage diffusion and explosion according to the calculated leakage flow and the selected simulation working conditions with proper quantity, and corresponding the explosion consequences under each leakage amount one to one.
2. The underground utility tunnel gas leakage explosion load determination method according to claim 1, characterized in that: in the failure frequency model in the step 2, the following three factors are considered to reasonably select and modify the EGIG statistical data for use:
(1) Frequency of failure F f The statistical data of the last ten years from 2007 to 2016 are selected as a reference because the statistical data decline year by year and are stabilized at a lower level since the beginning of the century;
(2) The diameter d of the natural gas pipeline of the comprehensive pipe gallery is usually between 300 and 600mm, so statistics of 279.4 to 584.2mm are selected as reference;
(3) After the gas enters the corridor, the failure caused by the damage of the third party is basically avoided, and the effect of natural disasters can be reduced to a great extent, so that the influences of the damage of the third party and the natural disasters are respectively reduced by 90% and 60% and then calculated.
Priority Applications (1)
| Application Number | Priority Date | Filing Date | Title |
|---|---|---|---|
| CN202110644845.4A CN113408884B (en) | 2021-06-09 | 2021-06-09 | Method for determining load of gas leakage explosion of underground comprehensive pipe gallery |
Applications Claiming Priority (1)
| Application Number | Priority Date | Filing Date | Title |
|---|---|---|---|
| CN202110644845.4A CN113408884B (en) | 2021-06-09 | 2021-06-09 | Method for determining load of gas leakage explosion of underground comprehensive pipe gallery |
Publications (2)
| Publication Number | Publication Date |
|---|---|
| CN113408884A CN113408884A (en) | 2021-09-17 |
| CN113408884B true CN113408884B (en) | 2023-04-07 |
Family
ID=77683334
Family Applications (1)
| Application Number | Title | Priority Date | Filing Date |
|---|---|---|---|
| CN202110644845.4A Active CN113408884B (en) | 2021-06-09 | 2021-06-09 | Method for determining load of gas leakage explosion of underground comprehensive pipe gallery |
Country Status (1)
| Country | Link |
|---|---|
| CN (1) | CN113408884B (en) |
Family Cites Families (1)
| Publication number | Priority date | Publication date | Assignee | Title |
|---|---|---|---|---|
| CN109140242B (en) * | 2018-09-12 | 2020-04-24 | 哈尔滨工业大学 | Online monitoring and ventilation linkage control method for gas cabin of comprehensive pipe rack |
-
2021
- 2021-06-09 CN CN202110644845.4A patent/CN113408884B/en active Active
Non-Patent Citations (5)
| Title |
|---|
| 城市综合管廊内天然气爆炸荷载特性研究;孙庆文;《中国优秀硕士学位论文全文数据库》;20190515;全文 * |
| 燃气爆炸作用下地下综合管廊动力响应模拟;刘中宪;《防灾减灾工程学报》;20180831;第38卷(第4期);全文 * |
| 燃气爆炸荷载作用下综合管廊破坏历程研究;王树银;《煤气与热力》;20210331;第41卷(第3期);全文 * |
| 综合管廊内燃气爆炸荷载特性实验研究和数值模拟;闫秋实;《爆破》;20210331;第38卷(第1期);全文 * |
| 综合管廊在燃气爆炸作用下的动力响应;张杨;《中国优秀硕士学位论文全文数据库》;20190915;全文 * |
Also Published As
| Publication number | Publication date |
|---|---|
| CN113408884A (en) | 2021-09-17 |
Similar Documents
| Publication | Publication Date | Title |
|---|---|---|
| Wang et al. | Diffusion process simulation and ventilation strategy for small-hole natural gas leakage in utility tunnels | |
| Chen et al. | Dynamic vulnerability assessment of process plants with respect to vapor cloud explosions | |
| Zhu et al. | Analysis and assessment of the Qingdao crude oil vapor explosion accident: Lessons learnt | |
| Rimkevicius et al. | Development of approach for reliability assessment of pipeline network systems | |
| Jin et al. | Probabilistic fire risk analysis and structural safety assessment of FPSO topside module | |
| Ahumada et al. | A method for facility layout optimisation including stochastic risk assessment | |
| Zhu et al. | Study on ignition probability of flammable materials after leakage accidents | |
| Xu et al. | A risk-based optimal pressure relief opening design for gas explosions in underground utility tunnels | |
| CN113408884B (en) | Method for determining load of gas leakage explosion of underground comprehensive pipe gallery | |
| CN113256127B (en) | LNG fuel power ship gate-passing risk assessment method and device and storage medium | |
| CN112381475B (en) | Gas distribution station anti-seismic safety evaluation method and evaluation system | |
| Omidvar et al. | Seismic damage to urban areas due to failed buried fuel pipelines case study: fire following earthquake in the city of Kermanshah, Iran | |
| CN112989717A (en) | Hydrogenation station fire accident thermal radiation assessment method and system | |
| KR20170040908A (en) | Probabilistic gas explosion scenario calculation system and probabilistic gas explosion scenario calculation method using the same | |
| Badri et al. | The role of quantitative risk assessment in improving hazardous installations siting: a case study | |
| Li et al. | Review on fire explosion research of crude oil storage tank | |
| Badri et al. | A multivariable approach for estimation of vapor cloud explosion frequencies for independent congested spaces to be used in occupied building risk assessment | |
| CN112784391A (en) | Explosion safety risk assessment method and system | |
| Xu et al. | Risk assessment method for the safe operation of long-distance pipeline stations in high-consequence areas based on fault tree construction: Case study of China–Myanmar natural gas pipeline branch station | |
| Alghamdi | Developmental of a vapor cloud explosion risk analysis tool using exceedance methodology | |
| CN115100822B (en) | Early warning and grading method for gas leakage risk | |
| Wang et al. | Cask principle of multi-attribute risk assessment: Non-weighted maximal approach for production accidents | |
| Duclos et al. | Engineering safety in hydrogen-energy applications | |
| Tchouvelev et al. | Comparative risk estimation of compressed hydrogen and CNG refuelling options | |
| CN112784388A (en) | Petrochemical device explosion risk assessment method and system thereof |
Legal Events
| Date | Code | Title | Description |
|---|---|---|---|
| PB01 | Publication | ||
| PB01 | Publication | ||
| SE01 | Entry into force of request for substantive examination | ||
| SE01 | Entry into force of request for substantive examination | ||
| GR01 | Patent grant | ||
| GR01 | Patent grant |