CN113165652B - Verifying predicted trajectories using a mesh-based approach - Google Patents
Verifying predicted trajectories using a mesh-based approach Download PDFInfo
- Publication number
- CN113165652B CN113165652B CN201980080993.9A CN201980080993A CN113165652B CN 113165652 B CN113165652 B CN 113165652B CN 201980080993 A CN201980080993 A CN 201980080993A CN 113165652 B CN113165652 B CN 113165652B
- Authority
- CN
- China
- Prior art keywords
- vehicle
- predicted
- trajectory
- cells
- trajectories
- Prior art date
- Legal status (The legal status is an assumption and is not a legal conclusion. Google has not performed a legal analysis and makes no representation as to the accuracy of the status listed.)
- Active
Links
- 238000013459 approach Methods 0.000 title description 9
- 210000004027 cell Anatomy 0.000 claims description 87
- 238000000034 method Methods 0.000 claims description 37
- 210000003888 boundary cell Anatomy 0.000 claims description 24
- 238000012935 Averaging Methods 0.000 claims description 5
- 230000002547 anomalous effect Effects 0.000 claims description 2
- 230000001133 acceleration Effects 0.000 description 14
- 230000006399 behavior Effects 0.000 description 14
- 230000015654 memory Effects 0.000 description 14
- 230000033001 locomotion Effects 0.000 description 11
- 230000008447 perception Effects 0.000 description 8
- 238000012795 verification Methods 0.000 description 7
- 230000003542 behavioural effect Effects 0.000 description 5
- 238000010801 machine learning Methods 0.000 description 5
- 238000010586 diagram Methods 0.000 description 3
- 238000012545 processing Methods 0.000 description 3
- 230000002159 abnormal effect Effects 0.000 description 2
- 239000003795 chemical substances by application Substances 0.000 description 2
- 238000004891 communication Methods 0.000 description 2
- 239000000446 fuel Substances 0.000 description 2
- 230000006870 function Effects 0.000 description 2
- 230000011664 signaling Effects 0.000 description 2
- 239000013589 supplement Substances 0.000 description 2
- 230000003247 decreasing effect Effects 0.000 description 1
- 238000001514 detection method Methods 0.000 description 1
- 230000007774 longterm Effects 0.000 description 1
- 230000003287 optical effect Effects 0.000 description 1
- 230000000737 periodic effect Effects 0.000 description 1
- 239000007787 solid Substances 0.000 description 1
- 239000013598 vector Substances 0.000 description 1
Images


Classifications
-
- B—PERFORMING OPERATIONS; TRANSPORTING
- B60—VEHICLES IN GENERAL
- B60W—CONJOINT CONTROL OF VEHICLE SUB-UNITS OF DIFFERENT TYPE OR DIFFERENT FUNCTION; CONTROL SYSTEMS SPECIALLY ADAPTED FOR HYBRID VEHICLES; ROAD VEHICLE DRIVE CONTROL SYSTEMS FOR PURPOSES NOT RELATED TO THE CONTROL OF A PARTICULAR SUB-UNIT
- B60W30/00—Purposes of road vehicle drive control systems not related to the control of a particular sub-unit, e.g. of systems using conjoint control of vehicle sub-units, or advanced driver assistance systems for ensuring comfort, stability and safety or drive control systems for propelling or retarding the vehicle
- B60W30/08—Active safety systems predicting or avoiding probable or impending collision or attempting to minimise its consequences
- B60W30/095—Predicting travel path or likelihood of collision
- B60W30/0953—Predicting travel path or likelihood of collision the prediction being responsive to vehicle dynamic parameters
-
- G—PHYSICS
- G05—CONTROLLING; REGULATING
- G05D—SYSTEMS FOR CONTROLLING OR REGULATING NON-ELECTRIC VARIABLES
- G05D1/00—Control of position, course or altitude of land, water, air, or space vehicles, e.g. automatic pilot
- G05D1/02—Control of position or course in two dimensions
- G05D1/021—Control of position or course in two dimensions specially adapted to land vehicles
- G05D1/0212—Control of position or course in two dimensions specially adapted to land vehicles with means for defining a desired trajectory
- G05D1/0214—Control of position or course in two dimensions specially adapted to land vehicles with means for defining a desired trajectory in accordance with safety or protection criteria, e.g. avoiding hazardous areas
-
- B—PERFORMING OPERATIONS; TRANSPORTING
- B60—VEHICLES IN GENERAL
- B60W—CONJOINT CONTROL OF VEHICLE SUB-UNITS OF DIFFERENT TYPE OR DIFFERENT FUNCTION; CONTROL SYSTEMS SPECIALLY ADAPTED FOR HYBRID VEHICLES; ROAD VEHICLE DRIVE CONTROL SYSTEMS FOR PURPOSES NOT RELATED TO THE CONTROL OF A PARTICULAR SUB-UNIT
- B60W30/00—Purposes of road vehicle drive control systems not related to the control of a particular sub-unit, e.g. of systems using conjoint control of vehicle sub-units, or advanced driver assistance systems for ensuring comfort, stability and safety or drive control systems for propelling or retarding the vehicle
- B60W30/08—Active safety systems predicting or avoiding probable or impending collision or attempting to minimise its consequences
- B60W30/095—Predicting travel path or likelihood of collision
- B60W30/0956—Predicting travel path or likelihood of collision the prediction being responsive to traffic or environmental parameters
-
- B—PERFORMING OPERATIONS; TRANSPORTING
- B60—VEHICLES IN GENERAL
- B60W—CONJOINT CONTROL OF VEHICLE SUB-UNITS OF DIFFERENT TYPE OR DIFFERENT FUNCTION; CONTROL SYSTEMS SPECIALLY ADAPTED FOR HYBRID VEHICLES; ROAD VEHICLE DRIVE CONTROL SYSTEMS FOR PURPOSES NOT RELATED TO THE CONTROL OF A PARTICULAR SUB-UNIT
- B60W50/00—Details of control systems for road vehicle drive control not related to the control of a particular sub-unit, e.g. process diagnostic or vehicle driver interfaces
- B60W50/0097—Predicting future conditions
-
- B—PERFORMING OPERATIONS; TRANSPORTING
- B60—VEHICLES IN GENERAL
- B60W—CONJOINT CONTROL OF VEHICLE SUB-UNITS OF DIFFERENT TYPE OR DIFFERENT FUNCTION; CONTROL SYSTEMS SPECIALLY ADAPTED FOR HYBRID VEHICLES; ROAD VEHICLE DRIVE CONTROL SYSTEMS FOR PURPOSES NOT RELATED TO THE CONTROL OF A PARTICULAR SUB-UNIT
- B60W60/00—Drive control systems specially adapted for autonomous road vehicles
- B60W60/001—Planning or execution of driving tasks
- B60W60/0015—Planning or execution of driving tasks specially adapted for safety
-
- B—PERFORMING OPERATIONS; TRANSPORTING
- B60—VEHICLES IN GENERAL
- B60W—CONJOINT CONTROL OF VEHICLE SUB-UNITS OF DIFFERENT TYPE OR DIFFERENT FUNCTION; CONTROL SYSTEMS SPECIALLY ADAPTED FOR HYBRID VEHICLES; ROAD VEHICLE DRIVE CONTROL SYSTEMS FOR PURPOSES NOT RELATED TO THE CONTROL OF A PARTICULAR SUB-UNIT
- B60W60/00—Drive control systems specially adapted for autonomous road vehicles
- B60W60/001—Planning or execution of driving tasks
- B60W60/0027—Planning or execution of driving tasks using trajectory prediction for other traffic participants
-
- G—PHYSICS
- G05—CONTROLLING; REGULATING
- G05D—SYSTEMS FOR CONTROLLING OR REGULATING NON-ELECTRIC VARIABLES
- G05D1/00—Control of position, course or altitude of land, water, air, or space vehicles, e.g. automatic pilot
- G05D1/0088—Control of position, course or altitude of land, water, air, or space vehicles, e.g. automatic pilot characterized by the autonomous decision making process, e.g. artificial intelligence, predefined behaviours
-
- G—PHYSICS
- G05—CONTROLLING; REGULATING
- G05D—SYSTEMS FOR CONTROLLING OR REGULATING NON-ELECTRIC VARIABLES
- G05D1/00—Control of position, course or altitude of land, water, air, or space vehicles, e.g. automatic pilot
- G05D1/02—Control of position or course in two dimensions
- G05D1/021—Control of position or course in two dimensions specially adapted to land vehicles
- G05D1/0212—Control of position or course in two dimensions specially adapted to land vehicles with means for defining a desired trajectory
- G05D1/0221—Control of position or course in two dimensions specially adapted to land vehicles with means for defining a desired trajectory involving a learning process
-
- B—PERFORMING OPERATIONS; TRANSPORTING
- B60—VEHICLES IN GENERAL
- B60W—CONJOINT CONTROL OF VEHICLE SUB-UNITS OF DIFFERENT TYPE OR DIFFERENT FUNCTION; CONTROL SYSTEMS SPECIALLY ADAPTED FOR HYBRID VEHICLES; ROAD VEHICLE DRIVE CONTROL SYSTEMS FOR PURPOSES NOT RELATED TO THE CONTROL OF A PARTICULAR SUB-UNIT
- B60W2554/00—Input parameters relating to objects
- B60W2554/40—Dynamic objects, e.g. animals, windblown objects
- B60W2554/402—Type
-
- B—PERFORMING OPERATIONS; TRANSPORTING
- B60—VEHICLES IN GENERAL
- B60W—CONJOINT CONTROL OF VEHICLE SUB-UNITS OF DIFFERENT TYPE OR DIFFERENT FUNCTION; CONTROL SYSTEMS SPECIALLY ADAPTED FOR HYBRID VEHICLES; ROAD VEHICLE DRIVE CONTROL SYSTEMS FOR PURPOSES NOT RELATED TO THE CONTROL OF A PARTICULAR SUB-UNIT
- B60W2554/00—Input parameters relating to objects
- B60W2554/40—Dynamic objects, e.g. animals, windblown objects
- B60W2554/404—Characteristics
- B60W2554/4042—Longitudinal speed
-
- B—PERFORMING OPERATIONS; TRANSPORTING
- B60—VEHICLES IN GENERAL
- B60W—CONJOINT CONTROL OF VEHICLE SUB-UNITS OF DIFFERENT TYPE OR DIFFERENT FUNCTION; CONTROL SYSTEMS SPECIALLY ADAPTED FOR HYBRID VEHICLES; ROAD VEHICLE DRIVE CONTROL SYSTEMS FOR PURPOSES NOT RELATED TO THE CONTROL OF A PARTICULAR SUB-UNIT
- B60W2554/00—Input parameters relating to objects
- B60W2554/40—Dynamic objects, e.g. animals, windblown objects
- B60W2554/404—Characteristics
- B60W2554/4043—Lateral speed
-
- G—PHYSICS
- G05—CONTROLLING; REGULATING
- G05D—SYSTEMS FOR CONTROLLING OR REGULATING NON-ELECTRIC VARIABLES
- G05D1/00—Control of position, course or altitude of land, water, air, or space vehicles, e.g. automatic pilot
- G05D1/02—Control of position or course in two dimensions
- G05D1/021—Control of position or course in two dimensions specially adapted to land vehicles
- G05D1/0212—Control of position or course in two dimensions specially adapted to land vehicles with means for defining a desired trajectory
- G05D1/0223—Control of position or course in two dimensions specially adapted to land vehicles with means for defining a desired trajectory involving speed control of the vehicle
Abstract
Aspects of the present disclosure provide for controlling a vehicle (100) in an autonomous driving mode. For example, sensor data and a plurality of predicted trajectories (510, 512) of an object may be received. Each predicted trajectory may represent multiple possible future positions of the object. A grid may be generated (610) comprising a plurality of cells, each cell associated with a geographic area. A probability that an object will enter a geographic area associated with each of the plurality of units within a future period of time may be determined based on the sensor data in order to generate a heat map (710). One or more of the plurality of predicted trajectories may be compared to a heat map. The vehicle may be controlled in an autonomous driving mode based on the comparison.
Description
Cross Reference to Related Applications
This application claims priority to U.S. application No. 16/185,787 filed on 2018, 11/9, the disclosure of which is incorporated herein by reference.
Technical Field
The present disclosure relates generally to verifying predicted trajectories using a mesh-based approach.
Background
Autonomous vehicles, such as vehicles that do not require a human driver, may be used to assist in transporting passengers or items from one place to another. Such vehicles may operate in a fully autonomous mode in which the passenger may provide some initial input, such as an boarding location or a destination location, to which the vehicle will move on its own.
To determine how to maneuver an unmanned vehicle in an environment with other independent participants (e.g., vehicles, bicycles, and pedestrians), it is critical for the computing device of the unmanned vehicle to detect such participants and predict future movements of those participants. Typical prediction systems may use behavioral prediction models that evaluate the likelihood that an object will follow a given trajectory. In making such predictions, some trajectory models may even take into account the relative positions and motions of other participants.
Disclosure of Invention
One aspect of the present disclosure provides a method of controlling a vehicle in an autonomous driving mode. The method includes receiving, by one or more processors, sensor data for an object; receiving, by one or more processors, a plurality of predicted trajectories, each predicted trajectory representing a plurality of possible future locations of an object; generating, by one or more processors, a grid comprising a plurality of cells, each cell representing a geographic area; predicting, by the one or more processors, a probability that the object will enter the geographic area of each of the plurality of cells within a future period of time based on the sensor data to generate a heat map; comparing, by the one or more processors, one or more of the plurality of predicted trajectories to a heat map; and controlling, by one or more processors, the vehicle in an autonomous driving mode based on the comparison.
In one example, each predicted trajectory of the plurality of predicted trajectories is associated with a probability value, and the method further comprises: prior to the comparing, one or more of the plurality of predicted trajectories are identified based on probability values associated with the plurality of predicted trajectories and a threshold. In this example, the threshold is a threshold minimum probability value. In another example, the method further comprises generating a plurality of predicted trajectories based on the sensor data. In another example, the object is a vehicle. In another example, the method further comprises determining whether to generate a mesh based on the type of object. In another example, the method further comprises determining whether to generate a mesh based on an observed velocity of the object. In another example, the comparing includes evaluating the validity of one or more of the plurality of predicted trajectories. In this example, the vehicle is further controlled based on one or more of the plurality of predicted trajectories when the one or more of the plurality of predicted trajectories is assessed as valid. Alternatively, when one or more of the plurality of predicted trajectories is evaluated as invalid, the vehicle is not controlled based on the one or more of the plurality of predicted trajectories. In another example, the method further includes, based on the comparison, generating a new predicted trajectory based on the heat map, and controlling is further based on the new predicted trajectory. In this example, generating the new predicted trajectory includes examining the boundary cells of the heat map and averaging the cell locations of the boundary cells based on probabilities associated with the boundary cells. Further, generating a new predicted trajectory further includes generating a constant curvature trajectory using the average and the location of the object. Additionally or alternatively, generating the new predicted trajectory includes averaging unit locations weighted by the probabilities of all units of the heat map. In this example, generating the new predicted trajectory further includes generating a constant curvature trajectory using the average and the position of the object. In another example, the method further includes identifying a first set of cells in the heat map that satisfy a Threshold minimum probability value Threshold, and wherein the comparing is further based on the identified first set of cells. In this example, the comparing further includes, for each given predicted trajectory in one or more of the plurality of predicted trajectories, analyzing points of the given predicted trajectory to identify a second set of units in the heat map that are closest to each point, and comparing the first set of identified units to the second set of identified units. Alternatively, the comparing further comprises, for each given predicted trajectory in one or more of the plurality of predicted trajectories, searching points of the given predicted trajectory to identify boundary cells traversed by the given predicted trajectory, and comparing the boundary cells to the first set of cells. In another example, the comparing further includes determining whether one or more of the plurality of tracks overlap with one or more cells in the heat map having a probability that satisfies a minimum threshold probability value. In this example, the method further includes, when none of the one or more of the plurality of tracks overlap, flagging the plurality of tracks as anomalous.
Drawings
FIG. 1 is a functional block diagram of an exemplary vehicle according to aspects of the present disclosure.
FIG. 2 is an exemplary representation of map information in accordance with aspects of the present disclosure.
Fig. 3 is an exemplary exterior view of a vehicle according to aspects of the present disclosure.
FIG. 4 is an exemplary top view of a vehicle and its environment in accordance with aspects of the present disclosure.
FIG. 5 is an example of multiple trajectories for road users according to aspects of the present disclosure.
Fig. 6A and 6B are exemplary projections of a grid in accordance with aspects of the present disclosure.
Fig. 7 is an exemplary heatmap in accordance with aspects of the present disclosure.
Fig. 8A and 8B are example data comparisons in accordance with aspects of the present disclosure.
FIG. 9 is an exemplary trajectory in accordance with aspects of the present disclosure.
FIG. 10 is an exemplary vehicle path according to aspects of the present disclosure.
Fig. 11 is a flow chart in accordance with aspects of the present disclosure.
Detailed Description
SUMMARY
The present technique relates to using a mesh-based approach to evaluate the effectiveness of predicted trajectories for other road users. To determine how to maneuver an unmanned vehicle in an environment with other independent participants, such as vehicles, bicycles, and pedestrians, it is important for the computing device of the unmanned vehicle to detect such participants and predict future movements of those participants. Typical prediction systems may use behavioral models based on learned trajectory recommendations to assess the likelihood that an object, such as another road user, will follow a given trajectory, for example, based on previously observed motion. In making such predictions, some trajectory models may even take into account the relative positions and motions of other participants.
For example, for each road user, multiple trajectories may be generated using one or more behavioral models. These models may be quite simple, or may be highly complex machine learning models. In the case of a machine learning model, each of these trajectories may be associated with a probability of how likely the road user will follow the trajectory. In many cases, such trajectory modeling may be a practical and useful approach. However, in some cases, the behavior of an agent may be difficult to predict. This is especially the case where other road users that do not follow the "road rules" are acting unpredictably, or in a previously unobserved or unmodeled manner, in a reckless manner, and/or are merely moving very slowly.
While these "bad" trajectories or imperfect predictions may be identified after facts or "offline," doing so is ineffective to solve these problems in real time. To address these obstacles, grid-based predictions of likely future positions of road users over short periods of time in the future may be used.
For example, for each road user detected by the vehicle sensing system, a grid may be projected around the road user. The size of the grid may correspond to the outward boundary how far a road user will be able to move within a short period of time. Using observations about road users, a value may be determined for each cell that indicates the likelihood of a road user entering the cell within a short period of time.
Thus, each grid cell may represent the probability that a road user will enter the cell within a short period of time. This may provide a heat map of the predicted location of the road users. The heat map may then be used to evaluate the effectiveness of the predicted trajectory. For example, one or more predicted trajectories may then be compared to cells of the heat map to determine whether one or more of the trajectories overlap with a high probability cell. If not, the identified trajectory may not fully capture what the road user will do in the future. To address this issue, the vehicle's computing device may use the heatmap to generate additional traces to capture how the road user may do, which may be ignored by the identified traces.
The features described herein allow for real-time verification of predicted trajectories. Since the time scale of the mesh-based approach is small, it is more likely to accurately predict the behavior of road users in a very short period of time. In other words, the heat map may leverage more dynamic characteristics of the agent (e.g., curvature, velocity, acceleration, etc.) to achieve high accuracy. Thus, it can be used to verify predictions based on longer-term trajectories. Additionally, because the heatmap covers all locations around the road user, the heatmap may have the ability to capture and predict any movement of the road user, even including those movements that are not modeled, encountered, or even illegal. At the same time, the identified trajectory may not cover all possible locations that a road user may go to, and thus may not always be reliable. In this way, the heatmap may then be used to verify or inspect the identified traces, and possibly supplement them with additional traces as described above.
Exemplary System
As shown in fig. 1, a vehicle 100 according to an aspect of the present disclosure includes various components. Although certain aspects of the present disclosure are particularly useful for certain types of vehicles, the vehicle may be any type of vehicle, including but not limited to a car, truck, motorcycle, bus, recreational vehicle, and the like. The vehicle may have one or more computing devices, such as computing device 110, containing one or more processors 120, memory 130, and other components typically found in general purpose computing devices.
The instructions 132 may be any set of instructions that are directly executable (e.g., machine code) or indirectly executable (e.g., script) by a processor. For example, the instructions may be stored as computing device code on a computing device readable medium. In this regard, the terms "instructions" and "programs" may be used interchangeably herein. The instructions may be stored in an object code format for direct processing by a processor, or in any other computing device language, including a collection of script or independent source code modules that are interpreted or pre-compiled as needed. The function, method and routine of the instructions will be described in more detail below.
Computing device 110 may be all of the components typically used in connection with computing devices, such as the processors and memory described above, as well as user input 150 (e.g., a mouse, keyboard, touch screen, and/or microphone), and various electronic displays (e.g., a monitor having a screen or any other electronic device that may be operated to display information). In this example, the vehicle includes an internal electronic display 152 and one or more speakers 154 to provide an informational or audiovisual experience. In this regard, the internal electronic display 152 may be located within the cabin of the vehicle 100 and may be used by the computing device 110 to provide information to passengers within the vehicle 100. The vehicle may also include one or more wireless network connections 156 to facilitate communication with devices remote from the vehicle and/or between various systems of the vehicle.
In one example, the computing device 110 may be an autonomous driving computing system incorporated into the vehicle 100. The autonomous driving computing system may be capable of communicating with various components and systems of the vehicle, such as wirelessly (via wireless network connection 156) and/or wired connections (e.g., a controller area network bus or other communication bus). For example, returning to fig. 1, in an autonomous driving mode where continuous or periodic input from a vehicle occupant is not required or is required, according to instructions 132 of memory 130, computing device 110 may communicate with various systems of vehicle 100, such as a deceleration system 160 (for controlling braking of the vehicle), an acceleration system 162 (for controlling acceleration of the vehicle), a steering system 164 (for controlling wheel orientation and vehicle direction), a signal system 166 (for controlling steering signals), a navigation system 168 (for navigating the vehicle to a certain location or around an object), a positioning system 170 (for determining vehicle location), a sensing system 172 (for detecting objects in the vehicle environment), and a power system 174 (e.g., a battery and/or a gasoline or diesel powered engine) to control motion, speed, etc. of vehicle 100. Also, although these systems are shown as being external to computing device 110, in practice, these systems may also be incorporated into computing device 110, again as an autonomous driving computing system for controlling vehicle 100.
The computing device 110 may control the direction and speed of the vehicle by controlling various components. For example, the computing device 110 may use data from the map information and navigation system 168 to navigate the vehicle to the destination location completely autonomously. The computing device 110 may use the positioning system 170 to determine the location of the vehicle and the sensing system 172 to detect and respond to objects as needed to safely reach the location. To do so, the computing device 110 may accelerate the vehicle (e.g., by increasing fuel or other energy provided to the engine by the acceleration system 162), decelerate (e.g., by decreasing fuel provided to the engine, changing gears, and/or applying braking by the deceleration system 160), change direction (e.g., rotating the front or rear wheels of the vehicle 100 by the steering system 164), and signal such a change (e.g., by turning on the steering signal of the signaling system 166). Thus, the acceleration system 162 and the deceleration system 160 may be part of a drivetrain (drivetrain) that includes various components between the engine of the vehicle and the wheels of the vehicle. Again, by controlling these systems, the computing device 110 may also control the driveline of the vehicle in order to autonomously steer the vehicle.
As an example, the computing device 110 may interact with a deceleration system 160 and an acceleration system 162 to control the speed of the vehicle. Similarly, the steering system 164 may be used by the computing device 110 to control the direction of the vehicle 100. For example, if the vehicle 100 is configured for on-road use, such as a car or truck, the steering system may include components that control wheel angle to steer the vehicle. The signaling system 166 may be used by the computing device 110 to signal the vehicle's intent to other drivers or vehicles, such as by turning on turn signals or brake lights, when desired.
The computing device 110 may use the navigation system 168 to determine and follow a route to a location. In this regard, the navigation system 168 and/or the data 134 may store map information, such as a highly detailed map that the computing device 110 may use to navigate or control the vehicle. By way of example, the maps may identify the shape and elevation of roads, lane markers, intersections, crosswalks, speed limits, traffic lights, buildings, signs, real-time or historical traffic information, vegetation, or other such objects and information. The lane markings may include features such as double lane lines or single lane lines in solid or dashed lines, reflectors, and the like. A given lane may be associated with left and right lane lines or other lane markings defining lane boundaries. Thus, most lanes may be bounded by the left edge of one lane line and the right edge of another lane line. As described above, the map information may store known traffic or congestion information and/or traffic schedules (trains, buses, etc.) for a particular boarding location from similar times in the past. The information may even be updated in real-time by information received by the computing device 110.
Fig. 2 is an example of map information 200 for a section of road. In this example, the map information 200 describes a portion of map information that includes information identifying the shape, location, and other characteristics of lane markings or lane lines 210, 212, curbs 220, 222, 224, 226, lanes 230, 232, 234, 236, and intermediate regions 240, 242. In this example, the map information also indicates the direction of traffic for each lane as shown by arrows 250, 252, 254, 256, and the orientation of the map information as shown by arrow 260. In this regard, each of lanes 230 and 232 is a west lane and each of lanes 234 and 236 is an east lane. In this example, the map information 200 also identifies, for example, a commercial parking lot area 270. In addition to these features, the map information may also include information identifying the speed limit for each lane, as well as information allowing the computing device 110 to determine whether the vehicle has right of way to complete a particular maneuver (i.e., complete a turn or cross a lane or intersection), as well as other features such as buildings, waterways, vegetation, signs, and the like.
Although the detailed map information is described herein as an image-based map, the map information need not be entirely image-based (e.g., a raster map). For example, detailed map information may include one or more road maps or information map networks, such as roads, lanes, intersections, and connections between these features. Each feature may be stored as graphical data and may be associated with information such as geographical location and whether it is linked to other relevant features, e.g. a stop sign may be linked to roads and intersections etc. In some examples, the associated data may include a mesh-based road map index to allow efficient lookup of certain road map features.
The sensing system 172 also includes one or more components for detecting objects external to the vehicle, such as other vehicles (e.g., other cars, trucks, buses, motorcycles, etc.), pedestrians, bikers, obstacles in lanes, traffic signals, signs, trees, and the like. For example, the perception system 172 may include one or more LIDAR sensors, sonar devices, radar units, cameras, and/or any other detection devices that record data that may be processed by the computing device 110. The sensors of the sensing system may detect objects and their characteristics, such as location, orientation, size, shape, type (e.g., vehicle, pedestrian, cyclist, etc.), direction of travel, rate of change of direction of travel, speed, acceleration, rate of change of acceleration, deceleration, rate of change of deceleration, etc. When generated by the perception system 172, the raw data from the sensors and/or the above-described characteristics may be quantified or arranged into descriptive functions, vectors, and/or bounding boxes and periodically and continuously sent to the computing device 110 for further processing.
As discussed in further detail below, the computing device 110 may use the positioning system 170 to determine the location of the vehicle, use the perception system 172 to detect objects and respond to objects as needed to safely arrive at the location.
For example, fig. 3 is an exemplary external view of the vehicle 100. In this example, the roof housing 310 and dome housing 312 may include LIDAR sensors as well as various cameras and radar units. Additionally, a housing 320 located at the front end of the vehicle 100 and housings 330, 332 on the driver and passenger sides of the vehicle may each store a LIDAR sensor. For example, the housing 330 is located forward of the driver's door 350. The vehicle 100 further comprises housings 340, 342 for radar units and/or cameras, which are also located on the roof of the vehicle 100. Other radar units and cameras (not shown) may be located at the front and rear ends of the vehicle 100, and/or at other locations along the roof or roof housing 310. The vehicle 100 also includes many features of a typical passenger vehicle, such as doors 350, 352, wheels 360, 362, etc.
Exemplary method
In addition to the operations described above and illustrated in the figures, various operations will now be described. It should be understood that the following operations need not be performed in the exact order described below. Rather, various steps may be processed in a different order or concurrently, and steps may also be added or omitted.
As the vehicle 100 is being manipulated by the computing device 110, the sensing system 172 of the vehicle may receive sensor data from various sensors. These sensor data may be used to detect objects in the vehicle environment. Once an object is detected, the computing device 110 and/or perception system 172 may determine the type of the object, such as a traffic cone, a pedestrian, a vehicle (e.g., a passenger car, truck, bus, etc.), a bicycle, and so forth. The object may be identified by various models that may take into account various characteristics of the detected object, such as the size of the object, the speed of the object (the speed of travel of a bicycle typically will not exceed 40 miles per hour or be less than 0.1 miles per hour), the heat from the bicycle (a bicycle tends to cause the rider to dissipate heat from the bicycle), and so forth. Further, objects may be classified according to their particular attributes (e.g., information contained on the license plate, bumper sticker, or logo appearing on the vehicle).
Fig. 4 is a plan view of the vehicle 100 traveling in an environment corresponding to the area of the map information 200. In this example, lane lines 410, 412, curbs 420, 422, 424, 426, lanes 430, 432, 434, 436, intermediate regions 440, 442 and parking lots 470 correspond to the shape, location and other characteristics of lane markings or lane lines 210, 212, curbs 220, 222, 224, 226, lanes 230, 232, 234, 236, intermediate regions 240, 242 and parking lots 270, respectively. In this example, the traffic direction of each lane 430, 432, 434, 436 corresponds to the traffic direction indicated by arrows 250, 252, 254, 256. In this regard, each of the lanes 430 and 432 is a west lane, while each of the lanes 434 and 436 is an east lane. In the example of fig. 4, the vehicle travels eastward on the lane 436. Further, the perception system 172 and/or the computing device 110 may detect the vehicle 480 in the parking lot 470 and identify the vehicle 480 as another road user (here, a vehicle). The perception system 172 and/or the computing device 110 may also determine the aforementioned characteristics of the vehicle 480 based on the sensor information.
For each detected object, multiple trajectories may be generated using one or more behavioral models. Each trajectory may include a number of possible locations and corresponding times at which the object is expected to be located within a future period of time. For example, the period of time may be 10 seconds or more or less. In one example, the computing device 110 and/or perception system 172 may be operable to predict the trajectory of another road user based only on the other road user's instantaneous direction, acceleration/deceleration and speed, e.g., the current direction and motion of the object will continue. However, memory 130 may also store a behavior model that provides probabilities that a detected object takes one or more actions. These models may be quite simple, or may be highly complex machine learning models. In the case of a machine learning model, each of these trajectories may be associated with a probability of how likely the road user will follow the trajectory. In some examples, the sum of these probabilities may be 1 for a given road user. The number of generated trajectories may depend on the number of reasonable or feasible options available to the road user, such as the number of lanes, the number of steering options, etc.
In some cases, to increase the usefulness of these behavior models, each behavior model may be associated with a particular type of road user. For example, one type of behavior model may be used for objects identified as pedestrians, another type of behavior model may be used for objects identified as vehicles, and another type of behavior model may be used for objects identified as bicycles or bicyclists, and so on. The behavior model may be used by the computing device 110 to predict one or more trajectories of road users by analyzing data related to characteristics of objects (e.g., detected or estimated size, shape, location, orientation, direction of travel, speed, acceleration or deceleration, changes in acceleration or deceleration, etc.) and the current surroundings of the road user (e.g., the position of the road user relative to map information, the relative positions and behaviors of other road users, etc.) and determine how other road users will likely respond. In this regard, the behavioral model may work from an object-centric perspective of the road user's environment, as the system determines what other road users are perceiving in order to better predict how these road users will behave. In this regard, the behavior model may also indicate whether the predicted behavior of the road user is responsive to certain other road users, including the vehicle 100, at least in some instances.
FIG. 5 provides an example of a set of predicted trajectories for the vehicle 480 based on observed characteristics of the vehicle 480. In this example, the set of predicted trajectories includes trajectories 510, 512, 514. Each of these trajectories includes a number of possible locations and corresponding times at which the object is expected to be located within a period of time in the future. Additionally, as in the machine learning example, each of these trajectories may be associated with a probability that the vehicle 480 will follow the trajectory, and these probabilities may sum to 1. For example, the trajectory 510 may be associated with a probability of 0.3 (i.e., 30%) that the vehicle 480 will turn right into the lane 434, the trajectory 512 may be associated with a probability of 0.65 (i.e., 65%) that the vehicle 480 will turn right into the lane 436, and the trajectory 514 may be associated with a probability of 0.05 (i.e., 5%) that the vehicle 480 will back further into the parking lot 470.
For each object identified as a road user detected by the perception system 172, the computing device 110 may project a mesh around the object. The grid may include a plurality of cells, each cell representing a geographic area around a road user. The grid may be arranged so that any or a given point on the road user is located at the centre of the grid. The size of the grid may correspond to the outward boundary of how far a road user can move within a short period of time. The short period of time may be substantially shorter than the period of time used to predict the trajectory. For example, if the short period of time is 2 seconds or less (e.g., 1.5 seconds), the grid may be 27 meters by 27 meters, while the cells are 0.5 meters. Of course, to balance computational resources (time and effort) against prediction accuracy, the size may be selected to be larger or smaller.
Fig. 6A is an exemplary projection of a grid 610 for a vehicle 480. Fig. 6B is an exemplary detailed view of grid 610. It can be seen that grid 610 is a 12 x 12 grid of 144 cells in this example. Of course, as noted above, larger or smaller grids and/or cells may also be used. FIG. 6B also provides column coordinates A-L and row coordinates 1-12. These coordinates (e.g., a1, B2, etc.) will be used to indicate the different cells of the grid.
Using the observed speed, direction of travel or movement, rate of change of curvature or direction of travel, orientation, acceleration or deceleration, change in acceleration or deceleration, etc., of the road user, the computing device 110 may determine the value of each unit. These values may indicate the likelihood of a road user entering the geographic area of the unit in a short period of time. For example, a vehicle may be more likely to move forward and enter a grid cell that is front left or front right than a grid cell that is behind the vehicle (a grid cell that enters behind would require the vehicle to reverse or change direction by 180 degrees). Thus, each grid cell may represent the probability that a vehicle will enter the cell at a certain point in time within a short period of time (or that a certain portion of the road users will occupy the cell and/or any portion of the cell).
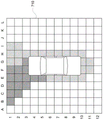
The top view of the grid provides a heat map in which some areas with a higher likelihood that road users will cross the grid cells are darkest in color, while areas that road users are unlikely to cross are lightest in color. Thus, the strength of each cell depends on the prediction for that cell. In this regard, fig. 7 represents a heat map 710 for grid 610. Likewise, darker shaded cells, such as cells B1, C1, C2, etc., represent the highest probabilities, while white cells, such as cells a1, a2, represent the lowest probabilities, and cells with intervening shading, such as cells H1, I2, etc., represent intermediate probabilities or probabilities between the highest and lowest probability cells. Of course, the scale could be reversed so that the lightest cells of the heat map are the cells with the greatest probability, and the darkest cells are the cells with the lowest probability, and so on.
The heat map may then be used to evaluate the effectiveness of the predicted trajectory for the road user. For example, each predicted trajectory having a threshold minimum probability value T may be identified by the computing device 110. By way of example, assuming that the sum of the probabilities of the trajectories is 1 as described above, T may be some value greater than 0.1 (or greater or less). For example, referring to FIG. 5, from a set of predicted trajectories including trajectories 510, 512, 514, trajectories 510 and 512 may be identified as trajectories having a probability exceeding a threshold minimum probability value T.
The computing device 110 may compare the identified tracks to the units of the heat map to determine whether one or more of the tracks overlap with a high probability unit. This may involve traversing all cells in the grid to identify those cells having the threshold minimum probability value K. By way of example, K may be some value greater than 0.1 (or greater or less) and may be the same or different than T. K may be a learned or manually adjusted value. Those units having a probability greater than K may be included in the list. For example, the darkest shaded cells, such as cells B1, C1, D1, E1, F1, C2, D2, E2, F2, D3, E3, F3, G3, E4, and E5, may each have a probability greater than a threshold minimum probability value K. In this regard, each of the aforementioned units may be included in a list.
Alternatively, rather than traversing all of the cells of the grid, the computing device 110 may analyze only the edges or boundary cells of the grid to identify those boundary cells having a probability of satisfying the threshold minimum probability value K. For example, the boundary cells may include all cells in rows 1 and 12 and all cells in columns A and L. In this example, the darkest shaded border cells, e.g., cells B1, C1, D1, E1, and F1, may each have a probability greater than a threshold minimum probability value K. In this regard, each of the aforementioned elements may be included in a list.
Each of the identified trajectories may be overlaid onto the grid and/or analyzed point-by-point by computing device 110 to identify the cells in the grid that are closest to each point on the identified trajectory. These identified units may then be compared to a list. If each identified cell is contained in the list, or more than a threshold minimum number of cells, the identified trajectory overlaps with a high probability cell and can be verified. If less than the threshold number of cells overlap with the highest probability cell, the identified trajectory is validated. For comparison, fig. 8A provides an exemplary view of a heat map 710 projected on the identified traces 510, 512. Fig. 8B provides a detailed view of the projection. As can be seen in FIG. 8B, the trajectory 510 passes through cells G3, H2, H1, and I1. Only cell G3 is included in the list of all cells having a probability that satisfies the threshold minimum probability value K. Thus, trace 510 will not pass verification. The trajectory 512 passes through cells G3, H3, H2, I2, J2, K3, and L3. Only cell G3 is included in the list of all cells having a probability of satisfying the threshold minimum probability value K. Thus, trace 512 will not pass verification.
Alternatively, instead of comparing all points in the identified trajectory, the points in the identified trajectory are searched to identify points that overlap with the boundary cell. If the boundary cell is included in the list, the predicted trajectory overlaps with the high probability boundary cell, and the predicted trajectory may be verified. As can be seen from fig. 8B, the trajectory 510 passes through the boundary cells H1 and I1, and the boundary cells H1 and I1 are not included in the list of boundary cells having a probability of satisfying the threshold minimum probability value K. Thus, trace 510 will not pass verification. The trajectory 512 passes through the boundary cell L3, which is not included in the list of boundary cells having a probability of satisfying the threshold minimum probability value K, L3. Thus, trace 512 does not pass verification.
If at least one of the identified tracks is verified (e.g., more than a threshold number of points are included on the identified track that are closest to the cells included in the list, and/or boundary cells of the identified track are included in the list), then all of the identified tracks may be verified by the computing device 110. In this regard, the computing device 110 may only need to traverse the identified trajectory until a validated trajectory is found. In some cases, individual trajectories that fail verification may be flagged as abnormal in order to allow a human operator to further analyze such trajectories and/or trajectory generation software of the computing device 110.
However, if none of the identified tracks are verified (i.e., there is no identified track having more than a threshold number of points closest to the cells included in the list and/or boundary cells of the identified track are not included in the list), then the identified track may not be verified and/or flagged as abnormal by the computing device 110. In this case, the identified trajectory may not fully capture the future behavior of the road user.
For this case, the computing device 110 may use the heat map to generate new predicted trajectories to capture what the road user may do, which may be missed by the identified trajectories. As one approach, the trajectory may be fitted to the cells by examining the boundary cells of the heat map and averaging the cell locations of the boundary cells with the highest probability. From the average cell position, as well as the position of the road user in the center of the grid and the current direction of travel of the road user, a new trajectory may be determined. For example, a new trajectory may be determined from the average cell position of the boundary cells, the position of the road user located in the center of the grid, and the current direction of travel of the road user. As an example, using this information, the computing device 110 may calculate a constant curvature of the average cell position from the road user's position and the current direction of travel to reach the boundary cell. This constant curvature can be used to determine a new trajectory.
As another approach, an average of cell locations weighted by the probability of all cells of the heat map or grid may be employed. From this average cell position of all cells, the position of the road user in the center of the grid and the current direction of travel of the road user, a new trajectory can be determined. As an example, using this information, the computing device 110 may calculate a constant curvature from the road user's position and the current direction of travel to the average cell position of all cells. This constant curvature can be used to determine a new trajectory.
Fig. 9 provides an example of a new track 910 generated based on heat map 710. For example, the trajectory 910 may be a constant curvature trajectory as determined in any of the examples described above. In this example, rather than following the "road rules" to turn right into either lane 434 or 436 and travel east, the vehicle 480 may enter the lane 436 on a left turn while traveling west into the oncoming traffic.
The new trajectory generated, and in some cases the identified trajectory, may then be used to determine how to control the vehicle to avoid the object in the autonomous driving mode. For example, the new trajectory and the identified trajectory may be used to generate physical constraints for the vehicle, or to generate locations and times that the vehicle should not traverse. In this regard, the computing device 110 may attempt to circumvent these physical constraints when planning future paths or trajectories for the vehicle. Thus, even when a road user acts in a manner that a trajectory that has not been recognized is captured, it can still be captured by a constant curvature trajectory. Fig. 10 is an example of a path 1010 that the computing device 110 may determine to enter the lane 434. Doing so may allow the vehicle 100 to avoid colliding with or coming too close to the vehicle 480 based on the constant curvature trajectory 910 and the identified trajectories 510, 512. Thus, the computing device 110 may control the vehicle to follow the path in the autonomous driving mode as described above, and the computing device 110 may be able to avoid a collision or simply be too close to the road user.
Such a check of the predicted trajectory may be performed for all road users or only for specific types of road users with or without specific characteristics. For example, only predicted trajectories of other vehicles and/or vehicles moving at certain predetermined speeds may be verified. For example, it may be particularly useful to verify the trajectories of other vehicles moving at speeds of 10 miles per hour or less, as these vehicles may tend to be more difficult to predict; furthermore, grid-based methods are particularly useful for short-term prediction. In other words, for faster moving road users, such as vehicles on a highway, the grid-based approach is less useful because the vehicles may quickly exceed the heat map area.
Fig. 11 is a flow diagram 1100 that may be executed by one or more processors, such as one or more processors 120 of computing device 110, to control a vehicle in an autonomous driving mode. In this example, at block 1110, sensor data of an object is received. At block 1120, a plurality of predicted trajectories is received. Each predicted trajectory represents a plurality of possible future positions of the object. At block 1130, a grid is generated that includes a plurality of cells. Each cell of the plurality of cells represents a geographic area. At block 1140, a probability that an object will enter the geographic area of each of the plurality of cells within a future period of time is predicted based on the sensor data to generate a heat map. At block 1150, one or more of the plurality of predicted trajectories are compared to a heat map. At block 1160, the vehicle is controlled in an autonomous driving mode based on the comparison. As noted above, the features of the flow diagrams described herein may be performed in various orders, unless otherwise specified. For example, block 1130 may occur concurrently with block 1120 or prior to block 1120.
The features described herein allow for real-time verification of predicted trajectories. Since the time range of the mesh-based method is small, it is highly likely that the behavior of the road user within a very short period of time is accurately predicted. In other words, the heat map may take advantage of more dynamic characteristics of the road user (e.g., curvature, speed, acceleration, etc.) to achieve high accuracy. In this way, it can be used to verify long-term trajectory-based predictions. In addition, because the heatmap covers all locations around the road user, the heatmap may have the ability to capture and predict any movement of the road user, even including those that are not modeled, encountered, or even illegal. At the same time, the identified trajectory may not cover all possible locations that a road user may go to, and thus may not always be reliable. Thus, the heatmap may be used to verify or inspect the identified traces and possibly supplement them with additional traces as described above.
Unless otherwise specified, the foregoing alternative examples are not mutually exclusive and may be implemented in various combinations to achieve unique advantages. As these and other variations and combinations of the features discussed above can be utilized without departing from the subject matter defined by the claims, the foregoing description of the embodiments should be taken by way of illustration rather than by way of limitation of the subject matter defined by the claims. Additionally, the provision of examples described herein, as well as words expressed using the phrases "such as," "including," and the like, should not be construed to limit claimed subject matter to particular examples; rather, these examples are intended to illustrate only one of many possible embodiments. Further, the same reference numbers in different drawings may identify the same or similar elements.
Claims (20)
1. A method of controlling a vehicle in an autonomous driving mode, the method comprising:
receiving, by one or more processors, sensor data of an object in a vehicle environment;
receiving, by one or more processors, a plurality of predicted trajectories, each predicted trajectory representing a plurality of possible future locations of the object;
generating, by one or more processors, a grid comprising a plurality of cells, each cell representing a geographic area;
predicting, by one or more processors, a probability that the object will enter a geographic area of each of the plurality of cells within a future period of time based on sensor data to generate a heat map;
comparing, by the one or more processors, one or more of the plurality of predicted trajectories to a heat map; and
controlling, by the one or more processors, the vehicle in an autonomous driving mode based on the comparison.
2. The method of claim 1, wherein each predicted trajectory of the plurality of predicted trajectories is associated with a probability value, and the method further comprises: prior to making the comparison, identifying the one or more of the plurality of predicted trajectories based on probability values associated with the plurality of predicted trajectories and a threshold.
3. The method of claim 2, wherein the threshold is a threshold minimum probability value.
4. The method of claim 1, further comprising: generating the plurality of predicted trajectories based on the sensor data.
5. The method of claim 1, wherein the object is a vehicle.
6. The method of claim 1, further comprising determining whether to generate a mesh based on a type of object.
7. The method of claim 1, further comprising determining whether to generate a mesh based on an observed velocity of the object.
8. The method of claim 1, wherein the comparing comprises evaluating the validity of the one or more of the plurality of predicted trajectories.
9. The method of claim 8, wherein when the one or more of the plurality of predicted trajectories is assessed to be valid, controlling the vehicle further based on the one or more of the plurality of predicted trajectories.
10. The method of claim 8, wherein the vehicle is not controlled based on the one or more of the plurality of predicted trajectories when the one or more of the plurality of predicted trajectories is assessed as invalid.
11. The method of claim 1, further comprising: based on the comparison, a new predicted trajectory is generated based on the heat map, and wherein the controlling is further based on the new predicted trajectory.
12. The method of claim 11, wherein generating a new predicted trajectory comprises examining border elements of the heat map and averaging border element locations weighted by a probability of the border element.
13. The method of claim 12, wherein generating a new predicted trajectory further comprises generating a constant curvature trajectory using the average and a position of an object.
14. The method of claim 11, wherein generating a new predicted trajectory comprises averaging unit locations weighted by probabilities of all units of the heat map.
15. The method of claim 14, wherein generating a new predicted trajectory further comprises generating a constant curvature trajectory using the average and a position of an object.
16. The method of claim 1, further comprising identifying a first set of units in the heat map that satisfy a threshold minimum probability value, and wherein the comparing is further based on the identified first set of units.
17. The method of claim 16, wherein the comparing further comprises, for each given predicted trajectory of the one or more of the plurality of predicted trajectories,
analyzing the points of a given predicted trajectory to identify a second set of cells in the heat map that are closest to each of the points; and
the identified first set of cells is compared to the identified second set of cells.
18. The method of claim 16, wherein the comparing further comprises, for each given predicted trajectory of the one or more of the plurality of predicted trajectories:
searching for points of the given predicted trajectory to identify boundary cells that the given predicted trajectory crosses; and
the boundary cells are compared to a first set of cells.
19. The method of claim 1, wherein the comparing further comprises determining whether the one or more of the plurality of tracks overlap with one or more cells in a heat map having a probability of satisfying a threshold minimum probability value.
20. The method of claim 19, wherein the plurality of traces are flagged as anomalous when none of the one or more of the plurality of traces overlap.
Applications Claiming Priority (3)
| Application Number | Priority Date | Filing Date | Title |
|---|---|---|---|
| US16/185,787 | 2018-11-09 | ||
| US16/185,787 US10969789B2 (en) | 2018-11-09 | 2018-11-09 | Verifying predicted trajectories using a grid-based approach |
| PCT/US2019/059795 WO2020097029A1 (en) | 2018-11-09 | 2019-11-05 | Verifying predicted trajectories using a grid-based approach |
Publications (2)
| Publication Number | Publication Date |
|---|---|
| CN113165652A CN113165652A (en) | 2021-07-23 |
| CN113165652B true CN113165652B (en) | 2022-07-05 |
Family
ID=70551433
Family Applications (1)
| Application Number | Title | Priority Date | Filing Date |
|---|---|---|---|
| CN201980080993.9A Active CN113165652B (en) | 2018-11-09 | 2019-11-05 | Verifying predicted trajectories using a mesh-based approach |
Country Status (4)
| Country | Link |
|---|---|
| US (2) | US10969789B2 (en) |
| EP (1) | EP3860894A4 (en) |
| CN (1) | CN113165652B (en) |
| WO (1) | WO2020097029A1 (en) |
Families Citing this family (19)
| Publication number | Priority date | Publication date | Assignee | Title |
|---|---|---|---|---|
| US11048927B2 (en) * | 2017-10-24 | 2021-06-29 | Waymo Llc | Pedestrian behavior predictions for autonomous vehicles |
| US10969789B2 (en) * | 2018-11-09 | 2021-04-06 | Waymo Llc | Verifying predicted trajectories using a grid-based approach |
| US11126197B2 (en) * | 2018-11-19 | 2021-09-21 | Waymo Llc | Verification of iterative closest point alignments for autonomous vehicles |
| US10814870B2 (en) * | 2018-12-04 | 2020-10-27 | GM Global Technology Operations LLC | Multi-headed recurrent neural network (RNN) for multi-class trajectory predictions |
| US11458965B2 (en) | 2019-08-13 | 2022-10-04 | Zoox, Inc. | Feasibility validation for vehicle trajectory selection |
| US11407409B2 (en) * | 2019-08-13 | 2022-08-09 | Zoox, Inc. | System and method for trajectory validation |
| US11914368B2 (en) | 2019-08-13 | 2024-02-27 | Zoox, Inc. | Modifying limits on vehicle dynamics for trajectories |
| US11397434B2 (en) | 2019-08-13 | 2022-07-26 | Zoox, Inc. | Consistency validation for vehicle trajectory selection |
| US11912271B2 (en) * | 2019-11-07 | 2024-02-27 | Motional Ad Llc | Trajectory prediction from precomputed or dynamically generated bank of trajectories |
| US11955000B2 (en) * | 2019-11-18 | 2024-04-09 | Google Llc | Methods, systems, and media for generating and evaluating street grids |
| US20210286924A1 (en) | 2020-03-11 | 2021-09-16 | Aurora Innovation, Inc. | Generating autonomous vehicle simulation data from logged data |
| WO2022072764A1 (en) * | 2020-10-01 | 2022-04-07 | Uatc, Llc | Metrics for evaluating autonomous vehicle performance |
| US11945469B2 (en) * | 2020-11-25 | 2024-04-02 | Zoox, Inc. | Object uncertainty models |
| CN112598767A (en) * | 2020-12-29 | 2021-04-02 | 厦门市美亚柏科信息股份有限公司 | Trajectory behavior analysis method based on space-time big data, terminal device and storage medium |
| US20220379910A1 (en) * | 2021-05-26 | 2022-12-01 | Nissan North America, Inc. | Real-time Map and Prediction Diagnostics |
| USD1002647S1 (en) * | 2021-10-13 | 2023-10-24 | Waymo Llc | Display screen or portion thereof with graphical user interface |
| USD1002648S1 (en) * | 2021-10-13 | 2023-10-24 | Waymo Llc | Display screen or portion thereof with graphical user interface |
| USD1002649S1 (en) * | 2021-10-13 | 2023-10-24 | Waymo Llc | Display screen or portion thereof with graphical user interface |
| CN114416710B (en) * | 2021-12-29 | 2023-04-07 | 苏州大学 | Method and system for extracting OD position of express way vehicle |
Citations (4)
| Publication number | Priority date | Publication date | Assignee | Title |
|---|---|---|---|---|
| JP2010033352A (en) * | 2008-07-29 | 2010-02-12 | Toyota Central R&D Labs Inc | Lane change alarm and program |
| EP2562060A1 (en) * | 2011-08-22 | 2013-02-27 | Honda Research Institute Europe GmbH | A method and system for predicting movement behavior of a target traffic object |
| CN104812645A (en) * | 2012-09-27 | 2015-07-29 | 谷歌公司 | Determining changes in a driving environment based on vehicle behavior |
| CN107168305A (en) * | 2017-04-01 | 2017-09-15 | 西安交通大学 | Unmanned vehicle method for planning track based on Bezier and VFH under the scene of crossing |
Family Cites Families (25)
| Publication number | Priority date | Publication date | Assignee | Title |
|---|---|---|---|---|
| DE19641261C1 (en) * | 1996-10-07 | 1998-02-12 | Siemens Ag | Distance sensor measuring quality evaluation method |
| JP5206752B2 (en) * | 2010-08-30 | 2013-06-12 | 株式会社デンソー | Driving environment recognition device |
| EP2615598B1 (en) | 2012-01-11 | 2017-12-06 | Honda Research Institute Europe GmbH | Vehicle with computing means for monitoring and predicting traffic participant objects |
| DE102013203239A1 (en) | 2013-02-27 | 2014-08-28 | Bayerische Motoren Werke Aktiengesellschaft | Grid-based prediction of the position of an object |
| US9216745B2 (en) | 2013-09-16 | 2015-12-22 | Disney Enterprises, Inc. | Shared control of semi-autonomous vehicles including collision avoidance in multi-agent scenarios |
| US9988047B2 (en) * | 2013-12-12 | 2018-06-05 | Magna Electronics Inc. | Vehicle control system with traffic driving control |
| US9248834B1 (en) * | 2014-10-02 | 2016-02-02 | Google Inc. | Predicting trajectories of objects based on contextual information |
| EP3048023B1 (en) * | 2015-01-23 | 2018-11-28 | Honda Research Institute Europe GmbH | Method for assisting a driver in driving an ego vehicle and corresponding driver assistance system |
| US10229363B2 (en) | 2015-10-19 | 2019-03-12 | Ford Global Technologies, Llc | Probabilistic inference using weighted-integrals-and-sums-by-hashing for object tracking |
| WO2017079341A2 (en) | 2015-11-04 | 2017-05-11 | Zoox, Inc. | Automated extraction of semantic information to enhance incremental mapping modifications for robotic vehicles |
| JP6940612B2 (en) * | 2016-09-14 | 2021-09-29 | ナウト, インコーポレイテッドNauto, Inc. | Near crash judgment system and method |
| KR101965296B1 (en) | 2016-11-30 | 2019-04-19 | 연세대학교 산학협력단 | Method and Apparatus for Estimating Location of a Moving Object and Generating Maps Sharing a Map between Particles |
| CN110914777B (en) | 2016-12-30 | 2023-05-26 | 辉达公司 | High definition map for autonomous vehicle and route storage management system |
| US20180217603A1 (en) | 2017-01-31 | 2018-08-02 | GM Global Technology Operations LLC | Efficient situational awareness from perception streams in autonomous driving systems |
| US10803683B2 (en) * | 2017-02-14 | 2020-10-13 | Kabushiki Kaisha Toshiba | Information processing device, information processing method, computer program product, and moving object |
| US20180349746A1 (en) * | 2017-05-31 | 2018-12-06 | Uber Technologies, Inc. | Top-View Lidar-Based Object Detection |
| US10809361B2 (en) * | 2017-05-31 | 2020-10-20 | Uatc, Llc | Hybrid-view LIDAR-based object detection |
| US20190113920A1 (en) * | 2017-10-18 | 2019-04-18 | Luminar Technologies, Inc. | Controlling an autonomous vehicle using model predictive control |
| US20190286145A1 (en) * | 2018-03-14 | 2019-09-19 | Omron Adept Technologies, Inc. | Method and Apparatus for Dynamic Obstacle Avoidance by Mobile Robots |
| US20190310651A1 (en) * | 2018-04-10 | 2019-10-10 | Uber Technologies, Inc. | Object Detection and Determination of Motion Information Using Curve-Fitting in Autonomous Vehicle Applications |
| US11409295B1 (en) * | 2018-08-31 | 2022-08-09 | Amazon Technologies, Inc. | Dynamic positioning of an autonomous mobile device with respect to a user trajectory |
| US20200097010A1 (en) * | 2018-09-21 | 2020-03-26 | Luminar Technologies, Inc. | Autonomous vehicle technology for facilitating safe stopping according to hybrid paths |
| US11169531B2 (en) * | 2018-10-04 | 2021-11-09 | Zoox, Inc. | Trajectory prediction on top-down scenes |
| US10969789B2 (en) * | 2018-11-09 | 2021-04-06 | Waymo Llc | Verifying predicted trajectories using a grid-based approach |
| US11482011B2 (en) * | 2019-03-28 | 2022-10-25 | Intel Corporation | Acceleration of data processing for object detection |
-
2018
- 2018-11-09 US US16/185,787 patent/US10969789B2/en active Active
-
2019
- 2019-11-05 EP EP19883127.3A patent/EP3860894A4/en active Pending
- 2019-11-05 WO PCT/US2019/059795 patent/WO2020097029A1/en unknown
- 2019-11-05 CN CN201980080993.9A patent/CN113165652B/en active Active
-
2021
- 2021-03-03 US US17/191,491 patent/US20210341927A1/en active Pending
Patent Citations (4)
| Publication number | Priority date | Publication date | Assignee | Title |
|---|---|---|---|---|
| JP2010033352A (en) * | 2008-07-29 | 2010-02-12 | Toyota Central R&D Labs Inc | Lane change alarm and program |
| EP2562060A1 (en) * | 2011-08-22 | 2013-02-27 | Honda Research Institute Europe GmbH | A method and system for predicting movement behavior of a target traffic object |
| CN104812645A (en) * | 2012-09-27 | 2015-07-29 | 谷歌公司 | Determining changes in a driving environment based on vehicle behavior |
| CN107168305A (en) * | 2017-04-01 | 2017-09-15 | 西安交通大学 | Unmanned vehicle method for planning track based on Bezier and VFH under the scene of crossing |
Also Published As
| Publication number | Publication date |
|---|---|
| US20210341927A1 (en) | 2021-11-04 |
| EP3860894A1 (en) | 2021-08-11 |
| WO2020097029A1 (en) | 2020-05-14 |
| CN113165652A (en) | 2021-07-23 |
| US20200150665A1 (en) | 2020-05-14 |
| US10969789B2 (en) | 2021-04-06 |
| EP3860894A4 (en) | 2022-07-06 |
Similar Documents
| Publication | Publication Date | Title |
|---|---|---|
| CN113165652B (en) | Verifying predicted trajectories using a mesh-based approach | |
| EP3678911B1 (en) | Pedestrian behavior predictions for autonomous vehicles | |
| US11734473B2 (en) | Perception error models | |
| US11625513B2 (en) | Safety analysis framework | |
| US11351995B2 (en) | Error modeling framework | |
| US11256260B2 (en) | Generating trajectories for autonomous vehicles | |
| US10824148B2 (en) | Operating an autonomous vehicle according to road user reaction modeling with occlusions | |
| US9495874B1 (en) | Automated system and method for modeling the behavior of vehicles and other agents | |
| US11242040B2 (en) | Emergency braking for autonomous vehicles | |
| CN112368662A (en) | Directional adjustment actions for autonomous vehicle operation management | |
| US20210139048A1 (en) | Tree policy planning for autonomous vehicle driving solutions | |
| US11628850B2 (en) | System for generating generalized simulation scenarios | |
| JP2021501396A (en) | Semantic object clustering for autonomous vehicle decision making | |
| CN116745195A (en) | Method and system for safe driving outside lane | |
| US20220119011A1 (en) | Collision evaluation using a hierarchy of grids | |
| US20220180170A1 (en) | Systems and methods for trajectory forecasting according to semantic category uncertainty | |
| EP4073782A1 (en) | Perception error models |
Legal Events
| Date | Code | Title | Description |
|---|---|---|---|
| PB01 | Publication | ||
| PB01 | Publication | ||
| SE01 | Entry into force of request for substantive examination | ||
| SE01 | Entry into force of request for substantive examination | ||
| GR01 | Patent grant | ||
| GR01 | Patent grant |