CN112970039A - Techniques for data-driven correlation of metrics - Google Patents
Techniques for data-driven correlation of metrics Download PDFInfo
- Publication number
- CN112970039A CN112970039A CN201980072248.XA CN201980072248A CN112970039A CN 112970039 A CN112970039 A CN 112970039A CN 201980072248 A CN201980072248 A CN 201980072248A CN 112970039 A CN112970039 A CN 112970039A
- Authority
- CN
- China
- Prior art keywords
- metric
- metrics
- user
- subset
- processors
- Prior art date
- Legal status (The legal status is an assumption and is not a legal conclusion. Google has not performed a legal analysis and makes no representation as to the accuracy of the status listed.)
- Pending
Links
- 238000000034 method Methods 0.000 title claims abstract description 74
- 230000015654 memory Effects 0.000 claims description 31
- 230000008859 change Effects 0.000 claims description 25
- 230000006399 behavior Effects 0.000 claims description 24
- 230000009471 action Effects 0.000 claims description 22
- 230000000007 visual effect Effects 0.000 claims description 10
- 238000004088 simulation Methods 0.000 claims description 8
- 238000004422 calculation algorithm Methods 0.000 abstract description 5
- 238000010801 machine learning Methods 0.000 abstract description 4
- 238000001514 detection method Methods 0.000 abstract description 3
- 208000018910 keratinopathic ichthyosis Diseases 0.000 abstract 5
- 238000003860 storage Methods 0.000 description 40
- 238000004458 analytical method Methods 0.000 description 37
- 238000012545 processing Methods 0.000 description 34
- 238000004891 communication Methods 0.000 description 27
- 230000000694 effects Effects 0.000 description 24
- 238000007726 management method Methods 0.000 description 11
- 230000008569 process Effects 0.000 description 11
- 230000006870 function Effects 0.000 description 7
- 230000007246 mechanism Effects 0.000 description 6
- 230000007423 decrease Effects 0.000 description 5
- 238000009826 distribution Methods 0.000 description 5
- 238000009434 installation Methods 0.000 description 5
- 238000012544 monitoring process Methods 0.000 description 5
- 238000012360 testing method Methods 0.000 description 5
- 238000012546 transfer Methods 0.000 description 5
- 239000000654 additive Substances 0.000 description 4
- 230000000996 additive effect Effects 0.000 description 4
- 230000002547 anomalous effect Effects 0.000 description 4
- 238000005516 engineering process Methods 0.000 description 4
- 238000004519 manufacturing process Methods 0.000 description 4
- 238000012986 modification Methods 0.000 description 4
- 230000004048 modification Effects 0.000 description 4
- 230000006855 networking Effects 0.000 description 4
- 230000008520 organization Effects 0.000 description 4
- 238000013068 supply chain management Methods 0.000 description 4
- 230000003936 working memory Effects 0.000 description 4
- 230000002159 abnormal effect Effects 0.000 description 3
- 230000008901 benefit Effects 0.000 description 3
- 230000001413 cellular effect Effects 0.000 description 3
- 238000010586 diagram Methods 0.000 description 3
- 230000003993 interaction Effects 0.000 description 3
- 230000004044 response Effects 0.000 description 3
- 239000007787 solid Substances 0.000 description 3
- 241000699666 Mus <mouse, genus> Species 0.000 description 2
- 230000001133 acceleration Effects 0.000 description 2
- 239000003086 colorant Substances 0.000 description 2
- 238000004590 computer program Methods 0.000 description 2
- 230000002596 correlated effect Effects 0.000 description 2
- 230000003247 decreasing effect Effects 0.000 description 2
- 238000013461 design Methods 0.000 description 2
- 230000001667 episodic effect Effects 0.000 description 2
- 238000001914 filtration Methods 0.000 description 2
- 230000033001 locomotion Effects 0.000 description 2
- 238000005259 measurement Methods 0.000 description 2
- 230000003287 optical effect Effects 0.000 description 2
- 230000002093 peripheral effect Effects 0.000 description 2
- 238000013439 planning Methods 0.000 description 2
- 238000012358 sourcing Methods 0.000 description 2
- 230000003068 static effect Effects 0.000 description 2
- 230000007306 turnover Effects 0.000 description 2
- 240000005020 Acaciella glauca Species 0.000 description 1
- 241000699670 Mus sp. Species 0.000 description 1
- 241000251737 Raja Species 0.000 description 1
- 241000700605 Viruses Species 0.000 description 1
- 238000007792 addition Methods 0.000 description 1
- 230000004075 alteration Effects 0.000 description 1
- 238000013459 approach Methods 0.000 description 1
- 238000003491 array Methods 0.000 description 1
- 238000013475 authorization Methods 0.000 description 1
- 230000005540 biological transmission Effects 0.000 description 1
- 238000002591 computed tomography Methods 0.000 description 1
- 238000010276 construction Methods 0.000 description 1
- 238000010924 continuous production Methods 0.000 description 1
- 238000007796 conventional method Methods 0.000 description 1
- 238000010219 correlation analysis Methods 0.000 description 1
- 230000000875 corresponding effect Effects 0.000 description 1
- 238000007405 data analysis Methods 0.000 description 1
- 238000013523 data management Methods 0.000 description 1
- 238000007418 data mining Methods 0.000 description 1
- 230000001934 delay Effects 0.000 description 1
- 238000012217 deletion Methods 0.000 description 1
- 230000037430 deletion Effects 0.000 description 1
- 238000011161 development Methods 0.000 description 1
- 238000002059 diagnostic imaging Methods 0.000 description 1
- 238000005553 drilling Methods 0.000 description 1
- 230000007613 environmental effect Effects 0.000 description 1
- 230000001073 episodic memory Effects 0.000 description 1
- 230000010354 integration Effects 0.000 description 1
- 239000004973 liquid crystal related substance Substances 0.000 description 1
- 230000007774 longterm Effects 0.000 description 1
- 238000002595 magnetic resonance imaging Methods 0.000 description 1
- 239000000203 mixture Substances 0.000 description 1
- 238000010295 mobile communication Methods 0.000 description 1
- 230000000737 periodic effect Effects 0.000 description 1
- 238000007637 random forest analysis Methods 0.000 description 1
- 235000003499 redwood Nutrition 0.000 description 1
- 238000012552 review Methods 0.000 description 1
- 238000000926 separation method Methods 0.000 description 1
- 230000006403 short-term memory Effects 0.000 description 1
- 230000002123 temporal effect Effects 0.000 description 1
- 238000003325 tomography Methods 0.000 description 1
- 230000009466 transformation Effects 0.000 description 1
- 238000000844 transformation Methods 0.000 description 1
- 238000002604 ultrasonography Methods 0.000 description 1
- 238000012795 verification Methods 0.000 description 1
- 230000003442 weekly effect Effects 0.000 description 1
Images


Classifications
-
- G—PHYSICS
- G06—COMPUTING; CALCULATING OR COUNTING
- G06Q—INFORMATION AND COMMUNICATION TECHNOLOGY [ICT] SPECIALLY ADAPTED FOR ADMINISTRATIVE, COMMERCIAL, FINANCIAL, MANAGERIAL OR SUPERVISORY PURPOSES; SYSTEMS OR METHODS SPECIALLY ADAPTED FOR ADMINISTRATIVE, COMMERCIAL, FINANCIAL, MANAGERIAL OR SUPERVISORY PURPOSES, NOT OTHERWISE PROVIDED FOR
- G06Q10/00—Administration; Management
- G06Q10/06—Resources, workflows, human or project management; Enterprise or organisation planning; Enterprise or organisation modelling
- G06Q10/063—Operations research, analysis or management
- G06Q10/0639—Performance analysis of employees; Performance analysis of enterprise or organisation operations
- G06Q10/06393—Score-carding, benchmarking or key performance indicator [KPI] analysis
-
- G—PHYSICS
- G06—COMPUTING; CALCULATING OR COUNTING
- G06Q—INFORMATION AND COMMUNICATION TECHNOLOGY [ICT] SPECIALLY ADAPTED FOR ADMINISTRATIVE, COMMERCIAL, FINANCIAL, MANAGERIAL OR SUPERVISORY PURPOSES; SYSTEMS OR METHODS SPECIALLY ADAPTED FOR ADMINISTRATIVE, COMMERCIAL, FINANCIAL, MANAGERIAL OR SUPERVISORY PURPOSES, NOT OTHERWISE PROVIDED FOR
- G06Q10/00—Administration; Management
- G06Q10/04—Forecasting or optimisation specially adapted for administrative or management purposes, e.g. linear programming or "cutting stock problem"
-
- G—PHYSICS
- G06—COMPUTING; CALCULATING OR COUNTING
- G06F—ELECTRIC DIGITAL DATA PROCESSING
- G06F3/00—Input arrangements for transferring data to be processed into a form capable of being handled by the computer; Output arrangements for transferring data from processing unit to output unit, e.g. interface arrangements
- G06F3/01—Input arrangements or combined input and output arrangements for interaction between user and computer
- G06F3/048—Interaction techniques based on graphical user interfaces [GUI]
- G06F3/0481—Interaction techniques based on graphical user interfaces [GUI] based on specific properties of the displayed interaction object or a metaphor-based environment, e.g. interaction with desktop elements like windows or icons, or assisted by a cursor's changing behaviour or appearance
- G06F3/0482—Interaction with lists of selectable items, e.g. menus
-
- G—PHYSICS
- G06—COMPUTING; CALCULATING OR COUNTING
- G06F—ELECTRIC DIGITAL DATA PROCESSING
- G06F9/00—Arrangements for program control, e.g. control units
- G06F9/06—Arrangements for program control, e.g. control units using stored programs, i.e. using an internal store of processing equipment to receive or retain programs
- G06F9/44—Arrangements for executing specific programs
- G06F9/451—Execution arrangements for user interfaces
-
- G—PHYSICS
- G06—COMPUTING; CALCULATING OR COUNTING
- G06T—IMAGE DATA PROCESSING OR GENERATION, IN GENERAL
- G06T11/00—2D [Two Dimensional] image generation
- G06T11/20—Drawing from basic elements, e.g. lines or circles
- G06T11/206—Drawing of charts or graphs
-
- G—PHYSICS
- G06—COMPUTING; CALCULATING OR COUNTING
- G06T—IMAGE DATA PROCESSING OR GENERATION, IN GENERAL
- G06T2200/00—Indexing scheme for image data processing or generation, in general
- G06T2200/24—Indexing scheme for image data processing or generation, in general involving graphical user interfaces [GUIs]
Abstract
Techniques are described herein for identifying highly relevant content for viewing by a user in the form of KPI cards and for providing relevant views to the user automatically or through suggestions. When a user accesses the user interface, the KPI with the highest practical and statistical significance is provided. In some embodiments, when a user is viewing KPIs, other related KPIs may be provided for the user to view as suggestions. Additionally, in some embodiments, meaningful KPIs may be provided to the user based on anomaly detection, and an explanation of the anomaly and suggestions for correcting any problems may be provided to the user. Highly informative content can be visualized using advanced machine learning algorithms described herein.
Description
Cross Reference to Related Applications
This application claims the benefit and priority OF provisional patent application No.62/855,218 entitled "techiniques FOR DATA-drive CORRELATION OF methods" filed on 31.5.2019 and provisional patent application No.62/737,518 entitled "techiniques FOR DATA-drive CORRELATION OF methods" filed on 27.9.2018, each OF which is incorporated herein by reference in its entirety FOR all purposes.
Background
Metrics, also referred to herein as key performance indicators ("KPIs"), may provide valuable information about the performance of a company's operations. Identifying which metrics are most valuable to a user's decision can be challenging. The relevant information of the user may change rapidly or may be stagnant. However, a user who regularly views only certain metrics may not be aware of changes that are important or contain valuable information, particularly if the user regularly views only stagnant metrics.
Disclosure of Invention
The techniques described herein provide practically and statistically useful information to a user by providing the user with metrics that are informative, relevant, and personalized for that particular user. A system of one or more computers may be configured to perform particular operations or actions by installing software, firmware, hardware, or a combination thereof on the system that, in operation, causes the system to perform the actions. One or more computer programs may be configured to perform particular operations or actions by including instructions that, when executed by a data processing apparatus, cause the apparatus to perform the actions. One general aspect includes a computer-implemented method for identifying and displaying high informational content to a user, the method comprising: for each metric indicator (metric indicator) of a plurality of metric indicators for an enterprise, a metric indicator model is generated having each attribute of a plurality of attributes of the metric indicator as an independent model variable. For each metric, at least one attribute of the plurality of attributes having a largest entropy change contribution is selected based on the model. A deck of metric indicators (deck) is generated based on selecting a subset of the plurality of metric indicators, wherein the subset of the plurality of metric indicators is selected based at least in part on the metric having the statistically significant largest variation. A graphical display of each subset of the plurality of metrics is generated, wherein each graphical display of the subset of metrics includes at least one attribute of the plurality of attributes. The graphical display is provided to the user's device for display to the user. Other embodiments of this aspect include corresponding computer systems, apparatus, and computer programs recorded on one or more computer storage devices, each configured to perform the actions of the methods.
Implementations may include one or more of the following features. Optionally, selecting the subset of the plurality of metrics comprises obtaining a previous time series model based forecast (forecast) of a current metric, determining a current value of the metric, and selecting the metric when the previous forecast (expected) is statistically significantly different from the current value. Optionally, the interpretation of the metric for which the entropy change of the subset of the plurality of metric measures is maximal is generated by: the current value of the metric index is applied to the model along with the values of other independent metrics or variables to generate the partial derivatives (rates of change) of each attribute (independent variable) in the model, and a subset of each attribute is selected based on an ordered list of the sizes of the statistically significant generated derivatives and how much it contributes to the change in the metric using techniques including, but not limited to, locally interpretable model interpretation and sharley additive interpretation. Optionally, the method may comprise: based on the recorded actions, the actions of the user are recorded within the user interface and user preference information for at least one metric, frequency of use, and metrics viewed before and after each metric is generated. Optionally, the deck of metrics includes at least one metric in the deck. Optionally, generating the graphical display of each subset of metric metrics includes creating a metric card that includes at least one visual depiction of the at least one attribute. Optionally, usage behavior of multiple users using the user interface is tracked based on past content viewed by other users (e.g., the current user) and used to provide suggestions regarding interest indicators. Optionally, trend data is generated for each of the plurality of metrics based on usage behavior of the plurality of users. Optionally, a graphical trend card is generated that includes a visual depiction of the trend data. Optionally, the graphical trend card is provided in the form of suggestions and recommendations of metrics of interest to one or more of the plurality of users in the user interface. Implementations of the described technology may include hardware, methods or processes, or computer software on a computer-accessible medium.
Drawings
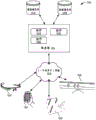
FIG. 1 illustrates a high-level overview of an intelligent analytics system, in accordance with some embodiments.
FIG. 2A illustrates an example user interface with KPI cards of interest, according to some embodiments.
FIG. 2B illustrates an example user interface of a drill-down view of a KPI card according to some embodiments.
FIG. 3 illustrates an example user interface with relevant metric suggestions, according to some embodiments.
FIG. 4 illustrates a method for identifying correlation metrics, in accordance with some embodiments.
FIG. 5 illustrates another example user interface with KPI cards of interest, according to some embodiments.
FIG. 6 illustrates another method for identifying correlation metrics, according to some embodiments.
Fig. 7 illustrates an example user interface for adding KPIs, according to some embodiments.
Fig. 8 illustrates an example user interface for providing details of a new KPI, in accordance with some embodiments.
FIG. 9 illustrates an example user interface of a drill-down view of a new KPI in accordance with some embodiments.
FIG. 10 illustrates an example network computer system according to some embodiments.
FIG. 11 illustrates an example cloud-based computer system, in accordance with some embodiments.
FIG. 12 illustrates an example computer system according to some embodiments.
FIG. 13 illustrates an example architecture of an intelligent analytics system, in accordance with some embodiments.
FIG. 14 illustrates an example method for generating metric recommendations, in accordance with some embodiments.
FIG. 15 illustrates an example method for displaying related content according to some embodiments.
Detailed Description
In the following description, for purposes of explanation, specific details are set forth in order to provide a thorough understanding of certain inventive embodiments. It will be apparent, however, that various embodiments may be practiced without these specific details. The drawings and description are not intended to be limiting. The word "exemplary" is used herein to mean "serving as an example, instance, or illustration. Any embodiment or design described herein as "exemplary" is not necessarily to be construed as preferred or advantageous over other embodiments or designs.
Methods and systems for providing suggestions of metric indicators, also referred to as key performance indicators ("KPIs"), for viewing in a user interface are described herein. Techniques for providing high information content to a user without requiring the user to request a particular KPI are also described. The user interface may provide a dashboard (also referred to as a cockpit) that may include a visual depiction of a metric (e.g., a business metric or a key performance indicator). The user interface may be provided by a computer system, such as computer system 1200 of fig. 12, cloud infrastructure system 1102 of fig. 11, or server 1012 of fig. 10. A user interface may be provided to a user and may be useful for viewing metrics or data underlying metrics. The metric may be an aggregate of data or a snapshot view of the underlying data, or a time series trend created from the data through statistical transformations, including but not limited to mean, median, standard deviation, quartile, and the like. For example, the metrics may provide trend data (e.g., sales increased by 10% over the past 60 days), snapshot information (e.g., revenue of $ 1000 million to date), and so on. The metrics of the business may include values for number of people, income, loss of people, inventory, and the like. Metric indicators (e.g., key performance indicators) may be generated based on the metrics. For example, the early-to-date revenue metric may provide information about the early-to-date revenue. The metric indicators may provide trending or historical information that helps a user learn the metrics in some cases. For example, a single day's revenue value may not be as helpful to the user as a quarterly revenue value.
As used herein, metrics, metric indicators, variables, metric cards, KPIs, and KPI cards are used interchangeably to describe data provided in a user interface with respect to metrics and/or data associated with metrics. For example, KPI card 220a is a KPI card that depicts information about a quantity of people metric. The collection of KPI cards is called a deck. For example, KPI cards 220a, 220b, 220c, 220d, 220e, 220f, 220g, and 215 are decks of KPI cards that are displayed to the user as shown in fig. 2A. In some embodiments, KPI cards within a deck are related. In some embodiments, a user may select KPI cards displayed on a deck, which may or may not be related, because there may or may not be metadata within the KPI cards that relates them to each other.
The described user interfaces may include, for example, user interfaces used by administrators and teams thereof. Administrators may include a Chief Financial Officer (CFO), Chief Technical Officer (CTO), Chief Human Resources Officer (CHRO), Chief Executive Officer (CEO), department manager, business analyst, and the like. As described herein, the user interface may be referred to as a dashboard. Alternatively, the user interface may be used by any user.
When an enterprise initially begins using the described user interface (which may be provided in a cloud application, site installation, or any other suitable implementation), a user interface for any given user may be generated based on the type of user, the field of interest of the user role, and the responsibility of the user. For example, CHRO and CEO may have different views (e.g., different metric indicators shown). CHRO may be more interested in employee data (such as number of people, people lost, diversity, etc.). However, CEOs may be more interested in revenue, inventory, production, and the like. Thus, an off-the-box implementation may provide metrics that are more likely to be useful to the user based on the user's title or role in the enterprise. Alternatively, when installing an application, the user may select an initial dashboard configuration from several off-the-shelf default configurations, including default configurations for CEO, CHRO, CFO, CTO, and the like.
As each user uses the user interface, the computer system may track and identify usage patterns for each user. The patterns may include initial viewing habits, sequential viewing habits, habits that may be recognized as changing based on data values, and so on. For example, CHRO may develop a mode of opening a user interface, viewing a people quantity metric, and viewing an employment metric if the people quantity metric indicates that the number of people is high. However, the CHRO can view the staff churn metric index and thus the staff churn metric when the staff count metric index is low. These viewing habits and their order can be analyzed and stored. Details of the storage of such episodic (episodic) memory are described in more detail with respect to FIG. 13.
Once the pattern of behavior is identified for the user, the computer system may additionally use current data values or trends to identify information that may be useful to the user based on its usage pattern. For example, since the people count metric is low, a recommendation may be provided to the CHRO at login to view the people churn metric. Optionally, the suggestion may include a notification with the suggestion. For example, the suggestions may be displayed in the user interface as a pop-up window containing suggestions and notifications, such as "since last month, the number of people has decreased, and is at a low point per month. Do you look at the people loss metric? The "suggestion and notification language may be clickable so that a user may click on text to view the people churn metric in a user interface. In some embodiments, relevant data is provided to the user without requesting the user's preferences only because it is statistically significant or because it is relevant to a particular domain.
Further, usage behavior of all users, input information from users, and behavior of metrics over time may be used to identify relationships between metrics. For example, viewing the CHRO behavior of the people churn metric shortly after (within a threshold time period) the people churn metric may cause the computer system to identify a relationship between the people churn metric and the people churn metric. Similarly, viewing the CHRO behavior of the employment metric shortly after (within a threshold period of time of) the staff quantity metric may also cause the computer system to identify a relationship between the employment metric and the staff quantity metric and place a weight on the edge in the relationship graph, where the strength of the relationship is redefined by the weight on the edge, and the node is a metric. The metrics can have associated metadata that the computer system can use to create a relationship between the two metrics. Alternatively, the metrics may have any number of relationships. In the example above, the number of people metric has two related metrics, while the people churn metric and the employment metric each have one. Alternatively, the computer system may identify the relationship by analyzing the user log for metrics that are scrutinized in time based on timestamps in the user log. In some embodiments, user logs for multiple users may be used to generate relationships between metric metrics for all other users.
The behavior of the metrics over time can also be used to identify relationships between the metrics. For example, over time, the computer system may analyze the value (trend) of the metric. For example, a computer system analysis method may identify lead (leading) indicators and lag (trailing) indicators. One example may be that as inventory begins to decline, revenue also declines, but after some time (e.g., after 3 days, after 2 weeks, after 1 month, etc.). The computer system may analyze the similarity of trends with time delays for revenue trends and identify the inventory metrics as leading indicators of the revenue metrics and conversely, the revenue metrics as lagging indicators for the inventory metrics. The metadata associated with each metric may be used to store the relationship between the two metrics and the type of relationship (lead/lag).
In some embodiments, a user may enter the relationship between metrics through a user interface. Metrics may be created by users, so entering relationships within the metrics information may help other users create relationships.
Relationships created using user logs, explicit user entry of relationships via user interfaces, and/or metric behavior may be used by a computer system to generate recommendations for a user based on the user's role (e.g., human resources team member, financial team member, etc.), the user's behavior, and/or the user's current view, as shown in more detail below.
Embodiments include techniques for crowd sourcing metric indicators. In some embodiments, when a system is initially provisioned for an enterprise, which may be a cloud-based system installed as a site or provided as a software as a service ("SaaS") implementation, the off-the-shelf dashboard for any given user may include a set of metrics related to that type of user. For example, the CEO may have a different metric on the dashboard than the CHRO. One of the metrics may be a trend index. The trend metric may provide a trend metric using, for example, a tag cloud. For example, the trend metric may include an indicator that other users in the company are viewing, or in some embodiments, more specifically by others in a team of users. In some embodiments, when the installation is new, the trend metric may be identified based on what other users in other companies are viewing within their companies as public domain knowledge. The tag cloud may provide a list of metric names with varying font sizes based on the popularity of the metrics. For example, metrics that are viewed in large numbers may have a larger font than metrics that are viewed by only a single user. In some embodiments, regardless of how long the enterprise uses the system, the trend metric may be configured by the user to identify the tag cloud based on a team of users (generally companies) or other similar companies hosted in the same cloud-based system. Tag clouds may be generated based on tracking user behavior and which metrics are viewed at any given time. The trend metric may be updated periodically, for example, every 1 hour or when refreshed by the user. The user may select a metric listed in the trend metrics. Upon selection, the metrics may be added to, for example, a dashboard of the user. In some embodiments, selecting a metric name from a tag cloud may provide a detailed screen that provides information related to the selected metric.
In some embodiments, the metrics indicators include metadata for modeling business metrics. Each metric may have multiple attributes. Each metric definition may describe a primary value as well as a detailed view that provides additional information about the primary value.
In some embodiments, metrics may be shared across business domains (e.g., customer experience ("CX"), human capital management ("HCM"), enterprise resource planning ("ERP"), supply chain management ("SCM")). Each metric can be informed by role requirements and business objectives in these particular domains. The user interface may provide immediate value and may change over time to best serve the enterprise. Thus, the metrics may reflect a priori knowledge of the traffic and "learning" over time. The user interface may change (change) because, for example, the user may use a new metric as a default in the user interface and may display different attributes for each metric. Additionally, suggestions may be provided that may allow the user to modify dashboard/user interface details.
After initial installation (e.g., site installation or cloud-based implementation), more than one metric may be defined and provided as part of the application. After installation, metrics may continue to be defined on the organization and picked (selected for use) by the user. Metrics may also appear organized over time to visualize new or changing business needs. The metric may reflect a priori knowledge of the business, and may be selected over time as a recommendation from the user's usage history. The metrics may fully utilize the data to model the business. The data may be provided by industry benchmark data, third party data sources, sales and production data sources, and the like.
Turning now to FIG. 1, an intelligent analysis system 100 is shown in a high-level block diagram. The intelligent analysis system 100 may be used to generate metric indicators (KPIs and cards) to show to a user. The intelligent analytics system 100 includes a user device 105, an intelligent analytics server 110, an intelligent analytics database 115, and an enterprise data source 120. The intelligent analysis system 100 may include additional components that are not shown in FIG. 1 for simplicity.
The user device 105 may be any suitable user computing device, such as user devices 1002, 1004, 1006, or 1008 of fig. 10, client devices 1104, 1106, 1108 of fig. 11, or computer system 1200 of fig. 12. The user may use the user device 105 to access the user interface 125 of the intelligent analysis server 110 to obtain a graphical user interface showing KPI cards and deck.
The enterprise data source 120 may be any data source of an enterprise that provides data for creating KPIs. The intelligent analysis server 110 may retrieve this information from the enterprise data sources 120 to perform metric index analysis, as described in more detail below.
FIG. 2A illustrates an example dashboard 200 for CHRO. A user may log into a dashboard/user interface that may be hosted on a computer system (such as, for example, computer system 1200 of fig. 12, cloud infrastructure system 1102 of fig. 11, or server 1012 of fig. 10). The dashboard 200 may include a plurality of metric indicator cards 215 and 220. The cards 215 and 220 may each provide a view of the activity represented by the metric. Metric indicator cards 215 and 220 may each be a card that represents information for a particular metric. This information may be stored in a data store of company information. Each user may group various metric indicator cards into one or more decks. In some embodiments, the deck is created by the system or grouped based on the metadata underlying each of the metric indicator cards 215 and 220. Each metric indicator card may include metadata that includes information (e.g., an identifier) about other related metric indicator cards. The metric indicator cards 215 and 220 may each be created by a user of the system, may be created by the system based on user behavior, or may be provided with an initial implementation of the system.
The metric-indicator cards 215 and 220 may be generated by a user by selecting a metric to view with the metadata. These cards can be personalized by each user while still relying on the same underlying data. For example, the metric indicator cards 215 and 220 may show a line graph trend for one user, while the other user prefers a pie graph display. These types of user-specific personalization settings are stored in the metadata for the user in the metrics indicator card. Additional information in the metadata of the metric-indicator cards 215 and 220 includes relationship data for the relevant metric indicators. The relationship data may be generated manually, by rules, and/or using machine learning.
The dashboard 200 may include a section that provides notifications 205. The notifications 205 may include team notifications applicable to all users within a team. Information may be provided for a particular user (e.g., Lynda and Thomas) that is useful to all members of the team. The alert 210 may provide relevant suggestions and notifications to the user. For example, the alert box 210 includes an alert that the new employee churn rate is 12%. The new employment turnover metric 215 displays further data to the user regarding this alert. The second alert 210 also indicates that the quarter staff with the highest U.S. based manufacturing personnel churn rate is 4.8 times higher than the expected rate, which is potentially valuable information to the user in the CHRO user interface. The alert may be clickable such that selection of the alert may provide a view of a metric that provides data related to the personnel attrition information.
If an alert is selected, the user interface 250 of FIG. 2B may be provided to the user. The user interface 250 may include information related to an alarm. For example, the user interface 250 may include further insights 255 on data associated with high people churn rates. The lead indicator 260 may provide the user with further information regarding high staff churn levels and staff outages. The high risk metric 265 may identify those portions of a company that are at risk of suffering additional personnel loss based on historical data. The loss metric 270 may provide information about employees who have left work the quarter. The people loss metric 275 may provide monthly people loss information based on region (e.g., europe and africa). The departmental staff churn metric 280 may provide quarterly staff churn information organized by department.
The dashboard 250 may be one view of drilling down the metrics based on the metrics selected from the original dashboard 200. In some embodiments, different metrics may be configured to be displayed based on the selected metric.
Fig. 3 may pass through another example dashboard 300. For example, a financial team member may be viewing a revenue meter metric including the revenue meter graphic 305. The user may select the "revenue" column in the revenue form graphic 305, which may display revenue metric 310. Due to the identified relationship between the revenue metric index 310 and the direct revenue metric index, indirect revenue metric index, sales speed metric index, revenue-amazon metric index, sales turnover metric index, etc., the metric index in the associated smart index selection box 315 may be displayed for selection and viewing by the user.
In some embodiments, the metric metrics shown in the relevant smart metrics selection box 315 may be selected based on relationships created from usage behavior of one or more users (e.g., analysis of user logs of users), explicit relationship creation by users via a user interface, and/or by automatic relationship creation based on computer system analysis of metric metrics behavior over time. In some embodiments, viewing the user's behavior may be used to select the metric shown in the relevant smart metric selection box 315. For example, if the user has recently viewed the metric, it may be excluded from the associated smart metric selection box 315 (or included in the associated smart metric selection box 315).
Fig. 4 may be a flow chart 400 of a method for providing data-driven metric correlation. The method of flowchart 400 may be performed by a computer, such as, for example, server 1012 of fig. 10, cloud infrastructure system 1102 of fig. 11, or computer system 1200 of fig. 12. The flowchart 400 may begin at step 405 by providing a dashboard to a user via a user interface, the dashboard including a visual depiction of the metric indicators, wherein the dashboard is configurable for each user. For example, the user interface 200 or 250 provides a metric for a human resources ("HR") user. Different types of users may wish to view financial information (e.g., revenue metrics) and may configure the dashboard accordingly. In some embodiments, the initial dashboard configuration may be provided to various types of users. For example, the HR user may select an HR dashboard configured with a number of people metric, a employment metric, a loss of people metric, and the like. As another example, a financial user may select a financial dashboard configured with revenue metrics, sales metrics, and the like. Each user can then remove and add metrics so that the dashboard is unique to that user. The method may continue at step 410 with tracking usage behavior of the user in the user interface. For example, HR users can typically view a measure of the rate of people lost in the united states for the last quarter at login. This metric may be identified as a usage pattern. Each user activity may be stored in a user log. The user log may contain, for example, user names, activities, and timestamps. The method may continue at step 415 where a relationship between the first metric and the second metric is identified. For example, the user log information may indicate that the user viewed the first metric and the second metric within a threshold period of time of each other. The method may continue at step 420 where a suggestion to view a second metric is provided while the first user is viewing the first metric in the dashboard. For example, the user interface 300 provides an example view with suggestions. The relevant smart metric index selection box 315 provides a suggestion of a relevant metric index based on the user viewing revenue metric index 310.
Returning to step 415, identifying the relationship between the first metric and the second metric may include identifying the relationship because the user manually entered the relationship via, for example, a user interface. The user can mark and flag the metric as relevant. For example, a user may select two metrics and mark the first as leading (i.e., the trend of this metric precedes the second metric) and the second as lagging (i.e., the trend of this metric follows the trend of the second metric). Metadata stored with the metrics allows for such tagging and relationship creation. As described with respect to fig. 10, the metadata may be stored, for example, in a data repository 1014.
At step 415, identifying a relationship between the first metric and the second metric may include identifying the relationship based on a user log that records user behavior and activity in a user interface. For example, an example usage log is shown in table 1.
| Date and time of log | Login to | Name of metric |
| 2018-06-12 12:34:01PM | Richard | Gross Profit (Gross Profit) |
| 2018-06-12 12:36:45PM | Richard | Income by region |
| 2018-06-12 12:37:23PM | Richard | According to income of staff |
| 2018-06-12 2:16:12PM | John | Gross profit |
| 2018-06-12 2:20:01PM | John | Income by region |
| 2018-06-12 4:39:42PM | Raja | Revenue per sale channel |
TABLE 1
Using the logs shown in Table 1, and using data mining based on associated rule learning, metrics that are often viewed together are identified and correlated between the metrics. Such analysis may not identify the type of relationship and may not identify the likelihood of the existence of a relationship. For example, using the example logs in table 1, "gross profit" and "revenue by region" may be identified as having a relationship, as multiple users perform them sequentially during a session. The association rule may identify whether the metrics are performed by the same user in the same session or within a certain time period. The order of execution may also provide insight into association rule algorithms. The association may also include additional information, including the type of user (user role and/or realm) to which the relationship applies. Using the example above, the user domain may be a CFO and the user role may be a financial executive. User logs may be collected for each user in the enterprise.
Identifying a relationship between the first metric and the second metric may include automatically identifying the relationship by analyzing a metric trend at step 415. The metric value trend may be used to identify the associated metric and the type of relationship (e.g., lead/lag metric). Snapshots may be created periodically (e.g., daily, weekly, monthly, quarterly, yearly, etc.) for each metric value. The snapshot may be used to identify any trends, patterns, and/or interdependencies. For example, if a first metric increases, then a second metric also increases, and this trend shows up consistently, then a relationship between the two metrics can be inferred. The time span used to identify whether two metrics are trending together or one leading/one lagging may be different. For example, some metrics may tend together and be seen in each snapshot, while in other relationships, a second metric may lag behind another metric by months. As another example, if the third metric increases and then the fourth metric decreases, then a relationship between the metrics may be inferred.
Table 2 provides example metric data snapshot values.
| Date | Name of metric | Value of |
| 2018-06-12 | Gross profit | 26,32,853 |
| 2018-06-12 | Income (R) | 89,45,389 |
| 2018-06-12 | Cost of | 63,12,536 |
| 2018-06-13 | Gross profit | 24,34,853 |
| 2018-06-13 | Income (R) | 89,45,389 |
| 2018-06-13 | Cost of | 65,11,536 |
TABLE 2
Table 2 provides a snapshot of the values collected and stored for the three metrics (gross profit, revenue, cost) over a two-day period. Such metric snapshot can be collected across all hosted customers in a cloud-based hosting environment. An algorithm may be applied to the snapshot data to identify trends in metric index values. Correlations between metric values that always trend together (e.g., two metrics increase and/or decrease together over time, or one metric increases and then the other increases and/or decreases over a period of time) are used to identify the metrics as being correlated and the type of relationship (e.g., lead/lag).
Fig. 5 illustrates another example user interface 500, which example user interface 500 may be, for example, an initial off-the-shelf dashboard provided for a user. When a user utilizes a user interface, the tracking discussed above may be used to provide suggestions based on the user's usage patterns and current data related to the usage patterns.
The user interface 500 may be a dashboard for, for example, a CEO. The CEO user interface 500 may include metrics for quarterly revenue 505, yearly to date ("YTD") revenue 510, and so forth. The CEO user interface 500 may also include a trend metric indicator 515. The trend metric 515 may be a tag cloud that provides trend metric information (also described herein as crowd-sourced metric information). More popular metrics are depicted with larger fonts. For example, in the user interface 500, "employee diversity KPI" is the most popular metric currently and is shown in the largest font. In some embodiments, color coding may further be used to highlight the most popular/current trending metric. For example, bright colors may be used for those metrics that are most trending, and dark, gray, or other less prominent colors may be used for those metrics that are less popular in gathering trending information. The trend metric 515 may change as the metric trend changes while the user is viewing the user interface 500. For example, as "profit KPIs" become more popular (used in large numbers by others in a business, team, etc.), the font size of "profit" within the trend metric 515 may increase. Similarly, for example, as the "employment" KPI becomes less popular (less viewed by users in an enterprise, team, etc.), the font size of the "employment" in the trend metrics 515 may decrease. In some embodiments, the user may select a metric within the trend metrics 515, for example, by clicking on a metric name within the trend metrics 515. Selecting a metric name may drill into a metric selected by displaying the metric and/or a more detailed screen with the metric and other underlying information about the metric. In some embodiments, a user may select whether trend metric 515 analyzes a trend of the metric based on all users in the enterprise, users within the enterprise that belong to a particular team, across other enterprises if information for other enterprises is available, and so on.
Fig. 6 illustrates a flow chart 600 describing a method for crowd sourcing metric metrics. The method may be performed by, for example, server 1012 of fig. 10, cloud infrastructure system 1102 of fig. 11, or computer system 1200 of fig. 12. The method may include, at step 605, providing a plurality of metrics in a user interface. In some embodiments, the metrics are all generated by the software manufacturer. In some embodiments, the metrics may be generated and/or customized by a user. The method may also include, at step 610, tracking a plurality of users using a user interface. In some embodiments, the user may be a teammate of individuals using the user interface. In some embodiments, the user may be other users within the company of the individual using the user interface. In some embodiments, the user may be from another company (enterprise). The method can also include, at step 615, identifying trend data for each metric based on tracking user usage. For example, if many users (e.g., 15 users in a 40 user enterprise) are viewing a metric, the metric may be considered a trend. Determining whether the metric is trending upward or downward may include analyzing whether the number of users viewing the metric is increasing or decreasing over a period of time (e.g., 30 minutes, 24 months, three quarters, 13 weeks). Further, the number of users viewing the first metric may be considered relative to the number of users viewing other metrics to determine whether the first metric is popular. Additionally, the total number of users in the system may also indicate popularity of the metrics based on, for example, a percentage of users viewing the metrics (e.g., with 90% of the user viewing metrics may indicate high popularity and large fonts in the tag cloud, while 2% of the user viewing metrics may indicate low popularity and no metrics exist in the tag cloud of the trend metrics 515. metrics that are less attended to and/or viewed may have low trend values. The clickable list indicates the metric name and provides information about the trending value or popularity of the named metric. For example, the most popular metrics may be displayed in a large font in a clickable list. Optionally, the method may include receiving a selection of a metric named in the clickable list, and in response to the selection, providing a view to the user via the user interface of details of the selected metric.
Returning to fig. 5, the user interface 500 may include an option to add a metric index 520. Selection of the add metric indicator 520 may provide the user interface depicted in the user interface 700 of fig. 4. The user interface 700 may provide a screen 705 that allows the user to select the type of metric selected.
Fig. 8 may illustrate a user interface 800 that may be used to enter data associated with a metric. The bases, interactions, and relationships, when entered by a user, provide metadata associated with the metrics. As an example, the target persona may identify the type of user to locate. As another example, the relevant metric metrics may be identified as cross-referencing options (to create a relationship for the recommendation, as described with respect to fig. 3 and 4). Each metadata value may also be used to identify relevant results when a user searches within the user interface.
Within the user interface, the "new" metric may be data driven based on consumer demand and may reflect any number of Oracle and non-Oracle data sources. The new metric may be user configurable and may be viewed across multiple contact points based on user preferences. New metrics may be pushed to users (alarms) based on urgency of traffic derived from configurable thresholds, industry benchmarks, or Advanced Intelligence (AI) driven monitoring. The metric may also be used as a focus of the application. The metric may also be user configurable. The metric may be viewed across multiple points of contact based on the user. The metrics may be able to filter not only the metrics currently shown on their user interface, but also all available metrics based on a range of parameters. The search may provide a mechanism for simple and complex searching/filtering. A simple control for filtering and surfacing the set of metrics may be provided.
In some embodiments, the search parameters may include, for example, topic/business goals, KPI status and status severity, usage/trends, seasonality, and the like. In some embodiments, the search may always be present on the user interface. The search may be integrated with an inquiry (Ask) function. Additionally, there may be no search based on the derived relationship.
In some embodiments, the system may utilize relationships derived from metadata tags and application usage, as described with respect to fig. 3 and 4.
The application/user interface may be driven by a consistent definition of a metric, which may be configured to appear as desired by the user. One example of configuring a metric may include setting a personalized threshold that overrides a default value of the metric. The threshold types may include personal threshold(s), baseline, and auto/AI detection. The metrics may also include custom navigation, multiple thresholds, directionality of coverage, custom navigation to subsequent processes, general rules, coverage rules, and/or custom tags. The user interface and/or the server system may provide these updates based on thresholds defined for the metric in the user interface and user preferences for the update mechanism. The user may have the ability to configure the manner in which notifications of different severity are sent, e.g., text, email, voice, etc. to the mobile device. Links back to the original metric and next actions may also be provided with the notification, where possible.
Within the user interface, metrics may be provided to a snapshot of the enterprise and the starting points of a number of follow-up actions. These subsequent steps are intended to further describe or explore the business and take action on the problems or opportunities revealed by the metrics. The subsequent steps cover a continuous process from rigorously defined automatic drill-down to fully customizable navigation paths. Ultimately, the metrics can effectively act as a portal to numerous functions.
In some embodiments, drilled-in details may be available. FIG. 9 is an example metric detail view 900 of a monthly revenue metric. For example, based on metadata (including derived data) and metric-metric details, a selection of a relevant metric may be selected for a drill-down menu of monthly revenue metrics. Drill-down analysis is automatically generated and mapped to predefined patterns. Based on the metric type (e.g., focusing on time, lead metrics, aggregated information that needs to be decomposed, etc.) and the set of metric attributes, an optimal mode can be automatically selected. This choice can also be overridden at the metric definition level. Even with the default selection, other drill-down modes may still be instructive, and if the user selects, the user is still able to see them.
The multiple attributes of the metrics themselves, as well as the observations of how to use them, can be used to drive the automatic generation of an informed analysis experience (also referred to as "drill-down" screens). This approach removes the burden of manually creating content from the user and reveals insight that would otherwise be lost. First, the definition of metric-index metadata and metric-index types can directly determine and populate the drill-down details screen. An example may be to render an arrangement of information ranges captured with metrics to present information to a user subdivided by dimensions or expanded by hints. Second, drill-down may also be customized based on user preferences (thresholds). Personal thresholds inform the relevance of a particular user and may also be aggregated across a user population. Data captured around user behavior and system usage provides a third input. The drill-down detail template for customization may include factors contributing to, associated with, or interpreting a particular metric, a usage-based correlation metric, lead/lag metrics, correlation analysis, and the like. The detail view may span or incorporate multiple metrics. Fourth, insights derived from machine learning algorithms (identifying patterns or abnormal events in large amounts of data) may also be collected from system data and usage, appended to metrics, and visualized in drill-down of those metrics. Classical (temporal) history and predictive analysis may also inform the state of the traffic. Since this is a dynamic system where usage, data and content are constantly changing, the output will change over time based on the state of the application. A related metric index, lead/lag index or predictive analysis are good examples.
Some embodiments may include a method for providing a metric authoring scheme for dynamic analysis. The method may be performed by a computer system. The method may include providing a user interface to a user. The method may also include receiving, via the user interface, a definition of a metric including metadata associated with the metric. For example, selecting the save button in FIG. 8 may send a value entered via the user interface to the computer system. The method may also include generating, based on the metadata, a metric-detail view that includes data associated with the metric. The detail view may, for example, be similar to the detail view 900 of fig. 9. The method may also include providing a detail view via a user interface.
The infrastructure may be implemented in a variety of different environments, including cloud environments (which may be of various types of clouds, including private, public, and hybrid cloud environments), in-house deployment environments, hybrid environments, and so forth.
FIG. 10 depicts a simplified diagram of a distributed system 1000 for implementing embodiments. In the illustrated embodiment, distributed system 1000 includes one or more client computing devices 1002, 1004, 1006, and 1008 coupled to a server 1012 via one or more communication networks 1010. The client computing devices 1002, 1004, 1006, and 1008 may be configured to execute one or more applications.
In some embodiments, the server 1012 may provide services or software applications that may include non-virtual and virtual environments. In some embodiments, these services may be provisioned as web-based services or cloud services, such as under a software as a service (SaaS) model, to users of client computing devices 1002, 1004, 1006, and/or 1008. A user operating client computing device 1002, 1004, 1006, and/or 1008 can, in turn, interact with server 1012 using one or more client applications to take advantage of the services provided by these components.
In the configuration depicted in FIG. 10, the server 1012 may include one or more components 1018, 1020, and 1022 that implement the functions performed by the server 1012. These components may include software components, hardware components, or a combination thereof, which may be executed by one or more processors. It should be appreciated that a variety of different system configurations are possible, which may differ from distributed system 1000. Thus, the embodiment shown in FIG. 10 is one example of a distributed system for implementing the embodiment system and is not intended to be limiting.
A user may execute one or more applications using client computing devices 1002, 1004, 1006, and/or 1008, which may generate one or more storage requests, which may then be serviced in accordance with the teachings of the present disclosure. The client device may provide an interface that enables a user of the client device to interact with the client device. The client device may also output information to the user via the interface. Although fig. 10 depicts only four client computing devices, any number of client computing devices may be supported.
Client devices may include various types of computing systems, such as portable handheld devices, general purpose computers, such as personal and laptop computers, workstation computers, wearable devices, gaming systems, thin clients, various messaging devices, sensors and other sensing devices, and so forth. These computing devices may run various types and versions of software applications and operating systems (e.g., Microsoft Windows Apple
Apple Or UNIX-like operating system, Linux, or Linux-like operating system, such as Google ChromeTMOS) including various mobile operating systems (e.g., Microsoft Windows
 Windows
 AndroidTM、
 Palm
Palm ). The portable handheld device may include a cellular telephone, a smart phone (e.g.,
 ) A tablet computer (e.g.,
 ) Personal Digital Assistants (PDAs), etc. Wearable devices may include Google
 Head mounted displays and other devices. The gaming system may include various handheld gaming devices, internet-enabled gaming devices (e.g., with or without)
 Microsoft of gesture input device
 Game machine, Sony
 System, by
 Various gaming systems provided, among others), and the like. The client device may be capable of executing a variety of different applications, such as various internet-related applications, communication applications (e.g., email applications, Short Message Service (SMS) applications), and may use a variety of communication protocols.
Network(s) 1010 may be any type of network familiar to those skilled in the art that may support data communications using any of a number of available protocols, including but not limited to TCP/IP (transmission control protocol/internet protocol), SNA (system network architecture), IPX (internet packet exchange), and the like, And the like. By way of example only, network(s) 1010 may be a Local Area Network (LAN), an ethernet-based network, a token ring, a Wide Area Network (WAN), the internet, a virtual network, a Virtual Private Network (VPN), an intranet, an extranet, a Public Switched Telephone Network (PSTN), an infrared network, a wireless network (e.g., as in any Institute of Electrical and Electronics Engineers (IEEE)1002.11 protocol suite, a web site,
 And/or any other network operating under a wireless protocol) and/or any combination of these and/or other networks.
The server(s) 1012 can be comprised of one or more general purpose computers, special purpose server computers (including, by way of example, PC (personal computer) servers, and the like, Servers, midrange servers, mainframe computers, rack-mounted servers, etc.), server farms, server clusters, or any other suitable arrangement and/or combination. The server 1012 may include one or more virtual machines running a virtual operating system, or other computing architecture involving virtualization, such as one or more flexible pools of logical storage devices that may be virtualized to maintain virtual storage devices for the server. In various embodiments, the server 1012 may be adapted to execute one or more services or software applications that provide the functionality described in the foregoing disclosure.
The computing systems in the servers 1012 can run one or more operating systems, including any of the operating systems discussed above, as well as any commercially available server operating systems. The servers 1012 can also execute any of a variety of additional server applications and/or intermediate tier applications, including HTTP (HyperText transfer protocol) servers, FTP (File transfer protocol) servers, CGI (common gateway interface) servers, Web services, Servers, database servers, etc. Exemplary database servers include, but are not limited to, those available from
 A commercially available database server (international business machine), etc.
In some implementations, the server 1012 may include one or more applications to analyze and integrate data feeds and/or event updates received from users of the client computing devices 1002, 1004, 1006, and 1008. By way of example, the data feeds and/or event updates may include, but are not limited to, those received from one or more third-party information sources and a continuous data stream Feeding,
 Updates or real-time updates, which may include real-time events related to sensor data applications, financial tickers, network performance measurement tools (e.g., network monitoring and traffic management applications), clickstream analysis tools, automotive traffic monitoring, and the like. The server 1012 can also include one or more applications that display data feeds and/or real-time events via one or more display devices of the
 client computing devices 1002, 1004, 1006, and 1008.
The distributed system 1000 may also include one or more data repositories 1014, 1016. In certain embodiments, these data repositories may be used to store data and other information. For example, one or more of the data repositories 1014, 1016 may be used to store information such as data for analysis and display in a dashboard. The data repositories 1014, 1016 may reside at various locations. For example, a data repository used by the server 1012 may be local to the server 1012, or may be remote from the server 1012 and connected to the service via a network-based or dedicated connectionThe devices 1012 communicate. The data repositories 1014, 1016 can be of different types. In certain embodiments, the data repository used by the server 1012 may be a database, e.g., a relational database, such as the one used by Databases provided by companies and other suppliers. One or more of these databases may be adapted to enable the storage, updating, and retrieval of data to and from the databases in response to SQL-formatted commands.
In some embodiments, the application may also use one or more of the data repositories 1014, 1016 to store application data. The data repositories used by the applications may be of different types, such as, for example, key-value repositories, object storage repositories, or generic repositories supported by a file system.
In some embodiments, storage-related functionality described in this disclosure may be provided as a service via a cloud environment. Fig. 11 is a simplified block diagram of a cloud-based system environment 1100 in which various storage-related services may be provided as cloud services, according to some embodiments. In the embodiment illustrated in fig. 11, cloud infrastructure system 1102 may provide one or more cloud services that may be requested by a user using one or more client devices 1104, 1106, and 1108. Cloud infrastructure system 1102 may include one or more computers and/or servers, which may include those described above for server 1012. The computers in cloud infrastructure system 1102 may be organized as general purpose computers, special purpose server computers, server farms, server clusters, or any other suitable arrangement and/or combination.
Network(s) 1110 may facilitate communication and data exchange between client devices 1104, 1106, and 1108 and cloud infrastructure system 1102. Network(s) 1110 may include one or more networks. The networks may be of the same or different types. Network(s) 1110 may support one or more communication protocols, including wired and/or wireless protocols, for facilitating communication.
The embodiment depicted in fig. 11 is merely one example of a cloud infrastructure system and is not intended to be limiting. It should be appreciated that in some other embodiments, cloud infrastructure system 1102 may have more or fewer components than shown in fig. 11, may combine two or more components, or may have a different configuration or arrangement of components. For example, although fig. 11 depicts three client computing devices, any number of client computing devices may be supported in alternative embodiments.
The term "cloud service" is generally used to refer to a service made available to users by a service provider's system (e.g., cloud infrastructure system 1102) as needed and via a communication network such as the internet. Typically, in a public cloud environment, the servers and systems that make up the cloud service provider system are different from the customer's own internal servers and systems. The system of the cloud service provider is managed by the cloud service provider. Customers can thus utilize the cloud services provided by the cloud service provider themselves without having to purchase separate licenses, support, or hardware and software resources for the services. For example, a cloud service provider's system may host an application, and a user may order and use the application on demand via the internet without the user having to purchase infrastructure resources for executing the application. Cloud services are designed to provide easy, scalable access to applications, resources, and services. Several providers provide cloud services. For example, by Redwood Shores, Calif Companies provide several cloud services, such as middleware services, database services, Java cloud services, and the like.
In certain embodiments, the cloud infrastructure system 1102 may provide one or more cloud services using different models, such as a software as a service (SaaS) model, a platform as a service (PaaS) model, an infrastructure as a service (IaaS) model, and other models including a hybrid service model. Cloud infrastructure system 1102 may include a suite of applications, middleware, databases, and other resources that enable provisioning of various cloud services.
The SaaS model enables applications or software to be delivered as a service to customers over a communications network, such as the internet, without the customers having to purchase hardware or software for the underlying applications. For example, the SaaS model may be used to provide customers with access to on-demand applications hosted by cloud infrastructure system 1102. By Examples of SaaS services provided by companies include, but are not limited to, various services for human resources/capital management, Customer Relationship Management (CRM), Enterprise Resource Planning (ERP), Supply Chain Management (SCM), Enterprise Performance Management (EPM), analytics services, social applications, and others.
The IaaS model is typically used to provide infrastructure resources (e.g., servers, storage, hardware, and networking resources) to customers as cloud services to provide flexible computing and storage capabilities. Companies offer various IaaS services.
The PaaS model is typically used to provide platform and environmental resources as services that enable customers to develop, run, and manage applications and services without the customers having to purchase, build, or maintain such resources. By Examples of PaaS services provided by companies include, but are not limited to, Oracle Java Cloud Services (JCS), Oracle database cloud services (DBCS), data management cloud services, various application development solution services, and other services.
Cloud services are typically provided in an on-demand self-service, subscription-based, elastically scalable, reliable, highly available, and secure manner. For example, a customer may order one or more services provided by cloud infrastructure system 1102 via a subscription order. Cloud infrastructure system 1102 then performs processing to provide the services requested in the customer's order. Cloud infrastructure system 1102 may be configured to provide one or even multiple cloud services.
Cloud infrastructure system 1102 may provide cloud services via different deployment models. In the public cloud model, cloud infrastructure system 1102 may be owned by a third party cloud service provider, and the cloud services are provided to any common public customer, where the customer may be an individual or an enterprise. In certain other embodiments, under the private cloud model, cloud infrastructure system 1102 may be operated within an organization (e.g., within an enterprise organization) and services provided to customers within the organization. For example, a customer may be a respective department of an enterprise, such as a human resources department, a payroll department, etc., or even an individual within the enterprise. In certain other embodiments, under the community cloud model, cloud infrastructure system 1102 and services provided may be shared by several organizations in a related community. Various other models, such as a mixture of the above-mentioned models, may also be used.
In some embodiments, the processing performed by cloud infrastructure system 1102 may involve big data analysis. Such analysis may involve the use, analysis, and manipulation of large data sets to detect and visualize various trends, behaviors, relationships, etc. within the data. Such analysis may be performed by one or more processors, possibly processing data in parallel, performing simulations using data, and so forth. The data used for such analysis may include structured data (e.g., data stored in a database or structured according to a structured model) and/or unstructured data (e.g., a data blob).
As depicted in the embodiment of fig. 11, cloud infrastructure system 1102 may include infrastructure resources 1130 used to facilitate provisioning of various cloud services provided by cloud infrastructure system 1102. Infrastructure resources 1130 may include, for example, processing resources, storage or memory resources, networking resources, and the like.
In certain embodiments, to facilitate efficient supply of these resources to support various cloud services provided by cloud infrastructure system 1102 for different customers, resources may be bundled into a collection of resources or resource modules (also referred to as a "cluster (pod)"). Each resource module or cluster may include a pre-integrated and optimized combination of one or more types of resources. In some embodiments, different clusters may be pre-provisioned for different types of cloud services. For example, a first clustered set may be provisioned for a database service, and a second clustered set may be provisioned for a Java service, where the second clustered set may include a different combination of resources than the clusters in the first clustered set. For some services, the resources allocated to provision the service may be shared among the services.
Cloud infrastructure system 1102 itself may use service 1132 internally, service 1132 being shared by different components of cloud infrastructure system 1102 and facilitating service provisioning for cloud infrastructure system 1102. These internally shared services may include, but are not limited to, security and identity services, integration services, enterprise repository services, enterprise manager services, virus scanning and whitelisting services, high availability, backup and restore services, services for enabling cloud support, email services, notification services, file transfer services, and the like.
Cloud infrastructure system 1102 may include a plurality of subsystems. These subsystems may be implemented in software or hardware or a combination thereof. As shown in fig. 11, the subsystems may include a user interface subsystem 1112, the user interface subsystem 1112 enabling a user or customer of cloud infrastructure system 1102 to interact with cloud infrastructure system 1102. User interface subsystem 1112 may include a variety of different interfaces, such as web interface 1114, online store interface 1116 (where cloud services provided by cloud infrastructure system 1102 are advertised and available for purchase by consumers), and other interfaces 1118. For example, a customer may use one or more of the client devices using interfaces 1114, 1116, and 1118 to request (service request 1134) one or more services provided by cloud infrastructure system 1102. For example, a customer may visit an online store, browse cloud services provided by cloud infrastructure system 1102, and place an order for one or more services provided by cloud infrastructure system 1102 that the customer wishes to subscribe to. The service request may include information identifying the customer and one or more services to which the customer wishes to subscribe. For example, a customer may place an order for storage-related services provided by cloud infrastructure system 1102. As part of the order, the customer may provide information identifying the application for which the service is to be provided, as well as application profile information for the application.
In certain embodiments, such as the embodiment shown in fig. 11, cloud infrastructure system 1102 may include an Order Management Subsystem (OMS)1120 configured to process new orders. As part of this processing, OMS 1120 may be configured to: create an account for the customer (if not already created); receiving billing and/or accounting information from the customer, the billing and/or accounting information to be used to charge the customer for providing the requested service to the customer; verifying the customer information; after verification, ordering an order for the customer; and orchestrating various workflows to prepare orders for supply.
Once properly verified, the OMS 1120 may invoke an order supply subsystem (OPS)1124 configured to supply resources, including processing resources, memory resources, and networking resources, for the order. Provisioning may include allocating resources for orders and configuring resources to facilitate services requested by customer orders. The manner in which resources are provisioned for an order and the type of provisioning resources may depend on the type of cloud service that the customer has subscribed to. For example, in accordance with one workflow, OPS 1124 may be configured to determine a particular cloud service requested, and identify a plurality of clusters that may have been preconfigured for the particular cloud service. The number of clusters allocated for an order may depend on the size/quantity/level/range of services requested. For example, the number of clusters to allocate may be determined based on the number of users supported by the service, the duration of the service being requested, and the like. The assigned clusters may then be customized for the particular requesting customer for providing the requested service.
Cloud infrastructure system 1102 may send a response or notification 1144 to the requesting customer to indicate when the requested service is ready. In some cases, information (e.g., links) may be sent to the customer so that the customer can begin using and utilizing the benefits of the requested service.
Cloud infrastructure system 1102 may provide services to multiple customers. For each customer, cloud infrastructure system 1102 is responsible for managing information related to one or more subscription orders received from the customer, maintaining customer data related to the orders, and providing the requested services to the customer. Cloud infrastructure system 1102 may also collect usage statistics regarding customer usage of subscribed services. For example, statistics may be collected for the amount of storage used, the amount of data transferred, the number of users, and the amount of system uptime and system down time, among other things. This usage information may be used to bill the customer. The billing may be performed, for example, on a monthly basis.
Cloud infrastructure system 1102 may provide services to multiple customers in parallel. Cloud infrastructure system 1102 may store information for these customers, including possibly proprietary information. In certain embodiments, cloud infrastructure system 1102 includes an Identity Management Subsystem (IMS)1128 configured to manage customer information and provide a separation of the managed information such that information related to one customer is not accessible to another customer. IMS 1128 may be configured to provide various security-related services, such as identity services, such as information access management, authentication and authorization services, services for managing client identities and roles and related capabilities, and so forth.
FIG. 12 illustrates an exemplary computer system 1200 that can be used to implement some embodiments. As shown in fig. 12, computer system 1200 includes various subsystems, including a processing subsystem 1204 that communicates with various other subsystems via a bus subsystem 1202. These other subsystems may include processing acceleration unit 1206, I/O subsystem 1208, storage subsystem 1218, and communication subsystem 1224. Storage subsystem 1218 may include non-transitory computer-readable storage media including storage media 1222 and system memory 1210.
The processing subsystem 1204 controls the operation of the computer system 1200 and may include one or more processors, Application Specific Integrated Circuits (ASICs), or Field Programmable Gate Arrays (FPGAs). The processor may include a single-core or multi-core processor. The processing resources of computer system 1200 may be organized into one or more processing units 1232, 1234, etc. A processing unit may include one or more processors, one or more cores from the same or different processors, a combination of cores and processors, or other combinations of cores and processors. In some embodiments, the processing subsystem 1204 may include one or more special-purpose coprocessors, such as a graphics processor, a Digital Signal Processor (DSP), or the like. In some embodiments, some or all of the processing subsystems 1204 may be implemented using custom circuitry, such as an Application Specific Integrated Circuit (ASIC) or a Field Programmable Gate Array (FPGA).
In some embodiments, the processing units in processing subsystem 1204 may execute instructions stored in system memory 1210 or on computer-readable storage media 1222. In various embodiments, the processing unit may execute various programs or code instructions and may maintain multiple concurrently executing programs or processes. At any given time, some or all of the program code to be executed may reside in system memory 1210 and/or on computer-readable storage media 1222, including possibly on one or more storage devices. The processing subsystem 1204 may provide the various functions described above, with appropriate programming. In the case where computer system 1200 is executing one or more virtual machines, one or more processing units may be assigned to each virtual machine.
In some embodiments, a processing acceleration unit 1206 may optionally be provided for performing customized processing or for offloading some of the processing performed by the processing subsystem 1204, thereby accelerating the overall processing performed by the computer system 1200.
I/O subsystem 1208 may include devices and mechanisms for inputting information to computer system 1200 and/or for outputting information from computer system 1200 or via computer system 1200. In general, use of the term "input device" is intended to include all possible types of devices and mechanisms for inputting information to computer system 1200. User interface input devices may include, for example, a keyboard, a pointing device such as a mouse or trackball, a touchpad or touch screen incorporated into the display, a scroll wheel, a click wheel, a dial, buttons, switches, a keypad, an audio input device with voice command recognition system, a microphone, and other types of input devices. The user interface input device may also include a user interface such as Microsoft Windows (R) for enabling a user to control and interact with the input device Motion sensing and/or gesture recognition device for a motion sensor, Microsoft
 360 game controller, a device providing an interface for receiving input using gestures and spoken commands. The user interface input device may also include an eye gesture recognition device, such as to detect eye activity from the user (e.g., "blinks" when taking pictures and/or making menu selections) and translate eye gestures into input devices (e.g., Google)
 ) Input of (2) Google
 A blink detector. In addition, the user interface input devices may include devices that enable a user to interact with a speech recognition system (e.g.,
 navigator) a voice recognition sensing device that interacts.
Other examples of user interface input devices include, but are not limited to: three-dimensional (3D) mice, joysticks or pointers, game pads and graphics tablets, and audio/video devices such as speakers, digital cameras, digital camcorders, portable media players, webcams, image scanners, fingerprint scanners, barcode readers, 3D scanners, 3D printers, laser rangefinders, and eye gaze tracking devices. Further, the user interface input device may include, for example, a medical imaging input device, such as a computed tomography, magnetic resonance imaging, positional emission tomography, and medical ultrasound examination device. User interface input devices may also include, for example, audio input devices, such as MIDI keyboards, digital musical instruments, and the like.
In general, use of the term "output device" is intended to include all possible types of devices and mechanisms for outputting information from computer system 1200 to a user or other computer. The user interface output devices may include a display subsystem, indicator lights, or a non-visual display such as an audio output device. The display subsystem may be a Cathode Ray Tube (CRT), a flat panel device such as one that utilizes a Liquid Crystal Display (LCD) or a plasma display, a projection device, a touch screen, or the like. For example, user interface output devices may include, but are not limited to: various display devices that visually convey text, graphics, and audio/video information, such as monitors, printers, speakers, headphones, car navigation systems, plotters, voice output devices, and modems.
Storage subsystem 1218 provides a repository or data store for storing information and data used by computer system 1200. Storage subsystem 1218 provides a tangible, non-transitory computer-readable storage medium for storing the basic programming and data constructs that provide the functionality of certain embodiments. The storage subsystem 1218 may store software (e.g., programs, code modules, instructions) that, when executed by the processing subsystem 1204, provide the functionality described above. The software may be executed by one or more processing units of the processing subsystem 1204. Storage subsystem 1218 may also provide a repository for storing data used in accordance with the teachings of the present disclosure.
The storage subsystem 1218 may include one or more non-transitory memory devices, including volatile and non-volatile memory devices. As shown in fig. 12, the storage subsystem 1218 includes a system memory 1210 and computer-readable storage media 1222. The system memory 1210 may include a number of memories, including a volatile main Random Access Memory (RAM) for storing instructions and data during program execution and a non-volatile read-only memory (ROM) or flash memory in which fixed instructions are stored. In some embodiments, a basic input/output system (BIOS), containing the basic routines that help to transfer information between elements within computer system 1200, such as during start-up, may typically be stored in ROM. The RAM typically contains data and/or program modules that are currently being operated on and executed by the processing subsystem 1204. In some embodiments, system memory 1210 may include a variety of different types of memory, such as Static Random Access Memory (SRAM), Dynamic Random Access Memory (DRAM), and so forth.
By way of example, and not limitation, as shown in fig. 12, system memory 1210 may load application programs 1212, program data 1214, and an operating system 1216 that may include various applications (such as a Web browser, middle tier application, relational database management system (RDBMS), and the like) that are being executed. By way of example, the operating system 1216 may include various versions of Microsoft Windows Apple
Apple And/or Linux operating system, various commercial products
 Or UNIX-like operating systems (including but not limited to various GNU/Linux operating systems, Google)
 OS, etc.) and/or mobile operating systems (such as iOS, OS, and/or the like,
 Phone、
 OS、
OS、 OS、
OS、 OS operating systems, among other operating systems).
Computer-readable storage media 1222 may store programming and data constructs that provide the functionality of some embodiments. Computer-readable storage media 1222 may provide storage of computer-readable instructions, data structures, program modules, and other data for computer system 1200. Software (programs, code modules, instructions) that when executed by the processing subsystem 1204 provide the functions described above may be stored in the storage subsystem 1218. By way of example, computer-readable storage medium 1222 may include non-volatile memory, such as a hard disk drive, a magnetic disk drive, an optical disk drive (such as a CD ROM, DVD, (blu-ray) discs or other optical media). Computer-
readable storage media 1222 may include, but is not limited to: drives, flash memory cards, Universal Serial Bus (USB) flash drives, Secure Digital (SD) cards, DVD disks, digital video tapes, and the like. The computer-
readable storage media 1222 may also include non-volatile memory based Solid State Drives (SSDs), such as flash memory based SSDs, enterprise flash drives, solid state ROMs, etc., volatile memory based SSDs, such as solid state RAM, dynamic RAM, static RAM, DRAM based SSDs, magnetoresistive RAM (mram) SSDs, and hybrid SSDs that use a combination of DRAM and flash memory based SSDs.
In certain embodiments, the storage subsystem 1218 may also include a computer-readable storage media reader 1220, the computer-readable storage media reader 1220 also being connectable to a computer-readable storage medium 1222. The reader 1220 may receive and be configured to read data from a memory device, such as a disk, flash drive, or the like.
In certain embodiments, computer system 1200 may support virtualization techniques, including but not limited to virtualization of processing and memory resources. For example, computer system 1200 may provide support for executing one or more virtual machines. In some embodiments, computer system 1200 may execute programs such as a hypervisor that facilitates configuration and management of virtual machines. Each virtual machine may be allocated memory, computing (e.g., processors, cores), I/O, and networking resources. Each virtual machine typically runs independently of the other virtual machines. The virtual machines typically run their own operating systems, which may be the same or different from the operating systems executed by other virtual machines executed by computer system 1200. Thus, computer system 1200 can potentially run multiple operating systems simultaneously.


In some embodiments, communications subsystem 1224 may be configured to receive data that may be continuous or unbounded in nature without explicit termination in the form of a continuous data stream, which may include event stream 1228 and/or event updates 1230 of real-time events. Examples of applications that generate continuous data may include, for example, sensor data applications, financial tickers, network performance measurement tools (e.g., network monitoring and traffic management applications), click stream analysis tools, automotive traffic monitoring, and so forth.


FIG. 13 illustrates an architecture 1300 and an exemplary data flow through a system for creating a metric recommendation based on identifying and selecting the highest informational value content of a user. The most informative value content may be information about metrics that have some statistically significant change associated therewith or some statistically significant anomaly associated therewith over a period of interest. For example, based on predictions made by a multivariate time series model, KPIs with trends or trend values that do not fit an expected distribution over a particular time period may be identified as abnormal. Whether or not the user requires the metric, it may be valuable to provide this information to the user. Additionally, users may be limited by the particular metrics they may have access to. For any given user, the relevant metrics to which that user has access are considered. For example, if the overall profit KPI has an anomaly signal associated with it, but the user does not have access to the overall profit KPI, the overall profit KPI will not be provided to the user. Additionally, if a user typically views the number of people and people losing KPIs, but there are no exceptions or other signals associated with these KPIs, these KPIs are not always removed from the user's view. Instead, user behavior may be added to the signal detection to provide additional KPIs for the user to view, so that the user sees not only the KPIs that the user will select by himself, but also KPIs that have information valuable to the user.
Data from the data store 1304 is used to identify signal anomalies in the KPI selector 1310. KPI selector 1310 may identify a metric that may indicate an abnormal signal because, for example, the metric may tend to exceed a threshold. To identify the metric, the KPI modeler and predictor 1312 may generate a multivariate dynamic dependency model for a given metric, including but not limited to VARIMAX (vector auto-regressive synthetic moving average with exogenous variables) and multivariate variable attention time attention long-term short-term memory using time series data for the metric. Based on the dynamic dependency model, a prediction of a first set of values of a first variable or attribute of the metric is generated. The values from the model can be compared to actual values to determine if the distribution of observed values differs significantly from the forecasted predictions by finding statistical deviations using divergence tests including, but not limited to, the Kullback-Leibler divergence test. If the statistical deviation is significant (e.g., more than two standard deviations from the centroid of the distribution), the KPI selector 1310 identifies the metric as being relevant or having some important information indicating that a person should view it. To do so, the KPI selector 1310 selects the KPI. If the metric is not anomalous, then KPIs are not selected for highlighting to the user. In other words, a previously predicted value of the metric may be identified and compared to a current metric value. An anomaly is identified if the metric index value is statistically different (e.g., two standard deviations) from the forecasted value at multiple points in time. If the metric model suggests a problem or anomaly, the metrics may be selected for inclusion in the user's KPI deck.
In some embodiments, the selected KPIs (metrics) may be provided to the guidance integrator 1318 without further analysis. However, in some embodiments, KPI interpreter 1314 may generate an interpretation of the anomaly based on the model. For example, a model of the metric, the current metric value, and the value of the contributing variable at that point in time may be used to identify an attribute that is important to the metric at the relevant time. Derivatives of the attributes may be computed in the model and the attributes that most affect identified because the most affecting attributes will have the largest derivative values based on computational techniques including, but not limited to, locally interpretable model interpretations and Shapley Additive (Additive) interpretations. This interpretation serves as a locally faithful linear model that acts as a surrogate for the original nonlinear model. The metrics may also be analyzed with a machine learning model to determine which metrics have statistically significant variations over a period of interest. A percentage change or z-score of the metric may be calculated to determine the actual meaning of the change. In some embodiments, the interpretation is not generated because, for example, the system cannot converge to a brief interpretation or there is insufficient data to compute such an interpretation.
Once the interpretation is generated, the KPI simulator 1316 may generate recommendations to correct the signal anomaly. Recommendations may be generated by performing a what-if simulation of the model by changing the most influential identified attributes to reach the most desirable or more desirable or closest non-outlier values of the KPI before an anomaly occurs. For example, the what-if simulation may modify the most influential attributes until the metrics in the model match the predictions. Once the values for the attribute modifications can be used to generate recommendations. Signal anomalies, modeled signal anomalies, interpretations, and recommendations may be provided to the guidance integrator 1318.
Metadata indexing and tagging engine 1308 may receive data from data warehouse 1304 and tag or apply metadata to the data, and then send it to metadata index database 1330.
After using the graphical user interface, the user indicated by the browser analysis 1342 generates activities based on the creation, use, and viewing of various metrics. Each action is recorded by the action recorder 1326. The recorded actions are analyzed to extract activity data and context data. The activity data is stored in the activity working memory 1328 and the context data is stored in the context working memory 1324. By way of example, if a user logs in and immediately views a people quantity metric and then views a people churn metric, the activity may be to view KPIs, last a period of time, and so on. For example, the context data may be the time of day, the device, the meeting in which the user attended during which the user viewed both metrics. The activity and context data are combined to create episodic memory 1322 for all relevant actions performed, for example, over a period of time. The episode memory 1322 is clustered into similar episodes by the clustering engine 1320. Plot information relating to context and data and clusters is stored in a relationship data store 1332, a role and KPI data store 1334, and an action knowledge data store 1336. The user-specific usage data stored in data stores 1332, 1334, and 1336 is then provided to the directions integrator 1318. Over time, individual user scenarios may reveal patterns, such as a user always logging in and immediately viewing the people count metric, and then viewing the people churn metric. In addition, over time, data for a cluster of many users may be captured and used to generate personalized recommendations for the users based on what many other users do, the KPIs they view, the order of viewing, and the like. All of this information may be provided to the guidance integrator.
The guidance integrator 1318 uses the signal anomaly information from the KPI selector 1310 and the KPI modeler and predictor 1312 to generate metric recommendations. In some embodiments, the user-specific information is combined to generate the metric recommendations. For example, if a revenue metric has been identified by the KPI selector 1310, the user may access the revenue metric, and the user typically reviews the profit metric. Even if the profit metrics are not captured by the KPI selector 1310, the user may be provided with a deck including revenue metrics and profit metrics. Metric recommendations and other information are provided to presentation manager 1338. The metric recommendations may be provided to the user in the related information sidebar 1340. This may be, for example, recommendation 315 of FIG. 3. The relevant information sidebar 1340 may be, for example, the relevant metrics index 315 shown in fig. 3. The analysis information (used to generate the metric indicator cards and deck described above) is shown to the user via a graphical user interface. The browser analysis 1342 is shown to the user using a browser interface. The mobile analysis 1344 is shown to the user using a mobile application. The data included in the metric (analysis) is the same data regardless of whether the interface is a browser or a mobile device.
To display metric information in a user interface of the browser-based analysis and/or the movement analysis 144, a graphical representation of the KPI must be generated. In other words, KPI cards must be generated. For each KPI in the system, a model of the metrics (e.g., a random forest or XGBoost model) is generated using the KPI modeler and predictor 1312. Each attribute of the metric is included in the model as an independent variable. Using the model, the attribute with the highest entropy change may be identified by, for example, calculating a Shapley plus interpretation value or a locally interpretable model-agnostic interpretation (LIME) value. When generating the graphical representation of the metric, a card, such as the card shown in the exemplary user interface herein (including, for example, card 505 of fig. 5), is generated for display. The card typically includes some information associated with the attribute identified above as having the highest (maximum) entropy change. In this manner, the most relevant content associated with the metric is provided to the user for viewing.
Fig. 14 illustrates a method 1400 that may be performed using a system having an architecture 1300 as described in fig. 13. Method 1400 may begin at step 1405, where the system receives first data related to an activity performed by a user in a graphical user interface. For example, the action recorder 1326 can receive and record activity data of user interactions with metrics using browser-based analysis 1342 and/or mobile analysis 1344.
In step 1410, activity data and context data may be extracted from the first data. For example, context data may be extracted and stored in the context working memory 1324, and activity data may be extracted and stored in the activity working memory 1328. The activity information is obtained directly from the user's interaction with the user interface elements in the form of mouse clicks, scrolls, key presses related to KPIs, cards, deck of cards, and the sequence of these operations is stored as a time activity graph. Similarly, the context of each of the above actions in terms of its previous actions, its subsequent actions, the role and responsibility of the user, the user's collaborative activities with other users, and the user's sharing and email activities related to KPIs are also attached as a graphical store to each node in the above activity graph.
In step 1415, episode data is generated for all relevant activities performed by the user based on the activity data and the context data. In particular, if a user views several related metrics, the views may be identified as episodes and stored accordingly.
In step 1420, second data indicative of a metric of the anomaly signal is received. For example, the signal anomaly selector 1310 may receive information from the data store 1304 regarding metric indicators that reveal anomalies upon analysis.
In step 1425, the second data is modeled by the KPI modeler and predictor 1312 to identify an anomaly signal, as described above. For example, the modeler may use the time series data for the metric to generate a dynamic dependency model. Based on the dynamic dependency model, a prediction of a first set of values of a first variable or attribute of the metric is generated. Values from the model may be compared to actual values to generate statistical deviations using a divergence test. If the statistical deviation is significant (e.g., two standard deviations as described above), the KPI selector 1310 identifies the metric as being relevant or having some information indicating that a person should view it. This deviation is indicative of an anomaly, and thus a signal anomaly may be identified and verified.
In step 1430, an interpretation of the anomaly signal can be generated based on the modeled anomaly signal. Such an interpretation may include, for example, factors that cause the metric to tend to exceed a threshold. The interpretation may be found by finding derivatives of attributes of the model using the model of the metric and the current metric value, where the attributes are each represented as an independent variable within the model. When the metric indicator value is at a point in time, those attributes having the highest partial derivatives are identified as having the most impact at that time. These attributes are identified to account for anomalies using techniques such as Shapley additive interpretation or locally interpretable model agnostic interpretation.
In step 1435, a metric recommendation is generated based on the episode data and the modeled anomaly signals. The recommendation may include steps that may be taken to correct the anomaly. Specifically, KPI path specifier (prescripter) 1316 may generate recommendations. The what-if simulation of the model is run by changing the values of those identified attributes that have the most impact to place the metric index values in the most desirable state. For example, if the metric has deviated from the forecasted value, the what-if simulation may attempt to modify the attributes such that the metric value corresponds to the predicted value or values within the expected distribution.
In step 1440, metric recommendations are generated and displayed in a graphical user interface, including interpretations and recommendations for resolving anomalous signals. The metric recommendations may be displayed, for example, in a sidebar while the user views the selected metric. For example, a metric recommended for viewing may be generated as a card having some value or information, such as a graph or value indicating one or more metric values over time, in addition to the information identified by the KPI interpreter 1314 and KPI path specifier 1316 regarding the most relevant attributes of the metric. The user interfaces herein provide examples of KPI cards and other information that may be generated for viewing by a user.
In step 1445, the metric recommendations are displayed in a graphical user interface, including interpretations and recommendations for resolving anomalous signals. For example, a visual depiction may be provided in the related information sidebar 1340 or more directly on the user's screen. As an example, the information box 210 of FIG. 2A provides some notification information, including a loss of 12% for newly employed personnel, and one explanation is provided that the manufacturing personnel loss is 4 times the expected rate. This type of information may help the user understand why these values are.
FIG. 15 illustrates an example method 1500 for providing a high value metric to a user. The method 1500 may be performed by, for example, the intelligent analysis system 100 and/or the intelligent analysis architecture 1300. The method 1500 begins at step 1505 where the KPI modeler and predictor 1312 generates a model for each metric having each attribute as an independent variable. A model is created for each KPI to identify which attributes are most relevant to the KPI, at least during the time period of interest. In this manner, KPI cards may be generated for any KPI that may be displayed to a user. It should be noted that some KPIs may not be available for a given user, and therefore in some embodiments KPIs not accessible to the user may not be analyzed at step 1505.
At step 1510, KPI selector 1310 may select at least one attribute having the greatest change contribution based on the model for each metric. For example, the model generated by the KPI modeler 1312 may be used to take the derivative of each attribute to find the attribute with the largest derivative (change contribution). The attribute that the variation contributes most to has the most important or most influential effect on the metric.
At step 1515, the KPI selector 1310 may generate a deck of metrics based on selecting a subset of the metrics, wherein the subset is selected based on selecting the metric with the greatest statistically significant variation. The metric having the greatest entropy change may be determined by identifying whether the metric index may have an anomaly associated therewith. As described above, one method of determining whether a metric is anomalous includes generating a dynamic correlation model using time series data of the metric. Based on the dynamic dependency model, a prediction of a first set of values of a first variable or attribute of the metric is generated. Values from the model can be compared to actual values to generate statistical deviations using statistical divergence tests, including but not limited to the Kullback-Leibler divergence test. If the statistical deviation is significant (e.g., equal to two or more standard deviations), the KPI selector 1310 identifies the metric as being relevant or having some statistically significant information indicating that the person should view it. This deviation indicates an anomaly, and those metrics having an anomaly are included in the deck of metrics. In some embodiments, the user's personalization may also be used to add metrics to the deck. For example, if the information in the vital KPIs and relational database 1332 has information that a particular user prefers certain metrics for periodic viewing, then these KPIs may also be included in the deck. The key KPIs and relational database 1332 may obtain this user-specific information from the clustering engine 1320.
At step 1520, the presentation manager can generate a graphical display for each subset of the metric, wherein each graphical display includes at least one attribute having a maximum entropy change. In other words, the metrics card can include information about the attributes identified by the KPI selector 1310 as each KPI was analyzed at 1510 that have the most impact on the metric.
In some embodiments, the metrics are ranked based on statistical significance and/or actual significance. The ranking is based on the z-score (normalized standard deviation) distance between the observed distribution and the expected forecast prediction, and the ranking is in descending order. The determination of actual significance is based on how hard users in the enterprise are reviewing anomalies in the domain and how much deviation in z-scores occurs. Once the metrics are ranked and the metric (subset) with the highest informational value has been selected, a graphical display of each subset of metrics may be generated in order.
At step 1525, a graphical display of the metric indicators that may be ranked may be provided to a user's display for viewing.
While specific embodiments have been described, various modifications, alterations, alternative constructions, and equivalents are possible. Embodiments are not limited to operation within certain specific data processing environments, but may operate freely within multiple data processing environments. Further, while certain embodiments have been described using a particular series of transactions and steps, it will be apparent to those skilled in the art that this is not intended to be limiting. Although some of the flowcharts describe the operations as a sequential process, many of the operations can be performed in parallel or concurrently. Further, the order of the operations may be rearranged. The process may have additional steps not included in the figure. Various features and aspects of the above-described embodiments may be used alone or in combination.
Additionally, although certain embodiments have been described using a particular combination of hardware and software, it should be recognized that other combinations of hardware and software are possible. Some embodiments may be implemented in hardware only or software only or a combination thereof. The various processes described herein may be implemented on the same processor or different processors in any combination.
Where a device, system, component, or module is described as being configured to perform certain operations or functions, such configuration may be achieved by: for example, by designing an electronic circuit to perform the operations, by programming a programmable electronic circuit (such as a microprocessor) to perform the operations (such as by executing computer instructions or code, or a processor or core programmed to execute code or instructions stored on a non-transitory storage medium, or any combination thereof). The processes may communicate using a variety of techniques, including but not limited to conventional techniques for inter-process communication, and different pairs (pair) of processes may use different techniques, or the same pair of processes may use different techniques at different times.
Specific details are given in the present disclosure to provide a thorough understanding of the embodiments. However, embodiments may be practiced without these specific details. For example, well-known circuits, processes, algorithms, structures, and techniques have been shown without unnecessary detail in order to avoid obscuring the embodiments. This description provides example embodiments only, and is not intended to limit the scope, applicability, or configuration of other embodiments. Instead, the previous description of the embodiments will provide those skilled in the art with an enabling description for implementing various embodiments. Various changes may be made in the function and arrangement of elements.
The specification and drawings are, accordingly, to be regarded in an illustrative rather than a restrictive sense. It will, however, be evident that additions, subtractions, deletions, and other modifications and changes may be made thereto without departing from the broader spirit and scope as set forth in the claims. Thus, while specific embodiments have been described, these embodiments are not intended to be limiting. Various modifications and equivalents are within the scope of the appended claims.
Claims (20)
1. A computer-implemented method for identifying and displaying highly informational content to a user, comprising:
for each metric index of a plurality of metric indices for an enterprise:
generating a model of the metric, the model having each of a plurality of attributes of the metric as an independent variable of the model,
selecting, based on the model, at least one of the plurality of attributes having a largest statistical variation contribution;
generating a deck of metrics based on selecting a subset of the plurality of metrics, wherein the subset of the plurality of metrics is selected based at least in part on having a maximum metric entropy change;
generating a graphical display of each of the subset of the plurality of metrics, wherein each graphical display of the subset of metrics includes the at least one of the plurality of attributes; and
the graphical display is provided to a device of the user for display to the user.
2. The computer-implemented method of claim 1, wherein selecting a subset of the plurality of metrics comprises:
obtaining a previous prediction of a current metric;
determining a current value of the metric; and
the metric is selected when the previous prediction differs from the current value.
3. The computer-implemented method of claim 1, the method further comprising:
generating an interpretation of maximum metric entropy change for the subset of the plurality of metrics by: the method includes applying a current value of a metric to a model, generating a partial derivative with respect to each of the attributes of the model, and selecting a subset of each of the attributes based on the generated partial derivatives.
4. The computer-implemented method of claim 3, further comprising:
the what-if simulation of the model is run by changing the values of a subset of each of the selected attributes to reach a more valuable value of the metric.
5. The method of claim 1, further comprising:
recording the user's actions within the user interface;
generating user preference information for at least one metric; and
wherein generating the deck of metrics includes including the at least one metric in the deck.
6. The method of claim 1, wherein generating a graphical display of each of the subsets of the plurality of metrics comprises:
creating a metrology card comprising at least one visual depiction of the at least one attribute.
7. The method of claim 1, further comprising:
identifying a second subset of the plurality of metrics that is accessible to a user; and
selecting the subset of the plurality of metrics from a second subset of the plurality of metrics.
8. The method of claim 1, further comprising:
tracking usage behavior of a plurality of users using a user interface;
identifying trend data for each of the plurality of metrics based on usage behavior of the plurality of users;
generating a graphical trend card comprising a visual depiction of trend data; and
providing a graphical trend card to one or more of the plurality of users in a user interface.
9. A system, comprising:
one or more processors; and
a memory having instructions stored thereon that, when executed by the one or more processors, cause the one or more processors to:
for each metric index of a plurality of metric indices for an enterprise:
generating a model of the metric, the model having each of a plurality of attributes of the metric as an independent variable of the model,
selecting, based on the model, at least one of the plurality of attributes having a largest statistical variation contribution;
generating a deck of metrics based on selecting a subset of the plurality of metrics, wherein the subset of the plurality of metrics is selected based at least in part on having a maximum metric entropy change;
generating a graphical display of each of the subset of the plurality of metrics, wherein each graphical display of the subset of metrics includes the at least one of the plurality of attributes; and
the graphical display is provided to a device of the user for display to the user.
10. The system of claim 9, wherein the instructions for selecting the subset of the plurality of metrics comprise further instructions that, when executed by the one or more processors, cause the one or more processors to:
obtaining a previous prediction of a current metric;
determining a current value of the metric; and
the metric is selected when the previous prediction differs from the current value.
11. The system of claim 9, wherein the memory includes further instructions that, when executed by the one or more processors, cause the one or more processors to:
generating an interpretation of maximum metric entropy change for the subset of the plurality of metrics by: the method includes applying a current value of a metric to a model, generating a partial derivative with respect to each of the attributes of the model, and selecting a subset of each of the attributes based on the generated partial derivatives.
12. The system of claim 11, wherein the memory includes further instructions that, when executed by the one or more processors, cause the one or more processors to:
the what-if simulation of the model is performed by changing the values of a subset of each of the selected attributes to reach a more valuable value of the metric.
13. The system of claim 9, wherein the memory includes further instructions that, when executed by the one or more processors, cause the one or more processors to:
recording the user's actions within the user interface;
generating user preference information for at least one metric; and
wherein generating the deck of metrics includes including the at least one metric in the deck.
14. The system of claim 9, wherein the instructions for generating a graphical display of each of the subsets of the plurality of metrics include further instructions that, when executed by the one or more processors, cause the one or more processors to:
creating a metrology card comprising at least one visual depiction of the at least one attribute.
15. The system of claim 9, wherein the memory includes further instructions that, when executed by the one or more processors, cause the one or more processors to:
identifying a second subset of the plurality of metrics that is accessible to a user; and
selecting the subset of the plurality of metrics from a second subset of the plurality of metrics.
16. The system of claim 9, wherein the memory includes further instructions that, when executed by the one or more processors, cause the one or more processors to:
tracking usage behavior of a plurality of users using a user interface;
identifying trend data for each of the plurality of metrics based on usage behavior of the plurality of users;
generating a graphical trend card comprising a visual depiction of trend data; and
providing a graphical trend card to one or more of the plurality of users in a user interface.
17. A memory device having instructions stored thereon that, when executed by one or more processors, cause the one or more processors to:
for each metric index of a plurality of metric indices for an enterprise:
generating a model of the metric, the model having each of a plurality of attributes of the metric as an independent variable of the model,
selecting, based on the model, at least one of the plurality of attributes having a largest statistical variation contribution;
generating a deck of metrics based on selecting a subset of the plurality of metrics, wherein the subset of the plurality of metrics is selected based at least in part on having a maximum metric entropy change;
generating a graphical display of each of the subset of the plurality of metrics, wherein each graphical display of the subset of metrics includes the at least one of the plurality of attributes; and
the graphical display is provided to a device of the user for display to the user.
18. The memory device of claim 17, wherein the instructions to select the subset of the plurality of metrics comprise further instructions that, when executed by the one or more processors, cause the one or more processors to:
obtaining a previous prediction of a current metric;
determining a current value of the metric; and
the metric is selected when the previous prediction differs from the current value.
19. The memory device of claim 17, comprising further instructions that, when executed by the one or more processors, cause the one or more processors to:
generating an interpretation of maximum metric entropy change for the subset of the plurality of metrics by: the method includes applying a current value of a metric to a model, generating a partial derivative with respect to each of the attributes of the model, and selecting a subset of each of the attributes based on the generated partial derivatives.
20. The memory device of claim 19, wherein the instructions comprise further instructions that, when executed by the one or more processors, cause the one or more processors to:
the what-if simulation of the model is performed by changing the values of a subset of each of the selected attributes to reach a more valuable value of the metric.
Applications Claiming Priority (5)
| Application Number | Priority Date | Filing Date | Title |
|---|---|---|---|
| US201862737518P | 2018-09-27 | 2018-09-27 | |
| US62/737,518 | 2018-09-27 | ||
| US201962855218P | 2019-05-31 | 2019-05-31 | |
| US62/855,218 | 2019-05-31 | ||
| PCT/US2019/053576 WO2020069393A1 (en) | 2018-09-27 | 2019-09-27 | Techniques for data-driven correlation of metrics |
Publications (1)
| Publication Number | Publication Date |
|---|---|
| CN112970039A true CN112970039A (en) | 2021-06-15 |
Family
ID=68296671
Family Applications (1)
| Application Number | Title | Priority Date | Filing Date |
|---|---|---|---|
| CN201980072248.XA Pending CN112970039A (en) | 2018-09-27 | 2019-09-27 | Techniques for data-driven correlation of metrics |
Country Status (4)
| Country | Link |
|---|---|
| US (1) | US11367034B2 (en) |
| JP (1) | JP2022503842A (en) |
| CN (1) | CN112970039A (en) |
| WO (1) | WO2020069393A1 (en) |
Families Citing this family (20)
| Publication number | Priority date | Publication date | Assignee | Title |
|---|---|---|---|---|
| US11467803B2 (en) | 2019-09-13 | 2022-10-11 | Oracle International Corporation | Identifying regulator and driver signals in data systems |
| US11321887B2 (en) * | 2018-12-24 | 2022-05-03 | Accenture Global Solutions Limited | Article design |
| WO2020223402A1 (en) | 2019-04-30 | 2020-11-05 | Oracle International Corporation | System and method for data analytics with an analytic applications environment |
| US10708122B1 (en) | 2019-10-30 | 2020-07-07 | T-Mobile Usa, Inc. | Network fault detection and quality of service improvement systems and methods |
| US11611576B2 (en) * | 2019-12-11 | 2023-03-21 | GE Precision Healthcare LLC | Methods and systems for securing an imaging system |
| US11281564B2 (en) | 2020-06-22 | 2022-03-22 | HCL Technologies Italy S.p.A. | Method and system for generating key performance indicators (KPIs) for software based on debugging information |
| US11636104B2 (en) * | 2020-07-28 | 2023-04-25 | Servicenow, Inc. | Analytics center having a natural language query (NLQ) interface |
| US11265205B2 (en) * | 2020-07-31 | 2022-03-01 | Verizon Patent And Licensing Inc. | System and method for anomaly detection with root cause identification |
| US11763240B2 (en) * | 2020-10-12 | 2023-09-19 | Business Objects Software Ltd | Alerting system for software applications |
| US11243835B1 (en) | 2020-12-03 | 2022-02-08 | International Business Machines Corporation | Message-based problem diagnosis and root cause analysis |
| US11403326B2 (en) | 2020-12-03 | 2022-08-02 | International Business Machines Corporation | Message-based event grouping for a computing operation |
| US11513930B2 (en) | 2020-12-03 | 2022-11-29 | International Business Machines Corporation | Log-based status modeling and problem diagnosis for distributed applications |
| US11599404B2 (en) | 2020-12-03 | 2023-03-07 | International Business Machines Corporation | Correlation-based multi-source problem diagnosis |
| US11797538B2 (en) | 2020-12-03 | 2023-10-24 | International Business Machines Corporation | Message correlation extraction for mainframe operation |
| US11474892B2 (en) | 2020-12-03 | 2022-10-18 | International Business Machines Corporation | Graph-based log sequence anomaly detection and problem diagnosis |
| EP4260256A1 (en) | 2020-12-08 | 2023-10-18 | Oracle International Corporation | System and method for determination of smart measures for use with a data analytics environment |
| EP4040355A1 (en) * | 2021-02-08 | 2022-08-10 | Tata Consultancy Services Limited | System and method for measuring user experience of information visualizations |
| US20220357820A1 (en) * | 2021-05-04 | 2022-11-10 | Honeywell International Inc. | User interface modifications for increased productivity |
| WO2022271057A1 (en) * | 2021-06-25 | 2022-12-29 | Telefonaktiebolaget Lm Ericsson (Publ) | First node and methods performed thereby for handling anomalous values |
| US20230289695A1 (en) * | 2022-03-09 | 2023-09-14 | Ncr Corporation | Data-driven prescriptive recommendations |
Citations (4)
| Publication number | Priority date | Publication date | Assignee | Title |
|---|---|---|---|---|
| CN102254017A (en) * | 2010-07-21 | 2011-11-23 | 微软公司 | Intelligent acquiescence for data visualization |
| US20120053995A1 (en) * | 2010-08-31 | 2012-03-01 | D Albis John | Analyzing performance and setting strategic targets |
| CN106575308A (en) * | 2014-09-26 | 2017-04-19 | 甲骨文国际公司 | Semantic distance-based assignment of data elements to visualization edges |
| US9911094B1 (en) * | 2017-05-11 | 2018-03-06 | International Business Machines Corporation | Intelligent key performance indicator catalog |
Family Cites Families (83)
| Publication number | Priority date | Publication date | Assignee | Title |
|---|---|---|---|---|
| US5642519A (en) | 1994-04-29 | 1997-06-24 | Sun Microsystems, Inc. | Speech interpreter with a unified grammer compiler |
| JP2690027B2 (en) | 1994-10-05 | 1997-12-10 | 株式会社エイ・ティ・アール音声翻訳通信研究所 | Pattern recognition method and apparatus |
| US5717828A (en) | 1995-03-15 | 1998-02-10 | Syracuse Language Systems | Speech recognition apparatus and method for learning |
| JPH08335091A (en) | 1995-06-09 | 1996-12-17 | Sony Corp | Voice recognition device, voice synthesizer, and voice recognizing/synthesizing device |
| US6995768B2 (en) * | 2000-05-10 | 2006-02-07 | Cognos Incorporated | Interactive business data visualization system |
| US20040030667A1 (en) | 2002-08-02 | 2004-02-12 | Capital One Financial Corporation | Automated systems and methods for generating statistical models |
| GB0228447D0 (en) * | 2002-12-06 | 2003-01-08 | Nicholls Charles M | System for detecting and interpreting transactions events or changes in computer systems |
| US20060046232A1 (en) | 2004-09-02 | 2006-03-02 | Eran Peter | Methods for acquiring language skills by mimicking natural environment learning |
| US7869989B1 (en) | 2005-01-28 | 2011-01-11 | Artificial Cognition Inc. | Methods and apparatus for understanding machine vocabulary |
| US7801769B1 (en) | 2005-09-22 | 2010-09-21 | Hewlett-Packard Development Company, L.P. | Computing a set of K-best solutions to an auction winner-determination problem |
| US9092593B2 (en) * | 2007-09-25 | 2015-07-28 | Power Analytics Corporation | Systems and methods for intuitive modeling of complex networks in a digital environment |
| US8233702B2 (en) | 2006-08-18 | 2012-07-31 | Google Inc. | Computer implemented technique for analyzing images |
| GB2443472A (en) | 2006-10-30 | 2008-05-07 | Cotares Ltd | Method of generating routes |
| US8021163B2 (en) | 2006-10-31 | 2011-09-20 | Hewlett-Packard Development Company, L.P. | Skill-set identification |
| US8200527B1 (en) | 2007-04-25 | 2012-06-12 | Convergys Cmg Utah, Inc. | Method for prioritizing and presenting recommendations regarding organizaion's customer care capabilities |
| US8060451B2 (en) | 2007-06-15 | 2011-11-15 | International Business Machines Corporation | System and method for facilitating skill gap analysis and remediation based on tag analytics |
| US8065247B2 (en) | 2007-11-21 | 2011-11-22 | Inomaly, Inc. | Systems and methods for multivariate influence analysis of heterogenous mixtures of categorical and continuous data |
| US20090276296A1 (en) | 2008-05-01 | 2009-11-05 | Anova Innovations, Llc | Business profit resource optimization system and method |
| WO2009154484A2 (en) * | 2008-06-20 | 2009-12-23 | Business Intelligence Solutions Safe B.V. | Methods, apparatus and systems for data visualization and related applications |
| WO2010011652A1 (en) | 2008-07-21 | 2010-01-28 | Talent Tree, Inc. | System and method for tracking employee performance |
| US20100049538A1 (en) | 2008-08-22 | 2010-02-25 | Durban Frazer | Method and apparatus for selecting next action |
| WO2010080121A1 (en) | 2008-12-18 | 2010-07-15 | The Regents Of The University Of California, Santa Cruz | Training-free generic object detection in 2-d and 3-d using locally adaptive regression kernels |
| US20100223212A1 (en) | 2009-02-27 | 2010-09-02 | Microsoft Corporation | Task-related electronic coaching |
| US20100233663A1 (en) | 2009-03-10 | 2010-09-16 | Accenture Global Services Gmbh | Skills competency tool |
| ES2468795T3 (en) | 2009-07-09 | 2014-06-17 | Tomtom International B.V. | Navigation device and method for route calculation with temporary dependence |
| US20110161139A1 (en) | 2009-12-31 | 2011-06-30 | Accenture Global Services Gmbh | Capability Accelerator |
| US20130024249A1 (en) | 2010-04-08 | 2013-01-24 | Zeev El Asher Adin Zohar | Public transport optimization |
| US8972467B2 (en) | 2010-08-31 | 2015-03-03 | Sovanta Ag | Method for selecting a data set from a plurality of data sets by means of an input device |
| US20120066017A1 (en) | 2010-09-09 | 2012-03-15 | Siegel Paul E | System and Method for Utilizing Industry Specific Competencies to Maximize Resource Utilization |
| US9582908B2 (en) * | 2010-10-26 | 2017-02-28 | Inetco Systems Limited | Method and system for interactive visualization of hierarchical time series data |
| US9208231B1 (en) | 2010-12-01 | 2015-12-08 | Google Inc. | Identifying languages relevant to resources |
| US10853828B2 (en) | 2011-02-28 | 2020-12-01 | Flytxt B.V | Methods and systems for providing multivariate time series clustering for customer segmentation |
| US20130261965A1 (en) | 2011-03-31 | 2013-10-03 | Microsoft Corporation | Hub label compression |
| US8676730B2 (en) | 2011-07-11 | 2014-03-18 | Accenture Global Services Limited | Sentiment classifiers based on feature extraction |
| US9843488B2 (en) | 2011-11-07 | 2017-12-12 | Netflow Logic Corporation | Method and system for confident anomaly detection in computer network traffic |
| US8824337B1 (en) | 2012-03-14 | 2014-09-02 | Google Inc. | Alternate directions in hierarchical road networks |
| US8706416B2 (en) | 2012-04-03 | 2014-04-22 | Ford Global Technologies, Llc | System and method for determining a vehicle route |
| US9524473B2 (en) | 2012-08-31 | 2016-12-20 | Nutonian, Inc. | System and method for auto-query generation |
| JP5770753B2 (en) | 2013-01-15 | 2015-08-26 | グーグル・インコーポレーテッド | CJK name detection |
| US9436349B2 (en) * | 2013-03-12 | 2016-09-06 | Microsoft Technology Licensing, Llc | Business solution user interface enabling interaction with reports |
| US10205640B2 (en) | 2013-04-11 | 2019-02-12 | Oracle International Corporation | Seasonal trending, forecasting, anomaly detection, and endpoint prediction of java heap usage |
| US20160343263A9 (en) | 2013-05-03 | 2016-11-24 | Samsung Electronics Co., Ltd. | Computing system with learning platform mechanism and method of operation thereof |
| US20140358602A1 (en) | 2013-05-31 | 2014-12-04 | Compindex Limited | Methods, systems, and media for human capital analysis including gender gap |
| US20150012471A1 (en) | 2013-07-02 | 2015-01-08 | SenseGon Technologies Ltd. | System for user psychosocial profiling |
| US9426170B2 (en) | 2013-10-17 | 2016-08-23 | Adobe Systems Incorporated | Identifying target customers to stem the flow of negative campaign |
| US20150120608A1 (en) * | 2013-10-24 | 2015-04-30 | Lightkeeper LLC | Interactive multidimensional portfolio analysis |
| US10210548B1 (en) | 2013-11-25 | 2019-02-19 | Groupon, Inc. | Predictive recommendation system using absolute relevance |
| GB2541625A (en) | 2014-05-23 | 2017-02-22 | Datarobot | Systems and techniques for predictive data analytics |
| US10558924B2 (en) | 2014-05-23 | 2020-02-11 | DataRobot, Inc. | Systems for second-order predictive data analytics, and related methods and apparatus |
| US10496927B2 (en) | 2014-05-23 | 2019-12-03 | DataRobot, Inc. | Systems for time-series predictive data analytics, and related methods and apparatus |
| JP5967553B2 (en) | 2014-06-16 | 2016-08-10 | インターナショナル・ビジネス・マシーンズ・コーポレーションInternational Business Machines Corporation | Method for estimating purchase behavior of customer in store or between stores, and computer system and computer program thereof |
| US9398081B2 (en) | 2014-08-20 | 2016-07-19 | Futurewei Technologies, Inc. | Automating client development for network APIs |
| US10528589B2 (en) * | 2014-09-26 | 2020-01-07 | Oracle International Corporation | Cross visualization interaction between data visualizations |
| US20160171540A1 (en) | 2014-12-12 | 2016-06-16 | Suryanarayana MANGIPUDI | Dynamic Omnichannel Relevant Content And Services Targeting In Real Time |
| US10055084B2 (en) * | 2014-12-15 | 2018-08-21 | International Business Machines Corporation | Linking tag selections across multiple dashboards |
| US20160239768A1 (en) | 2015-02-13 | 2016-08-18 | Data Laboratories Limited | Human capital browser including interactive data visualization tools |
| WO2016147342A1 (en) | 2015-03-18 | 2016-09-22 | 三菱電機株式会社 | Information provision system |
| US9818043B2 (en) | 2015-06-24 | 2017-11-14 | Microsoft Technology Licensing, Llc | Real-time, model-based object detection and pose estimation |
| US20170116624A1 (en) | 2015-10-21 | 2017-04-27 | Revionics Inc. | Systems and methods for pricing optimization with competitive influence effects |
| CA3059699A1 (en) | 2016-04-11 | 2017-10-19 | Openmatters, Inc. | Universal business model scoring, classification, and decision-making engine |
| US20170344927A1 (en) | 2016-05-24 | 2017-11-30 | Accenture Global Solutions Limited | Skill proficiency system |
| US20180046987A1 (en) | 2016-08-15 | 2018-02-15 | Cangrade Inc. | Systems and methods of predicting fit for a job position |
| EP3309689A1 (en) | 2016-10-17 | 2018-04-18 | Tata Consultancy Services Limited | Systems and methods for selecting optimal variables using modified teaching learning based search optimization technique |
| US20190197605A1 (en) | 2017-01-23 | 2019-06-27 | Symphony Retailai | Conversational intelligence architecture system |
| US10375098B2 (en) | 2017-01-31 | 2019-08-06 | Splunk Inc. | Anomaly detection based on relationships between multiple time series |
| US20180253655A1 (en) | 2017-03-02 | 2018-09-06 | Linkedln Corporation | Skills clustering with latent representation of words |
| US10353958B2 (en) | 2017-03-20 | 2019-07-16 | Sap Se | Discriminative clustering |
| US10242473B2 (en) * | 2017-03-22 | 2019-03-26 | Sas Institute Inc. | Computer system to generate scalable plots using clustering |
| WO2018209254A1 (en) | 2017-05-11 | 2018-11-15 | Hubspot, Inc. | Methods and systems for automated generation of personalized messages |
| US10719539B2 (en) | 2017-06-06 | 2020-07-21 | Mastercard International Incorporated | Method and system for automatic reporting of analytics and distribution of advice using a conversational interface |
| WO2018236761A1 (en) | 2017-06-19 | 2018-12-27 | Vettd, Inc. | Systems and methods to determine and utilize semantic relatedness between multiple natural language sources to determine strengths and weaknesses |
| US20190066056A1 (en) | 2017-08-23 | 2019-02-28 | Atipica, Inc. | System and method for automated human resource management in business operations |
| US20190102841A1 (en) * | 2017-10-04 | 2019-04-04 | Servicenow, Inc. | Mapping engine configurations with task managed workflows and grid user interfaces |
| US11645541B2 (en) * | 2017-11-17 | 2023-05-09 | Adobe Inc. | Machine learning model interpretation |
| US10584973B2 (en) | 2017-12-14 | 2020-03-10 | International Business Machines Corporation | Personalized incentives leveraging incident-aware routing |
| JP6550448B2 (en) | 2017-12-18 | 2019-07-24 | ヤフー株式会社 | DATA MANAGEMENT DEVICE, DATA MANAGEMENT METHOD, AND PROGRAM |
| US20190188605A1 (en) * | 2017-12-20 | 2019-06-20 | At&T Intellectual Property I, L.P. | Machine Learning Model Understanding As-A-Service |
| US10824292B2 (en) * | 2018-01-18 | 2020-11-03 | Micro Focus Llc | Widget-of-interest identification |
| US10826776B2 (en) * | 2018-02-26 | 2020-11-03 | Servicenow, Inc. | Integrated continual improvement management |
| US11645356B2 (en) | 2018-09-04 | 2023-05-09 | International Business Machines Corporation | Deep learning for partial differential equation (PDE) based models |
| KR102148372B1 (en) | 2018-12-12 | 2020-08-26 | 건국대학교 산학협력단 | Apparatus and method for recognizing emotion based on voice |
| WO2021021328A2 (en) | 2019-06-14 | 2021-02-04 | Quantum Interface, Llc | Predictive virtual training systems, apparatuses, interfaces, and methods for implementing same |
| US11061650B2 (en) | 2019-06-27 | 2021-07-13 | Intel Corporation | Methods and apparatus to automatically generate code for graphical user interfaces |
-
2019
- 2019-09-27 JP JP2021517390A patent/JP2022503842A/en active Pending
- 2019-09-27 US US16/586,347 patent/US11367034B2/en active Active
- 2019-09-27 CN CN201980072248.XA patent/CN112970039A/en active Pending
- 2019-09-27 WO PCT/US2019/053576 patent/WO2020069393A1/en active Application Filing
Patent Citations (4)
| Publication number | Priority date | Publication date | Assignee | Title |
|---|---|---|---|---|
| CN102254017A (en) * | 2010-07-21 | 2011-11-23 | 微软公司 | Intelligent acquiescence for data visualization |
| US20120053995A1 (en) * | 2010-08-31 | 2012-03-01 | D Albis John | Analyzing performance and setting strategic targets |
| CN106575308A (en) * | 2014-09-26 | 2017-04-19 | 甲骨文国际公司 | Semantic distance-based assignment of data elements to visualization edges |
| US9911094B1 (en) * | 2017-05-11 | 2018-03-06 | International Business Machines Corporation | Intelligent key performance indicator catalog |
Also Published As
| Publication number | Publication date |
|---|---|
| WO2020069393A1 (en) | 2020-04-02 |
| US20200104775A1 (en) | 2020-04-02 |
| US11367034B2 (en) | 2022-06-21 |
| JP2022503842A (en) | 2022-01-12 |
Similar Documents
| Publication | Publication Date | Title |
|---|---|---|
| US11367034B2 (en) | Techniques for data-driven correlation of metrics | |
| US11921815B2 (en) | Techniques for the automated customization and deployment of a machine learning application | |
| US11263241B2 (en) | Systems and methods for predicting actionable tasks using contextual models | |
| US20220414545A1 (en) | Systems and methods for intelligently providing supporting information using machine-learning | |
| US20190102718A1 (en) | Techniques for automated signal and anomaly detection | |
| US9152947B2 (en) | Real-time social networking | |
| US11238409B2 (en) | Techniques for extraction and valuation of proficiencies for gap detection and remediation | |
| US20200097879A1 (en) | Techniques for automatic opportunity evaluation and action recommendation engine | |
| US11397873B2 (en) | Enhanced processing for communication workflows using machine-learning techniques | |
| US11386358B2 (en) | Intelligent decision support system | |
| US11521143B2 (en) | Supply chain disruption advisor | |
| US10636086B2 (en) | XBRL comparative reporting | |
| US9378270B2 (en) | Systems and methods for generating natural language insights about sets of data | |
| US20200159690A1 (en) | Applying scoring systems using an auto-machine learning classification approach | |
| US11790224B2 (en) | Machine learning from the integration flow metadata | |
| US20230039981A1 (en) | Identifying regulator and driver signals in data systems | |
| US11074533B1 (en) | System and method for creating an optimized actionable interface for data access and visualization | |
| US20150262107A1 (en) | Customer experience measurement system | |
| US20210264251A1 (en) | Enhanced processing for communication workflows using machine-learning techniques | |
| US20220207284A1 (en) | Content targeting using content context and user propensity | |
| US10417201B2 (en) | Systems and methods for adaptively identifying and mitigating statistical outliers in aggregated data | |
| CN116097244A (en) | Materialization of analytical workspaces | |
| US20210201237A1 (en) | Enhanced user selection for communication workflows using machine-learning techniques | |
| US10970795B2 (en) | Answer support systems for hybrid networks | |
| US11397614B2 (en) | Enhanced processing for communication workflows using machine-learning techniques |
Legal Events
| Date | Code | Title | Description |
|---|---|---|---|
| PB01 | Publication | ||
| PB01 | Publication | ||
| SE01 | Entry into force of request for substantive examination | ||
| SE01 | Entry into force of request for substantive examination |