Disclosure of Invention
In order to solve the problems, a method for optimizing a driving path according to the energy consumption of the pure electric vehicle is provided, and the driving path is reasonably planned through comprehensive consideration of the energy driving consumption of the pure electric vehicle and the energy consumption of the vehicle.
The invention discloses a method for optimizing a driving path according to the energy consumption of a pure electric vehicle, which obtains the driving energy consumption of the vehicle on each road section by overcoming the driving resistance through the running speed, the length and the gradient of the vehicle on each road section; acquiring hundred-kilometer energy consumption of an air conditioner, hundred-kilometer energy consumption of a low-voltage accessory and hundred-kilometer energy recovery of an energy recovery system through driving range tests in different environments, and calculating according to the total mileage of a recommended path to obtain vehicle energy consumption; and comparing the energy which can be emitted by the battery with the total energy consumption, and reasonably planning a driving path.
In a preferred embodiment of the present invention,
(1) dispersing the road sections from the starting position to the ending position into n road sections, and calculating the length of each road section (parameters such as road gradient and the like, and accessing the road network information system for obtaining the length);
(2) predicting the driving speed of each road section (accessing a big data system and sequencing the speeds);
(3) predicting the running resistance;
(4) and calculating the work consumed by overcoming the driving resistance of each road section, thereby obtaining the total work done on the recommended path to overcome the driving resistance.
In a preferred embodiment of the present invention,
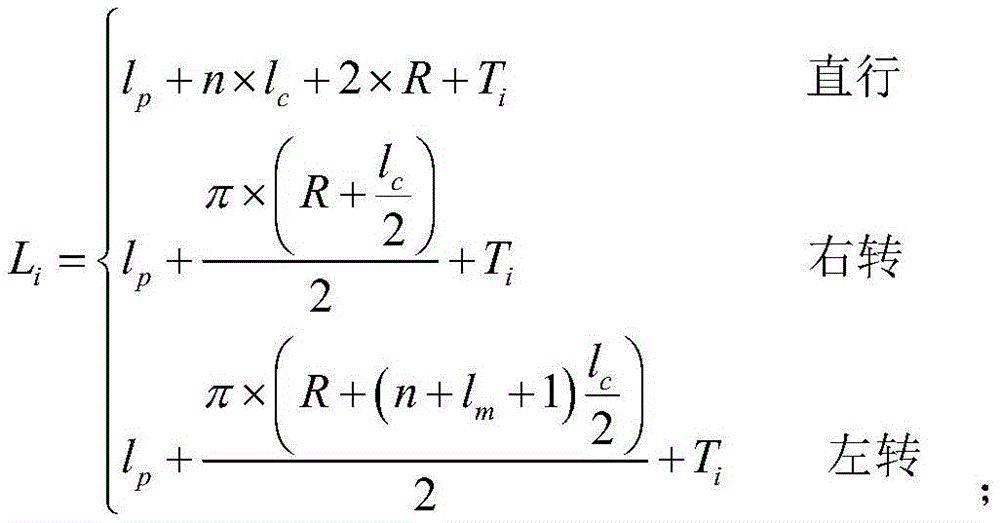
(1) the link numbers are numbered in sequence from the first link of the recommended route, the link numbers are respectively 1,2 and 3 … i … n, n is the last link of the recommended route, and the link length is LiRepresenting the distance traveled from the sidewalk of section i-1 to the sidewalk of section i, each lane width lcWidth of sidewalk lpRadius of curve R, length of straight line section of roadiNumber of lanes n, width of isolation belt lmThe running of the sample vehicle is divided into straight running, left turning and right turning, and the length expression of each road section is as follows:
in a preferred embodiment of the present invention,
(2) the speed predicting unit predicts the running speed of the vehicle on each road section in the recommended path, simplifies the whole process into an acceleration stage, a constant speed stage and a deceleration stage, and has the following speed expression,
in the curve, the link number i and the length L of the link ii85 th percentile speed V of road section i85i,V85iAverage acceleration a of a road section i as a desired speed of a vehicle traveling on the road sectionaiAverage deceleration a of the link ibiRoad surface gradient alphai。
In a preferred embodiment of the present invention,
(3) the total driving resistance equation to be overcome when the automobile is driven on a slope is as follows: fr=Ff+Fw+Fi+Fj,
The equation for the total driving resistance to be overcome when the vehicle is driving on a horizontal road is as follows, Fh=Ff+FwWherein: ffTo rolling resistance, FwAs air resistance, FiAs slope resistance, FjIs acceleration resistance;
the method adopts the automobile running resistance under different atmospheric temperatures and standard tire pressures to replace rolling resistance and air resistance, and pre-stores a plurality of sliding curves in an energy consumption prediction unit before the automobile leaves the factory, wherein the sliding curves are quadratic equations F of speedhi=f2hi×Vi 2+f1hi×Vi+f0hiWherein: f. of2hiIs the road load quadratic term coefficient in the temperature interval i; f. of1hiIs a road load first-order coefficient in the temperature interval i; f. of0hiA road load constant item in the temperature interval i; f. of2hi、 f1hi、f0hiFitting by a least square method to obtain;
the ramp resistance calculation formula: fii=m×g×sinαi=(mc+65×n)×g×sinαiWherein m is the total mass of the automobilecPre-storing the automobile quality in an energy consumption prediction unit before the automobile leaves a factory; n is the number of passengers and is calculated according to 65kg of each adult; g is gravity acceleration, and is 9.8m/s2,αiIs the road surface gradient, alphaiMore than or equal to 1 percent of the total weight is considered to be driving on a slope, alphaiLess than 1% is considered as no slope resistance;
an acceleration resistance calculation formula:
delta is the conversion coefficient of rotating mass of the automobile, in the pure electric automobile
Wherein: m is the vehicle mass, I
WIs the rotational inertia of the wheel, r is the radius of the wheel, the wheel is recorded into an energy consumption prediction unit for storage after measurement before delivery,
the running resistance calculation formula is as follows:
in a preferred embodiment of the present invention,
(4) in the calculation of the work done on the section i against the driving resistance
Total work done to overcome driving resistance on recommended path
In a preferred embodiment of the present invention,
(1) defining the environment temperature as a high-temperature working condition when the environment temperature is 23-41 ℃, and testing the air compressor to obtain hundred kilometers of energy consumption;
(2) testing PTC or other heating equipment to obtain hundred kilometers of energy consumption under the low-temperature working condition;
(3) predicting the energy consumption of low-voltage electric equipment;
(4) calculating system efficiency etatEfficiency η of the motorm(ii) a Efficiency eta of speed reducerg(ii) a DCDC efficiency ηdAll can be obtained by testing parts. Efficiency η of the systemT=ηm×ηg×ηd。
In a preferred embodiment of the present invention,
judging the energy of the battery to be compared with the total energy consumption, and acquiring the current state of charge (SOC) of the battery
cFrom the battery management system
Obtaining depth of discharge from battery technology parameters
Residual battery energy W
b = (SOC
c-SOC
d) × Q ×η
T × SoH × C
tempWherein Q is the new cell capacity, C
tempThe battery temperature correction coefficient is determined by a battery characteristic test; the SoH is the relation between the battery health state and the battery charge-discharge cycle times, the relation between the SoH and the charge-discharge cycle times is determined by a battery test, the SoH of the current battery is obtained from a battery management system, and if W is in a high-temperature environment
b>∑W
r+W
g+W
lOr W in a low temperature environment
b>∑W
r+W
d+W
lThis can reach the destination without charging in the middle; if W is in high temperature environment
b≤∑W
r+W
g+W
lOr W in a low temperature environment
b≤∑W
r+W
d+W
lAnd if so, re-planning the path, searching for charging pile resources, and continuing to drive after completing power supplement until the destination is reached.
In a preferred embodiment of the present invention,
and in the running process, the road network information is refreshed every 2 minutes, the predicted speed and the congestion condition of each road section are adjusted in time, and whether charging is needed in the way is predicted.
The invention also discloses a pure electric vehicle which comprises an energy consumption module, a battery residual energy acquisition module, a residual electric quantity and energy consumption prediction comparison module and an instrument board, wherein the energy consumption module comprises a speed prediction unit, a driving resistance prediction unit, a low-voltage energy consumption prediction unit and an air conditioner energy consumption prediction unit, the energy consumption module and the battery residual energy acquisition module are electrically connected with the residual electric quantity and energy consumption prediction comparison module and the instrument board, and the residual electric quantity and energy consumption prediction comparison module and the instrument board are electrically connected with the instrument board.
The invention has the beneficial technical effects that: according to the technical scheme, the energy consumption of the automobile running resistance, the energy consumption of an air conditioner, the energy consumption of low-voltage accessories and the energy recovered by an energy recovery system are considered when the energy consumption rate is predicted. By comparing the energy which can be emitted by the battery with the total energy consumed by the battery, whether the battery needs to be charged in the driving path is judged, the scheme can help a driver to reasonably plan the driving path, and the condition of anchoring or speed limitation caused by energy consumption prediction errors is avoided.
Detailed Description
The patent is described in further detail below with reference to the drawings and the specific examples, which are not intended to limit the patent, so as to facilitate the understanding of the patent.
The invention discloses a method for optimizing a driving path according to energy consumption of a pure electric vehicle, which is characterized by comprising the following steps of: acquiring the running energy consumed by the vehicle on each road section to overcome the running resistance through the running speed, the length and the gradient of the vehicle on each road section; acquiring hundred-kilometer energy consumption of an air conditioner, hundred-kilometer energy consumption of a low-voltage accessory and hundred-kilometer energy recovery of an energy recovery system through driving range tests in different environments, and calculating according to the total mileage of a recommended path to obtain vehicle energy consumption; and comparing the energy which can be emitted by the battery with the total energy consumption, and reasonably planning a driving path.
According to the technical scheme, the running resistance (including rolling resistance, air resistance, gradient resistance and acceleration resistance) of the automobile is calculated by acquiring the running speed, the road section length and the road section gradient of the automobile on each road section, and then the work done for overcoming the running resistance is calculated.
Through driving range tests in different environments, hundred kilometers of energy consumption of an air conditioner (a compressor enters a PTC), hundred kilometers of energy consumption of low-voltage accessories (light, a wiper, a vehicle machine and other systems) and hundred kilometers of an energy recovery system are obtained, and then the total energy consumption is calculated according to the total mileage of a recommended path.
And reasonably planning a driving path by comparing the energy which can be emitted by the battery with the energy which needs to be consumed.
The method comprises the following specific steps:
step one, a driver sets a navigation destination in a car machine system navigation unit or a mobile phone navigation app in a voice or text mode, and a map supplier automatically retrieves a recommended path through an internal algorithm.
Step two, the road information acquisition unit acquires information of each road section including a road section number i and a road section i length L through a map database and a Global Positioning System (GPS)i(m) 85 th percentile speed V of road section i85i(km/h),V85iAverage acceleration a of a road section i as a desired speed of a vehicle traveling on the road sectionai(m/s2) Average deceleration a of the link ibi(m/s2) Road surface gradient alphai(rad)(αiTravel on a hill is considered > 1%).
And thirdly, numbering the road sections in sequence from the first road section of the recommended route, wherein the road section numbers are respectively 1,2 and 3 … i … n, and n is the last road section of the recommended route. Road section length LiRepresenting the distance traveled from the sidewalk of section i-1 to the sidewalk of section i, e.g. FIG. 2, each lane width lcWidth of sidewalk lpRadius of curve R, length of straight line section of roadiNumber of lanes n, width of isolation belt lmThe running of the sample vehicle is divided into straight running, left turning and right turning, and the length expression of the road section in each case is as follows
If complex roads such as turning around and roundabouts with multiple exits are encountered, the length L of the road section can be calculated by referring to the methodi
Step four, the speed prediction unit predicts the driving speed of the vehicle on each road section in the recommended path, and simplifies the whole process into an acceleration stage, a constant speed stage and a deceleration stage, as shown in fig. 3, for example, when the vehicle starts when the red light is changed into the green light, the vehicle starts to start by average acceleration aaiAccelerating to reach V running speed85iThen running at constant speed, and approaching the end of the road section at average deceleration abiAnd (5) decelerating, and stopping at the end of the road section to wait for a red light. The velocity expression is as follows:
step five, predicting the driving resistance, wherein when the automobile runs on a road, the rolling resistance from the ground and the air resistance from the air must be overcome, when the automobile runs on a ramp, the component force of gravity along the ramp needs to be overcome, and when the automobile accelerates, the acceleration resistance also needs to be overcome, so that the total driving resistance equation of the automobile running is as follows: fr=Ff+Fw+Fi+FjWherein: ffIs rolling resistance (N); fwIs the air resistance (N); fiIs the slope resistance (N); fjIs the acceleration resistance (N).
Step six, the road sliding resistance reflects the resistance which needs to be overcome in the process of the uniform speed running of the whole vehicle on a horizontal road, and comprises air resistance, rolling resistance and mechanical resistance Fh=Ff+Fw+Fη,FηFor the mechanical resistance of the drive train (where the drive train comprises the gearbox, the drive shaft, the brake caliper and the bearings), where the mechanical resistance is neglected, Fh=Ff+Fw。
Step seven, the invention adopts the automobile running resistance under different atmospheric temperatures and standard tire pressures to replace rolling resistance and air resistance, a plurality of sliding curves are prestored in an energy consumption prediction unit before the automobile leaves a factory, as shown in fig. 4, according to the limit value of emission of light automobile pollutants of GB 18352.6-2017 and the measuring method of the sliding resistance in the sixth stage of China, the sliding resistance curve under the temperature range of-30 ℃ to 40 ℃ is prestored according to the step length of 5 ℃, the sliding resistance curve under the temperature conditions of-30 ℃, 25 ℃, … … 35 ℃ and 40 ℃ is used as the sliding resistance curve under the temperature range of-30 ℃ to 25 ℃, and the like under other temperature conditions.
Step eight, the sliding curve can be expressed as a quadratic equation F of the speedhi=f2hi×Vi 2+f1hi×Vi+f0hiWherein: f. of2hiIs the road load quadratic term coefficient in the temperature interval i; f. of1hiIs a road load first-order coefficient in the temperature interval i; f. of0hiA road load constant item in the temperature interval i; f. of2hi、f1hi、f0hiObtained by least squares fitting.
Step nine, calculating the ramp resistance Fii=m×g×sinαi=(mc+65×n)×g×sinαiWherein m is total mass (kg) of the automobile, mcThe automobile mass (kg) is pre-stored in an energy consumption prediction unit before the automobile leaves a factory; n is the number of passengers and is calculated according to 65kg of each adult; g is gravity acceleration, and is 9.8m/s2,αiIs the road surface gradient, alphaiMore than or equal to 1 percent of the total weight is considered to be driving on a slope, alphaiNo grade resistance was considered < 1%.
Step ten, calculating the acceleration resistance
Delta is the conversion coefficient of rotating mass of the automobile, in the pure electric automobile
Wherein: m is vehicle mass (kg), I
WIs the moment of inertia (kg. m) of the wheel
2) And r is the radius (m) of the wheel, and the radius is recorded into an energy consumption prediction unit for storage after measurement before delivery of the automobile.
Step eleven, calculating the running resistance of the automobile
Step twelve, calculating the work done on the road section i to overcome the driving resistance
Total work done to overcome driving resistance on recommended path
Step thirteen, when the environment temperature is 23-41 ℃, the environment temperature is defined as a high-temperature working condition, the air-conditioning compressor is a main energy consumption device, and if the vehicle is provided with an energy recovery system, the system charges the power battery when the vehicle is braked. The power of an air conditioner compressor is related to the temperature in the vehicle, the ambient temperature, the vehicle area and the sunlight radiation intensity, the factors such as the temperature, the humidity and the illumination intensity of a main sales area are simulated in an environmental chamber, a chassis dynamometer is tested by adopting the CLTC-P working condition according to GB/T38146.1-2019 regulations, 3 cycles are carried out according to each working condition, and the current and the voltage of a measuring point 1, a measuring point 2 and a measuring point 3 in the test process are recorded as shown in figure 4.
Fourteen, under the temperature conditions of 26 + -3 ℃, 32 + -3 ℃ and 38 + -3 ℃, 3 cycles of CLTC-P were performed at each temperature, and the energy of the air-conditioning and energy recovery components was recorded using Table 1. For example: the highest temperature of 38 ℃ in summer in the vehicle kingpin area and the illumination intensity of 850 +/-45W/m2Before the vehicle leaves the factory, a high-temperature test is carried out in an environmental chamber under the temperature condition of (38 +/-3) DEG C; before the high-temperature test, the vehicle should be immersed in the normal-temperature environment at (25 +/-5) DEG C for 12-15 hours, then immersed in the high-temperature environment for 0.5-1.0 hour, and the illumination intensity is kept at 850 +/-45W/m during the test process and the immersion period2. When the test cycle begins, the air conditioner is set to an internal circulation blowing mode, so that the average temperature of the test points in the vehicle reaches below 25 ℃ as soon as possible, and then the test points are kept in the range of not higher than 25 ℃ and not lower than 23 ℃ until the test is finished.
Step fifteen, in the testing process, the output voltage and current of the power battery at the measuring point 1 and the input voltage U of the power battery at the measuring point 2 are recorded in the whole processrAnd current IrMeasuring point 3 compressor input voltage UcAnd current Ic(ii) a Calculating the compressor power W by recording the current and voltage values during the whole testci=∫Ici×Ucidt, calculating the energy recovery W by recording the current and voltage values throughout the testri=∫Iri×Uridt where i is 1,2, 3
Hourly power consumption of compressor
Wherein T is
iThe time (h) of the ith cycle is 0.5h per cycle period.
Energy consumption of high-pressure system in high-temperature driving process
Power unit kw h
TABLE 1
| Number of cycles
|
Compressor power
|
Power of energy recovery
|
| 1
|
Wc1=∫Ic1×Uc1dt
|
Wr1=∫Ir1×Ur1dt
|
| 2
|
Wc2=∫Ic2×Uc2dt
|
Wr2=∫Ir2×Ur2dt
|
| 3
|
Wci=∫Ici×Ucidt
|
Wr3=∫Ir3×Ur3dt |
The ambient temperature of the day is obtained by an ambient temperature sensor, and then the temperature is judged to be matched with which test temperature interval, for example, the energy consumption of the compressor measured in the environment of 38 +/-3 ℃ is adopted when the ambient temperature is 40 DEG C
Sixthly, under the low-temperature working condition, the PTC or other heating equipment is main energy consumption equipment, and meanwhile, if the vehicle is provided with an energy recovery system, the system charges a battery when the vehicle is braked. The PTC or other heating equipment is related to the temperature in the vehicle, the ambient temperature and the recognition of passengers, the factors such as the temperature and the humidity of a main sales area are simulated in the environmental chamber, the CLTC-P cycle is adopted on the chassis dynamometer for testing according to the specified CLTC-P working conditions of GB/T38146.1-2019, 3 cycles are carried out according to each working condition, and the current and the voltage of a measuring point 1, a measuring point 2 and a measuring point 4 in the test process are recorded as shown in figure 4.
Seventhly, performing 3 cycles of CLTC-P at the temperature range of-27 +/-3 ℃, 21 +/-3 ℃, 15 +/-3 ℃, 9 +/-3 ℃, 3 +/-3 ℃, 9 +/-3 ℃ and 15 +/-3, and recording the energy of the air conditioner and the energy recovery part by using the table 1. For example, in the low-temperature driving range test, the low-temperature test is carried out under the temperature condition of minus 9 +/-3 ℃, before the low-temperature test, the vehicle should be immersed in the environment of minus 9 +/-3 ℃ for 12-15 hours, and when the test cycle starts, the air conditioner needs to be set to an outer cycle and foot blowing mode, so that the average temperature of the test points in the vehicle reaches more than 20 ℃ as soon as possible, and then the test temperature is kept in the range of not higher than 22 ℃ and not lower than 20 ℃ as far as possible until the test finishes.
Eighteen, recording the output voltage and current of the power battery at the
measuring point 1 and the input voltage U of the power battery at the
measuring point 2 in the whole process in the testing process
rAnd current I
rMeasuring the voltage U of a PTC or other heat source
hAnd current I
h(ii) a Calculating power of PTC or other heating equipment by recording current and voltage values in the whole test process
Generating power by calculating braking energy recovery system
PTC hourly power consumption
Wherein T is
iThe time (h) of the ith cycle is 0.5h per cycle period.
High-pressure accessory energy consumption in low-temperature driving process
TABLE 2
| Number of cycles
|
PTC power
|
Power of energy recovery
|
| 1
|
Wp1=∫Ip1×Up1dt
|
Wr1=∫Ir1×Ur1dt
|
| 2
|
Wp2=∫Ip2×Up2dt
|
Wr2=∫Ir2×Ur2dt
|
| 3
|
Wp3=∫Ip3×Up3dt
|
Wr3=∫Ir3×Ur3dt |
The ambient temperature of the day is obtained through an ambient temperature sensor, and then the temperature is judged to be matched with which test temperature interval, for example, PTC energy consumption measured in an environment of minus 9 +/-3 ℃ is adopted when the ambient temperature is minus 8 ℃.
Nineteen steps are that the energy consumption of the low-voltage electric equipment is predicted, and the electric system can be divided into several load conditions shown in table 3 according to the conditions of the vehicle in the use process. The method can measure the consumption of low-voltage electric equipment according to the following 4 load conditions when measuring the load of a high-voltage system, simulate the conditions of night and rain by starting a wiper, lamplight and the like, test the CLTC-P working condition at the temperature of 25 +/-3 ℃ according to the specified CLTC-P working conditions of GB/T38146.1-2019, perform 3 cycles according to the 4 load conditions respectively, measure the current and the voltage of the DCDC output end of a measuring point 4, and calculate the energy recovery energy W
li=∫I
li×U
lidt, total energy consumption for low voltage load
Low voltage load hourly power consumption
Wherein T is
iThe time (h) of the ith cycle is 0.5h per cycle period.
Energy consumption of low-voltage component in driving process
And judging which state the low-voltage load is in by acquiring the current weather and time, and acquiring the total energy consumption of the low-voltage load.
TABLE 3 usage of electric devices under different loads
Twenty, calculating the system efficiency etatEfficiency η of the motorm(ii) a Efficiency eta of speed reducerg(ii) a DCDC efficiency ηdAll can be obtained by testing parts. Efficiency η of the systemT=ηm×ηg×ηd
Step (ii) ofTwenty one, judging the comparison between the battery energy and the loss energy, and acquiring the current state of charge (SOC) of the batteryc(State of Charge State, SOC), from the current SOC in the battery management systemcObtaining the discharging depth SOC through the technical parameters of the batterydResidual battery energy Wb=(SOCc-SOCd)×Q×ηT×SoH×CtempWherein Q is the new battery capacity (kw.h), CtempThe battery temperature correction coefficient is determined by a battery characteristic test; SoH is the State of Health (SoH) of the battery and is related to the charge and discharge cycle number of the battery, the relationship between the SoH and the charge and discharge cycle number can be determined by a battery test, the SoH of the current battery is obtained from a battery management system, and if W is in a high-temperature environmentb>∑Wr+Wg+WlOr W in a low temperature environmentb>∑Wr+Wd+WlThis can reach the destination without charging in the middle; if W is in high temperature environmentb≤∑Wr+Wg+WlOr W in a low temperature environmentb≤∑Wr+Wd+WlAnd if so, re-planning the path, searching for charging pile resources, and continuing to drive after completing power supplement until the destination is reached.
And twenty-two, refreshing road network information every 2 minutes in the driving process, adjusting the predicted speed and congestion condition of each road section in time, and predicting whether charging is needed in the way according to the steps from one step to twenty-three.
The invention further discloses a pure electric vehicle which comprises an energy consumption module, a battery residual energy acquisition module, a residual electric quantity and energy consumption prediction and comparison module and an instrument board, wherein the energy consumption module comprises a speed prediction unit, a driving resistance prediction unit, a low-voltage energy consumption prediction unit and an air conditioner energy consumption prediction unit, the energy consumption module and the battery residual energy acquisition module are electrically connected with the residual electric quantity and energy consumption prediction and comparison module and the instrument board, and the residual electric quantity and energy consumption prediction and comparison module and the instrument board are electrically connected with the instrument board.
It will be apparent to those skilled in the art that various changes and modifications may be made in the present invention without departing from the spirit and scope of the invention. Thus, if such modifications and variations of the present invention fall within the scope of the claims of the present invention and their equivalents, the present invention is also intended to include such modifications and variations.