CN111488552B - Close-proximity multi-target tracking method based on Gaussian mixture probability hypothesis density - Google Patents
Close-proximity multi-target tracking method based on Gaussian mixture probability hypothesis density Download PDFInfo
- Publication number
- CN111488552B CN111488552B CN202010332381.9A CN202010332381A CN111488552B CN 111488552 B CN111488552 B CN 111488552B CN 202010332381 A CN202010332381 A CN 202010332381A CN 111488552 B CN111488552 B CN 111488552B
- Authority
- CN
- China
- Prior art keywords
- gaussian component
- gaussian
- target
- expression
- component
- Prior art date
- Legal status (The legal status is an assumption and is not a legal conclusion. Google has not performed a legal analysis and makes no representation as to the accuracy of the status listed.)
- Active
Links
Images


Classifications
-
- G—PHYSICS
- G06—COMPUTING OR CALCULATING; COUNTING
- G06F—ELECTRIC DIGITAL DATA PROCESSING
- G06F17/00—Digital computing or data processing equipment or methods, specially adapted for specific functions
- G06F17/10—Complex mathematical operations
- G06F17/16—Matrix or vector computation, e.g. matrix-matrix or matrix-vector multiplication, matrix factorization
-
- G—PHYSICS
- G06—COMPUTING OR CALCULATING; COUNTING
- G06F—ELECTRIC DIGITAL DATA PROCESSING
- G06F17/00—Digital computing or data processing equipment or methods, specially adapted for specific functions
- G06F17/10—Complex mathematical operations
- G06F17/18—Complex mathematical operations for evaluating statistical data, e.g. average values, frequency distributions, probability functions, regression analysis
-
- Y—GENERAL TAGGING OF NEW TECHNOLOGICAL DEVELOPMENTS; GENERAL TAGGING OF CROSS-SECTIONAL TECHNOLOGIES SPANNING OVER SEVERAL SECTIONS OF THE IPC; TECHNICAL SUBJECTS COVERED BY FORMER USPC CROSS-REFERENCE ART COLLECTIONS [XRACs] AND DIGESTS
- Y02—TECHNOLOGIES OR APPLICATIONS FOR MITIGATION OR ADAPTATION AGAINST CLIMATE CHANGE
- Y02D—CLIMATE CHANGE MITIGATION TECHNOLOGIES IN INFORMATION AND COMMUNICATION TECHNOLOGIES [ICT], I.E. INFORMATION AND COMMUNICATION TECHNOLOGIES AIMING AT THE REDUCTION OF THEIR OWN ENERGY USE
- Y02D30/00—Reducing energy consumption in communication networks
- Y02D30/70—Reducing energy consumption in communication networks in wireless communication networks
Landscapes
- Engineering & Computer Science (AREA)
- Physics & Mathematics (AREA)
- General Physics & Mathematics (AREA)
- Data Mining & Analysis (AREA)
- Mathematical Physics (AREA)
- Mathematical Analysis (AREA)
- Theoretical Computer Science (AREA)
- Mathematical Optimization (AREA)
- Pure & Applied Mathematics (AREA)
- Computational Mathematics (AREA)
- Algebra (AREA)
- Databases & Information Systems (AREA)
- Software Systems (AREA)
- General Engineering & Computer Science (AREA)
- Computing Systems (AREA)
- Life Sciences & Earth Sciences (AREA)
- Bioinformatics & Cheminformatics (AREA)
- Bioinformatics & Computational Biology (AREA)
- Evolutionary Biology (AREA)
- Operations Research (AREA)
- Probability & Statistics with Applications (AREA)
- Radar Systems Or Details Thereof (AREA)
Abstract
本发明公开了一种基于高斯混合概率假设密度的紧邻多目标跟踪方法,包括如下步骤:增加标签和历史状态矩阵为辅助参数构建目标的新标准描述集;初始化目标概率假设密度、目标标签集及目标历史状态矩阵集;根据新生目标和存活目标的概率假设密度、标签集、历史状态矩阵集计算目标预测概率假设密度、目标预测标签集、目标预测历史状态矩阵集;基于量测集计算目标后验概率假设密度、目标后验标签集和目标后验历史状态矩阵集,重分配目标后验概率假设密度中各高斯分量的权值;变换目标的高斯分量集及参数集,约简变换后的高斯分量集;估计目标的状态和数目;若跟踪单一时刻则跟踪结束;若跟踪若干时刻则迭代所有时刻。本发明有良好的跟踪性能和鲁棒性。

The invention discloses a method for tracking multiple targets in close proximity based on Gaussian mixture probability hypothesis density, comprising the following steps: adding labels and historical state matrices as auxiliary parameters to construct a new standard description set for the target; initializing the target probability hypothesis density, target label set and Target historical state matrix set; Calculate the target prediction probability hypothesis density, target prediction label set, target prediction historical state matrix set based on the probability hypothesis density, label set, and historical state matrix set of newborn targets and surviving targets; calculate the target based on the measurement set The posterior probability hypothesis density, the target posterior label set and the target posterior historical state matrix set, redistribute the weight of each Gaussian component in the target posterior probability hypothesis density; transform the Gaussian component set and parameter set of the target, and reduce the transformed Gaussian component set; estimate the state and number of targets; if tracking a single moment, the tracking ends; if tracking several moments, iterate over all moments. The invention has good tracking performance and robustness.
Description
技术领域technical field
本发明属于智能信息处理技术领域,具体涉及一种基于高斯混合概率假设密度的紧邻多目标跟踪方法。The invention belongs to the technical field of intelligent information processing, and in particular relates to a method for tracking multiple targets in close proximity based on Gaussian mixture probability hypothesis density.
背景技术Background technique
近年来,基于有限集统计理论的概率假设密度(Probability hypothesisdensity,PHD)滤波器因无需复杂的数据关联过程,极大地降低了计算复杂度,引起了多目标跟踪领域学者的广泛关注。In recent years, the Probability hypothesis density (PHD) filter based on finite set statistics theory has greatly reduced the computational complexity because it does not require complex data association process, which has attracted extensive attention from scholars in the field of multi-target tracking.
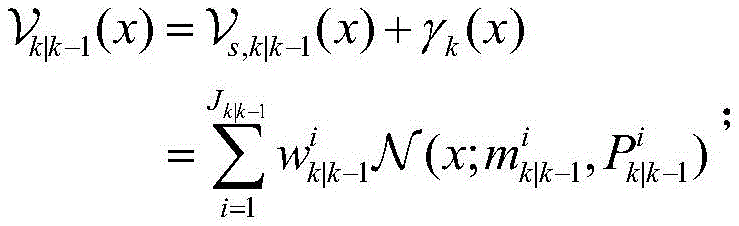
PHD滤波器是多目标贝叶斯滤波器的一种近似方法,它在每一时刻传递的并不是目标的完全后验密度,而是目标的概率假设密度(目标完全后验密度的一阶统计矩),目标状态及数目从该目标概率假设密度中获取。然而,PHD滤波器迭代过程无法直接求得闭合解。线性高斯动态系统中,PHD滤波器的闭合解可以采用高斯混合方式来实现,即利用多个高斯分量的加权和来近似目标概率假设密度,这种方法称为GM-PHD滤波器。该滤波器的递推过程如下:The PHD filter is an approximation method of the multi-objective Bayesian filter. What it transmits at each moment is not the complete posterior density of the target, but the probability hypothesis density of the target (the first-order statistics of the complete posterior density of the target moment), the target state and number are obtained from the target probability hypothesis density. However, the iterative process of the PHD filter cannot directly obtain the closed solution. In a linear Gaussian dynamic system, the closed solution of the PHD filter can be realized by Gaussian mixture, that is, the weighted sum of multiple Gaussian components is used to approximate the target probability hypothesis density. This method is called GM-PHD filter. The recursive process of the filter is as follows:
预测步:k-1时刻,假设目标概率假设密度

式中,


k时刻,目标预测概率假设密度

式中,


更新步:利用k时刻量测集Zk更新目标预测概率假设密度


式中,pd表示检测概率,

式中,Jk|k-1表示用k时刻高斯分量的预测数目,


式中,


目前,基于高斯混合(Gaussian mixture,GM)近似方式的概率假设密度滤波方法已经在实际应用中得到验证。杂波跟踪环境下,GM-PHD滤波器因具有较高迭代效率及状态提取方便等优势,被广泛用于线性高斯动态模型的目标跟踪系统。然而,基于PHD滤波的多目标跟踪方法是假设跟踪场景中目标之间的距离较远,即目标间不存在相互干扰;但真实跟踪环境下,多个目标为了实现相互协同工作,这些目标间的距离通常可能非常小,即紧邻目标(交叉运动的目标和平行运动的目标)。当跟踪场景中的多个目标相互接近或保持近距离运动状态时,基于PHD滤波的多目标跟踪方法便不能正确地区分出源于每个目标自身的真实量测,导致部分目标被错误更新和漏估计,因此,该类方法的目标状态及数目估计精度较低。此外,如果跟踪场景中的杂波均值较大且检测概率较低时,该类方法的滤波精度将进一步下降。At present, the probability hypothesis density filtering method based on the Gaussian mixture (Gaussian mixture, GM) approximation method has been verified in practical applications. In the clutter tracking environment, the GM-PHD filter is widely used in the target tracking system of the linear Gaussian dynamic model because of its advantages of high iteration efficiency and convenient state extraction. However, the multi-target tracking method based on PHD filtering assumes that the distance between the targets in the tracking scene is relatively long, that is, there is no mutual interference between the targets; The distances can often be very small, ie in close proximity to targets (cross-moving targets and parallel-moving targets). When multiple targets in the tracking scene are close to each other or keep moving at close range, the multi-target tracking method based on PHD filtering cannot correctly distinguish the real measurement from each target itself, resulting in some targets being updated incorrectly and Therefore, the target state and number estimation accuracy of this type of method is low. In addition, if the average value of clutter in the tracking scene is large and the detection probability is low, the filtering accuracy of this type of method will be further reduced.
发明内容Contents of the invention
针对平行运动目标场景中基于PHD滤波的多目标跟踪方法的目标状态及数目估计精度较低的问题,本发明提出了一种基于高斯混合概率假设密度的紧邻多目标跟踪方法,采用紧邻多目标高斯混合概率假设密度(MCST-GM-PHD)解决了密集杂波、较低检测概率跟踪环境下的平行运动目标跟踪问题。Aiming at the problem of low target state and number estimation accuracy of the multi-target tracking method based on PHD filtering in the parallel moving target scene, the present invention proposes a close-by multi-target tracking method based on Gaussian mixture probability hypothesis density, using the close-by multi-target Gaussian Mixed Probabilistic Hypothesis Density (MCST-GM-PHD) solves the problem of parallel moving target tracking in dense clutter and low detection probability tracking environment.
为解决以上技术问题,本发明所采用的技术方案如下:In order to solve the above technical problems, the technical scheme adopted in the present invention is as follows:
一种基于高斯混合概率假设密度的紧邻多目标跟踪方法,包括如下步骤:A method for tracking multiple targets in close proximity based on Gaussian mixture probability hypothesis density, comprising the following steps:
S1,增加高斯分量的标签和历史状态矩阵为辅助参数以构建用于表示目标的高斯分量的新标准描述集;S1, adding the label of the Gaussian component and the historical state matrix as auxiliary parameters to construct a new standard description set for the Gaussian component representing the target;
S2,初始化目标概率假设密度、目标标签集及目标历史状态矩阵集;S2, initialize the target probability hypothesis density, the target label set and the target historical state matrix set;
S3,根据新生目标的概率假设密度、标签集、历史状态矩阵集和存活目标的预测概率假设密度、预测标签集、预测历史状态矩阵集,计算目标预测概率假设密度、目标预测标签集、目标预测历史状态矩阵集;S3, according to the probability hypothesis density, label set, historical state matrix set of the newborn target, and the predicted probability hypothesis density, predicted label set, and predicted historical state matrix set of the surviving target, calculate the target prediction probability hypothesis density, target prediction label set, and target prediction Historical state matrix set;
S4,基于量测集计算目标后验概率假设密度、目标后验标签集和目标后验历史状态矩阵集,重分配目标后验概率假设密度中各高斯分量的权值;S4. Calculate the target posterior probability hypothesis density, the target posterior label set and the target posterior historical state matrix set based on the measurement set, and redistribute the weights of each Gaussian component in the target posterior probability hypothesis density;
S5,对目标的高斯分量集及其参数集进行变换,并对变换后的高斯分量集进行约简;S5, transforming the target Gaussian component set and its parameter set, and reducing the transformed Gaussian component set;
S6,估计目标的状态和数目;S6, estimating the state and number of targets;
S7,若跟踪单一时刻,则目标跟踪结束;若跟踪若干个时刻,则重复执行S3-S6直至迭代所有时刻。S7. If a single moment is tracked, the target tracking ends; if several moments are tracked, S3-S6 is repeatedly executed until all moments are iterated.
在步骤S1中,所述表示目标的高斯分量的新标准描述集的表达式为:In step S1, the expression of the new standard description set representing the Gaussian component of the target is:
o={w,m,P,l,χ};o={w,m,P,l,χ};
式中,w表示高斯分量的权值,m表示高斯分量的均值,P表示高斯分量的协方差矩阵,l表示高斯分量的标签,χ表示高斯分量的历史状态矩阵;In the formula, w represents the weight of the Gaussian component, m represents the mean value of the Gaussian component, P represents the covariance matrix of the Gaussian component, l represents the label of the Gaussian component, and χ represents the historical state matrix of the Gaussian component;
k时刻的高斯分量的历史状态矩阵χk的表达式为:The expression of the historical state matrix χ k of the Gaussian component at time k is:
χk=[mk-δ+1,...,mk-1,mk];χ k =[m k-δ+1 ,...,m k-1 ,m k ];
式中,δ表示传感器所设定的历史状态矩阵中的元素数目阈值。In the formula, δ represents the threshold number of elements in the historical state matrix set by the sensor.
在步骤S2中,所述目标概率假设密度

式中,


所述标签集

式中,

所述历史状态矩阵集Λk的表达式为:The expression of the historical state matrix set Λ k is:

式中,


在步骤S3中,所述新生目标的概率假设密度γk(x)的表达式为:In step S3, the expression of the probability hypothesis density γ k (x) of the newborn target is:

式中,Jγ,k表示新生高斯分量的数目,


所述新生目标的标签集

式中,

所述新生目标的历史状态矩阵集Λγ,k的表达式为:The historical state matrix set Λ γ of the newborn target, the expression of k is:

式中,


所述存活目标的预测概率假设密度

式中,


所述存活目标的预测标签集

式中,


所述存活目标的预测历史状态矩阵集Λs,k|k-1的表达式为:The expression of the predicted historical state matrix set Λ s,k|k-1 of the surviving target is:

式中,


所述目标预测概率假设密度

式中,Jk|k-1表示预测高斯分量的预测数目,


所述目标预测标签集

式中,

所述目标预测历史状态矩阵集Λk|k-1的表达式为:The expression of the target prediction historical state matrix set Λ k|k-1 is:

式中,

在步骤S4中,所述量测集Zk的表达式为:In step S4, the expression of the measurement set Z k is:

式中,Mk表示k时刻量测集Zk中量测的数目,
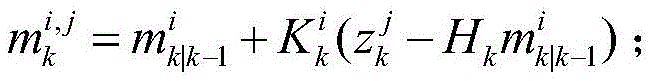
所述计算目标后验概率假设密度

S4.1;计算高斯分量


所述高斯分量


式中,


所述高斯分量


式中,


所述高斯分量


式中,I表示单位矩阵;In the formula, I represents the identity matrix;
所述高斯分量


所述高斯分量


式中,


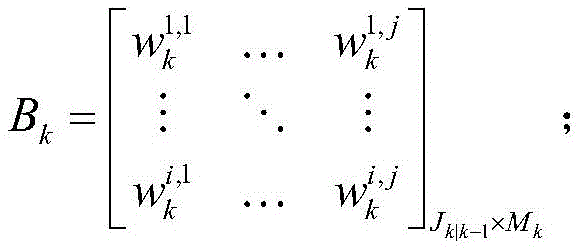
S4.2,计算高斯分量


所述非归一化权值矩阵Ak的表达式为:The expression of the non-normalized weight matrix A k is:

式中,


归一化权值矩阵Bk的表达式为:The expression of the normalized weight matrix B k is:

式中,

在步骤S4.2中,所述对各高斯分量的权值进行再分配,输出目标后验概率假设密度

S4.2.1,查找归一化权值矩阵Bk中的最大权值的索引<i*,j*>,构建与该最大权值高斯分量具有相同标签的分量索引集Ψ,计算分量索引集Ψ中索引所对应的高斯分量的权值和ηw;S4.2.1, find the index <i * , j * > of the maximum weight in the normalized weight matrix B k , construct a component index set Ψ with the same label as the maximum weight Gaussian component, and calculate the component index set Ψ The weight sum η w of the Gaussian component corresponding to the index in ;
所述最大权值的索引<i*,j*>的表达式为:The expression of the index <i * , j * > of the maximum weight is:

式中,

所述分量索引集Ψ的表达式为:The expression of the component index set Ψ is:

式中,


所述权值和ηw的表达式为:The expression of described weight and η w is:

S4.2.2,计算标志位


所述标志位

S4.2.3,将归一化权值矩阵Bk中的权值
S4.2.4,更新高斯分量索引集

S4.2.5,基于优化权值矩阵Ek中的权值,更新目标后验概率假设密度


所述目标后验概率假设密度

所述目标后验标签集

所述目标后验历史状态矩阵集Λk的表达式为:The expression of the target posterior history state matrix set Λ k is:

在步骤S4.2.2中,所述更新分量索引集中索引所对应的高斯分量的权值和ηw和标志位
S4.2.2a,从具有相同标签
所述高斯分量所对应的索引<ir,jc>的表达式为:The expression of the index <i r , j c > corresponding to the Gaussian component is:

其中,
式中,比例系数ζ=[1,δ-1/δ,δ-2/δ,δ-3/δ,δ-4/δ],


S4.2.2b,更新非归一化权值矩阵Ak和归一化权值矩阵Bk中的各权值,对应的表达式分别为:S4.2.2b, update the weights in the unnormalized weight matrix A k and the normalized weight matrix B k , the corresponding expressions are respectively:

式中,比例因子


S4.2.2c,更新分量索引集Ψ中索引所对应的高斯分量的权值和ηw和标志位


在步骤S5中,所述目标的高斯分量集的表达式为:In step S5, the expression of the Gaussian component set of the target is:

式中,Jk|k-1表示预测高斯分量的预测数目,Mk表示量测集Zk中量测的数目;In the formula, J k|k-1 represents the predicted number of predicted Gaussian components, and M k represents the number of measurements in the measurement set Z k ;
所述参数集的表达式为:The expression of the parameter set is:

式中,


所述变换后的高斯分量集的表达式为:The expression of the transformed Gaussian component set is:

式中,高斯分量数目为Jk=Jk|k-1+Jk|k-1×Mk;In the formula, the number of Gaussian components is J k =J k|k-1 +J k|k-1 ×M k ;
所述变换后的高斯分量集所对应的参数集表达式为:The parameter set expression corresponding to the transformed Gaussian component set is:

所述对变换后的高斯分量集进行约简包括步骤如下:The step of reducing the transformed Gaussian component set includes the following steps:
S5.1,设定删减阈值T1,融合阈值U,最大高斯分量数目阈值Jmax;S5.1, set the pruning threshold T 1 , the fusion threshold U, the maximum Gaussian component number threshold J max ;
S5.2,设定计数变量j=0和高斯分量数目变量

式中,

S5.3,执行j=j+1,筛选具有最大权值的高斯分量
所述最大权值的高斯分量

S5.4,更新高斯分量索引集


所述更新高斯分量索引集

式中,过渡索引集


所述更新高斯分量数目变量

S5.5,对高斯分量数目变量


如果


在步骤S5.3中,所述建立新的高斯分量包括如下步骤:In step S5.3, the establishment of a new Gaussian component includes the following steps:
S5.3.1,定义过渡索引集
式中,

S5.3.2,定义过渡索引集
式中,


S5.3.3,将过渡索引集L2中索引所对应的高斯分量

所述新的高斯分量


式中,

所述新的高斯分量


所述新的高斯分量


式中,


所述新的高斯分量


所述新的高斯分量


式中,


在步骤S6中,所述估计目标的状态和数目包括如下步骤:In step S6, said estimating the state and number of targets includes the following steps:
S6.1,根据步骤S5中所获得的高斯分量参数集中的权值估计目标数目;S6.1, estimating the number of targets according to the weights in the Gaussian component parameter set obtained in step S5;
所述目标数目Nk的表达式为:The expression of the target number N k is:

式中,

S6.2,从高斯分量参数集中选择权值大于0.5的索引,之后将索引所对应的高斯分量作为真实目标,最后输出高斯分量的均值即作为当前时刻的目标状态估计。S6.2. Select an index with a weight greater than 0.5 from the Gaussian component parameter set, then use the Gaussian component corresponding to the index as the real target, and finally output the mean value of the Gaussian component as the target state estimate at the current moment.
本发明的有益效果:Beneficial effects of the present invention:
本发明适用于航空和地面交通管制、移动机器人的道路规划和避障、无人机等系统的目标检测与跟踪,应用范围广;具有良好的跟踪性能和鲁棒性,可满足实际工程系统的设计需求,为密集杂波、较低检测概率跟踪环境下的紧邻多目标跟踪系统的设计提供了一种有效的方案。The present invention is suitable for target detection and tracking of systems such as aviation and ground traffic control, road planning and obstacle avoidance of mobile robots, and unmanned aerial vehicles, and has a wide range of applications; it has good tracking performance and robustness, and can meet the requirements of actual engineering systems. According to the design requirements, it provides an effective solution for the design of a close-by multi-target tracking system in a dense clutter and low detection probability tracking environment.
附图说明Description of drawings
为了更清楚地说明本发明实施例或现有技术中的技术方案,下面将对实施例或现有技术描述中所需要使用的附图作简单地介绍,显而易见地,下面描述中的附图仅仅是本发明的一些实施例,对于本领域普通技术人员来讲,在不付出创造性劳动的前提下,还可以根据这些附图获得其他的附图。In order to more clearly illustrate the technical solutions in the embodiments of the present invention or the prior art, the following will briefly introduce the drawings that need to be used in the description of the embodiments or the prior art. Obviously, the accompanying drawings in the following description are only These are some embodiments of the present invention. Those skilled in the art can also obtain other drawings based on these drawings without creative work.
图1是本发明MCST-GM-PHD的流程示意图。Fig. 1 is a schematic flow chart of MCST-GM-PHD of the present invention.
图2是本发明试验采用的杂波环境下含有目标真实运动轨迹及量测的场景示意图;Fig. 2 is a schematic diagram of a scene containing the real motion trajectory and measurement of the target under the clutter environment used in the test of the present invention;
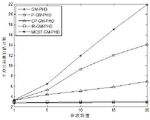
图3是采用本发明MCST-GM-PHD与GM-PHD方法、P-GM-PHD方法、CP-GM-PHD方法以及IR-GM-PHD方法的平均OSPA距离的比较效果图。Fig. 3 is a comparison effect diagram of the average OSPA distance of the MCST-GM-PHD method of the present invention and the GM-PHD method, the P-GM-PHD method, the CP-GM-PHD method and the IR-GM-PHD method.
图4是采用本发明MCST-GM-PHD与GM-PHD方法、P-GM-PHD方法、CP-GM-PHD方法以及IR-GM-PHD方法的平均目标数目估计数的比较效果图。Fig. 4 is a comparison effect diagram of the average target number estimates using the MCST-GM-PHD method of the present invention and the GM-PHD method, the P-GM-PHD method, the CP-GM-PHD method and the IR-GM-PHD method.
图5是不同杂波均值环境下本发明MCST-GM-PHD与GM-PHD方法、P-GM-PHD方法、CP-GM-PHD方法以及IR-GM-PHD方法的平均OSPA距离的比较效果图。Fig. 5 is a comparative effect diagram of the average OSPA distance of the MCST-GM-PHD of the present invention and the GM-PHD method, the P-GM-PHD method, the CP-GM-PHD method and the IR-GM-PHD method under different clutter mean environments .
图6是不同杂波均值环境下本发明MCST-GM-PHD与GM-PHD方法、P-GM-PHD方法、CP-GM-PHD方法以及IR-GM-PHD方法的平均目标数目估计数的比较效果图。Fig. 6 is the comparison of the average target number estimates of MCST-GM-PHD of the present invention and GM-PHD method, P-GM-PHD method, CP-GM-PHD method and IR-GM-PHD method under different clutter mean environments renderings.
图7是不同检测概率环境下本发明MCST-GM-PHD与GM-PHD方法、P-GM-PHD方法、CP-GM-PHD方法以及IR-GM-PHD方法的平均OSPA距离的比较效果图。Fig. 7 is a comparison effect diagram of the average OSPA distance of the MCST-GM-PHD method of the present invention and the GM-PHD method, the P-GM-PHD method, the CP-GM-PHD method and the IR-GM-PHD method under different detection probability environments.
图8是不同检测概率环境下本发明MCST-GM-PHD与GM-PHD方法、P-GM-PHD方法、CP-GM-PHD方法以及IR-GM-PHD方法的平均目标数目估计数的比较效果图。Fig. 8 is the comparative effect of the average target number estimate number of MCST-GM-PHD of the present invention and GM-PHD method, P-GM-PHD method, CP-GM-PHD method and IR-GM-PHD method under different detection probability environments picture.
具体实施方式Detailed ways
下面将结合本发明实施例中的附图,对本发明实施例中的技术方案进行清楚、完整地描述,显然,所描述的实施例仅仅是本发明一部分实施例,而不是全部的实施例。基于本发明中的实施例,本领域普通技术人员在没有付出创造性劳动前提下所获得的所有其他实施例,都属于本发明保护的范围。The following will clearly and completely describe the technical solutions in the embodiments of the present invention with reference to the accompanying drawings in the embodiments of the present invention. Obviously, the described embodiments are only some, not all, embodiments of the present invention. Based on the embodiments of the present invention, all other embodiments obtained by persons of ordinary skill in the art without making creative efforts belong to the protection scope of the present invention.
一种基于高斯混合概率假设密度的紧邻多目标跟踪方法,如图1所示,包括如下步骤:A method for tracking multiple targets in close proximity based on Gaussian mixture probability hypothesis density, as shown in Figure 1, includes the following steps:
S1,增加高斯分量的标签和历史状态矩阵为辅助参数以构建用于表示目标的高斯分量的新标准描述集;S1, adding the label of the Gaussian component and the historical state matrix as auxiliary parameters to construct a new standard description set for the Gaussian component representing the target;
所述表示目标的高斯分量的新标准描述集o的表达式为:The expression of the new standard description set o representing the Gaussian component of the target is:
o={w,m,P,l,χ};o={w,m,P,l,χ};
式中,w表示高斯分量的权值,m表示高斯分量的均值,P表示高斯分量的协方差矩阵,l表示高斯分量的标签,χ表示高斯分量的历史状态矩阵;In the formula, w represents the weight of the Gaussian component, m represents the mean value of the Gaussian component, P represents the covariance matrix of the Gaussian component, l represents the label of the Gaussian component, and χ represents the historical state matrix of the Gaussian component;
标签用于识别高斯分量的身份以及属于不同目标的高斯分量;历史状态矩阵存储了高斯分量的若干个历史状态,通过计算目标的各高斯分量的历史状态矩阵与不同量测间的距离,实现当前时刻高斯分量与目标的相对最优匹配;在滤波器对目标进行初始化时,每个目标一般只采用一个高斯分量来表示,但是在滤波迭代过程中,每个目标通常由多个高斯分量来表示;The tag is used to identify the identity of the Gaussian component and the Gaussian component belonging to different targets; the historical state matrix stores several historical states of the Gaussian component, by calculating the distance between the historical state matrix of each Gaussian component of the target and different measurements, the current The relative optimal matching between the Gaussian component and the target at any time; when the filter initializes the target, each target is generally represented by only one Gaussian component, but in the filtering iteration process, each target is usually represented by multiple Gaussian components ;
k时刻的高斯分量的历史状态矩阵χk的表达式为:The expression of the historical state matrix χ k of the Gaussian component at time k is:
χk=[mk-δ+1,…,mk-1,mk];χ k =[m k-δ+1 ,...,m k-1 ,m k ];
式中,δ表示传感器所设定的历史状态矩阵中的元素数目阈值。In the formula, δ represents the threshold number of elements in the historical state matrix set by the sensor.
S2,初始化目标概率假设密度、标签集及历史状态矩阵集;S2, initialize the target probability hypothesis density, label set and historical state matrix set;
所述目标概率假设密度

式中,


所述目标标签集

式中,

所述目标历史状态矩阵集Λk的表达式为:The expression of the target historical state matrix set Λ k is:

式中,


初始化目标概率假设密度、目标标签集及目标历史状态矩阵集,为对将要跟踪的目标进行初始化。Initialize the target probability hypothesis density, target label set and target historical state matrix set to initialize the target to be tracked.
S3,根据新生目标的概率假设密度、标签集、历史状态矩阵集和存活目标的预测概率假设密度、预测标签集、预测历史状态矩阵集,计算目标预测概率假设密度、目标预测标签集、目标预测历史状态矩阵集;S3, according to the probability hypothesis density, label set, historical state matrix set of the newborn target, and the predicted probability hypothesis density, predicted label set, and predicted historical state matrix set of the surviving target, calculate the target prediction probability hypothesis density, target prediction label set, and target prediction Historical state matrix set;
所述新生目标的概率假设密度γk(x)的表达式为:The expression of the probability hypothesis density γ k (x) of the newborn target is:

式中,Jγ,k表示新生高斯分量的数目,


所述新生目标的标签集

式中,

所述新生目标的历史状态矩阵集Λγ,k的表达式为:The historical state matrix set Λ γ of the newborn target, the expression of k is:

式中,


所述存活目标的预测概率假设密度

式中,


所述存活高斯分量


式中,ps表示存活概率,

所述存活高斯分量


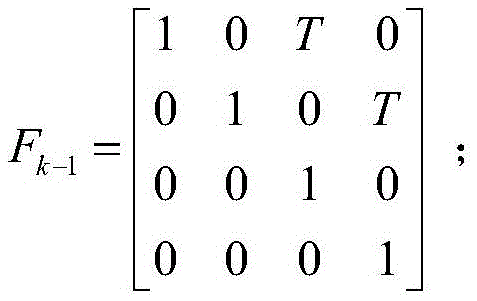
式中,Fk-1表示k-1时刻状态转移矩阵,

所述存活高斯分量


式中,Qk-1表示k-1时刻过程噪声协方差矩阵,

所述存活高斯分量的预测数目Js,k|k-1的表达式为:The expression of the predicted number J s,k|k-1 of the survival Gaussian component is:
Js,k|k-1=Jk-1;J s,k|k-1 = J k-1 ;
式中,Jk-1表示k-1时刻高斯分量的数目;In the formula, J k-1 represents the number of Gaussian components at time k-1;
所述存活目标的预测标签集

式中,


所述存活目标的预测历史状态矩阵集Λs,k|k-1的表达式为:The expression of the predicted historical state matrix set Λ s,k|k-1 of the surviving target is:

式中,


所述目标预测概率假设密度

式中,Jk|k-1表示预测高斯分量的预测数目,


所述预测高斯分量的预测数目Jk|k-1的表达式为:The expression of the prediction number J k|k-1 of the predicted Gaussian component is:
Jk|k-1=Js,k|k-1+Jγ,k;J k|k-1 = J s,k|k-1 +J γ,k ;
所述预测高斯分量


式中,


所述预测高斯分量


式中,


所述预测高斯分量


式中,


所述目标预测标签集

式中,

所述预测标签

所述目标预测历史状态矩阵集Λk|k-1的表达式为:The expression of the target prediction historical state matrix set Λ k|k-1 is:

式中,

所述预测历史状态矩阵

步骤S3通过对前一时刻目标的概率假设密度、标签集和历史状态矩阵集进行一步预测,以得到当前时刻存活目标的预测概率假设密度、预测标签集和预测历史状态矩阵集,结合当前时刻新生目标的概率假设密度、标签集和历史状态矩阵集,以构建当前时刻所有目标的预测概率假设密度、预测标签集和预测历史状态矩阵集,为后续的目标更新做好准备工作。In step S3, one-step prediction is performed on the probability hypothesis density, label set and historical state matrix set of the target at the previous moment to obtain the predicted probability hypothesis density, predicted label set and predicted historical state matrix set of the surviving target at the current moment. The probability hypothesis density, label set and historical state matrix set of the target are used to construct the predicted probability hypothesis density, predicted label set and predicted historical state matrix set of all targets at the current moment, so as to prepare for the subsequent target update.
S4,基于量测集计算目标后验概率假设密度


所述量测集Zk的表达式为:The expression of the measurement set Z k is:

式中,Mk表示k时刻量测集Zk中量测的数目,
所述计算目标后验概率假设密度

S4.1:计算目标的高斯分量


所述高斯分量


式中,


所述高斯分量


式中,


所述高斯分量


式中,I表示单位矩阵;In the formula, I represents the identity matrix;
所述高斯分量


所述高斯分量


式中,


S4.2,计算高斯分量


所述非归一化权值矩阵Ak的表达式为:The expression of the non-normalized weight matrix A k is:

式中,


归一化权值矩阵Bk的表达式为:The expression of the normalized weight matrix B k is:

式中,

然后,设定高斯分量索引集
所述对各高斯分量的权值再分配,并输出目标后验概率假设密度

S4.2.1,查找归一化权值矩阵Bk中的最大权值的索引<i*,j*>,构建与该最大权值高斯分量具有相同标签的分量索引集Ψ,计算分量索引集Ψ中索引所对应的高斯分量的权值和ηw;S4.2.1, find the index <i * , j * > of the maximum weight in the normalized weight matrix B k , construct a component index set Ψ with the same label as the maximum weight Gaussian component, and calculate the component index set Ψ The weight sum η w of the Gaussian component corresponding to the index in ;
所述最大权值的索引<i*,j*>的表达式为:The expression of the index <i * , j * > of the maximum weight is:

式中,Mk表示量测集Zk中量测的数目;In the formula, M k represents the number of measurements in the measurement set Z k ;
所述分量索引集Ψ的表达式为:The expression of the component index set Ψ is:

式中,


所述权值和ηw的表达式为:The expression of described weight and η w is:

S4.2.2,计算标志位


所述标志位

所述更新分量索引集中索引所对应的高斯分量的权值和ηw和标志位
S4.2.2a,从具有相同标签
所述高斯分量所对应的索引<ir,jc>的表达式为:The expression of the index <i r , j c > corresponding to the Gaussian component is:

其中,
式中,比例系数ζ=[1,δ-1/δ,δ-2/δ,δ-3/δ,δ-4/δ],


S4.2.2b,更新非归一化权值矩阵Ak和归一化权值矩阵Bk中的各权值,对应的表达式分别为:S4.2.2b, update the weights in the unnormalized weight matrix A k and the normalized weight matrix B k , the corresponding expressions are respectively:

式中,比例因子


S4.2.2c,更新分量索引集Ψ中索引所对应的高斯分量的权值和ηw和标志位


S4.2.3,将归一化权值矩阵Bk中的权值
S4.2.4,更新高斯分量索引集

所述更新高斯分量索引集

S4.2.5,基于优化权值矩阵Ek中的权值,更新目标后验概率假设密度


所述目标后验概率假设密度

所述目标后验标签集

所述目标后验历史状态矩阵集Λk的表达式为:The expression of the target posterior history state matrix set Λ k is:

步骤S4.2通过对高斯分量的权值进行再分配,得到了高精度的目标后验概率假设密度。In step S4.2, the high-precision target posterior probability hypothesis density is obtained by redistributing the weights of the Gaussian components.
S5,对步骤S4中所获得的高斯分量集
所述高斯分量集


变换后的高斯分量

变换后的高斯分量


变换后的高斯分量


变换后的高斯分量


变换后的高斯分量


变换后的高斯分量


所述对变换后的高斯分量集进行约简包括步骤如下:The step of reducing the transformed Gaussian component set includes the following steps:
S5.1,设定删减阈值T1,融合阈值U,最大高斯分量数目阈值Jmax。S5.1, setting the pruning threshold T 1 , the fusion threshold U, and the maximum Gaussian component number threshold J max .
S5.2,设定计数变量j=0和高斯分量数目变量

式中,

S5.3,执行j=j+1,筛选具有最大权值的高斯分量
所述最大权值的高斯分量

所述建立新的高斯分量包括如下步骤:The establishment of a new Gaussian component includes the following steps:
S5.3.1,定义第一过渡索引集L1;S5.3.1, define the first transition index set L1;
所述第一过渡索引集L1的表达式为:The expression of the first transition index set L1 is:

式中,


S5.3.2,定义第二过渡索引集L2;S5.3.2, define the second transition index set L2;
所述第二过渡索引集L2的表达式为:The expression of the second transition index set L2 is:

式中,


S5.3.3,将第二过渡索引集L2中索引所对应的高斯分量

所述新的高斯分量


式中,

所述新的高斯分量


所述新的高斯分量


式中,


所述新的高斯分量


所述新的高斯分量


式中,


S5.4,更新高斯分量索引集


所述更新高斯分量索引集

所述更新高斯分量数目变量

S5.5,对高斯分量数目变量


如果


所述约简后的高斯分量集

步骤S5通过对高斯分量进行约简,实现了对高斯分量的优化重组,降低了无效高斯分量的数目,能够有效地提高跟踪算法的计算效率。In step S5, Gaussian components are reduced to achieve optimal reorganization of Gaussian components, reducing the number of invalid Gaussian components, and effectively improving the calculation efficiency of the tracking algorithm.
S6,根据步骤S5中所获得的约简后的高斯分量集,估计目标的状态和数目,包括如下步骤:S6, according to the reduced Gaussian component set obtained in step S5, estimate the state and number of the target, including the following steps:
S6.1,根据约简后的高斯分量参数集

所述目标数目Nk的表达式为:The expression of the target number N k is:

S6.2,从高斯分量参数集


步骤S6实现了从当前时刻高斯分量参数集中估计目标的状态和数目。Step S6 realizes estimating the state and number of targets from the Gaussian component parameter set at the current moment.
S7,若跟踪单一时刻,则目标跟踪结束;若跟踪若干个时刻,则重复执行S3-S6直至迭代所有时刻。S7. If a single moment is tracked, the target tracking ends; if several moments are tracked, S3-S6 is repeatedly executed until all moments are iterated.
本发明的效果可通过以下仿真实验进一步说明:Effect of the present invention can be further illustrated by following simulation experiments:
①仿真条件及参数①Simulation conditions and parameters
图2是本发明试验采用的一个二维跟踪区域内目标真实轨迹及量测在100个时刻的仿真示意图,且杂波均值为5。k时刻的目标状态为


xk=Fk-1xk-1+Qk-1;x k = F k-1 x k-1 + Q k-1 ;
zk=Hkxk+Rk;z k = H k x k + R k ;
其中,in,


仿真场景中,过程噪声σw为一个均值为0、标准差为0.5m的高斯白噪声,量测噪声σv为一个均值为0、标准差为50m的高斯白噪声,检测概率pd=0.98,存活概率ps=0.99。设置删减阈值T1=10-5,融合阈值U=4,最大高斯分量数目阈值Jmax=100,元素数目阈值δ=5。假设k=0时刻初始化的目标概率假设密度为:In the simulation scenario, the process noise σ w is a Gaussian white noise with a mean value of 0 and a standard deviation of 0.5m, the measurement noise σv is a Gaussian white noise with a mean value of 0 and a standard deviation of 50m, and the detection probability p d =0.98 , survival probability p s =0.99. Set the pruning threshold T 1 =10 −5 , the fusion threshold U=4, the maximum Gaussian component number threshold J max =100, and the element number threshold δ=5. Assume that the target probability hypothesis density initialized at time k=0 is:

其中,


②仿真结果与分析②Simulation results and analysis
仿真实验中,本发明MCST-GM-PHD分别与GM-PHD、P-GM-PHD、CP-GM-PHD和IR-GM-PHD方法进行多目标跟踪性能对比。本发明中采用OSPA距离和目标数目估计数为跟踪性能度量指标,其中OSPA距离的两个参数分别为c=100和p=2。OSPA距离越小,目标状态精度越高。每个实验结果均为200次蒙特卡罗仿真的均值。实验主要从以下三个方面开展:In the simulation experiment, the MCST-GM-PHD of the present invention is compared with the GM-PHD, P-GM-PHD, CP-GM-PHD and IR-GM-PHD methods for multi-target tracking performance. In the present invention, the OSPA distance and the estimated number of targets are used as the tracking performance index, and the two parameters of the OSPA distance are c=100 and p=2 respectively. The smaller the OSPA distance, the higher the target state accuracy. Each experimental result is the mean of 200 Monte Carlo simulations. The experiment is mainly carried out from the following three aspects:
实验1:杂波干扰下的多目标场景Experiment 1: Multi-target scene under clutter interference
图3是采用本发明MCST-GM-PHD与GM-PHD、P-GM-PHD、CP-GM-PHD和IR-GM-PHD方法的平均OSPA距离对比效果图。可以看出,本发明MCST-GM-PHD的目标状态估计精度优于GM-PHD、P-GM-PHD、CP-GM-PHD和IR-GM-PHD方法。Fig. 3 is a comparison effect diagram of the average OSPA distance using the MCST-GM-PHD method of the present invention and the GM-PHD, P-GM-PHD, CP-GM-PHD and IR-GM-PHD methods. It can be seen that the target state estimation accuracy of MCST-GM-PHD of the present invention is better than that of GM-PHD, P-GM-PHD, CP-GM-PHD and IR-GM-PHD methods.
图4是采用本发明MCST-GM-PHD与GM-PHD、P-GM-PHD、CP-GM-PHD和IR-GM-PHD方法的平均目标数目估计数对比效果图。可以看出,本发明MCST-GM-PHD的目标数目估计精度与IR-GM-PHD方法相当,且均能够准确地估计出目标数目;本发明MCST-GM-PHD的目标数目估计精度优于GM-PHD、P-GM-PHD和CP-GM-PHD方法。Fig. 4 is a comparison effect diagram of the average target number estimates using the MCST-GM-PHD method of the present invention and the GM-PHD, P-GM-PHD, CP-GM-PHD and IR-GM-PHD methods. It can be seen that the target number estimation accuracy of MCST-GM-PHD of the present invention is equivalent to the IR-GM-PHD method, and both can accurately estimate the target number; the target number estimation accuracy of MCST-GM-PHD of the present invention is better than GM - PHD, P-GM-PHD and CP-GM-PHD methods.
实验2:不同杂波均值下的多目标场景Experiment 2: Multi-target scene with different clutter means
图5是不同杂波均值环境下采用本发明MCST-GM-PHD与GM-PHD、P-GM-PHD、CP-GM-PHD和IR-GM-PHD方法的平均OSPA距离对比效果图。可以看出,在不同杂波均值环境下本发明MCST-GM-PHD的目标状态估计精度优于GM-PHD、P-GM-PHD、CP-GM-PHD和IR-GM-PHD方法。Fig. 5 is a comparison effect diagram of the average OSPA distance using the MCST-GM-PHD of the present invention and the GM-PHD, P-GM-PHD, CP-GM-PHD and IR-GM-PHD methods under different clutter mean environments. It can be seen that the target state estimation accuracy of MCST-GM-PHD of the present invention is better than that of GM-PHD, P-GM-PHD, CP-GM-PHD and IR-GM-PHD methods under different clutter mean environments.
图6是不同杂波均值环境下采用本发明MCST-GM-PHD与GM-PHD、P-GM-PHD、CP-GM-PHD和IR-GM-PHD方法的平均目标数目估计数对比效果图。可以看出,在不同杂波均值环境下本发明MCST-GM-PHD的目标数目估计精度与IR-GM-PHD方法相当,且优于GM-PHD、P-GM-PHD和CP-GM-PHD方法。Fig. 6 is a comparison effect diagram of the average target number estimates using the MCST-GM-PHD of the present invention and the GM-PHD, P-GM-PHD, CP-GM-PHD and IR-GM-PHD methods under different clutter mean environments. It can be seen that the target number estimation accuracy of the MCST-GM-PHD of the present invention is equivalent to that of the IR-GM-PHD method under different clutter mean environments, and is better than GM-PHD, P-GM-PHD and CP-GM-PHD method.
实验3:不同检测概率下的多目标场景Experiment 3: Multi-target scenes with different detection probabilities
图7是不同检测概率环境下采用本发明MCST-GM-PHD与GM-PHD、P-GM-PHD、CP-GM-PHD和IR-GM-PHD方法的平均OSPA距离对比效果图。可以看出,在不同检测概率环境下本发明MCST-GM-PHD的目标状态估计精度优于GM-PHD、P-GM-PHD、CP-GM-PHD和IR-GM-PHD方法。Fig. 7 is a comparison effect diagram of the average OSPA distance using MCST-GM-PHD of the present invention and GM-PHD, P-GM-PHD, CP-GM-PHD and IR-GM-PHD methods under different detection probability environments. It can be seen that the target state estimation accuracy of MCST-GM-PHD of the present invention is better than that of GM-PHD, P-GM-PHD, CP-GM-PHD and IR-GM-PHD methods under different detection probability environments.
图8是不同检测概率环境下采用本发明MCST-GM-PHD与GM-PHD、P-GM-PHD、CP-GM-PHD和IR-GM-PHD方法的平均目标数目估计数对比效果图。可以看出,在不同检测概率环境下本发明MCST-GM-PHD的目标数目估计精度优于GM-PHD、P-GM-PHD、CP-GM-PHD和IR-GM-PHD方法。Fig. 8 is a comparison effect diagram of the average target number estimates using MCST-GM-PHD of the present invention and GM-PHD, P-GM-PHD, CP-GM-PHD and IR-GM-PHD methods under different detection probability environments. It can be seen that the target number estimation accuracy of MCST-GM-PHD of the present invention is better than that of GM-PHD, P-GM-PHD, CP-GM-PHD and IR-GM-PHD methods under different detection probability environments.
以上所述仅为本发明的较佳实施例而已,并不用以限制本发明,凡在本发明的精神和原则之内,所作的任何修改、等同替换、改进等,均应包含在本发明的保护范围之内。The above descriptions are only preferred embodiments of the present invention, and are not intended to limit the present invention. Any modifications, equivalent replacements, improvements, etc. made within the spirit and principles of the present invention shall be included in the scope of the present invention. within the scope of protection.
Claims (6)


Priority Applications (1)
| Application Number | Priority Date | Filing Date | Title |
|---|---|---|---|
| CN202010332381.9A CN111488552B (en) | 2020-04-24 | 2020-04-24 | Close-proximity multi-target tracking method based on Gaussian mixture probability hypothesis density |
Applications Claiming Priority (1)
| Application Number | Priority Date | Filing Date | Title |
|---|---|---|---|
| CN202010332381.9A CN111488552B (en) | 2020-04-24 | 2020-04-24 | Close-proximity multi-target tracking method based on Gaussian mixture probability hypothesis density |
Publications (2)
| Publication Number | Publication Date |
|---|---|
| CN111488552A CN111488552A (en) | 2020-08-04 |
| CN111488552B true CN111488552B (en) | 2023-03-21 |
Family
ID=71800244
Family Applications (1)
| Application Number | Title | Priority Date | Filing Date |
|---|---|---|---|
| CN202010332381.9A Active CN111488552B (en) | 2020-04-24 | 2020-04-24 | Close-proximity multi-target tracking method based on Gaussian mixture probability hypothesis density |
Country Status (1)
| Country | Link |
|---|---|
| CN (1) | CN111488552B (en) |
Families Citing this family (6)
| Publication number | Priority date | Publication date | Assignee | Title |
|---|---|---|---|---|
| CN111815081B (en) * | 2020-09-07 | 2020-12-22 | 华东交通大学 | A Robust Optimal Scheduling Method for Multi-objective Confidence Gap Decision Making in Integrated Energy Systems |
| CN112688667B (en) * | 2020-12-22 | 2022-10-11 | 中国人民解放军63921部队 | Design method of GM-PHD filter |
| CN113504521B (en) * | 2021-07-08 | 2022-09-20 | 哈尔滨工业大学 | A hybrid model-based constant false alarm detection method for multi-objective environments |
| CN114529582B (en) * | 2022-02-09 | 2025-04-25 | 上海交通大学 | Target tracking method, system, terminal and medium based on probability label |
| CN117197491B (en) * | 2023-09-25 | 2024-07-19 | 兰州理工大学 | Probability hypothesis density filtering multi-maneuvering target tracking method based on Gaussian process |
| CN120067523B (en) * | 2025-03-05 | 2026-04-17 | 北京理工大学 | Nonlinear multi-target tracking method based on transition state probability hypothesis density filtering |
Citations (6)
| Publication number | Priority date | Publication date | Assignee | Title |
|---|---|---|---|---|
| CN103345577A (en) * | 2013-06-27 | 2013-10-09 | 江南大学 | Probability hypothesis density multi-target tracking method based on variational Bayesian approximation technology |
| CN106408594A (en) * | 2016-09-28 | 2017-02-15 | 江南大学 | Video multi-target tracking method based on multi-Bernoulli characteristic covariance |
| CN106407677A (en) * | 2016-09-09 | 2017-02-15 | 南京理工大学 | Multi-target tracking method in case of loss of measurement data |
| WO2017124299A1 (en) * | 2016-01-19 | 2017-07-27 | 深圳大学 | Multi-target tracking method and tracking system based on sequential bayesian filtering |
| WO2018010099A1 (en) * | 2016-07-12 | 2018-01-18 | 深圳大学 | Target tracking method for turn maneuver, and system for same |
| CN110376581A (en) * | 2019-06-24 | 2019-10-25 | 河海大学 | The explicit multi-object tracking method of density filter is assumed based on Gaussian-mixture probability |
Family Cites Families (1)
| Publication number | Priority date | Publication date | Assignee | Title |
|---|---|---|---|---|
| WO2018049602A1 (en) * | 2016-09-14 | 2018-03-22 | 深圳大学 | Multi-target tracking method and tracking system applicable to cluttered environment |
-
2020
- 2020-04-24 CN CN202010332381.9A patent/CN111488552B/en active Active
Patent Citations (6)
| Publication number | Priority date | Publication date | Assignee | Title |
|---|---|---|---|---|
| CN103345577A (en) * | 2013-06-27 | 2013-10-09 | 江南大学 | Probability hypothesis density multi-target tracking method based on variational Bayesian approximation technology |
| WO2017124299A1 (en) * | 2016-01-19 | 2017-07-27 | 深圳大学 | Multi-target tracking method and tracking system based on sequential bayesian filtering |
| WO2018010099A1 (en) * | 2016-07-12 | 2018-01-18 | 深圳大学 | Target tracking method for turn maneuver, and system for same |
| CN106407677A (en) * | 2016-09-09 | 2017-02-15 | 南京理工大学 | Multi-target tracking method in case of loss of measurement data |
| CN106408594A (en) * | 2016-09-28 | 2017-02-15 | 江南大学 | Video multi-target tracking method based on multi-Bernoulli characteristic covariance |
| CN110376581A (en) * | 2019-06-24 | 2019-10-25 | 河海大学 | The explicit multi-object tracking method of density filter is assumed based on Gaussian-mixture probability |
Non-Patent Citations (3)
| Title |
|---|
| 一种鲁棒的多目标概率假设密度算法;王颖;《火力与指挥控制》(第08期);全文 * |
| 基于改进的概率假设密度多目标跟踪算法;高丽等;《火力与指挥控制》(第03期);全文 * |
| 多帧高斯混合概率假设密度的多目标跟踪算法;高丽等;《火力与指挥控制》(第09期);全文 * |
Also Published As
| Publication number | Publication date |
|---|---|
| CN111488552A (en) | 2020-08-04 |
Similar Documents
| Publication | Publication Date | Title |
|---|---|---|
| CN111488552B (en) | Close-proximity multi-target tracking method based on Gaussian mixture probability hypothesis density | |
| CN109798896A (en) | A kind of positioning of Indoor Robot with build drawing method and device | |
| CN111948601B (en) | Single-station pure-angle target positioning and tracking method under non-Gaussian noise condition | |
| CN109597864A (en) | Instant positioning and map constructing method and the system of ellipsoid boundary Kalman filtering | |
| CN113362368A (en) | Crowd trajectory prediction method based on multi-level space-time diagram neural network | |
| CN113189578B (en) | Extended target tracking method | |
| CN117193320B (en) | Multi-agent obstacle avoidance navigation control method based on deep reinforcement learning | |
| CN108134640B (en) | A cooperative positioning system and method based on node motion state constraints | |
| CN111262556B (en) | A multi-target tracking method for simultaneously estimating unknown Gaussian measurement noise statistics | |
| CN117611627A (en) | Multi-target tracking method and system based on unscented Kalman filter and long short-term memory fusion | |
| CN111969979B (en) | Minimum error entropy CDKF filter method | |
| Chen et al. | Kalman filtering | |
| CN120294742A (en) | Maneuvering target tracking system and method based on hybrid coding and UKF decoding | |
| CN117475090B (en) | Trajectory generation model, trajectory generation method, device, terminal and medium | |
| CN110649911B (en) | A distributed nonlinear Kalman filter method based on alpha divergence | |
| CN119336045A (en) | Distributed control method for target tracking based on time-space fusion optimization | |
| NL2026432B1 (en) | Multi-source target tracking method for complex scenes | |
| CN116611232A (en) | Mixed importance Gaussian filtering method and device driven by space-time causal mapping | |
| CN116125375A (en) | CKF-SLAM (continuous wave inertial navigation system-SLAM) -based improved unmanned underwater vehicle dynamic target tracking method | |
| CN111523090B (en) | Number time-varying multi-target tracking method based on Gaussian mixture probability hypothesis density | |
| CN110334322B (en) | Particle number self-adaption method of particle filter | |
| CN114612873A (en) | Data processing method, apparatus, electronic device and readable storage medium | |
| Kang et al. | Monocular vision-based 3D ship detection: From image pixels to spatial perception | |
| Liu et al. | Correlation scan matching algorithm based on multi‐resolution auxiliary historical point cloud and lidar simultaneous localisation and mapping positioning application | |
| Zhang et al. | The Unscented Kalman Filter Based Fusion Tracking Method with Multi-error Model |
Legal Events
| Date | Code | Title | Description |
|---|---|---|---|
| PB01 | Publication | ||
| PB01 | Publication | ||
| SE01 | Entry into force of request for substantive examination | ||
| SE01 | Entry into force of request for substantive examination | ||
| GR01 | Patent grant | ||
| GR01 | Patent grant |