CN111257404A - Method for top-down multiplexed mass spectrometry of mixtures of proteins or polypeptides - Google Patents
Method for top-down multiplexed mass spectrometry of mixtures of proteins or polypeptides Download PDFInfo
- Publication number
- CN111257404A CN111257404A CN202010090620.4A CN202010090620A CN111257404A CN 111257404 A CN111257404 A CN 111257404A CN 202010090620 A CN202010090620 A CN 202010090620A CN 111257404 A CN111257404 A CN 111257404A
- Authority
- CN
- China
- Prior art keywords
- mass
- species
- ion
- sample
- ions
- Prior art date
- Legal status (The legal status is an assumption and is not a legal conclusion. Google has not performed a legal analysis and makes no representation as to the accuracy of the status listed.)
- Pending
Links
Images


Classifications
-
- G—PHYSICS
- G01—MEASURING; TESTING
- G01N—INVESTIGATING OR ANALYSING MATERIALS BY DETERMINING THEIR CHEMICAL OR PHYSICAL PROPERTIES
- G01N33/00—Investigating or analysing materials by specific methods not covered by groups G01N1/00 - G01N31/00
- G01N33/48—Biological material, e.g. blood, urine; Haemocytometers
- G01N33/50—Chemical analysis of biological material, e.g. blood, urine; Testing involving biospecific ligand binding methods; Immunological testing
- G01N33/68—Chemical analysis of biological material, e.g. blood, urine; Testing involving biospecific ligand binding methods; Immunological testing involving proteins, peptides or amino acids
- G01N33/6803—General methods of protein analysis not limited to specific proteins or families of proteins
- G01N33/6848—Methods of protein analysis involving mass spectrometry
-
- H—ELECTRICITY
- H01—ELECTRIC ELEMENTS
- H01J—ELECTRIC DISCHARGE TUBES OR DISCHARGE LAMPS
- H01J49/00—Particle spectrometers or separator tubes
- H01J49/0027—Methods for using particle spectrometers
- H01J49/0031—Step by step routines describing the use of the apparatus
-
- H—ELECTRICITY
- H01—ELECTRIC ELEMENTS
- H01J—ELECTRIC DISCHARGE TUBES OR DISCHARGE LAMPS
- H01J49/00—Particle spectrometers or separator tubes
- H01J49/0027—Methods for using particle spectrometers
- H01J49/0036—Step by step routines describing the handling of the data generated during a measurement
-
- H—ELECTRICITY
- H01—ELECTRIC ELEMENTS
- H01J—ELECTRIC DISCHARGE TUBES OR DISCHARGE LAMPS
- H01J49/00—Particle spectrometers or separator tubes
- H01J49/004—Combinations of spectrometers, tandem spectrometers, e.g. MS/MS, MSn
- H01J49/0045—Combinations of spectrometers, tandem spectrometers, e.g. MS/MS, MSn characterised by the fragmentation or other specific reaction
- H01J49/0072—Combinations of spectrometers, tandem spectrometers, e.g. MS/MS, MSn characterised by the fragmentation or other specific reaction by ion/ion reaction, e.g. electron transfer dissociation, proton transfer dissociation
Abstract
The present invention discloses the use of ion-ion reaction chemistry methods, wherein Proton Transfer Reaction (PTR) and real-time data analysis methods are used to: (1) simplifying complex mixture analysis of samples introduced into the mass spectrometer, and (2) improving the resolution and sensitivity of analysis of large proteins over 50kDa by removing charge and reducing collision cross-sections.
Description
Technical Field
The present invention relates to mass spectrometry and, more particularly, to a method for mass spectrometry analysis of a complex mixture of proteins or polypeptides by a method comprising: the ionized samples are subjected to a proton transfer reaction to separate the ionized proteins and polypeptides from other molecules, and a mathematical deconvolution analysis of the resulting reaction products is performed to simultaneously characterize multiple proteins and/or polypeptides in the mixture.
Background
The study of proteins in living cells and tissues (proteomic studies) is a functional area of clinical and basic scientific research, since metabolic control in cells and tissues is exercised at the protein level. For example, comparison of protein level expression between healthy and diseased tissues or between pathogenic and nonpathogenic microbial strains can accelerate the discovery and development of new pharmaceutical compounds or agricultural products. In addition, analysis of protein expression patterns in diseased tissue or tissue excised from the organism undergoing treatment can also serve as a diagnostic or treatment strategy for disease conditions, as well as providing predictive information regarding the appropriate treatment modality and treatment options for the individual patient. Moreover, identification of a collection of proteins in a sample derived from a microorganism (e.g., bacteria) may provide a means to identify substances and/or strains of the microorganism and potentially drug-resistant properties with respect to the bacteria identifying such substances or strains.
An important aspect of proteomic research is the identification of proteins with altered expression levels. Differences in the levels of the neutralizing metabolites over time or across a population can be correlated with diseased states, drug treatments, or metabolic changes. The identified molecular species may serve as a biomarker for the disease or condition in question, allowing the development of new methods of diagnosis and treatment. Conventionally, due to the large amount of protein typically present in any sample extracted from natural tissue or cells, the protein must first be separated into individual components by gel or capillary electrophoresis or affinity techniques, however the individual protein levels can be assessed and compared to a database or between samples.
Mass Spectrometry (MS) is currently considered a valuable analytical tool for biochemical mixture analysis and protein identification because it can provide detailed structural information. Conventional methods of protein analysis therefore often combine two-dimensional (2D) gel electrophoresis for separation and quantification with mass spectrometric identification of proteins. Moreover, capillary liquid chromatography, as well as various other "front-end" separation techniques, have been combined with electrospray ionization tandem mass spectrometry for large-scale protein identification without the need for gel electrophoresis. Using mass spectrometry, qualitative differences between mass spectra can be identified, and proteins corresponding to peaks that occur only in certain portions of the spectra serve as candidate biomarkers.
In recent years, mass spectrometry has also gained popularity as a tool for identifying microorganisms due to its increased accuracy and shortened time to obtain results when compared to conventional methods for identifying microorganisms. By far, the most common method of mass spectrometry for the identification of microorganisms is matrix-assisted laser desorption ionization-time of flight (MALDI-TOF) mass spectrometry. In MALDI-TOF, cells of unknown microorganisms are mixed with a suitable uv light absorbing matrix solution and allowed to dry on a sample plate. Alternatively, extraction of microbial cells is used rather than whole cells. After transfer to the ion source of the mass spectrometer, a laser beam is directed at the sample for desorption and ionization of proteins, and time-dependent mass spectral data is collected.
The mass spectrum of a microorganism produced by MALDI-TOF method reveals several peaks from intact peptides, proteins, protein fragments and other molecules, which constitute the "fingerprint" of the microorganism. This method relies on the pattern matching of the peak distribution in the mass spectrum of an unknown microorganism to a reference database comprising a collection of mass spectra of known microorganisms obtained using essentially the same experimental conditions. The better the match between the spectra of the isolated microorganisms and the spectra in the reference database, the higher the confidence level of the identification of the organisms at the genus, species or in some cases subspecies level. Because the method relies on matching the pattern of peaks in MALDI-TOF mass spectra, there is no requirement to identify or otherwise characterize the protein represented in the spectrum of the unknown microorganism in order to identify it.
While MALDI-TOF methods are fast and economical, they have limitations that limit the scope of application to pathogen characterization and identification, including but not limited to toxicity detection and quantification, resistive marker determination, strain matching, and antibiotic susceptibility testing (to name a few). The information content within MALDI mass spectrometry reflects the majority of abundant and ionizable proteins that are generally limited to ribosomal proteins under the experimental conditions used. Since ribosomal proteins are highly conserved among prokaryotic cells, the discrimination of closely related microorganisms by MALDI-TOF is limited. In this case, many ribosomal proteins across closely related species contain identical or slightly different amino acid sequences (i.e., single amino acid substitutions), which cannot be effectively distinguished with low resolution mass spectrometers. Furthermore, the determination of strain and/or serovar type, antibiotic resistance, antibiotic susceptibility, toxicity or other important properties relies on the detection of protein markers other than ribosomal proteins, which further limits the application of MALDI-TOF for microbial analysis. Laboratories that use MALDI-TOF for microorganism identification must use other methods to further characterize the identified microorganisms. In addition, the reliance of MALDI-TOF methods on matching spectral patterns requires pure media to obtain high quality results and is therefore generally not suitable for direct testing, mixed media, blood media or other complex samples containing different microorganisms.
Several other mass spectrometry methods for the detection of microorganisms have been used. For example, mass spectrometry-based protein sequencing methods have been described in which liquid chromatography is combined with tandem mass spectrometry (LC-MS/MS) and sequence information is obtained from enzymatic digestion of proteins derived from a microbial sample. This method, referred to as "bottom-up" proteomic studies, is a widely practiced method for protein identification. The methods can provide for identification of subspecies or strain levels, as chromatographic separation allows for the detection of additional proteins beyond just ribosomal proteins, including those that can be used for characterization of antibiotic resistance markers and virulence factors.
In contrast to "bottom-to-top" proteomic studies, "top-to-bottom" proteomic studies refer to analytical methods in which a protein sample is introduced into a mass spectrometer intact without the need for enzymes, chemicals, or other means of decomposition. Top-down analysis enables the study of intact proteins, allowing direct recognition at the protein level, primary structure determination, and localization of post-translational modifications (PTMs). Top-down proteomic analysis typically involves introducing intact proteins into the ionization source of a mass spectrometer, fragmenting the protein ions, and measuring the mass-to-charge ratios and abundances of the various fragments so produced. The resulting fragmentation is much more complex than peptide fragmentation, which without the methods taught herein may necessitate the use of a mass spectrometer with extremely high mass accuracy and resolution capability in order to interpret the fragmentation pattern with acceptable certainty. The interpretation generally includes comparing the observed segmentation pattern to a protein sequence database that includes compiled experimental segmentation results generated from known samples, or alternatively to a theoretically predicted segmentation pattern. For example, Liu et al (Top-Down Protein Identification/Characterization of a Priori unknown proteins via Dissociation and Ion/Ion Reactions caused by Ion Trap collisions in Quadrupole/Time-of-Flight Tandem Mass spectrometers (Top-Down Protein Identification/Characterization of a Priori unknown proteins, Ion Trap chromatography-Induced Identification and Ion/Ion reaction in a Quadrupole/Time-of-Flight Mass-of-Flight Tandem Mass Spectrometer) have described kDa Protein Identification and Characterization of modified and unmodified unknown proteins with masses of up to 28, analytical chemistry (anal. chem.), 2009, 81, 1433-.
The advantage of top-down analysis over bottom-up analysis is that proteins can be identified directly, rather than being inferred as is the case with peptides in bottom-up analysis. Another advantage is that alternative forms of the protein can be identified, such as post-translational modifications and splice variants. However, top-down analysis has the disadvantage that many proteins can be difficult to isolate and purify when compared to bottom-up analysis. Thus, each protein in an incomplete separation mixture may generate a plurality of ionic species upon mass spectrometry, each species corresponding to a different respective degree of protonation and a different respective charge state, and each such ionic species may bring about a plurality of isotopic variants. A single MS spectrum measured in top-down analysis can easily contain hundreds to even thousands of peaks belonging to different analytes, all interlaced over a given m/z range, with ion signals of very different intensities overlapping and mutually suppressing.
Because mass spectra of biological samples obtained in top-down analysis are generally extremely complex, improved methods are needed for interpreting the mass spectra. The resulting computational challenge that such methods must overcome is to trace back each peak to a certain analyte and determine the molecular weight of the analyte once this is done for one or a few analytes in a process best described as mathematical decomposition (also known in the art as mathematical deconvolution). Yet another challenge associated with the use of mass spectrometry of proteins and polypeptides in clinical settings is to derive this information in the shortest time period possible, often referred to as "real-time" analysis. Clearly, it is more challenging to calculate in real time during automated top-down data dependency analysis, since this should occur very quickly, especially when chromatographic separations are involved. To continue, it is necessary to provide both: (i) an optimized real-time calculation strategy, and (ii) a mass spectrometry data acquisition strategy that predicts multiple mass spectral lines for each ion species and predicts effective isolation of an analyte compound of interest from a potentially numerous contaminating compounds.
Existing data-dependent and dynamic exclusion workflow techniques and corresponding algorithms were developed for small molecules, small peptides, and other analytes that acquire a limited number of charges (e.g., 1-3 charges) in the electrospray ionization process. These conventional methods perform significantly less when applied to higher molecular weight biopolymer analytes, most often intact proteins during the course of a top-to-bottom proteomic study, due to a combination of different electrospray behaviors and computational limitations. More specifically: (1) in general intact high quality analytes and in particular proteins form charge states (up to 50 charges or more per molecule, e.g. fig. 12C) much more than small molecules during the electrospray ionization process, due to the large number of charge acquisition sites resulting in a much more complex MS spectrum; (2) in complex mixtures, such as cell lysates or fractions thereof, there is a broad distribution of molecular weights and very complex overlapping copies resulting in charge state distribution patterns with varying intensitiesThe number of the cells; (3) the rate of change of physiochemical properties of high quality analytes of the same or different chemistry produces a significant rate of change of chromatographic peak shape and analyte retention on the column; (4) if at, for example, OrbitrapTMMass spectra are acquired on high resolution mass spectrometers such as mass analyzers (electrostatic trap-like mass analyzers) or time-of-flight (TOF) mass analyzers, then the corresponding peaks are further resolved into the number of isotopes in a series of clusters whose masses are often far from the theoretical binomial distribution; (5) the matrix ionization effects of a variety of different proteins can greatly affect the observed intensities of multiple overlapping species in order to distort the true ratio of protein intensities found in any given standard or sample. The oxidized species of the same analyte or adduct, the overlapping of isotopic clusters, and the inability of existing software tools to correctly calculate the charge state of high quality species introduce an additional level of complexity.
Indeed, the above considerations imply that in the case of intact proteins and other biopolymers, existing data-dependent algorithms are promiscuous and MS/MS is performed in a redundant manner for several different charge states from the same biopolymer. Also, when isotope clusters do not match the traditional binomial distribution pattern defined by the number of carbon, hydrogen, nitrogen, oxygen, and sulfur atoms present in a given biopolymer or do not meet the intensity threshold or signal-to-noise ratio requirements, redundancy occurs from segmenting multiple isotopes belonging to the same isotope cluster. This iterative work results in redundancy in the identification of the most abundant/ionizable protein, while information about other substances is lost and provides a trigger for MSnThere is little opportunity for analysis.
With respect to efficient instrument-associated data acquisition strategies, it may be noted that ion-ion reactions have gained greater utility in the field of biomass spectrometry over the last decade, mainly using Electron Transfer Dissociation (ETD) to dissociate peptides/proteins and determine the main sequence information and characterize post-translational modifications. Proton transfer, another type of ion-ion reaction, has also been fully utilized in biological applications. Experimentally, in one form of proton transfer, multi-positively charged protein ions (i.e., protein cations) from a sample are allowed to react with a single chargeThe reagent anions react so as to reduce the charge states of the individual protein cations and the number of such charge states of the protein cations. When the reagent anion is present in large excess over the protein cation population, these reactions continue with pseudo-first order reaction kinetics. The rate of reaction is proportional to the square of the charge of the protein cation (or other multiply charged cation) times the charge on the reagent anion. The same relationship also applies to reactions of opposite polarity, defined here as the reaction between a singly charged reagent cation and a population of multiply charged anions derived from a protein sample. This results in a series of pseudo-first order continuous reaction curves, as defined by the starting multiply-charged protein cation population. Although the reaction is highly exothermic (in excess of 100 kcal/mole), proton transfer is an electron coupled process performed in the presence of a background gas of 1 mtorr (i.e., helium) and thus does not fragment the initial population of multiply charged protein cations. The collision gas is used on a microsecond time scale (10)8Collisions per second) to remove excess energy, thus preventing fragmentation of the resulting product ion population. The collision gas is used on a microsecond time scale (10)8Collisions per second) to remove excess energy, thus preventing fragmentation of the resulting product ion population.
Proton Transfer Reactions (PTRs) have been successfully used to identify proteins in protein mixtures. In particular, the application of the proton transfer reaction method can be envisaged as a mixture-simplified process, which is carried out in real time (a few milliseconds) in a mass spectrometer, which separates the mass spectral features of proteins and polypeptides from each other and from generally low-charge contaminating ions. This procedure enables isolation of analyte proteins and polypeptide ions as a group or as individual ion species, and has therefore been used to determine the charge state and molecular weight of high quality proteins. PTR has also been used to simplify the product ion spectrum derived from collisional activation of multiply charged precursor protein ions. Although PTR reduces the overall signal derived from multiply charged protein ions, this is more than compensated by a significant gain in signal-to-noise ratio of the resulting PTR product ions. The PTR process is 100% efficient, producing only a single series of reaction products, and no side reaction products requiring special interpretation and data analysis.
Various aspects of the use of PTRs for the analysis of peptides, polypeptides and proteins have been described in the following documents: us patent 7,749,769B2 in the name of inventor Hunt et al, us 2012/0156707a1 in the name of inventor Hartmer et al, us 2012/0205531a1 in the name of inventor zaborouskov; McLuckey et al ion/ion proton transfer kinetics: implications for the Analysis of Ions Derived from Electrospray of a Protein mixture (Ion/Ion Protein Kinetics for Analysis of Ion removed from electrodes of Protein Mixtures), analytical chemistry 1998, 70, 1198-; stephenson et al, ion-ion proton transfer reactions involving non-covalently interacting bio-ions: whole myoglobin (Ion-Ion protein Reactions of Bio-ionic non-reactive Interactions: Holomologlobin), journal of the American society for Mass Spectrometry (J.Am.Soc.Mass Spectrum.), 1998, 8, 637-644; stephenson et al, ion/ion reaction in the gas phase: proton transfer Reactions (Ion/Ion Reactions in the Gas Phase: proton Reactions invasion Multi-Charged Proteins), journal of the American chemical society (J.Am.chem.Soc.), 1996, 118, 7390-; McLuckey et al, "Ion/Molecule Reactions for Improved effective Mass Resolution in Electrospray Mass Spectrometry" (Ion/Molecule Reactions for Improved effective Mass Resolution in Electrospray Mass Spectrometry), "analytical chemistry (anal. chem.), 1995, 67, 2493-; stephenson et al, "Ion/Ion Proton Reactions for Protein Analysis," analytical chemistry, "chem", 1996, 68, 4026-; stephenson et al ion/ion reaction for oligopeptide mixture analysis: use of Mixtures of 0.5-100kDa components (Ion/Ion Reactions for oligopeptidic Analysis: Application to Mixtures of 0.5-100 kDaCompounds), journal of the American Mass Spectrometry (J.am.Soc.Mass Spectrum.), 1998, 9, 585-; stephenson et al Charge Manipulation for Improved Mass Determination of High quality materials and Mixture Components by Electrospray Mass Spectrometry (Charge Manipulation for Improved Mass Determination of High-Mass specs and Mixture compositions by Electrospray Mass Spectrometry), journal of Mass Spectrometry (J.Mass Spectrum.) 1998, 33, 664-672; stephenson et al Simplification of Product Ion spectra derived from Multiply Charged Parent Ions via Ion/Ion Chemistry methods (analytical of Product Ion spectra derived from Multi-Charged Parent Ion/Ion Chemistry), "analytical of Chemistry (analytical of chem.), 1998, 70, 3533 & 3544, and Scalf et al Charge reduction Electrospray Mass Spectrometry (analytical of Chemistry), 2000, 72, 52-60. Various aspects of general Ion/Ion Chemistry methods have been described in McLuckey et al, Ion/Ion Chemistry of High-Mass Multiply Charged Ions (Ion/Ion Chemistry of High-Mass Charged Ions), Mass Spectrometry review (Mass Spectrum. Rev.) 1998, 17, 369-. Apparatus for performing PTR and for reducing ion charge states in mass spectrometers have been described in: U.S. pre-grant publication No. 2011/0114835a1 in the name of inventor Chen et al, No. 2011/0189788a1 in the name of inventor Brown et al, No. 8,283,626B2 in the name of inventor Brown et al, and No. 7,518,108B2 in the name of inventor Frey et al. The adaptation of PTR charge reduction techniques to the Detection and Identification of Organisms has been described by McLuckey et al (Electrospray/Ion Trap Mass Spectrometry for the Detection and Identification of Organisms; first Joint services seminar of Mass Spectrometry of biological Mass Spectrometry, Baltimore, Maryland, 1997, 28-30, 127-) 132).
The product ions produced by the PTR process can be accumulated into one or several charge states using a technique known as "ion parking. Ion parking PTR product ions formed from the originally differently protonated ions of any given protein molecule are consolidated into a particular charge state at a particular mass-to-charge ratio (m/z) value using a supplemental AC voltage during the reaction cycle. This technique can be used to concentrate the product ion signal into a single or limited number of charge states (and hence into a single or several respective m/z values) for higher sensitivity detection or further manipulation using collision activation, ETD or other ion manipulation techniques. Various aspects of ion parking have been described in the following: united states patent No. 7,064,317B2 in the name of inventor McLuckey; united states patent No. 7,355,169B2 in the name of inventor McLuckey; united states patent No. 8,334,503B2 in the name of inventor McLuckey; U.S. patent No. 8,440,962B2 in the name of inventor Le Blanc; and are described in the following documents: McLuckey et al, "Ion park reduction Ion/Ion Reactions in Electrical Ion traps," analytical chemistry (anal. chem.), 2002, 74, 336-; reid et al, "Gas Phase concentrations, Purification, and identification of intact Proteins from Complex Mixtures" (Gas-Phase concentrations, Purification, and identification of Whole Proteins from Complex Mixtures), "journal of the american chemical society (j.am.chem.soc.)," 2002, 124, 7353-); he et al, "Dissociation of Multiple Protein Ion Charge states after a Single Gas Phase Purification and Concentration Procedure (Dissociation of Multiple Protein Ion Charge states-Phase Purification and Concentration Procedure)," analytical chemistry (anal. chem.), "2002, 74, 4653-); xia et al, "Mutual Storage Mode Ion/Ion Reactions in a Hybrid Linear Ion trap," journal of the American society for Mass Spectrometry (J.Am.Soc.Mass Spectrum "), 2005, 16, 71-81; chrisman et al parallel ion parking: improve the Conversion of parent to First-Generation Products in electron Transfer Dissociation (Parallel Ion Dissociation of events to First-Generation Products in Electron Transfer Dissociation), analytical chemistry (anal. chem.) 2005, 77(10), 3411-3414, and Parallel Ion Parking of protein Mixtures by Chrsman et al, analytical chemistry (anal. chem.) 2006, 78, 310-316.
Due to ongoing requirements in the art for mass spectrometric proteomic analysis of complex natural samples analyzed in real-time or near real-time, there is a need for improved methods of functional and computational mass analysis that can effectively separate analytes from contaminants, distinguish signals from noise, correctly assign correlated m/z values to appropriate isotopic clusters, correctly determine charge states, and correctly organize the various charge states into a distribution envelope. These improvements are needed for success in data acquisition and optionally post-acquisition processing workflows. Preferably, the improved functioning methods, workflows and algorithms should be able to work in a "real-time" environment so that automated data-dependent decisions can be made while mass spectra are being acquired, and so that clinical interpretations can be made shortly thereafter. The present invention addresses these needs.
Disclosure of Invention
The present invention teaches the use of ion-ion reaction chemistry, wherein: (i) using one or more stages of proton transfer reactions, optionally supplemented by data-dependent segmentation, to simplify mass spectrometry analysis of a wrong-ion population derived from electrospray ionization of a sample comprising a mixture of compounds extracted from a sample of tissue, biological fluid, microorganisms, or other cells; and (ii) employing an optimized spectrum deconvolution procedure to automatically distinguish mass spectral signatures of multiple biopolymer molecules in a reduced spectrum in a sufficiently short time (i.e., a computation time of one second or less) such that decisions can be made in real time regarding the process of subsequent mass spectrometry steps of the same respective sample.
In particular, the inventors have found that by subjecting a restricted subset of mass to charge ratios of such ions to PTR, the population of resulting product ions comprises a much simpler population of charge states having a lower overall charge value (with the word "lower" or "reduced" in this context referring to lower or reduced in absolute value), which can be readily resolved and assigned to a particular protein or peptide ion. Since the PTR product ion represents a smaller complexity of the slave charge state than the original precursor ionMixture-derived subsets of multiply-charged species, mass spectrometry interpretation is greatly simplified, and the use of tandem mass spectrometry (MS/MS or MS-based mass spectrometry) can be performed on individual proteins or other components derived from microbial extractsn) Target analysis of (1).
The charge-reduced protein and peptide product ions resulting from a given proton transfer reaction yield larger mass-to-charge ratio (m/z) values than the original m/z values. For mixtures of protein ions having the same m/z value but different masses and charges, the mixtures can be separated on a microsecond or millisecond time scale. Furthermore, these multiply-charged protein ions with the same m/z values of different masses and charges can be separated from low m/z value background ions derived from small molecules, lipids, solvents or other interferents based on the charge square dependence of the reaction. The multiply-charged ions are thus separated in time from the background signal and thus produce a mixture of separated proteins at a highly increased signal-to-noise ratio (s/n). The inventors have found that due to these two factors, spectral features of a protein/peptide or any other analyte product ion can be significantly separated from those of most interferent ions. In addition, multiple stages of the PTR reaction may be performed to separate protein mixtures on low resolution instruments, such as linear ion trap mass spectrometers, in order to simplify and isolate these proteins and other analytes so that they may be passed through MSnThe analysis performs a target analysis. The present inventors have further discovered that the advantageous properties of simple PTR reactions can be even further amplified by performing an "ion shutdown" procedure in conjunction with the PTR reaction, thus enabling a system analyst to at least partially select or control the product ion charge state distribution resulting from the PTR reaction.
PTRs can also be used to improve high quality performance in mass spectrometry. In mass spectrometry, ions can be assigned an integer nominal mass or mass-to-charge ratio or an accurate or exact mass or mass-to-charge ratio. An accurate or exact mass or mass-to-charge ratio may be considered to include both integer components or values and decimal components or values. Atomic and molecular masses are measured in daltons (Da) and the m/z ratio is generally given in daltons per elementary charge or Da/e or Thomson (Th). It should be noted that in the examples of descriptive values of m/z ratios in this document, such ratios are understood to be provided in units of daltons per elementary charge, or Th. The exact or exact (i.e., non-integer) mass or m/z ratio may be expressed as an integer nominal mass or mass-to-charge ratio value or component and a corresponding decimal component. Thus, as used in this document, accurate mass determination or mass analysis may be considered to include sub-integer precision, i.e., accuracy of ± 0.5Da or better and preferably 0.1Da or better.
Alternatively, the exact or exact mass or m/z ratio may be defined in terms of parts per million (ppm) mass accuracy. For mass spectrometric determination of polypeptides and proteins, experimental mass accuracy of 50ppm or better, more preferably 10ppm or better and still more preferably 1ppm or better is generally required, since these molecules and their ions often have molecular or ionic masses of at least 10,000Da and up to 100,000 Da. Thus, as used in this document, accurate mass determination or mass analysis may alternatively be considered to include an accuracy of 50ppm or better, more preferably 10ppm or better, and still more preferably 1ppm or better.
In addition to improving the signal-to-noise ratio of this type of analysis, the present inventors also considered the reduction of charge on protein Ions that causes these large Ions to refold in the Gas Phase, as described in Zhao et al, impact of Ion/Ion Proton Transfer Reactions on the conformation of Gas-Phase Cytochrome C Ions, journal of the american society of mass spectrometry (j.am.soc.mass spectrometry), 2010, 21, 1208-. It is believed that this results in a more compact configuration which reduces the collision cross-section of the protein ions and thus increases their stability against fragmentation due to collisions with background gas molecules present in the mass analyser chamber. The inventors have found that this effect can be particularly beneficial in mass analysers employing image current detection, such as fourier transform ion cyclotron resonance (FT-ICR) mass analysers or OrbitrapTMMass analysers (a type of electrostatic trap mass analyser available from Thermo Fisher Scientific of Waltham, Mass.). Another potential reason for improved high quality performance is the large energy deposition into a given protein ion resulting from the PTR process. Due to the PTR processThe energy deposited exceeds 100 kcal/mol and is then effectively attenuated by the presence of the collision energy. This rapid heating process makes it possible for neutral molecules attached to the protein to "boil" via ion-dipole, ion-induced dipole, or dipole-induced dipole interaction. Most importantly, the reduction in charge state for high quality proteins can significantly improve the relatively high pressure transfer of these ions to, for example, the Orbitrap from ion guides, ion storage or ion trapping devices in which PTR processes are typically performedTMA mass analyzer, etc. a lower pressure region of a mass analyzer. The reduced charge state means that the ions are transported with less kinetic energy, thus limiting the formation of ion scattering, direct fragmentation or metastable species. The inventors further consider this latter property in, for example, OrbitrapTMThe realization of highly accurate mass analysis of PTR product ions is particularly significant in accurate mass spectrometers, such as electrostatic trap mass analyzers, which detect image currents generated by cyclic ion motion over an extended time range.
The present teachings are particularly useful for the analysis and identification of intact proteins having molecular weights in excess of 50 kDa. The present inventors have found surprising results which, in combination with the various advantageous factors mentioned above, allow for the accurate identification of multiple intact proteins or large peptides in a very complex mixture derived from a natural microbial sample. This identification can enable microbial identification at the substance, subspecies, or even strain level. The protein or polypeptide ion of interest, single or multiple species, may be selected so as to indicate the presence of a particular microorganism or cell type, or a particular strain or variant of a microorganism or cell type, or a given virulence factor or toxin, in a sample, individually or in combination, based on a priori knowledge or information, or the ability of a microorganism or cell to resist an antimicrobial compound or antibiotic drug.
The present invention provides in one aspect an alternative to the traditional bottom-to-top proteomic research approach, i.e. top-to-bottom analysis of intact proteins derived from microbial cells via a method that is applicable to substantially all microorganisms, including gram-positive bacteria, gram-negative bacteria, mycobacteria, mycoplasma, yeast, protozoa, filamentous (i.e. microscopic) fungi. The present invention provides for the identification of microorganisms at the genus, species, subspecies, strain-pathogenic variants and serovar level, even in samples containing mixtures of microorganisms and/or microorganisms directly from pure and/or mixed media and from direct sample (e.g., surface swabs, body fluids, etc.) analysis. In addition, the methods taught herein may be used for targeted detection of toxicity factors, antibiotic resistance, and susceptibility markers or other characteristics. The top-down method taught by the present invention is simple and fast, as no chemical or enzymatic decomposition of the sample is required and data processing is achieved in real time.
Methods according to the teachings of the present disclosure may include at least one or more of the following steps: microbial cell disruption, solubilization of proteins, sample cleanup (desalting, removal of insoluble components and debris, and/or aggregation), sample perfusion or flow injection, rapid partial liquid chromatographic separation, standard chromatographic separation, isoelectric focusing, ionization of proteins in solution, isolation of a given m/z range of ions, causing the isolated range of ions to undergo PTR so as to form first generation PTR product ions, optional isolation of m/z ranges of first generation PTR product ions, optional mass spectrometry in MS or MS/MS mode, optionally causing the isolated range of first generation PTR product ions to undergo a second PTR reaction so as to form second generation PTR product ions, mass spectrometry in MS or MS/MS mode, and identification of microorganisms via molecular weight analysis and/or protein sequence analysis, or using any statistical classification method. Preferably, but not necessarily, the mass spectrometry step is performed with a high resolution, high accuracy mass spectrometer, e.g. comprising OrbitrapTMA mass spectrometer of a mass analyzer.
Because the usual methods using a limited set of chemical reactants are performed, the methods of the present teachings are suitable for use within fully automated systems for sample preparation and mass spectrometry. Ideally, these methods can be automated from sample preparation to result reporting. The results may be automatically transmitted to the hospital's electronic medical record system, where the results may be directly linked to patient treatment strategies, insurance, billing, or used in a popular illness report. This integrated system facilitates the tracking of epidemic outbreaks at the hospital, local, regional, and global levels. For high throughput laboratories, multiple systems may interface to a central computer that integrates data from different instruments prior to reporting. The system can import phenotypic susceptibility data, where the data can be combined with the identification, toxicity, antibiotic resistance and keying information generated by the present invention.
The computational methods described herein enable efficient (1) non-redundant data-dependent spectroscopy analysis employing mass spectrometry workflow decisions based on computational results, and optionally post-acquisition data processing for individual high-quality analytes and mixtures thereof of different complexity. For data-dependent spectroscopy analysis, the novel "top P unique analyte-specific clustering" workflow and associated calculations described herein replace the "top P most abundant precursor" logic of the prior conventional prior art. The envelope associated with each such substance is the set of associated mass spectral lines (m/z values) that are all generated from a single unique molecule according to the method taught by the present invention. The envelope associated with each species groups together the various charge states and isotopic clusters indicated as having been generated from a single molecule. The method is also useful for mass spectral data where no peaks attributable to isotope distribution are observed (such as is the case with low resolution data) or mass spectral data with resolved isotope distribution but only one charge state per molecule. However, the substance-related envelope can exclude adducts removed prior to data analysis, if desired.
Tandem mass spectrometry (or more generally MS) can be performed on only selected representations of charge state distribution envelopes associated with a given species based on the results of the calculationsnAnalysis) after which data acquisition is for the next species-related charge state distribution envelope (i.e., envelope of a different compound) determined in the previous MS spectrum, and so on. In various embodiments, data derived from one or more stages of application of a subset of ions derived from a biological sample comprising a complex mixture of proteins and/or polypeptides and other organic molecules is calculated using Proton Transfer Reactions (PTRs) as described above. In MSnPrior to analysis, the calculated charge state distribution pattern is filtered to exclude oxidized (or other designated) species and various other undesirable adducts of the same analyte. In this method, the most likely sufficient information about the analytes in the sample is retrieved on a chromatographic time scale or in experiments where the sample is introduced into the mass spectrometer by perfusion, flow injection or by means of any other sample introduction device. In all cases, data acquisition redundancy is eliminated or significantly reduced altogether.
The optimized "top P unique analyte-specific clusters" computational workflow may include one or more of: (1) the use of centroids to represent peak locations; (2) the use of a binary or reduced intensity scale to represent peak height; (3) correct computational assignment of charge states to each peak (centroid) in the isotope clusters found in the scan; (4) the use of information about charge states to assign isotope clusters (resolved or unresolved) to appropriate charge state envelopes; (5) optionally determining the molecular weight; and (6) allowing only one (or a selected number) of MSs per individual charge state envelopenThe manner of events controls the acquisition of data dependencies. The "top P unique clusters" method can be set to identify and act on the densest charge state of a given biopolymer, the median charge state between the highest charge state detected and the densest charge state observed, or any other desired charge state (i.e., not only the maximum or median charge state) or combination of charge states. The method is thus well suited for use with a variety of ion activation methods for ion fragmentation, including but not limited to Collision Induced Dissociation (CID) and Electron Transfer Dissociation (ETD), which are defined for a given molecular weight range or in instances where the least abundant protein species are queried first. A similar approach may be employed for post-acquisition data processing, where the same computational logic is applied to the original MS spectrum that is completed acquisition prior to execution of the novel method. Real-time or post-acquisition data processing may further include molecular weight determination and analyte identification.
These principles taught by the present invention can be applied to fractions of various molecular weights and chemistries in high resolution tandem mass spectrometry systemsAnalytes, said systems including but not limited to based on or including OrbitrapTMA mass spectrometer instrument of a mass analyzer. Such instruments include the Orbitrap FusionTM、Orbitrap Velos-ProTM、Q-ExactiveTMAnd OrbitrapeLiteTMAnd quadrupole time-of-flight (QTOF) mass spectrometers and fourier transform ion cyclotron resonance (FT-ICR) mass spectrometers. Furthermore, the same computational principles can be applied to isotopically unresolved charge state envelopes that are visible in mass spectra obtained on high resolution mass spectrometry systems for relatively very high mass analytes, or to unit resolution mass spectra obtained on mass analyzers such as ion traps or any other Paul trap configuration. In an example, rather than making charge determinations based on distances between individual resolution lines of isotope clusters, these determinations are computed using distances between charge states within the same charge state envelope. Again, this cluster-based strategy can be applied to unit resolution data as well as data generated by linear ion traps and triple quadrupole instruments.
When used in conjunction with chromatographic separation, the proposed computational workflow method maximizes the information from each individual mass spectrum obtained during the course of a chromatographic run. The novel method may also be used in conjunction with mass spectrometry experiments in which samples are introduced by perfusion or flow injection. In most experimental cases, the novel method significantly reduces the total analysis time. When applied to already acquired data, the novel "top P unique analyte-specific clusters" workflow method can maximize the yield of information from MS spectra and can calculate the molecular weight of analytes in real time.
The novel principles, workflows and algorithms and methods described and taught in this disclosure are applicable in all cases when several analytes are detectable within the same mass spectrum by Mass Spectrometry (MS). For example, the novel teachings can be employed where two or more analytes are co-eluted from a chromatography column and the co-eluted analytes are simultaneously introduced into a mass spectrometer. As a second example, the novel teachings can be employed where two or more analytes are introduced into a mass spectrometer using a flow injection method. In yet a third example, the novel teachings can be employed where two or more analytes are introduced into a mass spectrometer using syringe perfusion. In still other examples, the novel teachings can be employed where the analyte is introduced into a mass spectrometer after separation by capillary electrophoresis apparatus or lab-on-a-chip apparatus. The novel method may be used in conjunction with mass spectrometers employing any known ionization technique, such as, but not limited to, photoionization, thermal spray ionization, electrospray ionization (ESI), desorption electrospray ionization (DESI), paper spray ionization, Atmospheric Pressure Chemical Ionization (APCI).
Accordingly, in a first aspect, a method is disclosed for identifying the presence or absence of a protein/polypeptide or other biologically relevant compound within a liquid sample comprising a mixture of compounds comprising a plurality of protein compounds or a plurality of polypeptide compounds or a plurality of proteins and polypeptides or other compounds, wherein the method comprises: (a) introducing a portion or all of the liquid sample into an electrospray ionization source of a mass spectrometer; (b) forming positively charged ions of the mixture of compounds of the portion of the liquid sample by electrospray ionization, the positively charged ions comprising a plurality of ionic species; (c) isolating a first subset of the ion species comprising a first range of mass-to-charge (m/z) ratios that includes m/z ratios of multi-protonated molecular species of the analyte compound; (d) generating a plurality of first generation product ionic species from a first subset of the isolated ionic species by causing the first subset of the isolated ionic species to react with a reagent anion, which upon reaction extracts a proton from each of one or more ionic species that includes a protonated species of a protein or polypeptide compound, for a predetermined duration of time; (e) generating a mass spectrum of the first generation product ion species or a second generation product ion species generated from the first generation product ion species using a mass analyzer; (f) conducting a search of the mass spectra of the first-generation or second-generation product ion species for a set of one or more m/z ratios that are diagnostic of the protein or polypeptide analyte compound; and (g) generating a determination of the presence or absence of the analyte compound within the sample based on a similarity measure between the set of m/z ratios identified in the mass spectrum and a set of one or more diagnostic m/z ratios. The similarity measure may comprise a metric calculated based on a determined percentage or proportion of one or more diagnostic m/z ratios found to occur in the measured set of identified m/z ratios. Alternatively, a similarity measure may be determined by comparing a set of m/z ratios identified in the mass spectra to a set contained in a protein, DNA or carbohydrate based database; and (h) using the foregoing information as a means of positively identifying any unknown microorganisms using spectral libraries, sequence-based searches, statistical classification methods (including but not limited to bayesian, logistic regression, and decision tree classifiers) to determine the presence of analyte compounds within the sample. As an alternative to forming positively charged ions in step (b), negatively charged analyte ion species may actually be generated. In such cases, the reagent anion is selected so as to transfer a proton to the analyte ion species, thereby reducing the absolute value of its negative charge.
In a second aspect, a method of identifying the presence or absence of a microorganism type in a sample is disclosed, comprising: (i) identifying a range of molecular weights for which co-presence in the sample is diagnostic of the presence of the microorganism type in the sample; (ii) identifying a list of analyte compounds whose co-presence in the sample is diagnostic of the presence of the microorganism type in the sample, the list of analyte compounds including protein compounds, polypeptide compounds, or both protein and polypeptide compounds; (iii) extracting from the sample a liquid solution comprising a mixture of proteins and polypeptides derived from the sample; (iv) performing a set of analytical steps for each respective analyte compound in the list; and (v) identifying the presence of a microorganism-specific analyte compound within the sample if the presence of a microorganism-specific analyte compound of the list of analyte compounds is identified within the liquid solution. The analysis steps performed for each respective analyte in the list include: (a) introducing a portion of the liquid solution into an electrospray ionization source of a mass spectrometer; (b) forming positively charged ions of the portion of the mixture of compounds of the liquid solution by electrospray ionization, the positively charged ions comprising a plurality of ionic species; (c) isolating a first subset of the ion species comprising a first range of mass-to-charge (m/z) ratios that encompasses m/z ratios of random or particular predetermined multi-protonated molecular species of the respective analyte compound; (d) generating a plurality of first generation product ionic species from the first subset of isolated ionic species by causing the first subset of isolated ionic species to react with a reagent anion, which spontaneously extracts protons from each of protonated species, including protein or polypeptide compounds, of one or more ionic species for a predetermined duration of time; (e) generating a mass spectrum of the first generation product ion species or a second generation product ion species generated from the first generation product ion species using a mass analyzer; (f) conducting a search of the mass spectra of the first-generation or second-generation product ion species to find a set of one or more m/z ratios that are diagnostic of the respective analyte compound; and (g) identifying the presence of the respective analyte compound within the liquid solution based on a similarity measure between the set of m/z ratios identified in the mass spectrum and the set of one or more diagnostic m/z ratios. The similarity measure may comprise a metric calculated based on a determined percentage or proportion of one or more diagnostic m/z ratios found to occur in the measured set of identified m/z ratios. Diagnostic m/z ratios can be derived from spectral or sequence databases. If the m/z ratio isolated in step (c) is a random multi-prime molecular species, then the search performed in step (f) is a sequence-based search. Otherwise, if the m/z ratio isolated in step (c) is a particular predetermined multi-protic molecular species, then a spectral library search is performed in step (f). In addition to using the foregoing information as a means of positively identifying unknown microorganisms using spectral libraries or sequence-based searches, statistical classification methods (including but not limited to bayesian, logistic regression, and decision tree classifiers) can be utilized for microorganism characterization and identification. As an alternative to forming positively charged ions in step (b), negatively charged analyte ion species may actually be generated. In such cases, the reagent anion or cation is selected so as to transfer a proton to the analyte anion species, thereby reducing the absolute value of its negative charge. Control of the PTR experimental process described herein may be performed manually or automatically in real-time using real-time spectral deconvolution.
The term "real-time spectral deconvolution" in the foregoing refers to spectral deconvolution of mass spectral data that is performed concurrently with a mass spectral experiment or analytical run that generated (or has generated) the mass spectral data. For example, mass spectral data acquired by mass analysis of analytes eluted at a first retention chromatographic retention time during gradient elution may be deconvoluted in order to identify the analytes while continuing collection of additional mass spectral data for additional analytes eluted at a second later retention time during the same gradient elution. Likewise, deconvolution of additional mass spectral data may be performed in order to identify additional analytes while continuing collection of mass spectral data for analytes that elute at a third elution time during the same gradient elution. Real-time spectral deconvolution may be facilitated by using a fast computer, such as a computer that performs the necessary calculations with parallel processing or a Graphics Processing Unit (GPU). Alternatively or additionally, real-time spectral deconvolution may be facilitated by using computationally efficient or optimized algorithms, such as those written at least partially in assembly language or that make extensive use of look-up tables in cache memory. Advantageously and as provided by the deconvolution calculation method according to the teachings of this disclosure (described in the appendix), the mathematical calculations will not introduce any significant delay (i.e., greater than 1.0 second) into the workflow relative to the same workflow without performing the deconvolution calculations.
More generally, the term "real-time" may be understood to mean when used with reference to an event or activity associated with a data acquisition process that occurs while some aspect or sub-process of the data acquisition process is in progress. The data acquisition process itself may include one or more of the following individual sub-processes: sample purification (e.g., solid phase extraction, size exclusion chromatography); sample separation (e.g., chromatography); sample transfer into the mass spectrometer (e.g., perfusion or entry of a chaotropic solution from a chromatograph); ionizing a sample in an ion source to produce first generation ions; selection and isolation of ions for further manipulation; causing fragmentation of ions derived from the sample or reaction of ions derived from the sample with reagent ions so as to produce first generation product ions; optional selection and isolation of product ions; optional further fragmentation of the product ions or further reaction of the product ions; the transmission of ions (first generation ions or first or subsequent generation product ions) to a mass analyser, the detection and measurement of ion mass to charge ratios by a detector of the mass analyser; and the transfer of data derived from the detection and measurement to a digital processor for storage, mathematical analysis, and the like. Such defined events or activities that may occur "in real time" may include, but are not necessarily limited to: determination or identification of the presence of an analyte in a sample; identification or determination of the presence of a microorganism in a sample; and providing a notification to the user of the identification or determination of the presence of the analyte or microbe in the sample.
The above as well as various other features and advantages of the present teachings will become more fully apparent from the following description and appended claims, or may be learned by the practice of the invention as set forth hereinafter.
Drawings
To further clarify the above and other advantages and features of the present invention, a more particular description of the invention will be rendered by reference to specific embodiments thereof which are illustrated in the appended drawings. It is appreciated that these drawings depict only illustrative embodiments of the invention and are therefore not to be considered limiting of its scope. The invention will be described and explained with additional specificity and detail through the use of the accompanying drawings in which:
FIG. 1 is a block diagram schematically illustrating a system for rapid extraction and analysis of soluble proteins from at least one microorganism for identifying the at least one microorganism;
FIG. 2 is a schematic representation of an exemplary mass spectrometer suitable for use in connection with methods according to the teachings of the present disclosure, the mass spectrometer comprising a hybrid system including a quadrupole mass filter, a dual-pressure quadrupole ion trap mass analyzer, and an electrostatic trap mass analyzer;
FIG. 3A is a flow chart of a first method according to the teachings of the present disclosure;
FIG. 3B is a flow chart of an alternative method according to the teachings of the present disclosure;
FIG. 3C is a flow chart of another alternative method according to the teachings of the present disclosure;
FIGS. 3D and 3E illustrate a flow chart of yet another alternative method according to the teachings of the present disclosure;
FIG. 3F is a flow chart of yet another alternative method according to the teachings of the present disclosure;
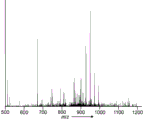
FIG. 4A is an ESI mass spectrum via direct infusion of a typical E.coli extract;
fig. 4B is a PTR product ion mass spectrum generated by isolating ions of the e.coli extract of fig. 4A within a 2Th mass window centered at m/z 750Th and reacting the isolated ions with PTR reagent anions;
FIG. 5A is a mass spectrum of a first generation PTR product ion generated by isolating an E.coli extract ion within a mass window of width 5Th centered at 1200Th and reacting the isolated ion with a PTR reagent anion;
FIG. 5B is a mass spectrum of second generation PTR product ions generated by isolating ions of the first generation PTR product ions of FIG. 5A within a mass window of width 5Th centered at 1320Th and reacting the isolated first generation product ions a second time with PTR reactant anions;
FIG. 6A is a mass spectrum of PTR product ions generated by isolating ions of an E.coli extract within a mass window of width 5Th centered at 640Th and reacting the isolated ions with PTR reagent anions;
FIG. 6B is a mass spectrum of an isolated PTR product ion species selected from the product ion collection of FIG. 6A and having an m/z ratio of 833 Th;
FIG. 6C is a mass spectrum of a second generation product ion generated by Collision Induced Dissociation (CID) of the isolated PTR product ion species of FIG. 6B;
FIG. 6D is a mass spectrum of an isolated PTR product ion species selected from the product ion collection of FIG. 6A and having an m/z ratio of 926 Th;
fig. 6E is a mass spectrum of a second generation product ion generated by collision induced dissociation of the isolated PTR product ion species of fig. 6D;
FIG. 6F is a mass spectrum of an isolated PTR product ion species selected from the product ion collection of FIG. 6A and having an m/z ratio of 917 Th;
FIG. 6G is a mass spectrum of a second generation product ion resulting from collision induced dissociation of the isolated PTR product ion species of FIG. 6F;
fig. 7A is a schematic depiction of a method of improved efficiency PTR conversion of ions of a selected analyte into a set of PTR product ions by simultaneous isolation and reaction of multiple m/z ranges of first generation precursor ions generated by electrospray in accordance with the teachings of the present invention;
fig. 7B is a schematic illustration of the isolation of a first randomly selected range of first-generation precursor ions for electrospray generation of PTR reactions as may be employed in an initial step of an improved efficiency PTR conversion method of ions;
fig. 7C is a schematic plot of the identification of two charge state sequences of PTR product ions corresponding to different analyte molecules as may be used as an intermediate step in a method of improved efficiency PTR conversion of ions;
FIG. 8 is a flow chart of a method of improved efficiency PTR conversion of ions of a selected analyte to a set of PTR product ions according to the teachings of the present invention;
FIG. 9A is a full scan mass spectrum of first generation ions generated from an eluate during the course of a ten minute gradient reverse phase liquid chromatographic separation of an E.coli extract at a10 minute 30 second residence time;
FIG. 9B is a PTR product ion spectrum generated by reacting sulfur hexafluoride with isolated ion populations of the sample of FIG. 9A for 10ms within a10 Th wide isolation window centered at 750 Th;
FIG. 10A is a full scan mass spectrum of first generation ions generated from an eluate at a residence time of 42 minutes 30 seconds during a course of a sixty minute gradient reverse phase liquid chromatography separation of an E.coli extract;
FIG. 10B is a PTR product ion spectrum generated by reacting sulfur hexafluoride with the isolated ion population of the sample of FIG. 10A for 10ms within a10 Th wide isolation window centered at 750 Th;
FIG. 11A is a full scan mass spectrum of first generation ions generated from a chaotropic solution at a residence time of 18 minutes 9 seconds during the course of a thirty minute gradient reverse phase liquid chromatographic separation;
fig. 11B is a PTR product ion spectrum generated by the reaction of PTR reactant ions with isolated ion populations of the sample of fig. 11A within a10 Th wide isolation window centered at 750 Th;
FIG. 11C is a full scan mass spectrum of a first generation ion generated from an eluate at a 22 minute 27 second residence time during the same thirty minute gradient reversed phase liquid chromatographic separation process whose earlier elution results are plotted in FIG. 11A;
fig. 11D is a PTR product ion spectrum generated by the reaction of PTR reactant ions with the isolated ion population of the sample of fig. 11C within a10 Th wide isolation window centered at 750 Th;
FIG. 12A is a schematic illustration of a simple intensity threshold based data dependent property spectrum analysis of two analytes exhibiting well resolved chromatographic peaks;
FIG. 12B is a schematic illustration of a portion of a chromatogram having highly overlapping isolated peaks that are both above the analysis threshold;
FIG. 12C is a graphical representation of multiple interleaved mass spectral peaks of two simultaneously eluted biopolymer analytes;
FIG. 13 is a set of chromatograms collected from a single liquid chromatography mass spectrometry experimental run of an E.coli extract, which contains a total ion current chromatogram (top curve) and also illustrates various extracted ion chromatograms contributing to the total ion current (lower curve), each of which represents a corresponding range of m/z ratios;
FIG. 14 is a flow chart of a general set of steps taken by various methods according to the teachings of the present invention;
FIG. 15 is a flow chart of a method of converting experimentally measured mass spectral centroids to occupancy arrays with indices that are related to each other by charge states encapsulated in a matrix according to the teachings of the present disclosure;
FIG. 16 is a flow chart of a method for constructing a Boolean-type occupancy array in mathematically transformed mass-to-charge ratio space from experimentally determined mass spectral centroid data in accordance with the teachings of the present invention;
FIG. 17A and subsequent FIG. 17B are a flow chart of a method for assigning a tentative charge state to a plurality of experimentally determined mass spectral centroids according to the teachings of the present disclosure;
FIG. 18 is a flow chart of a method for adjusting a set of previously tentatively assigned charge states such that the resulting final assigned charge states are self-consistent, according to the teachings of this disclosure;
FIG. 19 is a flow chart of a method for decomposing a set of experimentally determined centroids having assigned charge states into analyte-specific clusters according to the teachings of the present disclosure;
FIG. 20A and subsequent FIGS. 20B, 20C and 20D show C in the most abundant isotope exhibiting typical molecular weights13Expected number of atoms (mode), C among all isotopes13Expected average of atoms and difference between expected average and pattern, since they follow C in proteins12The total number of atoms varies;
21A, 21B, 21C and 21D are depictions of a computer screen user interface that may be combined with user control of and display of information from computer software employing methods according to the teachings of the present invention;
FIG. 22A is a depiction of a computer screen informational display illustrating peak cluster decomposition results as generated by computer software employing a method according to the teachings of the present invention calculated from mass spectra of a five component protein mixture consisting of cytochrome C, lysozyme, myosin, trypsin inhibitor, and carbonic anhydrase;
FIG. 22B is a depiction of a computer screen information display illustrating peak cluster decomposition results as produced by computer software employing a method in accordance with the teachings of the present invention, the display illustrating an expanded portion of the decomposition results shown in FIG. 22A;
FIG. 22C is a depiction of a computer screen information display illustrating peak cluster decomposition results as produced by computer software employing a method in accordance with the teachings of the present invention, the display illustrating an even further expanded portion of the decomposition results shown in FIG. 12B;
FIG. 23A is a depiction of a computer screen informational display illustrating peak cluster decomposition results as generated by computer software employing a method according to the teachings of the present invention, the display illustrating peak cluster decomposition results calculated from a single-stage mass spectrum of a crude extract of bacterial E.coli directly perfused into a mass spectrometer;
FIG. 23B is a depiction of a computer screen information display illustrating peak cluster decomposition results as produced by computer software employing a method in accordance with the teachings of the present invention, the display illustrating an expanded portion of the decomposition results shown in FIG. 23A;
FIG. 23C is a depiction of the mass spectral data in FIGS. 23A-23B showing a peak cluster decomposition thereof, showing peak positions and charge state assignments as provided by a conventional mass spectral peak analysis computer program;
FIG. 23D is a depiction of the mass spectral data in FIGS. 23A-23B showing a peak cluster decomposition thereof, showing charge state assignments as provided by a method in accordance with the teachings of the disclosure;
figure 24A is a depiction (main plot) of a mass spectrum of an intact antibody with varying degrees of glycosylation, further showing (inset) an expanded portion of the spectrum illustrating different glycoforms of the antibody;
FIG. 24B is a depiction of a computer screen informational display illustrating peak cluster decomposition results as generated by computer software employing a method according to the teachings of the present invention, calculated from the mass spectral data shown in FIG. 24A, showing calculated molecular weights for the four decomposed glycoforms of antibodies ranging from 148378Da to 148763 Da;
FIG. 25A is MS of protein carbonic anhydrase II resulting from collisional-induced dissociation of the +26 charge state of the protein occurring at m/z-807.00 Da2A description of spectra showing peak assignments as determined by conventional mass spectrometry methods;
FIG. 25B is a depiction of a computer screen information display illustrating peak cluster decomposition results as produced by computer software employing a method according to the teachings of the present invention, from the MS shown in FIG. 25A2Calculating mass spectrum data;
FIG. 25C is a graph formed by(II) a second MS of protein carbonic anhydrase II resulting from collision-induced dissociation of the +21 charge state of the protein at 1001.00Da2A description of spectra showing peak assignments as determined by conventional mass spectrometry methods; and
FIG. 25D is a depiction of a computer screen information display illustrating peak cluster decomposition results as produced by computer software employing a method according to the teachings of the present invention, from the MS shown in FIG. 25C2And (4) calculating mass spectrum data.
Detailed Description
The following description is presented to enable any person skilled in the art to make and use the invention, and is provided in the context of a particular application and its requirements. Various modifications to the described embodiments will be readily apparent to those skilled in the art, and the generic principles herein may be applied to other embodiments. Therefore, the present invention is not intended to be limited to the embodiments and examples shown, but is to be accorded the widest possible scope consistent with the claims. The particular features and advantages of the invention will become more apparent from the following description in the body of this document, taken in conjunction with the accompanying fig. 1 to 11D and fig. 12A to 25D, taken in conjunction with the description in the appendix of this document.
Referring now to fig. 1, a system 100 for extracting a protein from one or more microorganisms, detecting the protein, and identifying the one or more microorganisms is schematically illustrated. System 100 includes a sample handling device 115, a sample 110 accessible by sample handling device 115, and sources 120 of reagents, buffers, and the like, fluidly coupled to sample handling device 115 through various conduits or other transmission lines. The system 100 further includes a first and optionally a second sample purification device 135 (e.g., a solid phase extraction cartridge) configured for cleaning the sample (e.g., desalting, removing contaminants, aggregating proteins), and an optional chromatography column 140 that may be configured for at least partially purifying the sample 110 by liquid chromatography prior to mass spectrometry. The at least one sample purification device 135 may include an inline size exclusion chromatography column that may be used to remove not only salts but also small molecules and lipids. Sample 110, first and optional second sample purification devices 135, and optional chromatography column 140 are in fluid communication with fluid handling pump 130, various reagents, buffers, and other fluids 120, and mass spectrometer 150.
As illustrated in fig. 1, the system 100 further includes an optional control unit 160 that may be linked to the various components of the system 100 by linkages 170a-170 d. For example, control unit 160 may be linked to sample 110 to control sample application, to reagents 120 to control application of various reagents, to pump 130 to control fluid handling, flow rates, etc., to sample handling device 115 to control sample applicationPrepared, and linked to mass spectrometer 150 to control mass spectrometry parameters. In the illustrated embodiment, control unit 160 may also act as a data processing unit, for example, to process data from mass spectrometer 150, or to forward data to a server for processing and storage (server not shown in fig. 1). The control unit 160 may also determine in real time any resulting molecular weight and charge state of the PTR product ions for MS/MS, MSnOr molecular weight determination. The control unit 160 may also be used to automatically forward the results to the healthcare professional.
In some embodiments, the system 100 is designed for use by a clinician or general laboratory technician who is not necessarily skilled in all aspects of sample preparation, LC-MS operation, LC-MS method development, and the like. Thus, the control unit 160 can be designed to encapsulate the data system environment by providing a simplified application interface for the user, which can be used to initiate and monitor substantially all aspects of the assay sample 110 without requiring the user to interact with the overall hardware and control system of the system 100. The control unit 160 is thus configured to provide a degree of separation between the user and the underlying services that control the device, the data files, and the algorithms used to convert the data into a user-readable form. That is, the control unit 160 eliminates the need for the user to know or control hardware for analyzing the clinical sample and provides a simplified interface to send and receive information from the mass spectrometer.
The control unit 160 may be configured to monitor each sample analysis request internally and to be able to track the analysis requests throughout the system 100. Once the system 100 is acquiring or has acquired data of the sample 110, the control unit 160 may be configured to automatically begin post-processing the data based on the type of assay selected by the user. Most importantly, the control unit 160 may be configured to process the data in real-time during the acquisition process. Here the results are returned to the user in real time, containing microbial identification, toxicity and resistance characterization, strain matching information, and data on antibiotic susceptibility testing. Furthermore, control unit 160 may be configured to automatically select post-processing parameters based on the type of assay selected by the user, further reducing the need for user interaction with the system once an assay has been selected and started for analysis. The control unit 160 may be designed to fit in layers between the system 100 and the user to reduce the complexity required to set up the sample assay for acquisition. The control system 160 may also be configured to return only the most relevant data to the user to avoid the user receiving too much additional information.
In one embodiment, the system 100 may further include a sample detection device (not shown) operably coupled to or integrated with the sample handling device 115. The sample detection device may work with the sample handling device 115 or perform at least one of the following functions independently of the sample handling device 115: i. identifying a sample entering the system; identifying an assay type for a sample entering the system; selecting an assay protocol based on the type of assay desired and/or the analyte of interest; directing the sample handling device and/or the control system to initiate analysis of an analyte of interest in the sample; directing the control system to select one or more reagents based on a selected assay protocol for the assay type and/or analyte of interest; directing the control system to select a liquid chromatography mobile phase condition based on a selected assay protocol for the assay type and/or the analyte of interest, and to cause the liquid chromatography system to perform the assay and/or to purify the analyte of interest; directing the control system to select a mass spectrometer setting based on a selected assay protocol for the assay type and/or analyte of interest, and cause the mass spectrometer to generate mass spectral data associated with the selected assay type and/or analyte of interest; directing the control system to analyze mass spectral data associated with the selected assay type and/or analyte of interest to identify the presence and/or concentration of the analyte of interest.
The sample or treated sample can be purified and or purified prior to analysis by mass spectrometry. This purification or sample clarification may refer to a procedure that removes salts or lipids from the crude cell extract, or enriches one or more analytes of interest relative to one or more other components of the sample. It may also refer to sample processing and decontamination in a separate laboratory with a biosafety tertiary mechanism for handling mycobacteria or filamentous fungi. In this embodiment, the sample is transferred to the system and may be analyzed as previously described. In one embodiment, this purification or sample cleanup may be accomplished by a solid phase extraction device, inline size exclusion chromatography, and/or optional chromatography column 140.
In one embodiment, the first and/or second sample purification devices 135 may comprise Solid Phase Extraction (SPE) cartridges. In some embodiments, the SPE cartridge may be directly in-line with the high resolution/high quality accurate property spectrometer 150. In one embodiment, the SPE cartridge may be a polypropylene tip with a small volume of silica or other adsorbent containing a bonded C immobilized in the cartridge4、C8Or C18Or other functional groups, e.g. StageTipTMCassette (Thermo Fisher Scientific). In alternative embodiments, polymeric adsorbents or chelating agents may be used. The bed volume can be as small as 1 μ L or less, but larger volumes can also be used. The apparatus and method are well suited for complex samples derived from microbial cells, as each SPE cartridge is used only once, thereby minimizing the problem of carryover from one sample to another.
In one embodiment, sample purification device 135 may be an in-line size exclusion chromatography column designed to remove salts, small molecules, and lipids from sample 110. The method can also be used to separate media from large molecular weight proteins. The phases are selected to be compatible with a portion (i.e., less than 100%) of the organic solution and the organic acid. Adaptable molecular weight from 103To 108Da different protein size distribution. The flow rate is adjusted in real time to achieve separation of intact proteins from small molecules, with the separation flow rate typically being much less than the higher flow rate used to remove small molecules, lipids, and salts from the system. In this embodiment, the sample purification device 135 may also be heated to promote a faster diffusion rate of intact proteins, thus significantly shortening the run time. The flow of mobile phase through sample purification device 135 may also be diverted during a portion of the purification process to remove certain impurities from the flowing stream and prevent them from entering mass spectrometer 150.
In one embodiment, the optional chromatography column 140 can comprise a column configured for use in a sampleA column for at least partially chromatographic separation of proteins. The stationary phase in a chromatography column may be porous or non-porous silica or agarose particles, or a monolithic material polymerized or otherwise formed inside the column. The stationary phase may be coated with a suitable material, such as C18、C8、C4Or another suitable derivative, or contain cation exchangers or other materials, or combinations of the above, to facilitate separation of proteins, and this material may be chemically bonded to the particles or monolithic within the column. The particle size typically varies in the range of 1.5 μm to 30 μm. The pore size may vary from 50 to 300 angstroms. The internal diameter of the column typically varies in the range of 50 μm to 2.1mm, and the column length is in the range of about 0.5cm to 25cm or otherwise. The mobile phase or the exfoliant may be a pure solvent or a mixture of two or more solvents, and may contain added salts, acids, and/or other chemical modifiers. Proteins are separated on a column based on one or more physiochemical properties, including size, net charge, hydrophobicity, affinity, or other physiochemical properties. The chromatographic separation method comprises one or more of ion exchange, size exclusion, HILIC, hydrophobic interaction, affinity, normal phase or reverse phase chromatography.
Additional methods of purifying a sample may include, without limitation, liquid chromatography, HPLC, UHPLC, precipitation, solid phase extraction, liquid-liquid extraction, dialysis, affinity capture, electrophoresis, filtration, ultrafiltration, or other suitable methods known in the art for purification.
Various methods have been described that involve the use of HPLC for sample cleanup prior to mass spectrometry analysis. One skilled in the art can select HPLC instruments and columns suitable for use in the present invention. Chromatography columns typically contain a medium (i.e., packing material) to facilitate separation of chemical moieties both spatially and temporally. The media may include very small particles that may have bonding surfaces that interact with various chemical moieties to facilitate separation of analytes of interest. One suitable bonding surface is a hydrophobic bonding surface, such as an alkyl bonding surface. The alkyl bonding surface may comprise C4、C8Or C18An alkyl group is bonded. In addition, existing ones may be usedMonoliths and other phases known in the state of the art. The chromatography column comprises an inlet port for receiving a sample and an outlet port for discharging an effluent comprising a partially separated sample. For example, a test sample may be applied to a column at an inlet port, eluted with a solvent or solvent mixture, and discharged at an outlet port. In another example, more than one column may be used sequentially or as a two-dimensional (2D) chromatography system, where a test sample may be applied to a first column at an inlet port, eluted onto a second column with a solvent or solvent mixture, and eluted from the second column to an outlet port with a solvent or solvent mixture. Different solvent modes can be selected for the dissolved analyte. For example, liquid chromatography may be performed using a gradient mode, isocratic mode, or polytype (i.e., mixed) mode.
Fig. 2 is a schematic depiction of an exemplary mass spectrometer 150a that may be used as mass spectrometer 150 of fig. 1. The mass spectrometer illustrated in fig. 2 is a hybrid mass spectrometer, comprising more than one type of mass analyser. Specifically, mass spectrometer 150a includes an ion trap mass analyzer 216 and an OrbitrapTMAn analyzer, which is a type of electrostatic trap mass analyzer. As will be described below, since various analysis methods according to the teachings of the present disclosure employ multiple mass analysis data acquisitions, a hybrid mass spectrometer system can be advantageously used to improve duty cycle by using two or more analyzers simultaneously. OrbitrapTMThe mass analyser 212 employs image charge detection in which ions are detected indirectly by detecting image currents induced on electrodes by the movement of ions within the ion trap.
In operation of the mass spectrometer 150a, the electrospray ion source 201 provides ions of a sample to be analyzed to the aperture of the skimmer 202, where the ions enter the first vacuum chamber. After entry, ions are captured and focused into a dense beam by the stacked ring ion guide 204. The first ion optical transport assembly 203a transports the beam to a high vacuum region of the mass spectrometer downstream. Most of the remaining neutral molecules and undesirable high velocity ion clusters (e.g., dissolved ions) are separated from the ion beam by the curved beam guide 206. Neutral molecules and ion clusters follow a straight path, while the ions of interest are caused by the drag field to bend about a ninety degree turn, thereby creating a separation.
Quadrupole mass filter 208 of mass spectrometer 150a acts in its conventional sense as a tunable mass filter to pass ions only within a selected narrow m/z range. The subsequent ion optical transport assembly 203b delivers the filtered ions to a curved quadrupole ion trap ("C-trap") assembly 210. The C-trap 210 is capable of transporting ions along a path between the quadrupole mass filter 208 and the ion trap mass analyzer 216. The C-well 210 also has the ability to temporarily collect and store ion populations and then deliver the ions as pulses or packets to the OrbitrapTMCapabilities in the mass analyzer 212. The ion packets are transferred through the C-trap 210 and the Orbitrap and the C-trap 210TMThe potential difference is applied between a set of injection electrodes 211 between the mass analyzers 212. The curvature of the C-well is designed such that the ion population is spatially focused so as to match OrbitrapTMThe acceptance angle of the entrance aperture of the mass analyzer 212.
The multipole ion guide 214 and optical transport assembly 203b are used to guide ions between the C-trap 210 and the ion trap mass analyzer 216. The multipole ion guide 214 provides temporary ion storage capability so that ions generated in a first processing step of the analysis method can be later retrieved for processing in a subsequent step. The multipole ion guide 214 may also serve as a segmented unit. The various gate electrodes along the path between the C-trap 210 and the ion trap mass analyzer 216 are controllable so that ions can be transported in either direction, depending on the sequence of ion processing steps required in any particular analysis method.
The ion trap mass analyzer 216 is a dual pressure linear ion trap (i.e., a two-dimensional trap) that includes a high pressure linear trap cell 217a and a low pressure linear trap cell 217b, which are positioned adjacent to each other, separated by a plate lens with a small aperture that permits ion transport between the two cells and presents pumping limitations and allows different pressures to be maintained in the two traps. The environment of the high voltage cell 217a facilitates ion cooling, ion fragmentation by collision induced dissociation or electron transfer dissociation, or plasma-ion reactions such as proton transfer reactions. The environment of the low-voltage cell 217b facilitates analytical scanning with high resolution and mass accuracy. The low voltage unit contains a double dynode ion detector 215.
The use of a step of electron transfer dissociation or proton transfer reaction within a mass analysis method requires the ability to induce controlled ion-ion reactions within the mass spectrometer. The ion-ion reaction in turn requires the ability to generate reagent ions and to cause the reagent ions to mix with the sample ions. The mass spectrometer 150a as depicted in fig. 2 illustrates two alternative sources of reactant ions, a first source 299a of reactant ions being disposed between the stacked ring ion guide 204 and the curved beam guide 206, and a second source 299b of reactant ions being disposed at an opposite end of the instrument, adjacent to the low pressure cell 217b of the linear ion trap mass analyzer 216. In general, any particular system will contain at most only one source of reactant ions. However, two different sources of reactant ions are depicted and discussed herein for illustrative purposes. While the following discussion is directed to a source of reactant ions for PTR, similar discussion can be applied to a source of ETD reactant ions.
A first possible source 299a of reactant ions may be located between the stacked ring ion guide 204 and the curved beam guide 206. The reactant ion source 299a includes a glow discharge cell that includes a pair of electrodes (anode and cathode) exposed to a reactant gas conduit 298a that delivers a reactant gas from a reactant liquid (or solid) reservoir 297a having a heater that volatilizes the reactant compound. When a high voltage is applied across the electrodes, a glow discharge is initiated, which ionizes the reactants flowing between the electrodes. Reagent anions from the glow discharge source are introduced into the ion optics path in front of the quadrupole mass filter 208 where they can be m/z selected. The reactant ions may then accumulate in the multipole ion guide 214 and subsequently pass into the high voltage cell 217b of the dual pressure linear ion trap 216 where they are made available for the PTR reaction. The reaction product can be transferred directly to the low pressure cell 217a or OrbitrapTMThe mass analyzer 212 is used for m/z analysis.
A possible alternative reactant ion source 299a may be located adjacent to the low pressure linear trap cell 217b, where it may include an additional high vacuum chamber 292 from which reactant ions may be directed into the high pressure cell 217b through an aperture between the chamber 292 and the high pressure cell. In operation, the gaseous reactant compound is supplied from a reactant liquid (or solid) reservoir 297b having a heater that volatilizes the reactant compound and is directed through a reactant gas conduit 298b that delivers the reactant gas into the partially confined ion generation volume 296. In operation, thermionic electrons supplied from the electrically heated filament 294 are directed into the ion generation volume 296 at some predetermined energy by applying an electrical potential between the filament 294 and an accelerator electrode (not shown). The supplied energetic electrons cause ionization of the reactant gas to produce reactant ions. The reactant ions may then be directed by ion optics transport assembly 203a into high voltage cell 217b under operation of a gate electrode (not shown).
An exemplary method according to the teachings of this disclosure is schematically illustrated in the flow diagrams shown in figures 3A-3F. Fig. 3A schematically illustrates a first such exemplary method 300 for monitoring and optionally quantifying the presence of certain specific target analyte proteins or peptides in a biological sample. For example, the sample may be a sample of a microorganism. The initial steps 302, 304 and 306 of the method 300 are the steps of cell lysis (if the sample is a sample of microorganisms or other cells) and extraction, solid phase clarification or size exclusion chromatography and chromatographic separation, respectively, as described above. Step 302 may only be applicable if the sample comprises a tissue sample, a bacterial cell sample, a cell sample of another microorganism, or another form of cell sample. In some experimental scenarios, the extracted sample may be directly perfused into the mass spectrometer in a subsequent sample introduction step 308, thus steps 304 and 306 are shown by dashed lines as optional. The sample may also be prepared using an off-line method, including dialysis or other techniques known in the state of the art. However, in many other experimental scenarios, steps 304 and 306 are useful in order to at least partially purify the sample prior to mass spectrometry.
When the analysis must be completed according to time constraints, as in some clinical applications, the time required for the analysis can be shortened by employing the SPE step 304 (a time-compressed chromatography step as described in U.S.5,175,430 by inventor Enke) or the "flash partial chromatographic separation" (FPCS) method in the chromatography step 306 as described in international (PCT) patent application publication WO 2013/166169a 1. In general, in performing FPCS, a crude extract of microbial cells (small organic molecules, proteins and naturally occurring fragments thereof, lipids, nucleic acids, polysaccharides, lipoproteins, etc.) containing a complex mixture of various organic and inorganic analytes is loaded onto a chromatography column and subjected to chromatography. However, rather than allowing the gradient to dissolve each analyte separately (ideally, one analyte per chromatographic peak), the gradient is intentionally accelerated such that chromatographic peaks are not substantially obtained, for example, in approximately eight minutes or less, and preferably five minutes or less, rather than obtaining a much longer run time that would otherwise be required for baseline separation. In FPCS separation, many analytes are intentionally co-eluted from the column at any given time depending on their nature and the type of chromatography used (reversed phase, HILIC, etc.). Partial or incomplete separation may also be achieved by other methods known to those skilled in the art, including but not limited to reducing the use of mobile phase solvents and/or modifiers for retention of compounds on the column, reducing the choice of stationary phase media for retention of compounds on the column (including particle size, pore size, etc.), operation of the chromatography system at higher flow rates, operation of the chromatography system at elevated temperatures, or selection of different chromatographic separation modes (i.e., reversed phase, size exclusion, etc.). The FPCS technique produces few or possibly no analytical chromatographic peaks spanning the entire gradient. Thus, the only relevant information derived from the chromatogram is in general the elution time from the column. Each mass spectrum recorded represents a "subset" of co-resolved analytes, which are subsequently ionized, separated in a mass analyzer, and detected.
In step 308 (fig. 3A), the sample is introduced into the mass spectrometer. The sample may be provided as a chaotropic material emerging from an SPE cartridge, chromatographic apparatus or alternatively by direct infusion of a chaotropic solution. After being provided to the mass spectrometer, the sample is injected by an electrospray ionization source of the mass spectrometerThe compound is ionized (step 308). These electrospray-generated ions are referred to herein as "first generation" ions. At this point, full or segmented MS may optionally be performed1The protein rich regions in m/z space are scanned (step 309). (Note that in this document, the term "scan" may be employed to refer generally to mass spectrometry when used as a noun, or alternatively to acquisition of mass spectrometry when used as a verb). In a preferred embodiment, MS is available over the full mass range of the mass spectrometer instrument1The scan is such that the information-rich portion of the spectrum can then be selected for isolation in a data-dependent or independent manner (step 310). However, in the case of target analysis, MS1Scanning may not be necessary and execution of the method 300 may proceed directly to step 310, where a subset of the ions are then isolated for further reaction and analysis. When target analysis is employed, the isolation performed in step 310 may be such that ions within a certain predetermined m/z range or possibly a plurality of predetermined m/z ranges are retained for subsequent reaction and analysis, while ions outside one or more predetermined m/z ranges are discarded. The predetermined m/z range is selected so as to correspond to a preferably known m/z ratio of the target analyte protein or peptide, the presence or amount of which is detected or monitored in the performance of the method.
In general, the isolation of step 310 may be performed in a known manner by introducing ions from an ion source into an ion trap (e.g., a three-dimensional ion trap, a curved ion trap (sometimes referred to as a "C-trap"), a single-segment linear ion trap, a multi-segment linear ion trap, a multipole ion guide, or a quadrupole mass filter), and then resonantly ejecting ions having m/z ratios outside a desired range by applying a supplemental AC voltage across pairs of electrodes of the ion trap or applying an appropriate RF/DC voltage ratio to isolate a population of ions of interest. In some embodiments, the frequency of the supplemental voltage may be swept through various frequencies to cause ions to be ejected in a sequence according to their m/z ratios. In such cases, the ions may be detected as they are ejected in order to generate a mass spectrum of the original set of ions. However, since mass spectrometry may not be required at this stage, the supplemental AC voltage may instead be applied as a combination of superimposed frequencies, selected so as to result in an m/z ratioSubstantially simultaneously, ions outside the desired range are expelled. In some embodiments, the combination of superimposed frequencies may be provided with multiple segments of missing frequencies (i.e., "gaps") such that ions comprising two or more non-contiguous ranges of m/z ratios are isolated simultaneously within the trap. Each of the non-contiguous ranges of m/z ratios may correspond to a preferably known m/z ratio of a respective unique target analyte protein or peptide. The applied RF/DC voltage ratio of the quadrupole mass filter can also be used to isolate a defined or target mass range of interest. The particular m/z range of the first generation ions is selected by a single or a series of fixed RF/DC voltage ratios in order to select the appropriate mass isolation window. The functional configuration employed in this case may be a hybrid mass spectrometer instrument comprising a quadrupole, a C-trap, an OrbitrapTMMass analyzers, and high energy collision cells (HCDs), where isolated ion populations may be stored in a C-trap or HCD cell for PTR experiments. The isolated population of first generation ions is referred to herein as "precursor" ions because these ions will undergo subsequent ion-ion reactions or fragmentation.
In a preferred embodiment, the isolation of the precursor ion population may be performed in a first segment of the piecewise linear ion trap. After isolation of the desired ion population, the multi-charged protein ion population may advantageously be moved to another segment of the linear ion trap. These steps may be repeated multiple times for a defined range of isolation of precursor ions prior to the PTR process.
Next, anions are generated from suitable high electron affinity based gaseous reactants using rhenium based filaments with chemical ionization or glow discharge ionization sources. Chemical ionization can be performed using nitrogen, methane, isobutane or other gases known in the state of the art. The anionic reactant may be a gas at room temperature, or may be a liquid with sufficient vapor pressure to produce an excess of anion that will drive the PTR process under pseudo first order reaction conditions. The anions are then transferred from the source region to the segmented linear trap, whereby the particular anion reactant mass is isolated using a supplemental AC voltage as described above. The anion source may be in-line with the electrospray source or mounted on the opposite end of the segmented linear ion trap. Alternatively, the quadrupole mass filter can also perform anion isolation, where the subsequent PTR process occurs in the instrument's C-trap or HCD cell.
In step 312 of method 300 (fig. 3A), the mass-isolated ions (i.e., "precursor" ions) are subjected to a proton transfer reaction in step 310, wherein the reagent anion species react with the sample precursor ions in the ion trap for a specified period of time to extract protons from the precursor cations. In one embodiment, the multi-charged precursor ion populations are reacted with the single-charged anion ion populations by adjusting a DC voltage offset of the piecewise linear ion trap so as to store the multi-charged positive ions and the single-charged anions to facilitate the PTR process. The reagent anion is selected such that in this example the reagent anion is now A Lowry base and rendering the precursor ions to behave as one or more species
 Lowry acid. The reactant anion is formed by the individual ionization of a suitable reactant gas/liquid with sufficient vapor pressure, including but not limited to sulfur hexafluoride, perfluoro-1, 3-dimethylcyclohexane, perfluorodecalin, and perfluorophenanthrane. After allowing the reaction to continue for a specified time, a supplemental AC voltage is applied across the electrodes of the ion trap in order to expel the reagent anions, leaving product ions and possibly some residual precursor ions within the ion trap.
In opposite polarity experiments, multiply charged anions derived from proteins or other biomolecules can also react with singly charged cations. A variety of sources can be employed to generate singly charged cations, including electron, chemical, and electrospray ionization processes. These reactions follow the same reaction kinetics as previously described. Typical reactant cations include pyridine, benzo (f) quinolone, and the noble gases argon and xenon. In addition, multiply-charged proteins of opposite polarity have also reacted, and multiply-charged anions from the nucleic acids have also reacted with multiply-charged cations of the proteins.
In step 314 of method 300 (fig. 3A), mass spectra are obtained from the product ions from the PTR process that remain in the ion trap over the full range of m/z ratios of interest. Mass spectra can be obtained in a known manner by sequentially detecting ions ejected from a 3D or linear ion trap in their m/z ratio order. Alternatively, the ions may be directed to different mass analysers of the mass spectrometer, for example a time of flight (TOF) mass analyser or OrbitrapTMElectrostatic trap mass analysers of the type available for analysis with greater accuracy or mass resolution, followed by sequential scanning through the ion trap. Furthermore, by directing the product ions to a separate analyzer, the ion trap can be refilled with a new sample of precursor ions while mass analysis is being performed. If the accurate mass analyser is of the type which detects an image current generated by cyclic ion motion within the ion trap, for example an FT-ICR mass analyser or OrbitrapTMMass analyser, then the PTR reaction step may advantageously reduce the collision cross-section of the target protein or polypeptide molecules so that these molecules remain stable in the trap for a sufficient length of time to produce a high mass spectrum. And, the PTR product ion as it is transported to the OrbitrapTMThe mass analyzer will have less kinetic energy after exiting the high pressure cbrap region. Due to the PTR process, the resulting product ion population will be completely desolvated, which will improve the quality of the resulting mass spectrum.
In step 316 of the method 300, the mass spectrum resulting from the mass analysis performed in step 314 is automatically examined in order to identify one or more individual series of relevant m/z ratios, wherein each m/z ratio of a series represents a respective different charge state, i.e. different degree of protonation, of a single intact protein or polypeptide molecule. For example, see fig. 7C, which depicts two different series of rows, represented by envelope 905 and envelope 906, respectively. After ionization and after PTR reaction, has mass mpEach protein or polypeptide molecule M of (a) represents at least one (and possibly several different) protein or polypeptide cationic species. Each such cationic species of the relevant series formed by a particular molecule M may be represented by the formula (M + zH)z+Where the integer z is the number of protons added to the original molecule or after the PTR step in the proteinThe number of protons remaining in the proton. In this example, only monoisotopic ions are considered, mass to charge ratio (m/z)ionThus, it is given as follows:
(m/z)ion≈(mp+z×1.007)/z≈(mp+z)/z≈mpz (equation 1)
Wherein the final approximation is derived from mp>>z. Thus, this series of ion species, representing only different states of protonation, can be readily identified by using automated software in real time to determine the monoisotopic ions. Once this series has been identified, the molecular mass m of the parent protein or polypeptide molecule can be discerned in real timep. Similar methods can also be applied to molecules of larger molecular weight using average or monoisotopic mass. The automatic inspection of the mass spectral data and the identification of one or more individual series of relevant m/z ratios may be performed by any of a number of known mass spectral data analysis programs or software packages specifically designed for this purpose. However, for use in clinical applications or other time critical applications, this automatic check is preferably performed by an optimized computational method, such as the computational method described in detail in the appendix of this document.
The m/z values generated by the PTR process or alternatively the molecular weights obtained from the PTR product ions (step 402 of fig. 3A) may then be searched against a database containing tabulated values of m/z values or molecular weights of proteins or polypeptides in order to identify the presence of such analytes in the sample. If the sample is derived from a microorganism, the database may refer to individual pathogen standards containing observed m/z values or molecular weights from known reference standards/patient samples. In such cases, by matching these m/z values or molecular weights from a database containing individual reference pathogens, a small subset of possible pathogen identifications is obtained. The subset may be limited by determining a particular mass accuracy, weighting the intensities of individual peaks, and/or by weighting molecular weight values by mass in a given scoring system.
In some cases of microbial studies, m/z or molecular weight matching may provide a direct match to specific pathogen recognition that can be automatically determined (e.g., step 404 of fig. 3A). However, in all probabilities, m/z molecular weight information will substantially reduce the number of possible pathogen identifications that can be unambiguously identified using tandem mass spectrometry. This process is initially described in International (PCT) patent application publication WO 2013/166169A1 for use in conjunction with steps 302, 304, 306, and 308-310. Additionally, bayesian, logistic regression, or decision tree based methods can be employed to further refine the identification of pathogens. In a preferred embodiment, this m/z or molecular weight search is performed in real time during data acquisition (i.e., as the sample is being analyzed). Alternatively, the search may also be performed after acquisition (i.e., after the sample has been analyzed). A small number of m/z values or molecular weights (3 to 10) of proteins compared to a reference database will generally be five or fewer candidates sufficient to significantly reduce pathogen recognition.
Optionally, execution of method 300 may return to any of steps 302, 308, or 310 after execution of step 402 as indicated by the dashed arrow in fig. 3A. This same option also applies to method 370 illustrated in fig. 3B, method 380 illustrated in fig. 3C, method 390 illustrated in fig. 3D-3E, and method 395 illustrated in fig. 3F. Returning to step 302 corresponds to repeating all of method 300 in the analysis of different samples. Returning to step 308 corresponds to introducing a different portion of the same sample into the mass spectrometer system and repeating the mass spectrometry analysis for the different portion. In some cases, different portions of the same sample may comprise different chemical fractions of the same sample (i.e., they may comprise different compositions than previously analyzed portions), provided that the sample is chemically partially separated, for example, by chromatography (step 306) or by some other chemical moiety separation technique. In some cases, the different portion of the sample may comprise the same composition (or may be considered to comprise substantially the same composition) as the previously analyzed portion, provided that there is no chemical fractionation step or the rate of change in chemical composition resulting from fractionation is much slower than the rate at which the mass spectrometer system can repeat steps 312-402.
Returning from step 402 to step 310 corresponds to mass isolating one or more second different predetermined m/z ranges of the ion species in step 310 (as compared to the m/z ranges of the ion species isolated in the previous execution of step 310), and then repeating step 312-402 using the newly isolated ion species and their reaction products. This procedure of repeating steps 310-402 is particularly useful where it may be assumed that the sample composition has not changed between successive iterations of these steps. In these circumstances, the repetition of steps 310-402 may provide additional information from the same sample composition. The sample may often be assumed to remain constant or to be nearly non-different, provided that there is no chemical fractionation prior to introduction of the sample into the mass spectrometer or that the rate of change in chemical composition caused by fractionation is much slower than the rate at which the mass spectrometer system can repeat steps 312-402.
Figure 3B schematically illustrates a flow chart of a second exemplary method 370 according to the teachings of this disclosure. Steps 302-314 of method 370 (fig. 3B) are identical to similarly numbered steps of method 300 (fig. 3A) and, thus, the description of these steps is not repeated here. Method 370 differs from method 300 only with respect to steps subsequent to the generation of the mass spectrum in step 314. Mass spectrometry of PTR product ions, according to the method 300 described earlier, is assumed to be sufficient for the detection or quantification of proteins and polypeptides of interest. However, in many cases tandem mass spectrometry (sometimes referred to as MS/MS or MS) may have to be performed after the generation of the PTR reaction productn) In order to resolve remaining ambiguity in the recognition of a particular protein or polypeptide molecule. In other cases, it may be necessary to perform the second stage of PTR as discussed further below. In cases where fragmentation is desired, the PTR reaction product may be considered to comprise a first generation reaction product that is subsequently fragmented to form a second generation product ion. The combination of a particular m/z ratio of the first generation reaction product with one or more particular m/z ratios of the fragment ions may in many cases allow the identification of a particular protein or polypeptide molecule associated with a given pathogen. In many cases, proteins recognized by a particular pathogen may also be found in other similar pathogens. In order to correctly identify a single pathogen, it may be necessary to perform method 370 (specifically tandem mass spectrometry) on as many proteins as there are given PTR scores or PTR scores of the same sample.
In step 316 of method 370, a computational method is performed to automatically analyze mass spectral data of the PTR reaction product obtained in step 314. The computational methods attempt to identify the charge state sequence of a protein or polypeptide. The results of the real-time automated computational analysis obtained in step 316 of the method 370 may later be used as a basis for making m/z selections in subsequent step 318, where a subset of PTR product ions comprising a limited range of m/z ratios are selected and isolated for later segmentation in step 320. Preferably, the automatic identification of the sequence of charge states (step 316) is carried out by a fast computational method, such as the computational method described in detail in the appendix of this document, which is optimized for such real-time data analysis.
Thus, step 318-322 of method 370 (FIG. 3B) represents the application of a technique for tandem mass spectrometry or Selected Reaction Monitoring (SRM) applied to ions formed from PTRs. If permitted by the particular mass spectrometry system employed, a portion of the PTR product ions may have been stored (immediately after step 312) in an ion storage device of the mass spectrometry system. In such cases, branching step 315 results in the performance of step 317a, where previously stored ions are retrieved for further processing. Otherwise, if the mass analysis step (step 314) is depleted of previous batches of PTR product ions, then according to an alternative step 317b, it may be necessary to re-perform step 308-312 in order to generate new batches of such PTR product ions.
In step 318 of method 370, certain PTR reaction product ions (i.e., first generation product ions) within a particular m/z range or ranges are mass isolated by ejecting ions having an m/z ratio that is not within the range or ranges of interest. The isolated ions are then segmented in step 320. The particular selected range or ranges will generally be responsive to the details of the particular identified charge state sequence identified immediately prior to execution of step 316, and the selection will generally be made automatically by the computer. Thus, the selection of one or more particular m/z ranges for isolation and segmentation is an example of so-called "data-dependent analysis" (or "data-dependent acquisition," etc.).
In most conventional MS/MS analyses involving low mass molecules of several hundred to several thousand daltons, data dependent segmentation includes basing the previous MS1Information on data acquisition picks the "most abundant predecessor of highest P numberThe volume "is used for tandem mass analysis, where the number P is a constant or possibly a variable input by the user. This conventional form of data dependent analysis has been found to perform poorly when used in the analysis of multi-component samples of biopolymer analytes. For example, fig. 7C illustrates two charge state distributions represented by envelope 905 and envelope 906, respectively. In this example, each envelope corresponds to a different respective analyte molecular species. Thus, the set of rows contained by envelopes 905 and 906 may be referred to as a "molecular species-related charge state distribution. Considering that the rows (individual m/z values) in fig. 7C represent precursor ions, then if P is 10, then the conventional data-dependent segmentation technique would select the ten leftmost solid vertical rows below envelope 906 for segmentation. Using conventional techniques, the dotted line corresponding to the envelope 905 will not be selected. Conventional procedures would therefore produce redundant information related to the molecular species corresponding to envelope 906 and no information related to the molecular species corresponding to envelope 905.
To overcome the disadvantages of conventional data-dependent segmentation when applied to high molecular weight molecules, the present inventors have developed the novel "top P unique analyte-specific clustering" data-dependent technique used herein in order to replace the previous "top P number of most sufficient precursor" logic for application to high molecular weight molecules. The per-molecule species-related charge state distribution is interpreted according to the novel "top P unique analyte-specific cluster" logic as a collection of related mass-spectral lines (m/z values) that are all generated from a single unique molecule. The charge state distribution associated with each molecule of matter will be indicated as grouping together the various charge states and isotopic clusters that have been generated from the individual molecules prior to ionization. However, the molecular species-related distribution excludes the adduct that was removed prior to data analysis. According to the novel method, segmentation is performed on only one (or possibly more) selected representations of a given molecular species-dependent charge state distribution envelope, thereby avoiding the redundancy described above in connection with conventional data-dependent segmentation methods. According to the novel "top P unique analyte-specific cluster" logic, after a representative m/z ratio (or ratios) has been selected for the first molecular species-related charge state distribution, any further segmentation is for the next determined representative m/z ratio of the molecular species-related charge state distribution, and so on.
As previously described, the isolation performed in step 318 of method 370 may be achieved by: a supplemental AC voltage is applied across pairs of electrodes of the ion trap such that ions having an m/z ratio that is not within one or more ranges of interest are ejected from the trap, while those ions having an m/z ratio within the one or more ranges remain within the trap. In some cases, the ion trap used for mass isolation may be the same as the mass analyzer used in step 314 to perform full scan mass analysis.
The supplemental AC voltage applied to the ion trap for mass isolation may comprise a summation of superimposed frequencies such that ions in two or more non-contiguous m/z ranges are isolated simultaneously. In subsequent step 320, the mass-isolated first-generation product ions are segmented by a suitable ion segmentation technique, such as collision-induced dissociation (CID). The segmentation may be achieved by delivering first generation product ions (product ions formed from the PTR of the original precursor ions) in a known manner to a dedicated segmentation unit, the delivered ions being segmented within the segmentation unit so as to produce fragment ions, which comprise second generation reaction products. Optionally, a portion of the fragment product ions may be stored for possible future additional segmentation in optional step 321.
In step 322 of method 370 (fig. 3B), the fragments produced in step 320 are mass analyzed by a mass analyzer of a mass spectrometer. If the second generation product ions are generated within a fragmentation cell specifically dedicated to fragmentation purposes, the ions must first be transferred to a mass analyzer before execution of step 322. An ion trap mass analyzer may be employed in step 322 to analyze the second generation product ions, in which case the mass analyzer used in step 322 may be the same as the mass analyzer used in step 314 to perform the full scan mass analysis. Alternatively, an accurate mass analyzer capable of measuring mass-to-charge ratio with an accuracy of 10ppm or better may be employed for step 322, such as an FT-ICR mass analyzer, a time-of-flight (TOF) mass analyzer, or OrbitrapTMA type electrostatic trap mass analyser.
As is known, the correlation between the m/z value of a certain selected ion species undergoing segmentation and the m/z value (or values) of one or more fragment ion species generated by the segmentation may be sufficient to automatically determine (in step 402 b) the chemical identity of the selected ion species. In this case, the selected ion species are the mass-isolated PTR reaction product species generated in step 312 in step 318. The identification of small amounts (i.e., 3 to 10) of such proteins will generally be sufficient to uniquely identify the microbial substance (optional step 404 b). However, segmentation of a single stage may not be sufficient for performing chemical identification. In such cases, the second generation product ions may be further segmented so as to form next generation product ions, indicated by an optional iteration (indicated in dashed lines) from step 322 back to step 318, wherein a selected subset of the fragment product ions are isolated according to their m/z values, and the so isolated fragment ions are further segmented. More generally, n may be selectedthThe subset of product ions is used for further fragmentation by any suitable ion fragmentation method, such as, but not limited to, collision induced fragmentation, higher energy collision dissociation, electron transfer dissociation, electron capture dissociation, negative electron transfer dissociation, electron separation dissociation, fragmentation in the source, surface induced dissociation, or photodissociation, to form (n +1)thTo generate product ions. The results of the mass analysis step 322 may form the basis for an automated decision as to whether or not each additional segmentation is required and, if so, which m/z values correspond to the ion species to be segmented.
In the discussion above, the optional iteration of method 370 from step 322 back to step 318 is described with the purpose of further segmenting previously generated fragment ions. However, in some embodiments, the second or subsequent execution of step 318 may be for the following purposes: a second, different ion species of PTR reaction product (generated and possibly stored in step 312) is picked for segmentation based on the automatic identification of the sequence of charge states previously performed in step 316. The possible need for the second PTR step can now be understood with reference to fig. 12C. As an example, a first execution of the mass isolation step (step 318 of the method 370) may isolate ion species corresponding to mass lines belonging to the charge state envelope a208, while a second execution of the step 318 may isolate ion species corresponding to one of the mass lines belonging to the charge state envelope a 206. As described in the appendix of this document, each such set of mass spectral lines (either belonging to the set of envelope a208 or to the set of envelope a 206). The novel "top P unique analyte-specific clustering" workflow described in the appendix is specifically adapted to identify such clusters corresponding to different respective potential analyte molecules. According to this workflow procedure, a second execution of the isolation step (step 318) and the segmentation step (step 320) of the method 370 is performed in order to exclude isolation and segmentation of the ion species corresponding to the envelope a208 (assuming one such ion species is isolated and segmented during an earlier execution of these steps), even though they may have a greater intensity than the ion species corresponding to the envelope a 206. In this way, fragment information about different potential analytes is obtained during each iteration of the optional loop including steps 318-322.
The method 300 depicted in fig. 3A discussed above provides a relatively simple and straightforward method of sample analysis that may be applicable to relatively low complexity samples, such as when a highly resolved chromatographic separation (step 306) has been performed prior to introduction of the chromatographic portion into the mass spectrometer (step 308). However, the simple method 300 may not be suitable for more complex samples, and analysis of such samples may present some challenges. First, the proteins present in complex mixtures have a wide range of molecular weights. Second, the large number of charge states caused by the presence of large numbers of lysine, arginine, histidine residues can result in multiple overlapping peak sets, each corresponding to a different chemical species. Third, if the mass analysis (step 314) is of sufficiently high resolution, the presence of resolved peaks for the isotope distribution of any given charge state can confound most data processing algorithms. Finally, the distribution of available ions among multiple charge states and possibly among multiple isotopic states necessarily reduces the signal intensity of any resolved peak in the mass analysis.
To address the above challenges in the analysis of complex samples, a method 380, whose schematic flow diagram is illustrated in fig. 3C, provides an opportunity to perform multiple PTR phases. Under the earlier described method 300, it is assumed that the mass spectra obtained (in step 314) of the first generation PTR reaction product (generated in step 312) exhibit sufficient improvement in signal-to-noise ratio and sufficient reduction in isobaric interference such that charge state order can be identified and proteins or polypeptides can be identified. If this improvement in mass spectral quality is still insufficient for this purpose after the first PTR reaction event, then additional refining steps 327 and 330 of method 380 (FIG. 3C) may be performed. Furthermore, one or more of the PTR stages may utilize known techniques of "ion parking" in order to simplify the charge state distribution, as mentioned in the previous paragraph. Ion parking is a technique that inhibits certain selected ions/ion reactions within an ion trap. In practice, a resonant excitation waveform is applied across an electrode pair, ion guide or other ion storage device of the ion trap, of insufficient amplitude to cause ion expulsion but sufficient to increase the velocity of ions of a selected m/z value. This excitation process increases the relative velocity between the excited ion (cation, for the purposes of this discussion) and the reagent anion, and it is believed that this increase in relative velocity results in a decrease in the rate of reaction between the excited cation and the reagent anion.
During the PTR process, the rate of reaction between the cation and the reagent anion varies as the square of the number of charges of the various cations, with the anionic charge on the reagent ion equal to-1. Thus, in the absence of ion shutdowns, the PTR process results in a rapid reduction in the number of highly charged cations. During the course of the reaction, from a single molecular species M (having a mass M)pProtein or polypeptide molecules) is shifted towards lower charge states. The population of each ionic species having an intermediate charge state will first increase as the more highly charged precursor ions lose protons and then decrease as each respective species loses more protons, which then benefits from the decreasing number of more highly charged cations. If the PTR reaction is allowed to proceed to completion, the end result is complete neutralization of all such cations and complete loss of all mass spectral signals.
When an ion stopping technique is applied during the PTR reaction, then the charge reduction process essentially stops at the charge state z1Corresponding to a particular mass-to-charge ratio (e.g., m) of ions resonantly excited by an applied AC waveformp/z1). Derived from a molecular species M having an initial charge state z such that z>z1Will lose protons until its charge state is reduced to z1After which further reaction and proton loss will be prohibited. From having an initial charge state z such that z<z1Will be completely neutralized by those precursor cations derived from the molecular species M. Thus, after a PTR reaction with ion parking, a charge state z will pass in the mass spectrum1Represents a significant fraction of the originally protonated molecular ions (i.e., precursor ions) of molecule M. This "concentration" of molecular species M into a single charge state can advantageously amplify the mass spectral signal associated with the species, thereby improving the signal-to-noise ratio and lowering the lower limit of detection and optionally the lower limit of quantitation of the species. Furthermore, many isotopic variations of the ions generated from the molecular species M will have M/z values outside the range of values corresponding to the applied AC resonant excitation waveform. Such isotopic variants will be neutralized so as not to interfere with mass spectral identification of the ions of interest. Other isotopic variations include m/z values within a range of values corresponding to an applied AC resonant excitation waveform. The isotopic distribution pattern of such isotopic variant ions will be greatly simplified relative to the isotopic distribution observed in the original precursor ion, since they will mostly relate to the single charge state z of the ion generated from the molecule M1。
Returning to the discussion of the method 380 outlined in FIG. 3C, it should be noted that the steps 302-310 of the method 380 are identical to the similarly numbered steps of the method 300 (FIG. 3A) and are not described here. Subsequently, in step 328, the precursor ions are subjected to PTR, optionally modified by ion-stop techniques. Step 328 is performed by applying a supplemental AC excitation waveform across a pair of electrodes of the ion trap, as previously described, within which the sample-derived cations react with the reagent anions for a predetermined period of time. As described above, the employment of this "ion shutdown" procedure will concentrate the distribution of ions derived from any particular protein or polypeptide in a particular limited range of m/z values. This will generally confine ions derived from any particular protein or polypeptide to a particular charge state, thereby simplifying the resulting mass spectrum and increasing the intensity of any mass spectral peaks corresponding to a particular protein or polypeptide. The particular range of m/z values within which the ions are confined may include ions of different respective charge states derived from different respective molecular species. In some embodiments, the applied AC waveform to achieve ion stopping may comprise a summation of waveforms of different respective frequencies, such that the summed waveform causes the PTR reaction to produce a final population of PTR product ions corresponding to two or more non-contiguous m/z ranges.
In a subsequent step 330, the population of PTR product ions generated in step 328 is mass analyzed by a mass analyzer, and in step 331, automated calculations may be performed on the data generated in the mass analysis in order to automatically identify any charge state sequences that may be represented in the data, wherein each such charge state sequence corresponds to a different potential protein or polypeptide analyte. Prior to mass analysis at step 330, a portion of the PTR product ions may be stored (step 329) in preparation for possible subsequent PTR reactions. Depending on the results of the automatic identification of the sequence of charge states (step 331), an automatic decision can be made to subject the PTR product ions to this further PTR reaction, as indicated by the dashed optional path shown in fig. 3C. The decision may also be made based on the results of the automatic identification of the sequence of charge states to subject only a selected subset of PTR product ions to subsequent PTR reactions. In such cases, step 327 is performed. Thus, according to some embodiments, step 327-331 may comprise an iterative loop, wherein at each iteration of the loop, different respective ion species corresponding to different respective proteins or polypeptides are selected and isolated for further purification by the PTR process. The ion species selected in this manner can be determined in step 331 according to the novel "top P unique analyte-specific cluster" workflow described in the appendix of this document.
If the mass analyser employed in step 330 is of the type which detects an image current generated by cyclic ion motion within an ion trap or other ion storage device, for example an FT-ICR mass analyser or OrbitrapTMA mass analyzer, then the PTR reaction step may advantageously reduce the collision distribution of target protein or polypeptide molecules so that these molecules remain stable in the trap for a sufficient length of time to produce a high mass spectrum. After a sufficient number of PTR reaction steps, the chemical identity of the protein or polypeptide can then be rapidly discerned by matching to a database of known molecular masses (in step 402 c). The identification of small amounts (3 to 10) of protein will generally be sufficient to uniquely identify the microbial substance (optional step 404 c). Identification may also be accomplished via the use of classifiers applied to the PTR data as previously discussed, including, but not limited to, bayesian, logistic regression, or decision tree based approaches.
Figures 3D-3E illustrate in flow chart form another method 390 according to the teachings of the present disclosure. Step 302 of method 390-331 is shown in FIG. 3D and is identical to similarly numbered steps previously discussed for method 380 (FIG. 3C), and therefore, these steps are not described again here. Rather than proceeding directly from step 330 to the identification step 402D (as in method 380 of fig. 3C), execution of the method 390 (fig. 3D through 3E) proceeds from step 330 to the mass selection and isolation step 332. In step 332, a subset of PTR product ions generated by one or more applications of the PTR program are isolated according to the selected m/z ratio. The decision as to the particular m/z ratio to isolate during this step may be performed automatically based on the mass spectral results obtained in step 330 or based on the results of mass analysis of the fragment ions themselves (step 338) relative to optional subsequent mass isolation and segmentation (see optional repeat branch of fig. 3E). Step 332-338 illustrated in fig. 3E represents an ion fragmentation procedure that can be iterated (see optional repeat branches) to generate multiple generations of fragmented product ions. These steps 332-338 are similar to the steps 318-322 of the method 370 illustrated in FIG. 3B and therefore are not discussed in detail.
After the segmentation and mass analysis steps are performed, the peptide identification step 402d of method 390 (fig. 3E) is performed. The identification step 402a of the method 300 (fig. 3A) only utilizes the m/z ratios (or molecular weights) of the ionic species comprising protonated or multi-protonated analyte molecules, while the identification step 402d of the method 390 also takes into account the m/z ratios of fragments (possibly generations) of these ionic species. Thus, in the case of a complex mixture of proteins or polypeptides, a greater degree of confidence may be associated with the results of the identification performed using method 390. Control of the experiment may be performed in real-time by deconvolution with real-time data as described above according to some embodiments. The identification of small amounts (3 to 10) of proteinaceous matter in step 402d will generally be sufficient to uniquely identify the microbial matter in step 404 d.
Figure 3F schematically illustrates, in flow diagram form, another method 395 in accordance with the teachings of the present invention. Most of the steps in method 395 (FIG. 3F) are similar to the similarly numbered steps in method 370 (FIG. 3B) and are not described in detail again. Similar to method 370, method 395 includes the step of subjecting the original precursor ions to PTR charge reduction (step 312), followed by the steps of isolating selected PTR product ion species and subjecting the isolated ion species to fragmentation so as to form fragment product ion species (steps 318 and 320). Method 395 differs from method 370 by providing an additional step 340 of subjecting the fragment ions to PTR charge reduction. Since the various PTR product ion species generated from the original precursor ions may be multiply charged and may be distributed among the species with various degrees of protonation, the fragment ions formed therefrom may themselves be distributed among multiple protonation states. The PTR charge reduction of fragment ion species in step 340 may simplify the charge state distribution of fragment ions prior to their mass analysis in step 341. Optionally, either of the PTR steps (steps 312 and 340) may employ ion parking. The optional iteration from step 341 back to step 318 so that repeating step 318-: a second, different ion species of PTR reaction product (generated in step 312 and possibly stored) is picked for segmentation based on the automatic identification of the sequence of charge states previously performed in step 316. As previously discussed with respect to method 370 (fig. 3B), the second, different ion species may belong to a set of lines of a second charge state envelope that is different from the charge state envelope to which the previously isolated and segmented ion species belong (see also fig. 12C). The novel "top P unique analyte-specific clustering" workflow described in the appendix is specifically adapted to identify such clusters corresponding to different respective potential analyte molecules. In this manner, fragment information about different potential analytes is obtained during each iteration of the optional loop including steps 318-341 of method 395.
Example A
Fig. 4A and 4B provide examples of mass spectral signal enhancement provided by a single PTR reaction step (e.g., as in method 300 shown in fig. 3A). In a first application (fig. 4A, 4B), extracts from the pathogen e.coli were analyzed via direct infusion, and the mass spectra of the ions generated by the first generation electrospray are shown in fig. 4A. As expected, there are many proteins overlapping at various m/z values, resulting in a broad spectral region between approximately m/z 780 and m/z 1420 within which many ions are detected but with little information available in terms of the discernible distribution of protein charge states. Then, the m/z "window" of the first generation of ions having a width of 2Th and centered at m/z 750 is isolated, and the resulting isolated population of ions undergoes a PTR reaction. The m/z position 412a shown in FIG. 4A indicates the center position of the isolation window.
Figure 4B shows mass spectra of PTR reaction products of precursor ions of e. A PTR reaction was carried out in which from 3ppm of sulfur hexafluoride (SF) in a nitrogen stream delivered to a glow discharge reactant ion source contained within the ion optics of a mass spectrometer of the same general configuration as illustrated in figure 26) The derived reagent anion. As with most PTR product ion spectra, the mass spectrum shown in fig. 4B exhibits a relatively strong isolated peak at the location of the original first generation ion isolation window (as indicated by location 412B). These peaks at the location of the isolation window generally indicate the presence of residual singly charged first generation ions (generally of no concern) that occur by chance at the location of the isolation. The other peaks in the spectrum of fig. 4B represent product ions resulting from the PTR reaction. These product ions generally comprise overlapping sets of ions of interest, each set corresponding to ions comprising a charge state distribution from the original multiply-charged precursor ions within the original isolation window. One such possible charge state distribution pattern is approximately indicated by envelope 413. The results shown in fig. 4A and 4B show that the PTR reaction process generally significantly simplifies the spectrum and reduces background interference. However, due to the large number of proteinsDerived or peptide derived precursor ions may be present in the original isolation window and thus the charge state distribution patterns may overlap. Mathematical decomposition (sometimes referred to as "deconvolution") may be required to recognize individual patterns.
Example B
Fig. 5A and 5B illustrate an example of an analysis of an e.coli extract performed by a two-stage procedure involving a PTR reaction (see, e.g., steps 327, 328, 329, and 330 of method 380 in fig. 3C). Fig. 5A illustrates an isolated first generation precursor ion resulting from a PTR product ion spectrum within a 5Th mass window centered at m/z 1200, indicated by position 711 in fig. 5A. In this example, the initial PTR spectrum does not include peaks that are sufficiently well resolved to enable identification of any proteins in the sample. Thus, a subset of first generation PTR product ions are isolated for the second stage of PTR from within a 5Th mass window centered at m/z 1320, indicated by position 712a in fig. 5A and position 712B in fig. 5B. The second generation PTR product ions occurring at m/z ratios greater than 1320 in fig. 5B show a clear charge state distribution pattern that can be successfully used for identification of proteins in a sample.
Fig. 6A-6G illustrate an example of an e.coli extract analysis performed by a procedure comprising a first stage of formation of product ions by the PTR reaction followed by a subsequent stage of CID of the PTR reaction product ions (see, e.g., steps 312-322 of method 370 in fig. 3B). Fig. 6A illustrates an isolated first-generation precursor ion resulting from a PTR product ion spectrum within a 5Th mass window centered at m/z-640, indicated by position 811 in fig. 6A. The PTR product ions occur at a larger m/z ratio than indicated by position 811 in fig. 6A. The three most intense PTR product ions in fig. 6A located at the m/z ratios of 833, 926 and 917, respectively, and indicated by mass spectral peaks 813, 814 and 815 were then individually isolated and individually subjected to collision-induced dissociation in order to generate three sets of second-generation product ions. Fig. 6B and 6C depict isolated PTR product ions at m/z 833 and second generation product ions (fragment ions) generated by CID of the isolated PTR product ions, respectively. Likewise, fig. 6D and 6E depict isolated PTR product ions at m/z 926 and second generation product ions generated by the CID of the isolated PTR product ions at m/z 926, respectively. Likewise, fig. 6F and 6G depict isolated PTR product ions at m/z 917 and second generation product ions generated by the CID of the isolated PTR product ion at m/z 917, respectively.
Example C
As will be apparent from the previous discussion, cationic electrospray ionization of any protein or polypeptide molecule will produce multiple ions comprising different respective charge states (i.e., number of charges) due to different degrees of protonation of the original molecule. +50 or more charge states or possibly and each charge state will be represented by multiple mass lines representing different degrees of natural isotopic substitution. Another concurrency arises from the fact that: for most natural biological samples, many different proteins of a polypeptide molecule can be represented in a mass spectrum. Yet another concurrency arises from the fact that: many other molecules that are not necessarily of interest may be present in the sample.
In many studies oriented toward basic research, the above-described concurrency factors for multiple analytes and multiple interfering substances may be resolved, partially or completely, by performing colorimetric separation prior to introducing each separated compound individually into a mass spectrometer. However, clinical analyses are often performed under tight time constraints, which do not allow for traditional time-consuming chromatographic separations. Clinical time constraints may only allow incomplete or partial separation using Solid Phase Extraction (SPE), size exclusion chromatography, or the methods of Flash Partial Chromatographic Separation (FPCS) described above. Thus, when using these partial separation procedures, the mass spectral characteristics of any particular protein or polypeptide can be extended beyond a broad mass-to-charge ratio and can complicatedly overlap with the mass spectral characteristics of other compounds. Since the available charge provided by the electrospray apparatus will spread over many different types of ions, most observed mass spectral lines will co-exist and may be hidden in a generally dense population and low intensity or poorly defined spectral "background", schematically indicated by the spectral envelopes 902 in fig. 7A-7B.
The inventors have realized that the mass spectral signature of any particular protein, polypeptide, or other biologically relevant high molecular weight analyte can be hypothetically amplified by: multiple charge states of the same original molecule are simultaneously isolated, and then a collection of the multiple states are reacted with the PTR reactant ion to simultaneously reduce the collection to a small number of charge states distributed over several charge state values, which are reduced relative to the original charge state. This concept is illustrated by the vertical blocks 904a-904g shown in FIG. 7A overlying the general charge state envelope 902. Each such vertical box represents a particular precursor ion species and represents a small range of m/z values selected to correspond to a particular charge state (and possibly including several isotopic variations) of a particular analyte. Hypothetically, if all ions outside the range corresponding to the vertical box can be excluded and only ions from within the indicated range are mixed together, the subsequent PTR will essentially provide a summation of the signals from the various original multiple charge states. The use of such multi-species isolation of multiple precursor ion species can increase the sensitivity of the analysis by up to N times, where N is the number of m/z ranges selected and isolated simultaneously.
This multi-species isolation is quite easy to achieve when performed in a linear ion trap, such as the low-pressure linear trap cell 217b illustrated in figure 2, because the resonant excitation waveform used to eject the unwanted ions may be configured with multiple gaps. Each such gap corresponds to a different respective m/z window within which ions will not be ejected (and thus isolated). Thus, in some embodiments, the common isolation of multiple electrospray generated (first generation) precursor ion species may be performed by isolating all of the multiple precursor ion species simultaneously. One way to do this is by applying a broadband resonant ejection frequency waveform to an ion trap into which ions received from an electrospray source have been introduced, wherein the waveform comprises a plurality of summed sinusoidal frequency components, with the included frequency components corresponding to the m/z range of ions desired to be ejected from the trap and the excluded frequency components corresponding to the m/z range of ions desired to be retained within the trap. In this procedure, the omitted frequencies define one or more frequency notches in the ejection frequency waveform. The frequency components may be calculated by first picking the desired multi-notched waveform and then calculating the inverse fourier transform of the desired waveform.
Alternatively, the common isolation of the plurality of precursor ion species may be performed by isolating individual precursor ion species one ion species at a time in the conventional sense using respective single-notch waveforms applied to the ion trap. Individually isolated precursor ion species can be transferred to an ion storage component (such as the multipole ion guide 214 illustrated in fig. 2) one at a time, with various selected and isolated ion species accumulating over time. As yet another alternative, the common isolation of a plurality of precursor ion species received from an electrospray source may be performed by passing the plurality of ions through a quadrupole mass filter, while the band-pass of the quadrupole mass filter is sequentially tuned to in turn preferentially emit each m/z range corresponding to a particular precursor ion species. The filtered ions passing through the quadrupole mass filter are then passed to an ion storage assembly which accumulates ions from all preferentially emitted m/z ranges. For example, in the mass spectrometer 150a illustrated in fig. 2, the quadrupole mass filter 208 may perform a sequence of filtering steps and ions of each emission m/z range may be emitted into and accumulated within the multipole ion guide 214. The accumulated precursor ion species may then be conveyed back to the low pressure cell 217b for PTR reaction.
The above procedure employing simultaneous multi-species isolation assumes appropriate isolation ranges 904a-904g that are known a priori. This knowledge about the correct isolation range to be employed is available in certain instances of target analysis when the identity of the analyte to be searched (and other information about it) is already known and the purpose of the analysis is to determine the presence or absence of the analyte or to determine the amount or concentration of the analyte. However, the above assumptions may be invalid in the case of an investigation analysis where the identity of the analyte may not be known in advance. In these latter cases, an initial random investigation may be performed by isolating a random mass range 903 of the first generation ions as schematically depicted in fig. 7B and then reacting the isolated ions with PTR reagent anions. As previously illustrated in fig. 4A and 4B, this procedure can provide an resolved, interpretable mass spectral line relating to the charge state distribution of one or more analytes. In many cases, the set of correlation lines can be identified by their mutual consistency with equation 1 for some sequence of consecutive integers z. The degree of consistency of line positions may be performed automatically by computer analysis so that overlapping sets of such related lines may be mathematically decomposed and recognized.
As an example of the above type of analysis, mathematical decomposition of PTR product ion lines produced by isolation and reaction of precursor ions within the m/z range 903 may result in the identification of two overlapping line sets depicted by envelope 905 and envelope 906 as illustrated in fig. 7C. With the information provided by this initial investigation procedure, a suitable and consistent set of m/z values can be selected that can be used in subsequent simultaneous multi-species isolation and reaction procedures. For example, it may be possible to automatically select the m/z values of some parsed instances of the line below the envelope 905. Subsequent multi-species isolation and PTR reactions of precursor ions corresponding to these selected m/z values will then provide an amplified spectrum that can be used to determine the number or concentration of particular molecules represented by envelope 905. This procedure may be repeated later using the associated envelope 906 in order to determine the number or concentration of another molecule. The determined quantities or concentrations may not be accurate in an absolute sense, but the ratio of the determined quantities or concentrations may provide useful information relating to the relative quantities or concentrations. This entire procedure outlined above can be repeated multiple times using different randomly selected m/z ranges 903, providing a determination of the relative amounts or concentrations of several compounds. As previously stated, the results of real-time spectral deconvolution may be utilized to achieve control of such experiments in a data-dependent manner.
Fig. 8 provides a general flow diagram of an exemplary method 397 for investigation analysis using PTR signal amplification through reaction of PTR reactant ions with first generation ions from multiple non-contiguous m/z ranges as outlined above. Steps 302, 304, 306, 308, 309, 312, 314, 316, 402, and 404 of method 397 are identical to the similarly numbered steps of method 300 illustrated in fig. 3A and therefore are not described again here. Also, the new step 311 is similar to the previously described step 310 of the method 300, but step 311 involves only mass isolation of random m/z ranges (e.g., range 903 depicted in fig. 7C) of the first generation ions, and does not involve "one or more random or predetermined m/z ranges" as described for the previous method 300. After initial investigation of the PTR reaction (step 312) and identification of the charge state sequence (step 316), the latter preferably performed by the computational methods described in the appendix of this document, a step 323 is performed in which a plurality of non-contiguous m/z ranges of the first generation ions are isolated and accumulated, wherein the non-contiguous m/z ranges correspond to the identified charge state sequence. The first generation ions may be obtained from a previously stored batch of such ions (previous step 319a), or alternatively (previous step 319b), it may be necessary to repeat the sample introduction and electrospray ion generation steps.
After isolation and accumulation of a plurality of non-contiguous m/z ranges of first generation ions (step 323), the accumulated ions are reacted with PTR reactant ions (step 324). The resulting amplified spectrum will generally be of high quality, facilitating derivation of, for example, the exact molecular weight of the molecule or the exact number, concentration or relative abundance of such molecule corresponding to multiple non-contiguous m/z ranges (step 325). If the immediately preceding execution of step 316 identifies more than one set of relevant m/z ratios, then steps 319a or 319b and step 323-325 (following the leftmost "Y" branch of step 326) may be executed again using the new set of non-contiguous m/z ranges corresponding to the different identified charge state sequences. If the search for possible additional analytes is to continue, execution may return to step 311 (following the rightmost "Y" branch of step 326), where a different random m/z range is selected.
Example D
According to another method of sample complexity reduction utilizing proton transfer reactions according to the teachings of the present invention, mass spectrometry employing PTR can be directly linked to chromatography in order to simplify and detect additional proteins that would otherwise be missed. In this example, a full scan mass spectrum was taken and the protein molecular weight was calculated using a real-time deconvolution procedure. Then, an isolation window having a defined width is selected, and a subset of the m/z values in the window are subjected to PTR reaction.
For example, fig. 9A shows a full scan mass spectrum of first generation ions generated from an eluate at a10 minute 30 second residence time during the course of a ten minute gradient reverse phase liquid chromatography separation of an e. As indicated by brackets in fig. 9A, this full scan mass spectrum exhibits distinct spectral features of two proteins with approximate molecular weights of 35.1 and 31.1kDa, respectively. For the next step, ion populations having m/z values within m/z isolation window 510 with a width of 10Th and centered at 750Th are isolated. The isolated ionic population was then subjected to a PTR reaction with the anionic reactant sulphur hexafluoride for 10 ms. The resulting product ion mass spectrum shown in fig. 9B reveals mass spectral features of two additional proteins not seen in the full scan mass spectrum with molecular weights of 11220.07Da and 24599.56 Da. In addition, the 35.1kDa protein component previously observed in the full scan mass spectrum also exhibited spectral features in the PTR product ion spectrum, including a line corresponding to the +47 charge state at the nominal m/z value of 749, depicted in block 520. The line at 749Th represents a charge reduction of the even higher charge state of the 35.1kDa protein. The proteins observed at 11.2 and 24.6kDa would not be identified in the absence of the PTR step in this example of a reverse phase chromatography run due to complex spectral overlap and interference noise from a large number of singly charged background ions.
Fig. 10A and 10B show the results of similar chromatography/MS experiments obtained from the eluates at a retention time of 42 minutes 30 seconds from a sixty minute gradient elution run. As shown in fig. 10A, the high background at this time of elution causes difficulty in identifying the analyte peaks in the full scan spectrum. However, the PTR product ion spectrum plotted in fig. 10B is more susceptible to interpretation and mass spectral deconvolution. The PTR product ion spectrum exhibits mass spectral characteristics of three distinct proteins (specifically having molecular weights of 11165.92Da, 13480.28Da and 18727.23 Da) that would otherwise not be observed. In this example, PTR product ions are generated from isolated precursor ions generated from a10 Th wide mass spectral window (indicated by block 610 in fig. 10A) centered at m/z 750. By performing this type of analysis on the chaotropes that elute at various different residence times during a single experimental process, a sufficient number of sample peptides can be identified in order to achieve identification of the microorganism at the substance, subspecies or strain level. The results as shown in fig. 9A-9B also indicate that if there is an m/z overlap of protein ions from the full mass spectrum within the isolation window, the proteins will also be seen in the PTR product ion mass spectrum.
Interestingly, the full scan mass spectrum and PTR product ion mass spectrum can provide complementary information, as illustrated in fig. 11A and 11B, which represent mass spectral results obtained from an eluate that was eluted at a residence time of 18 minutes and 9 seconds during a thirty minute chromatographic separation. In this example, the full scan mass spectrum (fig. 11A) exhibited strong spectral signatures for substantially a single protein with a molecular weight of 9534.3Da, however, when the PTR product ion spectrum was generated from ions isolated within a10 Th wide window (block 530) centered at m/z 750Th, the mass spectral signatures included strong signals from a protein with a molecular weight of 14965.5Da (best represented by peak 535 of the +12 charge state at approximately 1247 Th) and five other tiny proteins with molecular weights of 12669.8Da, 14150.0Da, 14236.1Da, 14965.5Da, and 15117.5 Da. Figure 11C is a full scan mass spectrum obtained from the eluates eluted at a retention time of 22 minutes and 27 seconds during the same chromatographic separation. The spectrum comprises peaks indicating the presence of proteins having a molecular weight of 24961.3 Da. After PTR reaction of the isolated ions within the isolation window 540, the PTR product ion spectrum shown in fig. 11D was obtained. The mass spectral features in the PTR product ion spectrum comprise relatively strong signals from a protein with a molecular weight of 28461.5Da (best represented by the peak 545 of the +22 charge state at approximately 1294 Th) and two other proteins with molecular weights of 18590.5Da and 20168.0 Da. Thus, from the data at these two residence times only, it is possible to detect the presence and molecular weight of eleven different proteins.
Additional examples
The following paragraphs list additional specific examples of various specific embodiments according to the teachings of the present disclosure.
Example 1. a method for identifying the presence or absence of a protein or polypeptide analyte compound within a liquid sample, the liquid sample comprising a mixture of compounds, the mixture comprising a plurality of protein compounds or a plurality of polypeptide compounds or a plurality of protein and polypeptide compounds, the method comprising:
(a) introducing a portion of the liquid sample into an electrospray ionization source of a mass spectrometer;
(b) forming positively charged ions of the mixture of compounds of the portion of the liquid sample by electrospray ionization, the positively charged ions comprising a plurality of ionic species;
(c) isolating a first subset of the ion species comprising a first range of mass-to-charge (m/z) ratios that includes m/z ratios of particular predetermined multi-protic molecular species of the analyte compound;
(d) generating a plurality of first generation product ion species from the first subset of isolated ion species by causing the first subset of isolated ion species to react with a reagent anion for a predetermined duration, the reagent anion, upon reaction, extracting a proton from each of one or more ion species that includes a protonated molecular species of a protein or polypeptide compound;
(e) generating a mass spectrum of the first generation product ion species or a second generation product ion species generated from the first generation product ion species using a mass analyzer;
(f) conducting a search of the mass spectra of the first-generation or second-generation product ion species for a set of one or more m/z ratios that are diagnostic of the protein or polypeptide analyte compound; and
(g) identifying the presence of the analyte compound within the sample if the set of one or more m/z ratios is identified in the mass spectrum.
Example 2. the method of example 1, further comprising repeating the steps (a) through (e) a second time, wherein the steps (f) and (g) are performed during or before the second performing of the steps (a) through (e).
Example 3. the method of example 1, further comprising performing steps (a) through (g) in a plurality of repetitions, wherein each repetition of step (a) comprises introducing an eluate from a chromatography column corresponding to a respective retention time into the electrospray ionization source.
Example 4. the method of example 1, wherein the step (f) comprises conducting a search of the mass spectrum of the first generation product ion species to find a series of m/z ratios corresponding to a sequence of multi-protonated ion species of the analyte compound that are progressively charge reduced relative to the charge state of the particular predetermined multi-protonated molecular species.
Example 5. the method of example 1, wherein:
said step (c) comprises further isolating a second subset of said ion species, said second subset comprising a second m/z ratio range encompassing the m/z ratio of a particular predetermined multi-protonated molecular species of a second protein or polypeptide analyte compound;
said step (f) comprises conducting an additional search of the mass spectrum of the first-generation or second-generation product ion species for a second set of one or more m/z ratios that are diagnostic of the second protein or polypeptide analyte compound; and
the step (g) comprises identifying the presence of the second analyte compound within the sample if the second set of m/z ratios is identified in the mass spectrum.
Example 6. the method of example 5, wherein the first m/z ratio range is the same as the second m/z ratio range.
Example 7. the method of example 5, wherein the step (c) comprises simultaneously isolating the first subset of the ionic species comprising the first range of m/z ratios and the second subset of the ionic species comprising the second range of m/z ratios such that the first and second ranges of m/z ratios are non-contiguous.
Example 8. the method of example 1, wherein the step (d) of generating a plurality of first generation product ion species comprises causing a first subset of the isolated ion species and reagent anions to react for a duration that causes the product ion species to stabilize against decomposition during subsequent generation of the mass spectrum in step (e).
Example 9 the method of example 8, wherein step (e) comprises generating a mass spectrum of the first generation product ion species using a mass analyzer that generates the mass spectrum by detecting an image current caused by movement of the ions of the product ion species within an ion trap.
Example 10. the method of example 1, wherein the step (d) of generating a plurality of first generation product ion species comprises applying a supplemental AC voltage across electrodes of an ion trap within which a first subset of the isolated ion species react with reagent anions, wherein the frequency of the supplemental AC voltage is such as to inhibit ion-ion reactions between the reagent anions and selected first generation product ion species.
Example 11 the method of example 10, wherein the frequency of the supplemental AC voltage is such that, after performance of step (d), product ions formed from the analyte compound exist substantially as a single ion species having a particular charge state.
Example 12. the method of example 11, wherein:
said step (e) comprises generating a mass spectrum of said first generation product ion species; and
wherein the mass of the single ion species is greater than 20,000Da and the charge state of the single ion species is sufficiently large such that ions of the single ion species can be detected by a quadrupole mass analyzer, a Fourier transform ion cyclotron resonance mass spectrometer, or an electrostatic trap mass analyzer during generation of the mass spectrum.
Example 13. the method of example 1, wherein the step (e) of generating a mass spectrum comprises generating a mass spectrum of second-generation product ion species, wherein the second-generation product ion species are generated by:
isolating a subset of the first generation product ion species that includes a particular range of product ion m/z ratios; and
segmenting the isolated subset of the first-generation product ion species to form fragment ion species, wherein the fragment ion species comprise the second-generation product ion species.
Example 14. the method of example 1, wherein the step (e) of generating a mass spectrum comprises generating a mass spectrum of second-generation product ion species, wherein the second-generation product ion species are generated by:
causing the first-generation product ionic species to react with the reactant anion for a second predetermined duration, wherein a product of the reaction between the first-generation product ionic species and the reactant anion comprises the second-generation product ionic species.
Example 15 the method of example 14, wherein a supplemental AC voltage is applied across electrodes of an ion trap within which the first generation product ion species react with the reactant anions, wherein the frequency of the supplemental AC voltage is such that ion-ion reactions between the reactant anions and selected product ion species are inhibited.
Example 16. the method of any of examples 1-15, further comprising generating the liquid sample comprising the mixture of compounds by a procedure comprising:
(i) culturing the microorganism or cell;
(ii) lysing said cultured microorganisms or cells; and
(iii) extracting proteins from the lysate of the cultured microorganisms or cells.
Example 17. the method of example 16, wherein the step (iii) of extracting the liquid sample from the lysate comprises passing the lysate through a solid phase extraction apparatus.
Example 18 a method of identifying the presence or absence of a microorganism type in a sample, comprising:
(i) identifying a list of analyte compounds whose co-presence in the sample is diagnostic of the presence of the microorganism type in the sample, the list of analyte compounds including protein compounds, polypeptide compounds, or both protein and polypeptide compounds;
(ii) extracting from the sample a liquid solution comprising a mixture of proteins and polypeptides derived from the sample;
(iii) for each respective analyte compound in the list, performing the following steps:
(a) introducing a portion of the liquid solution into an electrospray ionization source of a mass spectrometer;
(b) forming positively charged ions of the portion of the mixture of compounds of the liquid solution by electrospray ionization, the positively charged ions comprising a plurality of ionic species;
(c) isolating a first subset of the ion species comprising a first range of mass-to-charge (m/z) ratios that encompasses m/z ratios of particular predetermined multi-protic molecular species of the respective analyte compound;
(d) generating a plurality of first generation product ion species from the first subset of isolated ion species by causing the first subset of isolated ion species to react with a reagent anion for a predetermined duration, the reagent anion, upon reaction, extracting a proton from each of one or more ion species that includes a protonated molecular species of a protein or polypeptide compound;
(e) generating a mass spectrum of the first generation product ion species or a second generation product ion species generated from the first generation product ion species using a mass analyzer;
(f) conducting a search of the mass spectra of the first-generation or second-generation product ion species for a set of one or more m/z ratios that are diagnostic of the respective analyte compound; and
(g) identifying a presence of the respective analyte compound within the liquid solution if the set of one or more m/z ratios is identified in the mass spectrum; and
(iv) identifying the presence of the microorganism type within the sample if the presence of each of the analyte compound list and each analyte compound is identified within the liquid solution.
Example 19a method of identifying the presence or absence of a microorganism type in a sample, comprising:
(i) identifying a list of analyte compounds whose co-presence in the sample is diagnostic of the presence of the microorganism type in the sample, the list of analyte compounds including protein compounds, polypeptide compounds, or both protein and polypeptide compounds;
(ii) extracting from the sample a liquid solution comprising a mixture of proteins and polypeptides derived from the sample;
(iii) introducing at least a first portion of the liquid solution into an ionization source of a mass spectrometer;
(iv) generating positively charged ions of the mixture of compounds from the at least a first portion of the liquid solution at the ionization source, the positively charged ions comprising a plurality of ionic species;
(v) isolating at least a first subset of the plurality of ionic species, each isolated subset of the at least a first isolated subset comprising a respective range of mass-to-charge (m/z) ratios;
(vi) generating a plurality of first generation product ion species from each isolated subset of ionic species by reacting each said isolated subset of ionic species with a reagent anion for a predetermined duration, said reagent anion, upon reaction, extracting protons from each of one or more ionic species of said isolated subset of ionic species comprising protonated molecular species of a protein or polypeptide compound;
(vii) generating at least one mass spectrum of first-generation product ion species or second-generation product ion species generated by further reaction of the first-generation product ion species using a mass analyzer of the mass spectrometer;
(viii) for each respective analyte compound in the list, performing the following steps:
(a) conducting a search of the at least one mass spectrum of the first-generation or second-generation product ion species for a set of one or more m/z ratios that are diagnostic of the respective analyte compound; and
(b) identifying a presence of the respective analyte compound within the liquid solution if the set of one or more m/z ratios is identified in the mass spectrum; and
(ix) identifying the presence of the microorganism type within the sample if the presence of each of the analyte compound list and each analyte compound is identified within the liquid solution.
Example 20. the method of example 19, wherein the performing of steps (a) and (b) is performed concurrently with the performing of one or more of steps (iii) through (vii).
Example 21. the method of example 19, wherein the microorganism type is defined as a particular bacterial species, and the list of analyte compounds includes a sufficient number of analyte compounds that are diagnostic of the particular bacterial species to enable identification of the presence or absence of the particular bacterial species in the sample.
Example 22 the method of example 19, wherein the microorganism type is defined as a particular bacterial substance, and the list of analyte compounds includes a sufficient number of analyte compounds that are diagnostic of the particular bacterial substance to enable identification of the presence or absence of the particular bacterial substance in the sample.
Example 23 the method of example 19, wherein the microorganism type is defined as a particular bacterial sub-substance, and the list of analyte compounds includes a sufficient number of analyte compounds that are diagnostic of the particular bacterial sub-substance to enable identification of the presence or absence of the particular bacterial sub-substance in the sample.
Example 24. the method of example 19, wherein the microorganism type is defined as a particular virus strain, and the list of analyte compounds includes a sufficient number of analyte compounds that are diagnostic of the particular virus strain to enable identification of the presence or absence of the particular virus strain in the sample.
Example 25 the method of example 19, wherein the microorganism type is defined as a particular virus strain, and the list of analyte compounds includes a sufficient number of analyte compounds that are diagnostic of the particular virus strain to enable identification of the presence or absence of the particular virus strain in the sample.
Example 26 a method for identifying the presence or absence of a protein or polypeptide analyte compound within a sample, the sample comprising a mixture of compounds, the mixture comprising a plurality of protein compounds or a plurality of polypeptide compounds or a plurality of protein and polypeptide compounds, the method comprising:
(a) introducing a portion of the liquid sample into an electrospray ionization source of a mass spectrometer;
(b) forming positively charged ions of the mixture of compounds of the portion of the liquid sample by electrospray ionization, the positively charged ions comprising a plurality of first generation ion species;
(c) isolating a plurality of subsets of the first generation of ionic species that include respective ranges of mass-to-charge ratio (m/z) ratios, wherein each range of m/z ratios includes an m/z ratio of ionic species that include a respective protonation state of the analyte compound;
(d) generating a plurality of first-generation product ion species from the isolated plurality of subsets of the first-generation ion species by causing the isolated plurality of subsets of the first-generation ion species to react with reagent anions that, upon reaction, extract protons from each ion species that includes a respective protonation state of the analyte compound for a predetermined duration of time;
(e) generating a mass spectrum of the first generation product ion species; and
(f) identifying the presence or otherwise the absence of the analyte compound within the sample if the mass spectrum comprises one or more lines at respective predetermined m/z ratios comprising respective intensities above a predetermined threshold.
Example 27 the method of example 26, further comprising performing steps (a) through (f) in multiple iterations, wherein each iteration of step (a) comprises introducing an eluate from a chromatography column corresponding to a respective retention time into the electrospray ionization source.
Example 28. the method of example 26, wherein the step (f) further comprises determining an amount or concentration of the analyte compound within the sample based on the one or more intensities if the mass spectrum comprises one or more lines at respective predetermined m/z ratios comprising respective intensities above a predetermined threshold.
Example 29. the method of example 26, further comprising, after the step (b) of forming positively charged ions and before the step (c) of isolating a plurality of subsets of the first generation ion species, the steps of:
(b1) isolating a subset of the first generation ion species comprising a randomly selected range of mass-to-charge (m/z) ratios;
(b2) generating a plurality of product ion species from the isolated subset of the first-generation ion species by causing the isolated subset of the first-generation ion species to react with a reagent anion that, upon reaction, extracts a proton from each ion species that includes a respective protonation state of the analyte compound or a respective protonation state of another protein or polypeptide compound;
(b3) generating a mass spectrum of the product ion species; and
(b4) automatically determining the m/z ratio range to be used in the subsequent step (c) based on the mass spectrum of the product ions.
Example 30 the method of example 28, wherein the step (b4) comprises automatically determining from the mass spectrum a set of m/z ratios for a multi-protonated ionic species corresponding to another protein or polypeptide compound.
Example 31a method of identifying the presence or absence of a microorganism in a sample, comprising:
preparing an extract of the sample;
repeatedly performing the method of example 26 so as to identify, at each performance, the presence or absence of a different respective protein or polypeptide analyte compound within the sample extract; and
identifying the presence of the microorganism within the sample if each respective protein or polypeptide analyte compound is present within the sample extract, or otherwise identifying the absence of the microorganism within the sample.
Conclusion
The use of PTR types of ion-ion reactions as taught in this document has several advantages for the analysis of complex mixtures of protein or polypeptide ions. A first significant advantage is readily observed by comparing fig. 4A with fig. 4B as being provided by a greatly improved signal-to-noise ratio. Even if some charge is lost due to the PTR process (i.e., complete neutralization), a significant signal-to-noise ratio is obtained due to the reaction of multiply charged proteins with singly charged anions. The rate of this reaction is proportional to the square of the product of the charges. Thus, initially highly charged analyte ions are converted to less charged PTR product ions whose mass spectral characteristics occur at significantly larger mass-to-charge ratios. In contrast, low charge state chemical background ions are significantly less affected by the PTR process during a typical experimental reaction cycle due to the low rate of reaction of these ions. This process essentially removes the mass spectral features of proteins and polypeptides from the low mass, low charge state chemical background "noise". For example, as shown in FIG. 4B, the background ion is represented by a large single charge peak "to the back left" at m/z ≈ 642. It is also believed that the adducts or water molecules that still adhere to the large proteins are removed due to the exothermic heat of reaction (at least 125 kcal/mole) deposited by the PTR reaction. Such ion transformations into simple protonated molecules may further enhance signal-to-noise characteristics. Potentially, the number of protein identifications obtained via this approach may exceed current complex top-down approaches that utilize some form of separation technique.
A second important advantage associated with the method according to the teachings of the present invention is provided by the greatly improved assignment of charge states. For example, the inventors have experimentally determined that approximately 75% of the charge state assignments for individual charge states can be correctly assigned by employing methods according to the teachings of the present disclosure. This improved ability to recognize charge states results from a significantly improved signal-to-noise ratio. This in turn provides a more accurate determination of the molecular weight of the protein or polypeptide. This comparison is applicable to the current Patterson-FFT charge state algorithm, which is often used for real-time charge state determination. Another important advantage associated with methods according to the teachings of the present invention is provided by the ability to perform fast throughput analysis. When combined with the rapid partial chromatographic separation techniques applied above, these methods allow for analysis of samples in a high throughput manner over a time scale of one minute or less.
The discussion included in this application is intended to serve as a basic description. While the invention has been described in terms of various embodiments shown and described, one of ordinary skill in the art will readily recognize that there could be variations to the embodiments and those variations would be within the spirit and scope of the present invention. Thus, the reader should appreciate that the detailed discussion may not explicitly describe all possible embodiments; many alternatives are implicit. Accordingly, many modifications may be made by one of ordinary skill in the art without departing from the scope of the invention as described in the claims. Neither the description nor the terminology is intended to limit the scope of the invention. Any patent, patent application publication or other document referred to herein is hereby incorporated by reference in its entirety as if fully set forth herein.
Appendix-mathematical calculation method
Structural elucidation of ionized molecules of complex structures such as proteins is often performed using tandem mass spectrometers coupled to liquid chromatographs. A general technique of performing Mass Spectrometry (MS) analysis on ions generated from compounds separated by Liquid Chromatography (LC) may be referred to as "LC-MS". If the mass spectrometry analysis is performed as tandem mass spectrometry (MS/MS), then the procedure described above can be referred to as "LC-MS/MS". In a conventional LC-MS/MS experiment, a sample is initially analyzed by mass spectrometry to determine the mass-to-charge ratio (m/z) corresponding to the peak of interest. The sample is then further analyzed by performing a product ion MS/MS scan on the selected peaks. In particular, it is often referred to as "MS1"obtaining a full scan mass spectrum comprising an initial survey scan. This full scan spectrum is followed by the selection of one or more precursor ion species (from the results obtained). Precursor ions of the selected species undergo a reaction, typically for example using a collision cell or using another form of fragmentation cell (for example using surface induced dissociation, electron transfer dissociation or photo dissociation)Those of (a) to (b) to achieve segmentation. In the second stage, the resulting fragment (product) ions are detected for further analysis using the same or a second mass analyzer (often referred to as "MS/MS" or "MS")2"). The resulting product spectrum exhibits a set of segmented peaks (fragment sets) that can be used in many cases as a means to derive structural information related to a precursor peptide or protein or other biochemical oligomer. It should be noted that using fragment ions as the starting population, the process of ion selection and subsequent segmentation can be repeated again, thereby generating an "MS"3"spectra". In the general case, the mass spectrum obtained after (n-1) iterative stages of selection and segmentation may be referred to as "MSn"spectra". This is a time consuming process as the sample needs to be analysed at least twice and the MS/MS data is only recorded for a limited number of components.
Most currently available mass spectrometers capable of tandem analysis are equipped with an automatic data dependency function whereby when slave MS is used1Ion peak selection in for MS2The precursor ions are analyzed while selecting the ion precursor at progressively decreasing intensities. In a simple data-dependent experiment shown in fig. 12A, the detector continuously measures the total current attributable to ions entering the mass spectrometer detector. Set a threshold intensity level A8 for total ion current below which only MS acquisition is possible1And (4) data. Upon dissolution of the first component detected as peak a10, the total ion current intensity crosses the threshold A8 at time t 1. When this occurs, an on-board processor or other controller of the mass spectrometer determines the MS1The most intense ion in the spectrum and immediately initiate an MS/MS scan for the most intense ion. Subsequently, the leading edge of another dissolution peak a12 was detected. When the total ion current again breaches the threshold intensity a8 at time t3, an MS/MS scan is initiated with respect to the most intense ion detected after time t 3. In general, peak a12 will correspond to the dissolution of a different chemical component, and thus the most abundant ions detected after time t3 will be different from the ions whose MS/MS analysis was conducted during dissolution of peak a 10. In this way, both MS and MS/MS spectra were acquired for each component as it was dissolved away.
The above simple data-dependent experiments work well for chromatographically resolved or partially resolved components, as illustrated in fig. 12A. However, in very complex mixtures there may be components where the dissolution peaks overlap completely, as illustrated by the ionic current intensity versus residence time graph in fig. 12B. The dissolution peak a11 represents the ion current attributable to ion m11 and the dissolution peak a13 represents the ion current attributable to ion m13 in this example, the masses of these ions being schematically illustrated in the mass spectral representation in inset box a 16. In the hypothetical situation shown in fig. 12B, there is almost complete overlap of the dissolution of the compounds causing ions m11 and m13, with the mass spectral intensity of ion m11 being consistently greater than the mass spectral intensity of ion m13 during the dissolution process. Under these conditions, the simple data-dependent technique discussed above with reference to fig. 12A will not always be able to initiate MS/MS analysis of ion m13 (and possibly other important ions), since only the most dense component (m11) will be selected for MS/MS.
The hypothetical two ion case illustrated in fig. 12B is a simplified example. Most modern mass spectrometer instruments are capable of MS-related1Each respective one of a number of sufficient ions detected in the analysis performs a series of MS/MS analyses. Typically, instead of picking only the single most abundant precursor, modern instruments will be based on previous MS1The information of data acquisition selects the "most sufficient precursor of the highest P number" for tandem mass analysis, where the number P is a constant or possibly a variable input by the user. However, the fundamental problem illustrated by fig. 12B remains particularly for multicomponent samples of biopolymer analytes that may give rise to tens to hundreds of mass spectral peaks in a single mass spectrum. Regardless of how this sample is introduced to the mass spectrometer (e.g., by chromatographic separation, flow injection, or capillary electrophoresis; as separate chemicals delivered from a lab-on-a-chip device, by perfusion, or other methods), more than one analyte may be represented in a single mass spectrum from a single point in time, and each such analyte may give rise to many ions, as illustrated in the hypothetical mass spectrum illustrated in fig. 12C. In FIG. 12C, the solid vertical line summarized by envelope A208 represents the centroid of the first set of mass spectral peaks generated from the first analyte compound, and the dotted vertical line summarized by envelope A206The straight line represents the centroid of the second set of mass spectral peaks resulting from the second co-resolved analyte compound. It is clear that even if the number P of most abundant peaks to be analyzed is equal to e.g. 10, more ions than just one of the analyte compounds will be selected for MS/MS analysis using the conventional data-dependent method described above. Information associated with the second analyte will be lost. Furthermore, the data thus obtained will include redundant information about the same component.
To more successfully address the complexity of mass spectrometry of co-ionized compounds, many mass spectrometry instruments also employ the so-called "dynamic exclusion" principle whereby their MS is acquirednThe spectra were then temporarily placed in an exclusion list. MS (Mass Spectrometry)nExcluded mass-to-charge ratios are not re-analyzed until prior MSnA certain duration of time has elapsed after the spectrum acquisition. This technique minimizes the chance that the same precursor ion is segmented in several subsequent scans, and allows the mass spectrometer to collect MS for other components with less dense peaks that would otherwise go uncheckednSpectra. After a selected period of time, the excluded ions will be removed from the list so that any other compounds with the same mass-to-charge ratio can be analyzed. This duration of ion species on the exclusion list is generally estimated based on an average or estimated chromatographic peak width. Thus, the use of the dynamic exclusion principle allows more data to be obtained regarding more components in a complex mixture.
Unfortunately, existing dynamic exclusion techniques may perform poorly for analyzing mass spectra of mixtures of complex biomolecules. For example, consider again the hypothetical scenario illustrated in fig. 12C. If the ions depicted in FIG. 12C were analyzed using the dynamic exclusion principle, then the ions would be passed through MSnAnalysis of MS as described1The descending order of their intensities in the spectrum analyzes at least 10 ion species derived from a single analyte (summarized by envelope a 208) before considering any peaks from lower abundance analytes (summarized by envelope a 206). This sequence will occur despite the fact that each precursor, each ion species, was placed on the exclusion list after its respective analysis. Performing ten unnecessary redundant MSsnAnalyzing the amount of time consumed may thenResulting in expiration of the time of exclusion of the most abundant ions (or may result in depletion of the time available for complete analysis of a small number of the most abundant ions), after which MS may be repeatednThe entire sequence was analyzed.
Another complicating factor in applying the principle of dynamic exclusion to mass analysis of mixtures of complex biomolecules derives from the fact that: the elution profile of various compounds is highly variable and difficult to predict. Due to the complex interactions between the chromatographic stationary phase and the biopolymers with multiple molecular interaction sites, different biopolymer compounds can exhibit different elution profiles. Furthermore, due to ionization suppression within the ionization source of the mass spectrometer, the temporal distribution of various ions generated from even a single such compound may not correlate with the dissolution distribution of non-ionized compounds or with the distribution of each other.
As an example of the rate of change of the dissolution profile that may be encountered, fig. 13 illustrates a set of chromatograms collected from a single liquid chromatography mass spectrometry experimental run of an e. The total ion current is shown in the uppermost chromatogram (curve a40), and various extracted ion chromatograms illustrating the ion currents contributed by the respective m/z ratio ranges are shown in the bottom five plots (curves a50, a60, a70, a80, and a 90). Curve A50 represents the m/z range 660.0-660.5 Da. Similarly, curves A60, A70, A80 and A90 represent m/z ranges 700.5-701.5Da, 1114.5-1114.5Da, 942.5-943.5Da and 540.5-540.5 Da. Peaks a1, a2, and A3 are examples of peaks with broad chromatographic distributions. Peaks a4 and a5 are examples of narrow distributions. Peak a6 shows a very broad peak. The peak width spans an order of magnitude, thus severely limiting the applicability of exclusion lists with predefined exclusion durations. To address the above computational difficulties, an improved optimized computational method for charge state assignment and for real-time identification of multiplexed charge state distributions, referred to as "top P unique analyte-specific clusters," is described below.
2.1. Key features of self-consistent mapping charge assignment algorithm
2.1.1. The use of a special centroid.Standard mass spectrum charge assignment algorithms (e.g., Senko et al, 1995) use the full distribution data of lines in the mass spectrum. In contrast, the novel approach employed in the method of the present invention uses centroids. A key advantage of using centroids on a line distribution is data compaction. Typically the number of distributed data points is about an order of magnitude greater than the number of centroids. Any algorithm that uses centroids will gain a significant advantage over the computational efficiency of standard assignment methods. For applications requiring real-time charge assignment, it is preferable to design an algorithm that requires only centroid data. The main drawback of using centroids is the inaccuracy of the m/z values. Factors such as mass accuracy, resolution, and peak picking efficiency all tend to affect the quality of the centroid data. But these problems can be mostly mitigated by incorporating m/z inaccuracies into algorithms that employ centroid data.
2.1.2. The intensity is binary.Another key difference from most existing algorithms is the encoding of the intensities as binary (or boolean) variables (true/false or presence/absence) according to the method of the present invention. The method of the invention only considers whether the centroid intensity is above a threshold. An intensity value assumes a boolean "true" value if the intensity value satisfies a user settable criterion based on signal strength or signal-to-noise ratio, or both, otherwise a value of "false" is assigned, regardless of the actual numerical value of the intensity. The encoding of digital values as simple binary values again brings about significant data reduction. In many programming languages, double precision values use eight bytes of memory storage, while binary (or boolean) values use only a single byte. Also, the comparison of boolean quantities is inherently much faster than the comparison of double precision variables. A well-known disadvantage of using boolean values is the loss of information. However, if there are a large number of data points to process, e.g., thousands of centroids in a typical high resolution spectrum, the loss of intensity information is more than compensated for by the absolute number of boolean variables. Thus, the inventors' method, and thus the algorithms taught herein, utilizes this data abundance to achieve both efficiency and accuracy.
However, additional accuracy without significant computational speed penalty can be achieved by using approximate intensity values instead of just boolean true/false variables. For example, a situation may be envisaged in which only peaks of similar height are compared to each other. The added information can be easily accommodated by discretizing the intensity values into a small number of low resolution bins (e.g., "low," "medium," "high," and "very high"). This binarization can achieve a good balance with "height information" without sacrificing the computational simplicity of the very simplified representation of intensity.
2.1.3. The mass-to-charge ratio values are transformed and combined into low resolution bins, and the relative charge state interval is pre-computed by one Secondary and cached for efficiency.Another innovation of the method taught in the present invention is that the m/z values of the mass spectral lines are transformed from their normal linear scale in daltons to a more natural dimensionless logarithmic representation. As can be seen from the detailed discussion below, this transformation greatly simplifies the calculation of m/z values for any peaks belonging to, for example, the same protein, but representing potentially different charge states. This transformation does not involve a reduction in precision. When performing calculations of transformed variables, cached relative m/z values may be utilized to improve computational efficiency.
2.1.4. Simple count based scoring and statistical selection criteriaCombining the centroid intensity as a boolean-type value encoding and m/z value transformation, the inventive method encodes the entire content of any mass spectrum in question as a single boolean-type value array. The score of the charge state is reduced to a simple count of yes or no (true or false) of the boolean variable at the transformed m/z position appropriate to the charge state being queried. This approach again bypasses the computationally expensive operations involving double precision variables. Once scores are compiled for a range of potential charge states, the optimal values can be easily picked by simple statistical procedures. Using statistical criteria is more rigorous and reliable than using arbitrary score cutoffs or just picking the highest scoring charge state.
2.1.5. Iterative process achieving optimality and defined by full self-consistency of charge assignmentThe final key feature of the novel method of the present invention is the use of appropriate optimality conditions that direct charge assignment to the solution. The optimum condition is simply defined as spectralAll ofThe most consistent assignment of charge of centroids. It is the inference under this condition that the charge states assigned to each centroid should be consistent with those assigned to other centroids in the spectrum. Algorithm implementation of the inventionThe procedure is iterated to generate charge state assignments as directed by the optimality conditions above. This procedure meets the accepted standards for optimization procedures. That is, first an appropriate optimality condition is defined, and then the algorithm is designed to satisfy this condition, and finally the effectiveness of the algorithm can then be judged by how well the algorithm satisfies the optimality condition. Most existing methods lack this logical framework, and their theoretical advantages are therefore difficult to assess objectively.
2.2.Details of the decomposition algorithm
The inventors have developed methods that are particularly capable of assigning self-consistent charge states to mass spectral lines and decomposing complex mass spectra that include overlapping information about several analytes into multiple line sets, where each line set corresponds to a respective analyte. FIG. 14 is an overview flow chart of a general set of steps for achieving these results in accordance with the teachings of the present invention. Several of the operations listed in FIG. 14 are illustrated in more detail in other flow charts of the accompanying drawing set.
2.2.1. A high-level method.As shown, fig. 14 depicts at least two general execution or workflow paths. According to a first general execution path or workflow, referred to herein for reference purposes only as a "file deconvolution workflow," the methods taught by the present invention are employed for the purpose of analyzing and possibly interpreting previously collected and stored mass spectral data. According to a second general execution path or workflow, referred to herein for reference purposes only as a "data-dependent acquisition workflow," the methods taught by the present invention are employed in a "real-time" or "online" manner as mass spectral data is being acquired, and at least some aspects of the data acquisition process are determined or controlled based on the results of calculations or algorithms according to the present invention. Some of the steps illustrated in FIG. 14 are common to both of the execution paths defined above, and are represented in FIG. 14 by double-lined boxes. Other steps are specific to the data dependency acquisition workflow path and are represented by the blocks bounded by the dashed lines. At least one step, step a312, is specific to the file deconvolution workflow path and is represented by the box bounded by the dotted line. Finally, steps A920 and A925, depicted by the blocks with the single solid line, are optional with respect to the data dependency acquisition workflowBut will typically be performed in conjunction with a file deconvolution workflow. The file deconvolution workflow will typically follow the general path indicated by the dotted arrow in the lower portion of fig. 14.
Still referring to FIG. 14, the file deconvolution workflow begins at step A312, where previously acquired and stored mass spectral data in the form of at least one mass spectrum is input from an electronic storage device and available for use in subsequent analysis. The mass spectrum may be MS1Spectrum, MS2Spectrum or substantially any form of MSnSpectra. In contrast, the data dependency acquisition workflow begins at step a310, where a sample is introduced into a mass spectrometer and subsequently ionized in step a 315. The sample introduction may be from a chromatograph by injection or other means. MS of ion Generation in step A3201Spectra. Assume that steps similar to steps a310, a315, and a320 have been performed in the generation of data input in the alternate path including step a 312.
In step A325, a new peak centroid is identified (i.e., MS during the experiment in question or at the input data)1Previously unidentified centroids in the spectrum) and added to the centroid list. In a next step A400, the m/z values of the centroid are transformed and the intensity data is converted into an array of Boolean-type value data, with bins assigned on the transformed m/z scale. Step a400 comprises a first sub-step a420 of structuring and filling a boolean occupancy array and a second sub-step a460 of structuring and filling a relative separation matrix (see fig. 15). The details of these sub-steps are described in more detail in the subsequent sections of the invention.
In step A510, which applies only to the data-dependent acquisition workflow, if mass analysis is being performed on a sample whose composition is time-varying (e.g., on effluent from a chromatography column), then the completed MS is removed from the "selection list"nThe centroid of the analyzed analytes and can be added to the "exclusion list". The selection list contains the mass analysis to be analyzed or being analyzed by tandem mass analysis (MS/MS analysis) or possible MSsnAnalyzing one or more mass-to-charge ratio (m/z) values or ranges of values analyzed by a mass spectrometer, each such m/z value or range corresponding to a chemical set of a sample as identified by methods taught by the present disclosureAnd (4) dividing. The exclusion list includes one or more mass-to-charge ratio (m/z) values or ranges of values to be excluded from future analysis for the duration of the experiment or a temporary period of time during the experiment. The temporary time period, if employed, may be determined according to methods taught by the present invention, as described in subsequent sections of the disclosure. Alternatively for direct infusion or flow injection analysis, the one or more mass-to-charge ratio values or value ranges to be excluded from future analysis may be performed based on signal level. The centroids depicting low intensity mass spectral lines are removed from the exclusion and selection list in step a 515. If the corresponding mass spectral signal intensity subsequently increases during the experimental run, the removed m/z values or ranges can be added to the selection list later.
In step A600, a tentative charge state assignment is made, as summarized in FIGS. 17A and B and discussed further below with reference to the figures. Subsequently, in step a700, the tentatively assigned charge states are adjusted using self-consistency requirements and a final charge state assignment is made. The details of this process are summarized in FIG. 18 and discussed further below with reference to that figure. Once the final charge state assignment has been made, the experimentally observed centroids are decomposed into analyte-specific clusters in step a800 using information derived from the spacing of the isotope clusters. Details of step a800 are illustrated in fig. 19 and further described with reference to that figure.
Execution of method A300 may branch at step A910 along one of two possible execution paths, indicated by solid and dotted arrows, respectively. If real-time tandem mass spectrometry is controlled by the results of previous data analysis, then method execution may follow the "No" branch (represented by the solid line) from step A910 directly to step A915, skipping steps A920 and A925. Alternatively, if the MS measured in step A320 is to be paired1The data is subjected to further data analysis operations or, if the data was previously entered in step a312, the "yes" branch of step a910 is followed, the molecular weight may then be calculated or the analyte species identified (step a920), and the results of the calculation may be reported or stored (step a 925). If tandem mass spectrometry is to be performed, as determined at step A915, it is performed as would generally follow a data dependency acquisition workflowIn the case of the row path, the method branches along the yes branch to step a 930. Otherwise, execution proceeds along the "no" branch to step a 960.
Considering now the "online" execution path illustrated on the right side of fig. 14, a determination is made in step a930 whether there are centroids in the set of centroids under consideration that are attributable to known adducts. As such (the "yes" branch of step a 930), then the centroid corresponding to the adduct species or otherwise modified species (e.g., species resulting from loss of neutral molecules) is added to the exclusion list in step a 935. Otherwise, step a935 is bypassed. Step a940 is the start of the top-down analysis, where a representative peak is selected for segmentation from each of the top P analyte-specific clusters determined in step a 800. The following steps a945, a950 and a955 are isolating ions of m/z ratio corresponding to the selected centroid, segmenting the isolated ions and performing mass analysis (MS) of the product ions, respectively2) The conventional procedure of (1).
If the mass spectrometry experiment or data analysis is complete, execution of method A300 may end after step A960. Otherwise, step a310 is performed returning to introducing the next portion of the sample to the mass spectrometer or step a312 is performed returning to inputting the next portion of the mass spectral data.
2.2.2. A boolean-type value occupancy array is built.FIG. 16 shows building occupancy array [ O ]k]Details of step a 420. The array values are boolean variables and the indices of the array correspond to discrete transformed mass/charge values. Step A420 takes centroid set Ci(1. ltoreq. i.ltoreq.L), where L is the number of mass spectral lines observed. Each CiIs characterized by its mass/charge (m/z)iStrength I thereofiIts signal-to-noise ratio (S/N)iAnd its resolution Ri. Next, filtering of the centroids is performed by collecting a subset of centroids { F } that pass the user-settable criteria for strength and signal-to-noise ratio thresholds (step A422). Next, in step A424, the mass M of the protons is subtracted by taking the mass/charge valueprotonTo each C in { F }, toiThe mass/charge conversion is performed as in equation 1.
T(m/z)i=ln((m/z)i-Mproton) Equation (1)
After this transformation, each centroid C in the subset { F }iIs characterized by T (m/z)i、Ii、(S/N)iAnd Ri. The maximum value T (m/z) of the T (m/z) values from the subset { F } is noted in step A426HighAnd a minimum value T (m/z)low. This information is then used to generate an array of values [ O ]k]Wherein each element of the array is a Boolean-type value "occupied" that maintains whether a "signal" is deemed to be at a respective transformed mass-to-charge ratio value T (m/z) associated with the array elementkThe recording of which occurred. After creation, each element O of the array is addedkInitialization is to a boolean value false. Number of discrete elements in array or array [ O ]k]Is expressed as LoccsWhich is determined as

Where D is the width of each bin in the array and D ═ MA/106Where MA, typically 10, represents a user settable parameter of mass accuracy of the spectrum of interest.
After creation and initialization, the array [ O ] must be populated with meaningful valuesk](performed in step A436). Occupied array [ O ]k]The element(s) is (are) a variable k (1. ltoreq. k. ltoreq.Loccs) The index is taken and the elements of the filtered subset of centroids { F } are indexed by the variable i. The latter index is converted into a corresponding value of k in step A430, where for each centroid C in the subset { F }iCorresponding index kiThe following were determined:

and rounded to the nearest integer (the rounding operation is performed by the operator "ROUND" in FIG. 16]"indicates. If the center of mass CiResolution R ofiAvailable (e.g. collected in centroid mode)Some of the spectra may not be so defined), the "yes" branch of decision step a432 is followed, with additional indices being calculated in step a434a And
And as follows


Where the value is rounded to the nearest integer. In which R isiIn the event of unavailability, these indices are actually set to k in step A434b, respectivelyi-1 and ki+1. Finally, in step A436, the array values are all set for ranges from To
To Is true, i.e., the Boolean value of

2.2.3. A Relative Separation Matrix (RSM) is built.As shown in fig. 15, step a460 is a step of constructing a relative separation matrix and is a second sub-step of the general step a 400. The creation of the relative separation matrix is actuated by the observation: given two centroids C1And C2If they belong to the same protein isotope peak but are exactly in a different charge state, their mass/charge values are related as follows
|z1|×((m/z)1-Mproton)=|z2|×((m/z)2-Mproton) Etc. ofFormula (6)
Wherein z is1And z2Are respectively the center of mass C1And C2And M is a charge state ofprotonIs the mass of the proton. Value of charge state z1And z2Will typically be either all positive or all negative depending on the ionization mode used in the mass spectrometer instrument performing the analysis. Performing the transformation as described in equation (1) yields the following relationship:
T(m/z)1=T(m/z)2+ln|z2/z1equation (7)
An important property of equation (7) is the transformed T (m/z) at different charge statesiThe values are correlated by an additive factor that is independent of the transformed values. The memory ln (z) can be pre-calculated and cached2/z1) As a matrix that can be reused in subsequent computations by a simple query that pre-computes the RSM. The absolute value of the charge state will typically range from unity to some maximum value | ZmaxBetween | or, more specifically, 1 ≦ z1,z2≤|ZmaxL. The final step is discretizing ln | z by dividing by D as in equation (4)2/z1The matrix of | is:

from ZmaxThe limits of the determined matrix may be set by the maximum and minimum charge states that a user expects to encounter in the set of spectra. Alternatively, ZmaxMay be a predetermined or pre-calculated value. Typically, for the top-down experiments, the absolute value of the charge state ranges from 1 to 50. In this case, therefore, the RSM would be a50 x 50 antisymmetric matrix.
2.2.4. A score distribution for each centroid is built and used to assign tentative charge states.Before a self-consistent set of charge assignments can be determined by iteration (in step a700 of fig. 18), a reasonable initial set of tentative charge assignments must be deployed. Step A600, the details of which are shown in FIGS. 17A and 17B, generates this initial set by assigning possible charge states to the centroids of the subset { F }. Steps A601-A615 consider each such centroid, and in turn, for each centroid considered, from a minimum charge state value ZminUp to a maximum charge state value ZmaxStep through the assumed value of the assumed charge state z. For example, a hypothetical charge state from z-1 to z-50 may be considered for each centroid. For center of mass CiEach combination of (as selected in step a601 or step a 615) and a postulated charge state zi(as set in A603 of step A609), the "probe index" k is calculated in step A605p(Ci,zi) A collection of (a). The probe indices refer to the occupancy array [ O ] for the purpose of testing the "true" value at each of these indicesk]Is selected to be the set of k values of the bins of (1). k is a radical ofp(Ci,zi) The index of the first row of the matrix corresponds to the selected centroid CiDiscrete T (m/z) of the (+/-m) theoretical isotopic peak of (c)iThe value is obtained. For example, if m ═ 5, then the detection index corresponding to the (+/-5) theoretical isotopic peak is the transformed value as follows:

kp(Ci,zi) The matrix also includes two additional rows whose elements are calculated by generating, for each of the 2m probe indices in the row above, an additional probe index corresponding to the expected position of the z-1 peak and another additional probe index corresponding to the expected position of the z +1 peak. Specifically, an index [ k ] is generatedp(Ci,zi)+RSM(zi-1,zi)]And [ k ]p(Ci,zi)+RSM(zi+1,zi)]Where RSM is the above-mentioned pre-computed and cached relative separation matrix. Note the centroid CiK of itselfiThe index is excluded from the probe index matrix because at this execution stage of the algorithm, it is assumed that the occupied array contains a value of "true" at this index. Similarly, the detection matrix may also be increased to include more charge states of (z-m, z-m + 1, …, z + m-1, z + m) rather than just (z-1, z, z +1) as described above.
In step (b)In step A607, z values and each centroid C for each testiA score value is calculated. The score set is used to generate a score distribution for each z-value. By aiming at ziCalculates a score s (z) by summing the experimentally derived occupancy values. Specifically, the score for each value of z is determined as follows:
S(z)=∑Ok/C equation (9)
Wherein the sum is at kp(Ci,zi) So that (1. ltoreq. k. ltoreq.Loccs) And C is exactly the number of this k. In other words, the score at z is exactly k occupied by the coded measured mass spectral signals above the threshold (i.e., the value of "true") in the occupancy array as constructed in step a420 (fig. 15)p(Ci,zi) The score of the index. Thus, the calculation in step A605 is in the form of a streamlined approximation "inner product" calculation, where the maximum possible score for any single calculation is in units of one. The score distribution is formed by summing the scores for each value of z from the lowest to the highest user settable limit. Using our example of 1 and 50 as low and high limits, we will get a distribution of 50 scores per centroid.
Decision step a611 determines for each centroid whether the maximum value of z has been considered. If not, execution returns to step A605 for computing the probe index at the new value of z (as set in step A609). Otherwise, execution branches to decision step A613 which determines whether the last centroid in the subset { F } has been considered. If not, execution proceeds to step A615, where the next centroid is selected, and then to step A603, where the z value is reset to its initial state. Otherwise, execution proceeds to step A617 (FIG. 17B), where the process of formulating a tentative charge assignment begins.
Steps a617-a635 shown in fig. 17B illustrate a process of making tentative charge assignments using previously generated scoring distributions in multiple iterations of step a607 (fig. 17A). In step a617, a first centroid is selected; the selection of the centroid being considered is updated later in step a 635. After either of these two steps, the mean μ and standard deviation σ of the respective score distributions are calculated in step a 620. Thus, repeated iterations of steps a620-a635 cause these statistical measures to be calculated for the score distributions associated with each centroid. In step a625, if there are any scores greater than the mean μ +3 σ, then the z-value with the largest score is assigned to the centroid as the initial charge state assignment. If there is no score greater than μ +3 σ, then a null value is provided as the initial assignment for the centroid in question.
2.2.5. The optimality of a fully self-consistent charge assignment is achieved by iteration.After tentative charge state assignments have been made in step A600, execution of method A300 (FIG. 14) proceeds to step A700, where the tentative charge state assignments are adjusted. Details of step a700 are shown in fig. 18. The optimum condition is simply defined as spectralAll ofThe most consistent assignment of charge of centroids. It is the inference under this condition that the charge states assigned to each centroid should be consistent with those assigned to other centroids in the spectrum.
The details of step a700 are shown in fig. 18, which implements an iterative procedure to generate charge state assignments as directed by the optimality conditions above. Having a non-null assignment (as assigned per centroid in step a625 of fig. 17B) is then considered. Each of these may be associated with a set of probe indices as indicated in step a605 of fig. 17A. This process is repeated for all centroids with non-null assignments, and a new charge state distribution is determined at each detection index. Specifically, in step A702, a charge state z is selected having a non-null tentative assignmenttThe first or next centroid of (a). In step a704, a probing index for the centroid in question is generated, if necessary, as previously described with respect to step a605 of fig. 17A. Subsequently, in step A706, assume that the charge state of the selected centroid is ztThe charge state is calculated at each of the detection indices corresponding to the centroid in question. For each probe index, a record is kept of how many times each charge state is calculated for that probe index. These records are cleared (reset to zero) in step a701 before beginning each cycle through steps a702-a 710. Subsequently, during each cycle, the charge is calculated for the probe index in step A706 each timeThe number of times the charge state has been so counted at the probe index is incremented. If at step A710 there are additional centroids with non-null assignments, execution returns to step A702 and the next such centroid is selected.
After the last centroid has been considered, execution branches to step A712. In step A712, the number of occurrences of each charge state (as calculated in step A706) is tabulated at each probe index, thereby generating a charge state distribution for each probe index. Using the new charge state distribution, a "most charge assignment" (CAM) is obtained in step A714 by adjusting the tentative charge state at each probe index so that the charge state equals the highest number of lists at the corresponding index. The set of all such CAM charge assignments forms an array of values-the array is assigned by most of the charges.
If, at step A716, the value of the CAM array is different than the charge state value used in the generation of the CAM array, then the charge assignments are considered inconsistent. In contrast, a fully self-consistent charge assignment is defined as the charge assignment at each index such that it is fully consistent with the assignment from the CAM array that originated from it. Thus, at step a716, the adjusted tentative charge state is compared to its previous value. The charge assignment is not self-consistent if there has been a change greater than some tolerable limit. In this case, the "NO" branch of step A716 is followed, and execution returns to step A701, whereby a new set of computations is performed in order to achieve self-consistency. Thus, a set of iterations of the CAM array determination is performed by using the charge from each CAM to generate a subsequent CAM. Optimality is achieved when convergence is achieved, i.e., the CAMs generate the same CAM.
In fact, exact convergence may not be achieved by this procedure. However, the inventors' experience shows that after a few iterations, the occurrence of non-uniformity becomes negligibly small, and thus the iterations can be stopped with excellent charge state assignments. Thus, in step a716, convergence is deemed to be achieved operationally when the differences in successive CAM arrays are within some tolerable limit (i.e., within some tolerance). In this case, execution branches to step a718, where the final self-consistent charge state and each centroid is set equal to the tentative charge state at which operational convergence occurs.
2.3. Determination of analyte-specific clusters
The clustering method starts with a clustering criterion defined by equation (10), where C is reasonably expected to occur within a restricted m/z range13Number of non-monoisotopic peaks Δ NC13Given as follows:

wherein z is1And z2Is the charge state assigned to the mass line, (m/z)1And (m/z)2Is a mass-to-charge ratio, M, measured experimentallyC13Is carbon isotope C13And C12Of a mass difference therebetween, and MprotonThe error (delta) or standard deviation associated with the calculation is from the user-supplied accuracy value α defined in ppm and the resolution R of the centroid under consideration1And R2Calculation, as described in equation (11):

to determine whether any two centroids (peaks) belong to the same analyte-specific cluster (associated with a specific biomolecule such as a protein), the theoretical Δ N is calculated using equation (10)C13The value is obtained. If calculated Δ NC13The values are integers within the measurement error, as calculated in equation (11), then the two centroids are considered to belong to the same analyte-specific cluster, provided that C13The number of peaks does not exceed the user-defined limit (typically 10 to 15). Of course, one of ordinary skill in the art can readily use numerous other similar statistical tests, such as a z-test or a t-test, to determine whether the two peaks differ by an integer number of Cs13The uncertainty of its m/z and the resolution R of the α encoding are assumed.
The decomposition of mass lines into analyte-specific clusters step A800 shown in FIG. 19 utilizes the above-describedAnd (6) reasoning. Step a800 considers the centroids to which charge assignments have been made, as previously described. Step a805 begins with the charge-assigned centroid having the greatest experimentally observed intensity. The thus selected centroid is then used as a "seed" for the first cluster. Then, proceeding in decreasing order of intensity (steps A810 through A830), a check is made to determine whether the next centroid in the list is clustered with a seed centroid for this cluster. This check is made by first calculating Δ N using equations 10 and 11, respectivelyC13And its error delta (step a 815). If Δ N is noted in decision step A820C13Is an integer within the calculation error, then execution follows the yes branch to step a825, where the centroid under consideration is grouped together with the seed centroid as belonging to a single cluster. If not, the "No" branch is followed such that in step A830, if there are remaining non-seed centroids, execution returns to step A810 where the next dense non-seed centroid is selected for cluster checking. If at step A830 the list of non-seed centroids is exhausted (i.e., there are no remaining non-seed centroids with a strength less than the currently considered centroid) but there are remaining non-cluster centroids (determined in step A835), then execution returns to step A805 where the new cluster is started using the most dense non-seed centroid as the new seed. Subsequent iterations examine all cluster seeds generated and generate a new cluster if the new centroid is not clustered with any previous clusters.
Finally, in step A840, simple heuristics are used to determine whether any clusters generated by the clustering algorithm are "healthy". In our initial implementation, we used a simple rule that "healthy" clusters must have at least four distinct charge states or at least N (user settable, but default to 15) member centroids. We filter out clusters that are not "healthy" according to these criteria. Following removal of the "unhealthy" clusters, the remaining are the final analyte-specific clusters, each representing a different biopolymer or other high quality compound.
2.4.Calculation of protein molecular weight
From experimental high scoreResolution Spectroscopy calculation of the monoisotopic molecular weight M of the proteinmonoOne of the more common ways of doing this is to use the so-called "average" method (Senko, M.W, Beu, s.c. and mclaferty, f.w., 1995), "Determination of single isotope masses and ion populations of large biomolecules from resolved isotope distributions" (Determination of individual isotope masses and sites biological from reactive distributions), "journal of the american mass spectrometry (j.am. soc. mass spectra.), 6: 229), which is itself An extension of earlier methods for low resolution data (zubarv, r.a. and bonddata nko, p.v., 1991," a-priori relationship between average and single isotope masses of peptides and oligonucleotides (approximate-probability of spectra, 276: 5: spectrum). Briefly, the Averagine method first models experimental isotope clustering by assuming a model molecule "Averagine" molecule. By optimizing the fit between the experiment and the theoretical isotope distribution, an estimate of the required monoisotopic mass can be obtained.
The Averagine technique is used within various mass spectrometry peak decomposition and analysis algorithms available from Thermo fisher scientific, waltham, massachusetts, usa. Although the Averagine method has been highly successful, the present inventors were motivated to develop different methods based on the following considerations: (1) the speed is calculated. Averagine fitting can be time consuming, which is not an insignificant consideration for real-time applications, such as those described herein where decisions about which of several observed ions to fragment are automatically made in real-time. However, it should be noted that in the case where a large number of spectral fits are not required, the calculation speed may not present any problem; and (2) mass accuracy. For larger molecular weight proteins whose features appear in a crowded spectrum, corresponding isotope clusters tend to be noisy and incomplete (missing isotopes, especially edges, missing charge states, etc.). The use of Averagine fitting may not be appropriate in such cases.
The inventors therefore teach herein a method that is expected to produce robust estimates of monoisotopic mass that are extremely easy to calculate and more resistant to noise and artifacts. Accepting the influence of estimating possible bias, the main goals are robustness and accuracy. In short, the estimate may not be (but very close to) the "true" monoisotopic mass, but will be robust/stable in the face of experimental defects. After taking mass accuracy into account, the error should be exactly 0 or +/-1 daltons (1Da) from the true monoisotopic mass. The inventors herein point out that robustness is more important than accuracy in many cases. For example, if a molecular weight database is to be built based on experimental data, the ability to generate the same answer while building the database and while testing the database with new data is generally required, even though the estimate potentially deviates from the true molecular weight by 1Da but is the same between experiments.
The method starts with three simple observations: (1) the isotopic pattern of most proteins is due to C12/C13Binomial distribution and all other isotopes have too low abundance to warrant consideration; (2) the pattern of the binomial distribution (i.e., the peak with the greatest intensity) is a very robust feature of the binomial distribution compared to the mean, standard deviation, or exact boundary of the distribution, and (3) for the binomial distribution, the pattern is located less than 1Da to the left of the mean (see table a1 presented in fig. 20A-20D). This means that the pattern is a very useful alternative to the mean value, which itself is more difficult to estimate for noisy data. For example, a distribution truncated at the edge will result in an unreliable average estimate, while the pattern is very stable to this truncation unless the distribution is highly distorted.
The starting point of the calculation is composed of Defined, it is the observation pattern of isotope clustering. The Zubarev method of calculating a first approximation of the monoisotopic mass is then employed, wherein:

the second approximation of the monoisotopic mass is then defined as follows:

where n is the smallest integer such that M2≥M1. Finally, in the monoisotopic mass MmonoIf there are clusters within 1 dalton greater than M in the calculation of (1)2Experimental peak of (a), then:
Mmono=M2+1.003 equation (14a)
If not, then,
Mmono=M2equation (14b)
This method of calculating monoisotopic mass has been incorporated into the results described herein. The inventors' results show that the prediction is extremely advantageous compared to those predicted by the avergine method. For large proteins, testing for standard proteins indicates that the monoisotopic mass estimation is stable. In addition, cluster molecular weights are also calculated for closely related peaks or protein variants. We refer to the result of this calculation as the "cluster molecular weight". After protein variants have been found in batches, a clustering analysis of all protein variants is performed using a more discriminatory error function:
error min | w1-w2-Nx 1.003| equation (15)
Wherein N is more than or equal to-3 and less than or equal to 3. If there is an error<0.5(w1+w2) X 10ppm, then w1And w2Should be considered equal. Each protein variant will then map into a cluster of equivalent protein variants represented by the consensus monoisotopic mass. This mass is referred to and stored as "consensus MW".
2.5.Program input and output
FIG. 21A shows a start page (i.e., a visual display screen shot) for a post-data acquisition version of a computer program employing the data dependency methods described herein. On the left side of the display illustrated in fig. 21A, the "raw file" box serves as an input line for the mass spectrometry data file to be processed. A "batch mode" checkbox may be enabled, thereby allowing a user to process multiple data files, while an "auto scan increment" checkbox is used to enable processing of a continuum. The results from the post-data acquisition version of the program may be plotted in the display by the user activating a "plot deconvolution" check box. The minimum and maximum number of spectra (scans) to be processed are set by a "scan button", which directly defaults to file length (in number of scans) or can be set by the user.
As seen on the lower left side of fig. 21A, the output may be controlled by causing the results to be output to a peak list and by the user designating the output as MS1 or MS2 type data (in csv file format). Mass tolerance (Mass Tol) defaults to 3; however, this can also be set by the user. The output may also be generated in a buf file format for input to ProSightTMIn the PC protein recognition program. The details of the spectral decomposition results (also referred to herein as "deconvolution" results) may also be stored in the csv file format for further data analysis. The deconvolution summary in the "results" tab lists the data files and scans that were analyzed to generate the report. Down the label is the total number of centroids detected and the number filtered as part of the procedure. The percentage of peaks that successfully received a charge state assignment is found in the "Zscape" box, as well as a comparison with results calculated by one of the leading prior deconvolution procedures currently used by those skilled in the art. The "both assigned" and "consistent" blocks measure the agreement between the two programs. Moving to the bottom of the "result" label, the percentage of clusters assigned and the total number of unique proteins deconvolved are shown. An enlarged view of this label is shown in fig. 21D.
The two labels shown in FIG. 21A on the right side of the display provide for picking the assignment and clustering parameters associated with the deconvolution process. In fig. 21B, the "assign parameters" label includes mass accuracy in parts per million (ppm), minimum peak intensity threshold, minimum signal-to-noise ratio (s/n) required, and lowest and highest charge states expected by the deconvolution process. These parameters are further divided into two columns, one for each MS1And MS2And (6) analyzing.
The "Cluster parameter" label shown in FIG. 21C is also divided into separate labels for MS' s1And MS2The two columns of correlation are analyzed. A minimum number of user inputs of adjacent charge states and isotopes are provided for use in the cluster convergence calculations described above. Also presented on this input label are "sufficient adjacent charge states", "sufficient adjacent isotopes" and "mass separation" parameter input displays.
2.6.Examples of the invention
Figure 22A shows deconvolution results from a five-component protein mixture consisting of cytochrome C, lysozyme, myosin, trypsin inhibitor, and carbonic anhydrase. The top display panel a1203 of the display shows data acquired from mass spectrometry represented as a centroid. The centrally located main display panel a1201 illustrates each peak as a respective symbol. A horizontally disposed mass-to-charge ratio (m/z) dimension A1207 for the top panel A1203 and the center panel A1201 is shown below the center panel. The computer display may also include (not specifically shown in fig. 22A) settings for mass accuracy (expressed in ppm), peak/isotope clustering settings, minimum intensity threshold and signal-to-noise ratio settings, and minimum and maximum charge states associated with the calculations. Panel a1205 on the left of the display shows the calculated molecular weight in daltons of the protein molecule. The Molecular Weight (MW) scale of side panel a1205 was oriented vertically on the display, which was perpendicular to the horizontally oriented m/z scale a1207 with respect to the detected ions. Each horizontal line in the central panel a1201 indicates the detection of a protein having a dotted outline corresponding to an ion charge state in this example, which is shown as a direct result of the transformation calculations discussed previously. A display on the same data set is shown in fig. 22B, with the Molecular Weight (MW) scale greatly expanded relative to the view shown in fig. 22A. The expanded graph of fig. 22B illustrates a well resolved isotope of a single protein charge state (the lowest part of the left panel a 1205) and potential adduct or impurity peaks (two are present in the display). The most dense of these three molecules is the trypsin inhibitor protein. Another expanded view in fig. 22C shows the exact details of trypsin inhibitor protein at the isotope level. The symbol sizes used to represent the individual isotopes are scaled according to the intensity of each isotope peak.
Figure 23A shows data and deconvolution results for crude extracts from the bacterium escherichia coli. This sample was directly perfused into the mass spectrometer using single-stage-only mass spectrometry. The calculations obtained using the method according to the teachings of the present invention indicate the presence of 58 uniquely identifiable proteins in this sample. Many of the proteins in this example have overlapping charge states that are easily clustered using the aforementioned algorithm. Fig. 23B illustrates another display corresponding to the same dataset, showing an expanded view of the m/z scale (and an expanded view of the MW scale in daltons) near 700Da/e, showing three distinct charge states depicted by different patterned centroids in the top panel a 1203. The centroid a1301 in the top panel a1203 of the display corresponds to the +22 isotopically resolved charge state of the protein with mass 15,305.76 Da. In this case, this is the only charge state distribution that exists, but even if centroid bars a1303 and a1305 occur within 1Da of the charge state in question, the algorithm correctly identifies the clusters. Many currently available deconvolution procedures fail to correctly assign charge states to independent distributions (two different proteins) within a 3Da window. Also, centroid bar A1305 represents the +23 charge state of the E.coli protein with mass 16,017.57 Da. It should be noted that the +23 charge state of this protein directly overlaps the centroid bar a1303 for a separate +22 charge state protein with mass 15327.47 Da. Typical deconvolution procedures are unable to correctly assign peaks in spectra with such small pitches or overlapping charge states, as can be seen by comparison with fig. 23C, which shows the same mass spectrum acquired and processed using a procedure employing a conventional algorithm. Conventional methods are unable to make any charge state assignments in this region of the spectrum, as indicated by the "problem label" on the peak of interest in the plot. Fig. 23D has correctly labeled the charge states of the original distribution data for the two overlapping charge states described above as assigned by our algorithm employing the novel method taught herein.
The program employing the method according to the teachings of the present invention can also determine the charge states of those peaks that do not contain individually resolved isotopes. In another example illustrated in fig. 24A, mass spectra of intact antibodies are displayed with varying degrees of glycosylation. Examples of different glycoforms of the antibodies are shown in the inset of fig. 24A. FIG. 24B illustrates the deconvolution molecular weights for four deconvolution glycoforms ranging from 148378Da to 148763 Da.
Methods according to the teachings of this disclosure also have utility for deconvoluting tandem mass spectrometry data. In another example as illustrated in fig. 25A and 25B, two charge states from the protein carbonic anhydrase II are selected for collision activated dissociation. The MS/MS spectrum of the +26 charge state of carbonic anhydrase II and the corresponding deconvolution are shown in fig. 25A. Here 64% of the centroids are correctly identified compared to only 9% using conventional algorithms. Exactly 50% of the centroids are clustered even in cases where many MS/MS fragments do not produce multiple charge states for the same fragment. The total number of correctly identified fragment ions is 35. FIG. 25B shows MS/MS fragmentation and deconvolution of the +21 charge state of carbonic anhydrase II at m/z 1001. Here 74% of the centroids are correctly clustered and 78% of the charge states are assigned. A total of 49 fragment ions were identified using the procedure.
2.7.Guiding data dependency acquisition to avoid redundant measurements
In the traditional method of building dynamic exclusion lists, the m/z values are placed on the list for a specified time period that approximates the average peak width for a given compound/compound type. When this method is used for small molecules or peptides (i.e. tryptic peptides which typically have the same physiochemical properties), it works well to increase the dynamic range associated with the compound recognition process. In contrast, intact proteins (as measured in the top-down proteome) vary widely in size, amino acid composition, physiochemical properties, and 3-D structure. This rate of change generally results in more sites on the protein (as compared to the case of smaller molecular analytes) interacting with the immobilization of the chromatography column. The result is that some peaks may be only a few seconds wide, while others may last in the order of minutes. A typical example of the rate of change that can be expected is illustrated in fig. 13, which shows the distribution of the changing peaks obtained from a single chromatographic run. Thus, the standard method of dynamic exclusion is not an ideal fit for top-down analysis. To correct this problem, the inventionThe method employs a signal intensity ranking system to determine how long the charge state associated with a given protein should be placed on a dynamic exclusion list. In this new method, the seed centroid of each cluster is placed on the exclusion list. When following MS1When a new seed centroid is proposed in the scan, a check is first made in step a510 to determine if the new centroid is clustered with any of the seed centroids currently on the selection list (fig. 14). If so, a check is made to determine if the strength of the new centroid has dropped below a threshold (e.g., a fraction of the strength of the original seed centroid). The primordial seed centroid is removed from the exclusion list only if the intensity does drop below the threshold (step a 515).
Alternatively, all charge states from a given protein can be placed on an exclusion list, thus avoiding the selection of different charge states from the same protein for tandem MS analysis. While these charge states are on a dynamic exclusion list, the signal intensities of the peaks making up the list are monitored until they are below a defined minimum intensity or there is an increase in signal from one of the charge states at a defined mass difference (ppm), indicating the presence of two components of different mass and charge but the same m/z value.
Claims (8)
1. A method of identifying the presence or absence of a microbial species in a sample, comprising:
(a) identifying a series of analyte compounds concurrently present in the sample to diagnose the presence of the microbial species in the sample, the series of analyte compounds including protein compounds, polypeptide compounds, or both protein and polypeptide compounds;
(b) extracting a liquid solution comprising a mixture of proteins and polypeptides derived from a sample from the sample;
(c) introducing at least a first portion of the liquid solution into an ionization source of a mass spectrometer;
(d) generating positively charged ions of the mixture of compounds from the at least a first portion of the liquid solution at the ionization source, the positively charged ions comprising a plurality of ion types;
(e) separating at least a first subset of the plurality of ion species, each separated subset of the at least a first separated subset comprising a respective range of mass-to-charge (m/z) ratios;
(f) generating a plurality of first generation product ion species from each separated subset of ion species by reacting each said separated subset of ion species with a reagent anion for a predetermined duration, said reagent anion, upon reaction, extracting protons from each of one or more ion species of said separated subset of ion species that includes protonated molecular species of a protein or polypeptide compound;
(g) generating at least one mass spectrum of first-generation product ion species or second-generation product ion species resulting from further reaction of the first-generation product ion species using a mass analyzer of the mass spectrometer;
(h) for each respective analyte compound in the series, performing the following steps:
(h1) performing a search of the at least one mass spectrum of the first-generation or second-generation product ion species for a set of one or more m/z ratios that are diagnostic of the respective analyte compound; and
(h2) identifying a presence of the respective analyte compound within the liquid solution if the set of one or more m/z ratios is identified in the mass spectrum; and
(i) identifying that the microbial species is present in the sample if the presence of each analyte compound in the series of analyte compounds is identified within the liquid solution.
2. The method of claim 1, wherein performing the steps (h1) and (h2) is performed concurrently with performing one or more of the steps (c) through (g).
3. A method as recited in claim 1, wherein the microorganism species is defined as a particular bacteria species, and the series of analyte compounds includes a sufficient number of analyte compounds that are diagnostic of the particular bacteria species to identify the presence or absence of the particular bacteria species in the sample.
4. A method as recited in claim 1, wherein the microorganism species is defined as a particular bacteria species, and the series of analyte compounds includes a sufficient number of analyte compounds that are diagnostic of the particular bacteria species to identify the presence or absence of the particular bacteria species in achieving the sample.
5. A method as recited in claim 1, wherein the microorganism species is defined as a particular bacterial sub-species, and the series of analyte compounds includes a sufficient number of analyte compounds that are diagnostic of the particular bacterial sub-species to identify the presence or absence of the particular bacterial sub-species in the sample.
6. The method of claim 1, wherein the microorganism species is defined as a particular virus strain and the series of analyte compounds comprises a sufficient number of analyte compounds to identify the presence or absence of the particular virus strain in the sample as a diagnosis of the particular virus strain.
7. The method of claim 1, wherein the microorganism species is defined as a particular virus strain and the series of analyte compounds comprises a sufficient number of analyte compounds to identify the presence or absence of the particular virus strain in the sample as a diagnosis of the particular virus strain.
8. A method of identifying the presence or absence in a sample of a microbial species, comprising:
(a) identifying a series of analyte compounds whose co-presence in the sample is diagnostic of the presence of the microbial species in the sample, the series of analyte compounds including protein compounds, polypeptide compounds, or both protein and polypeptide compounds;
(b) extracting a liquid solution comprising a mixture of proteins and polypeptides derived from a sample from the sample;
(c) for each respective analyte compound in the series, performing the following steps:
(c1) introducing a portion of the liquid solution into an electrospray ionization source of a mass spectrometer;
(c2) forming positively charged ions of the portion of the mixture of compounds of the liquid solution by electrospray ionization, the positively charged ions comprising a plurality of ion types;
(c3) isolating a first subset of said ion species comprising a first range of mass-to-charge (m/z) ratios, said range encompassing m/z ratios of particular predetermined multi-protic molecular species of said respective analytical compound;
(c4) generating a plurality of first generation product ion species from the separated first subset of ion species by reacting the separated first subset of ion species with a reagent anion for a predetermined duration, the reagent anion extracting protons from each of one or more ion species that includes a protonated molecular species of a protein or polypeptide compound after reaction;
(c5) generating a mass spectrum of the first generation product ion species or a second generation product ion species generated from the first generation product ion species using a mass analyzer;
(c6) performing a search of the mass spectrum of the first-generation or second-generation product ion species for a set of one or more m/z ratios that are diagnostic of the respective analyte compound; and
(c7) identifying a presence of the respective analyte compound within the liquid solution if the set of one or more m/z ratios is identified in the mass spectrum; and
(d) identifying that the microbial species is present in the sample if the presence of each analyte compound in the series of analyte compounds is identified within the liquid solution.
Applications Claiming Priority (3)
| Application Number | Priority Date | Filing Date | Title |
|---|---|---|---|
| US201662278935P | 2016-01-14 | 2016-01-14 | |
| US62/278,935 | 2016-01-14 | ||
| CN201710026358.5A CN106970228B (en) | 2016-01-14 | 2017-01-13 | Method for top-down multiplexed mass spectrometry of mixtures of proteins or polypeptides |
Related Parent Applications (1)
| Application Number | Title | Priority Date | Filing Date |
|---|---|---|---|
| CN201710026358.5A Division CN106970228B (en) | 2016-01-14 | 2017-01-13 | Method for top-down multiplexed mass spectrometry of mixtures of proteins or polypeptides |
Publications (1)
| Publication Number | Publication Date |
|---|---|
| CN111257404A true CN111257404A (en) | 2020-06-09 |
Family
ID=57777529
Family Applications (2)
| Application Number | Title | Priority Date | Filing Date |
|---|---|---|---|
| CN201710026358.5A Active CN106970228B (en) | 2016-01-14 | 2017-01-13 | Method for top-down multiplexed mass spectrometry of mixtures of proteins or polypeptides |
| CN202010090620.4A Pending CN111257404A (en) | 2016-01-14 | 2017-01-13 | Method for top-down multiplexed mass spectrometry of mixtures of proteins or polypeptides |
Family Applications Before (1)
| Application Number | Title | Priority Date | Filing Date |
|---|---|---|---|
| CN201710026358.5A Active CN106970228B (en) | 2016-01-14 | 2017-01-13 | Method for top-down multiplexed mass spectrometry of mixtures of proteins or polypeptides |
Country Status (3)
| Country | Link |
|---|---|
| US (2) | US10151758B2 (en) |
| EP (2) | EP3460481B1 (en) |
| CN (2) | CN106970228B (en) |
Families Citing this family (16)
| Publication number | Priority date | Publication date | Assignee | Title |
|---|---|---|---|---|
| EP3193352A1 (en) | 2016-01-14 | 2017-07-19 | Thermo Finnigan LLC | Methods for mass spectrometric based characterization of biological molecules |
| GB2561142B (en) | 2016-12-19 | 2019-05-08 | Thermo Fisher Scient Bremen Gmbh | Determination of isobaric interferences in a mass spectrometer |
| GB2563565B (en) * | 2017-04-13 | 2022-05-11 | Micromass Ltd | Mass spectrometry with increased duty cycle |
| GB2575168B (en) * | 2018-06-04 | 2022-06-01 | Bruker Daltonics Gmbh & Co Kg | Precursor selection for data-dependent tandem mass spectrometry |
| KR102198846B1 (en) * | 2018-06-29 | 2021-01-05 | 다인기술 주식회사 | Method, system and non-transitory computer-readable recording medium for carrying out a survey relating to urination |
| US10665440B1 (en) | 2018-11-19 | 2020-05-26 | Thermo Finnigan Llc | Methods for multiplexed MS-3 analyses of peptides |
| EP3959742A4 (en) * | 2019-04-25 | 2023-05-24 | Thermo Finnigan LLC | Charge detection mass spectrometry utilizing harmonic oscillation and selective temporal overview of resonant ion ( stori) plots |
| CN113552204A (en) * | 2020-04-02 | 2021-10-26 | 株式会社岛津制作所 | Mass spectrometry method and mass spectrometry system |
| CN111398402B (en) * | 2020-04-29 | 2022-09-27 | 中国计量科学研究院 | Ion conformation distribution characterization method based on linear ion trap gradient isolation strategy |
| CN111900073B (en) * | 2020-07-15 | 2023-04-07 | 宁波大学 | Ion source and mass spectrum combined control method |
| WO2022034535A1 (en) * | 2020-08-12 | 2022-02-17 | Dh Technologies Development Pte. Ltd. | Effective use of multiple charge states |
| CN112489730B (en) * | 2020-12-07 | 2022-06-17 | 重庆邮电大学 | Rapid incremental construction method for protein mass spectrogram database |
| TWI774454B (en) * | 2021-06-29 | 2022-08-11 | 中國醫藥大學 | Method for assessing drug-resistant microorganism |
| CN114678253B (en) * | 2022-03-16 | 2024-04-09 | 中国科学技术大学 | Device for on-line rapid pretreatment mass spectrometry of multicellular or single-cell sample and application thereof |
| WO2023203541A1 (en) * | 2022-04-22 | 2023-10-26 | Dh Technologies Development Pte. Ltd. | Pseudo ms3 strategy employing ptr for labelled quantitative proteomics |
| US20240094877A1 (en) * | 2022-09-21 | 2024-03-21 | Thermo Finnigan Llc | Data acquisition workflows for scientific instrument support systems |
Citations (8)
| Publication number | Priority date | Publication date | Assignee | Title |
|---|---|---|---|---|
| WO2000029987A1 (en) * | 1998-11-17 | 2000-05-25 | University Of Maryland | Methods for identifying and classifying organisms by mass spectrometry and database searching |
| CN101014857A (en) * | 2004-03-12 | 2007-08-08 | 维吉尼亚大学专利基金会 | Electron transfer dissociation for biopolymer sequence analysis |
| CN101073137A (en) * | 2004-03-30 | 2007-11-14 | 普渡研究基金会 | Method and system for desorption electrospray ionization |
| US20080093547A1 (en) * | 2006-10-24 | 2008-04-24 | Bruker Daltonik Gmbh | Top-down protein analysis in mass spectrometers with ion traps |
| US20140051113A1 (en) * | 2012-05-01 | 2014-02-20 | Oxoid Limited | Apparatus and methods for microbiological analysis |
| US20140339421A1 (en) * | 2012-01-24 | 2014-11-20 | Thermo Finnigan Llc | Multinotch isolation for ms3 mass analysis |
| US20140357502A1 (en) * | 2011-12-30 | 2014-12-04 | Dh Technologies Development Pte. Ltd | Windowing Combined with Ion-Ion Reactions for Chemical Noise Elimination |
| US20150162175A1 (en) * | 2013-12-11 | 2015-06-11 | Thermo Finnigan Llc | Methods for Isolation and Decomposition of Mass Spectrometric Protein Signatures |
Family Cites Families (32)
| Publication number | Priority date | Publication date | Assignee | Title |
|---|---|---|---|---|
| US5175430A (en) | 1991-05-17 | 1992-12-29 | Meridian Instruments, Inc. | Time-compressed chromatography in mass spectrometry |
| IL155281A0 (en) | 2000-10-19 | 2003-11-23 | Target Discovery Inc | Methods for determining protein and peptide terminal sequences |
| EP1342257B1 (en) | 2000-12-14 | 2017-03-22 | MDS Inc. | APPARATUS AND METHOD FOR MSnth IN A TANDEM MASS SPECTROMETER SYSTEM |
| US6627875B2 (en) | 2001-04-23 | 2003-09-30 | Beyond Genomics, Inc. | Tailored waveform/charge reduction mass spectrometry |
| US7064317B2 (en) | 2001-08-15 | 2006-06-20 | Purdue Research Foundation | Method of selectively inhibiting reaction between ions |
| JP3840417B2 (en) | 2002-02-20 | 2006-11-01 | 株式会社日立ハイテクノロジーズ | Mass spectrometer |
| US7457708B2 (en) | 2003-03-13 | 2008-11-25 | Agilent Technologies Inc | Methods and devices for identifying related ions from chromatographic mass spectral datasets containing overlapping components |
| CA2525978C (en) | 2003-05-30 | 2011-07-19 | Purdue Research Foundation | Process for increasing ionic charge in mass spectrometry |
| CN101073012A (en) | 2004-10-08 | 2007-11-14 | 维吉尼亚大学专利基金会 | Simultaneous sequence analysis of amino- and carboxy-termini |
| WO2006082042A2 (en) | 2005-02-01 | 2006-08-10 | Metanomics Gmbh | Mass spectrometry analysis method and system |
| US20060255261A1 (en) | 2005-04-04 | 2006-11-16 | Craig Whitehouse | Atmospheric pressure ion source for mass spectrometry |
| WO2006121668A2 (en) | 2005-05-09 | 2006-11-16 | Purdue Research Foundation | Parallel ion parking in ion traps |
| US7518108B2 (en) | 2005-11-10 | 2009-04-14 | Wisconsin Alumni Research Foundation | Electrospray ionization ion source with tunable charge reduction |
| DE102006049241B4 (en) | 2006-10-18 | 2011-04-21 | Bruker Daltonik Gmbh | Ion source for electron transfer dissociation and deprotonation |
| US8639447B2 (en) | 2007-05-31 | 2014-01-28 | The Regents Of The University Of California | Method for identifying peptides using tandem mass spectra by dynamically determining the number of peptide reconstructions required |
| GB0806725D0 (en) | 2008-04-14 | 2008-05-14 | Micromass Ltd | Mass spectrometer |
| GB0820308D0 (en) | 2008-11-06 | 2008-12-17 | Micromass Ltd | Mass spectrometer |
| GB0813777D0 (en) | 2008-07-28 | 2008-09-03 | Micromass Ltd | Mass spectrometer |
| US8440962B2 (en) | 2009-09-08 | 2013-05-14 | Dh Technologies Development Pte. Ltd. | Targeted ion parking for quantitation |
| US10553412B2 (en) | 2010-05-24 | 2020-02-04 | Agilent Technologies, Inc. | System and method of data-dependent acquisition by mass spectrometry |
| DE102010054580B3 (en) | 2010-12-15 | 2012-04-26 | Bruker Daltonik Gmbh | Proteome analysis in mass spectrometers with HF ion traps |
| US20120205531A1 (en) | 2011-02-10 | 2012-08-16 | Vladimir Zabrouskov | Quantitation Precision for Isobarically Labeled Peptides Using Charge State Targeted Dissociation |
| DE102012102874A1 (en) | 2011-04-04 | 2012-10-04 | Wisconsin Alumni Research Foundation | Method for analyzing analyte with use of mass spectrometry, involves providing isobaric labeled analyte and generating distribution of precursor ions from isobaric labeled analyte |
| DE102011117582B4 (en) * | 2011-11-02 | 2013-07-25 | Bruker Daltonik Gmbh | Reactants for charge transfer reactions in mass spectrometers |
| US8530831B1 (en) | 2012-03-13 | 2013-09-10 | Wisconsin Alumni Research Foundation | Probability-based mass spectrometry data acquisition |
| WO2013170067A1 (en) * | 2012-05-10 | 2013-11-14 | Thermo Finnigan Llc | Method for highly multiplexed quantitation of peptides by mass spectrometry and labeling reagent sets therefor |
| EP2909618B1 (en) | 2012-10-22 | 2021-02-17 | President and Fellows of Harvard College | Accurate and interference-free multiplexed quantitative proteomics using mass spectrometry |
| US9366678B2 (en) | 2012-10-25 | 2016-06-14 | Wisconsin Alumni Research Foundation | Neutron encoded mass tags for analyte quantification |
| WO2014116711A1 (en) | 2013-01-22 | 2014-07-31 | The University Of Chicago | Methods and apparatuses involving mass spectrometry to identify proteins in a sample |
| CA2901378C (en) | 2013-02-18 | 2019-07-02 | Micromass Uk Limited | Improved efficiency and precise control of gas phase reactions in mass spectrometers using an auto ejection ion trap |
| US9824871B2 (en) | 2013-03-15 | 2017-11-21 | Thermo Finnigan Llc | Hybrid mass spectrometer and methods of operating a mass spectrometer |
| WO2016011355A1 (en) | 2014-07-18 | 2016-01-21 | Thermo Finnigan Llc | Methods for mass spectrometry of mixtures of proteins of polypeptides using proton transfer reaction |
-
2017
- 2017-01-10 EP EP18197334.8A patent/EP3460481B1/en active Active
- 2017-01-10 EP EP17150858.3A patent/EP3193174B1/en active Active
- 2017-01-13 CN CN201710026358.5A patent/CN106970228B/en active Active
- 2017-01-13 CN CN202010090620.4A patent/CN111257404A/en active Pending
- 2017-01-13 US US15/406,626 patent/US10151758B2/en active Active
-
2018
- 2018-11-07 US US16/183,058 patent/US20190072566A1/en not_active Abandoned
Patent Citations (9)
| Publication number | Priority date | Publication date | Assignee | Title |
|---|---|---|---|---|
| WO2000029987A1 (en) * | 1998-11-17 | 2000-05-25 | University Of Maryland | Methods for identifying and classifying organisms by mass spectrometry and database searching |
| CN101014857A (en) * | 2004-03-12 | 2007-08-08 | 维吉尼亚大学专利基金会 | Electron transfer dissociation for biopolymer sequence analysis |
| CN101073137A (en) * | 2004-03-30 | 2007-11-14 | 普渡研究基金会 | Method and system for desorption electrospray ionization |
| US20080093547A1 (en) * | 2006-10-24 | 2008-04-24 | Bruker Daltonik Gmbh | Top-down protein analysis in mass spectrometers with ion traps |
| US20140357502A1 (en) * | 2011-12-30 | 2014-12-04 | Dh Technologies Development Pte. Ltd | Windowing Combined with Ion-Ion Reactions for Chemical Noise Elimination |
| US20140339421A1 (en) * | 2012-01-24 | 2014-11-20 | Thermo Finnigan Llc | Multinotch isolation for ms3 mass analysis |
| US20140051113A1 (en) * | 2012-05-01 | 2014-02-20 | Oxoid Limited | Apparatus and methods for microbiological analysis |
| CN104797939A (en) * | 2012-05-01 | 2015-07-22 | 奥克索伊德有限公司 | Apparatus and methods for microbiological analysis |
| US20150162175A1 (en) * | 2013-12-11 | 2015-06-11 | Thermo Finnigan Llc | Methods for Isolation and Decomposition of Mass Spectrometric Protein Signatures |
Also Published As
| Publication number | Publication date |
|---|---|
| CN106970228A (en) | 2017-07-21 |
| EP3460481B1 (en) | 2020-09-02 |
| US20190072566A1 (en) | 2019-03-07 |
| EP3193174B1 (en) | 2018-11-07 |
| EP3193174A1 (en) | 2017-07-19 |
| US20170205425A1 (en) | 2017-07-20 |
| US10151758B2 (en) | 2018-12-11 |
| EP3460481A1 (en) | 2019-03-27 |
| CN106970228B (en) | 2020-02-18 |
Similar Documents
| Publication | Publication Date | Title |
|---|---|---|
| CN106970228B (en) | Method for top-down multiplexed mass spectrometry of mixtures of proteins or polypeptides | |
| US10497549B2 (en) | Methods for mass spectrometry of mixtures of proteins or polypeptides using proton transfer reaction | |
| US10458994B2 (en) | Methods for mass spectrometric based characterization of biological molecules | |
| US10217619B2 (en) | Methods for data-dependent mass spectrometry of mixed intact protein analytes | |
| EP1530721B1 (en) | Method for characterizing biomolecules utilizing a result driven strategy | |
| US9048074B2 (en) | Multinotch isolation for MS3 mass analysis | |
| EP2741224A1 (en) | Methods for generating local mass spectral libraries for interpreting multiplexed mass spectra | |
| US8153961B2 (en) | Methods for acquisition and deductive analysis of mixed fragment peptide mass spectra | |
| CN111198226B (en) | Method for multiplexing MS-3 analysis of peptides | |
| Merkley et al. | A proteomics tutorial | |
| Hsi | Peptide identification of tandem mass spectrometry from quadrupole time-of-flight mass spectrometers | |
| Ma | Applications of Probabilistic Models on Peptide MS/MS Spectra Identification and Protein Quantification | |
| Senko et al. | Multinotch isolation for ms3 mass analysis |
Legal Events
| Date | Code | Title | Description |
|---|---|---|---|
| PB01 | Publication | ||
| PB01 | Publication | ||
| SE01 | Entry into force of request for substantive examination | ||
| SE01 | Entry into force of request for substantive examination | ||
| WD01 | Invention patent application deemed withdrawn after publication | ||
| WD01 | Invention patent application deemed withdrawn after publication |
Application publication date: 20200609 |