CN111164103A - Methods for detecting and treating classes of hepatocellular carcinoma responsive to immunotherapy - Google Patents
Methods for detecting and treating classes of hepatocellular carcinoma responsive to immunotherapy Download PDFInfo
- Publication number
- CN111164103A CN111164103A CN201880052676.1A CN201880052676A CN111164103A CN 111164103 A CN111164103 A CN 111164103A CN 201880052676 A CN201880052676 A CN 201880052676A CN 111164103 A CN111164103 A CN 111164103A
- Authority
- CN
- China
- Prior art keywords
- genes
- gene
- immunotherapy
- expression profile
- subject
- Prior art date
- Legal status (The legal status is an assumption and is not a legal conclusion. Google has not performed a legal analysis and makes no representation as to the accuracy of the status listed.)
- Pending
Links
Images


Classifications
-
- C—CHEMISTRY; METALLURGY
- C12—BIOCHEMISTRY; BEER; SPIRITS; WINE; VINEGAR; MICROBIOLOGY; ENZYMOLOGY; MUTATION OR GENETIC ENGINEERING
- C12Q—MEASURING OR TESTING PROCESSES INVOLVING ENZYMES, NUCLEIC ACIDS OR MICROORGANISMS; COMPOSITIONS OR TEST PAPERS THEREFOR; PROCESSES OF PREPARING SUCH COMPOSITIONS; CONDITION-RESPONSIVE CONTROL IN MICROBIOLOGICAL OR ENZYMOLOGICAL PROCESSES
- C12Q1/00—Measuring or testing processes involving enzymes, nucleic acids or microorganisms; Compositions therefor; Processes of preparing such compositions
- C12Q1/68—Measuring or testing processes involving enzymes, nucleic acids or microorganisms; Compositions therefor; Processes of preparing such compositions involving nucleic acids
- C12Q1/6876—Nucleic acid products used in the analysis of nucleic acids, e.g. primers or probes
- C12Q1/6883—Nucleic acid products used in the analysis of nucleic acids, e.g. primers or probes for diseases caused by alterations of genetic material
- C12Q1/6886—Nucleic acid products used in the analysis of nucleic acids, e.g. primers or probes for diseases caused by alterations of genetic material for cancer
-
- C—CHEMISTRY; METALLURGY
- C07—ORGANIC CHEMISTRY
- C07K—PEPTIDES
- C07K16/00—Immunoglobulins [IGs], e.g. monoclonal or polyclonal antibodies
- C07K16/18—Immunoglobulins [IGs], e.g. monoclonal or polyclonal antibodies against material from animals or humans
- C07K16/28—Immunoglobulins [IGs], e.g. monoclonal or polyclonal antibodies against material from animals or humans against receptors, cell surface antigens or cell surface determinants
- C07K16/2803—Immunoglobulins [IGs], e.g. monoclonal or polyclonal antibodies against material from animals or humans against receptors, cell surface antigens or cell surface determinants against the immunoglobulin superfamily
- C07K16/2818—Immunoglobulins [IGs], e.g. monoclonal or polyclonal antibodies against material from animals or humans against receptors, cell surface antigens or cell surface determinants against the immunoglobulin superfamily against CD28 or CD152
-
- C—CHEMISTRY; METALLURGY
- C07—ORGANIC CHEMISTRY
- C07K—PEPTIDES
- C07K16/00—Immunoglobulins [IGs], e.g. monoclonal or polyclonal antibodies
- C07K16/18—Immunoglobulins [IGs], e.g. monoclonal or polyclonal antibodies against material from animals or humans
- C07K16/28—Immunoglobulins [IGs], e.g. monoclonal or polyclonal antibodies against material from animals or humans against receptors, cell surface antigens or cell surface determinants
- C07K16/2803—Immunoglobulins [IGs], e.g. monoclonal or polyclonal antibodies against material from animals or humans against receptors, cell surface antigens or cell surface determinants against the immunoglobulin superfamily
- C07K16/2827—Immunoglobulins [IGs], e.g. monoclonal or polyclonal antibodies against material from animals or humans against receptors, cell surface antigens or cell surface determinants against the immunoglobulin superfamily against B7 molecules, e.g. CD80, CD86
-
- A—HUMAN NECESSITIES
- A61—MEDICAL OR VETERINARY SCIENCE; HYGIENE
- A61K—PREPARATIONS FOR MEDICAL, DENTAL OR TOILETRY PURPOSES
- A61K39/00—Medicinal preparations containing antigens or antibodies
- A61K2039/505—Medicinal preparations containing antigens or antibodies comprising antibodies
-
- C—CHEMISTRY; METALLURGY
- C12—BIOCHEMISTRY; BEER; SPIRITS; WINE; VINEGAR; MICROBIOLOGY; ENZYMOLOGY; MUTATION OR GENETIC ENGINEERING
- C12Q—MEASURING OR TESTING PROCESSES INVOLVING ENZYMES, NUCLEIC ACIDS OR MICROORGANISMS; COMPOSITIONS OR TEST PAPERS THEREFOR; PROCESSES OF PREPARING SUCH COMPOSITIONS; CONDITION-RESPONSIVE CONTROL IN MICROBIOLOGICAL OR ENZYMOLOGICAL PROCESSES
- C12Q2600/00—Oligonucleotides characterized by their use
- C12Q2600/106—Pharmacogenomics, i.e. genetic variability in individual responses to drugs and drug metabolism
-
- C—CHEMISTRY; METALLURGY
- C12—BIOCHEMISTRY; BEER; SPIRITS; WINE; VINEGAR; MICROBIOLOGY; ENZYMOLOGY; MUTATION OR GENETIC ENGINEERING
- C12Q—MEASURING OR TESTING PROCESSES INVOLVING ENZYMES, NUCLEIC ACIDS OR MICROORGANISMS; COMPOSITIONS OR TEST PAPERS THEREFOR; PROCESSES OF PREPARING SUCH COMPOSITIONS; CONDITION-RESPONSIVE CONTROL IN MICROBIOLOGICAL OR ENZYMOLOGICAL PROCESSES
- C12Q2600/00—Oligonucleotides characterized by their use
- C12Q2600/158—Expression markers
Landscapes
- Health & Medical Sciences (AREA)
- Chemical & Material Sciences (AREA)
- Immunology (AREA)
- Organic Chemistry (AREA)
- Life Sciences & Earth Sciences (AREA)
- Proteomics, Peptides & Aminoacids (AREA)
- Genetics & Genomics (AREA)
- Biochemistry (AREA)
- Biophysics (AREA)
- General Health & Medical Sciences (AREA)
- Molecular Biology (AREA)
- Pathology (AREA)
- Engineering & Computer Science (AREA)
- Zoology (AREA)
- Medicinal Chemistry (AREA)
- Analytical Chemistry (AREA)
- Wood Science & Technology (AREA)
- Physics & Mathematics (AREA)
- Biotechnology (AREA)
- Microbiology (AREA)
- Hospice & Palliative Care (AREA)
- Oncology (AREA)
- Bioinformatics & Cheminformatics (AREA)
- General Engineering & Computer Science (AREA)
- Measuring Or Testing Involving Enzymes Or Micro-Organisms (AREA)
- Medicines That Contain Protein Lipid Enzymes And Other Medicines (AREA)
- Investigating Or Analysing Biological Materials (AREA)
- Apparatus Associated With Microorganisms And Enzymes (AREA)
- Medicines Containing Antibodies Or Antigens For Use As Internal Diagnostic Agents (AREA)
- Peptides Or Proteins (AREA)
Abstract
The present invention relates to methods for detecting, diagnosing, prognosing, monitoring and treating hepatocellular carcinoma patients. In particular, the invention provides diagnostic markers for the detection and treatment of patients who would benefit from immunotherapy, i.e. patients who respond most strongly to immunotherapy.
Description
Cross Reference to Related Applications
Priority of us patent application serial No. 62/519,711 filed on 14.6.2017 and us patent application serial No. 62/629,231 filed on 12.2.2018, which are incorporated herein by reference in their entirety, are claimed in this application.
Technical Field
The present invention relates to methods for detecting, diagnosing, prognosing, monitoring and treating hepatocellular carcinoma patients. In particular, the invention provides diagnostic markers for the detection and treatment of patients who would benefit from immunotherapy, i.e. patients who respond most strongly to immunotherapy.
Background
Hepatocellular carcinoma (HCC) is the second leading cause of cancer-related mortality worldwide. The number of HCC deaths (about 80 million per year) overlaps with new cases, demonstrating its high mortality (Murray, et al 2012; Llovet, et al 2016). This malignancy commonly occurs in the context of chronic inflammatory liver disease (e.g., cirrhosis) and is associated with well-defined risk factors such as Hepatitis B Virus (HBV), Hepatitis C Virus (HCV), alcohol abuse, metabolic syndrome, and diabetes (Llovet, et al 2016). In the past decade, significant progress has elucidated the molecular pathogenesis of HCC (Zucman-Rossi, et al 2015), but current treatment options remain very limited. When curative procedures (e.g., surgical resection, transplantation, or local ablation) are effective, only a few HCC patients are diagnosed at an early stage. In advanced patients, the only systemic therapies that could improve survival were the polytyrosine kinase inhibitors sorafenib (first line) (Llovet, et al 2008) and regorafenib (second line) (Bruix, et al 2017). Nevertheless, even though these drugs provide survival benefits, the median life expectancy is less than 2 years.
HCC comprises a mixture of multiple cell types, including malignant hepatocytes, immune cells, and endothelial cells dispersed within and supporting the extracellular matrix. Previous studies have established a suite of analytical methods to virtually dissect the molecular signals derived from these different parts (Moffitt, et al 2013).
In recent years, immune checkpoint inhibitors have shown significant efficacy in different solid cancers by targeting regulatory pathways in T cells to release the human own immune response to attack the tumor. This has led to the approval by the Food and Drug Administration (FDA) of four immune-based agents, including monoclonal antibodies against cytotoxic T-lymphocyte protein (CTLA-4), programmed cell death protein 1(PD-1) and its ligand PD-L1, for the treatment of advanced malignancies, such as melanoma or lung cancer. These agents ipilimumab, nivolumab, pembrolizumab and atlizumab can significantly improve the survival of these patients (Llovet, et al. 2015). These compounds cause a long lasting clinical response and long-term remission in a subset of patients with metastatic disease (Zou, et al 2016; Khalil, et al 2016). Given that these therapies are directed against immune cells rather than tumor cells, they can be effective in a variety of cancer types, recently reported to have important activities in both solid and hematologic malignancies, including bladder and colorectal cancers (Topalian, et al 2012; Le, et al 2015). Interestingly, however, not all patients have the same likelihood of responding to these treatment regimens (Zou, et al, 2016).
In view of the prospect of these therapies and the contradictory evidence of which patients can benefit from them, reliable biomarkers are constantly being sought to predict positive outcomes of immunotherapy. One such biomarker is the expression of the protein PD-L1. Preliminary experiments with non-small cell lung cancer showed that patients positive for PD-L1 expression had a greater overall response compared to patients negative for PD-L1 (Herbst, et al 2016; Garon, et al 2015; topallian, et al 2012).
However, due to its low accuracy and mixed results, Immunohistochemistry (IHC) -based PD-L1 detection is unreliable in determining and predicting patient response to immunotherapy. First, this procedure has technical problems. IHC-based detection was subjective in defining "positive" tumor PD-L1 staining and using different cut-offs for positive staining. Differences also exist in pathologist's findings using the same assay (Brunnstrom, et al 2017; Wang, et al 2016).
In addition, antibodies used in different studies have different sensitivities. In various studies of PD-L1 using IHC, at least seven different antibodies were used. The use of different PD-L1 antibodies was another reason for the differences in expression of PD-L1 in tumors in various studies. See generally Wang, et al 2016.
The accuracy of IHC protocols also depends on biological factors, such as temporal and spatial factors. In other words, the expression of PD-L1 in tumors was not uniform in time and area. For example, specimens obtained when PD-L1 is overexpressed in tumors (temporally) or samples obtained from patients losing the associated tumor-immune interface (spatially) lead to inaccuracies in PD-L1 measured by IHC (Latchman, et al 2001). Therefore, the accuracy of IHC for PD-L1 detection depends on the time of occurrence of the biopsy and is also relevant to previous treatments including radiation and chemotherapy. Studies have shown that tumor PD-L1 expression is upregulated following radiation therapy (Deng, et al 2014).
Spatial considerations also need to be taken into account, since PD-L1 expression may differ in primary tumors and metastatic lesions. Even in one sample, different patterns of PD-L1 expression (focal and diffuse) may lead to bias (Wang, et al 2016). Also, different sites on the same tumor were heterogeneous, and a positive PD-L1 result was determined by membrane or cytoplasmic staining, indicating that only positive membrane staining was biologically significant (Wang, et al 2016).
Furthermore, accurate scoring of PD-L1 protein expression by IHC is difficult due to other factors such as retrospective data, different clinical characteristics of patients, and comparison of samples from different tumor types.
Immunotherapy has begun to be used to treat HCC. The results of a phase II extended clinical trial testing nivolumab showed that objective response rate was 16% and median survival was 14 months in 214 treated patients (El-Khoueiry, et al 2015). However, in this experiment, objective responses (21/145 cases, 15%) were not associated with expression of PD-L1 on tumor cells. Little is known about the immunological features of HCC tumors and how to use this information to maximize the response to immune-based therapies.
For these reasons and the fact that, as described above, PD-L1 expression is not a reliable biomarker for selecting ideal candidates for immunotherapy, there is a need to identify accurate predictive biomarkers to detect HCC patients who may benefit from immunotherapy.
Disclosure of Invention
The present invention solves the problem of using PD-L1 expression as a biomarker to detect the phenotype of an immunotherapy response in hepatocellular carcinoma (HCC) patients by accurately detecting the immunotherapy response phenotype using a panel of gene expression biomarkers.
The biomarkers described herein not only provide a novel and unique way to deterministically identify and predict a patient's response to immunotherapy, but also provide targets for drug screening and basic research for HCC and other cancers.
Using non-Negative Matrix Factorization (NMF), the examples described herein deconvolute gene expression data from 956 human HCC samples and isolate the signal released from inflammatory infiltrates to characterize the immunological features of HCC. This enables the identification of immunospecific classes of HCC with specific biological properties, referred to as "immune" classes. Key features of this category include the actual presence and activation of immune cells, enhanced cytolytic activity and protein expression of PD-1 and PD-L1. Further evaluation of this category using expression of 112 genes (fig. 10) revealed a gene signature profile, which indicates a response to immunotherapy. The gene expression profile of this immune class was compared to HCC patients treated with immunotherapy and to other cancer patients who responded to HCC. In these cases, the gene expression profile of the immune class correlates with immunotherapy responsiveness.
The 112 gene panels were successfully reduced to 56 genes, and those genes with the highest scores were selected. As shown below, the sensitivity of the 56-gene immune classifier was 97%, the specificity was 98%, and the accuracy was 97% (table 3).
Thus, the use of gene expression biomarkers provides accurate detection of HCC patients responding to immunotherapy.
In addition, a subset of the 112 genes in fig. 10 are listed in fig. 11, including 108 genes that are up-regulated in the immune class.
Further profiling of the immune classes revealed two powerful types of microenvironment-based with active or depleted (exhausted) immune activity. These further classifications help determine treatment options for HCC patients and provide a comprehensive understanding of the HCC immune environment. The depleted immune activity class can be identified by the genetic pathway in figure 12. These gene expression biomarkers were particularly relevant in identifying these subclasses, as there were no significant differences between the two classes in PD-L1 and PD-1 expression (example 4).
Accordingly, one embodiment of the present invention is a method and/or assay for detecting a phenotype responsive to immunotherapy in a subject diagnosed with hepatocellular carcinoma, comprising:
a. analyzing gene expression levels of one or more genes in table 3 in a sample from a subject with hepatocellular carcinoma to obtain a test expression profile;
b. comparing the test expression profile of the gene to a reference expression profile, wherein the reference expression profile comprises a reference expression level of the same gene in a sample from a control group; and
c. detecting that the gene expression level of one or more genes in the test expression profile is the same as compared to the expression level of the same gene in the reference expression profile indicative of an immunotherapy-responsive phenotype, and further detecting that the subject is responsive to immunotherapy.
Another embodiment of the invention is a method of treating a subject with HCC, comprising:
a. analyzing gene expression levels of one or more genes in table 3 in a sample from a subject with hepatocellular carcinoma to obtain a test expression profile;
b. comparing the test expression profile of the gene to a reference expression profile, wherein the reference expression profile comprises a reference expression level of the same gene in a sample from a control group;
c. detecting that the gene expression level of one or more genes in the test expression profile is the same as compared to the expression level of the same gene in the reference expression profile indicative of an immunotherapy-responsive phenotype; and
d. treating the subject with immunotherapy.
In some embodiments, the immunotherapy includes, but is not limited to, monoclonal antibodies against cytotoxic T-lymphocyte protein (CTLA-4) (e.g., ipilimumab), programmed cell death protein 1(PD-1) (e.g., nivolumab and pembrolizumab) and its ligand PD-L1 (e.g., atelizumab), and combinations thereof.
In some embodiments, the subject has recently been diagnosed with hepatocellular carcinoma (HCC). In some embodiments, the subject has previously received treatment for HCC.
In some embodiments, the sample is tumor tissue. In some embodiments, multiple samples from a tumor are analyzed for gene expression.
Expression of any gene can be determined by any method known in the art, including but not limited to microarrays; southern blotting; northern blotting; dot printing; extending the primer; nuclease protection; subtractive hybridization and separation using non-duplex molecules such as hydroxyapatite; solution hybridization; filtering the hybridization; amplification techniques such as RT-PCR and other PCR related techniques (e.g., PCR with melting curve analysis and PCR with mass spectrometry); fingerprinting, e.g., using restriction endonucleases; and the use of structure-specific endonucleases. mRNA expression can also be analyzed using mass spectrometry techniques (e.g., MALDI or SELDI), liquid chromatography, and capillary gel electrophoresis. Any other method known in the art can be used to detect the presence or absence of a transcript.
Gene expression from subjects with HCC can be compared to a reference expression level of the same gene in a control group. The control group may be subjects with HCC who are responsive to immunotherapy. The control group can be subjects with another cancer responsive to immunotherapy. The control group can be subjects with lung cancer or melanoma in response to immunotherapy. The level of the expressed gene can be measured as an absolute value or a relative value. The concentration of specific RNA is measured absolutely quantitatively and requires a calibration curve. Fold-change differences in specific RNAs were measured relative quantitatively compared to housekeeping genes. Relative quantification is usually sufficient to investigate physiological changes in gene expression levels.
Any of these methods may be performed using one or more of the genes listed in figures 10 and 11.
The invention also provides methods for further detecting and identifying responsiveness to immunotherapy by classifying immune classes as either active immune response classes or depleted immune response classes. These sub-classifications are based on the activation of a substrate. Those lacking an activating substrate are considered to be active immune response classes. Those with an activating matrix are considered to be a depleting immune response class. Both classes belong to the immune class, but require slightly different treatment regimens.
Thus, a further embodiment of the invention is a method of treating a subject with HCC, comprising
a. Analyzing gene expression levels of one or more genes in table 3 in a sample from a subject with hepatocellular carcinoma to obtain a first test expression profile;
b. comparing a first test expression profile of one or more genes in table 3 to a first reference expression profile, wherein the first reference expression profile comprises reference expression levels of the same genes in a sample from a control group;
c. detecting that the gene expression level of one or more genes in the test expression profile is the same as compared to the expression level of the same gene in the reference expression profile indicative of an immunotherapy response phenotype, and further detecting that the subject is responsive to immunotherapy;
d. analyzing gene expression levels of one or more genes in the pathway in fig. 12 in a sample from a subject with hepatocellular carcinoma to obtain a second test expression profile;
e. comparing a second test expression profile of one or more genes in the pathway in figure 12 to a second reference expression profile, wherein the second expression profile comprises reference expression levels of the same genes in a sample from a control group;
f. detecting that the gene expression level of one or more genes in the second test expression profile is the same as compared to the expression level of the same gene in the second reference expression profile indicative of a depleted immune response phenotype; and
g. treating the subject with an immunotherapy in combination with a second agent.
In some embodiments, the subject has recently been diagnosed with hepatocellular carcinoma (HCC). In some embodiments, the subject has previously received treatment for HCC.
In some embodiments, the sample is tumor tissue. In some embodiments, multiple samples from a tumor are analyzed for gene expression.
Expression of any gene can be determined by any method known in the art, including but not limited to microarrays; southern blotting; northern blotting; dot printing; extending the primer; nuclease protection; subtractive hybridization and separation using non-duplex molecules such as hydroxyapatite; solution hybridization; filtering the hybridization; amplification techniques (e.g., RT-PCR) and other PCR-related techniques (e.g., PCR with melting curve analysis and PCR with mass spectrometry); fingerprinting, e.g., using restriction endonucleases; and the use of structure-specific endonucleases. mRNA expression can also be analyzed using mass spectrometry techniques (e.g., MALDI or SELDI), liquid chromatography, and capillary gel electrophoresis. Any other method known in the art can be used to detect the presence or absence of a transcript.
Gene expression from subjects with HCC can be compared to a reference expression level of the same gene in a control group. The control groups of step (b) and step (e) may be the same or the control groups may be different. The control group may be subjects with HCC who are responsive to immunotherapy. The control group can be subjects with another cancer responsive to immunotherapy. The control group can be subjects with lung cancer or melanoma in response to immunotherapy. The level of the expressed gene can be measured as an absolute value or a relative value. The concentration of specific RNA is measured absolutely quantitatively and requires a calibration curve. Fold-change differences in specific RNAs were measured relative quantitatively compared to housekeeping genes. Relative quantification is usually sufficient to investigate physiological changes in gene expression levels.
Steps a-c may be performed using one or more of the genes listed in figures 10 and 11.
In some embodiments, the immunotherapy includes, but is not limited to, monoclonal antibodies against cytotoxic T-lymphocyte protein (CTLA-4) (e.g., ipilimumab), programmed cell death protein 1(PD-1) (e.g., nivolumab and pembrolizumab) and its ligand PD-L1 (e.g., atelizumab), and combinations thereof.
In some embodiments, the gene whose expression level is determined in step (d) is PMEPA1, LGALS1, LGALS3, TGF-J3, or from the CTNNB1 signaling pathway comprising CXCL12 and CCL 2.
In some embodiments, the second agent includes, but is not limited to, a TGF- β inhibitor and an inhibitor of the CTNNB1 signaling pathway.
A further embodiment of the invention is a method of treating a subject with HCC comprising
a. Analyzing gene expression levels of one or more genes in table 3 in a sample from a subject with hepatocellular carcinoma to obtain a first test expression profile;
b. comparing a first test expression profile of one or more genes in table 3 to a first reference expression profile, wherein the first reference expression profile comprises reference expression levels of the same genes in a sample from a control group;
c. detecting that the gene expression level of one or more genes in the test expression profile is the same as compared to the expression level of the same gene in the reference expression profile indicative of an immunotherapy response phenotype, and further detecting that the subject is responsive to immunotherapy;
d. analyzing the gene expression level of one or more genes selected from the group consisting of PMEPA1, LGALS1, LGALS3, TGF- β, genes from the CTNNB1 signaling pathway, and combinations thereof in a sample from a subject with hepatocellular carcinoma to obtain a second test expression profile;
e. comparing a second test expression profile of one or more genes selected from the group consisting of PMEPA1, LGALS1, LGALS3, TGF- β, a gene from the CTNNB1 signaling pathway, and combinations thereof to a second reference expression profile, wherein the second expression profile comprises reference expression levels of the same gene in a sample from a control group;
f. detecting that the gene expression level of one or more genes in the second test expression profile is the same as compared to the expression level of the same genes in the second reference expression profile indicative of a depleted immune response phenotype; and
g. treating the subject with an immunotherapy in combination with a second agent.
In some embodiments, the genes from the CTNNB1 signaling pathway are CXCL12 and CCL 2.
The invention also provides a kit.
Drawings
For the purpose of illustrating the invention, there are depicted in the drawings certain embodiments of the invention. The invention, however, is not limited to the precise arrangements and instrumentalities of the embodiments depicted in the drawings.
Figure 1 depicts a flow chart of the study. A total of 956 HCC samples were used for this study. Training cohorts (hampsomes (heptamics)) including 228 HCCs were virtually microdissected to identify immune classes. Verification was then performed in 7 independent data sets.
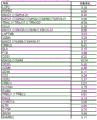
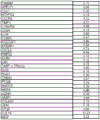
FIG. 2 shows a table of publicly available gene markers used in this study in the order they appear in the text.
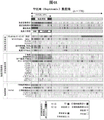
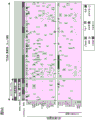
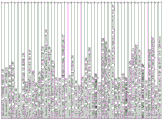
Figure 3 shows the identification of HCC immune classes. Figure 3A shows a consensus-cluster heatmap of HCC samples (training dataset, n 228) using canonical genes for immune expression patterns and defined by random forests. In the heatmap, high and low gene set enrichment scores are represented in red and blue, respectively. Positive prediction of markers is indicated in red and grey is absent. Both markers achieved similar results. FIG. 3B shows representative images of immune cell infiltration, staining of PD-1 and PD-L1 in patients in the immune category (M321) and in patients outside the immune category (M743). A 20 times capture image is used. Fig. 3C is a graph showing Tertiary Lymphoid Structure (TLS) counts for immune category patients compared to the remaining cohort. The vertical axis represents TLS counts expressed as continuous variables, and the horizontal axis represents patients within the immune category (right side) and patients outside the immune category (left side).
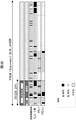
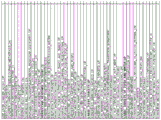
Figure 4 shows that the immune class contains two different microenvironment-based subtypes. Figure 4A is NTP analysis of whole tumor gene expression data using molecular markers capable of capturing an activated inflammatory stromal response, identifying subtypes of two different immune classes, namely the active (blue bars) and depleted (green bars) immune response subtypes. In the heatmap, high and low gene set enrichment scores are represented in red and blue, respectively; the same expression is used for high and low gene expression. Positive predictions for markers calculated by NTP are shown in red and grey in absence. Figure 4B is a heat map representation of the distribution of immune cell infiltration (high and low), TLS [ positive (>5 lesions) and negative (<5 lesions) ], PD-1 and PD-L1 positive staining in the immune class and remaining cohorts, and between the two immune subtypes. No significant differences were observed between the active and depleted immune subtypes in immune infiltration (10/35 and 1/14, p 0.14), TLS counts (>5 foci, 15/34 and 4/17, p 0.22), PD-L1(9/34 and 3/14, p 1.00), and PD-1 expression (8/34 and 0/14, p 0.08). FIG. 4C is a representative image of immune cell infiltration, staining for PD-1 and PD-L1 in patients of the active immune subtype (M499) and patients of the depleted immune subtype (B209). The image was captured using a factor of 40.
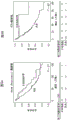
FIG. 5 shows the Kaplan-Meier estimates of overall survival and recurrence rates based on the status of immune response type and robustness of immune classes. Figure 5A shows Kaplan-Meier estimates of overall survival from the status of active immune responses in the hampsoimi (Heptromic) cohort (active versus remaining plus depleted immune responses). FIG. 5B shows the Kaplan-Meier estimates of overall survival in TCGA cohorts based on active immune response status 1. Fig. 5C shows that the immunization class was externally validated in a publicly obtained TCGA dataset. Figure 5D shows Kaplan-Meier estimates of total relapse rate in training cohorts according to microenvironment-based immune subtypes. In the training group (hampsoimi (hepthromic)), patients in the active immune response group had a lower tumor recurrence rate (p 0.04) than in the depleted group. No significant difference was observed between the active immune response group and the remaining cohorts (p 0.32), and no significant difference was observed between the depleted immune response group and the rest (p 0.15). Figure 5E shows Kaplan-Meier estimates of total relapse rate according to microenvironment-based immune subtypes in validation datasets. In the validation set, only a non-significant trend was observed, with a median of 79 months for the active immune response subtype and 27 months for the depleted immune response subtype (p 0.14) with the remaining cohort at 31 months (p 0.08).
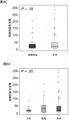
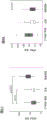
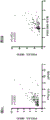
Figure 6 shows the association of immune classes with copy number aberrations, presence of neoantigens, mutations in driver genes, and changes in methylation. Figure 6A shows the revenue load of the immunized species patients relative to the remaining cohort. Figure 6B shows the loss load of the immune category patients relative to the remaining cohort. In both figures, the whole (left figure) and the lesion (right figure) are shown. Figure 6C is a graph showing that the mutation rates predicted to generate neoantigens are similar in the immune classes and remaining cohorts. Figure 6D is a graph showing the prediction of mutation rates to produce neoantigens between two microenvironment-based subtypes and the remaining cohorts. Figure 6E is a graph comparing mutation rates between immune classes and the remaining cohorts. Fig. 6F is a graph of mutation rates between different immune subtypes and the remaining cohorts. Figure 6G is a heat map representation of the distribution of mutations in known driver genes between immune class patients and the remaining TGCA cohorts. Fig. 6H is a graph showing the difference in the methylation levels of 363 CpG sites in 192 immune-related promoter genes in the 3 groups, which is shown in a box plot. According to Tukey testing, the exact p-value is: between active and rest: p ═ 3.57E-13; exhaustion and rest: p is 1.93E-13; exhaustion and initiative: p is 3.42E-7. Figure 6I is a LGALS3 expression profile (left) and PMEPA1 expression profile (right) in the immune response subtype and remaining cohort. Fig. 6J is a boxplot of CCL4 expression in patients of CTNNB1 species compared to the immune species and the remaining cohorts. Fig. 6K is a boxplot of normalized PTK2 expression (microarray data) for patients of the CTNNB1 species compared to the immunized species and the remaining cohort of patients. PTK2 expression is indicated by log 2. Figure 6L shows a correlation plot of normalized PTK2 gene expression levels detected by microarray and qRT-PCR in a hampstart (Heptromic) cohort of HCC samples. Figure 6M is a correlation plot of normalized gene expression levels detected by microarray and copy number in the hampstart (heptamic) cohort of HCC samples (Spearman rank correlation coefficient).
Figure 7 shows that the intratumoral immune spectrum does not correspond to the immune infiltration of the surrounding non-tumoral liver. Fig. 7A shows gene expression of tumors (upper panel), and matched peripheral non-tumor liver (lower panel) was available for 167 rare tomtommy (Heptromic) cohort patients (training dataset). The heat map represents the enrichment score of the immune markers in the tumor (upper panel) and the corresponding surrounding tissue (lower panel). Patients who were positive for the immune classifier had a more frequent multinode rate [25/55 (45%) vs 24/110 (22%), p 0.01 ]. Figure 7B shows Kaplan-Meyer estimates of overall survival based on the presence of immune classifiers in the surrounding liver.
Figure 8 shows the anti-tumor activity of nivolumab in patient # 1 positively predicted by the immune classifier. Initially, patient # 1 developed intrahepatic recurrence and metastatic pelvic mass 16cm after resection of a single 3cm HCC. Figure 8A shows a CT image of patient # 1 prior to starting treatment with nivolumab. Figure 8B shows a CT image of patient # 1 showing a 75% reduction in tumor mass after 2 months of treatment with nivolumab. White arrows point to the tumor in each image.
Figure 9 shows the genetic similarity between patients in the immune category and melanoma patients responding to PD-1 therapy. FIG. 9A is a subgraph analysis of hampsoimi (Heptomic) in which two groups (immune classes versus rest) in HCC cohort and 4 groups in Chen et al dataset were considered [ PD1 pre-responder (pre-PD 1R) and non-responder (pre-PD 1 NR); CTLA4 pre-responder (pro-CTLA 4R) and non-responder (pro-CTLA-4 NR) ]. Fig. 9B is a subgraph analysis of hampsoimi (hepthromic) in which 3 groups in the HCC cohort (active, exhausted and remaining) and 4 groups in the Chen et al dataset were considered [ PD1 pre-responder (pre-PD 1R) and non-responder (pre-PD 1 NR); CTLA4 pre-responder (pro-CTLA 4R) and non-responder (pro-CTLA-4 NR) ]. FIG. 9C is a subgraph analysis of TCGA considering two groups in HCC cohort (immune classes vs. rest) and 4 groups in Chen et al dataset [ PD1 pre-responder (pre-PD 1R) and non-responder (pre-PD 1 NR); CTLA4 pre-responder (pro-CTLA 4R) and non-responder (pro-CTLA-4 NR) ]. FIG. 9D is a subgraph analysis of TCGA considering 3 groups in HCC cohort (active, exhausted and remaining) and 4 groups in Chen et al dataset [ PD1 pre-responder (pre-PD 1R) and non-responder (pre-PD 1 NR); CTLA4 pre-responder (pro-CTLA 4R) and non-responder (pro-CTLA-4 NR) ]. Similarities were observed between the immune class and anti-PD 1 responders (p 0.01 in hampstan (heptamic) and non-significant trend in TCGA) and between the active immune subtype of both cohorts and anti-PD 1 responders (Bonferroni corrected p value 0.01).
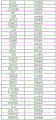
FIG. 10 is a table of genes in the subclass gene classifier.
Figure 11 is a table of genes significantly overexpressed in the immune classes.
Figure 12 is a table of gene pathways enriched in depleted immune responder subtypes.
Figure 13 is a table of lesion High Level Amplification (HLA) and homozygous deletion profiles in the driver between the immune classes and the rest of the patients.
Fig. 14 shows a heat map visualization of the predictive power of 56 gene immune classifiers compared to the original 112 gene immune classifiers. In the heatmap, each column represents a sample, and each row represents 112 gene classifiers or 56 gene immune classifiers (bottom row). Samples with positive predictions belonging to the immune category are shown as black boxes on the left, while patients with negative predictions for the immune classifier are shown as light boxes on the right. Fig. 14A shows the results of the TGCA dataset (n 190 samples). Fig. 14B shows the result of the validation queue (n-132). Fig. 14C shows the results of the HCC-I dataset (n-90).
Fig. 15 is a Receiver Operating Characteristic (ROC) curve (n 441) calculated in all analyzed patients. Standard error 0.011, confidence interval (0.949-0.993), asymptotic significance 0.011.
Detailed Description
Definition of
The terms used in this specification generally have their ordinary meanings in the art, within the context of the present invention and in the specific context in which each term is used. Certain terms are discussed below or elsewhere in the specification to provide additional guidance to the practitioner in describing the methods of the invention and how to use them. Moreover, it will be appreciated that the same thing can be explained in more than one way. Thus, alternative language and synonyms may be used for any one or more of the terms discussed herein, with no special meaning as to whether a term is set forth or discussed herein. Synonyms for certain terms are provided. The recitation of one or more synonyms does not exclude the use of other synonyms. Examples used anywhere in the specification, including examples of any term discussed herein, are illustrative only and in no way limit the scope and meaning of the invention or any exemplary term. Also, the present invention is not limited to the preferred embodiments thereof.
As used herein, the term "hepatocellular carcinoma (HCC)" refers to a primary malignancy of the liver, occurring primarily in patients with chronic liver disease and cirrhosis. Cells of origin are considered hepatic stem cells, although this is still the subject of the study. Tumors progress with local expansion, intrahepatic spread and distant metastasis.
As used herein, the term "subject" or "patient" as used herein refers to a mammal, preferably a human, for which treatment may be provided.
The term "treatment" or "treating" as used herein refers to administering a drug or performing a medical procedure to a subject to prevent (prevent) or cure or reduce the extent or likelihood of the occurrence or recurrence of a pathology or disease or disorder or an event that occurs in the context of a disease in the subject or patient. For purposes of the present disclosure, the term may also refer to administration of a pharmacological agent or agent, or to performing non-pharmacological procedures, including, but not limited to, radiation therapy and surgery. Pharmacological agents used herein may include, but are not limited to, art-established chemotherapeutic agents such as gemcitabine (gemcar), 5-fluorouracil (5-FU), irinotecan (CAMPTOSAR), oxaliplatin (eloptin), albumin-bound paclitaxel (ABRAXANE), capecitabine (XELODA), cisplatin, paclitaxel (TAXOL), docetaxel (TAXOTERE), and irinotecan liposome (oniyde). Pharmacological agents may include agents used in immunotherapy, such as checkpoint inhibitors, which may include, but are not limited to, ipilimumab, nivolumab, pembrolizumab, and atlizumab. Treatment may include a variety of pharmacological agents as well as radiation therapy and surgery.
The term "agent" as used herein refers to a substance that produces or is capable of producing an effect and includes, but is not limited to, chemicals, drugs, biological substances, small organic molecules, antibodies, nucleic acids, peptides and proteins.
The phrase "therapeutically effective amount" as used herein means an amount sufficient to cause amelioration of a clinically significant condition in a subject, or to delay or minimize or alleviate one or more symptoms associated with the disease, or to cause a desired beneficial physiological change in a subject.
The term "expression profile" or "gene expression profile" refers to any description or measurement of one or more genes expressed by a cell, tissue, or organism under or in response to a particular condition. Expression profiles can identify genes that are up-regulated, down-regulated, or unaffected under particular conditions. Gene expression can be detected at the nucleic acid level or at the protein level. Expression profiling at the nucleic acid level can be accomplished using any technique that can be used to measure the level of gene transcripts. For example, the method may employ in situ hybridization, Northern hybridization, or hybridization to a nucleic acid microarray (e.g., an oligonucleotide microarray or a cDNA microarray). Alternatively, the method may employ reverse transcriptase-polymerase chain reaction (RT-PCR), such as fluorescent dye-based quantitative real-time PCR (R-PCR) PCR). Expression profiling at the protein level can be accomplished using any technique that can be used to measure protein levels, for example using an array of peptide-specific capture agents.
The terms "gene", "gene transcript" and "transcript" are used interchangeably in this application. The term "gene", also referred to as a "structural gene", refers to a DNA sequence encoding or corresponding to a particular sequence comprising all or part of the amino acids of one or more proteins or enzymes, and may or may not include regulatory DNA sequences (e.g., promoter sequences) that determine, for example, the conditions under which the gene is expressed. Some genes that are not structural genes may be transcribed from DNA to RNA, but are not translated into amino acid sequences. Other genes may then act as regulators of structural genes or of DNA transcription. A "transcript" or "gene transcript" is an RNA sequence produced by transcription of a particular gene. Thus, the expression of a gene can be measured by the transcript.
As used herein, the term "immunological category" refers to patients with hepatocellular carcinoma who exhibit a marked enrichment in markers that recognize immune cells, i.e., T cells, cytotoxic Tertiary Lymphoid Structures (TLS), as well as macrophages, immunogenic genes, IFN gene markers predictive of response to pembrolizumab in melanoma and head and neck squamous cell carcinoma, and PD-1 signaling.
As used herein, the term "IFN" refers to an interferon.
As used herein, the term "CTNNB 1" refers to catenin β 1.
As used herein, the term "NMF" refers to non-negative matrix factorization.
As used herein, the term "TLS" refers to a tertiary lymphoid structure.
As used herein, the term "FDR" refers to false discovery rate.
As used herein, the term "CCL" refers to a chemokine (C-C motif) ligand.
As used herein, the term "CXCL" refers to a chemokine (C-X-C motif) ligand.
As used herein, the term "JAK/STAT" refers to Janus kinase/signal transducers and transcriptional activators.
As used herein, the term "GSEA" refers to a gene set enrichment assay.
As used herein, the term "EMT" refers to epithelial-mesenchymal transition.
As used herein, the term "NTP" refers to nearest template prediction.
As used herein, the term "TBRS" refers to a TGF- β response marker.
As used herein, the term "F-TBRS" refers to a fibroblast-derived TGF- β response marker.
As used herein, the term "T-TBRS" refers to a T cell-derived TGF- β response marker.
As used herein, the term "LGALS" refers to a lectin, galactose-binding soluble 1.
As used herein, the term "NKG 2D" refers to the natural killer group 2D.
As used herein, the term "TBX" refers to a 1T-box transcription factor.
As used herein, the term "FFPE" refers to formalin-fixed paraffin embedding.
As used herein, the term "PMEPA 1" refers to the transmembrane protein of the prostate, androgen inducible 1.
As used herein, the term "PTK 2" refers to protein tyrosine kinase 2.
As used herein, the term "AFP" refers to alpha-fetoprotein.
As used herein, the term "RF" refers to a random forest.
As used herein, the term "SCNA" refers to somatic copy number aberrations.
The term "about" or "approximately" means within an acceptable error range for a particular value, as determined by one of ordinary skill in the art, which will depend in part on how the value is measured or determined, i.e., the limits of the measurement system, i.e., the degree of accuracy required for a particular purpose (e.g., a pharmaceutical formulation). For example, "about" can mean within 1 or more than 1 standard deviation, according to convention in the art. Alternatively, "about" may refer to a range of up to 20%, preferably up to 10%, more preferably up to 5%, and still more preferably up to 1% of a given value. Alternatively, particularly for biological systems or processes, the term may index values within an order of magnitude, preferably within 5-fold, more preferably within 2-fold. Where a particular value is described in the application and claims, unless otherwise stated, it is assumed that the term "about" means within an acceptable error range for the particular value.
Molecular biologyStudy the design
In accordance with the present invention, there are numerous tools and techniques within the skill of the art, such as those commonly used in molecular immunology, cellular immunology, pharmacology, and microbiology. See, e.g., Sambrook et al (2001) molecular cloning: a Laboratory Manual (Molecular Cloning: A Laboratory Manual.) third edition Cold spring harbor Laboratory Press: cold spring harbor, new york; ausubel et al, eds (2005) molecular biology recent Protocols (Current Protocols in molecular biology), John Willi father, Hopkinck, N.J.; bonifacino et al, eds (2005) molecular Biology recent Protocols (Current Protocols in Cell Biology), John Willi father, Hopkinck, N.J.; coligan et al, eds (2005) Current Protocols in Immunology, John Willi parent subsidiary: Hobock, N.J.; coico et al, edited (2005) Current Protocols in microbiology, John Willi, parent subsidiary: Hobock, N.J.; coligan et al, edited (2005) the latest protocol in Protein Science (Current Protocols in Protein Science), John Willi father, Hopkinck, N.J.; and Enna et al, edited (2005) Current Protocols in Pharmacology, John Willi father and son, Hopkinck, N.J.
Identification of immune classes and subclasses, active and exhaust immune responses of HCC
The present invention solves the problem of using PD-L1 expression as a biomarker to detect immunotherapy responses by accurately detecting the phenotype of an HCC patient's immunotherapy responses using a panel of gene expression biomarkers.
The biomarkers described herein not only provide a novel and unique way to deterministically identify, detect and predict a patient's response to immunotherapy, but also provide a variety of markers for drug screening and basic research in HCC and other cancers.
Using non-Negative Matrix Factorization (NMF), the examples described herein deconvolute gene expression data from 956 human HCC samples and isolate the signal released from inflammatory infiltrates to characterize the immunological features of HCC. This enables the identification of a robust immunospecific class of HCC with specific biological properties, not previously noted, called the "immune" class. Nearly 25% of HCCs belong to the immune class, whose molecular characteristics-including high infiltration of immune cells, expression of PD-1 and PD-L1, and active IFN- γ signaling-are highly similar to those cancers that respond most strongly to immunotherapy (Ji, et al 2012; Le, et al 2015; Bald, et al 2014). Further evaluation of this category using expression of 112 genes (fig. 10) found a gene signature profile, which indicates a response to immunotherapy (examples 2 and 5). The gene expression profile of this immune class was compared to HCC patients treated with immunotherapy and to other cancer patients responding to HCC. In these cases, the gene expression profile of the immune class correlated with immunotherapy responsiveness (example 5; FIGS. 8 and 9).
The original 112 gene immune classifier was successfully reduced to 56 genes, selecting those genes with the highest scores (table 3). The predictive power of 56 genetic immune classifiers has been tested and compared to 112 genetic original immune classifiers in 3 data sets: TGCA, validation queue and HCC-1 dataset. The sensitivity of the 56 gene immune classifiers was 97%, the specificity 98% and the accuracy 97% (example 10; FIGS. 14 and 15). Thus, the use of gene expression biomarkers provides accurate detection of HCC patients responding to immunotherapy.
PD-L1 staining was enriched in the immune class, but failed to capture most cases, and therefore represented a suboptimal marker (example 3). As described above, this finding is consistent with the lack of predictive power of PD-L1 expression observed on tumor cells in large phase II studies using nivolumab on HCC patients (El-Khoueiry, et al 2017), and suggests the need for additional biomarkers for detecting those HCC patients who would benefit from immunotherapy.
Although this immunophenotype of immune class can predict response to immunotherapy, further analysis was performed because the favorable response to checkpoint inhibitors relies on complex and dynamic interactions between tumor cells, immune cells, and other immune modulators in the microenvironment, which may inhibit or enhance the immune response. In this regard, virtual profiling of gene expression profiles for immune classes can elucidate this interaction and identify two clear sample clusters based on microenvironments: 1) an active immune response and 2) a depleting immune response. The robustness of these subtypes is supported by: replication was successful in seven independent datasets on different platforms, from RNA sequencing to microarray and using different types of samples (i.e. fresh frozen and paraffin embedded tissues). The active immune response cluster showed anti-tumor immune characteristics such as enrichment of IFN markers, overexpression of adaptive immune response genes and better survival, while the depleted immune response was characterized by tumor promoting signals (e.g., activated stroma, T cell depletion and immunosuppressive components) (fig. 12). In particular, activation of TGF-B (a potent immunomodulatory cytokine that is frequently overexpressed in aggressive cancers) is significantly enriched in the depleting species. TGF-B modulates tumor-matrix interactions, angiogenesis, metastasis and suppresses host immune responses by inducing T cell failure (Park, et al 2016; Stephen, et al 2014) and promoting M2-type macrophages (Flavell, et al 2010) (example 4).
Understanding the interaction between immune responses, oncogenic signals and the tumor microenvironment is crucial to improving the efficacy of current immunotherapy. For example, patients with depleted immune responder subtypes may benefit from TGF-B inhibition binding to immune checkpoint blockades. In this regard, the phase lb/2 clinical trial (NCT02423343) is currently underway to test the novel TGF-B inhibitor, golitinib (galinisertib), in combination with nivolumab in advanced solid tumors, including HCC, without using any patient enrichment strategy. Likewise, profiling the oncogenic mechanisms responsible for T cell rejection may lead to other combination strategies for patients who may otherwise be unresponsive. Recent molecular analyses have shown a correlation between activation of the CTNNB1 signaling pathway and lower T cell infiltration in melanoma and other tumors (pora-Pardo and Godzik 2016). Consistent with these findings, HCC samples belonging to the CTNNB1 species showed lower immune cell marker scores. Interestingly, the CTNNB1 species also showed overexpression of PTK2, PTK2 being another oncogenic signal recently reported to drive immune rejection (Jiang, et al 2016).
Genes related to the prediction of immune classes in response to immunotherapy
As well discussed, expression of the current biomarker PD-L1 in response to immunotherapy is unreliable and there is a need in the art for reliable biomarkers. The data herein show for the first time a panel of genetic biomarkers that correlate with a positive response to immunotherapy.
These biomarkers included 112 genes that were differentially expressed in the immune class. These genes are listed in figure 10.
A set of 56 genes has been shown to be more sensitive and accurate in correlating positive responses to immunotherapy. These genes are listed in table 3.
In addition, 108 genes listed in figure 11 were up-regulated in the immune class.
By using these biomarkers, important predictions and determinations can be made of the response of HCC patients to immunotherapy. Although these biomarkers can be tested at any time after diagnosis of HCC, it is preferred that such tests be performed as soon as possible after a positive diagnosis of HCC is made by the clinician. In this way, valuable insights into the disease can be exploited in selecting a treatment.
Thus, in one embodiment of the invention, the expression of one or more of the genes in figure 10 may be tested, and a positive result indicates that the subject is a candidate for immunotherapy.
In a further embodiment of the invention, the expression of one or more genes in figure 11 may be tested and a positive result indicates that the subject is a candidate for immunotherapy.
In a further embodiment of the invention, expression of one or more genes in table 3 can be tested and a positive result indicates that the subject is a candidate for immunotherapy.
Also as discussed more fully, the data herein also show two distinct subclasses, which also predict the response of HCC patients to treatment. These sub-classes, termed active and depleting immune responses, can also be identified by the expression of a set of genetic pathways found in figure 12.
Thus, in a further embodiment of the invention, expression of one or more genes in the pathways listed in figure 12 may be tested, and a positive result indicates that the patient is a candidate for immunotherapy that should bind to another agent (e.g., a TGF-B inhibitor).
To detect any of these transcripts or genes, tumor samples were obtained from subjects who had been positively diagnosed with HCC, prepared and analyzed for the presence of biomarkers (e.g., gene expression) in table 3, fig. 10, 11, and/or 12. This can be accomplished in a number of ways by the diagnostic laboratory and/or the health care provider.
Alternatively, the nucleic acid may be obtained from any biological tissue including, but not limited to, liver, whole blood and plasma, and any biological fluid including, but not limited to, plasma.
Nucleic acids are extracted, isolated and purified from cells of tumors, tissues or body fluids by methods known in the art.
If desired, nucleic acid samples having gene sequences are prepared using known techniques. For example, as will be appreciated by those skilled in the art, samples can be processed using known lysis buffers, sonication, electroporation to lyse cells, and purification and expansion as required. In addition, the reaction can be accomplished in a variety of ways. The components of the reaction may be added simultaneously or sequentially in any order. In addition, the reaction may include a variety of other reagents that may be used in the methods and assays, and will include, but are not limited to, salts, buffers, neutral proteins (e.g., albumin), and detergents, which may be used to facilitate optimal hybridization and detection, and/or to reduce non-specific or background interactions. Depending on the sample preparation method and purity, reagents that otherwise improve assay efficiency, such as protease inhibitors, nuclease inhibitors, and antimicrobial agents, can also be used.
After preparation, mRNA or other nucleic acids can be analyzed by methods known to those skilled in the art. In addition, when nucleic acids are to be detected, a preferred method is to use a cleavage or shearing technique to cleave a nucleic acid sample containing the target sequence to a size that facilitates processing and hybridization to the target. This may be achieved by shearing the nucleic acid under the action of mechanical forces (e.g. ultrasound), or by cleaving the nucleic acid using restriction endonucleases or any other method known in the art. However, in most cases, the natural degradation that occurs during the archiving process will result in "short" oligonucleotides. In general, the methods and assays of the invention can be performed on oligonucleotides as short as 20-100 base pairs, 20 to 50 of which are preferred, 40 to 50, including 44, 45, 46, 47, 48 and 49 are most preferred.
Methods for examining gene expression are generally based on hybridization and include Southern blotting; northern blotting; dot printing; extending the primer; nuclease protection; subtractive hybridization and separation using non-duplex molecules such as hydroxyapatite; solution hybridization; filtering the hybridization; amplification techniques (e.g., RT-PCR) and other PCR-related techniques (e.g., PCR with melting curve analysis and PCR with mass spectrometry); fingerprinting, e.g., using restriction endonucleases; and the use of structure-specific endonucleases. mRNA expression can also be analyzed using mass spectrometry techniques (e.g., MALDI or SELDI), liquid chromatography, and capillary gel electrophoresis. Any other method known in the art can be used to detect the presence or absence of a transcript.
For a general description of these techniques, see also Sambrook et al 1989; kriegler 1990; and Ausebel et al 1990.
A preferred method for detecting gene expression is the use of an array or microarray. These terms are used interchangeably and refer to any ordered arrangement on the surface or substrate of different molecules, referred to herein as "probes". Each distinct probe of any array is capable of specifically recognizing and/or binding a particular molecule, which in the context of the array is referred to as a "target". Examples of typical target molecules that can be detected using microarrays include mRNA transcripts, cRNA molecules, cDNA, PCR products, and proteins.
Microarrays can be used to simultaneously detect the presence, absence, and quantity of a variety of different target molecules in a sample. The presence and quantity, or absence, of target molecules of the probe in the sample can be readily determined by assaying whether and how much target binds to the probe at a particular location on the surface or substrate.
In a preferred embodiment, the array used in the present invention is an "addressable array", wherein each different probe is associated with a specific "address".
The array used in the present invention is preferably a nucleic acid array comprising a plurality of nucleic acid probes immobilized on a surface or substrate. Different nucleic acid probes are complementary to different target nucleic acid molecules in the sample and can therefore hybridize. Thus, each probe can be used to simultaneously detect the presence and quantity of multiple different genes, e.g., the presence and abundance of different mRNA molecules or nucleic acid molecules derived therefrom (e.g., cDNA or cRNA).
The arrays are preferably reproducible, allowing multiple copies of a given array to be made and results to be readily compared to each other. Preferably, the microarray is small and made of a material that is stable under the binding conditions. A given binding site or unique collection of binding sites in a microarray will specifically bind to a target. It will be appreciated that when cDNA complementary to cellular RNA is prepared and hybridized to a microarray under appropriate conditions, the level or degree of hybridization to a site in the array corresponding to any particular gene will reflect the prevalence in the cell of mRNA transcribed from that gene. For example, when detectably labeled (e.g., with a fluorophore) cDNA complementary to total cellular mRNA is hybridized to a microarray, there will be little signal on the array at the sites corresponding to genes that are not transcribed in the cell (i.e., nucleic acid products that are capable of specifically binding to the gene), while genes with highly prevalent mRNA will have a relatively strong signal.
For example, (Affymetrix, Santa Clara, Calif.) generates data for evaluating gene expression profiles and other biological assays. An oligonucleotide expression array can simultaneously and quantitatively "interrogate" thousands of mRNA transcripts. Each transcript may be represented by a plurality of probe pairs on a probe array to distinguish closely related gene family members. Each probe contains millions of copies of a particular oligonucleotide probe, allowing accurate and sensitive detection of even low intensity mRNA hybridization patterns. After capturing the hybridization data using a scanner or optical detection system, the intensity values for each probe cell can be automatically calculated using software. The probe cell intensities can be used to calculate the average intensity of each gene, which is correlated with the mRNA abundance level. The enunciated data can be quickly ordered according to any analysis parameter and any selected subset of genes displayed in various graphical formats.
Other examples of microarrays that can be used in the assays and methods of the invention are according to what is sometimes referred to as VLSIPSTMTechniques of (very large scale immobilized polymer synthesis) synthesis of microarrays, for example as described in U.S. patent nos. 5,324,633; 5,744,305; 5,451,683, respectively; 5,482,867, respectively; 5,491,074, respectively; 5,624,711, respectively; 5,795,716; 5,831,070, respectively; 5,856,101, respectively; 5,858,659; 5,874,219; 5,968,740; 5,974,164; 5,981,185, respectively; 5,981,956, respectively; 6,025,601, respectively; 6,033,860, respectively; 6,090,555; 6,136,269, respectively; 6,022,963; 6,083,697, respectively; 6,291,183, respectively; 6,309,831, respectively; 6,416,949, respectively; 6,428,752 and 6,482,591.
Other exemplary arrays that may be used with the present invention include, but are not limited to, those available from Available from Inc. (san Diego, Calif.)
 Array or
 BeadChip array or at holeOther arrays including beads, such as U.S. Pat. nos. 6,266,459; 6,355,431, respectively; 6,770,441 and 6,859,570. Arrays having particles on the surface may also be used, including those described in U.S. patent nos. 6,489,606; 7,106,513, respectively; 7,126,755 and 7,164,533.
Bead arrays in fluid form, such as the fluid flow of a flow cytometer or similar device, may also be used in the methods of the invention. Exemplary forms that can be used in the present invention to distinguish beads in a fluid sample using a microfluidic device are described, for example, in U.S. patent No. 6,524,793. Commercially available fluid forms for differentiating beads include, for example, XMAP by LuminexTMMPSS of technology or Lynx therapy (Lynx Therapeutics)TMThose forms used in the process.
Dot microarrays may also be used in the methods of the invention. An exemplary spotted microarray is CodeLink available from Amersham BiosciencesTMAnd (4) array.
Another microarray that can be used in the present invention is a microarray manufactured using an inkjet printing method, such as the Sureprint available from Agilent technologiesTMProvided is a technique. Other microarrays that can be used in the present invention include, but are not limited to, U.S. patent nos. 5,429,807; 5,436,327, respectively; 5,561,071, respectively; 5,583,211, respectively; 5,658,734, respectively; 5,837,858, respectively; 5,919,523, respectively; 6,287,768, respectively; 6,287,776, respectively; 6,288,220, respectively; 6,297,006, respectively; 6,291,193 and 6,514,751.
The screening and diagnostic methods of the invention may involve amplification of a target locus. A preferred method for target amplification of nucleic acid sequences is the use of polymerases, in particular the Polymerase Chain Reaction (PCR). PCR or other polymerase-driven amplification methods can obtain millions of copies of the nucleic acid sequence of interest, which can then be used as a substrate for probes or for sequencing or other assays.
Amplification using the polymerase chain reaction is particularly useful in embodiments of the invention. PCR is a rapid and versatile in vitro method for amplifying a defined target DNA sequence present in a DNA source. Generally, the methods are designed to allow selective amplification of specific target DNA sequences within a heterogeneous collection of DNA sequences (e.g., total genomic DNA or complex cDNA populations). To allow such selective amplification, some prior DNA sequence information from the target sequence is required. This information is used to design two oligonucleotide primers (amplicons) that are specific for the target sequence, typically about 15-25 nucleotides in length.
Immune checkpoint inhibitor therapy
In one embodiment, the present invention relates to a cancer cell that utilizes this system BY driving high level expression of checkpoint proteins on its surface to control T cells expressing checkpoint proteins on the surface of T cells entering the tumor microenvironment, thereby suppressing anti-cancer immune responses, such that inhibition of checkpoint proteins results in complete or partial restoration of T cell function and immune responses to cancer cells, examples of checkpoint proteins include, but are not limited to, CTLA-4, PD-L1, PD-L2, PD-1, B7-H3, B7-H4, BTLA, HVEM, TIM3, GAL9, LAG3, LAG ta, KIR, 2B4 (belonging to the family of CD2 molecules and expressing on all NK, γ δ and CD8 (CD αβ) T cells), BY 160 (also known as CGEN-8249), CGEN-9, and CHK-9B-9 family of molecules).
Checkpoint inhibitors include any agent that blocks or inhibits the inhibitory pathway of the immune system in a statistically significant manner, such inhibitors may include small molecule inhibitors, or may include antibodies or antigen-binding fragments thereof that bind to and block or inhibit immune checkpoint receptors, or antibodies that bind to and block or inhibit immune checkpoint receptor ligands, exemplary checkpoint molecules that may be targeted for blocking or inhibition include, but are not limited to, CTLA-4, PD-Ll, PD-L, PD-1, B-H, BTLA, HVEM, GAL, LAG, TIM, VISTA, KIR, 2B (belonging to the family of CD molecules and expressed on all NK, γ δ and memory CD + () T cells), CD160 (also known as BY), CGEN-15049, CHK 1 and CHK kinase, A2 and various B-7 family ligands B family ligands including, but not limited to, B-1, B-2, B-DC, B-H, B-15049, B-H and Tre-7 family ligands, B family ligands including, anti-PDL (anti-PDL), anti-PDL, anti-PDL-binding or anti-PDL-binding antibodies (anti-PDL), anti-IgG-binding antibodies (anti-PDL), anti-binding antibodies, anti-IgG-binding antibodies, anti-IgG-4, anti-L-binding antibodies (anti-MLI, anti-L), CTLA, anti-IgG-L-TNF-IgG-4, anti-IgG-binding antibodies (anti-IgG-TNF-IgG-binding antibodies, anti-IgG-binding antibodies (anti-TNF-IgG-TNF-5, anti-TNF-5, anti-TNF-5.
Programmed cell death protein 1(PD-1) is a 288 amino acid cell surface protein molecule expressed on T cells and pro-B cells and plays a role in its fate/differentiation. PD-1 has two ligands, PD-L1 and PD-L2, which are members of the B7 family. PD-1 plays a role in tumor-specific evasion of immune surveillance. PD-1 is up-regulated in melanoma infiltrating T lymphocytes (TILs) (Dotti (2009) Blood 114(8): 1457-58). It has been found that tumors express PD-1 ligands (PDL-1 and PDL-2), which, when bound to upregulation of PD-1 in CTLs, may be contributing factors in the loss of T cell function and the inability of CTLs to mediate effective anti-tumor responses.
Clinical trials of melanoma show robust anti-tumor responses against PD-1 blocking. Significant benefits of PD-1 inhibition in advanced melanoma, ovarian cancer, non-small cell lung cancer, prostate cancer, renal cell carcinoma, and colorectal cancer have also been described. Murine model studies have applied this evidence to glioma treatment. anti-PD-1 blockade as a radiation adjuvant promoted cytotoxic T cell populations and associated long-term survival benefits in mice with gliomas.
One aspect of the invention provides checkpoint inhibitors, which are antibodies that can act as inhibitors of PD-1, thereby modulating the immune response modulated by PD-1. In one embodiment, the anti-PD-1 antibody can be an antigen-binding fragment. The anti-PD-1 antibodies disclosed herein are capable of binding to human PD-1 and agonizing the activity of PD-1, thereby inhibiting the function of immune cells expressing PD-1. Examples of PD-1 and PD-L1 blockers are disclosed in U.S. patent nos. 7,488,802; 7,943,743, respectively; 8,008,449; 8,168,757, respectively; 8,217,149, and PCT published patent application Nos.: w003042402, WO2008156712, W02010089411, W02010036959, WO2011066342, WO2011159877, WO2011082400 and WO 2011161699.
Several PD-1 inhibitors are currently being tested in clinical trials. CT-011 is a humanized IgG1 monoclonal antibody directed against PD-1. Phase II clinical trials were recently completed for diffuse large B-cell lymphoma (DLBCL) subjects who had undergone autologous stem cell transplantation. Preliminary results indicate that 70% of the subjects did not progress at the end of the follow-up period, while 47% of the controls, 82% of the subjects survived, and 62% of the controls. The test confirms that CT-011 can not only block the function of PD-1, but also enhance the activity of natural killer cells, thereby enhancing the anti-tumor immune response.
BMS 936558 is a fully human IgG4 monoclonal antibody targeting PD-1. BMS-936558 administered biweekly to subjects with advanced refractory malignancies showed persistent partial or complete regression in phase I trials. The most significant response rates were observed in subjects with melanoma (28%) and renal cell carcinoma (27%), but significant clinical activity was also observed in subjects with non-small cell lung cancer (NSCLC), and some responses lasted for more than a year.
BMS 936559 is a fully human IgG4 monoclonal antibody targeting PD-1 ligand PD-L1. Phase I results show that administration of this drug every two weeks results in a sustained response, especially in subjects with melanoma. Objective response rates in subjects with advanced NSCLC, melanoma, RCC, or ovarian cancer range from 6% to 17%), depending on the type of cancer, with some subjects having a response period that lasts for one year or more.
MK3475 was a humanized IgG4 anti-PD-1 monoclonal antibody used alone in phase III studies, or administered in combination with chemotherapy, and as the first line treatment for advanced gastric or gastroesophageal junction (GEJ) adenocarcinomas compared to chemotherapy alone. MK3475 is currently undergoing numerous phase III clinical trials worldwide.
MPDL 3280A (atelizumab) is a monoclonal antibody that also targets PD-L1. MPDL 3280A obtained the us Food and Drug Administration (FDA) designation for breakthrough therapy for the treatment of people with NSCLC expressing PD-L1 and progressing during or after standard treatment.
AMP224 is a fusion protein of the extracellular domains of a second PD-1 ligand, PD-L2 and IgG1, with the potential to block the PD-L2/PD-1 interaction. AMP-224 is currently being tested as a monotherapy in subjects with advanced cancer for phase I.
Medi4736 is an anti-PD-L1 antibody that has shown acceptable safety and sustained clinical activity in this dose escalation study. The expansion and development of MEDI4736 in a variety of cancers is ongoing as a monotherapy and as a combination therapy.
Thus, in certain embodiments, PD-1 blockers include anti-PD-1 antibodies and similar binding proteins, such as nivolumab (MDX 1106, BMS 936558, ONO 4538), a fully human IgG4 antibody that binds to PD-1 and blocks the activation of PD-1 by its ligands PD-L1 and PD-L2; (pembrolizumab)/lamblubizumab (lambrolizumab)) (MK-3475 or SCH 900475), a humanized monoclonal IgG4 antibody to PD-1; CT-011, a humanized antibody that binds to PD-1; AMP-224 is a fusion protein of B7-DC; an antibody Fc portion; BMS-936559(MDX-1105-01) for PD-L1(B7-H1) blockade. Other immune checkpoint inhibitors include lymphocyte activation gene 3(LAG-3) inhibitors, such as IMP321, soluble Ig fusion protein (Brignone, et al, 2007, J.Immunol.179: 4202-4211). Other immune checkpoint inhibitors include B7 inhibitors, such as B7-H3 and B7-H4 inhibitors. In particular, the anti-B7-H3 antibody MGA271(lo, et al, 2012, clin. Also included are TIM3 (T-cell immunoglobulin domain and mucin domain 3) inhibitors (Fourcade, et al, 2010, j.exp. med.207:2175-86 and Sakuishi, et al, 2010, j.exp. med.207: 2187-94).
The precise identity of any particular drug administered to a subjectEffective amounts will depend on their size and health, the nature and extent of their condition, and the administration of the selected therapy or combination of therapies. An effective amount for a given patient is determined by routine experimentation and is within the judgment of the clinician. A therapeutically effective amount of the subject antibody compounds may also include an amount within the range of about 0.1mg/kg to about 150mg/kg, about 0.1mg/kg to about 100mg/kg, about 0.1mg/kg to about 50mg/kg, or about 0.05mg/kg to about 10mg/kg per single dose administered to a harvested organ or patient. Known antibody-based drugs provide guidance in this regard. For example, Herceptin is administered by intravenous infusion of a 21mg/ml solutionTMThe initial loading dose was 4mg/kg body weight and the weekly maintenance dose was 2mg/kg body weight; for example, at 375mg/m per week2Administration of RituxanTM。
The health care provider can determine a therapeutically effective amount of any individual patient by monitoring the effect of the antibody compound on tumor regression, circulating tumor cells, tumor stem cells, or anti-tumor response. Analysis of the data obtained by these methods allows for modification of the treatment regimen during the course of treatment, such that the optimal amount of an antibody compound of the invention, whether used alone or in combination with each other, or in combination with another therapeutic agent, or both, can be administered, which can also determine the duration of treatment. In this way, the dosage/treatment regimen can be modified during the course of treatment so that a minimum amount of antibody compounds, used alone or in combination, exhibiting satisfactory efficacy is administered and such compounds continue to be administered as long as the patient is successfully treated. Known antibody-based drugs provide guidance regarding the frequency of administration, e.g., whether the drug should be administered daily, weekly, monthly, etc. The frequency and dosage may also depend on the severity of the symptoms.
In some embodiments, the antibody compounds of the invention can be used as human pharmaceuticals, which are administered by a variety of routes, including, but not limited to, oral, intravenous, intramuscular, intraarterial, intramedullary, intraperitoneal, intrathecal, intraventricular, transdermal, topical, subcutaneous, intratumoral, intranasal, enteral, sublingual, intravaginal, intravesical, or rectal routes. The composition may also be administered directly into a lesion, such as a tumor. The dose treatment may be a single dose schedule or a multiple dose schedule. Generally, therapeutic compositions can be prepared as injectables (liquid solutions or suspensions). Solid forms suitable for dissolution or suspension in a liquid vehicle prior to injection may also be prepared.
Current methods of treating HCC are unique in that it uses gene expression profiling to determine that a subject is responsive to immunotherapy. To date, obtaining a genetic profile of a subject's tumor in combination with the use of immunotherapy has not been used for HCC treatment or other cancer treatments using immunotherapy. This unconventional treatment of HCC will lead to better patient outcomes.
Reagent kit
It is contemplated that all of the methods and assays disclosed herein can be in kit form for use by a health care provider and/or a diagnostic laboratory.
Assays for detecting and quantifying one or more gene biomarkers can be incorporated into kits. Such a kit would include probes for one or more of the genes listed in table 3, fig. 10, 11 and/or 12, reagents for isolating and purifying nucleic acids from biological tissues or body fluids, reagents for performing assays on the isolated and purified nucleic acids, instructions for use and reference values or methods for obtaining reference values for the contained genes in a control sample.
Preferred embodiments of these kits have probes attached to a solid state. The most preferred embodiment will have probes in microarray format in which the nucleic acid probes directed to one or more genes of table 3, fig. 10, 11 and/or 12 will be ordered on a surface or substrate.
Examples of the invention
The following examples are included to illustrate embodiments of the invention. The following examples are given by way of illustration only to assist those of ordinary skill in the art in the use of the present invention. The examples are not intended to limit the scope of the invention in any way. Those of ordinary skill in the art should, in light of the present disclosure, appreciate that many changes can be made in the specific embodiments which are disclosed and still obtain a like or similar result without departing from the spirit and scope of the invention.
EXAMPLES 1-EXAMPLES 2-10 materials and methods
Patient and sample
For the purposes of the study, gene expression profiles from a total of 956 HCC human samples (fig. 1) were analyzed, including a training cohort of 228 surgically excised Fresh Frozen (FF) samples (hamtormi (heptamic) data set, GSE 63898). All samples of the training set were previously obtained from two institutions of the HCC genome consortium under IRB approval: the IRCCS national institute for tumor (istuto nazonale tomori) (milan, italy) and the hospital clinic (hospitalcrinic) (barcelona, spain). RNA profiles and methylation data were obtained for all 228 HCC samples and 168 non-tumorous parahepatic cirrhosis tissues and published elsewhere (villanuva, et al 2015). An additional 728 HCC samples from 7 independent datasets of mixed-etiology patients were used for external validation (figure 1). An additional 728 HCC samples from 7 independent datasets of mixed-etiology patients were used for external validation (figure 1).
A validation set of one of these data sets included 131 FFPE tissue samples that were previously collected by the inventors and analyzed using DASL (lonomia, san diego, california) technology (GSE20140, a sample that did not overlap with the training set) (Chiang, et al 2008; Villaneuva, et al 2011). Six other publicly available datasets included the TCGA cohort (n 190) analyzed by RNA sequencing on the enomina (Illumina) HiSeq 2000 platform and five other microarray analyzed datasets (Lee, et al 2004; Chen, et al 2002; lizuka, et al 2003; Boyault, et al 2007; Hoshida, et al 2009) for further validation. Table 1 summarizes the clinical pathology data and follow-up of the patients included in the training and validation data sets (validation and TCGA sets).
Other data sets have been reported elsewhere for clinical and pathological parameters (Lachenmayer, et al 2012).
Table 1 clinical features of training (rarely medetomic (hepthromic)) and validation cohort (validation and TCGA dataset)


AFP-alpha fetoprotein; BCLC-Barcelona clinical liver cancer; IQR-interquartile range; N/A-is not available. a-missing value training set: etiology (n ═ 2);
liver function score (n ═ 2);
multiple nodules (n ═ l);
vascular infiltration (n ═ 3)
BCLC 0-A(n=2);
Tumor differentiation (n-42);
bilirubin (n-32);
AFP(n=11);
albumin and bilirubin (n-4);
platelets (n ═ 2);
relapse (n ═ 7).
Verification set of missing values: etiology (n ═ 3);
liver function score (n ═ 6);
tumor size (n ═ 2);
multiple nodules (n ═ 2);
vascular infiltration (n ═ 6)
Satellite virus (n ═ 6);
BCLC 0-A(n=4);
tumor differentiation (n-4);
bilirubin (n-6);
AFP(n=10);
albumin (n ═ 9);
platelets (n ═ 5);
relapse (n ═ l).
Deletion value TCGA set: liver function score (n 87);
vascular infiltration (n ═ 32)
Tumor differentiation (n-5);
bilirubin (n-50);
AFP(n=58);
albumin (n ═ 55);
inaccurate platelet counts;
relapse (n ═ 40);
etiology, tumor size and number, satellite virus and
the latest follow-up information is not available.
Identification of immune expression patterns and unsupervised clustering
Virtual microdissection of gene expression data was performed in a training set using unsupervised non-negative matrix factorization (NMF, gene pattern module) (Brunet, et al 2004) as described previously (moffat, et al 2015), with k ═ 10 as the factor number. Immune-related expression patterns were given by integrating NMF identifiers with immune enrichment scores (Yoshihara, et al 2013) calculated by single sample gene set enrichment analysis (ssGSEA, gene pattern module). Once the immune expression pattern was characterized by NMF deconvolution and by integration with ssGSEA scores, the top-ranked genes (or canonical genes) were listed according to their load. Exemplary genes for immune expression patterns were further characterized by an original pathway analysis (IPA). These canonical genes were then unsupervised clustered using NMF identity (gene pattern module). The robustness of the obtained classes was evaluated using a conventional random forest program (Breiman 2001).
Molecular characterization of immune classes
Enrichment and gene expression signatures of molecular pathways were evaluated using GSEA, ssGSEA, and recent template prediction (NTP) analysis (gene pattern module) (Reich, et al 2006). To this end, a molecular markers database gene set and previously reported gene expression markers representing different states of inflammation or different immune cells were tested (Moffitt, et al 2015; Yoshihara, et al 2013; Cancer Genome 2015; Finkin, et al 2015; Messina, et al 2012; Quigley, et al 2010; Spranger, et al 2015; Coates, et al 2008; Bindea, et al 2013; Alistar, et al 2014; Ribas, et al 2015; Chow, et al 2016; Calon, et al 2012; Rooney, et al 2015) (FIG. 2). The previously published molecular classification of HCC was also analyzed (Chiang, et al 2008; Hoshida, et al 2009; courouam, et al 2008; Hoshida, et al 2008) (fig. 2). NTP analysis (gene pattern) was used to predict the classification of previously released HCC molecules. Genes over-expressed in the immune class versus the rest, and in the depleted versus the active immune response type, were identified by comparative marker selection (CMS, gene pattern) with FDR <0.05 and Fold Change (FC) equal to or greater than 3. Canonical genes were then characterized by David functional annotation. GSEA was used to identify the pathway enriched in each subgroup.
Immunohistochemistry and assessment of immune infiltrates and Presence of tertiary lymphoid structures
The presence of immunoinfiltrates and TLS was analyzed by a professional pathologist (S.T.). Hematoxylin and eosin (H & E) stained slides were evaluated and scored according to the amount of immunoinfiltration: 0-no immune cell infiltration, 1-minimal, 2-mild, 3-moderate, and 4-severe. Samples stained between 0 and 2 were considered low immune infiltrates, while scores 3 and 4 were classified as high immune infiltrates. The presence of TLS was also quantified on H & E slides. TLS was evaluated as a continuous variable and classified as negative (<5 lesions, 10X) or positive (greater than or equal to 5 lesions, 10X).
Immunohistochemistry for PD-1 and PD-L1 (inside and outside of the immune class) was performed in a subset of 100 patients belonging to the training cohort.
After heat-induced antigen retrieval in the microwave with 10mM TRIS-EDTA (pH 9), 3 μm thick FFPE tissue sections were immunohistochemically stained. The first antibodies used were anti-PD 1 (primary anti (Abeam), clone NAT105) and anti-PD-L1 (primary anti (Abeam), clone 28-8). The positive immunostaining of PD-1 and PD-L1 was assessed by two professional pathologists (J.P. and S.T.) who did not understand the results of the expression profiling. As previously described (Calderaro, et al 2016), a semi-quantitative measurement of positive staining was performed for PD1 (PD-1/high versus PD-1/low). In short, PD-1 was only observed in intratumoral foci of inflammatory cell clusters distributed throughout the tumor. The number of clusters was counted (20X), and if the number of clusters within the tumor was equal to or higher than the median of the clusters, the sample was classified as PD-1/high. On the other hand, PD-L1 expression was only evaluated in tumor HCC cells, since the intra-tumor inflammatory cells were largely negative.
As previously described in HCC and other cancers, the percentage of tumor cells showing membrane staining was recorded and at least 1% of tumors were classified as positive for positive cells (Calderaro, et al 2016; Robert, et al 2015; Garon, et al 2015; Borghaei, et al 2015).
Methylation profiling of immune classes
Methylation data for all patients included in the training cohort have been obtained and published elsewhere. Briefly, bisulfite converted DNA (bs-DNA) was treated with the Infinium FFPE recovery method and then hybridized on a methylated 450 chip (Infinium HumanMethylation450BeadChip) array according to the manufacturer's instructions (illinois). The resulting raw Intensity Data (IDAT) were normalized by using the enomipan (Illumina) normalization method developed under the minfi R package (v 1.12.0). After the normalization step, probes associated with the Y chromosome are removed, and those probes whose 10 bases are closer to the interrogated site contain SNPs, as noted in the product description file. In addition, CpG sites with an associated p-value greater than 0.01 were discarded for analysis. Finally, only CpG sites present in the promoter region were selected. For supervised heat map representations (depleted immune response, active immune response, rest) of three different groups analyzed, CpG sites were selected by applying ANOVA analysis to identify statistically significant CpG sites (FDR adjusted p-value <0.05) of differential methylation (Ap >0.2) between groups. Selected CpG sites were then clustered based on the manhattan distance summarized by Ward linkage.
Generation of immune classifiers and performance validation in independent datasets
Immune gene signature classifiers were generated using genes differentially expressed between HCC samples belonging to or not belonging to the immune class (FDR <0.05, FC >3) in a training set (hampstartmic cohort, n ═ 228). The ability of markers to capture immune classes was verified in our validation set (GSE20140) and 6 publicly available data sets using NTP analysis (gene profiling). This study included two patients receiving nivolumab non-indications to evaluate the ability of the immune classifier to predict response to immunotherapy. RNA extraction and RNA analysis of archivable tissue-derived tumor sections collected at any time prior to treatment (GSE93647) were performed with the patient's consent using the Affymetrix human genome U219 array plate (affifen corporation, santa clara, california). Class map (SubMap) analysis (Gene Pattern) is a bioinformatics method based on its expression profile for quantitative assessment of molecular category similarity between independent patient cohorts (Chen et al 2016) for measuring similarity between our immune subtype and the gene expression profile of melanoma patients treated with immunotherapy (Chen, et al 2016; Roh, et al 2017). In the study and subsequent papers, biopsies were obtained before the onset of CTLA-4 blockade and actual therapy, before PD-1 therapy and actual therapy in those patients who did not respond to CTLA-4 blockade and after PD-1 therapy in those patients who did not respond to PD-1 therapy. Responders were identified by visual evidence of no/stable disease or tumor volume shrinkage >6 months, while non-responders were identified by continuous CT scan of tumor growth after treatment initiation. Of the 56 patients included in this study, 32 gene expression (Custom nanodot (nano stroking) immunised group) were obtained and compared to HCC patients included in our dataset.
Correlation of immune classes with copy number aberrations, mutations and neoantigens in TCGA datasets
Copy number data generated by the gstic 2(Mermel, et al 2011) for TCGA-LIHC samples can be accessed from the Broad Institute GDAC FireBrowser. The extensive values defined for each chromosome arm, will be analyzed independently. First, each of the 190 tumor samples was examined to determine whether each arm or focal region was missing or amplified. Then, when appropriate, the Mann-Whitney test and Kruskal-Wallis test were used to compare the distribution of values between the immune classes and the rest, and between the rest and the "active immune response" and "depleted immune response" subtypes. Differences in focally High Level Amplification (HLA) or Homozygous Deletion (HD) occurring in the driver gene were then assessed as previously reported in HCC (Schulze, et al 2015). To increase the confidence of this analysis, HLA and HD thresholds have been redefined as previously described (Weir, et al 2007). In short, HLA is invoked if the log2 ratio of copy number fragments belonging to the gene border (+/-20kb) is > 0.85; whereas if the log2 ratio of the copy number fragment is < -0.74, HD is invoked, with both values corresponding to 3.6 and 1.2 copies, respectively. Figure 13 lists significant HLA and HD found by gist ic2 and related to the reported driver genes. Significant differences were assessed by two-tailed Fisher's exact test. Values of p <0.05 were considered significant. Statistical analysis was performed using R statistics software.
To analyze mutations and new antigens, the event list for each sample provided in table S4A of Rooney et al Cell 2015 was used. This data was obtained from the GDAC Firehose standard analysis pipeline. Briefly, the POLYSOLVER-based mutation detection tubing was first used to characterize HLA alleles and identify HLA mutations. Individual-specific HLA-binding peptides are then identified by the previously reported neoantigen prediction pipeline. The binding affinities of all possible 9 and 10-mer mutant peptides to the corresponding POLYSOLVER-deduced HLA alleles were predicted using NetMHCpan (v2.4) (Nielsen, et al 2007).
Statistical analysis
All analyses were performed using SPSS software version 22. Correlations between molecular categories, histological markers and clinical pathology variables were classified and continuously data analyzed by Fisher's exact test and Wilcoxon rank sum test, respectively. All markers used in this study have been reported previously (FIG. 2).
Kaplan-Meier estimation, log rank test and Cox regression modeling were performed to analyze the relationship between molecular and clinical variables and overall survival and tumor recurrence. Because of the lack of key variables (e.g., tumor size and number, satellite viruses, etc.) known to be relevant to outcome, a TCGA-focused multivariate analysis was not performed.
Example 2-identification of immunological classes of HCC
To isolate immune-related genomic signals from a large number of gene expression data in HCC tumors, NMF analysis was performed on 228 resected HCC samples (training cohort, fig. 1). Table 1 summarizes the clinical features of the training cohort. Among the different expression patterns identified by NMF, one is due to the presence of inflammatory responses and immune cells by integration with the immune enrichment scores reported previously. Analysis of top-ranked genes (called canonical genes) that define this expression pattern further confirmed immune-related function and signaling. Consistent clustering of canonical genes identified a new molecular subgroup, accounting for 24% of the cohort (55/228), referred to herein as "immune classes" (FIG. 3).
Patients belonging to the immune category showed a significant enrichment of markers identifying immune cells, i.e., T cells, cytotoxins, Tertiary Lymphoid Structures (TLS) and macrophages (p <0.001), the immunogenes, IFN gene markers predictive of pembrolizumab response in melanoma (28 genes, p <0.001) and head and neck squamous cell carcinoma (6 genes, p <0.001), and PD-1 signaling (36/55 and 19/173, p <0.001) (fig. 3A).
Class comparisons between the immune class and the remaining samples identified 112 significantly deregulated genes (immune classifier, figure 10), including 108 over-expressed immune-related genes, such as the T cell receptor component and Natural Killer (NK) cells and chemo-inducers of T cells (CCL5, CXCL9 and CXCL10, p <0.001) (figure 11) again, GSEA identified IFN α and gamma signaling, inflammatory responses (i.e., lymphocyte activation, T helper 1-cytotoxic module, NK-mediated toxicity, etc.), enrichment of TGF- β and JAK/STAT signals (FDR <0.001) (results not shown).
This revealed an enrichment of IFN-related (18/55 vs 12/173, p 0.0001) and SI (TGF- β/WNT activation) (32/55 vs 15/173, p 0.0001) classes and clearly excluded S2 (2/55 vs 46/173, p 0.0001) and CTNNB1 (8/55 vs 59/173, p <0.001, fig. 3A).
Taken together, these data indicate that an immune-related class of HCC was identified that is enriched for markers that capture the presence of immune cells, markers that respond to immune checkpoint therapy, and IFN signaling.
Example 3-immune class immunophenotype PD-1/PD-L1 SignalEnrichment of conduction
Immunophenotypic analysis was performed to further understand the immunological properties of the immune classes biologically. As predicted, patients belonging to this category had significantly higher immune cell infiltration rates (11/49 and 14/167, p 0.01, fig. 3A and 3B) and TLS densities (>5 lesions, 19/51 and 34/170, p 0.01, fig. 3A and 3C) as revealed by examination of hematoxylin and eosin stained sections.
PD-1 and PD-L1 protein expression was then assessed by immunohistochemistry in a subset of samples in the training cohort (inside and outside of the immune class, fig. 3B). Overall, PD-L1 tumor expression was observed in 16% (16/99) HCC according to recent reports. PD-1 protein expression was observed in 10% of cohorts (10/99), but no significant correlation was found between high expression of PD-1 and PD-L1, probably due to the small sample size. Nevertheless, tumors with high PD-1 (8/48 in the immune class, 2/51 in the remaining class, p ═ 0.4) and PD-L1 (12/48 in the immune class, 4/51 in the remaining class, p ═ 0.03) protein expression were significantly enriched in the immune class. For other clinical pathology variables, no differences were observed between the immune classes and the remaining cohorts (data not shown, p > 0.05).
In summary, pathological examination showed that patients belonging to the immune category showed high degree of immune infiltration, higher PD-1/PD-L1 immunohistochemical expression and presence of TLS. These data underscore the ability of the immune classifier to capture immune cell-derived molecular signals infiltrated in HCC.
Example 4-immunological classes two distinct components of the tumor microenvironment were captured: active and depleting subtypes
The immune system may exert anti-tumor and pro-tumor activities. Indeed, cross-talk between cancer cells and the tumor microenvironment triggers an immune response that favors cancer progression by providing growth factors that maintain proliferation and promote Epithelial Mesenchymal Transition (EMT), invasion, and metastasis. To further explore this concept in HCC, patients in the immune category were analyzed for immune modulation that occurs in response to the tumor microenvironment. As shown in figure 4A, 33% of the immune classes (18/55) were characterized by "activated substrates," while the remaining patients (37/55, 67%) showed a lack of such activation, as predicted by recent template prediction (NTP) analysis using previously released molecular markers to capture the activated inflammatory substrate response. Interestingly, patients with normal or inactive stroma (37/55, 67%) showed significant enrichment of T-cells and IFN markers, including adaptive immune response genes (i.e., T-cell receptor G, CD8A, IFN- γ, GZMB, etc.) and overexpression of IFN markers predictive of pembrolizumab response (p < 0.001). Thus, this cluster is referred to as an active immune response.
In contrast, the presence of activated stroma was significantly associated with T cell depletion markers (10/18 and 4/37, p <0.001) and immunosuppressive components, such as TGF- β signaling and M2 macrophages (8/18 and 1/37, p ═ 0.0003) in particular, overexpression of TGF- β -1 and-3 and enrichment of multiple markers reflecting TGF- β pathway activation were observed in this subgroup, such as late TGF- β markers (9/18 and 6/37, p ═ 0.02), Sl/TGF- β markers (16/18 and 16/18, p ═ 0.001), WNT/TGF-16/18 signaling (16/18 and 16/18, p <0.001) and fibroblasts (F-TBRS) (16/18 and 16/18, p ═ 0.02) and T cells (T23TBRS) (16/18 and 16/18, p ═ 0.03 and 16/18, p ═ tbysc) and T cells (T23TBRS) (16/18 and 16/18, p ═ 0.03 and 16/18) were further correlated with the clinical response of these T cell depletion markers, T-tbs-5, T-tbs (T-tbs) and tnf-72) and tnf-T-5 receptor activation, which were shown to be highly correlated with the clinical and the observed in the clinical and T-5-T-5, T-5, T-x-T-5, T-5, T-5, C, T-B, C, T-B, C, and tnf-B, and tnf-B, C, tnf-B.
Interestingly, patients within the active immune response cluster showed lower tumor recurrence rates after resection than the depleted immune response cluster (median time to recurrence was 32 and 21 months, p ═ 0.0, fig. 5D and 5E). A better survival trend was also observed (median survival time for active immunization was 88 months, with the remaining patients 63 months, p ═ 0.07) (fig. 5A). No differences in other clinicopathological variables (including HBV and HCV infection) were found between the different immunotypes (results not shown). Notably, the active immune subtype was retained as an independent prognostic factor for overall survival (HR 0.58, CI 0.34-0.98, p 0.04), as well as vascular infiltration, multiple nodules, platelet count, and HCV infection.
Taken together, these data separated the immune class into two distinct microenvironment-based components, a) an active immune response subtype (-65%), characterized by overexpression of the adaptive immune response gene (FIG. 4), and b) a depleted immune response subtype (-35%), characterized by the presence of immunosuppressive signals (i.e., TGF- β, M2 macrophages).
Example 5-validation of immune classes in dataset
The presence of immune classes was further assessed in 7 other datasets (n 728 HCC, fig. 1) using an immune classifier based on 112 gene expression (fig. 10). First, an immune classifier was applied to the TCGA dataset, which is the largest publicly available dataset [ n 190 Fresh Frozen (FF) samples ] analyzed by RNA sequencing ]. Similar to the training cohort, 42/190 (22%) HCC samples were successfully predicted in the immune category. Molecular characterization of the immune class demonstrated the identification of markers of immune cells (i.e., T cells, cytotoxins, TLS and macrophages, p <0.001), markers predictive of response to immune checkpoint therapy (p <0.001), and significant enrichment of PD-1 signaling (24/42 and 31/148, p <0.001) (fig. 5C). Enrichment of the IFN-associated class (13/42, remaining 11/148, p <0.001) and Sl class (28/42, remaining queue 20/148, p <0.001) was demonstrated compared to the known HCC molecule classes, significantly excluding the CTNNB1 class (2/42, remaining queue 30/148, p <0.001), as previously observed in the training cohort. In addition, half of the TCGA-immune classes showed a lack of activated matrix markers and overexpressed adaptive immune response genes, which recapitulate the active immune response subtype (fig. 5C).
On the other hand, the remaining half of patients showed activated stroma, which is associated with TGF- β signaling (11/21, 1/21 for the remaining immune classes, p ═ 0.01) and down-regulation of NKG2D and TBX21 receptors (p <0.01), which are the main features of the depleted immune response subtype correlation with clinical outcomes demonstrates better survival for the active immune response subtype patients (median survival time for the active immune cluster of 107 months, 33 months for the remaining patients, p ═ 0.03) (fig. 5B).
Next, a validation cohort [ n-131 cases of Formalin Fixed Paraffin Embedded (FFPE) HCC ] previously collected by our panel and 5 other datasets comprising 4 FF tissues tested (n-289) and 1 FFPE sample (n-118) were queried (fig. 1). The percentage of patients assigned to the immune class remained consistent across all FF data sets, with an average of 27% of samples predicted for this class (range 22-28). In both FFPE datasets (validated and HCC-V), 37% (48/131) and 30% (35/118) of patients were assigned to the immune category, respectively (results not shown). The higher percentage may be due to the use of different genomic platforms [ DASL (Illumina) and Affymetrix ] or different types of tissue material (FFPE and FF samples). However, regardless of the platform and sample type used, the molecular characteristics of the immune class and the presence of two microenvironment-based subtypes were successfully summarized in all data sets tested.
Finally, the ability of the immune class to predict response to immunotherapy was tested. The presence of an immune classifier for tumor gene expression from two HCC patients treated with nivolumab was analyzed, giving a positive result for #1 patients exhibiting a partial response (FDR ═ 0.001) and no result for #2 patients exhibiting stable disease (FDR ═ 0.23). Fig. 8.
Given that regulatory agencies have not approved checkpoint inhibitors for HCC management, gene expression profiles of the immune class were compared to that of melanoma patients responding to immunotherapy using the recently released 32-patient dataset. Subclass mapping analysis indicated that the immune class, particularly the active immune subtype, was similar to the melanoma patient population that responded to PD-1 checkpoint inhibitors. Fig. 9.
Example 6-immune classes of tumors show lower chromosomal aberration load, but expression of neoantigens or tumor mutations
No difference in load
Recent analyses linked tumor genomic characteristics to anti-tumor immunity (Le, et al 2015; Rooney, et al 2015; McGranahan, et al 2016). In particular, it has been suggested that the presence of neoantigens and overall mutational burden may drive T cell responses, while tumor aneuploidy is associated with markers of immune evasion and decreased response to immunotherapy (Roh, et al 2017; Davoli, et al 2017). To verify whether Somatic Copy Number Aberrations (SCNA) and loading of mutated neoantigens might affect local immunoinfiltration in HCC, the TCGA dataset was used. In a recent analysis, the local immunocytolytic activity of some tumors appears to be closely related to cytotoxic T cells and to interferon-stimulated chemokines that attract T cells (Rooney et al, 2015). Interestingly, in HCC patients, a close correlation between cytolytic activity scores and immune classes was observed (p <0.0001, fig. 5C). In the case of SCNA, immune category patients showed lower overall and loss burden in both overall and focal (fig. 6A and 6B), with median overall benefit (range 0-16) and 3.5 overall losses (range 0-20) for the immune category, and overall benefit (range 0-22) and 9 overall losses (range 0-26) for the remaining cohorts (p ═ 0.046 and p ═ 0.01, respectively). Similarly, a median of 5 lesion gains (ranging from 0-18) and 9 lesion losses (ranging from 0-25) were identified in the immune cohort, while 8.5 lesion gains (ranging from 0-20) and 13 lesion losses (ranging from 0-27) were identified in the remaining cohort (for comparison, p ═ 0.03). When analyzing the region associated with recurrent SCNA in patients outside the immune category (low immunoinfiltration based on immunolabeling), recurrent copy number gain for chromosome 1q and recurrent loss for chromosomes 3p, 17p and 18p were observed at the arm level. With respect to focal high level amplification and homozygous deletions, the analysis was limited to focal structural aberrations involving the driver genes previously reported in HCC (Schulze et al, 2015). Significant differences were found in the high level amplification of the locus llql3(CCND1, FGF19, etc.), which is significantly enriched in the immune class, especially in the active immune subtype. No significant differences were found for loci involved in MYC, TERT, and PTEN.
The immune class was then correlated with the total mutation rate and predicted neoantigen incidence based on previous analysis of TCGA data sets (Rooney et al, 2015). There was no association between the immune class and both features (fig. 6C and 6E). In particular, the median number of mutations in the immune class compared to the rest of the patients was 175 to 212, respectively (p ═ 0.1, fig. 6E). Similarly, there was no statistical difference in neoantigen incidence between the two groups (21 and 23, respectively, p ═ 0.28, fig. 6C). Nevertheless, when both parameters were analyzed according to microenvironment-based subtypes, the active immune subtypes showed a trend towards lower neoepitope incidence (median 18, depleted queue 33, remaining queues 23, p 0.20, fig. 6D) and mutations (median 140, depleted subtype 269, remaining queues 212, p 0.06, fig. 6F).
Finally, the immune class is associated with mutations in known driver genes. Except for the mutations in CTNNB1 pathway (12/42 and 81/148, p ═ 0.003), other mutations showed no differential distribution (fig. 6G).
All these data indicate no correlation between neoantigen burden and T cell response, suggesting that other mechanisms (e.g. aneuploidy and mutations of specific oncogenic pathways) may impair immune cell recruitment in highly immunogenic tumors.
Example 7 immunological classes with unique DNA methylation signatures
Given the apparent up-regulation of immune-related genes in the immune class, it was considered whether this disorder could reflect epigenetic changes in these tumors. Supervised analysis of genome-wide methylation data showed that 363 CpG sites in the 192 immune response gene promoters in the immune class were differentially methylated compared to the remaining cohort (FDR <0.05, fig. 6H). In addition, of the 192 genes showing differentially methylated CpG sites, 115 were significantly associated with gene expression.
In particular, the immunosuppressive molecule LGALS3, which may play a role in immune escape during tumor progression by inducing apoptosis of cancer-infiltrating T cells (Fukimori et al, 2003) and the TGF- β signaling regulator PMEPA1 were significantly overexpressed in 2 immunosubtypes (p <0.001, fig. 6I).
Collectively, these data indicate that the immune classes are characterized by unique methylation profiles. In particular, differential methylation was observed in 192 immune-related genes and was associated with changes in gene expression in most cases.
Example 8-specific oncogenic Signaling pathways may act synergistically to reduce T cells in the CTNNB1 class of HCCs
Cellular infiltration
Integration of the immune classes with the previously reported molecular classification revealed that the CTNNB1 class of HCC was clearly excluded from the whole set of test data (fig. 3A and 5C) the overexpression of liver-associated Wnt target genes, enrichment of nuclear β -catenin (β -catenin) staining and the exclusion of CTNNB1 mutations (Chiang et al, 2008) the CTNNB1 class supported recent reports in melanoma, wherein activation of this pathway was associated with T cell exclusion by inhibition of CCL4 and subsequent T cell priming failure (Spranger et al, 2015) in the cohort, HCC samples of CTNNB1 class showed significantly lower enrichment scores for several immune markers (especially T cells) compared to the immune class patients or the rest of patients (p <0.001, fig. 6 nnj and 6K) in addition, depending on melanoma data, patients of CCL4 class showed down-regulation (p <0.001, ng) of CCL4 patients (p <0.001, further) and the synergistic effect of this pathway was suggested in the T cell rejection (p 3, p 3. cnk 3, 8) and p 3. cnk 3, which are also shown to be the synergistic effects in the T cell rejection (p 3, p 3.
These data indicate that HCC samples in the CTNNB1 category showed lower immune marker expression compared to the immune category and the rest of the tumor patients. Activation of specific oncogenic signaling, such as CTNNB1 and PTK2 signaling, by activating mutations or other mechanisms may play an important role in affecting the immunological characteristics of this subpopulation.
Example 9-compartmentalization of immune signals: immune infiltration in surrounding tissues does not reflect its tumor counterpart
Finally, to assess whether the type of immune cell infiltration within the tumor reflects its peritumoral counterpart, the intratumoral immune infiltration is associated with peripheral liver tissue, for which 167 training cohorts of patients were sub-analyzed, and the gene expression data of their tumors and matching peripheral non-tumoral tissues were available, in 167 cases 25% (42/167) were positively classified into the immune category (fig. 7A) according to the expression profile of the tumor, interestingly, only a few of these patients (13/42, 31%) showed a positive predictive combination in both the tumor and the matching peripheral liver, indicating that the intratumoral immune infiltration could not reflect the situation of the peripheral tissues, in view of these observations, the types of immune infiltration occurring in the non-tumoral liver were further explored, interestingly, patients who were predicted positive by the immune classifier according to the situation of the peripheral tissues showed captured immune cells (CD8, macrophages, p <0.001), activated stroma [31/57 (54%) and captured immune cells, (6%), p 0.3542- β) were also considered as positive with the remaining immune markers < 19%, 7% after the clinical trial (p 5) and the remaining immune classifier, 7 h, 3 h, 7 h, 3 h, 7 h, 3 h, 5 h, p 3.
Essentially, these data indicate that the immune characteristics of the peripheral liver tumors do not reflect intratumoral characteristics, the main characteristic of which is an immunosuppressive component associated with the survival of HCC patients.
Example 10 identification of immunological classes 56 Gene classifiers
The original 112-gene immune classifier (fig. 10) has successfully been reduced to 56 genes, selecting those with the highest scores (table 3). The 56-gene immune classifier was tested for predictive power and compared to the original 112-gene immune classifier in 3 data sets: TGCA (190 samples n, fig. 14A), validation queue (132, fig. 14B) and HCC-I dataset (90, fig. 14C).
As shown below, the immunoslassifier for 56 genes had a sensitivity of 97% (ranging from 95 to 100% when analyzed in 3 cohorts, respectively), a specificity of 98% (ranging from 96 to 99% when analyzed in 3 cohorts, respectively) and an accuracy of 97% (ranging from 96 to 98% when analyzed in 3 cohorts, respectively) (table 2).
In addition, Receiver Operating Characteristic (ROC) curves for the 56-gene immune classifier were also calculated in all patients from the 3 cohorts (n 411, fig. 15). ROC curves are useful methods to explain the level of sensitivity and specificity. The ROC curve is a generalization of the set of potential combinations of sensitivity and specificity possible for the predictor variables and provides a natural universal scale for comparing different predictor variables in the case of the original 112-gene immune classifier and the reduced 56-gene immune classifier. AUC values near 1 indicate that the screening metric reliably distinguishes patients performing satisfactorily. For the 56 gene immune classifier, the area under the curve was 0.971 when tested in all patients (fig. 15).
Table 2: sensitivity, specificity, positive predictive value, negative predictive value and accuracy of 56-gene immune classifier
| Statistics in all 3 queues | Numerical value | 95%CI |
| Sensitivity of the reaction | 97% | 91.41 to 99.05 percent |
| Specificity of | 98% | 95.20 to 99.05 percent |
| Positive predictive value | 94% | 88.49-97.08% |
| Negative predictive value | 99% | 96.51 to 99.48 percent |
| Accuracy of | 97% | 95.28% to 98.66 |
| Statistical data, TCGA cohort (190 ═ n) | Numerical value | 95%CI |
| Sensitivity of the reaction | 95% | 83.84 to 99.42 percent |
| Specificity of | 99% | 95.20 to 99.84 percent |
| Positive predictive value | 95% | 83.45 to 98.76 percent |
| Negative predictive value | 99% | 94.97 to 99.65 percent |
| Accuracy of | 98% | 94.70 to 99.42 percent |
| Statistics, validation queue (n as 132) | Numerical value | 95%CI |
| Sensitivity of the |
100% | 92.60 to 100.00 percent |
| Specificity of | 96% | 89.80 to 99.25 percent |
| Positive predictive value | 94% | 84.05 to 97.98 percent |
| Negative |
100% | |
| Accuracy of | 98% | 93.45 to 99.53 percent |
| Statistics, HCC-1 queue (n ═ 90) | Numerical value | 95%CI |
| Sensitivity of the reaction | 92% | 73.00 to 98.97 percent |
| Specificity of | 97% | 89.48 to 99.63 percent |
| Positive predictive value | 92% | 73.65 to 97.74 percent |
| Negative predictive value | 97% | 89.46-99.18% |
| Accuracy of | 96% | 89.01 to 98.78 percent |
Table 3: 56-gene immune classifier


Reference to the literature
Alistar,et al.(2014)Genome Med 6:80.
Bald,et al.(2014)Cancer Discov 4:674-87.
Balli,et al.(2016)Clin Cancer Res 23(12):3129-38.
Bindea,et al.(2013)Immunity 39:782-95.
Borghaei,et al.(2015 N Engl J Med 373:1627-39.
Boyault,et al.(2007)Hepatology 45:42-52.
Brunnstrom et al.(2017)Modern Pathology 30(10):1411-21.
Breiman(2001)Machine Learning,45(1):5-32.
Brunet,et al.(2004)Proc Natl Acad Sci US A 101:4164-9.
Calderaro,et al.(2016)Hepatology 64:2038-2046.
Calon,et al.(2012)Cancer Cell 22:571-84.
Cancer Genome Atlas N.Genomic Classification of Cutaneous Melanoma.(2015)Cell161:1681-96.
Charoentong,et al.(2017)Cell Rep 18:248-262.
Chen,et al.(2016)Cancer Discov 6:827-37.
Chen,et al.(2002)Mol Biol Cell 13:1929-39.
Chiang,et al.(2008)Cancer Res 68:6779-88.
Chow,et al.(2016)J Clin Oncol 34,(suppl;abstr 6010).
Coates,et al.(2008)Cancer Res 68:450-6.
Coulouar,et al.(2008)Hepatology 47:2059-67.
Davoli,et al.(2017)Science 355(6322).
Deng et al.(2014)J.Clin.Invest.124(2):687-695
El-Khoueiry,et al.(2017)Lancet 389:2492-2502.
Finkin,et al.(2015)Nat Immunol 16:1235-44.
Flavell,et al.(2010)Nat Rev Immunol 10:554-67.
Fukumori,et al.(2003)Cancer Res 63:8302-11.
Garon,et al.(2015)N Engl J Med 372:2018-28.
Hanahan and Weinberg(2011)Cell 144:646-74.
Herbst,et al.(2016)Lancet 387:1540-50.
Hoshida,et al.(2009)Cancer Res 69:7385-92.
Hoshida,et al.(2008)N Engl J Med 359:1995-2004.
Hoshida,et al.(2007)PLoS One 2:e1195.
Hoshida,et al.(2013)Gastroenterology 144(5):1024-30.
Iizuka,et al.(2003)Lancet 361:923-9.
Ji,et al.(2012)Cancer Immunol Immunother 61:1019-31.
Jiang,et al.(2016)Nat Med 22:851-60.
Khalil,et al.(2016)Nat Rev Clin Oncol 13:394.
Lachenmayer,et al.(2012)Clin Cancer Res 18:4997-5007.
Le,et al.(2015)N Engl J Med 372:2509-20.
Lee,et al.(2004)Nat Genet 36:1306-11.
Llovet,et al.(2008)N Engl J Med 359:378-90.
Llovet,et al.(2015)Nat Rev Clin Oncol 12:408-24.
Llovet,et al.(2016)Nat Rev Dis Primers 2:16018.
McGranahan,et al.(2016)Science 351:1463-9.
Mermel,et al.(2011)Genome Biol 12:R41.
Messina,et al.(2012)Sci Rep 2:765.
Moffitt,et al.(2015)Nat Genet 47:1168-78.
Murray,et al.(2012)Lancet 380:2197-223.
Nielsen,et al.(2007)PLoS One 2:e796.
Park,et al.(2016)Cancer Discov 6:1366-81.
Peng,et al.(2016)Cancer Discov 6:202-16.
Porta-Pardo and Godzik(2016)Cancer Immunol Res 4:789-98.
Powles,et al.(2014)Nature 515:558-62.
Quigley,et al.(2010)Nat Med 16:1147-51.
Rajasagi,et al.(2014)Blood 124:453-62.
Reich,et al.(2006)Nat Genet 38:500-1.
Ribas,et al.(2015)J Clin Oncol 33,(suppl;abstr 3001).
Robert,et al.(2015)N Engl J Med 372:2521-32.
Roh,et al.(2017)Sci Transl Med 9.
Rooney,et al.(2015)Cell 60:48-61.
Schulze,et al.(2015)Nat Genet 47:505-11.
Slavuljica,et al.(2011)Front Immunol 2:85.
Spranger,et al.(2015)Nature 523:231-5.
Stephen,et al.(2014)Immunity 41:427-39.
Topalian,et al.(2012)N Engl J Med 366:2443-54.
Viel,et al.(2016)Sci Signal 9:ra 19.
Villanueva,et al.(2015)Hepatology 61:1945-56.
Villanueva,et al.(2011)Gastroenterology 140:1501-12 e2.
Wang et al.2016 OncoTargets and Therapy 9:5023-39
Weir,et al.(2007)Nature 450:893-8.
Yoshihara,et al.(2013)Nat Commun 4:2612.
Zou et al.(2016)Sci Transl.Med 8:328rv4.
Zucman-Rossi,et al.(2015)Gastroenterology 149:1226-1239 e4.
Claims (38)
1. A method for detecting a phenotype responsive to immunotherapy in a subject diagnosed with hepatocellular carcinoma, comprising:
a. analyzing gene expression levels of one or more genes in table 3 in a sample from a subject with hepatocellular carcinoma to obtain a test expression profile;
b. comparing the test expression profile of the gene to a reference expression profile, wherein the reference expression profile comprises a reference expression level of the same gene in a sample from a control group; and
c. detecting that the gene expression level of one or more genes in the test expression profile is the same as compared to the expression level of the same gene in the reference expression profile indicative of an immunotherapy-responsive phenotype, and further detecting that the subject is responsive to immunotherapy.
2. The method of claim 1, wherein the subject has recently been diagnosed with hepatocellular carcinoma (HCC).
3. The method of claim 1, wherein the sample is from a hepatocellular carcinoma tumor.
4. The method of claim 1, wherein the control group is a subject with hepatocellular carcinoma who responded well to immunotherapy.
5. The method of claim 1, wherein the control group is a subject with another cancer who responds well to immunotherapy.
6. The method of claim 5, wherein the cancer is lung cancer or melanoma.
7. A method of treating a subject having hepatocellular carcinoma, comprising:
a. analyzing gene expression levels of one or more genes in table 3 in a sample from a subject with hepatocellular carcinoma to obtain a test expression profile;
b. comparing the test expression profile of the gene to a reference expression profile, wherein the reference expression profile comprises a reference expression level of the same gene in a sample from a control group;
c. detecting that the gene expression level of one or more genes in the test expression profile is the same as compared to the expression level of the same gene in the reference expression profile that is indicative of an immunotherapy-responsive phenotype; and
d. treating a subject with the immunotherapy.
8. The method of claim 7, wherein the subject has recently been diagnosed with hepatocellular carcinoma (HCC).
9. The method of claim 7, wherein the sample is from a hepatocellular carcinoma tumor.
10. The method of claim 7, wherein the control group is a subject with hepatocellular carcinoma who responded well to immunotherapy.
11. The method of claim 7, wherein the control group is a subject with another cancer who responds well to immunotherapy.
12. The method of claim 11, wherein the cancer is lung cancer or melanoma.
13. The method of claim 7, wherein the immunotherapy is selected from the group consisting of monoclonal antibodies against cytotoxic T-lymphocyte protein (CTLA-4) (e.g., ipilimumab), programmed cell death protein 1(PD-1) (e.g., nivolumab and pembrolizumab) and its ligand PD-L1 (e.g., atlizumab), and combinations thereof.
14. A method of treating a subject having hepatocellular carcinoma, comprising
a. Analyzing gene expression levels of one or more genes in table 3 in a sample from a subject with hepatocellular carcinoma to obtain a first test expression profile;
b. comparing a first test expression profile of one or more genes in table 3 to a first reference expression profile, wherein the first reference expression profile comprises reference expression levels of the same genes in a sample from a control group;
c. detecting that the gene expression level of one or more genes in the first test expression profile is the same as compared to the expression level of the same gene in the first reference expression profile indicative of an immunotherapy-responsive phenotype, and further detecting that the subject is responsive to immunotherapy;
d. analyzing gene expression levels of one or more genes in fig. 12 in a sample from a subject with hepatocellular carcinoma to obtain a second test expression profile;
e. comparing the second test expression profile of one or more gene pathways in figure 12 to a second reference expression profile, wherein the second expression profile comprises reference expression levels of the same genes in a sample from a control group;
f. detecting that the gene expression level of one or more genes in the first test expression profile is the same as compared to the expression level of the same gene in a second reference expression profile indicative of a depleted immune response category; and
g. treating the subject with an immunotherapy in combination with a second agent.
15. The method of claim 14, wherein the subject has recently been diagnosed with hepatocellular carcinoma (HCC).
16. The method of claim 14, wherein the sample is from a hepatocellular carcinoma tumor.
17. The method of claim 14, wherein the control group is a subject with hepatocellular carcinoma who responded well to immunotherapy.
18. The method of claim 14, wherein the control is a subject with another cancer who responds well to immunotherapy.
19. The method of claim 18, wherein the cancer is lung cancer or melanoma.
20. The method of claim 14, wherein the immunotherapy is selected from the group consisting of monoclonal antibodies directed against cytotoxic T-lymphocyte protein (CTLA-4), programmed cell death protein 1(PD-1), and its ligand PD-L1, and combinations thereof.
21. The method of claim 14, wherein the genes added in step (f) are selected from the group consisting of TGF- β and genes from the CTNNB1 signaling pathway.
22. The method of claim 14, wherein the second agent is selected from the group consisting of a TGF- β inhibitor and a CTNNB1 signaling pathway inhibitor.
23. The method of claim 14, wherein a gene from the CTNNB1 signaling pathway is selected from the group consisting of CCL4, PTK2, and combinations thereof.
24. The method of claim 14, wherein the second agent is a chemotherapeutic agent or radiation.
25. A method of treating a subject having hepatocellular carcinoma (HCC), comprising
a. Analyzing gene expression levels of one or more genes in table 3 in a sample from a subject with hepatocellular carcinoma to obtain a first test expression profile;
b. comparing a first test expression profile of one or more genes in table 3 to a first reference expression profile, wherein the first reference expression profile comprises a reference expression level of the same gene in a sample from a control group;
c. detecting that the gene expression level of one or more genes in the test expression profile is the same as compared to the expression level of the same gene in the reference expression profile indicative of an immunotherapy-responsive phenotype, and further detecting that the subject is responsive to immunotherapy;
d. analyzing the gene expression level of one or more genes selected from the group consisting of PMEPA1, LGALS1, LGALS3, TGF- β, genes from the CTNNB1 signaling pathway, and combinations thereof in a sample from a subject with hepatocellular carcinoma to obtain a second test expression profile;
e. comparing a second test expression profile of one or more genes selected from the group consisting of PMEPA1, LGALS1, LGALS3, TGF- β, a gene from the CTNNB1 signaling pathway, and combinations thereof to a second reference expression profile, wherein the second expression profile comprises a reference expression level of the same gene in a sample from a control group;
f. detecting that the gene expression level of one or more genes in the second test expression profile is the same as compared to the expression level of the same genes in the second reference expression profile indicative of a depleted immune response phenotype; and
g. treating the subject with an immunotherapy in combination with a second agent.
26. The method of claim 25, wherein the subject has recently been diagnosed with hepatocellular carcinoma (HCC).
27. The method of claim 25, wherein the sample is from a hepatocellular carcinoma tumor.
28. The method of claim 25, wherein the control group is a subject with hepatocellular carcinoma who responded well to immunotherapy.
29. The method of claim 25, wherein the control is a subject with another cancer who responds well to immunotherapy.
30. The method of claim 29, wherein the cancer is lung cancer or melanoma.
31. The method of claim 25, wherein the immunotherapy is selected from the group consisting of monoclonal antibodies directed against cytotoxic T-lymphocyte protein (CTLA-4), programmed cell death protein 1(PD-1), and its ligand PD-L1, and combinations thereof.
32. The method of claim 25, wherein the genes added in step (f) are selected from the group consisting of TGF- β and genes from the CTNNB1 signaling pathway.
33. The method of claim 25, wherein the second agent is selected from the group consisting of a TGF- β inhibitor and a CTNNB1 signaling pathway inhibitor.
34. The method of claim 25, wherein a gene from the CTNNB1 signaling pathway is selected from the group consisting of CCL4, PTK2, and combinations thereof.
35. The method of claim 25, wherein the second agent is a chemotherapeutic agent or radiation.
36. A kit for detecting a phenotype responsive to immunotherapy in a subject diagnosed with hepatocellular carcinoma, comprising probes for one or more of the genes listed in table 3, reagents for isolating and purifying nucleic acids from biological tissues or body fluids, reagents for performing assays on the isolated and purified nucleic acids, instructions for use and a reference value or a method of obtaining a reference value for a gene contained in a control sample.
37. The kit of claim 36, further comprising probes for one or more of the genes listed in figure 12.
38. The kit of claim 37, wherein the probes are attached to the solid state in a microarray format.
Applications Claiming Priority (5)
| Application Number | Priority Date | Filing Date | Title |
|---|---|---|---|
| US201762519711P | 2017-06-14 | 2017-06-14 | |
| US62/519,711 | 2017-06-14 | ||
| US201862629231P | 2018-02-12 | 2018-02-12 | |
| US62/629,231 | 2018-02-12 | ||
| PCT/US2018/037579 WO2018232142A1 (en) | 2017-06-14 | 2018-06-14 | Methods for the detection and treatment of classes of hepatocellular carcinoma responsive to immunotherapy |
Publications (1)
| Publication Number | Publication Date |
|---|---|
| CN111164103A true CN111164103A (en) | 2020-05-15 |
Family
ID=64660235
Family Applications (1)
| Application Number | Title | Priority Date | Filing Date |
|---|---|---|---|
| CN201880052676.1A Pending CN111164103A (en) | 2017-06-14 | 2018-06-14 | Methods for detecting and treating classes of hepatocellular carcinoma responsive to immunotherapy |
Country Status (5)
| Country | Link |
|---|---|
| US (1) | US11473150B2 (en) |
| EP (1) | EP3638695A4 (en) |
| JP (1) | JP2020523022A (en) |
| CN (1) | CN111164103A (en) |
| WO (1) | WO2018232142A1 (en) |
Cited By (3)
| Publication number | Priority date | Publication date | Assignee | Title |
|---|---|---|---|---|
| CN112530581A (en) * | 2020-12-03 | 2021-03-19 | 安徽医科大学第一附属医院 | Immune molecule classification system for prostate cancer patients and application thereof |
| CN112735521A (en) * | 2021-01-22 | 2021-04-30 | 安徽医科大学第一附属医院 | Guidance selection of bladder cancer immune classification system suitable for anti-PD-1/PD-L1 immunotherapy patients |
| CN113380318A (en) * | 2021-06-07 | 2021-09-10 | 天津金域医学检验实验室有限公司 | Artificial intelligence assisted flow cytometry 40CD immunophenotyping detection method and system |
Families Citing this family (6)
| Publication number | Priority date | Publication date | Assignee | Title |
|---|---|---|---|---|
| US20220112564A1 (en) * | 2019-02-14 | 2022-04-14 | Merck Sharp & Dohme Corp. | Gene expression based biomarker of tumor response to pd-1 antagonists |
| US20210174908A1 (en) * | 2019-11-07 | 2021-06-10 | Oncxerna Therapeutics, Inc. | Classification of tumor microenvironments |
| EP3868897A1 (en) * | 2020-02-20 | 2021-08-25 | Worldwide Innovative Network | Method for improving the treatment with immune checkpoint blockade therapy |
| CN113215253B (en) * | 2020-06-05 | 2022-10-25 | 冠科生物技术(苏州)有限公司 | Methods and compositions for assessing immune responses in murine tumor models |
| CN117275733A (en) * | 2023-11-17 | 2023-12-22 | 中日友好医院(中日友好临床医学研究所) | Method and device for predicting tumor immune state and treatment response based on image histology |
| CN118098378B (en) * | 2024-04-28 | 2024-07-19 | 浙江大学医学院附属邵逸夫医院 | Gene model construction method for identifying new subtype of liver cell liver cancer and application |
Citations (3)
| Publication number | Priority date | Publication date | Assignee | Title |
|---|---|---|---|---|
| US20110124521A1 (en) * | 2008-06-11 | 2011-05-26 | The Ohio State University | Use of MiR-26 Family as a Predictive Marker for Hepatocellular Carcinoma and Responsiveness to Therapy |
| US20140017227A1 (en) * | 2011-01-14 | 2014-01-16 | Suk Peng Chew | Gene signatures for use with hepatocellular carcinoma |
| US20150297310A1 (en) * | 2014-04-17 | 2015-10-22 | Georgia Regents Research Institute, Inc. | Methods for selecting a treatment for cancer |
Family Cites Families (5)
| Publication number | Priority date | Publication date | Assignee | Title |
|---|---|---|---|---|
| WO2008045505A2 (en) | 2006-10-10 | 2008-04-17 | Xenomics, Inc. | Compositions, methods and kits for isolating nucleic acids from body fluids using anion exchange media |
| WO2009055480A2 (en) * | 2007-10-22 | 2009-04-30 | The United States Of America, As Represented By The Secretary, Department Of Health And Human Services | Tgf-beta gene expression signature in cancer prognosis |
| WO2014009535A2 (en) * | 2012-07-12 | 2014-01-16 | INSERM (Institut National de la Santé et de la Recherche Médicale) | Methods for predicting the survival time and treatment responsiveness of a patient suffering from a solid cancer with a signature of at least 7 genes |
| GB201501017D0 (en) * | 2014-12-23 | 2015-03-04 | Immatics Biotechnologies Gmbh | Novel peptides and combination of peptides for use in immunotherapy against hepatocellular carcinoma (HCC) and other cancers |
| EP3240908A2 (en) | 2014-12-30 | 2017-11-08 | F. Hoffmann-La Roche AG | Methods and compositions for prognosis and treatment of cancers |
-
2018
- 2018-06-14 WO PCT/US2018/037579 patent/WO2018232142A1/en unknown
- 2018-06-14 EP EP18816865.2A patent/EP3638695A4/en not_active Withdrawn
- 2018-06-14 CN CN201880052676.1A patent/CN111164103A/en active Pending
- 2018-06-14 JP JP2019568654A patent/JP2020523022A/en active Pending
- 2018-06-14 US US16/621,983 patent/US11473150B2/en active Active
Patent Citations (3)
| Publication number | Priority date | Publication date | Assignee | Title |
|---|---|---|---|---|
| US20110124521A1 (en) * | 2008-06-11 | 2011-05-26 | The Ohio State University | Use of MiR-26 Family as a Predictive Marker for Hepatocellular Carcinoma and Responsiveness to Therapy |
| US20140017227A1 (en) * | 2011-01-14 | 2014-01-16 | Suk Peng Chew | Gene signatures for use with hepatocellular carcinoma |
| US20150297310A1 (en) * | 2014-04-17 | 2015-10-22 | Georgia Regents Research Institute, Inc. | Methods for selecting a treatment for cancer |
Non-Patent Citations (1)
| Title |
|---|
| 曲建慧等: "肝细胞癌免疫治疗的现状与挑战", 《传染病信息》 * |
Cited By (5)
| Publication number | Priority date | Publication date | Assignee | Title |
|---|---|---|---|---|
| CN112530581A (en) * | 2020-12-03 | 2021-03-19 | 安徽医科大学第一附属医院 | Immune molecule classification system for prostate cancer patients and application thereof |
| CN112530581B (en) * | 2020-12-03 | 2023-11-21 | 安徽医科大学第一附属医院 | Immune molecule classification system for prostate cancer patients and application thereof |
| CN112735521A (en) * | 2021-01-22 | 2021-04-30 | 安徽医科大学第一附属医院 | Guidance selection of bladder cancer immune classification system suitable for anti-PD-1/PD-L1 immunotherapy patients |
| CN112735521B (en) * | 2021-01-22 | 2023-09-22 | 安徽医科大学第一附属医院 | Guiding selection of bladder cancer immune classification system suitable for anti-PD-1/PD-L1 immunotherapy patients |
| CN113380318A (en) * | 2021-06-07 | 2021-09-10 | 天津金域医学检验实验室有限公司 | Artificial intelligence assisted flow cytometry 40CD immunophenotyping detection method and system |
Also Published As
| Publication number | Publication date |
|---|---|
| WO2018232142A1 (en) | 2018-12-20 |
| US20210277480A1 (en) | 2021-09-09 |
| JP2020523022A (en) | 2020-08-06 |
| EP3638695A4 (en) | 2021-06-30 |
| US11473150B2 (en) | 2022-10-18 |
| EP3638695A1 (en) | 2020-04-22 |
Similar Documents
| Publication | Publication Date | Title |
|---|---|---|
| US11473150B2 (en) | Methods for the detection and treatment of classes of hepatocellular carcinoma responsive to immunotherapy | |
| JP7241353B2 (en) | Methods for Subtyping Lung Adenocarcinoma | |
| Ascierto et al. | Transcriptional mechanisms of resistance to anti–PD-1 therapy | |
| EP1934377B1 (en) | Methods for identifying biomarkers useful in diagnosis of biological states | |
| JP6067686B2 (en) | Molecular diagnostic tests for cancer | |
| CN109777872B (en) | T cell subsets in lung cancer and genes characteristic thereof | |
| US20170275705A1 (en) | Biomarkers useful for determining response to pd-1 blockade therapy | |
| US20170073763A1 (en) | Methods and Compositions for Assessing Patients with Non-small Cell Lung Cancer | |
| CN113694193A (en) | Checkpoint blockade and microsatellite instability | |
| JP2015536667A (en) | Molecular diagnostic tests for cancer | |
| US20110071032A1 (en) | Novel tumor marker determination | |
| US20160259883A1 (en) | Sense-antisense gene pairs for patient stratification, prognosis, and therapeutic biomarkers identification | |
| WO2013172926A1 (en) | Immune biomarkers and assays predictive of clinical response to immunotherapy for cancer | |
| WO2013082440A2 (en) | Methods of treating breast cancer with taxane therapy | |
| WO2014022826A2 (en) | Biomarker associated with risk of melanoma reoccurrence | |
| Saleh et al. | Differential gene expression of tumor-infiltrating CD8+ T cells in advanced versus early-stage colorectal cancer and identification of a gene signature of poor prognosis | |
| Mitra et al. | Spatially resolved analyses link genomic and immune diversity and reveal unfavorable neutrophil activation in melanoma | |
| WO2015120069A1 (en) | Methods and kits for the diagnosis and treatment of pancreatic cancer | |
| Zhao et al. | Glucoside xylosyltransferase 2 as a diagnostic and prognostic marker in gastric cancer via comprehensive analysis | |
| Blanco-Heredia et al. | Converging and evolving immuno-genomic routes toward immune escape in breast cancer | |
| JP2024526977A (en) | Biomarkers for treatment response after immunotherapy | |
| KR20210052709A (en) | CXCL13 marker predictive of responsiveness to immunotherapy in a patient with lung cancer and use thereof | |
| WO2014086765A2 (en) | Organized immune response in cancer | |
| US20200263254A1 (en) | Method for determining the response of a malignant disease to an immunotherapy | |
| US20110183859A1 (en) | Inflammatory genes and microrna-21 as biomarkers for colon cancer prognosis |
Legal Events
| Date | Code | Title | Description |
|---|---|---|---|
| PB01 | Publication | ||
| PB01 | Publication | ||
| SE01 | Entry into force of request for substantive examination | ||
| SE01 | Entry into force of request for substantive examination | ||
| REG | Reference to a national code |
Ref country code: HK Ref legal event code: DE Ref document number: 40031046 Country of ref document: HK |
|
| WD01 | Invention patent application deemed withdrawn after publication |
Application publication date: 20200515 |
|
| WD01 | Invention patent application deemed withdrawn after publication |