CN110662962B - System and method for sensing and predicting maturity of source rock - Google Patents
System and method for sensing and predicting maturity of source rock Download PDFInfo
- Publication number
- CN110662962B CN110662962B CN201880032114.0A CN201880032114A CN110662962B CN 110662962 B CN110662962 B CN 110662962B CN 201880032114 A CN201880032114 A CN 201880032114A CN 110662962 B CN110662962 B CN 110662962B
- Authority
- CN
- China
- Prior art keywords
- data
- sample
- source rock
- source
- maturity
- Prior art date
- Legal status (The legal status is an assumption and is not a legal conclusion. Google has not performed a legal analysis and makes no representation as to the accuracy of the status listed.)
- Expired - Fee Related
Links
- 239000011435 rock Substances 0.000 title claims abstract description 374
- 238000000034 method Methods 0.000 title claims abstract description 120
- 150000002430 hydrocarbons Chemical class 0.000 claims abstract description 70
- 229930195733 hydrocarbon Natural products 0.000 claims abstract description 69
- 239000004215 Carbon black (E152) Substances 0.000 claims abstract description 49
- 238000010801 machine learning Methods 0.000 claims abstract description 15
- 238000005259 measurement Methods 0.000 claims description 119
- 230000003595 spectral effect Effects 0.000 claims description 86
- 239000012074 organic phase Substances 0.000 claims description 47
- 238000005033 Fourier transform infrared spectroscopy Methods 0.000 claims description 35
- 230000003287 optical effect Effects 0.000 claims description 33
- 239000000203 mixture Substances 0.000 claims description 30
- 238000007405 data analysis Methods 0.000 claims description 25
- 238000009826 distribution Methods 0.000 claims description 25
- 238000011065 in-situ storage Methods 0.000 claims description 23
- 238000004422 calculation algorithm Methods 0.000 claims description 22
- 238000000804 electron spin resonance spectroscopy Methods 0.000 claims description 19
- 238000005102 attenuated total reflection Methods 0.000 claims description 16
- 238000004611 spectroscopical analysis Methods 0.000 claims description 12
- 238000005553 drilling Methods 0.000 claims description 11
- 238000000197 pyrolysis Methods 0.000 claims description 11
- 230000004044 response Effects 0.000 claims description 11
- 238000004891 communication Methods 0.000 claims description 9
- 230000003044 adaptive effect Effects 0.000 claims description 8
- 238000012937 correction Methods 0.000 claims description 7
- 238000000870 ultraviolet spectroscopy Methods 0.000 claims description 7
- 238000013450 outlier detection Methods 0.000 claims description 6
- 238000010606 normalization Methods 0.000 claims description 5
- 230000035945 sensitivity Effects 0.000 claims description 5
- 238000012706 support-vector machine Methods 0.000 claims description 5
- 238000007477 logistic regression Methods 0.000 claims description 2
- 239000000523 sample Substances 0.000 description 204
- 239000012530 fluid Substances 0.000 description 36
- 239000007789 gas Substances 0.000 description 35
- 238000001157 Fourier transform infrared spectrum Methods 0.000 description 28
- 238000004458 analytical method Methods 0.000 description 27
- 238000001228 spectrum Methods 0.000 description 27
- 239000003921 oil Substances 0.000 description 25
- 239000004927 clay Substances 0.000 description 21
- 230000008569 process Effects 0.000 description 20
- 229910052500 inorganic mineral Inorganic materials 0.000 description 19
- 239000011707 mineral Substances 0.000 description 19
- 238000010586 diagram Methods 0.000 description 16
- 238000004519 manufacturing process Methods 0.000 description 16
- 239000004079 vitrinite Substances 0.000 description 13
- 238000002290 gas chromatography-mass spectrometry Methods 0.000 description 12
- 229910052739 hydrogen Inorganic materials 0.000 description 12
- 239000001257 hydrogen Substances 0.000 description 12
- 238000012545 processing Methods 0.000 description 12
- 238000010521 absorption reaction Methods 0.000 description 11
- 229910052799 carbon Inorganic materials 0.000 description 11
- 239000000463 material Substances 0.000 description 11
- UFHFLCQGNIYNRP-UHFFFAOYSA-N Hydrogen Chemical compound [H][H] UFHFLCQGNIYNRP-UHFFFAOYSA-N 0.000 description 10
- 238000005070 sampling Methods 0.000 description 10
- GUJOJGAPFQRJSV-UHFFFAOYSA-N dialuminum;dioxosilane;oxygen(2-);hydrate Chemical compound O.[O-2].[O-2].[O-2].[Al+3].[Al+3].O=[Si]=O.O=[Si]=O.O=[Si]=O.O=[Si]=O GUJOJGAPFQRJSV-UHFFFAOYSA-N 0.000 description 9
- 238000000605 extraction Methods 0.000 description 8
- 230000006870 function Effects 0.000 description 8
- 230000005484 gravity Effects 0.000 description 8
- NLYAJNPCOHFWQQ-UHFFFAOYSA-N kaolin Chemical compound O.O.O=[Al]O[Si](=O)O[Si](=O)O[Al]=O NLYAJNPCOHFWQQ-UHFFFAOYSA-N 0.000 description 8
- 229910052760 oxygen Inorganic materials 0.000 description 8
- 239000000843 powder Substances 0.000 description 8
- OKTJSMMVPCPJKN-UHFFFAOYSA-N Carbon Chemical compound [C] OKTJSMMVPCPJKN-UHFFFAOYSA-N 0.000 description 7
- 239000010426 asphalt Substances 0.000 description 7
- 239000000090 biomarker Substances 0.000 description 7
- 239000003245 coal Substances 0.000 description 7
- 238000004817 gas chromatography Methods 0.000 description 7
- 229910052622 kaolinite Inorganic materials 0.000 description 7
- 230000035800 maturation Effects 0.000 description 7
- 150000003254 radicals Chemical class 0.000 description 7
- 239000000126 substance Substances 0.000 description 7
- 238000000862 absorption spectrum Methods 0.000 description 6
- 239000008186 active pharmaceutical agent Substances 0.000 description 6
- 230000008859 change Effects 0.000 description 6
- 238000012512 characterization method Methods 0.000 description 6
- 230000000875 corresponding effect Effects 0.000 description 6
- 230000007423 decrease Effects 0.000 description 6
- 238000013461 design Methods 0.000 description 6
- 229910052900 illite Inorganic materials 0.000 description 6
- 229910052901 montmorillonite Inorganic materials 0.000 description 6
- VGIBGUSAECPPNB-UHFFFAOYSA-L nonaaluminum;magnesium;tripotassium;1,3-dioxido-2,4,5-trioxa-1,3-disilabicyclo[1.1.1]pentane;iron(2+);oxygen(2-);fluoride;hydroxide Chemical compound [OH-].[O-2].[O-2].[O-2].[O-2].[O-2].[F-].[Mg+2].[Al+3].[Al+3].[Al+3].[Al+3].[Al+3].[Al+3].[Al+3].[Al+3].[Al+3].[K+].[K+].[K+].[Fe+2].O1[Si]2([O-])O[Si]1([O-])O2.O1[Si]2([O-])O[Si]1([O-])O2.O1[Si]2([O-])O[Si]1([O-])O2.O1[Si]2([O-])O[Si]1([O-])O2.O1[Si]2([O-])O[Si]1([O-])O2.O1[Si]2([O-])O[Si]1([O-])O2.O1[Si]2([O-])O[Si]1([O-])O2 VGIBGUSAECPPNB-UHFFFAOYSA-L 0.000 description 6
- 239000005416 organic matter Substances 0.000 description 6
- XEEYBQQBJWHFJM-UHFFFAOYSA-N Iron Chemical compound [Fe] XEEYBQQBJWHFJM-UHFFFAOYSA-N 0.000 description 5
- QVGXLLKOCUKJST-UHFFFAOYSA-N atomic oxygen Chemical compound [O] QVGXLLKOCUKJST-UHFFFAOYSA-N 0.000 description 5
- 238000000799 fluorescence microscopy Methods 0.000 description 5
- 239000001301 oxygen Substances 0.000 description 5
- 239000003208 petroleum Substances 0.000 description 5
- 230000002829 reductive effect Effects 0.000 description 5
- XLYOFNOQVPJJNP-UHFFFAOYSA-N water Substances O XLYOFNOQVPJJNP-UHFFFAOYSA-N 0.000 description 5
- 125000003118 aryl group Chemical group 0.000 description 4
- 230000005540 biological transmission Effects 0.000 description 4
- 238000006243 chemical reaction Methods 0.000 description 4
- 238000001218 confocal laser scanning microscopy Methods 0.000 description 4
- 238000011161 development Methods 0.000 description 4
- 238000011156 evaluation Methods 0.000 description 4
- 238000002329 infrared spectrum Methods 0.000 description 4
- 238000012986 modification Methods 0.000 description 4
- 230000004048 modification Effects 0.000 description 4
- 238000005457 optimization Methods 0.000 description 4
- 239000002245 particle Substances 0.000 description 4
- 238000007781 pre-processing Methods 0.000 description 4
- 238000007670 refining Methods 0.000 description 4
- NINIDFKCEFEMDL-UHFFFAOYSA-N Sulfur Chemical compound [S] NINIDFKCEFEMDL-UHFFFAOYSA-N 0.000 description 3
- 230000006399 behavior Effects 0.000 description 3
- 238000002790 cross-validation Methods 0.000 description 3
- 238000002149 energy-dispersive X-ray emission spectroscopy Methods 0.000 description 3
- 238000002073 fluorescence micrograph Methods 0.000 description 3
- 125000000524 functional group Chemical group 0.000 description 3
- 229920001903 high density polyethylene Polymers 0.000 description 3
- 239000004700 high-density polyethylene Substances 0.000 description 3
- 238000012625 in-situ measurement Methods 0.000 description 3
- XOJVVFBFDXDTEG-UHFFFAOYSA-N pristane Chemical compound CC(C)CCCC(C)CCCC(C)CCCC(C)C XOJVVFBFDXDTEG-UHFFFAOYSA-N 0.000 description 3
- NIFIFKQPDTWWGU-UHFFFAOYSA-N pyrite Chemical compound [Fe+2].[S-][S-] NIFIFKQPDTWWGU-UHFFFAOYSA-N 0.000 description 3
- 229910052683 pyrite Inorganic materials 0.000 description 3
- 239000011028 pyrite Substances 0.000 description 3
- 238000003860 storage Methods 0.000 description 3
- 229910052717 sulfur Inorganic materials 0.000 description 3
- 239000011593 sulfur Substances 0.000 description 3
- 238000012360 testing method Methods 0.000 description 3
- 238000012549 training Methods 0.000 description 3
- GGYKPYDKXLHNTI-UHFFFAOYSA-N 2,6,10,14-tetramethylhexadecane Chemical compound CCC(C)CCCC(C)CCCC(C)CCCC(C)C GGYKPYDKXLHNTI-UHFFFAOYSA-N 0.000 description 2
- GXDHCNNESPLIKD-UHFFFAOYSA-N 2-methylhexane Natural products CCCCC(C)C GXDHCNNESPLIKD-UHFFFAOYSA-N 0.000 description 2
- IJGRMHOSHXDMSA-UHFFFAOYSA-N Atomic nitrogen Chemical compound N#N IJGRMHOSHXDMSA-UHFFFAOYSA-N 0.000 description 2
- CURLTUGMZLYLDI-UHFFFAOYSA-N Carbon dioxide Chemical compound O=C=O CURLTUGMZLYLDI-UHFFFAOYSA-N 0.000 description 2
- BVKZGUZCCUSVTD-UHFFFAOYSA-L Carbonate Chemical compound [O-]C([O-])=O BVKZGUZCCUSVTD-UHFFFAOYSA-L 0.000 description 2
- OTMSDBZUPAUEDD-UHFFFAOYSA-N Ethane Chemical compound CC OTMSDBZUPAUEDD-UHFFFAOYSA-N 0.000 description 2
- 208000033962 Fontaine progeroid syndrome Diseases 0.000 description 2
- 238000000305 Fourier transform infrared microscopy Methods 0.000 description 2
- 229910000530 Gallium indium arsenide Inorganic materials 0.000 description 2
- -1 Gas/oil ratio (GOR) Chemical class 0.000 description 2
- 238000004566 IR spectroscopy Methods 0.000 description 2
- 150000001335 aliphatic alkanes Chemical class 0.000 description 2
- 125000001931 aliphatic group Chemical group 0.000 description 2
- 150000001338 aliphatic hydrocarbons Chemical class 0.000 description 2
- 150000004945 aromatic hydrocarbons Chemical class 0.000 description 2
- 238000005899 aromatization reaction Methods 0.000 description 2
- 230000001174 ascending effect Effects 0.000 description 2
- 230000008901 benefit Effects 0.000 description 2
- 238000006065 biodegradation reaction Methods 0.000 description 2
- 230000015572 biosynthetic process Effects 0.000 description 2
- 238000009933 burial Methods 0.000 description 2
- 238000007635 classification algorithm Methods 0.000 description 2
- 150000001875 compounds Chemical class 0.000 description 2
- 238000004590 computer program Methods 0.000 description 2
- 238000007796 conventional method Methods 0.000 description 2
- 230000002596 correlated effect Effects 0.000 description 2
- 238000005336 cracking Methods 0.000 description 2
- 239000013078 crystal Substances 0.000 description 2
- 238000005520 cutting process Methods 0.000 description 2
- 230000003247 decreasing effect Effects 0.000 description 2
- 230000001419 dependent effect Effects 0.000 description 2
- 230000001066 destructive effect Effects 0.000 description 2
- 230000000694 effects Effects 0.000 description 2
- 230000005284 excitation Effects 0.000 description 2
- 238000001506 fluorescence spectroscopy Methods 0.000 description 2
- 239000012634 fragment Substances 0.000 description 2
- 238000004128 high performance liquid chromatography Methods 0.000 description 2
- 150000002431 hydrogen Chemical class 0.000 description 2
- 229910052742 iron Inorganic materials 0.000 description 2
- 239000007788 liquid Substances 0.000 description 2
- 238000004949 mass spectrometry Methods 0.000 description 2
- 239000011159 matrix material Substances 0.000 description 2
- 125000002496 methyl group Chemical group [H]C([H])([H])* 0.000 description 2
- 238000005498 polishing Methods 0.000 description 2
- 238000002360 preparation method Methods 0.000 description 2
- 230000005855 radiation Effects 0.000 description 2
- 230000009257 reactivity Effects 0.000 description 2
- 238000011084 recovery Methods 0.000 description 2
- 239000011347 resin Substances 0.000 description 2
- 229920005989 resin Polymers 0.000 description 2
- 229920006395 saturated elastomer Polymers 0.000 description 2
- 239000013049 sediment Substances 0.000 description 2
- 239000004065 semiconductor Substances 0.000 description 2
- 239000007787 solid Substances 0.000 description 2
- 238000000638 solvent extraction Methods 0.000 description 2
- 238000000992 sputter etching Methods 0.000 description 2
- 238000001149 thermolysis Methods 0.000 description 2
- 238000000411 transmission spectrum Methods 0.000 description 2
- 238000002834 transmittance Methods 0.000 description 2
- 238000004876 x-ray fluorescence Methods 0.000 description 2
- WSMQKESQZFQMFW-UHFFFAOYSA-N 5-methyl-pyrazole-3-carboxylic acid Chemical compound CC1=CC(C(O)=O)=NN1 WSMQKESQZFQMFW-UHFFFAOYSA-N 0.000 description 1
- 238000004483 ATR-FTIR spectroscopy Methods 0.000 description 1
- 239000005995 Aluminium silicate Substances 0.000 description 1
- 241000195493 Cryptophyta Species 0.000 description 1
- 238000004435 EPR spectroscopy Methods 0.000 description 1
- 208000035126 Facies Diseases 0.000 description 1
- 235000019738 Limestone Nutrition 0.000 description 1
- 229910000661 Mercury cadmium telluride Inorganic materials 0.000 description 1
- 241000283973 Oryctolagus cuniculus Species 0.000 description 1
- 238000000944 Soxhlet extraction Methods 0.000 description 1
- RTAQQCXQSZGOHL-UHFFFAOYSA-N Titanium Chemical compound [Ti] RTAQQCXQSZGOHL-UHFFFAOYSA-N 0.000 description 1
- KXNLCSXBJCPWGL-UHFFFAOYSA-N [Ga].[As].[In] Chemical compound [Ga].[As].[In] KXNLCSXBJCPWGL-UHFFFAOYSA-N 0.000 description 1
- 238000002835 absorbance Methods 0.000 description 1
- 239000002250 absorbent Substances 0.000 description 1
- 230000002745 absorbent Effects 0.000 description 1
- 230000002776 aggregation Effects 0.000 description 1
- 238000004220 aggregation Methods 0.000 description 1
- 235000012211 aluminium silicate Nutrition 0.000 description 1
- 238000013459 approach Methods 0.000 description 1
- 230000002238 attenuated effect Effects 0.000 description 1
- 238000005452 bending Methods 0.000 description 1
- 229920001222 biopolymer Polymers 0.000 description 1
- MCMSPRNYOJJPIZ-UHFFFAOYSA-N cadmium;mercury;tellurium Chemical compound [Cd]=[Te]=[Hg] MCMSPRNYOJJPIZ-UHFFFAOYSA-N 0.000 description 1
- 229910002092 carbon dioxide Inorganic materials 0.000 description 1
- 239000001569 carbon dioxide Substances 0.000 description 1
- 125000002915 carbonyl group Chemical group [*:2]C([*:1])=O 0.000 description 1
- 125000003178 carboxy group Chemical group [H]OC(*)=O 0.000 description 1
- 239000000969 carrier Substances 0.000 description 1
- 238000004140 cleaning Methods 0.000 description 1
- 239000011248 coating agent Substances 0.000 description 1
- 238000000576 coating method Methods 0.000 description 1
- 238000011109 contamination Methods 0.000 description 1
- 239000010779 crude oil Substances 0.000 description 1
- 238000001514 detection method Methods 0.000 description 1
- 230000023077 detection of light stimulus Effects 0.000 description 1
- 210000005069 ears Anatomy 0.000 description 1
- 230000005274 electronic transitions Effects 0.000 description 1
- 238000005516 engineering process Methods 0.000 description 1
- 238000005530 etching Methods 0.000 description 1
- 239000000284 extract Substances 0.000 description 1
- 239000012467 final product Substances 0.000 description 1
- 238000002189 fluorescence spectrum Methods 0.000 description 1
- 230000004907 flux Effects 0.000 description 1
- 238000005194 fractionation Methods 0.000 description 1
- 230000004927 fusion Effects 0.000 description 1
- VTGARNNDLOTBET-UHFFFAOYSA-N gallium antimonide Chemical compound [Sb]#[Ga] VTGARNNDLOTBET-UHFFFAOYSA-N 0.000 description 1
- 230000020169 heat generation Effects 0.000 description 1
- 238000010438 heat treatment Methods 0.000 description 1
- KWLMIXQRALPRBC-UHFFFAOYSA-L hectorite Chemical compound [Li+].[OH-].[OH-].[Na+].[Mg+2].O1[Si]2([O-])O[Si]1([O-])O[Si]([O-])(O1)O[Si]1([O-])O2 KWLMIXQRALPRBC-UHFFFAOYSA-L 0.000 description 1
- 229910000271 hectorite Inorganic materials 0.000 description 1
- 229910052738 indium Inorganic materials 0.000 description 1
- RPQDHPTXJYYUPQ-UHFFFAOYSA-N indium arsenide Chemical compound [In]#[As] RPQDHPTXJYYUPQ-UHFFFAOYSA-N 0.000 description 1
- APFVFJFRJDLVQX-UHFFFAOYSA-N indium atom Chemical compound [In] APFVFJFRJDLVQX-UHFFFAOYSA-N 0.000 description 1
- 238000002347 injection Methods 0.000 description 1
- 239000007924 injection Substances 0.000 description 1
- 229910010272 inorganic material Inorganic materials 0.000 description 1
- 239000011147 inorganic material Substances 0.000 description 1
- 238000007689 inspection Methods 0.000 description 1
- 230000010354 integration Effects 0.000 description 1
- 230000003993 interaction Effects 0.000 description 1
- 150000002500 ions Chemical class 0.000 description 1
- 238000006317 isomerization reaction Methods 0.000 description 1
- 238000003064 k means clustering Methods 0.000 description 1
- 238000011545 laboratory measurement Methods 0.000 description 1
- 229910052746 lanthanum Inorganic materials 0.000 description 1
- FZLIPJUXYLNCLC-UHFFFAOYSA-N lanthanum atom Chemical compound [La] FZLIPJUXYLNCLC-UHFFFAOYSA-N 0.000 description 1
- 239000006028 limestone Substances 0.000 description 1
- 230000000670 limiting effect Effects 0.000 description 1
- 125000003473 lipid group Chemical group 0.000 description 1
- 150000002632 lipids Chemical class 0.000 description 1
- 238000000622 liquid--liquid extraction Methods 0.000 description 1
- 238000000691 measurement method Methods 0.000 description 1
- 230000007246 mechanism Effects 0.000 description 1
- HZVOZRGWRWCICA-UHFFFAOYSA-N methanediyl Chemical compound [CH2] HZVOZRGWRWCICA-UHFFFAOYSA-N 0.000 description 1
- 125000000325 methylidene group Chemical group [H]C([H])=* 0.000 description 1
- 238000004452 microanalysis Methods 0.000 description 1
- 229910052757 nitrogen Inorganic materials 0.000 description 1
- 239000011368 organic material Substances 0.000 description 1
- 239000012071 phase Substances 0.000 description 1
- 238000004867 photoacoustic spectroscopy Methods 0.000 description 1
- 230000000704 physical effect Effects 0.000 description 1
- 238000000053 physical method Methods 0.000 description 1
- 239000011295 pitch Substances 0.000 description 1
- 229920000052 poly(p-xylylene) Polymers 0.000 description 1
- 229920001690 polydopamine Polymers 0.000 description 1
- 238000000513 principal component analysis Methods 0.000 description 1
- 239000000047 product Substances 0.000 description 1
- 238000011002 quantification Methods 0.000 description 1
- 239000010453 quartz Substances 0.000 description 1
- 230000000171 quenching effect Effects 0.000 description 1
- 230000009467 reduction Effects 0.000 description 1
- 238000001055 reflectance spectroscopy Methods 0.000 description 1
- 238000013349 risk mitigation Methods 0.000 description 1
- VYPSYNLAJGMNEJ-UHFFFAOYSA-N silicon dioxide Inorganic materials O=[Si]=O VYPSYNLAJGMNEJ-UHFFFAOYSA-N 0.000 description 1
- 239000000243 solution Substances 0.000 description 1
- 238000012306 spectroscopic technique Methods 0.000 description 1
- 238000010561 standard procedure Methods 0.000 description 1
- 230000003068 static effect Effects 0.000 description 1
- 239000000725 suspension Substances 0.000 description 1
- 230000001360 synchronised effect Effects 0.000 description 1
- 230000009897 systematic effect Effects 0.000 description 1
- 239000011271 tar pitch Substances 0.000 description 1
- 238000004227 thermal cracking Methods 0.000 description 1
- 238000005979 thermal decomposition reaction Methods 0.000 description 1
- 230000005676 thermoelectric effect Effects 0.000 description 1
- 230000035924 thermogenesis Effects 0.000 description 1
- 230000000476 thermogenic effect Effects 0.000 description 1
- 238000011522 transarterial infusion chemotherapy Methods 0.000 description 1
- 230000009466 transformation Effects 0.000 description 1
- 230000001131 transforming effect Effects 0.000 description 1
- 230000007704 transition Effects 0.000 description 1
- 238000002604 ultrasonography Methods 0.000 description 1
- 238000002137 ultrasound extraction Methods 0.000 description 1
- 238000011144 upstream manufacturing Methods 0.000 description 1
- 230000000007 visual effect Effects 0.000 description 1
- 238000005406 washing Methods 0.000 description 1
Images


Classifications
-
- E—FIXED CONSTRUCTIONS
- E21—EARTH DRILLING; MINING
- E21B—EARTH DRILLING, e.g. DEEP DRILLING; OBTAINING OIL, GAS, WATER, SOLUBLE OR MELTABLE MATERIALS OR A SLURRY OF MINERALS FROM WELLS
- E21B49/00—Testing the nature of borehole walls; Formation testing; Methods or apparatus for obtaining samples of soil or well fluids, specially adapted to earth drilling or wells
- E21B49/003—Testing the nature of borehole walls; Formation testing; Methods or apparatus for obtaining samples of soil or well fluids, specially adapted to earth drilling or wells by analysing drilling variables or conditions
-
- G—PHYSICS
- G06—COMPUTING; CALCULATING OR COUNTING
- G06N—COMPUTING ARRANGEMENTS BASED ON SPECIFIC COMPUTATIONAL MODELS
- G06N20/00—Machine learning
- G06N20/20—Ensemble learning
-
- G—PHYSICS
- G01—MEASURING; TESTING
- G01N—INVESTIGATING OR ANALYSING MATERIALS BY DETERMINING THEIR CHEMICAL OR PHYSICAL PROPERTIES
- G01N21/00—Investigating or analysing materials by the use of optical means, i.e. using sub-millimetre waves, infrared, visible or ultraviolet light
- G01N21/17—Systems in which incident light is modified in accordance with the properties of the material investigated
- G01N21/25—Colour; Spectral properties, i.e. comparison of effect of material on the light at two or more different wavelengths or wavelength bands
- G01N21/31—Investigating relative effect of material at wavelengths characteristic of specific elements or molecules, e.g. atomic absorption spectrometry
- G01N21/35—Investigating relative effect of material at wavelengths characteristic of specific elements or molecules, e.g. atomic absorption spectrometry using infrared light
- G01N21/3563—Investigating relative effect of material at wavelengths characteristic of specific elements or molecules, e.g. atomic absorption spectrometry using infrared light for analysing solids; Preparation of samples therefor
-
- G—PHYSICS
- G01—MEASURING; TESTING
- G01N—INVESTIGATING OR ANALYSING MATERIALS BY DETERMINING THEIR CHEMICAL OR PHYSICAL PROPERTIES
- G01N33/00—Investigating or analysing materials by specific methods not covered by groups G01N1/00 - G01N31/00
- G01N33/24—Earth materials
- G01N33/241—Earth materials for hydrocarbon content
-
- G—PHYSICS
- G06—COMPUTING; CALCULATING OR COUNTING
- G06N—COMPUTING ARRANGEMENTS BASED ON SPECIFIC COMPUTATIONAL MODELS
- G06N20/00—Machine learning
-
- G—PHYSICS
- G06—COMPUTING; CALCULATING OR COUNTING
- G06N—COMPUTING ARRANGEMENTS BASED ON SPECIFIC COMPUTATIONAL MODELS
- G06N5/00—Computing arrangements using knowledge-based models
- G06N5/04—Inference or reasoning models
- G06N5/046—Forward inferencing; Production systems
-
- G—PHYSICS
- G16—INFORMATION AND COMMUNICATION TECHNOLOGY [ICT] SPECIALLY ADAPTED FOR SPECIFIC APPLICATION FIELDS
- G16C—COMPUTATIONAL CHEMISTRY; CHEMOINFORMATICS; COMPUTATIONAL MATERIALS SCIENCE
- G16C20/00—Chemoinformatics, i.e. ICT specially adapted for the handling of physicochemical or structural data of chemical particles, elements, compounds or mixtures
- G16C20/30—Prediction of properties of chemical compounds, compositions or mixtures
-
- G—PHYSICS
- G01—MEASURING; TESTING
- G01N—INVESTIGATING OR ANALYSING MATERIALS BY DETERMINING THEIR CHEMICAL OR PHYSICAL PROPERTIES
- G01N21/00—Investigating or analysing materials by the use of optical means, i.e. using sub-millimetre waves, infrared, visible or ultraviolet light
- G01N21/17—Systems in which incident light is modified in accordance with the properties of the material investigated
- G01N21/25—Colour; Spectral properties, i.e. comparison of effect of material on the light at two or more different wavelengths or wavelength bands
- G01N21/31—Investigating relative effect of material at wavelengths characteristic of specific elements or molecules, e.g. atomic absorption spectrometry
- G01N21/35—Investigating relative effect of material at wavelengths characteristic of specific elements or molecules, e.g. atomic absorption spectrometry using infrared light
- G01N2021/3595—Investigating relative effect of material at wavelengths characteristic of specific elements or molecules, e.g. atomic absorption spectrometry using infrared light using FTIR
-
- G—PHYSICS
- G01—MEASURING; TESTING
- G01N—INVESTIGATING OR ANALYSING MATERIALS BY DETERMINING THEIR CHEMICAL OR PHYSICAL PROPERTIES
- G01N33/00—Investigating or analysing materials by specific methods not covered by groups G01N1/00 - G01N31/00
- G01N33/24—Earth materials
-
- G01V20/00—
-
- G—PHYSICS
- G16—INFORMATION AND COMMUNICATION TECHNOLOGY [ICT] SPECIALLY ADAPTED FOR SPECIFIC APPLICATION FIELDS
- G16C—COMPUTATIONAL CHEMISTRY; CHEMOINFORMATICS; COMPUTATIONAL MATERIALS SCIENCE
- G16C20/00—Chemoinformatics, i.e. ICT specially adapted for the handling of physicochemical or structural data of chemical particles, elements, compounds or mixtures
- G16C20/70—Machine learning, data mining or chemometrics
Abstract
Systems, devices, and computer-implemented methods for sensing and predicting properties of hydrocarbon source rock are provided. Disclosed herein is a method of predicting the maturity of a source rock, the method comprising: obtaining a plurality of data of a sample source rock from a plurality of data acquisition devices placed in proximity to the sample source rock, and analyzing the received data using the predicted correlation to determine maturity of the sample source rock. Predictive correlations are generated by applying a machine learning model to correlate a plurality of data obtained from a plurality of representative source rocks with a plurality of attributes of the plurality of representative source rocks.
Description
Technical Field
Methods, devices, and systems are disclosed herein that are generally directed to sensing and prediction of hydrocarbon source rock properties.
Background
In conventional reservoirs, hydrocarbons are recovered from formation or formation traps in sandstone or limestone. Hydrocarbons are produced from some of the deeper source rocks in the basin and migrate and accumulate in these reservoirs. In unconventional reservoirs, the source rock is both the source and reservoir in the rock structure. The value of the hydrocarbons extracted from each type is highly dependent on the properties of the source rock associated with each type. It will be appreciated that predicting and interpreting the properties of the hydrocarbons produced by each type of reservoir requires analysis of the source rock using a variety of methods to determine the maturity and type of the source rock. Maturity and source rock type are parameters that have the greatest effect on the fluid properties of the produced hydrocarbons, such as Gas/oil ratio (GOR), Gas humidity or dryness, and viscosity, all of which affect the mobility and quality of the hydrocarbons. For example, successful hydrocarbon production in unconventional reservoirs is dominated by condensate/gas mixtures. This is mainly associated with type II marine source rocks. These source rocks undergo a transition in the late oil maturation stage, during which the maximum kerogen (kerogen) internal porosity develops as a result of the maturation cycle. The reservoir pressure generated during this maturation period is caused by hydrocarbon cracking, which provides the required gas drive for driving out the produced hydrocarbons. This internal pressure results in greater gas storage capacity, which can be exploited by hydraulic fracturing to break rock and recover hydrocarbons. The produced fluid is a very light, low viscosity and high GOR crude oil containing a large amount of moisture (wet gas). Moisture is more easily extracted into valuable products. In contrast, the density of oil in conventional reservoirs is higher, migrating from less mature oil source types. These reservoirs may present expensive production challenges during recovery, as high viscosity and low GOR reduce the mobility of fluids in the reservoir. Refining such petroleum oils is also expensive due to the removal of excess resins and asphaltenes and the need to crack heavier hydrocarbons during the refining process, thereby reducing the net value of the final product.
Commercial exploitation depends on the identification of effective source rocks that contain the desired organic phase profile and the desired maturity and are currently being produced, or have the ability to produce hydrocarbons. Therefore, mineralogical and organic geochemical information of reservoirs and source rocks is crucial for the evaluation and optimized production of hydrocarbons. The standard method for obtaining properties of source rock is by taking a large number of measurements on homogenized, crushed/comminuted samples. Crushed rock is subjected to an extraction process that separates the organic components of the rock sample. The extracted organic components are analyzed to determine the maturity and organic phase distribution of the source rock sample.
Disclosure of Invention
Some risks are recognized in evaluating extracted and comminuted source rock samples. These risks include, but are not limited to, changes in the components extracted during the analysis and contamination of the analysis by the components during the extraction. In addition, samples are taken from the reservoir and later analyzed at the surface or sent to a laboratory for analysis. This process can take a long time and no information can be obtained in time to inform completion decisions about the well at the collection location. This process is also expensive and therefore mineralogical and maturity information is sometimes collected at several selected sample locations. Due to the limited sampling, important information about the rock may be missed. Therefore, there is a need for a wireline logging tool and other data acquisition device that can provide information about mineralogy and maturity within a reservoir interval in hours and can obtain a complete property profile along the well, rather than a small set of measurements at selected locations. It has also been recognized that there is a need for a casing logging tool that can measure properties of produced fluids as these properties change over time during production to indicate connectivity of the reservoir and whether oil may have been missed.
Spectroscopic measurements involve a light source, reflection of light or transmission of light through the sample, and detection of light intensity by a detector. Furthermore, the light source is monochromatic or the detector is wavelength selective, so that the attenuation of light (whether by reflection or transmission) is observed as a function of wavelength. Current laboratory spectrometers for mid-long Infrared (IR) wavelengths typically use semiconductor photodiode detectors. These detectors are made of materials such as mercury cadmium telluride, indium gallium arsenide, or indium arsenide that must be cooled below ambient temperature (e.g., with thermoelectric or liquid nitrogen) to achieve a usable signal-to-noise ratio.
In certain embodiments, these detectors are replaced with other types of detectors to enable fast spectral measurements with appropriately sized components to be used in wireline tools and to be operable at downhole temperatures. It is further recognized that the composition of reservoir rocks and fluids may be determined using a fraction of the wavelengths, while a full spectrum may not be necessary. Thus, downhole spectrometers can be designed to provide absorption at a few selected wavelengths. Since only a few wavelengths are required, it is possible to use the data acquisition device to make longer observation times at each wavelength, thereby having time to average out the higher noise levels produced by the higher downhole temperatures. One embodiment of a downhole spectrometer includes at least one light source, one detector, an assembly that reflects light from a material of interest (fluid or rock) and reflects it to the detector, an assembly that deploys the light source and detector into the well, and an assembly that retrieves data obtained in the spectroscopic measurements.
Disclosed herein are embodiments of systems, computer-implemented methods, and non-transitory computer-readable media having stored computer programs. These embodiments aim to address the shortcomings of the art, including particular methods for spectroscopic and optical measurements of hydrocarbon source rock samples to determine their properties by sensing devices and dedicated algorithms. These methods and systems provide spatially accurate and timely features critical to exploration, development, and reservoir production.
The disclosure herein provides a computer-implemented method for determining the maturity of a sample source rock. One such method comprises the steps of: a communication link is established with a source rock database and a plurality of data acquisition devices positioned proximate to the sample source rock by a data analysis engine. The source rock database includes a first plurality of data obtained from a plurality of representative source rocks and a plurality of attributes of the plurality of representative source rocks. The method further comprises the following steps: obtaining, by a data analysis engine, a second plurality of data of the sample source rock from a plurality of data acquisition devices; and analyzing, by the data analysis engine, the second plurality of data using the predicted correlation to determine a maturity of the sample source rock. The data analysis engine generates a predictive correlation by applying a machine learning model to correlate a first plurality of data obtained from a plurality of representative source rocks with a plurality of attributes of the plurality of representative source rocks. The plurality of data acquisition devices may include a spectrometer having a light source, a pyroelectric detector, and an assembly for reflecting light from the sample hydrocarbon source rock and directing the reflected light to the pyroelectric detector. The pyroelectric detector may be integrated with the tunable filter. In certain embodiments, the component for reflecting light from the sample source rock and directing the reflected light to the pyroelectric detector is an attenuated total reflectance cell. In certain embodiments, the method may further comprise the steps of: scoring at a data analysis engine by performing outlier detection, baseline correction, peak enhancement, and normalizationThe step of analyzing the second plurality of data is preceded by preparing the second plurality of data. The method further comprises the following steps: storing, by the data analysis engine, the first plurality of data of the sample source rock and the determined maturity of the sample source rock in a source rock database. Attributes of a number of representative source rocks may include kerogen typing and elemental composition. The first plurality of data may include two or more of location data, spectral measurements, and optical measurements obtained from a plurality of representative source rocks. The spectral measurements may include one or more of measurements obtained from fourier transform infrared spectroscopy (FTIR), electron spin resonance spectroscopy (ESR), terahertz spectroscopy (THz), and Ultraviolet (UV) spectroscopy. In certain embodiments, the first plurality of data further comprises pyrolysis data. Can be carried out by carrying out the treatment on a plurality of representative hydrocarbon source rocks Pyrolysis analysis to obtain pyrolysis data. In certain embodiments, the second plurality of data includes two or more of location data, spectral measurements, and optical measurements obtained from the sample source rock. The spectral measurements may include one or more of measurements obtained from fourier transform infrared spectroscopy, electron spin resonance spectroscopy, terahertz spectroscopy, and ultraviolet spectroscopy. The optical measurements may include one or more of measurements obtained by fluorescence microscopy and confocal laser scanning microscopy. Some embodiments include a machine learning model based on one or more of: support vector machine, Random
 Logistic regression, and Adaptive Boosting algorithms (Adaptive Boosting algorithms). Certain embodiments of the method further comprise the steps of: the spectral wavenumber bands are selected for operation of a plurality of data acquisition devices in the vicinity of the sample source rock. The spectral wavenumber bands of the sample source rock may be selected in response to receiving, by the data analysis engine, one or more selections of a desired maturity of the sample source rock and a desired organic phase distribution from the user interface.
Embodiments include a system for determining maturity of a sample source rock. One such system includes a plurality of data acquisition devices placed near a sample source rock and communicatively coupled to a computing device. The computing device is coupled to a source rock database via a communication network. The computing device is configured to obtain a first plurality of data of a sample source rock from the plurality of data acquisition devices; the first plurality of data is analyzed using the predictive correlations to determine a maturity of the sample source rock. The source rock database contains a second plurality of data relating to a plurality of representative source rocks, a plurality of attributes of the plurality of representative source rocks, and a predicted correlation generated by applying a machine learning model to correlate the second plurality of data obtained from the plurality of representative source rocks with the plurality of attributes of the plurality of representative source rocks. A plurality of data acquisition devices may be positioned to obtain data from the optimal sensing band of the sample source rock. The system may also include a sample source rock retrieval device to obtain a portion of the sample source rock. The plurality of data acquisition devices may be positioned to obtain two or more of the positional data, the spectral measurements, and the optical measurements. The spectral measurements may include one or more of measurements obtained from fourier transform infrared spectroscopy, electron spin resonance spectroscopy, terahertz spectroscopy, and ultraviolet spectroscopy. The optical measurements may include one or more of measurements obtained by fluorescence microscopy and confocal laser scanning microscopy. The data acquisition device may include a spectrometer including a light source, a pyroelectric detector, and an assembly that reflects light from the sample hydrocarbon source rock and directs the reflected light to the pyroelectric detector. The pyroelectric detector may be integrated with the tunable filter. The component that reflects light from the sample source rock and directs the reflected light to the pyroelectric detector may be an attenuated total reflectance cell.
Another system for determining maturity of a sample source rock includes an in situ gas data acquisition device positioned proximate to the sample source rock and communicatively coupled to a computing device. The computing device is coupled to a source rock database via a communication network and is configured to obtain a first plurality of data of a sample source rock from the in situ gas data acquisition device and analyze the first plurality of data using the predicted correlation to determine a maturity of the sample source rock. The source rock database contains a second plurality of data relating to a plurality of representative source rocks, a plurality of attributes of the plurality of representative source rocks, and a predicted correlation generated by applying a machine learning model to correlate the second plurality of data obtained from the plurality of representative source rocks with the plurality of attributes of the plurality of representative source rocks. The in situ gas data acquisition device may include a spectrometer including a light source, a pyroelectric detector, a gas inlet, a gas outlet, and a sample cell. In certain embodiments, the in situ gas data acquisition device is deployed as part of a logging-while-drilling assembly. In certain embodiments, the in situ gas data acquisition device is deployed as part of a wireline logging assembly.
Many other aspects, features and benefits of the present disclosure can become apparent from the following detailed description taken in conjunction with the accompanying drawings. The system may include fewer components, more components, or different components depending on the desired analysis goals.
Drawings
While the disclosure is susceptible to various modifications and alternative forms, specific embodiments have been shown by way of example in the drawings and will be described in detail herein. The drawings may not be to scale. It should be understood, however, that the drawings and detailed description thereto are not intended to limit the disclosure to the particular form disclosed, but on the contrary, the intention is to cover all modifications, equivalents and alternatives falling within the spirit and scope of the present disclosure as defined by the appended claims.
Fig. 1 is a flow diagram illustrating a method for determining certain properties of a source rock sample, according to an embodiment.
FIG. 2 is a flow diagram illustrating a method for determining certain properties of a source rock sample according to another embodiment.
FIG. 3 is a flow diagram illustrating a method for selecting spectral wavenumber bands for operation with a plurality of data acquisition devices proximate a sample source rock, according to another embodiment.
Fig. 4A and 4B are sample pyrograms illustrating data obtained from pyrolysis of two representative source rock samples.
Fig. 5 is an IR absorption spectrum showing various wavenumbers corresponding to chemical functional groups with respect to a hydrocarbon source rock.
Fig. 6 is a graphical representation depicting the shift to lower wavenumbers as the maturity of a source rock sample increases.
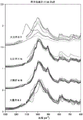
Fig. 7A is a FTIR spectrum of four groups of source rocks increasing from top to bottom according to their respective maturity. FIG. 7B is an enlarged view of FTIR spectra of four sets of bulk source rocks analyzed in FIG. 7A. Fig. 7C is a further enlarged view of the FTIR spectra of the four sets of bulk source rocks analyzed in fig. 7A.
FIG. 8A is an FTIR spectrum of several source rock powder samples and extracted kerogen. Fig. 8B is an FTIR spectrum of a pure clay powder sample.
Fig. 9A depicts a measurement time trace of a terahertz reference (high density polyethylene (HDPE)) and pulse time waveforms from various source rock sample analyses, and fig. 9B is a corresponding spectrum obtained by fourier transforming the waveforms.
Fig. 10A and 10B depict sample absorption and transmittance spectra of various source rock samples analyzed in fig. 9A and 9B in the terahertz wave band.
Fig. 11A is a two-dimensional (2D) core cross-sectional view showing the bedding (red zone rich in organics) of a source rock. FIG. 11B is a graphical representation of vitrinite reflectance plotted against the hydrocarbon indices of four different maturity levels of source rock identified as sample 1A, sample 2A, sample 3A, and sample 4A.
Fig. 12A-12C provide examples of fluorescence measurements of source rocks and oil.
Fig. 13 is a flow diagram illustrating a method of predicting maturity and organic phase distribution of a sample source rock, according to an embodiment.
Fig. 14A-14D are pre-processed representations of FTIR data from a source rock sample 3A.
FIG. 15 is a representation of a broadband input spectrum of a source rock sample across the terahertz (THz), IR, and Ultraviolet (UV) bands.
Fig. 16A and 16B depict two representations of source rock sample clustering in a reduced-dimension space.
FIG. 17 is a hierarchical double cluster diagram.
Fig. 18 is a representation of the alignment of the weights of the graded features from FTIR spectroscopy with the spectral wavenumber bands to distinguish various clays, minerals and kerogen at different maturity levels.
Fig. 19A and 19B are representations of cluster maps of FTIR spectra from different samples projected on selected wavenumber axes. Fig. 19C is an example dendrogram obtained from hierarchical clustering of sample FTIR spectra for 18 different types of samples.
FIGS. 20A and 20B present the use of two different machine learning algorithms in the form of confusion matrices- -the adaptive enhancement method (as shown in FIG. 20A) and Random The method (as shown in fig. 20B) classifies the source rock samples to obtain the evaluation results.
FIG. 21 shows the comparison of maturity indices obtained by two different machine learning algorithms (adaptive enhancement method and Random) with various source rocks processed by conventional methods Method) maturity index (ratio of Hydrogen Index (HI) to vitrinite reflectance (Ro%)) predicted from FTIR spectra of hydrocarbon source rock samples).
Fig. 22A represents a simplified thermal model according to an embodiment, and fig. 22B represents an equivalent circuit of a pyroelectric detector according to this embodiment.
FIG. 23 is a schematic diagram of a device including a commercial pyroelectric detector integrated with a tunable filter according to an embodiment.
Fig. 24 is a schematic diagram of a single reflection configuration of an Attenuated Total Reflectance (ATR) unit, according to an embodiment.
Fig. 25 is a schematic diagram of a multi-reflecting configuration of an Attenuated Total Reflectance (ATR) unit, according to an embodiment.
Fig. 26 is a schematic view of a GIP data acquisition device using a pyroelectric sensor according to an embodiment.
Fig. 27A, 27B, and 27C are photographs of a laboratory prototype of the GIP data acquisition device, the light source, and the pyroelectric detector, respectively, according to an embodiment.
Fig. 28A and 28B are representations of an IR spectrum obtained using ethane and an associated system calibration spectrum, respectively, according to an embodiment.
Fig. 29 is a schematic diagram of a sampling device according to an embodiment.
Detailed Description
In the following description, numerous specific details are set forth in order to provide a thorough understanding of various embodiments. In other instances, well-known processes and methods may not be described in particular detail in order to not unnecessarily obscure the embodiments described herein. Additionally, the illustrations of embodiments herein may omit certain features or details in order to avoid obscuring the embodiments described herein.
In the following detailed description, reference is made to the accompanying drawings, which form a part hereof. Other embodiments may be utilized and logical changes may be made without departing from the scope of the present disclosure. The following detailed description is, therefore, not to be taken in a limiting sense.
The description may use the phrases "in some embodiments," "in various embodiments," "in certain embodiments," or "in embodiments," which may each refer to one or more of the same or different embodiments. Furthermore, the terms "comprising," "including," "having," and the like, as used with respect to embodiments of the present disclosure, are synonymous.
The success of producing and extracting the most valuable hydrocarbons requires knowledge of the source rock of unconventional and conventional reservoirs within a given basin. The system and method provide high-grade target source rocks that require development of intelligent systems involving machine learning methods and chemometrics methods. In this framework, all analytical data for determining maturity and source type are integrated and analyzed to arrive at a determination regarding maturity and source. The system can be used to predict potential API gravity (API gravity), gas oil ratio, and viscosity of hydrocarbons, then evaluate the cost of extracting, producing, and refining the target hydrocarbons, and provide uncertainty quantification for these predictions.
As used herein, the term "source rock" refers to rock that is capable of producing or has produced an active amount of hydrocarbons. A number of representative source rock samples, their locations (e.g., type of well location), their organic phase distribution, their age and maturity, spectral measurements, and other representative source rock measurements are recorded in a database and used to correlate the spectral measurements with the source rock properties.
"data analysis engine" refers to one or more software modules that process data, develop models and rules, and perform data matching, training, and cross-validation by using appropriate logic and criteria, including but not limited to software for predicting properties of hydrocarbon source rocks. In some embodiments, the data analysis engine may be implemented as part of a server, user computing device, or the like. Examples of suitable implementations of the data analysis engine include servers, authorized user computing devices, smart phones, desktop computers, laptop computers, tablet computers, PDAs, and other types of processor-controlled devices that receive, process, or transmit digital data.
Characterization of mineral content and organic maturity in rock is important for determining the optimal depth of branches in shale reservoirs, the optimal location of hydraulic fractures of wells in shale reservoirs, as well as refining basin models and geological understanding of hydrocarbon systems. In shale reservoirs, the maturity and quantity of organics may be indicative of the porosity and in situ gas of kerogen. When the material exceeds a certain maturity level, the porosity may collapse and gas may not be present. Mineralogy indicates how effectively shale can be fractured. The characterization of the composition of the produced fluid may be indicative of the physical properties of the fluid, which may be important for designing well completions, artificial lifts, and surface facilities. A difference in fluid composition between two production zones or two wells may indicate that the zones or wells are not communicating. It may also indicate that the respective fluids are from different source rocks or have different temperatures, biodegrades or other changes after injection.
Certain aspects of the present disclosure include methods, systems, and software products for predicting source rock properties based on spectral and optical measurements. Certain embodiments include particular methods, systems, and software products including integration of multiple measurements of a hydrocarbon source rock sample using spectral and optical measurements and sensing techniques to perform geochemical and mineralogical characterization of the hydrocarbon source rock, such as classifying the hydrocarbon source rock based on its maturity and organic phase distribution.
Methods, systems, and software products in the present disclosure relate to techniques for determining selected source rock properties based on selected spectral measurements. Also included herein is a source rock property database for generating a predictive correlation of spectral measurements to selected source rock properties. A source rock database is one that contains measurements of several characteristics of a large number of source rock samples representing different maturity levels and depositional causes. The database includes measurements of representative source rock, such as selected spectral measurements, optical measurements, and standard measurements of source rock properties. These attributes include the maturity of the source rock and the type of kerogen present in the source rock. The spectral, optical, and standard measurements are processed using computer algorithms to develop correlations of selected aspects of the spectral measurements with the properties of the source rock. Correlations developed between the spectral measurements and the source rock properties are used to predict the source rock properties of unknown source rocks based on the spectral measurements and optical measurements of the source rocks.
The source rock database may be configured as a combination of external source and internal databases and implemented as an object-oriented, network, semi-structured, or other flexible database, or a combination thereof, to provide the functionality of acquiring, indexing, and storing data. In these embodiments, the source rock database provides data to one or more software modules in the system as well as other stored data and files. The external data source may be, for example, a single database, multiple databases, or a virtual database, including data from multiple sources (e.g., servers on the world wide web). In these embodiments, the source rock database may be implemented using application protocols for accessing and maintaining spectral, optical, and standard measurements of representative source rocks, and the like. Those skilled in the art will appreciate that the data stored in the databases described in this disclosure may also be stored or maintained in non-transitory memory and accessed between subroutines, functions, modules, objects, program products, or processes, e.g., in accordance with the objects or variables of those subroutines, functions, modules, objects, program products, or processes.
Certain embodiments of the methods, systems, and software products of the present disclosure involve new sensing techniques directed to only a subset of wavenumber bands that are important for maturity, kerogen type, and other geological properties (e.g., organic phase). Based on a spectral database consisting of a large number of representative samples and a variety of spectral measurement types, a variety of new algorithms have been developed to identify information overlaps and gaps between a variety of different measurements (e.g., FTIR, Florescence, THz, and ESR data). This is achieved by co-learning algorithms suitable for a variety of spectral measurements, in particular by means of high-dimensional feature learning algorithms, classification algorithms and prediction algorithms. The optimal sensing band and predictor are derived as a solution to the constrained optimization problem that maximizes the overall information about the source rock properties (maturity and kerogen type) under constraints accessible on site.
When an unknown source rock sample must be characterized, a spectral measurement is taken of the entire rock sample and correlated with source rock properties obtained from testing of the source rock sample. In certain embodiments, the hydrocarbon source rock properties of the unknown sample are determined based only on spectral measurements of the entire rock portion of the unknown sample. In certain embodiments, the measurements are made in situ of the source rock. These embodiments provide cost effective and reliable multispectral in situ sensing, accurate prediction of source rock maturity and organic phase distribution, accurate reserves and production rate estimates, which results in increased production of hydrocarbons, optimized recovery methods, and greater risk mitigation.
In certain embodiments, a computer-implemented method of determining properties of a sample source rock includes the following steps performed by a data analysis engine: a first plurality of data of a sample source rock is obtained from a plurality of data acquisition devices placed in proximity to the sample source rock and the received data is analyzed using predictive correlations to determine a maturity of the sample source rock. The received data is processed by performing outlier detection, baseline correction, peak enhancement and normalization, and then analyzed by a data analysis engine. Generating, by the data analysis engine, a predictive correlation by applying a machine learning model to correlate data obtained from the plurality of representative source rocks with a plurality of attributes of the plurality of representative source rocks. The source rock database stores data obtained from a plurality of representative source rocks, attributes of various representative source rocks, data received for sample source rocks, and a determined maturity of the sample source rocks.
In certain embodiments, a computer-implemented method of determining maturity of a sample source rock may include selecting spectral wavenumber bands for operation of a plurality of data acquisition devices in proximity to the sample source rock. The spectral wavenumber bands of the sample source rock are selected in response to receiving one or more selections of a desired maturity and a desired organic phase distribution of the sample source rock from a user interface.
In certain embodiments, the spectroscopic techniques include one or more of FTIR, THz, ESR, and fluorescence spectroscopy. Examples of properties tested include vitrinite reflectance, hydrocarbon index, elemental composition, thermolysis, and hectorite fluorescence. These tests provide an indication of the maturity of the source rock and the kerogen type. Other analytical methods such as High Performance Liquid Chromatography (HPLC), Gas Chromatography (GC), and GC mass spectrometry (GC-MS) can be used to characterize kerogen of representative source rock samples. For in-situ field sensing and prediction purposes, such as sub-bands of various spectral measurements, a set of optimal sensing properties is derived. In certain embodiments, the rock sample is evaluated using one or more of FTIR spectroscopy, fluorescence spectroscopy, THz spectroscopy, ESR spectroscopy, energy dispersive X-ray (EDS or EDX) spectroscopy. Also use The rock samples were evaluated by pyrolysis.
Embodiments disclosed herein also include a computer system associated with the data acquisition device, the computer system including a memory, a processor, and one or more input/output (I/O) interfaces. The memory may include non-volatile memory (e.g., flash memory, read-only memory (ROM), programmable read-only memory (PROM), erasable programmable read-only memory (EPROM), electrically erasable programmable read-only memory (EEPROM)), volatile memory (e.g., Random Access Memory (RAM), Static Random Access Memory (SRAM), Synchronous Dynamic RAM (SDRAM)), mass storage memory (e.g., CD-ROM, DVD-ROM, or hard disk) drives), and combinations thereof. The memory may include a non-transitory computer-readable storage medium having program instructions stored therein. The program instructions may include program modules executable by a computer processor to cause the functional operations described herein, including those described with respect to determining the maturity of a hydrocarbon source rock sample.
The processor may be any suitable processor capable of executing/executing program instructions. The processor may include a Central Processing Unit (CPU) that executes program instructions (e.g., for the methods shown in fig. 1, 2, 3, and 13) to perform the arithmetic operations, logical operations, and input/output operations described herein. The processor may include one or more processors. The processor may be communicatively linked to one or more I/O devices, such as a joystick, a computer mouse, a keyboard, a display screen (e.g., an electronic display for displaying a Graphical User Interface (GUI)), a touch or voice responsive device, and so forth. The I/O devices may include one or more user input devices, one or more data acquisition devices, one or more data processing apparatuses, and combinations thereof. These devices may be connected to the processor and I/O interface through wired or wireless connections. The I/O interface may provide an interface for communicating with one or more external devices (e.g., other computers, networks, data acquisition devices, sampling devices, and combinations thereof). In some embodiments, the I/O interface includes an antenna, a transceiver, and other components as needed to communicatively couple to other devices. In some embodiments, the external device comprises an upstream facility. The various illustrative logical blocks, modules, circuits, and algorithm steps described in connection with the embodiments disclosed herein may be implemented as electronic hardware, computer software, or combinations of both. When the devices are enabled to exchange data, control signals, or other information between them, a communication link will be established between two or more devices in the system. To clearly illustrate this interchangeability of hardware and software, various illustrative components, blocks, modules, circuits, and steps have been described above generally in terms of their functionality. Whether such functionality is implemented as hardware or software depends upon the particular application and design constraints imposed on the overall system. Skilled artisans may implement the described functionality in varying ways for each particular application, but such implementation decisions should not be interpreted as causing a departure from the scope of the present disclosure.
Fig. 1 is a flow diagram illustrating a method 100 for determining certain properties of a source rock sample, according to an embodiment. At step 102, a quantity of representative source rocks is collected. At step 104, the data analysis engine obtains spectral measurements, optical measurements, and other data related to various attributes of representative source rocks (e.g., source rock maturity and kerogen type). At step 106, the data analysis engine processes the spectral, optical, and other data to determine a predicted correlation between the spectral, optical, and other data and the source rock properties. At step 108, the data analysis engine acquires selected spectral measurements, optical measurements, and other data about the sample source rock. At step 110, the data analysis engine processes the selected spectral measurements, optical measurements, and other data related to the sample source rock using the predictive correlations to determine the maturity of the sample source rock.
Fig. 2 is a flow diagram illustrating a method 200 for determining certain properties of a source rock sample, according to an embodiment. At step 202, an FTIR spectrum of a new sample is obtained. At step 204, the FTIR spectra are subjected to preprocessing methods, such as outlier detection, baseline correction and normalization. At step 206, wavenumbers/bands are selected by weighting or from source rock database training data. At step 208, the processed FTIR spectra are clustered or classified against the database sample. At step 210, the maturity/organic phase distribution is predicted based on the source rock database training model. At step 212, if the FTIR pattern is a large number of samples, then at step 214, the classes and predictive attributes are mapped to the sample surface and co-registered and cross-validated with other images (e.g., energy dispersive X-ray spectroscopy (EDS or EDX) or fluorescence). At step 216, if the co-registration/cross-validation is successful, at step 218, the new sample is added to the source rock database 220, along with all acquired data and analysis. At step 212, if the FTIR image is not a large number of samples, at step 218, data from the source rock samples is added to a source rock database 220. At step 216, if the co-registration/cross-validation is not successful, the process repeats from step 208.
Fig. 3 is a flow diagram illustrating a method 300 for determining certain properties of a source rock sample, according to an embodiment. At step 302, target properties such as maturity and organic phase distribution are set to the properties of the sensed or predicted source rock sample. At step 304, a subset of database samples is selected as input from the curated source rock database. At step 306, a feature selection algorithm is used to calculate weights for wavenumbers/bins from the selected database samples. At step 308, feasibility constraints of sensor design and deployment are considered in selecting the optimal wavenumber/frequency band. These bands are selected by the feature classification and used as sensing bands at step 310. These sensing bands are most helpful for selected target properties, or to distinguish differences in the source rock sample.
Certain embodiments include an apparatus for performing selected spectral measurements in selected sub-bands in the borehole and transmitting the spectra to a surface computer for processing or possibly performing the processing itself and transmitting results of maturity and kerogen type. A set of methods for predicting source rock properties (maturity and organic phase) from multiple measurements in general and selected sensing has been developed, and in certain embodiments, these multiple measurements are sensed from the in situ field. Petromineralogical and organic geochemical information about reservoirs and source rocks important for evaluating and producing petroleum systems can be derived from various types of spectroscopic measurements such as FTIR, ESR, THz and UV spectroscopy, Gas Chromatography (GC) and Mass Spectrometry (MS). A database is established containing these measurements from the collection of representative source rock samples. The classification of the source rock of a new or unknown sample is determined by using a database. The best attributes for predicting source rock maturity and organic phase type are derived from all or a subset of these measurements and compared to indicators such as vitrinite reflectance and hydrocarbon index. The behavior of the molecular structure and the changes caused by different maturity levels were also compared to the values in the database. For in-situ field sensing and prediction purposes, a set of optimal sensing properties is derived. Spectral wavenumber bands that are closely related to the best attributes are determined, including those from different types of physical measurements and those from different sub-bands of each measurement type. This provides guidance for band selection for in situ sensing in field applications. The selected sensing band and its accuracy and certainty in predicting maturity and organic phase type are also quantified. This is achieved using optimal properties based on the available spectroscopic inspection data of the unknown sample or properties derived from in situ selected sensing band data.
The nature of the source rock maturation process is the physical and chemical transformation of the kerogen structure of the thermogenesis process by the burial of the source rock. The subsequent temperature gradient causes thermal decomposition of kerogen to hydrocarbons. Typically, the progression of this maturity is measured by a variety of different time-intensive methods (e.g., elemental composition, thermolysis, vitrinite reflectance, and lipoid fluorescence). Vitrinite reflectance (% Ro) is a visual microscopic estimate of the reflectance of light from vitrinite coal rock components in kerogen. By proper calibration, the range of reflectance values may reflect the maturity of the source rock. An example of a range of vitrinite reflectance (% Ro) values indicative of the age of the source rock is provided in table 1. These reflectance value ranges will vary between different source rocks and different kerogen.
TABLE 1
| Reflectance value | Age of source rock |
| 0.25-0.6 | Immature |
| 0.6-0.8 | Precocity |
| 0.8-1.1 | Peak maturity |
| 1.1-1.35 | Late maturing |
| 1.35> | Dry gas-over-ripening |
Measurement of the elemental composition of source rock helps determine the kerogen maturity and is expressed as the loss of hydrogen relative to carbon and oxygen measured from the concentrations of those elements. The systematic drop in hydrogen to carbon ratio versus oxygen to carbon ratio provides an estimate of maturity, as shown in the compositional chart (referred to as the Van Krevelen chart). Furthermore, the behavior of the H/C ratio versus the O/C ratio also provides an estimate of the composition of the coal rock components in kerogen and whether the immature source rock is classified as type I, type II, type III or type IV. These four types are based on the relative amounts of carbon, hydrogen, and oxygen in the source rock sample. Due to the production of oil and gas in the source rock, kerogen becomes depleted of hydrogen and oxygen relative to carbon. The hydrogen content in kerogen is directly proportional to the oil-producing potential of the source rock.
The nature and classification of source rocks is related to the organic phase, which reflects both the type of organic matter and the composition of the sediment in relation to the depositional environment. This is defined in terms of the relative abundance of the types of components of the coal rock and the source of the sediments that make up the matrix. The coal rock component is a blueprint residue of preserved algae and plant residues (blueprint remnants) and contains organic matter that includes three main types: lipid group, vitrinite group and inert group. These organic phases are of diagnostic interest and provide insight into the potential hydrocarbon yields and fluid quality expected for certain source rock organic phases. For example, the type II-S carbonate organic phase (sulfur-rich kerogen) contains lipid components of coal petrography, which are highly volatile and will produce oil. However, the maturity was much lower compared to standard type II kerogen which also contains volatile lipidic components of coal rock and produces oil. This occurs because the reactivity energy linked to sulfur is low and sulfur acts as a radical for increasing the reactivity. In contrast, type III siliceous organic phases tend to produce more gas because the kerogen component is less volatile and has a lower H/C ratio due to the enrichment of the vitrinite. The inert group (inert) based type IV organic phase is least volatile, has lower H/C, and has no hydrocarbon generating potential. Therefore, it is not considered an attractive source rock. These are just a few of the types of organic phases encountered in rock recordings of various basins.
A large number of source rock samples have been collected from each wellsite, and all or a selected set of the measurements described herein are made on these source rock samples. In addition to these spectral and optical measurements, the sample has other relevant data including, but not limited to, sample position, depth, and, Analysis results, FTIR spectroscopy measurements and images, elemental composition maps, confocal fluorescence images, X-ray fluorescence images, ESR measurements, terahertz images, and other data.
 The pyrolysis technology is French Petroleum institute: (
 ) A widely used technique was developed for measuring the quantity, quality and thermal maturity of organic matter in rock samples and includes determining the hydrocarbon generation potential, organic characteristics, and degree of thermal diagenesis (maturity). The FTIR data includes raw and pre-processed spectra, FTIR imaging data, and FTIR spectra of the extracted sample. The FTIR spectra typically need to be preprocessed to remove baselines, suppress noise and normalize the spectra before further analysis (e.g., clustering, classification, prediction and interpretation) is performed. The input and output spectra of these pre-processing steps are referred to as raw and pre-processed spectra, respectively. Elemental composition data includes individual mineral maps and mineral distributions of a hydrocarbon source rock sample and is obtained using techniques such as EDS-based chemical microanalysis.
FIGS. 4A and 4B are graphs showing samples obtained from immature type II kerogen source rock (e.g., sample 3A in Table 2) Sample pyrograms of the data. The peaks in the pyrogram represent mobile and non-mobile hydrocarbon fractions in the source rock and are recorded as pyrolysis data (S1 values and S2 values). These values are used to calculate the maturity indicators. The S1 peak represents mobile, distillable hydrocarbons or bitumen released from kerogen at a temperature of 330 ℃ and the S2 value represents the residual production potential of kerogen evolving at temperatures of 550 ℃ to 600 ℃. Both the S1 and S2 values are reported in milligrams per gram of rock.The S3 peak corresponds to carbon dioxide produced by thermal cracking of kerogen and is also reported in milligrams per gram of source rock. The Tmax value is the highest temperature at which the S2 value is reached and provides some measure of the maturity of the source rock. Table 2 lists samples of source rock used in this study, and
 parameters and recorded pyrolysis data. These samples were all type II kerogen source rock samples from different locations and depths in the same geological basin. Thus, the samples experience different maturity histories due to differences in geographic location and burial depth. These samples were chosen to provide a wide range of hydrocarbon maturity from no maturation to peak gas production.
Table 2 lists some examples of source rocks and their uses And (4) parameters. These represent the source rocks of the mindset age type II, covering a range of maturity from early oil to gas maturity. The division of the S2 value by Total Organic Carbon (TOC) provides a Hydrogen Index (HI) that can be used to estimate maturity (% Ro-HI), particularly when T-max is not readily resolvable from the pyrogram. Unresolved T-max (N/A value) occurred in over-matured samples, such as sample 4A and sample 4D, where the generation potential had been depleted, as seen by the low S2 value, which corresponds to the low HI-% Ro (2.0-2.5) characteristic of gas maturity. Likewise, type II sample 3A, sample 3B, and sample 3C represent samples in the early oil window, as seen by HI-% Ro of 0.62 to 0.64. In contrast, the "peak oil" maturity is characteristic of
 sample 1A (HI-% Ro ═ 1.02) and the final condensate maturity of sample 2A (HI-% Ro ═ 1.59).
TABLE 2
When predicting the maturity of or classifying the organic phase of a new source rock sample in a laboratory or field environment, similar spectral or optical data may be collected from the new sample of interest and then analyzed against the data of the source rock samples in the database.
Different frequency bands of electromagnetic waves are associated with different molecular responses, which form the physical/chemical basis of various spectroscopic and optical measurement techniques. The UV photoresponse is associated with the energy gap of the electronic transition and the infrared band produces an absorption spectrum that is characteristic of the stretching and bending modes of molecular bonds (e.g., C-H and O-H). The mechanism leading to terahertz absorption in molecular systems is mainly excited by intermolecular as well as intramolecular vibrations, such as torsional modes in macromolecular chains or intermolecular vibrations between adjacent molecules, which have stronger aggregation, while the microwave response is usually associated with molecular rotation. Spectral and optical measurements at different wavelengths characterize different aspects of molecular behavior, which are related to structural and compositional changes caused by maturation processes and organic phase changes. Thus, when optimally combined, data from different types of measurements will provide a more comprehensive characterization, resulting in more accurate predictions and classifications. These collaborative machine learning and prediction methods help classify unknown source rock samples.
The following is a description of some methods for characterizing various source rock samples in a database. FTIR is a non-destructive analytical method that provides important information for identifying and quantifying mineralogy and the composition of the organics contained in the rock matrix. In particular, it has the ability to distinguish between aliphatic and aromatic carbon structures associated with kerogen. This enables the hydrocarbon source to be tuned according to the type of kerogen and the physical and chemical transformation of the kerogen structure produced by the thermogenic process

And (4) class. FTIR spectroscopy measures composition and maturity by using vibrational energy corresponding to a moiety called the functional group that makes up kerogen. These consist mainly of single-bond structures and double-bond structures. In particular, changes in the C ═ C and C ═ O double bonds associated with aromatic components and carbonyl and carboxyl groups, and changes in the single bond C — H associated with methylene (CH2) and methyl (CH3) can diagnose maturity and composition in kerogen. Fig. 5 is a graph showing IR absorption spectra with respect to various wavenumbers corresponding to chemical functional groups of a source rock. For example, a wave number of 2930cm-1And wave number 2860cm-1Mainly with CH2And CH3The asymmetric stretching of the C-H bond of (A) is related to the symmetric stretching. The peak intensity or area can be used to determine 1710cm relative to wavenumber-1And wave number 1630cm-1Corresponding C ═ O and C ═ C bond compositions. If at 1710cm-1And 1450cm-1Where C ═ O is greater than CH of C-H bond2-CH3Then ground organic inputs are indicated, while the opposite relationship indicates more marine inputs. This relationship indicates that a continuum between these structures can be used to determine whether the contained organic is kerogen type I, II or III.
Due to the heat generation process, with the increase of maturity, at 1630cm-1The C ═ C bond at (a) also moves stably. This indicates increased fusion of the aromatic rings. Can be selected from% Ro and wave number of 1630cm-1To 1570cm-1See this in relation to the change in (c), as shown in FIG. 6, where 1630cm-1The wavenumber varies with increasing kerogen maturity in the source rock. In addition, 2930cm of vibration energy was used-1And 2860cm-1And 1630cm-1The combination of relationships of (a) can be used to plot a Van Krevelen plot. In addition to the composition and classification of organic matter, FTIR can also be used to identify and quantify mineral composition. Using the ability to identify source petromineralogy, this information can then be used together with FTIR-derived kerogen composition information to define organic phase distributions. The organic phase reflects the complexity of the source rock in relation to the depositional environment, the type of coal rock composition and the tectonic zone.
Terahertz spectroscopy is another non-destructive analysis method for analyzing source rocks. Terahertz radiation is an electromagnetic wave in the frequency range of 0.3THz to 10THz (1THz — 1012Hz), which is located in the spectrum between microwaves and near infrared. Terahertz absorption is mainly excited by remote vibration and can be an intramolecular torsion mode in a large chain molecule or an intermolecular vibration mode between adjacent molecules. These low frequency vibration modes are highly concentrated and may be heavily mixed. As a result, correlating individual absorption bands or peaks to specific patterns and molecular structures and compositions is often a difficult task. As a result, interpretation of terahertz spectral data in the context of source rock characterization is rare in the literature. In certain embodiments, a method of analyzing a hydrocarbon source rock sample includes juxtaposing THz data with FTIR data for samples having the same maturity and organic phase type, thereby inferring a correlation of THz data with molecular properties from a correlation of FTIR data with molecular properties that has been better characterized. The terahertz correlation generated is stored in a database and used to predict the properties of the new sample using its own THz data.
ESR spectroscopy in the electron spin resonance range provides a measure of characteristics such as color intensity, number of spins, and number of aromatic carbon atoms per spin. The intense dark color of the resin and asphaltene fractions of petroleum is generally believed to represent organic radicals associated with aromatic structures.
Fluorescence Microscopy (FM) is an optical tool used to identify, classify and quantify organic and inorganic materials. Fluorescence is a luminescent property in which photons are used to excite sensitive electrons within the atomic structure of minerals, organic matter and geological materials. These excited electrons temporarily hop to higher orbitals within the atomic structure of the mineral. When these electrons fall into their original trajectory, energy is released in the form of light. The emitted fluorescence has a longer wavelength and lower energy than the excitation light (Stoke's shift). Source rocks of different thermal maturity related to hydrocarbon chain length have characteristic Stokes shifts. According to the einstein-planck equation, decreasing the absorption energy results in a longer emission wavelength, a well-known red-shift in fluorescence with thermal maturation of the organic matter. The decrease in fluorescence emission intensity at higher maturity is due to concentration quenching effects (non-radiative relaxation) caused by increased aromatization of the molecules, which reduces the density of the fluorophore. Some of the organics present in source rock are a biopolymer, which contains predominantly long chain saturated aliphatic hydrocarbons. The diagnostic potential of combining fluorescence images with spectral data provides the opportunity for rapid hydrocarbon source rock and organic phase analysis.
Collecting gas phase colorSpectroscopic (GC) and gas chromatography mass spectrometry (GC-MS) data to analyze the chemical composition of hydrocarbon molecules associated with the oil or bitumen extracted from the source rock. In certain embodiments, the source rock sample undergoes five major steps of organic geochemical analysis. In the first step, a source rock is subjected to Pyrolysing and then performing a second step, i.e. one of several solvent extraction methods (e.g. soxhlet extraction, ultrasonic extraction, liquid-liquid extraction) to extract the bitumen. In the third step, the pitch is subjected to high performance liquid chromatography for analysis of saturates, aromatics, NSO compounds and asphaltenes. In the fourth step, saturates and aromatics were further analyzed using gas chromatography for normal alkanes (C)22-C35) And aromatic hydrocarbons (C)22-C35) Distribution of (2). These compounds were further analyzed by GC-MS to obtain a biomarker profile (biomarker profile). These data can be used for a number of evaluations, for example, evaluations of pristane and phytane molecules to determine depositional environments, using iso-heptane invariance to determine whether produced fluids originate from oil-to-oil correlations of the same source rock within the basin, and for determining even-odd alkane carbon ratios of organic types. API gravity (american petroleum institute gravity), which is the ratio of its density to the density of water (density of oil/density of water), is calculated using the specific gravity of the oil. The API calculated specific gravity was always determined at 60 degrees fahrenheit (af). The GC-MS data can be used to detect changes in the gravity of the API due to evaporative fractionation or biodegradation of the oil. GC-MS data can also be used to detect and assess the properties and extent of biodegradation of the oil. The methods disclosed herein utilize the molecular chemical composition of produced fluids to develop a method of predicting API gravity across basins for hydrocarbon source rock reservoirs and conventional reservoirs. Gas chromatography/mass spectrometry data can also be used to analyze oils and bitumen for biomarkers extracted from saturated and aromatic fractions. GC-MS data can be used to detect isomerization and aromatization of certain biomarkers to estimate the maturity of fluids in source rocks and determine whether hydrocarbons are generated in situ or migrated from other locationsAnd (6) moving. The GC-MS data can also be used to establish the organic phase using the deposited biomarker. The GC-MS data can be used for diamondoid analysis to determine the percentage of hydrocarbon cracking in the source rock and its relationship to kerogen internal porosity development, and to determine whether the oil is from the same or different source rock and/or reservoir. In contrast to biomarkers extracted from bitumen, GC-MS data can be used to generate time series geology of biomarkers in a fluid to determine where production originated within the stimulated rock volume. Once a database of multiple measurements from representative samples is established and new target sample measurements are obtained, one or more analytical methods for predicting maturity and organic phase distribution may be employed. A method includes data preprocessing, feature extraction, determination of optimal maturity and organic phase attributes for laboratory and field settings, source rock sample classification, and prediction and interpretation of maturity/organic phase distribution.
The present disclosure also provides a system for determining the maturity of a sample source rock. The system includes a plurality of data acquisition devices positioned proximate to the sample source rock and communicatively coupled to one or more processors. The system also includes a non-transitory computer-readable medium positioned in communication with the one or more processors and having stored thereon a computer program comprising a set of instructions that, when executed by the one or more processors, cause the one or more processors to: the method includes establishing a communication link with a plurality of data acquisition devices placed in proximity to a sample source rock, obtaining a first plurality of data of the sample source rock from the plurality of data acquisition devices, and analyzing the first plurality of data using predictive correlations to determine sample source rock maturity. Generating, by the data analysis engine, a predictive correlation by applying a machine learning model to correlate a second plurality of data obtained from the plurality of representative source rocks with a plurality of attributes of the plurality of representative source rocks. The system also includes a source rock database containing at least a second plurality of data associated with a plurality of representative source rocks, a plurality of attributes of the plurality of representative source rocks, and a prediction correlation. The data acquisition device may be positioned to obtain data from an optimal sensing band of the sample source rock. The data acquisition device is positioned to obtain two or more of the position data, the spectral measurements, and the optical measurements. The system may include a sample source rock retrieval device to obtain a portion of a sample source rock. The spectral measurements may include one or more of measurements obtained from fourier transform infrared spectroscopy, electron spin resonance spectroscopy, terahertz spectroscopy, and ultraviolet spectroscopy. The optical measurements may include one or more of measurements obtained by fluorescence microscopy and confocal laser scanning microscopy. For example, in certain embodiments, the image from confocal laser scanning microscopy analysis has a pixel size of 400 nanometers (nm) when the instrument has a resolution of 200 nm.
Additionally, a dedicated sampling device is disclosed herein. These devices include a sampling inlet and a sample acquisition chamber. The sampling inlet is designed to extract a sample from the borehole environment. The sample may comprise a fluid, a solid, or a combination thereof. In certain embodiments, the sample is a source rock sample that is not a component of the drilling fluid stream. The sample acquisition chamber may be equipped to store the sample without losing its integrity until further processing. The sample acquisition chamber may be equipped to contact the sample with an in situ data acquisition device for further processing. The sampling inlet can be designed to contain one or more openings to allow passage of the sample retrieval device, the sample, or both. The sample retrieval device includes a sample extraction component and a sample collection component. The sample extraction assembly may include a mechanical manipulator (e.g., a drill bit), or a device that extracts a sample using a fluid (e.g., water or air) or waves (e.g., ultrasound). A source rock sample may be extracted using a mechanical manipulator or a fluid-based drilling tool. The sample collection assembly may be integrated into the sample extraction assembly or may be separate, for example, a container or suction device that collects the sample after it is separated from the environment.
An example of a data acquisition device is a downhole spectrometer and includes at least one light source, a detector for reflecting light from a source of material of interest (whether fluid or rock) and detecting the light at the detectorThe components returned at the detectors, the components that deploy the sources and detectors into the well, and the components that retrieve the data obtained in the spectral measurements. In one embodiment, the light source is one or more single chip lasers (e.g., indium gallium antimonide distributed feedback lasers or quantum cascade lasers), each tuned to produce a different wavelength and each powered such that only one such laser is activated at a time. In this embodiment, the detector is made of, for example, lanthanum titanate (LaTiO)3) The finished pyroelectric detector. The pyroelectric detector does not generate carriers by absorption. Instead, they generate an electrical charge through electromechanical expansion due to the heating of the incident photons. They are therefore sensitive to a wide range of frequencies, and one such pyroelectric detector can be used to measure the light intensity from any single chip laser. In this embodiment, one laser is activated at a time, and as each laser is activated, the light intensity detected by the pyroelectric detector is measured and recorded in computer memory, thereby providing a measure of the light attenuation at each laser wavelength.
In one embodiment, the light source may be a wire of iron that radiates broad spectrum light in the infrared band when heated. In this embodiment, the detector is a plurality of pyroelectric detectors, each having a permanent filter on top of it, so that it is sensitive only to light of the wavelength selected by the filter. When the light source is active, the light intensity on each pyroelectric detector will be recorded to provide a measure of light attenuation at the wavelength selected by each filter. In one embodiment, there are multiple pyroelectric detectors, with filters tuned to each wavelength. Each such detector is much smaller than the width of the beam and all detectors are placed in a checkerboard pattern within the beam of the light source. The light intensities of all detectors with filters of the same wavelength are added to average the variation of the light beam intensity over a number of detector positions. In one embodiment, the apparatus for reflecting light away from a material includes a chamber into which a rock or fluid sample is introduced. The source and detector are outside the chamber, and light enters the chamber from the light source through a window and then returns through the same window to the outside of the chamber where it is measured by the detector. In another embodiment, the source and detector are contained in a sensor package and separated from the wellbore fluid or rock wall by a window. In one embodiment, the window is coated on the rock sample or fluid side with a non-stick coating, such as parylene, that repels wellbore fluids so that the fluids are visible through the window but do not adhere to the window. In one embodiment, a window is provided near a gripper or scraper that removes drilling mud from the rock wall so that light can propagate from the source to the rock wall and reflected light from the rock wall can be observed by the detector. In another embodiment, a jet of transparent fluid is injected onto the rock wall to maintain a transparent layer of fluid between the window and the rock wall.
In certain embodiments of the data acquisition device, the light source and detector are deployed into the well and contained within a wireline tool, a drill string, a slick tool, a drill sub or bottom hole assembly, or a combination thereof. In certain embodiments, the raw spectral data is (a) stored in a computer memory in the tool for download after the tool is retrieved from the well, or (b) transmitted to the surface via wireline, or (c) telemetered to the surface using wireless telemetry (including acoustic telemetry, electromagnetic telemetry, or mud pulse telemetry) equipment.
Different aspects of reservoir analysis may be incorporated into the data acquisition device. Certain embodiments have adjustable optical elements that can directly measure the in situ composition of mineral and bitumen components and provide information about hydrocarbon reserves in shale and carbonate.
Certain embodiments include apparatus and methods for obtaining downhole infrared spectroscopy measurements. Infrared spectroscopy can provide information about the organic and mineral content of the rock, as well as information to distinguish and characterize the produced fluids. However, such measurements are currently performed on recovered samples in the laboratory due to the bulky instrumentation required and the design of standard spectroscopic instrumentation requiring detectors that cannot operate at downhole temperatures. The apparatus described herein uses small, robust components for spectroscopic measurements that can be operated at downhole temperatures. In one embodiment, the device includes a broad-spectrum infrared source and a pyroelectric detector with a specific fixed integrated optical filter in an attenuated reflectance spectroscopy scheme. In another embodiment, an apparatus includes a photoacoustic spectroscopy detector enhanced with a pyroelectric or quartz and a laser chip of selected frequency. With such a multitude of small single wavelength attenuation measurements, spectral information of critical wavelengths can be quickly obtained at all depths in the well, even at downhole temperatures, at a fraction of the cost of laboratory measurements. These infrared absorption logs have a variety of applications. Infrared absorption of the rock wall in the wellbore at key wavelengths is related to mineralogy and maturity to guide drilling and hydraulic fracturing of shale gas wells. Such logs in the vertical portion of the well will indicate the optimal depth of the branch, while such logs in the branch will indicate the optimal location of the hydraulic fracture. Such logs will also enable basin models and geological knowledge of the oil and gas system to be refined and updated as new wells are drilled. An infrared absorption log of fluid in the production well provides information about the composition of the fluid, which may indicate the source of the fluid and thus the compartmentalization of the reservoir.
Example 1
The source rock database contains measurements of various characteristics of source rock samples. For example, without limitation, the source rock database includes parameters (e.g., location and depth) associated with various source rock samples and thereof Parameters (e.g., S1, S2, Tmax, HI, Oxygen Index (OI), yield index (PI), TOC,% Ro-Tmax, and HI-% Ro). The hydrocarbon source rock database may also contain FTIR data (e.g., raw and pre-processed data, FTIR imaging data, and FTIR data of extracted samples), as well as elemental composition data (including individual mineralogy maps and mineral distributions of the hydrocarbon source rock samples). The hydrocarbon source rock database also contains spectral measurements and images, confocal fluorescence images, X-ray fluorescence images, ESR measurements, terahertz images, and other data. Various methods for obtaining these metrics, as well as examples of data contained in the database, are provided below.
At wave number band of 500-4000cm-1FTIR spectra were obtained for all representative source rock samples. Measurements were made from the same samples of source rock in powder form as in table 2, which samples had different particle sizes and included extracted kerogen as well as clay fractions. Kaolinite, illite, montmorillonite and sodium montmorillonite (NA-MONT) clay samples having particle sizes ranging between 45 microns and 250 microns are used, such as montmorillonite-45, montmorillonite-63, montmorillonite-75, kaolinite-106, kaolinite-150, illite-150, montmorillonite-150, and 250 microns. By selective etching, the extracted kerogen was about 100% (volume) and the clay was also 100% (trace). The clay fraction appears to be less dependent on the maturity of the source rock than the extracted kerogen when analyzed in powder form.
Fig. 7A is an FTIR spectrum of four groups of source rocks increasing from top to bottom according to their respective maturity. FIG. 7B is an enlarged view of FTIR spectra of four sets of bulk source rocks analyzed in FIG. 7A to better visualize the bands associated with organic content. 2930cm-1And 2860cm-1Wave number of (1) mainly with CH2And CH3The asymmetric stretching of the C-H bond of (A) is related to the symmetric stretching. In FIG. 7B, it is apparent that 2930cm-1And 2860cm-1The peak at (a) decreased from sample 3, sample 1A, sample 1B to sample 2, and the maturity increased (table 2). Peak intensity or peak area may also be used to determine relative to 1710cm-1And 1630cm-1The wave number of (C) corresponds to the composition of bonds (C ═ O and C ═ C) (fig. 7B). Fig. 5 shows FTIR spectra in transmittance (T). Most other FTIR spectra provided in the present disclosure, including the spectra of fig. 7A, 7B and 7C and beyond, are represented using absorbance (a). Note that a ═ log10(1/T) explains the peak inversion compared to fig. 5. Fig. 7C is an enlarged view of the FTIR spectra of the four groups of bulk source rocks analyzed in fig. 7A to better visualize the bands associated with clay and mineral content. Unlike the bands mentioned in fig. 7B, the variation of the clay and mineral bands does not have a known direct dependence on maturity, at least not apparent from the FTIR spectra. One of the purposes of the method disclosed herein is by having different wavebands on the same set of samplesThese changes in between correlate to infer and capture these relationships. 2930cm-1And 2860cm-1Wave number of (1) mainly with CH2And CH3The asymmetric stretching of the C-H bond of (A) is related to the symmetric stretching. In FIG. 7B, it is apparent that 2930cm-1And 2860cm-1The peak at (a) decreases from the large number of samples 3, the large number of samples 1A, and the large number of samples 1B to the large number of samples 2 from top to bottom, and the maturity increases. Peak intensity or peak area may also be used to determine relative to 1710cm-1And 1630cm-1The wave number of (C) corresponds to the composition of the bond (C ═ O) and (C ═ C).
Fig. 8A is an FTIR spectrum of a plurality of source rock powder samples and extracted kerogen, while fig. 7A and 7B are ATR FTIR measurements from a large number of samples. As expected, the FTIR spectra of kerogen extracted from samples 1B, 2A, 2B, 3A, 4A and 4B had significantly lower responses in the clay and mineral bands than in the clay powder. In addition, the peaks near the C-O and C-C bands are more pronounced. The spectra shown in fig. 7A, 7B, and 7C are Attenuated Total Reflectance (ATR) FTIR measurements obtained from a number of source rock samples, while the spectra in fig. 8A and 8B are measurements from source rock powder samples and reference clay samples.
Fig. 8B is a graph of FTIR spectra of pure clay powder samples, wherein the clay samples show a small response at the C-H band. Conversely, 3600cm-1The characteristic signals of the vicinity are evident, especially for kaolin, the peak-like rabbit ears stand out. All clay samples were at 1000cm correlated to mineral response-1The vicinity also shows a strong peak. Samples of kaolinite, illite, montmorillonite and sodium montmorillonite clays having particle sizes ranging between 45 microns and 250 microns are used, such as montmorillonite-45, montmorillonite-63, montmorillonite-75, kaolinite-106, kaolinite-150, illite-150, montmorillonite-150, and 250 microns.
THz spectral data in a source rock database is obtained using a THz time domain spectroscopy (THz-TDS) method. Fig. 9A, 9B, 10A and 10B are THz time domain spectral data of a hydrocarbon source rock sample. Fig. 9A shows a measured time trace of THz reference (HDPE) and pulse time waveforms from analysis of various source rock samples, and fig. 9B is the corresponding spectrum obtained by fourier transformation of the waveforms. Based on this, sample absorption and transmission spectra of various source rock samples were calculated and shown as THz absorption spectra of the source rock sample in fig. 10A and transmission spectra of the source rock sample in fig. 10B, respectively. As shown in fig. 10A and 10B, the THz optical frequency band is not so directly and well-defined in relation to the structure of organic molecules. It is believed that most features may be associated with intramolecular torsional modes in large chains or intermolecular vibrational modes between adjacent molecules. With the cooperative learning approach disclosed herein, THz data is co-existent with other measurements (e.g., FTIR spectra) for samples of the same maturity and organic phase distribution. The generated terahertz correlation is a trained model that can be used to identify the characteristic structures, such as organic components, of a new rock sample from its representative terahertz data.
ESR spectroscopy was used to analyze four different maturity levels of source rock. Fig. 11A is a cross-sectional view of a 2D core showing bedding (red regions rich in organic) in transmission. The color scale indicates the level of free radicals as they vary throughout the sample, with red being a higher level. FIG. 11B is a graphical representation of the radical, iron, and hydrocarbon indices of source rocks versus vitrinite reflectance for four different maturity levels (sample 4A, sample 2A, sample 1A, and sample 3A as described in Table 2). The response of free radicals and pyrite is obtained by a number of measurements. Pyrite/free radical concentration is parabolic in maturity. In the ESR image, the source rock sample was sample 3A, showing organic enrichment (orange), and the graph in fig. 11B shows the spatially averaged compositional differences in terms of free radicals (blue RD curve), pyrite (red Fe curve), and hydrogen index (green HI/100).
Fig. 12A-12C show the relative fluorescence responses of organic-rich source rock samples of different maturity. The fluorescence intensity of organic substances decreases with maturity. Confocal images were taken on cleaned, cut and ion milled samples. The sample was smooth. These images were obtained with a laser scanning confocal microscope. The sample was excited with a series of three lasers (405nm, 488nm, and 633 nm). For 405nm excitation, the emission range is 400nm to 513 nm. For a 488nm laser, the emission range is 490nm to 633 nm. Finally, for a 633nm laser, the emission range is 638nm to 747 nm. The image corresponds to the fluorescence intensity of the emitted light. Color represents the emitted light detected by a series of filters at approximately 490nm, 505nm, and 560 nm. As shown in fig. 12A, sample 3A is an immature sample with a Hydrogen Index (HI) of 485. Sample 3A has a strong fluorescent response relative to the more mature sample. As shown in fig. 12B, sample 1A is within the peak oil window, where HI is 185. As shown in FIG. 12C, sample 4B is just inside the louver, and HI is 8. There is an increase in maturity (loss of hydrogen, and hence a decrease in HI) corresponding to a decrease in fluorescence intensity. Although these examples show a decrease in quality, this response can also be captured quantitatively.
Using a hydrocarbon source rock database of measurements from representative samples and measurements of new samples of interest, the analysis process of maturity and organic phase prediction includes several steps including preprocessing, feature extraction, optimal maturity and organic phase properties for laboratory and field settings, hydrocarbon source rock classification, and maturity/organic phase prediction and interpretation. In some embodiments, the sample may be retrieved and processed before further presentation for analysis. For example, the sample may be displayed as a sheet. The sample may also present as large fragments that may be fixed and flattened by mechanical polishing or ion milling. The sample may also present as small fragments of nuclei that can be fixed and smoothed by mechanical polishing or ion milling. Certain analysis methods may require sample washing as part of sample preparation, as the presence of external compounds (e.g., drilling mud) can affect the analysis.
Fig. 13 is a block diagram of a method 1300 of predicting maturity and organic phase distribution of a sample source rock, under an embodiment. The method begins by processing data obtained from a source rock sample by the previously described method. The data processing step 1301 includes data cleaning and preparation steps for each measurement type, e.g., outlier detection, baseline correction, peak enhancement, and normalization. Outlier detection can be achieved by a number of techniques (e.g., principal component analysis or proximity-based methods). An example of FTIR data from the source rock sample 3A was affected by these processing steps, as shown in fig. 14A-14D. Fig. 14A is raw FTIR data from a source rock sample 3A. FIG. 14B shows FTIR data subjected to wavelet de-noising and baseline correction. Fig. 14C shows FTIR data after fifth order polynomial baseline correction. Fig. 14D shows the FTIR data of fig. 14C subjected to vector normalization.
The plurality of measurements, which are correspondingly preprocessed for each measurement, may be integrated over the wavenumbers of the frequency bands, thereby forming a high-dimensional nominal input space. An example of such a broadband input spectrum is shown in fig. 15, which shows a full spectrum of one hydrocarbon source rock sample spanning the THz, IR and UV bands (the amplitudes in each band shown are centered and normalized).
Referring to fig. 13, the processed data is subjected to a feature extraction step 1302, which includes sparse band selection and dimension reduction. Spectra may be clustered or classified using annotated samples from a database, and then a feature ranking algorithm may be applied to obtain a spectral pattern with the greatest amount of information in a reduced feature space. In detail, the spectral measurements are mapped into some reduced feature space that captures the significant spectral patterns. Target properties (e.g., maturity and organic phase distribution) are then set as properties for sensing or predicting the source rock sample. A subset of database samples is selected as input from the planned source rock database. Finally, a feature selection algorithm is used to compute the wavenumber/bin weights from the selected database samples. The data from step 1302 is then processed through three separate steps. The step 1303 of developing sensing bands to predict maturity and organic phase distribution includes band selection and optimization by feature classification. This step is summarized as a mathematical expression representing steps 306, 308 and 310 in fig. 3 under a specific objective for prediction or classification. For maturity and organic phase prediction purposes, the value theta (theta) represents a minimum subset of spectral bands that may be selected for database samples with known maturity or organic phase that maximizes the likelihood of successful prediction. The minimum set is represented according to the constraint that the vector p _ norm is smaller than r. The likelihood of successful prediction is represented by log p (maturity, organic phase θ). The selected band is most helpful for a selected target property (e.g., a particular maturity or organic phase distribution), or to distinguish differences in the target hydrocarbon source rock sample. The selected band will also be constrained by the feasibility of sensor design and deployment. The optimal maturity or organic phase attribute is determined in step 1304. In step 1305, the classification of the source rock includes modeling using several classification algorithms, such as unsupervised clustering, supervised Latent Dirichlet Allocation (sLDA), or support vector machines. In step 1306, the data and constraints from step 1303, step 1304, and step 1305 are used to predict the maturity or organic phase distribution of the source rock sample by a modeling method (e.g., support vector regression).
Fig. 16A and 16B depict two representations of clustering of source rock samples in a reduced-dimension space. In a cluster-based maturity prediction model, spectra are mapped into a reduced feature space that captures the prominent spectral patterns. The samples are divided into groups, with the source rock samples being similar to each other in each group, but different between groups. Maturity-specific features and cluster structures were derived to determine the relevant wavenumber bands and representative chromatograms. The maturity of the new sample is then predicted from the one or more clusters, where the existing spectrum is most similar to the spectrum of the new sample. This process may be done on an accessible subset of the bands or fused among numerous measurements. As an example, fig. 16A and 16B are obtained by a K-means clustering algorithm. Results using hierarchical clustering are provided in fig. 17 and fig. 19A and 19B.
And clustering the samples according to the spectral similarity in a maturity prediction model based on hierarchical double clustering. The spectral bands are clustered based on their amplitude distribution throughout the sample data set. The heat map corresponds to a spectrogram (in ordered coordinates) that facilitates clustering, which can be summarized as including various types of measurements, such as fluorescence, terahertz, and ESR measurements. FIG. 17 is a hierarchical double cluster diagram. Each row of the master heat map corresponds to a sample and each column corresponds to a particular wavenumber in the spectrum. The color scale is plotted from the pre-processed spectrum. With the pre-processed broadband spectrum as input, the algorithm groups and orders the samples and spectral frequencies according to the particular distance metric selected. The top tree structure corresponds to clusters of different spectral frequencies or wavenumbers. The tree structure on the left represents the clustering of different source rock samples. Similar samples are grouped under adjacent leaves of the tree, with the same spectral frequency. For the particular example shown in fig. 17, the spectral frequencies are grouped by an algorithm such that they form bands associated with the molecular structure of various mineral and organic components and organics in the sample source rock, as shown in the color-coded boxes in fig. 17. By including the new samples into the database, these results can cluster the new samples with existing samples of known maturity and organic facies and with specific sub-bands that contribute to the clustering structure. This information can be used to determine further particle information such as mineral content and molecular structure associated with a particular maturity or organic phase.
These hydrocarbon source rock prediction methods facilitate the geochemical characterization of unconventional reservoirs and provide prediction tools that will allow field operators to more accurately assess reservoir quality and production potential and assess whether production from a given field can be enhanced. Analysis of samples obtained from wells and core samples can also provide key information for exploration and development to better assess reservoir potential.
Example 2
The following example is a method for selecting and optimizing a sensing band. The input is typically from a curated raw rock database. The sensing band is selected and optimized with a specific target property, such as a specific source rock maturity range or a specific organic phase distribution. The bands are selected to provide the most information for the selected target properties or to maximally distinguish differences in the target source rock sample. Band selection/optimization may be achieved through feature ranking and may also be constrained by feasibility of sensor design and deployment.
In this example of sensing band optimization, the bands are selected to distinguish clay from kerogen at different maturity levels. A feature selection algorithm is applied to calculate the weight for each frequency/wavenumber point. Figure 18 shows the alignment of the weights of the graded features from FTIR spectroscopy to the spectral wavenumber bands to distinguish various clays, minerals and kerogen at different maturity levels. The top panel of fig. 18 shows the resulting weights of the FTIR wavenumber spectra of the samples. The bottom panel of fig. 18 shows FTIR spectra of various samples. The result includes a set of weights for each frequency/wavenumber point; in the top panel of fig. 18, the higher the weight on the Y-axis, the more sensitive the selected band is to the target distribution. The highest weighted band coincides with the known bands representing hydrocarbons, clays and minerals, as shown in the bottom panel of fig. 18. Feature selection published in 2016 by the authors Jundong Li, Kewei Cheng, Suhang Wang, Fred Morstatter, Trevino Robert, Jiliang Tang, and Huang Liu: several methods for achieving object clustering, classification, or prediction of objects through a Feature ranking algorithm are described in the Data Perspective (Feature Selection: A Data Perspective), available from the website https:// axiv.org/pdf/1601.07996 v4. pdf. The best sensing band is selected from the sensing bands with the highest sensitivity and is also feasible for sensor design and deployment. For example, the sensing band for clay is determined to be higher than 3500cm-1And the sensing band for minerals is about 450cm-1To 1050cm-1。
Example 3
The following example is a method for clustering source rock samples by hierarchical clustering. The samples are divided into groups, with the source rock samples being similar to each other in each group, but different between groups. Maturity-specific features and cluster structures were derived to determine the relevant wavenumber bands and representative spectra. Fig. 19A and 19B are representations of cluster maps of FTIR spectra from different samples projected on selected wavenumber axes. Clustering is done in a high dimensional space defined by wavenumber bands. FIG. 19A shows the use of a spectral wavenumber of 1490.9cm-1(x-axis) and 2806.6cm-1(y-axis) ofAnd (6) clustering results. FIG. 19B shows the spectral wavenumber at two different spectral wavenumber positions (3697 cm for the x-axis)-1And 2862.5cm for the y-axis-1) The same clustering result. When projected in these two different coordinate systems, the same clustering result will have different appearances due to different effects from these wavenumber bands. The samples here included known clay materials (illite (C1), kaolinite (C2), montmorillonite (C3)) and kerogen extracted at different maturity in ascending order (sample 3A (C7), sample 1A (C4), sample 2A (C5 and C6) and sample 4A (C8)). Fig. 19C is an example dendrogram obtained from hierarchical clustering of sample FTIR spectra for 18 different types of samples.
Each of these samples is then run as a test sample to determine the predictive power of the model. Using different learning algorithms (e.g. Support Vector Machine (SVM) regression, Random) Nearest Neighbor (Nearest Neighbor) analysis and Adaptive
 (also referred to as
 ) Classified) and their performance was evaluated using four error metrics, as shown below in table 3.
TABLE 3

Selecting two prediction factors Adaptive with highest performance And Random
 Maturity prediction was performed, and the results are shown in fig. 20A and 20B. Will apply
 Method (as shown in FIG. 20A) and Random
 The predicted results of the method (as shown in fig. 20B) are plotted against the known values of the clay materials (illite (C1), kaolinite (C2), montmorillonite (C3)) and kerogen extracted at different maturity in ascending order (sample 3A (C7),
 sample 1A (C4), sample 2A (C5 and C6) and sample 4A (C8)).
As previously discussed, the maturity levels of source rocks and kerogen are represented by several quantities such as vitrinite reflectance (Ro%), Hydrogen Index (HI), pyrolysis Tmax, and atomic H/C ratio. In such an example, the ratio of Hydrogen Index (HI) to vitrinite reflectance (Ro%) is selected as a predictor of maturity. Adaptive And Random
 Regression models were used to predict the HI-Ro% index for various samples. FIG. 21 shows the maturity index obtained by two different learning algorithms (adaptive) compared to the maturity index obtained by processing various source rocks by conventional methods
 Method and Random
 Method) maturity index (HI-Ro% ratio) predicted from FTIR spectra of hydrocarbon source rock samples. As shown in fig. 21, these models provide extremely high predictability of sample maturity.
Although these examples have been described using FTIR data, the methods may be applied to other data obtained from THz, ESR and fluorescence spectra, as well as other spectral and optical measurements of hydrocarbon source rocks.
Example 4
Examples of components of the data acquisition device, the pyroelectric detector, are depicted in fig. 22A and 22B. Pyroelectric detectors are not sensitive to high background temperatures; and they respond only to temperature changes, making them suitable for downhole applications. FIG. 22A shows a simplified thermal model, while FIG. 22B shows an equivalent circuit, where α is the absorption coefficient and H isPIs heat capacity, GTIs the thermal conductivity, TAIs the ambient temperature. As the amount of light changes due to reflection/transmission into the sample, the amount of heat generated will change, making the charge change in the pyroelectric material (e.g., lithium tantalate) small. As shown in fig. 22A, the radiation flux ΦSIs absorbed and causes a temperature deltaT in the thermoelectric elementPA change in (c). The thermoelectric conversion is due to the thermoelectric effect, and thus the temperature change Δ TPChange the charge density DeltaQ on the electrodeP. As shown in fig. 22B, electrical conversion is then often performed, in which the signal is amplified and converted into a voltage. Equation 1 gives the temperature difference for the small circuit shown in fig. 22B.

When α τ isFMaximum and GTAnd HPAt minimum,. DELTA.TPWill be maximized. In practice, a compromise will be required. In some applications, trace detection requires a large signal-to-noise ratio, while in other applications, high spectral resolution is required, for example for clay identification. Depending on the application, the reported signal-to-noise ratio is 10000 to 100, where tunable filters in the collimation geometry can achieve high signal-to-noise ratio and the focusing optics can achieve high spectral resolution.
Fig. 23 shows a device 2300 containing a commercial pyroelectric detector integrated with a tunable filter. The filter 2301 may be tuned to the particular wavelength of interest: kaolinite is 2703nm, aliphatic is 3496nm, montmorillonite is 2923nm, and so on. In one embodiment, filter 2301 may be a wideband filter. The device further comprises a movable reflector 2302 and a fixed reflector 2303. The device includes a pyroelectric detector 2304, the pyroelectric detector 2304 consisting of an array of several pyroelectric elements each having a fixed filter tuned for a specific wavelength, thus eliminating the need for relatively fragile MEMS mechanical structures for tuning. Such a weak mechanical structure would make the sensor unsuitable for deployment in a downhole tool, especially if the interior of the tool is pressure compensated and filled with an insulating liquid. The pyroelectric detector 2304 is coupled to a circuit 2305. The device further comprises a control electrode 2306 and a spring suspension 2307.
Fig. 24 and 25 depict two configurations of sample measurement. In this embodiment, an Attenuated Total Reflectance (ATR) method is selected. A single reflective ATR cell 2400 is depicted in fig. 24, where the IR beam 2401 from the spectrometer is internally reflected in the ATR crystal 2402 and interacts with the sample 2403 at the crystal interface. The reflected IR beam 2404 is analyzed to determine the interaction of the evanescent wave with the sample and obtain an absorption spectrum. As shown in fig. 25, a waveguide technique with multiple reflections occurs in the ATR unit 2500. The incident beam 2501 undergoes multiple internal reflections inside the ATR element 2502, which is composed of a special prism. A broad sample interface may provide greater contact with the sample 2503 and may be used for weak absorbents and dilute samples. The outgoing infrared beam 2504 is directed to a detector in an infrared spectrometer. The detector records the IR beam and generates an infrared spectrum. Fig. 8A and 8B are examples of infrared spectra of several source rock samples and pure clay. Kaolinite, illite and sodium montmorillonite (montmorillonite) have unique peaks. By looking at 3800cm-1To 3000cm-1These clays can be distinguished for each particular clay wavenumber within the range. Kaolinite is 3400cm-1Two obvious peaks are nearby, and illite is in 3450cm-1Has a peak, and then has a peak length of 3200cm-1There is a broad peak.
Example 5
In situ Gas (GIP) is the volume of gas stored within a particular bulk reservoir rock volume. As the cuttings are transported to the surface, some of the gas escapes into the drilling mud. This amount of gas loss can lead to GIP estimation errors. Fig. 26 is a schematic diagram of a GIP data acquisition device using a pyroelectric sensor. Apparatus 2600 has gas inlet 2601 and gas outlet 2602For managing the entry and exit of a gas sample through gas sample chamber 2603. A light source 2604 is placed at one end of gas sample chamber 2603 and a pyroelectric detector 2605 is placed at the other end of gas sample chamber 2603. Selected sensors perform well at high temperatures and the footprint of the apparatus has been reduced to fit in a Logging While Drilling (LWD) tool or a Production Logging Tool (PLT). The cost of this identification is also significantly reduced compared to current GCMS devices, and some GCMS devices are large and not suitable for high temperature use. In situ measurements of gas released from the drilling fluid or cuttings may be made to estimate the appropriate reserves and determine the maturity of the source layer. Fig. 27A, 27B, and 27C are photographs of laboratory prototypes of the GIP data acquisition device 2600, the light source 2604, and the pyroelectric detector 2605, respectively. Fig. 28A and 28B are an IR spectrum obtained using ethane and an associated system calibration spectrum, respectively. Preliminary results indicate that the sensitivity of the system is three parts per million (3 mg/l) and that C can also be detected1-C4And ratios thereof.
The devices described in these examples provide IR spectral information about downhole rock and fluids in situ and at near reservoir conditions. This information includes mineralogy, free water in clay versus confined water, maturity. It can detect asphalt and tar pitch. It can distinguish between aromatic hydrocarbons and aliphatic hydrocarbons. It can detect the composition of the wellbore fluid. In-situ measurements are difficult to perform due to the poor high temperature performance of the semiconductor materials used in the photodetectors. The dimensional requirements do not allow in situ measurements to be made using large laboratory scale equipment. The present disclosure addresses the temperature problem by using pyroelectric sensors and miniaturizes the spectrometer by using an integrated tunable filter. The package can be installed in a wireline tool and is inexpensive, and therefore can be deployed in permanent sensing applications.
Example 6
Described herein are devices for facilitating sampling of drilling fluids/solids suitable for LWD applications as well as in well logging. Fig. 29 is a schematic diagram of a sampling apparatus 2900. The apparatus 2900 includes a sample inlet 2902 and a sample acquisition chamber 2904. The sampling inlet 2902 is designed to allow passage of the sample retrieval device and samples from the environment of the device. Sample inlet 2902 may be designed to accommodate filters to obtain certain sized samples or fluids. Sample acquisition chamber 2904 may be equipped to store sample 2906 until further processing without loss of integrity. Sample acquisition chamber 2904 may be equipped to contact the sample with an in situ data acquisition device for further processing.
Further modifications and alternative embodiments of various aspects of the devices and methods disclosed herein will be apparent to those skilled in the art in view of this description. Accordingly, this description is to be construed as illustrative only and is for the purpose of teaching those skilled in the art the general manner of carrying out the embodiments. It is to be understood that the forms of the embodiments shown and described herein are to be taken as examples of the embodiments. Elements and materials may be substituted for those illustrated and described herein, parts and processes may be reversed or omitted, and certain features of the embodiments may be utilized independently, all as would be apparent to one skilled in the art after having the benefit of the description of the embodiments. Changes may be made in the elements described herein without departing from the spirit and scope of the embodiments as described in the following claims.
The foregoing description of the method, apparatus and results obtained using them is by way of example only. The description of the methods is not intended to require or imply that the steps of the various embodiments must be performed in the order presented. As will be appreciated by one of ordinary skill in the art, the steps in the foregoing embodiments may be performed in any order. Words such as "then" are not intended to limit the order of the steps. These words are merely used to guide the reader through the description of the methods. Many of the operations can be performed in parallel or concurrently. In addition, the order of the operations may be rearranged. A process may correspond to a method, a function, a procedure, a subroutine, a subprogram, etc. When a procedure corresponds to a function, its termination may correspond to a return of the function to the calling function or the main function. Various modifications to these embodiments will be readily apparent to those skilled in the art, and the generic principles defined herein may be applied to other embodiments without departing from the spirit or scope of the disclosure.
Claims (30)
1. A computer-implemented method of determining maturity of a sample source rock, the method comprising the steps of:
establishing, by a data analysis engine, a communication link with a source rock database and a plurality of data acquisition devices positioned proximate to a sample source rock, the source rock database comprising a first plurality of data obtained from a plurality of representative source rocks and a plurality of attributes of the plurality of representative source rocks;
obtaining, by the data analysis engine, a second plurality of data of a sample source rock from the plurality of data acquisition devices; and
analyzing, by the data analysis engine, the second plurality of data using predictive correlations to determine maturity of the sample source rock, the analyzing including determining a spectral wavenumber band of at least one of the first plurality of data and the plurality of attributes to distinguish each type of a plurality of representative source rocks, the determining including calculating weights for a plurality of wavenumber points of the spectral wavenumber band, the weights based on sensitivity of the plurality of wavenumber points of the spectral wavenumber band to at least one of the plurality of attributes,
wherein the predictive correlations are generated by the data analysis engine by applying a machine learning model to correlate the first plurality of data obtained from the plurality of representative source rocks with a plurality of attributes of the plurality of representative source rocks.
2. The computer-implemented method of claim 1, wherein the plurality of data acquisition devices comprises a spectrometer comprising a light source, a thermoelectric detector, and an assembly for reflecting light from the sample hydrocarbon source rock and directing the reflected light to the thermoelectric detector.
3. The computer-implemented method of claim 2, wherein the pyroelectric detector is integrated with a tunable filter.
4. The computer-implemented method of claim 2, wherein the component for reflecting light from the sample source rock and directing the reflected light to the pyroelectric detector is an attenuated total reflectance cell.
5. The computer-implemented method of claim 1 or claim 2, further comprising the steps of:
preparing the second plurality of data before the data analysis engine analyzes the second plurality of data by performing one or more of outlier detection, baseline correction, peak enhancement, and normalization.
6. The computer-implemented method of claim 1 or claim 2, further comprising the steps of:
storing, by the data analysis engine, the first plurality of data of sample source rocks and the determined maturity of the sample source rocks in a source rock database.
7. The computer-implemented method of claim 1 or claim 2, wherein the plurality of attributes of the plurality of representative source rocks comprises kerogen typing and elemental composition.
8. A computer-implemented method as in claim 1 or claim 2, wherein the first plurality of data comprises two or more of location data, spectral measurements, and optical measurements obtained from the plurality of representative source rocks.
9. The computer-implemented method of claim 8, wherein the spectral measurements include one or more of measurements obtained from fourier transform infrared spectroscopy, electron spin resonance spectroscopy, terahertz spectroscopy, and ultraviolet spectroscopy.
10. The computer-implemented method of claim 8, wherein the first plurality of data further comprises pyrolysis data.
11. The computer-implemented method of claim 10, wherein the pyrolysis data is by performing on the plurality of representative source rocks Pyrolytically analyzing to obtain.
12. A computer-implemented method as in claim 1 or claim 2, wherein the second plurality of data comprises two or more of location data, spectral measurements, and optical measurements obtained from the sample source rock.
13. The computer-implemented method of claim 12, wherein the spectral measurements include one or more of measurements obtained from fourier transform infrared spectroscopy, electron spin resonance spectroscopy, terahertz spectroscopy, and ultraviolet spectroscopy.
14. The computer-implemented method of claim 12, wherein the optical measurements comprise one or more of measurements obtained by a fluorescence microscope and a confocal laser scanning microscope.
15. The computer-implemented method of claim 1 or claim 2, wherein the machine learning model is based on a support vector machine, Random One or more of a logistic regression and an adaptive boosting algorithm.
16. The computer-implemented method of claim 1 or claim 2, further comprising the steps of:
selecting spectral wavenumber bands for operation of the plurality of data acquisition devices in the vicinity of the sample source rock.
17. The computer-implemented method of claim 16, wherein the spectral wavenumber bands of the sample source rock are selected in response to receiving, by the data analysis engine, one or more selections of a desired maturity and a desired organic phase distribution of the sample source rock from a user interface.
18. A system for determining the maturity of a sample source rock, the system comprising:
a plurality of data acquisition devices placed in proximity to the sample source rock and communicatively coupled to the computing device;
the computing device is coupled to a source rock database via a communication network and is configured to:
obtaining a first plurality of data of a sample source rock from the plurality of data acquisition devices; and
analyzing the first plurality of data using predictive correlations to determine maturity of the sample source rock, wherein analyzing the first plurality of data comprises determining a spectral wavenumber band of at least one of the first plurality of data and a plurality of attributes to distinguish each type of a plurality of representative source rocks, the determining comprising calculating weights for a plurality of wavenumber points of the spectral wavenumber band, the weights based on sensitivity of the plurality of wavenumber points of the spectral wavenumber band to at least one of the plurality of attributes,
wherein the predictive correlations are generated by applying a machine learning model to correlate a second plurality of data obtained from a plurality of representative source rocks with a plurality of attributes of the plurality of representative source rocks; and
the source rock database comprising the second plurality of data associated with the plurality of representative source rocks, a plurality of attributes of the plurality of representative source rocks, and the predicted correlation.
19. The system of claim 18, wherein the plurality of data acquisition devices are positioned to obtain data from an optimal sensing band of the sample source rock.
20. The system of claim 18 or claim 19, further comprising: a sample source rock retrieval device to obtain a portion of the sample source rock.
21. The system of claim 18 or claim 19, wherein the plurality of data acquisition devices are positioned to obtain two or more of position data, spectroscopic measurements, and optical measurements.
22. The system of claim 21, wherein the spectral measurements comprise one or more of measurements obtained from fourier transform infrared spectroscopy, electron spin resonance spectroscopy, terahertz spectroscopy, and ultraviolet spectroscopy.
23. The system of claim 21, wherein the optical measurements comprise one or more of measurements obtained by a fluorescence microscope and a confocal laser scanning microscope.
24. The system of claim 18 or claim 19, wherein the plurality of data acquisition devices comprises a spectrometer comprising a light source, a thermoelectric detector, and an assembly for reflecting light from the sample hydrocarbon source rock and directing the reflected light to the thermoelectric detector.
25. The system of claim 24, wherein the pyroelectric detector is integrated with a tunable filter.
26. The system of claim 24, wherein the component for reflecting light from the sample source rock and directing the reflected light to the pyroelectric detector is an attenuated total reflectance cell.
27. A system for determining the maturity of a sample source rock, the system comprising:
an in situ gas data acquisition device placed proximate to the sample hydrocarbon source rock and communicatively coupled to the computing device;
the computing device is coupled to a source rock database via a communication network and is configured to:
obtaining a first plurality of data of a sample hydrocarbon source rock from the in situ gas data acquisition device; and
analyzing the first plurality of data using predictive correlations to determine maturity of the sample source rock, wherein analyzing the first plurality of data comprises determining a spectral wavenumber band of at least one of the first plurality of data and a plurality of attributes to distinguish each type of a plurality of representative source rocks, the determining comprising calculating weights for a plurality of wavenumber points of the spectral wavenumber band, the weights based on sensitivity of the plurality of wavenumber points of the spectral wavenumber band to at least one of the plurality of attributes,
wherein the predictive correlations are generated by applying a machine learning model to correlate a second plurality of data obtained from a plurality of representative source rocks with a plurality of attributes of the plurality of representative source rocks; and
the source rock database comprising the second plurality of data associated with the plurality of representative source rocks, a plurality of attributes of the plurality of representative source rocks, and the predicted correlation.
28. The system of claim 27, wherein the in situ gas data acquisition device comprises a spectrometer comprising a light source, a pyroelectric detector, a gas inlet, a gas outlet, and a sample cell.
29. The system of claim 27 or claim 28, wherein the field gas data acquisition device is deployed as part of a logging-while-drilling assembly.
30. The system of claim 27 or claim 28, wherein the in situ gas data acquisition device is deployed as part of a wireline logging assembly.
Applications Claiming Priority (3)
| Application Number | Priority Date | Filing Date | Title |
|---|---|---|---|
| US201762471274P | 2017-03-14 | 2017-03-14 | |
| US62/471,274 | 2017-03-14 | ||
| PCT/US2018/022293 WO2018170035A1 (en) | 2017-03-14 | 2018-03-14 | Collaborative sensing and prediction of source rock properties |
Publications (2)
| Publication Number | Publication Date |
|---|---|
| CN110662962A CN110662962A (en) | 2020-01-07 |
| CN110662962B true CN110662962B (en) | 2022-05-17 |
Family
ID=61906837
Family Applications (1)
| Application Number | Title | Priority Date | Filing Date |
|---|---|---|---|
| CN201880032114.0A Expired - Fee Related CN110662962B (en) | 2017-03-14 | 2018-03-14 | System and method for sensing and predicting maturity of source rock |
Country Status (5)
| Country | Link |
|---|---|
| US (1) | US11352879B2 (en) |
| EP (1) | EP3596638A1 (en) |
| CN (1) | CN110662962B (en) |
| CA (1) | CA3055385A1 (en) |
| WO (1) | WO2018170035A1 (en) |
Families Citing this family (37)
| Publication number | Priority date | Publication date | Assignee | Title |
|---|---|---|---|---|
| US11814931B2 (en) * | 2018-05-31 | 2023-11-14 | Schlumberger Technology Corporation | Machine-learning for sedimentary facies prediction |
| CN109783913B (en) * | 2018-12-30 | 2023-07-14 | 中铁十四局集团有限公司 | Tunnel support structure selection method and device |
| CN109613213B (en) * | 2019-01-14 | 2021-04-06 | 中南大学 | Multifunctional hydrocarbon-formation diagenetic high-temperature high-pressure simulation experiment device and use method thereof |
| CN111580179B (en) * | 2019-01-30 | 2023-02-28 | 中国石油天然气股份有限公司 | Method, device and system for determining organic carbon content |
| US11002721B2 (en) * | 2019-02-20 | 2021-05-11 | Saudi Arabian Oil Company | Automated organic petrology |
| GB2582294B (en) * | 2019-03-13 | 2021-04-14 | Equinor Energy As | Prediction of reservoir fluid properties from mud-gas data |
| US10830027B2 (en) | 2019-04-15 | 2020-11-10 | Saudi Arabian Oil Company | System and method to evaluate kerogen-rich shale |
| WO2020210870A1 (en) * | 2019-04-17 | 2020-10-22 | Swinburne University Of Technology | A system and method for asbestos identification |
| CN110108856B (en) * | 2019-05-16 | 2021-07-06 | 中国石油化工股份有限公司 | Method for predicting maturity of organic matters of hydrocarbon source rock under overpressure background |
| EP3745442A1 (en) * | 2019-05-29 | 2020-12-02 | FEI Company | Method of examining a sample using a charged particle microscope |
| CN110412145B (en) * | 2019-06-11 | 2022-03-01 | 中国石油天然气股份有限公司 | Method for determining lithology of hydrocarbon source rock |
| CN112113990B (en) * | 2019-06-20 | 2024-04-09 | 中国石油化工股份有限公司 | Diagenetic fluid source identification method and diagenetic fluid source identification system based on micro-region in-situ element allocation |
| US10515715B1 (en) | 2019-06-25 | 2019-12-24 | Colgate-Palmolive Company | Systems and methods for evaluating compositions |
| CN112327357A (en) * | 2019-08-05 | 2021-02-05 | 中国石油天然气股份有限公司 | Method and device for predicting maturity of hydrocarbon source rock based on three-dimensional seismic data |
| JP7371906B2 (en) | 2019-12-20 | 2023-10-31 | 東海電子株式会社 | Gas analysis systems and programs |
| CN110988997A (en) * | 2019-12-27 | 2020-04-10 | 中国海洋石油集团有限公司 | Hydrocarbon source rock three-dimensional space distribution quantitative prediction technology based on machine learning |
| US11339651B2 (en) | 2020-02-13 | 2022-05-24 | Saudi Arabian Oil Company | Systems and methods for generating continuous grain size logs from petrographic thin section images |
| US11686876B2 (en) * | 2020-02-18 | 2023-06-27 | Saudi Arabian Oil Company | Geological core laboratory systems and methods |
| US11454112B2 (en) | 2020-03-31 | 2022-09-27 | Saudi Arabian Oil Company | System and method of typing heterogeneous reservoir rocks |
| US11636352B2 (en) * | 2020-05-13 | 2023-04-25 | Saudi Arabian Oil Company | Integrated advanced visualization tool for geosteering underbalanced coiled tubing drilling operations |
| CN112304799B (en) * | 2020-06-24 | 2021-06-22 | 成都理工大学 | Method for quantitatively analyzing organic matters in different occurrence states of shale oil reservoir |
| WO2022005474A1 (en) * | 2020-07-01 | 2022-01-06 | Chevron U.S.A. Inc. | Spectroscopic analysis of rocks |
| US11891882B2 (en) | 2020-07-17 | 2024-02-06 | Landmark Graphics Corporation | Classifying downhole test data |
| CN111999260B (en) * | 2020-08-03 | 2023-04-21 | 自然资源实物地质资料中心 | Method for identifying spodumene-containing pegmatite by thermal infrared spectroscopy and application of thermal infrared spectroscopy |
| AU2021342788A1 (en) * | 2020-09-16 | 2023-05-11 | Enersoft Inc. | Multiple-sensor analysis of geological samples |
| US11542815B2 (en) | 2020-11-30 | 2023-01-03 | Saudi Arabian Oil Company | Determining effect of oxidative hydraulic fracturing |
| US11942190B2 (en) | 2021-02-04 | 2024-03-26 | Saudi Arabian Oil Company | Method and system for evaluating reactivity in source rock evaluation |
| US11681072B2 (en) | 2021-02-04 | 2023-06-20 | Saudi Arabian Oil Company | Method and system for ranking reactivities for kinetics assignment in basin modeling |
| CN113064217B (en) * | 2021-03-26 | 2022-06-17 | 中国石油大学(北京) | Hydrocarbon source rock effectiveness evaluation model construction method and hydrocarbon source rock effectiveness evaluation method |
| CN113094641B (en) * | 2021-06-04 | 2021-10-08 | 北京建筑大学 | K-nearest neighbor rock burst prediction method and device based on big data visualization analysis |
| CN113484291B (en) * | 2021-06-24 | 2022-07-26 | 中国地质大学(武汉) | Method for determining oil gas filling time by utilizing maturity and storage medium |
| US11808909B2 (en) | 2021-08-20 | 2023-11-07 | Saudi Arabian Oil Company | System and method for predicting fluid type and thermal maturity |
| WO2023081011A1 (en) * | 2021-11-03 | 2023-05-11 | Schlumberger Technology Corporation | Methods and systems for predicting fluid type while geosteering |
| US11885790B2 (en) | 2021-12-13 | 2024-01-30 | Saudi Arabian Oil Company | Source productivity assay integrating pyrolysis data and X-ray diffraction data |
| CN114295651B (en) * | 2021-12-15 | 2024-03-15 | 东南大学 | Oilstone ratio detection method based on random forest model |
| CN116754696B (en) * | 2023-08-23 | 2023-11-03 | 中国石油天然气股份有限公司 | Detection method of high-maturity hydrocarbon source rock biomarker compound and application thereof |
| CN117672395B (en) * | 2024-01-31 | 2024-04-02 | 中国石油大学(华东) | Shale kerogen pyrolysis hydrocarbon generation simulation method and device and electronic equipment |
Citations (21)
| Publication number | Priority date | Publication date | Assignee | Title |
|---|---|---|---|---|
| GB1330804A (en) * | 1972-04-10 | 1973-09-19 | Continental Oil Co | Method and apparatus for source rock analysis |
| CN1419209A (en) * | 2001-11-13 | 2003-05-21 | 株式会社Ntt都科摩 | Service information providing system and method, and control station |
| US6629086B1 (en) * | 1998-11-30 | 2003-09-30 | Institut Francais Du Petrole | Method for interpreting petroleum characteristics of geological sediments |
| CN1820247A (en) * | 2003-05-07 | 2006-08-16 | 沙特阿拉伯石油公司 | Compositional modeling and pyrolysis data analysis methods |
| WO2009094064A1 (en) * | 2008-01-22 | 2009-07-30 | Exxonmobil Upstream Research Company | Dynamic connectivity analysis |
| CN101689102A (en) * | 2007-02-16 | 2010-03-31 | 沙特阿拉伯石油公司 | Method for determining volume of organic matter in reservoir rock |
| WO2010063570A1 (en) * | 2008-12-01 | 2010-06-10 | Anpa S.R.L. | Method and system for identifying rocks |
| CN101839899A (en) * | 2009-03-18 | 2010-09-22 | 中国石油天然气股份有限公司 | Oil gas analyzing method for carbonate hydrocarbon source rock |
| WO2011005353A1 (en) * | 2009-07-06 | 2011-01-13 | Exxonmobil Upstream Research Company | Method for seismic interpretation using seismic texture attributes |
| CN101949832A (en) * | 2010-09-02 | 2011-01-19 | 西安交通大学 | Fourier transform infrared spectrum distortion identifying and processing method |
| WO2011035391A1 (en) * | 2009-09-24 | 2011-03-31 | Commonwealth Scientific And Industrial Research Organisation | Method of contaminant prediction |
| CN102028454A (en) * | 2010-10-26 | 2011-04-27 | 浙江大学 | Mirror-image separation method and system based on group delay wavenumber carrier frequency |
| WO2011133421A2 (en) * | 2010-04-21 | 2011-10-27 | Baker Hughes Incorporated | Method of predicting source rock thermal maturity from log responses |
| WO2014006592A2 (en) * | 2012-07-04 | 2014-01-09 | Genie Ip B.V. | Mapping hydrocarbon liquid properties of a kerogencontaining source rock |
| WO2014113482A1 (en) * | 2013-01-15 | 2014-07-24 | Westerngeco Llc | Methods and computing systems for survey design and modeling workflow for towed multimeasurement seismic streamer data |
| CN104198677A (en) * | 2014-09-01 | 2014-12-10 | 中国石油大学(华东) | Method for restoring original cracking potential of source rock |
| CN105064984A (en) * | 2015-06-29 | 2015-11-18 | 中国石油天然气股份有限公司 | Method for determining extinction time and depth of independent oil phases during ancient oil reservoir cracking process |
| CN105242026A (en) * | 2015-10-28 | 2016-01-13 | 中国石油化工股份有限公司 | Method for identifying source of gas reservoir |
| CN105247546A (en) * | 2013-06-10 | 2016-01-13 | 埃克森美孚上游研究公司 | Determining well parameters for optimization of well performance |
| CN205049133U (en) * | 2015-10-19 | 2016-02-24 | 中铁城际规划建设有限公司 | Tunnel surrouding rock deformation dynamic monitoring system |
| CN105758703A (en) * | 2016-02-22 | 2016-07-13 | 中国科学院武汉岩土力学研究所 | Rock mechanics cloud experiment system |
Family Cites Families (34)
| Publication number | Priority date | Publication date | Assignee | Title |
|---|---|---|---|---|
| AT378663B (en) * | 1984-03-16 | 1985-09-10 | Steyr Daimler Puch Ag | RECEIVING DEVICE FOR LOADING VEHICLES OR THE LIKE. |
| JPS60163352U (en) * | 1984-04-07 | 1985-10-30 | 株式会社 堀場製作所 | gas analyzer |
| US6074730A (en) * | 1997-12-31 | 2000-06-13 | The Boc Group, Inc. | Broad-band antireflection coating having four sputtered layers |
| AU2002363073A1 (en) | 2001-10-24 | 2003-05-06 | Shell Internationale Research Maatschappij B.V. | Method and system for in situ heating a hydrocarbon containing formation by a u-shaped opening |
| US20050043630A1 (en) * | 2003-08-21 | 2005-02-24 | Buchert Janusz Michal | Thermal Emission Non-Invasive Analyte Monitor |
| CN100470235C (en) * | 2004-12-28 | 2009-03-18 | 中国石油化工股份有限公司 | Method for measuring content of dialkene in gasoline through spectrum of near infrared light |
| CA2660481A1 (en) * | 2006-08-09 | 2008-02-14 | The University Of Queensland | Characterisation of geological materials by thermally induced response |
| US8164061B2 (en) * | 2006-09-13 | 2012-04-24 | Delphi Technologies, Inc. | Method and apparatus for a universal infrared analyzer |
| US7799211B2 (en) * | 2006-10-20 | 2010-09-21 | Saudi Arabian Oil Company | Process for upgrading whole crude oil to remove nitrogen and sulfur compounds |
| US7853045B2 (en) | 2007-10-31 | 2010-12-14 | Saudi Arabian Oil Company | Geostatistical analysis and classification of core data |
| US8073623B2 (en) | 2008-01-04 | 2011-12-06 | Baker Hughes Incorporated | System and method for real-time quality control for downhole logging devices |
| EP2283373B1 (en) * | 2008-04-28 | 2021-03-10 | Cornell University | Accurate quantification of magnetic susceptibility in molecular mri |
| EP2304174A4 (en) * | 2008-05-22 | 2015-09-23 | Schlumberger Technology Bv | Downhole measurement of formation characteristics while drilling |
| US20100313633A1 (en) * | 2009-06-11 | 2010-12-16 | Schlumberger Technology Corporation | Estimating effective permeabilities |
| US8738295B2 (en) | 2010-05-05 | 2014-05-27 | Conocophillips Company | Shale analysis methods |
| WO2011149609A1 (en) * | 2010-05-28 | 2011-12-01 | Exxonmobil Upstream Research Company | Method for seismic hydrocarbon system analysis |
| US20130262069A1 (en) | 2012-03-29 | 2013-10-03 | Platte River Associates, Inc. | Targeted site selection within shale gas basins |
| GB201210480D0 (en) | 2012-06-13 | 2012-07-25 | Adrok Ltd | Methods for determining material and/or subsurface composition |
| US9739729B2 (en) | 2012-09-07 | 2017-08-22 | Carl Zeiss X-ray Microscopy, Inc. | Combined confocal X-ray fluorescence and X-ray computerised tomographic system and method |
| MX347211B (en) | 2012-09-13 | 2017-04-19 | Halliburton Energy Services Inc | Spatial heterodyne integrated computational element ( sh-ice) spectrometer. |
| AU2013323430B2 (en) * | 2012-09-26 | 2017-12-21 | Malvern Panalytical Inc. | Multi-sensor analysis of complex geologic materials |
| CA2895400C (en) | 2013-01-25 | 2017-12-05 | Landmark Graphics Corporation | Well integrity management using coupled engineering analysis |
| US20150066460A1 (en) * | 2013-08-30 | 2015-03-05 | Jimmy Klinger | Stratigraphic function |
| CN103630669B (en) * | 2013-12-16 | 2016-03-30 | 中国石油天然气股份有限公司 | Unconventional densification and shale reservoir oil bearing evaluation experimental technique |
| US9593983B2 (en) * | 2014-09-04 | 2017-03-14 | Schlumberger Technology Corporation | Measuring hydrocarbon content of a rock formation downhole using laser-induced vaporization and pyrolysis |
| US10094815B2 (en) | 2014-09-18 | 2018-10-09 | Exxonmobil Upstream Research Company | Method to enhance exploration, development and production of hydrocarbons using multiply substituted isotopologue geochemistry, basin modeling and molecular kinetics |
| US10494923B2 (en) * | 2014-09-18 | 2019-12-03 | Exxonmobil Upstream Research Company | Method to perform hydrocarbon system analysis for exploration, production and development of hydrocarbons |
| US10113952B2 (en) * | 2015-06-01 | 2018-10-30 | Ingrain, Inc. | Combined vibrational spectroscopy and laser induced breakdown spectroscopy for improved mineralogical and geochemical characterization of petroleum source or reservoir rocks |
| CN105138749B (en) * | 2015-08-12 | 2018-06-01 | 中国石油天然气股份有限公司 | The original organic carbon restoration methods of highly mature source rock under a kind of geological constraining |
| US20190227087A1 (en) * | 2015-11-02 | 2019-07-25 | Schlumberger Technology Corporation | Cloud-based digital rock analysis and database services |
| CN105784554A (en) * | 2016-04-20 | 2016-07-20 | 广东工业大学 | PM2.5 detector based on WeChat and WeChat interaction method |
| US10534107B2 (en) * | 2016-05-13 | 2020-01-14 | Gas Sensing Technology Corp. | Gross mineralogy and petrology using Raman spectroscopy |
| CN106355011B (en) * | 2016-08-30 | 2018-11-20 | 有色金属矿产地质调查中心 | Geochemical data element sequence structure analysis method and device |
| US10215690B2 (en) * | 2017-01-04 | 2019-02-26 | Schlumberger Technology Corporation | Method for estimating a value of a kerogen property in subsurface formations |
-
2018
- 2018-03-14 EP EP18716034.6A patent/EP3596638A1/en not_active Withdrawn
- 2018-03-14 CN CN201880032114.0A patent/CN110662962B/en not_active Expired - Fee Related
- 2018-03-14 US US15/921,003 patent/US11352879B2/en active Active
- 2018-03-14 CA CA3055385A patent/CA3055385A1/en active Pending
- 2018-03-14 WO PCT/US2018/022293 patent/WO2018170035A1/en unknown
Patent Citations (22)
| Publication number | Priority date | Publication date | Assignee | Title |
|---|---|---|---|---|
| FR2180288A5 (en) * | 1972-04-10 | 1973-11-23 | Continental Oil Co | |
| GB1330804A (en) * | 1972-04-10 | 1973-09-19 | Continental Oil Co | Method and apparatus for source rock analysis |
| US6629086B1 (en) * | 1998-11-30 | 2003-09-30 | Institut Francais Du Petrole | Method for interpreting petroleum characteristics of geological sediments |
| CN1419209A (en) * | 2001-11-13 | 2003-05-21 | 株式会社Ntt都科摩 | Service information providing system and method, and control station |
| CN1820247A (en) * | 2003-05-07 | 2006-08-16 | 沙特阿拉伯石油公司 | Compositional modeling and pyrolysis data analysis methods |
| CN101689102A (en) * | 2007-02-16 | 2010-03-31 | 沙特阿拉伯石油公司 | Method for determining volume of organic matter in reservoir rock |
| WO2009094064A1 (en) * | 2008-01-22 | 2009-07-30 | Exxonmobil Upstream Research Company | Dynamic connectivity analysis |
| WO2010063570A1 (en) * | 2008-12-01 | 2010-06-10 | Anpa S.R.L. | Method and system for identifying rocks |
| CN101839899A (en) * | 2009-03-18 | 2010-09-22 | 中国石油天然气股份有限公司 | Oil gas analyzing method for carbonate hydrocarbon source rock |
| WO2011005353A1 (en) * | 2009-07-06 | 2011-01-13 | Exxonmobil Upstream Research Company | Method for seismic interpretation using seismic texture attributes |
| WO2011035391A1 (en) * | 2009-09-24 | 2011-03-31 | Commonwealth Scientific And Industrial Research Organisation | Method of contaminant prediction |
| WO2011133421A2 (en) * | 2010-04-21 | 2011-10-27 | Baker Hughes Incorporated | Method of predicting source rock thermal maturity from log responses |
| CN101949832A (en) * | 2010-09-02 | 2011-01-19 | 西安交通大学 | Fourier transform infrared spectrum distortion identifying and processing method |
| CN102028454A (en) * | 2010-10-26 | 2011-04-27 | 浙江大学 | Mirror-image separation method and system based on group delay wavenumber carrier frequency |
| WO2014006592A2 (en) * | 2012-07-04 | 2014-01-09 | Genie Ip B.V. | Mapping hydrocarbon liquid properties of a kerogencontaining source rock |
| WO2014113482A1 (en) * | 2013-01-15 | 2014-07-24 | Westerngeco Llc | Methods and computing systems for survey design and modeling workflow for towed multimeasurement seismic streamer data |
| CN105247546A (en) * | 2013-06-10 | 2016-01-13 | 埃克森美孚上游研究公司 | Determining well parameters for optimization of well performance |
| CN104198677A (en) * | 2014-09-01 | 2014-12-10 | 中国石油大学(华东) | Method for restoring original cracking potential of source rock |
| CN105064984A (en) * | 2015-06-29 | 2015-11-18 | 中国石油天然气股份有限公司 | Method for determining extinction time and depth of independent oil phases during ancient oil reservoir cracking process |
| CN205049133U (en) * | 2015-10-19 | 2016-02-24 | 中铁城际规划建设有限公司 | Tunnel surrouding rock deformation dynamic monitoring system |
| CN105242026A (en) * | 2015-10-28 | 2016-01-13 | 中国石油化工股份有限公司 | Method for identifying source of gas reservoir |
| CN105758703A (en) * | 2016-02-22 | 2016-07-13 | 中国科学院武汉岩土力学研究所 | Rock mechanics cloud experiment system |
Non-Patent Citations (4)
| Title |
|---|
| Application of extreme learning machine and neural networks in total organic carbon content prediction in organic shale with wire line logs;Xian Shi et al;<Journal of Natural Gas Science and Engineering>;20160524;第33卷;第687-702页 * |
| Artificial neuralnetworkmodelingandclusteranalysisfororganicfaciesandburial historyestimationusingwelllogdata:AcasestudyoftheSouthPars Gas Field,PersianGulf,Iran;Bahram Alizadeh et al;《Computers &Geosciences》;20111223;第45卷;第261-269页 * |
| Forcasting PVT properties of crude oil systems based on support vector machines modeling scheme;EL SEBAKHY E A et al;《Journal of petroleum science and engineering》;20090201;第64卷(第1-4期);第25-34页 * |
| Full field reservoir modeling of shale assets using advanced data-driven analytics;Soodabeh Esmaili et al;《Geoscience Frontiers》;20150123;第7卷(第1期);第11-20页 * |
Also Published As
| Publication number | Publication date |
|---|---|
| CN110662962A (en) | 2020-01-07 |
| WO2018170035A8 (en) | 2018-10-11 |
| US11352879B2 (en) | 2022-06-07 |
| WO2018170035A1 (en) | 2018-09-20 |
| CA3055385A1 (en) | 2018-09-20 |
| US20180347354A1 (en) | 2018-12-06 |
| EP3596638A1 (en) | 2020-01-22 |
Similar Documents
| Publication | Publication Date | Title |
|---|---|---|
| CN110662962B (en) | System and method for sensing and predicting maturity of source rock | |
| US11650348B2 (en) | Model based discriminant analysis | |
| US9322268B2 (en) | Methods for reservoir evaluation employing non-equilibrium compositional gradients | |
| Craddock et al. | Kerogen thermal maturity and content of organic-rich mudrocks determined using stochastic linear regression models applied to diffuse reflectance IR Fourier transform spectroscopy (DRIFTS) | |
| CN111033227A (en) | Photoacoustic gas detection | |
| CN105938099A (en) | Rock character judging method and system based on laser-induced breakdown spectroscopy | |
| RU2657055C2 (en) | Characterising wellbore depth interval from rock fragments | |
| AU2012387158B2 (en) | Methods of predicting a reservoir fluid behavior using an equation of state | |
| Craddock et al. | Universal curves describing the chemical and physical evolution of type II kerogen during thermal maturation | |
| US20230020895A1 (en) | Fluid optical database reconstruction methods and applications thereof | |
| Mullins et al. | Oil reservoir characterization via crude oil analysis by downhole fluid analysis in oil wells with visible− Near-infrared spectroscopy and by laboratory analysis with electrospray ionization Fourier transform ion cyclotron resonance mass spectrometry | |
| Zhang et al. | Detection of oil yield from oil shale based on near-infrared spectroscopy combined with wavelet transform and least squares support vector machines | |
| WO2011077271A1 (en) | Methods and apparatus for characterization of a petroleum reservoir employing compositional analysis of fluid samples and rock core extract | |
| Nandakumar et al. | Hydrocarbon fluid inclusions, API gravity of oil, signature fluorescence emissions and emission ratios: an example from Mumbai offshore, India | |
| Raupov et al. | Experience in the application of hydrocarbon optical studies in oil field development | |
| NO20210785A1 (en) | Determining reservoir fluid properties from downhole fluid analysis data using machine learning | |
| CA2843243A1 (en) | Estimating oil viscosity | |
| Miao et al. | Discriminating the mineralogical composition in drill cuttings based on absorption spectra in the terahertz range | |
| Jones et al. | In situ methane determination in petroleum at high temperatures and high pressures with multivariate optical computing | |
| Liu et al. | Novel Method for Determining Irreducible Water Saturation in a Tight Sandstone Reservoir Based on the Nuclear Magnetic Resonance T 2 Distribution | |
| Eriksen et al. | Field Tests of a New Optical Sensor Based on Integrated Computational Elements for Downhole Fluid Analysis | |
| Venkataramanan et al. | Downhole fluid analysis and fluid-comparison algorithm as aid to reservoir characterization | |
| Sanjuan et al. | Terahertz Dielectric Permittivity Anisotropy and Fabric of Oil Shales: Comparison to Acoustic, Magnetic Susceptibility, and X-ray Microtomography Results | |
| San Roman Alerigi et al. | Integrated Multi-Frequency Characterization of Sandstone Rocks | |
| US10018994B2 (en) | Method for designing a high sensitivity integrated computational element |
Legal Events
| Date | Code | Title | Description |
|---|---|---|---|
| PB01 | Publication | ||
| PB01 | Publication | ||
| SE01 | Entry into force of request for substantive examination | ||
| SE01 | Entry into force of request for substantive examination | ||
| GR01 | Patent grant | ||
| GR01 | Patent grant | ||
| CF01 | Termination of patent right due to non-payment of annual fee |
Granted publication date: 20220517 |
|
| CF01 | Termination of patent right due to non-payment of annual fee |