CN110383714B - Noiseless measurement of spectral shape of modulated signal using spectral correlation - Google Patents
Noiseless measurement of spectral shape of modulated signal using spectral correlation Download PDFInfo
- Publication number
- CN110383714B CN110383714B CN201880015245.8A CN201880015245A CN110383714B CN 110383714 B CN110383714 B CN 110383714B CN 201880015245 A CN201880015245 A CN 201880015245A CN 110383714 B CN110383714 B CN 110383714B
- Authority
- CN
- China
- Prior art keywords
- signal
- spectral
- optical
- data
- frequency
- Prior art date
- Legal status (The legal status is an assumption and is not a legal conclusion. Google has not performed a legal analysis and makes no representation as to the accuracy of the status listed.)
- Active
Links
Images


Classifications
-
- H—ELECTRICITY
- H04—ELECTRIC COMMUNICATION TECHNIQUE
- H04B—TRANSMISSION
- H04B10/00—Transmission systems employing electromagnetic waves other than radio-waves, e.g. infrared, visible or ultraviolet light, or employing corpuscular radiation, e.g. quantum communication
- H04B10/07—Arrangements for monitoring or testing transmission systems; Arrangements for fault measurement of transmission systems
- H04B10/075—Arrangements for monitoring or testing transmission systems; Arrangements for fault measurement of transmission systems using an in-service signal
- H04B10/079—Arrangements for monitoring or testing transmission systems; Arrangements for fault measurement of transmission systems using an in-service signal using measurements of the data signal
- H04B10/0795—Performance monitoring; Measurement of transmission parameters
- H04B10/07953—Monitoring or measuring OSNR, BER or Q
-
- H—ELECTRICITY
- H04—ELECTRIC COMMUNICATION TECHNIQUE
- H04B—TRANSMISSION
- H04B10/00—Transmission systems employing electromagnetic waves other than radio-waves, e.g. infrared, visible or ultraviolet light, or employing corpuscular radiation, e.g. quantum communication
- H04B10/07—Arrangements for monitoring or testing transmission systems; Arrangements for fault measurement of transmission systems
- H04B10/075—Arrangements for monitoring or testing transmission systems; Arrangements for fault measurement of transmission systems using an in-service signal
- H04B10/079—Arrangements for monitoring or testing transmission systems; Arrangements for fault measurement of transmission systems using an in-service signal using measurements of the data signal
- H04B10/0795—Performance monitoring; Measurement of transmission parameters
- H04B10/07955—Monitoring or measuring power
Abstract
Methods and systems for characterizing an optical signal propagating along a communication link are disclosed. The signal includes a data-carrying signal component and a noise component modulated at a symbol frequency. The method includes measuring an optical power spectrum of the signal, the optical power spectrum including data-carrying signal spectral components and noise spectral components. The method also includes determining a measured spectral correlation function within pairs of spectral components of a signal from a center frequency of the pairs of spectral components of the signal, the spectral components in each pair being spectrally separated from each other by the symbol frequency. The method also includes obtaining a solution for the data carrying signal spectral components based on the measured optical power spectrum such that a calculated spectral correlation function based on the solution matches the measured spectral correlation function. In some embodiments, the spectral correlation function is measured as a low frequency beat note amplitude function.
Description
Technical Field
The technical field relates generally to optical signal characterization in telecommunications applications, and more particularly, to a method and apparatus for spectrally characterizing an optical signal propagating along an optical communication link, for example, to distinguish a data-carrying signal (data transmission signal) component from a noise component and/or to perform optical signal-to-noise ratio (OSNR) measurements.
Background
The performance of long-haul fiber optic communication systems depends to a large extent on the optical signal-to-noise ratio (OSNR). The OSNR is a conventional measurable characteristic related to the quality of the signal carried by the optical telecommunication link. The dominant noise component in an optical communication link is typically unpolarized Amplified Spontaneous Emission (ASE) noise. ASE noise is a spectrally broadband noise source caused by optical amplifiers in the link. In practice, the OSNR must therefore be measured somewhere along the link (e.g. at the receiver end). Current prior art systems achieve high spectral efficiency using both complex modulation schemes and Polarization Multiplexing (PM). However, in the case of both densely packed channels combined with PM signals, conventional OSNR measurement techniques fail. That is, the ASE noise spectrum is generally not measurable outside the signal spectrum bandwidth because the spacing of the channels is too small. Also, relying on the fact that the signal is 100% polarized and the ASE is unpolarized, the in-band measurement method of the eliminated polarization type also has disadvantages because the overall PM signal is also unpolarized.
A method of measuring the noise level on a PM signal using an obtained optical spectral trace of the signal is proposed in commonly owned US 9,112,604B 2, the disclosure of which is incorporated herein by reference in its entirety. This approach is based on knowing the spectral shape of the data carrying signal components provided by the reference signal. Due to this knowledge, the data-carrying signal contribution and the ASE noise contribution can be mathematically distinguished from each other, otherwise they appear to be together on the optical spectral trace. Knowledge of the spectral shape of the signal components may be derived from a prior acquisition of the reference signal employed. For example, the reference signal may be obtained at different points along the same optical communication link, usually upstream, where the OSNR is known or the signal may be considered free of ASE noise. Thus, the reference signal originates from the same optical transmitter as the measured signal. The method described in US patent US 9,112,604B 2 considers that the spectral shape of the signal does not change significantly along the communication link within the optical signal bandwidth. The signal component of such a reference signal is therefore considered to be a signal component that spectrally represents the signal under test. U.S. patent application publications US 2014/0328586 a1 and US 2016/0127074 a1 (the disclosures of which are incorporated herein by reference in their entirety) include provisions for explaining changes in spectral shape that arise from, for example, nonlinear effects.
A method for determining in-band OSNR and other quality parameters of an optical information signal (e.g., PM signal) is disclosed in U.S. patent application publication US 2016/0164599 a 1. The method involves measuring the optical power spectrum of the noise signal, for example by means of a conventional spectrum analyzer, and then measuring the correlation between a predetermined pair of spaced apart time-varying frequency components in the optical amplitude or power/intensity spectrum of the signal by means of two optical narrowband amplitude or power detectors. The in-band noise of the signal may be determined from the correlation measurements. A measurement of the signal power may be used to determine the OSNR based on the determined in-band noise. The disadvantage of this approach is the complexity and high cost of the required equipment, especially involving two fully coherent receivers.
Accordingly, challenges remain in developing techniques to distinguish signals from noise in optical signals used in telecommunications applications.
Disclosure of Invention
This document relates generally to techniques for spectrally characterizing optical signals propagating along an optical communication link (e.g., an optical fiber). The optical signal may include a data carrying signal component modulated at a symbol frequency (mark frequency) within a data carrying signal bandwidth, and a noise component including ASE noise. The present technique exploits the spectral correlation that exists within a pair of spectrally spaced apart spectral components, the spectrally spaced apart amount corresponding to a symbol frequency in the optical signal, to allow in-band determination of the spectral shape of the data-carrying signal component as distinguished from the spectral shape of the noise component. In view of the shape of both the noise spectrum and the noise-free spectrum of the signal at the measurement location along the link, the OSNR or other signal quality parameter may be determined. A feature of some embodiments of the present technology is the use of a large number of such pairs of associated spectral components across the spectrum of the optical signal. Thus, although deviations from perfect spectral correlation may affect the overall signal spectrum, they will generally retain their shape. Such deviations may be due to, for example, Chromatic Dispersion (CD) and/or Polarization Mode Dispersion (PMD). Another feature of some embodiments of the present technology is the use of relative spectral shapes, which may eliminate or at least reduce the need for high precision measurements compared to absolute measurement techniques.
According to one aspect, a method is provided for spectrally characterizing an optical signal propagating along an optical communication link, the optical signal including a data-carrying signal component modulated at a symbol frequency within a data-carrying signal bandwidth, and a noise component. The method comprises the following steps:
measuring an optical power spectrum of the optical signal over a spectral range within the data-carrying signal bandwidth, the measured optical power spectrum including a data-carrying signal power spectral component associated with the data-carrying signal component of the optical signal and a noise power spectral component associated with the noise component of the optical signal;
determining from the measurements a spectral correlation function for a set of pairs of spectral components of the optical signal, the spectral components in each pair being spectrally separated from each other by the symbol frequency, the set of pairs of spectral components being respectively centered on a corresponding set of center frequencies over a center frequency range within the spectral range, the measured spectral correlation function correlating the strength of correlation between the spectral components of each pair with the center frequencies of the pair over the center frequency range; and
obtaining, using a processor, a solution representing the data-carrying signal power spectral components based on the measured optical power spectrum of the optical signal, such that spectral correlation functions calculated for pairs of spectral components spectrally separated by the symbol frequency in the solution representing the data-carrying signal power spectral components match the measured spectral correlation functions.
In some embodiments, obtaining the solution representative of the data-carrying signal power spectral content comprises:
determining a solution representative of the noise power spectral content; and
deriving the solution representative of the data carrying signal power spectral component from the solution representative of the noise power spectral component and the measured optical power spectrum.
In some embodiments, obtaining the solution representative of the data-carrying signal power spectral content comprises:
providing a non-linear regression model relating the measured optical power spectrum to the measured spectral correlation function; and
determining the solution representative of the data-carrying signal power spectral content using the non-linear regression model.
In some embodiments, the non-linear regression model comprises a set of adjustable parameters comprising at least one of:
a model function representing a normalized (normalized) model of the noise power spectral components;
a noise parameter representing a relative amplitude of the noise power spectral component with respect to the data carrying signal power spectral component; and
a dispersion parameter conveying information indicative of at least one of dispersion and polarization mode dispersion of the optical signal.
In some embodiments, the method further comprises: determining an optical signal-to-noise ratio (OSNR) based on the measured optical power spectrum and the solution representing the data carrying signal power spectral components.
In some embodiments, the method further comprises: averaging the measured optical power spectrum and the measured spectral correlation function over a plurality of polarization states of the optical signal.
In some embodiments, determining the measured spectral correlation function from a measurement comprises: beat (beat) amplitude functions of a set of beat component pairs respectively associated with the set of spectral component pairs spectrally separated by the symbol frequency in the optical signal are measured, beat components in each pair being spectrally separated from each other by beat frequencies lower than the symbol frequency, the beat amplitude functions representing the measured spectral correlation functions.
In some embodiments, the ratio of the symbol frequency to the beat frequency is at 103To 106In the range, preferably 104To 105Within the range of (1).
In some embodiments, measuring the beat note amplitude function comprises:
generating from the optical signal a double sideband signal comprising a first image signal and a second image signal, the first and second image signals representing sideband images of the optical signal, the first and second image signals being spectrally separated from each other by a spectral shift equal to the symbol frequency plus or minus the beat frequency;
detecting and spectrally resolving the double sideband signal within the spectral range; and
determining the beat tone amplitude function for the set of pairs of beat frequency components from the detected double sideband signals, wherein one beat frequency component of each pair is associated with the first image signal and the other beat frequency component is associated with the second image signal.
In some embodiments, detecting and spectrally resolving the double sideband signal further comprises:
generating a Local Oscillator (LO) signal having a tunable LO frequency;
combining the LO signal and the double sideband signal into a combined signal; and
detecting the combined signal while scanning the tunable LO frequency within the spectral range.
In some embodiments, measuring the beat note amplitude function comprises:
generating a Local Oscillator (LO) signal having a tunable LO frequency within the spectral range;
generating, from the LO signal, a double-sideband LO signal comprising a first LO image signal and a second LO image signal, the first and second LO image signals representing sideband images of the LO signal, the first and second LO image signals being spectrally separated from each other by a spectral shift equal to the symbol frequency plus or minus a beat frequency, the beat frequency being lower than the symbol frequency;
combining the double sideband LO signal with the optical signal into a combined signal;
while scanning the tunable LO frequency, detecting and spectrally resolving the combined signal within the spectral range; and
determining the beat tone amplitude function for the set of pairs of beat frequency components from the detected combined signal, wherein one beat frequency component of each pair is associated with the first LO image signal and the other beat frequency component is associated with the second LO image signal.
In some implementations, the method also includes reducing harmonics in the double sideband LO signal.
In some embodiments, a heterodyne optical spectrum analyzer is used to obtain the measured optical power spectrum and the measured spectral correlation function.
It should be noted that other method and process steps may be performed before, during, or after the above-described steps. The order of one or more of the steps may also be different, and some of the steps may be omitted, repeated, and/or combined, depending on the application. It should also be noted that some of the method steps may be performed using various signal processing and computing techniques, which may be implemented in hardware, software, firmware, or any combination thereof.
According to another aspect, a non-transitory computer-readable storage medium is provided having computer-readable instructions stored thereon which, when executed by a processor, cause the processor to perform a method for spectrally characterizing an optical signal propagating along an optical communication link, the optical signal including a data-carrying signal component modulated at a symbol frequency within a data-carrying signal bandwidth and a noise component. The method comprises the following steps:
receiving a measured optical power spectrum of the optical signal over a spectral range within the data-carrying signal bandwidth, the measured optical power spectrum including a data-carrying signal power spectral component associated with the data-carrying signal component of the optical signal and a noise power spectral component associated with the noise component of the optical signal;
receiving measured spectral correlation functions for a set of pairs of spectral components of the optical signal, the spectral components in each pair being spectrally separated from each other by the symbol frequency, the set of pairs of spectral components being respectively centered on a corresponding set of center frequencies over a center frequency range within the spectral range, the measured spectral correlation functions correlating a strength of correlation between the spectral components of each pair with a center frequency of the pair over the center frequency range; and
obtaining a solution representing the data-carrying signal power spectral components based on the measured optical power spectrum of the optical signal such that spectral correlation functions calculated for pairs of spectral components spectrally separated by the symbol frequency in the solution representing the data-carrying signal power spectral components match the measured spectral correlation functions.
In some implementations, obtaining the solution representative of the data carrying signal power spectral content includes:
determining a solution representative of the noise power spectral content; and
deriving the solution representative of the data-carrying signal power spectral component from the solution representative of the noise power spectral component and the measured optical power spectrum.
In some implementations, obtaining the solution representative of the data carrying signal power spectral content includes:
providing a non-linear regression model relating the measured optical power spectrum to the measured spectral correlation function; and
determining the solution representative of the data-carrying signal power spectral content using the non-linear regression model.
In some embodiments, the nonlinear regression model includes a set of adjustable parameters, the adjustable parameters including at least one of:
a model function representing a normalized model of the noise power spectral components;
a noise-to-signal ratio parameter representing the relative amplitude of the noise power spectral component relative to the data carrying signal power spectral component; and
a dispersion parameter conveying information indicative of at least one of dispersion and polarization mode dispersion of the optical signal.
In some embodiments, the method further comprises: determining an optical signal-to-noise ratio (OSNR) based on the measured optical power spectrum and the solution representing the data carrying signal power spectral components.
According to another aspect, a system or apparatus is provided that is capable of performing one or more of the steps of the above-described method.
In some embodiments, a system for spectrally characterizing an optical signal propagating along an optical communication link is provided, the optical signal including a data-carrying signal component modulated at a symbol frequency within a data-carrying signal bandwidth and a noise component. The system comprises:
a spectral shifter configured to generate, in a first acquisition mode, a double sideband signal from the optical signal, the double sideband signal comprising a first image signal and a second image signal spectrally separated from each other by a spectral shift equal to the symbol frequency plus or minus a beat frequency, the beat frequency being lower than the symbol frequency;
a spectrally resolving detector unit operable within a spectral range within the data carrying signal bandwidth, the spectrally resolving detector unit being configured to detect the double sideband signal and output a first detected signal in the first acquisition mode, and to detect the optical signal and output a second detected signal in a second acquisition mode; and
a processor coupled to the spectrally resolving detector unit and configured to:
determining or identifying a measured optical power spectrum of the optical signal based on the second detected signal, the measured optical power spectrum comprising a data-carrying signal power spectral component associated with the data-carrying signal component of the optical signal and a noise power spectral component associated with the noise component of the optical signal;
determining spectral correlation functions within pairs of spectral components of the optical signal, the spectral components in each pair being spectrally separated from each other by the symbol frequency, the spectral correlation functions being determined by determining beat amplitude functions within pairs of beat components respectively associated with the pairs of spectral components based on the first detected signal, the beat components in each pair being spectrally separated from each other by the beat frequency, one being associated with the first image signal and the other being associated with the second image signal; and
obtaining a solution representing the data-carrying signal power spectral components based on the measured optical power spectrum of the optical signal such that spectral correlation functions calculated for pairs of spectral components spectrally separated by the symbol frequency in the solution representing the data-carrying signal power spectral components match the measured spectral correlation functions.
In some embodiments, the spectrally resolving detector unit further comprises:
a Local Oscillator (LO) source that generates an LO signal having a tunable LO frequency;
an optical coupler for combining the LO signal and the double sideband signal into a first combined signal in the first acquisition mode and combining the LO signal and the optical signal into a second combined signal in the second acquisition mode;
a heterodyne receiver for receiving the first combined signal in the first acquisition mode and generating the first detected signal from the first combined signal, and receiving the second combined signal in the second acquisition mode and generating the second detected signal from the second combined signal; and
a scan controller coupled to the LO source to scan the tunable LO frequency over the spectral range in the first acquisition mode and the second acquisition mode.
In some implementations, the spectral shifter is an electro-optic modulator.
In some embodiments, the system further comprises a polarization analyzer disposed upstream of the spectrally resolving detector unit, the polarization analyzer comprising:
a polarization scrambler (scrambler) configured to change a polarization state of the optical signal or the double sideband signal according to time; and
a polarizer configured to pass a fixed polarization component of the optical signal or the double sideband signal at a changed polarization state.
In some embodiments, the system further comprises an optical channel selector configured to select the optical signal from a selected one of a plurality of spaced apart optical channels.
In some embodiments, a system for spectrally characterizing an optical signal propagating along an optical communication link is provided, the optical signal including a data-carrying signal component modulated at a symbol frequency within a data-carrying signal bandwidth and a noise component. The system comprises:
a spectrally resolving detector unit operable over a spectral range in the data carrying signal bandwidth, the spectrally resolving detector unit comprising:
a Local Oscillator (LO) source that generates an LO signal having a tunable LO frequency;
an LO spectral shifter configured to generate, in a first acquisition mode, a double-sideband LO signal from the LO signal, the double-sideband LO signal comprising a first LO image signal and a second LO image signal spectrally separated from each other by a spectral shift equal to the symbol frequency plus or minus a beat frequency, the beat frequency being lower than the symbol frequency;
an optical coupler for combining the double sideband LO signal with the optical signal into a first combined signal in the first acquisition mode and combining the LO signal with the optical signal into a second combined signal in the second acquisition mode;
a heterodyne receiver for receiving the first combined signal in the first acquisition mode and generating a first detected signal from the first combined signal, and receiving the second combined signal in the second acquisition mode and generating a second detected signal from the second combined signal; and
a scan controller coupled to the LO source to scan the tunable LO frequency within the spectral range in the first acquisition mode and the second acquisition mode; and
a processor coupled to the spectrally resolving detector unit and configured to:
determining or identifying a measured optical power spectrum of the optical signal based on the second detected signal, the measured optical power spectrum comprising a data-carrying signal power spectral component associated with the data-carrying signal component of the optical signal and a noise power spectral component associated with the noise component of the optical signal;
determining spectral correlation functions within pairs of spectral components of the optical signal, the spectral components in each pair being spectrally separated from each other by the symbol frequency, the spectral correlation functions being determined by determining beat amplitude functions within pairs of beat components respectively associated with the pairs of spectral components based on the first detected signal, the beat components in each pair being spectrally separated from each other by the beat frequency, one being associated with the first LO image signal and the other being associated with the second LO image signal; and
obtaining a solution representing the data-carrying signal power spectral components based on the measured optical power spectrum of the optical signal such that spectral correlation functions calculated for pairs of spectral components spectrally separated by the symbol frequency in the solution representing the data-carrying signal power spectral components match the measured spectral correlation functions.
In some implementations, the LO spectrum shifter is an electro-optic modulator.
In some embodiments, the system further comprises a polarization analyzer disposed upstream of the spectrally resolving detector unit, the polarization analyzer comprising:
a polarization scrambler configured to change a polarization state of the optical signal according to time; and
a polarizer configured to pass a fixed polarization component of the optical signal having a changed polarization state.
Other features and advantages herein will become more apparent upon reading the following non-limiting description of specific embodiments herein, given by way of example only, with reference to the accompanying drawings. Although specific features described in the foregoing summary and the following detailed description may be described with respect to particular embodiments or aspects, it should be noted that these specific features may be combined with each other, unless otherwise noted.
Drawings
Fig. 1 is a flow diagram of a method for spectral characterization of an optical signal propagating along an optical communication link, according to a possible embodiment.
Fig. 2A and 2B are graphs illustrating examples of measured spectral parameters and other relevant quantities used in some embodiments described herein.
Fig. 3 is a flow chart of a method for spectrally characterizing an optical signal propagating along an optical communication link according to another possible example scenario.
Fig. 4 is a schematic block diagram of a system for spectrally characterizing an optical signal propagating along an optical communication link, according to a possible example approach.
Fig. 5 is a schematic diagram illustrating the principles of operation and information flow of a system for spectrally characterizing an optical signal propagating along an optical communication link according to another possible example approach.
Fig. 6 is a schematic diagram of input and output signals for a 2-v shifter, such as that in the system of fig. 5. In fig. 6, the input signal is the frequency viAnd the output signal is frequency-dependent The two output tones are the spectrally shifted sideband images of the input tones.
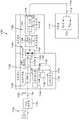
Fig. 7A is a schematic block diagram of a system for spectrally characterizing an optical signal propagating along an optical communication link according to another possible example approach. Fig. 7B is a schematic diagram illustrating the operational principles and information flow of the example scheme of fig. 7A.
Fig. 8 is a schematic diagram of a configuration of a possible example scheme of a 2-v spectrum shifter in an example scheme of a system for spectrum characterizing an optical signal propagating along an optical communication link. In FIG. 8, a 2-v spectrum shifter is implemented by a dual drive Mach-Zehnder (DDMZ) electro-optical interferometer configured as an amplitude modulator.
FIGS. 9A-9C are diagrams of phase swings induced as a function of modulation voltage applied by a DDMZ electro-optic modulator, such as the one of FIG. 8 Plotted amplitude c for q ═ 1 (thick solid line), 3 (dashed line) and 5 (thin solid line)q(FIG. 9A) and relative amplitude rq(fig. 9B and 9C).
Fig. 10 is a schematic block diagram of a system for spectrally characterizing an optical signal propagating along an optical communication link according to another possible example approach.
Fig. 11 is a schematic block diagram of a system for spectrally characterizing an optical signal propagating along an optical communication link according to another possible example approach.
FIG. 12 is a schematic diagram illustrating a block diagram of a harmonic control concept that may be used in some example aspects of the present technology.
Fig. 13 is a schematic diagram of a system for spectral characterization of an optical signal propagating along an optical communication link, the system including harmonic control capability, according to another possible example approach.
Fig. 14 is a schematic diagram of a system for spectral characterization of an optical signal propagating along an optical communication link, the system including a tunable optical filter for harmonic filtering, according to another possible example aspect.
Detailed Description
In the present description, like features in the drawings are generally given like reference numerals. To avoid cluttering certain figures, some elements may not be labeled if they have been identified in a previous figure. It should also be understood that the elements of the drawings are not necessarily drawn to scale, emphasis instead being placed upon clearly illustrating the elements and structures of the present embodiments. Further, for simplicity and clarity of description, position descriptors indicating the position and/or orientation of one element relative to another are used herein. Unless otherwise noted, these location descriptors should be employed in the context of the drawings and should not be viewed as limiting. More specifically, it will be understood that such spatially relative terms are intended to encompass different orientations in the use or operation of the present embodiment in addition to the orientation depicted in the figures.
Unless specified otherwise, the terms "connected" and "coupled" and derivatives and variations thereof herein refer to any connection or coupling, either direct or indirect, between two or more elements. For example, the connections or couplings between elements may be mechanical, optical, electrical, magnetic, logical, or a combination thereof.
In this document, the term "measured" when referring to a quantity or parameter is intended to mean that the quantity or parameter may be measured directly or indirectly. In the case of indirect measurements, quantities or parameters may be derived, retrieved, inferred, or otherwise determined from directly measured data.
The terms "a", "an" and "an" are defined herein to mean "at least one", that is, the terms do not exclude a plurality of elements unless otherwise indicated. It should also be noted that terms such as "substantially," "substantially," and "about" which modify a value, condition, or characteristic of a feature of an exemplary embodiment should be understood to mean that the value, condition, or characteristic is defined within a suitable operationally acceptable tolerance of this exemplary embodiment for the intended application.
The terms "light" and "optical" are used herein to refer to radiation in any suitable region of the electromagnetic spectrum. More specifically, these terms are not limited to visible light, but may also include the invisible region of the electromagnetic spectrum, including, but not limited to, the terahertz (THz), Infrared (IR), and Ultraviolet (UV) spectral bands. For example, in a non-limiting embodiment, an imaging system in which the present techniques may be implemented may be sensitive to light at a wavelength band somewhere in the range from about 1250nm to about 1650 nm. However, those skilled in the art will appreciate that this wavelength range is provided for illustrative purposes only, and that the present techniques may operate outside of this range.
Various embodiments of techniques for in-band (i.e., within a signal bandwidth) spectral characterization of an optical signal propagating along an optical communication link (e.g., an optical fiber) are disclosed herein.
The present techniques may be used in a variety of applications where it is desirable or necessary to measure spectral characteristics of an optical signal in telecommunications applications. For example, some of the present techniques may be applied to or implemented in different types of optical communication networks, including, but not limited to, typical metropolitan and long distance systems using signal modulation schemes in the ITU grid, such as 28Gb/s and higher rate QPSK or M-QAM (where M may be, for example, 16, 32, 64, 128, or 256). The signals may or may not be pulse shaped and may be polarization or polarization multiplexed. The present techniques may be used to ensure or help ensure that optical networks are reliable and operate within acceptable industry specifications. The present technology may be implemented in a variety of environments and settings, including on-site deployed networks, manufacturing facilities for network devices, research and development laboratories, data centers, and so forth. Furthermore, the present techniques may be employed during installation, activation and/or operational phases of an optical communications network for characterization, fault diagnosis and troubleshooting and/or performing monitoring.
In some embodiments, an in-band measurement method is provided that allows the spectral shape of the PM signal to be determined at the measurement site, as distinguished from the ASE noise background (no ASE). The OSNR can be calculated according to any standard or custom definition, considering both the signal plus ASE and ASE-free spectral shape of the signal at the measurement location. However, the present techniques are not limited to OSNR measurements and have a greater scope of application, as they relate to determining the spectrum over a large spectral range with and without ASE noise, rather than just a single OSNR value. Calculating the OSNR from this data may be seen as one specific application among various other possible applications.
Some implementations of the present technology utilize inherent or natural spectrum-dependent characteristics of optical signals to provide a reference signal spectrum measured "in situ" at a measurement location or point along an optical communication link. This reference signal spectrum may then be used in an OSNR measurement method (such as the method described in commonly owned US patent US 9,112,604B 2). However, in its comprehensive general sense, the present techniques may provide for mathematical analysis of measured data based on physical phenomena of a situation, where this measured data may be obtained using different systems and devices. For example, the theory, principles, and specific algorithms of some embodiments disclosed herein are based on the definition of physical quantities measured, regardless of actual device implementation.
Some embodiments of the present technology may overcome or reduce the disadvantages or limitations of the methods disclosed in U.S. patent application publication No. US 2016/0164599 a 1. Such drawbacks and limitations may include the assumption derived from perfect spectral correlation between predetermined pairs of frequency components and the requirement for high precision measurements derived from the absolute nature of the measurements, as well as the potentially lacking robustness due to high accuracy measurements and the fine tuning and calibration required for the implementation of such methods.
Method of implementation
Various aspects of a method for spectrally characterizing an optical signal propagating along an optical communication link will now be described. An optical signal can be described generally as comprising two components: a data-carrying signal component modulated at a symbol frequency within the data-carrying signal bandwidth, and a noise component typically comprising ASE noise.
Referring to fig. 1, a flow diagram of a possible embodiment of a method 100 for spectrally characterizing an optical signal propagating along an optical communication link is provided. Broadly, and as described in more detail below, the method 100 may include the step 102 of: the optical power spectrum of the optical signal is measured over a spectral range within the data carrying signal bandwidth. The measured optical power spectrum generally includes a data-carrying signal power spectral component associated with a data-carrying signal component of the optical signal and a noise power spectral component associated with a noise component (e.g., ASE noise) of the optical signal.
The method 100 may also include step 104: spectral correlation functions for a set of pairs of spectral components of the measured optical signal are determined from the measurements. In each pair, the spectral components are spectrally separated from one another by a symbol frequency and centered on a respective one of a set of center frequency values in a center frequency range within the spectral range. The measured spectral correlation function represents the variation of the correlation strength within the spectral component pairs as a function of the center frequency. As described in more detail below, in some embodiments, the step 104 of determining a spectral correlation function may include the steps of: beat tone amplitude functions of a set of beat frequency component pairs respectively associated with the set of spectral component pairs are measured, and the measured beat tone amplitude functions are identified as spectral correlation functions to be determined. In such cases, the beat components in each pair are spectrally separated from each other by beat frequencies that are the same for all pairs and are much lower than the symbol frequency. The beat tone amplitude function represents the variation in beat tone amplitude between the beat components of each pair as a function of the center frequency for the associated pair of spectral components.
The method 100 may also include step 106: a processor is used to obtain a solution of a power spectral component of the data carrying signal representing the measured optical power spectrum. The solution is such that the spectral correlation function calculated for pairs of spectral components separated by symbol frequency in the solution matches the measured spectral correlation function, the solution using the measured optical power spectrum as input. In this context, the terms "match", "matching" and "matched" are meant to encompass not only "exactly" or "equally" matching the measured and calculated spectral correlation functions, but also "substantially", "approximately" or "subjectively" matching the measured and calculated spectral correlation functions, as well as providing a higher or best match of a plurality of matching possibilities. Thus, the terms "match," "match," and "matched" are intended herein to refer to two elements being the same or within some predetermined tolerance of each other. Furthermore, the term "representing" in this context is used to indicate that the match between the solution found by the method 100 and the actual measured value of the optical power spectrum's data carrying signal power spectral components may be absolute or relative. For example, in some embodiments, the solution may be a normalized spectrum proportional to the data carrying signal power spectral component of the measured value of the optical power spectrum.
In some embodiments, the step 106 of obtaining a solution of the power spectral content of the data-carrying signal may include the step of performing a non-linear regression analysis based on a non-linear regression model. The nonlinear regression model may use a set of adjustable parameters to correlate the measured optical power spectrum over the center frequency range with the measured spectral dependence. In some embodiments, the adjustable parameters may include, but are not limited to, a model function representing a normalized model of the noise power spectral components (which may themselves be defined by one or more adjustable parameters); a noise-to-signal ratio parameter representing the relative amplitude of the noise power spectral component with respect to the data carrying signal power spectral component; and a dispersion parameter conveying information indicative of dispersion and/or polarization mode dispersion of an optical signal along the optical communication link. The measured data may be fitted using a successive approximation method, in which an initial set of parameter values is iteratively refined until a suitable match is obtained between the model and the measured data.
In some embodiments, the method 100 may include the steps of: an optical signal-to-noise ratio (OSNR) is determined based on the measured optical power spectrum and a solution representing the spectral content of the power of the data carrying signal. For example, in some cases, the method 100 may produce a normalized solution for the data carrying signal power spectral component and the noise to signal ratio, and these three parameters may be used to determine the OSNR.
These and other possible method steps and variations in accordance with the present techniques are described in more detail below.
Inherent spectral correlation
The modulated signal has a "hidden" periodicity even if the individual symbols are random variables that are independent of each other. This is reflected in the frequency domain (fourier transform, spectrum) as being exactly fsbTheoretical 100% correlation between separate spectral components, where fsbIs the symbol frequency (baud rate). Rather, for any random sequence of symbols, the two spectral components of all such pairs have the same phase difference. Considering the discrete signal (sampled), this can be expressed at the transmitter end as:
defining:
the value: c (f ≡ C<[P(f+)·P(f-)]1/2>sbδ(f+-f-)=fsbWherein f is 1/2 (f)++f-) And is

Wherein Is representative of a time-varying light field
 The jones vector (two-component complex phase) of the Discrete Fourier Transform (DFT), i.e., the modulated optical carrier including the state of polarization (SOP),<...>sbrepresents the average over all possible sequences of the symbol (sb), and C (f) is the two spectral components f±=(f·±1/2fsb) Where f · is the center frequency. In other words, equation (1) indicates that the correlation between these components is equal to the square root of the product of their powers, and if (f)+-f-)≠fsbIt is zero. This signal characteristic is utilized in the embodiments described herein. In practice, since ASE noise and other noise components do not generally have this characteristic (C ═ 0), knowing C (f) gives the frequency f, according to equation (2)+And f-The power of the signal of (a), or more precisely the square root of the product of two powers, which in practice is integrated over a small frequency range [ limited resolution, window w (f) ], see for example fig. 2A and 2B and the following equation (4a)]。
Definition of spectral content
With reference to fig. 2A and 2B, definitions of measured data and other relevant quantities for some embodiments described herein are provided. The graphs of fig. 2A and 2B illustrate the importance of these quantities by a simple example with the following specifications: the modulation format is 100Gb/s PM-NRZ-QPSK, wherein the symbol rate f sb25 GHz; the signal spectral density at the transmitter end is root raised cosine, where roll-off β is 0.3; and the ASE noise generated along the link by the optical amplifier has a flat spectrum. At the measurement site, both the signal and the ASE noise experience a common optical filter, the shape of which is 4 order super-gaussian, with FWMH ═ 35GHz, where there are no propagation effects due to Chromatic Dispersion (CD) and Polarization Mode Dispersion (PMD). Window w (f) is a Gaussian window in which the equivalent noise bandwidth B w100 MHz. The OSNR (conventional definition) at f-0 is 10dB (this low OSNR value is used to make things on the graph more obvious). The graphs of fig. 2A and 2B are simulation results.
Definition of measured data
In some embodiments, regardless of the device used to measure the data, the quantities making up the measured data are as follows. These quantities are shown in fig. 2A and 2B as thick solid lines.
Psη(f) Is the optical power spectrum of the optical signal to be characterized (i.e., the "signal + ASE" spectrum):
Psη(f)=Ps(f)+Pη(f) (3)
at f+And f-P ofsη(f) The values of (d) are shown as black circles in fig. 2A.


Wherein f is±=(f·±1/2fsb) And w2(f)=|w(f)|2。 (4a)
When w (f) is made narrow enough to approximate to w (f) δ (f) (dirac δ function), equation (4a) is simplified to

Other definitions
P (f) in general, the power spectrum, corresponds to a spectrum having w2(f) As measured, for example, by an Optical Spectrum Analyzer (OSA).
w (f) window or filter transfer function. Such as the optical power spectrum and the spectral correlation function, corresponds to a window w of some finite width2(f) Convolution of [ see equation (4a) ]]. The two peaks in fig. 2A corresponding to w (f) are shown by thin solid lines.
Bww2(f) Is/are as followsThe Equivalent Noise Bandwidth (ENB),
Ps(f) spectrum without ASE signal, corresponding to Psη(f) Carries the signal component. In this context, variables relating to data carrying signals are generally identified by an index "s". P is shown by a thin dashed line in FIG. 2As(f)。
Pη(f) Spectrum of ASE noise corresponding to Psη(f) The noise component of (1). In this context, variables that relate to noise are generally identified by an exponent "η". P is shown by a thin dotted line in FIG. 2Aη(f)。
P±(f.) where f ═ f±Of signal power of (A) such that P±(f·)=Ps(f±) (5) at f+And f-P ofs(f) The values of (d) are shown as black squares in fig. 2A.
P:Average "Signal + ASE" power at (f · so that P:(f·)=1/2[Psη(f+)+Psη(f-)]. (6) This amount is also referred to herein as the "DC term" and, in some embodiments, can be compared to Are measured together. P is:(f) is shown in FIG. 2B as a thin solid line.
Step-by-step description of an exemplary embodiment of a method for spectrally characterizing an optical signal propagating along an optical communication link
Referring to fig. 3, a flow diagram of an exemplary embodiment of a method 300 for spectrally characterizing an optical signal propagating along an optical communication link is provided. The optical signal to be characterized includes symbol frequencies f within the bandwidth of the data carrying signalsbThe modulated data carries a signal component and a noise component. A step-by-step description of this exemplary embodiment is provided below.
Step 0: raw data acquisition
Assume no matter what equipment is used to implement method 300 in fig. 3For Psη(f) Over the frequency f range and for The optical power spectrum P defined by equations (3), (4a) and (4b) is measured over or from the central frequency f.rangesη(f) And a spectral correlation function
 The constructed data. The range of frequencies f substantially covers the channel slots (e.g., typically 50GHz) as shown in fig. 2A. With this assumption, an embodiment of the
 method 300 proceeds as shown in the flow chart of FIG. 3.
More specifically, step 0 in fig. 3 may include the following steps: measuring an optical power spectrum P over a spectral range within an optical signal bandwidth of a signal to be characterizedsη(f) In that respect Optical power spectrum Psη(f) Conceptually, the sum of two terms can be written as follows: psη(f)=Ps(f)+Pη(f) Wherein the term Ps(f) Is a spectral component associated with a data-carrying signal component of an optical signal, and the term Pη(f) Is P associated with the noise component of the optical signalsη(f) Of the spectral component of (a).


In some embodiments, step 0 of method 300 may further include determining the DC term P from the measurements:Step of value of (f.). Can be used for measuring optical power spectrum Psη(f) To determine the DC term P:(f.). This different measurement procedure can be used to determine the spectral correlation function The same procedure is used.
Square modulus: it should be noted that equation (1) is as for Is distinguished in that in equation (4a), the modulo operator i<...>sbOf (c). The consequence of this difference is that (4b) compares favorably with (C)
 Adding an offset delta||(f), that is,
 wherein delta||(f·)~Psη(f+)Psη(f-)÷[1+Beq·Δt]And an

Where Δ t is the signal Of a finite duration, obtaining a DFT from said signal
 And BeqIs the equivalent width of w (f) (i.e., width B)eqGiving the same width).
It should be noted that if B is presenteq·Δt>>1, the offset δ appears to be inconvenient||Becomes negligible, which is expected to be easily satisfied in practice. For example, inCorresponds to BeqGaussian Window B of ENB 141MHzwIn the case of 100MHz, acquisition times Δ t even as short as 10 milliseconds (ms) have given Beq·Δt=1.4×10⁶. Thus, an otherwise advantageous average of the square modulus may be used, although Is a DFT of finite duration sequence, which means that the finite resolution (bin, binary) df is 1/Δ t, but the correlation is at a much larger width B than dfeqAnd (4) integrating. Given some Δ t, this is to BwA lower limit is imposed, or vice versa, but this lower limit is generally not an intended limit. The advantage of averaging the square modulus is that it is generally insensitive to CD and PMD, thereby removing the requirement of measuring CD and PMD that exists in some existing systems.
Step 1: psη(f) Normalization of
The method 300 may include step 1: calculating the measured optical power spectrum Psη(f) Normalized value of
Step 1 may involve measuring the optical power spectrum Psη(f) Divided by P measured at the center of the data carrying signal bandwidth of the measured optical signal (i.e., where f is 0)sη(f) A value of (a) such that Wherein
It should be noted that, in this context, the symbols All normalized spectra represented have the same definition, that is,

Step 2: and P:Scaling of (f.)
As described above, in some embodiments, the method 300 in fig. 3 may include step 2: function related to frequency spectrum The measurements taken together correspond to the DC term P defined by equation (6) and plotted in FIG. 2B:(f.) amount. This may be the case, for example, when
 method 300 is implemented with systems and devices that use a low frequency beat note method such as that described below. In this case, P:(f.) and respectively representing the DC component and the beat component of the detected signal.
It should be noted that step 2 may be omitted depending on the application, but may be used to provide a quantitative physical interpretation of the parameter a found by non-linear regression (see, e.g., step 4 below). It should also be noted that, in practice, it is intended to obtain And P:The measurement process of (f) may be different from that used to obtain Psη(f) Such that P is:The originally determined value of (f) may be different from that P will be usedsη(f) The measured values of (a) are those obtained from equation (6). In this case, scaling
 step 2 may involve scaling the DC term P:(f.) and spectral correlation terms Both multiplied by a common scaling factor alphaN. Selecting a scaling factor alphaNSuch that when P is:(f.) according to αNWhen zooming, the relationship is satisfied
 Where the right hand side is the normalized spectrum from the measurement
 sη(f) And (4) calculating. It should be noted that in general, the measurement or determination of the parameter P may be omitted when scaling
 step 2 is not performed:(f·)。
And step 3: guess value
Still referring to FIG. 3, the method 300 may further include performing a non-linear regression analysis in accordance with And optionally P:(f.) determining the power spectral content P of the data carrying signals(f) - -or a normalized value thereof
 Performing a nonlinear regression analysis typically involves providing initial or estimated values for a set of adjustable parameters for a nonlinear regression model that relates a measured optical power spectrum over a spectral range to a measured spectral dependence. Various techniques exist for determining initial estimates for non-linear regression analysis, and the selection of initial estimates may affect the convergence of the algorithm.
In the current embodiment, the set of adjustable parameters may be represented as a vector labeled V. The vector V may comprise a parameter (p α) and a set of N as described belowηAn additional parameter, said additional parameter being in the vector VηMiddle grouping and representing model functions Is adjustable parameter. This can be written as
V=(ραVη)。 (9)
Defining: in some embodiments, the model function Is defined as a function of f normalized according to equation (8), that is,
 wherein VηIs a vector of NηEach element represents NηAn adjustable parameter. VηCorresponds to a curve as a function of f
 Different shapes of (2). Depending on the application, VηN of (A)ηThe individual elements may be scalars, vectors, matrices, or any other suitable mathematical entity.
Conditions are as follows: in some embodiments, the composition is prepared by Provided that V is presentηA value of (a) such that
 Substantially equal to the actual normalized ASE noise spectrum
 In general, nothing is said about
 Form of (2), number of parameters NηOr an a priori indication of the nature of the parameters (scalar, vector, matrix, etc.). In some cases, with several scalar parameters
 May be sufficient and in other cases more complex functions with more parameters may be required. It is foreseeable that it is still common today over the width of the channel slots
 Of a simple shape (such as,simple constant, straight line, or parabolic) may change as the system architecture evolves. Determining
 Whether or not the particular form of (a) is sufficiently generalized will depend on the application, particularly in terms of the required or desired accuracy of the regression analysis. Are provided in Table I below and can be used for
 Model (2)
 Non-limiting examples of (a).

Table I: model function Examples of (1)
As described above, various techniques may be used to establish guesses in nonlinear regression. For example, in some embodiments, both ρ and α are at V ═ V (ρ α V)η) May initially be set to zero and may be iteratively refined as the regression progresses.
And 4, step 4: nonlinear least squares regression
In the present embodiment, the measured data includes the optical power spectrum Psη(f) Spectral correlation function And optionally a DC term P:(f.). More specifically, this means that the measured optical power spectrum Psη(f) Of the data carrying signal power spectral component Ps(f) Sum noise power spectral component Pη(f) Is not known a priori at the beginning of the
 method 300.
The method 300 of fig. 3 may include the following steps: obtaining or representing data carrying using a processorSignal power spectral component Ps(f) The solution of (1). Ps(f) Is such that is in contact with Ps(f) Including the solution correlation or the calculated spectral correlation function matching obtained therefrom Measured over a central frequency range of
 In some embodiments, this step may include first determining a spectrum P representing ASE noise powerη(f) Solutions of, e.g.
 And then from the measured spectrum Psη(f) By subtracting or removing Pη(f) To produce Ps(f) The solution of (1).
In some embodiments, the unknown ASE noise spectrum P may be found using nonlinear least squares regression analysisη(f) So that equation (4b) is satisfied, or in other words, P is foundη(f) Such that the following difference is zero or minimized to a suitable extent over the entire range of f,

wherein unknown Ps(f) Can be written as:
Ps(f)=Psη(f)-Pη(f)。 (11)
substituting equation (11) into P in equation (10)s(f) To obtain

Wherein the only unknown is Pη(f) In that respect Once P is presentη(f) Found by minimizing Δ (f), to be obtained according to the current method 300Signal spectrum Ps(f) It can be found from equation (11).
In some embodiments, equations (10) through (12) may be expressed differently to facilitate their use. For example, defining the following normalized spectrum according to equation (8) results in


wherein P iss0=Ps(0) And P isη0=Pη(0), (13)
From there, equation (11) can be normalized as follows:

where ρ ═ Pη0/Ps0。 (14)
Then, expressing (10) using equation (14) in terms of normalized spectrum results in

Wherein Δ (f) ═ Δ (f)/P2 s0. In the case of the equation (15), and
and is experimental data, and (ρ α) and
 is an unknown number.
To perform the nonlinear regression analysis, in equation (15) Can be modeled as a function
 Instead, of, in which the vector VηRepresenting model functions
 N of (A)ηAn adjustable parameter. The adjustable parameter of the regression is V ═ ρ α Vη). Experimental data
 And
And the fitting may be performed using a successive approximation method. In such a case, the initial set of parameter values of the vector V is iteratively refined until a suitable match is obtained between the model and the measured data, i.e. until the parameter V found by regression is used (ρ α V ═ Vη) The calculated Δ (f) in equation (15) approaches zero or a predetermined value within a specified tolerance level.
Regression is also performed iteratively within the scope of the present technique. In this case, use is made of Performs a first regression, then if the difference Δ is obtained0(f.) deviates significantly from zero or another convergence criterion, the result Δ based on the first regression is used0(f.) selected
 Is performed and then based on the result of the second regression, a1(f.) performing a third regression, and if necessary, and so on, until the result of the (q-1) th regression, Δq(f.) (iteration q) match or satisfy a specified criterion or degree of substantially "zero".
The meaning of ρ: ρ is the ratio r of ASEηThe noise parameter at f-0 is proportional to 1/OSNR (see step 5 below for more details).
The meaning of α: α is May convey information indicative of propagation effects (such as CD and/or PMD) affecting the measured optical signal along the optical communication link. In the absence of propagation effects such as CD and PMD, it has been found from simulation results that α becomes substantially equal to (1+ ρ) or αN(1+ ρ) depending on whether
 step 2 is performed. Thus, if CD and PMD can be neglected and step 2 is performed, then in principle, α can be omitted and replaced by (1+ ρ) as an independently adjustable parameter in equation (15). However, in practice CD and PMD are rarely negligible, so that α cannot usually be omitted. The effect of CD and PMD is through the global relative correlation factor Cr(which is referred to herein as "relative correlation", in practice substantially independent of f.) the correlation term is reduced relative to the values given in equations (4a) and (4b) The value of (c). The factor C can be interpreted by means of an adjustable parameter ar. Aspect CrThe fact of being substantially independent of f, and on the other hand introducing a parameter α in the regression, may be advantageous for some embodiments of the
 method 300. By this method, both CD and PMD can be compensated with a single adjustable parameter α without having to make measurements.
Normalized data-carrying signal spectrum Can be obtained by regression
 The results of (a) determined as follows:

in some embodiments, the difference between the model function and the actual normalized ASE noise spectrum is based on The function of the function is that of the function,
 error of (2)
 Can be approximated by

It should be noted that the normalized data carrying signal power spectral content if obtained using the present technique Used as the reference signal spectrum defined in US patent 9,112,604
B 2, equation (17) means that in the worst case the relative error in the measured ASE-to-noise ratio will be equal to the relative difference A certain average value of.
And 5: calculating OSNR
Still referring to the embodiment of fig. 3, the method 300 may further include step 5: normalization solution based on power spectral content of data carrying signal Normalization solution for noise power spectrum
 And the parameter p may be adjusted to determine the OSNR. In fact, it is known that
 And ρ, the OSNR can be calculated according to various standard definitions. For example, according to the vocabulary used herein, the conventional definition of OSNR can be written as:

In equation (18), Ss(f) And Sη(f) Spectral density of the data carrying signal and ASE noise, BchIs the width of the channel slot, and fr=1/2BνIn which B isνIs a standard reference width. In some applications, the standard reference width is specified as the wavelength interval Bλ0.1 nm. In this case, by being BλDefinition of function Bν:Bν=Bλ·(c/λ2 i) Wherein λ isiIs the center wavelength of the ith channel, and c is the speed of light. By this definition, the ASE-to-noise ratio and OSNR can be calculated from the measured normalized spectrum as follows:

wherein OSNRdBIs OSNR expressed in dB, that is, OSNRdB10log (osnr). It should be noted that equation (19) assumes that the window w (f) is sufficiently narrow in the sense that,

wherein And
And normalized spectral density of the signal and ASE noise, respectively. Since narrow w (f) (e.g., 50 to 500MHz) are typically used, in practice, the two approximations in equation (20) are generally accurate.
System implementation
According to another aspect, a system or apparatus for spectrally characterizing an optical signal propagating along an optical communication link and capable of implementing the methods described herein is provided. As will be described in greater detail below, some system and device embodiments described herein may use what is referred to herein as a "low frequency beat note" (LFB) method. In the LFB method, the spectral correlation functions within pairs of spectral components spectrally separated by the symbol frequency in the optical signal under test are determined according to an LFB amplitude function, the measurement of which may involve spectrally bringing the spectral components of each pair closer together and measuring the low frequency beat note between them.
Referring to fig. 4, a schematic block diagram of an exemplary embodiment of a system 400 for spectrally characterizing an optical signal 402 propagating along an optical communication link 404 (e.g., an optical fiber) is provided. The optical signal 402 includes a data carrying signal component and a noise component modulated at a symbol frequency within a data carrying signal bandwidth.
The system 400 includes a spectrum shifter 406 configured to generate a double sideband signal 408 from an optical signal in a first acquisition mode. The double sideband signal 408 includes a first image signal 410a and a second image signal 410 b. The first image signal 410a and the second image signal 410b represent sideband images of the optical signal 402 separated from each other by a spectral shift Equal to the symbol frequency fsbPlus or minus beat frequency fb,
 The situation of (2) is shown in fig. 4. Beat frequencyfbRatio symbol frequency fsbSmall ratios such as 10 in some embodiments3To 106In the range of, and more specifically at 104To 105Within the range. In the second acquisition mode, the
 spectrum shifter 406 is bypassed or inoperable by the optical signal 402. In the former case, the system 400 may include an optical switch 446 for directing the optical signal 402 along a first path 448a including the spectral shifter 406 in a first acquisition mode, and directing the optical signal 402 along a second path 448b bypassing the spectral shifter 446 in a second acquisition mode. In some embodiments, instead of the optical switch 446, the spectral shifting capability of the spectral shifter 446 may be selectively turned on and off in the first acquisition mode and the second acquisition mode, respectively.
The system 400 also includes a spectrally resolving detector unit 412 operable within a spectral range in the data-carrying signal bandwidth. The spectrally resolving detector unit 412 is configured to detect and spectrally resolve the double sideband signal 408 and output a first detected signal 414 in the first acquisition mode, and to detect and spectrally resolve the optical signal 402 and output a second detected signal 416 in the second acquisition mode. Since optical switch 446 is provided, optical signal 402 and double sideband signal 408 in the illustrated embodiment are detected one at a time and independently of each other. However, in other embodiments, it is contemplated that the optical signal 402 and the combined optical signal 408 are detected at least partially simultaneously, for example if the spectrally resolved detector unit includes multiple detectors and/or delay lines.
Herein, the term "spectrally resolved detector unit" broadly refers to any photo-detector or receiver or combination of photo-detectors capable of measuring a spectrally dependent response of an input signal (e.g. according to frequency or wavelength over a certain spectral range). The or each photo-detector in the spectrally resolved detector unit 412 typically operates as a photo-receiver configured to receive an input signal and output an electrical signal representative of the received input signal. The electrical signal may be sampled and digitized into spectral data representing the detected input signal. The spectrum-resolving detector unit 412 may be implemented by or be part of different types of spectrum-sensitive detectors, including an Optical Spectrum Analyzer (OSA), a swept-wavelength system, or any other type of spectrum measuring device. In some embodiments, the spectrally resolving detector unit 412 may be a high resolution OSA, non-limiting examples of which may include heterodyne OSA, coherent OSA, brillouin OSA, and coherent receivers.
The system 400 further includes a processor 418 coupled to the spectrum analysis detector unit 412. The processor 418 is configured to receive the first detected signal 414 and the second detected signal 416 after analog-to-digital conversion and derive therefrom spectral information about the double sideband signal 408 and the optical signal 402, respectively.
Herein, the term "processor" refers to an entity that controls and performs, at least in part, the operations of the system 400. Processor 418 may be located within one or more general-purpose computers and/or within any other special purpose computing device. It should be noted that the term "processor" should not be construed as limited to a single processor and, thus, any known processor architecture may be used. Processor 418 may be implemented in hardware, software, firmware, or any combination thereof, and may be connected to the various components of system 400 via appropriate communication links and ports. Processor 418 may be implemented by: a computer, a microprocessor, a microcontroller, a Central Processing Unit (CPU), a programmable logic device such as, for example, a Field Programmable Gate Array (FPGA), or any other type of processing resource or any combination of such processing resources configured to operate collectively as a processor. The processor 418 may include or be coupled to one or more memory elements 420 capable of storing computer programs and other data to be retrieved by the processor 418. Each memory element 420 may also be referred to as a "computer-readable storage medium". Depending on the application, processor 418 may be integrated, partially integrated, or physically separate with the optical hardware of system 400, including, but not limited to, spectral shifter 406 and spectral resolution detector unit 412.
In fig. 4, the processor 418 is configured to receive the second detected signal 416 and identify it as or determine it fromOptical power spectrum P of optical signal 402sη(f) In that respect As mentioned above, the optical power spectrum Psη(f) Comprising a data carrying signal power spectral component Ps (f) and a noise power spectral component P which are not distinguished from each otherη(f)。
The processor 418 is further configured to determine a spectral correlation function for a set of spectral component pairs of the optical signal 402 The set of pairs of spectral components is centered on a corresponding set of center frequencies f · on a center frequency range within the spectral range, respectively. The spectral components in each pair pass through the symbol frequency fsbBut are spectrally separated from each other. In the embodiment of fig. 4, the spectral correlation function is obtained by determining a beat tone amplitude function for a set of beat frequency component pairs based on the first detected
 signal 414 The pairs of beat frequency components are respectively associated with pairs of spectral components in the
 optical signal 402. The beat frequency component in each pair passes the beat frequency fbBut are spectrally separated from each other such that one beat component is associated with the first image signal 410a and the other beat component is associated with the second image signal 410 of the double sideband signal 408. The beat tone amplitude function spectrally relates the beat tone amplitude between the beat components of each pair as a function of the center frequency of its associated pair of spectral components.
Once optical power spectrum Psη(f) And a spectral correlation function Having been determined to be measured data, the
 processor 418 may be configured to obtain a spectral component P representing the power of the data carrying signals(f) Based on the solution and on the measured optical power spectrum Psη(f) And a calculated spectral correlation is matched to the measured spectral correlation function This step may be performed as described above, for example by using a non-linear regression analysis.
It should be noted that in some embodiments, the above-described process steps may be, but need not be, performed by the same physical processor. For example, it is contemplated that the spectral correlation function is determined using a processor included in the spectrally resolving detector unit 412 based on the first detected signal 414 and the second detected signal 416, respectively And optical power spectrum Psη(f) And another processor, separate from the optical hardware of
 system 400, is utilized to obtain spectral power components P representing the data-carrying signals(f) The solution of (c).
Further details regarding the structure, configuration, and operation of these and other possible components and features of systems according to the present technology are described in greater detail below.
Referring to fig. 5, a schematic diagram of the operational principles and information flow of another exemplary embodiment of a system 500 for spectrally characterizing an optical signal propagating along an optical communication link is provided. The system 500 in fig. 5 generally includes an optical channel lambda-selector 522, a 2-v shifter 506, an Optical Spectrum Analyzer (OSA)512, and a processor 518. Before describing the general principles of operation of system 500 itself, the functionality of channel λ -selector 522, 2- ν shifter 506, and OSA512 will be presented.
Channel lambda-selector 522 is configured to receive (at point "input" in fig. 5) optical waves 524, typically comprising N, from an optical communication system (not shown)iOne wavelength (λ) multiplexing channel, i 0. (N)i-1),NiInfinity 1. For example, in some exemplary embodiments, NiMay be about 10 to 100. Optical frequency viIs the carrier frequency (v) of channel ii=c/λi). In fig. 5, an optical signal, an electric signal, and a digital signal are shown by a thick solid line, a thin solid line, and a broken line, respectively.
The function of the channel lambda-selector 522 is to filter a given channel i from all other channels, as shown by the spectral input sum [1 ]. In some embodiments, the measurements are performed channel by channel sequentially: measuring a signal spectrum of a first channel i; then selecting a second channel and measuring its signal spectrum; a third channel is then selected, and so on. Depending on the application, channel λ -selector 522 may be implemented by: tunable filters, fixed filter arrays with optical switches, Wavelength Division Multiplexing (WDM) multiplexers, or any other commonly available device that can perform or be configured to perform the above-described functions.
It should be noted that as to the term used herein, NiEach of the optical channels may be said to comprise an optical signal 502 to be spectrally characterized. Thus, optical channel selector 522 is configured to select from a plurality of spaced-apart optical channels NiA currently characterized optical signal 502 of the selected one of the optical channels. Thus, the optical signal 502 in the selected channel may be described as including two components: i.e. the symbol frequency f within the bandwidth of the data carrying signal corresponding to the spectral width of the selected channelsbThe modulated data carries a signal component, and a noise component that typically includes ASE noise. The optical signal 502 in the selected channel also has an optical power spectrum Psη(f) Comprising a data-carrying signal power spectral component P associated with a data-carrying signal components(f) And a noise power spectral component P associated with the noise componentη(f)。
The LFB method introduced above may be implemented based on the functionality provided by 2-v shifter 506, which corresponds to spectrum shifter 406 of the embodiment of fig. 4. In fig. 5, the function of the 2-v shifter 506 is to generate the spectrum 1]The two images 510a, 510b, the two images 510a, 510b being shifted from the origin, respectively Wherein
 Or 1/2 (f)sb-fb) And f is andbat other points (graph [3 ]]、[4]) The frequency of the beat note observed. Situation(s)
 Shown in fig. 5. Referring briefly to fig. 6, the input to the 2-v shifter may be from the frequency viNarrow pitch of the laser. The function of the 2-v shifter is then to generate the frequency at this single tone from this tone
 And
And two tones of where viIs substantially suppressed. Returning to fig. 5, when the input to the 2-
v shifter 506 has an arbitrary frequency spectrum (e.g., a sum of spectral components), each spectral component is similarly imaged as two symmetrically shifted spectral components. Since this is a linear transformation, the output 508 is made up of two images 510a, 510b of the input spectrum that are identical in shape to the input image, but reduced in amplitude and shifted in spectrum And
And as in the graph of fig. 5 [2]]As shown. Preferably, viOf the original spectrum sum
 Possible undesired images of (a) are substantially suppressed. This suppression can be achieved, for example, by an appropriately arranged electro-optical modulator or the like.
The system 500 of fig. 5 also includes an OSA512, which is a possible embodiment of the spectrum resolving detector unit 412 of fig. 4. It should be noted that OSA is a common device whose principle of operation is generally known in the art and need not be explained in detail herein. In the embodiment of FIG. 5, one function of OSA512 is to operate as a tunable narrow-band optical filter followed by a photodetector whose output is incident upon itIs substantially proportional to the frequency of the optical wave. The output of the photodetector is typically an electrical signal (e.g. a photocurrent or a corresponding voltage), but may be any physical quantity that can be sampled and converted into digital data in a subsequent step. It should be noted that the OSA512 in FIG. 5 may provide a physical implementation of the concept window w (f) defined above. Thus, any of the features discussed herein with respect to w (f) may in principle be applied to the OSA512 in fig. 5. Herein, the term "tunable OSA" means a window w (f ═ v-v)i) The optical frequency v centered around it can take a number of values that substantially cover the range of the spectral bins allocated to channel i in the measurement. Furthermore, the term "narrowband OSA" refers to the width of a parameter commonly referred to as the Resolution Bandwidth (RBW), which herein corresponds to w as defined above2(f) Equivalent noise bandwidth Bw. Thus, the requirement (if any) on the RBW is typically BwThose requirements above. In practice, it is generally preferred that Bw<<fsbAnd anticipate BwIn the range of tens to hundreds of MHz (see below).
The principle of the LFB method can be more easily understood if presented first from the alternative angles where no 2-v shifter is present and no channel lambda-selector. In contrast, the incoming optical wave 524 at the input in FIG. 5 will be split into first and second optical waves, which will be respectively transmitted to have respective centers at (v)i+1/2fsb) And (v)i-1/2fsb) A first narrow band optical filter and a second narrow band optical filter of window w (f) above, wherein Bw<<fsb. The output light waves of the first and second optical filters will recombine and the resulting light wave will be sent to the fast photodetector. Due to the presence of a series of spectral components selected by the first filter and the second filter, respectively, the series of spectral components is passed through fsbA separate pair of correlated spectral components, and therefore the following will be observed in the photodetector output i (t), rather than the broadband noise that would be seen in the absence of such correlation: (a) in the time domain, if i (t) is sufficiently band-pass filtered, low noise positive is observedA sine wave; and (b) in the frequency domain, the frequency + -1/2 f is observed against a relatively minimal amplitude bandwidth noise backgroundsbLoud sound (Width-B)w). In other words, the frequency f will be observedsbCoherent beat tones. An important fact of some embodiments described herein is that the amplitude of this beat note will yield the spectral coherence term given by equations (4a) and (4b)
In contrast, in the LFB method depicted in the embodiment of FIG. 5, the two related spectral components (f) of all such pairs+f-) First, by the action of the 2-v shifter 506, close to each other in the frequency domain to form a double sideband signal 508 formed by the superposition of two image signals 510a, 510 b. At point [2]]In the spectrum of (a), the relevant spectral components of each of such pairs are now spectrally spaced apart by fbInstead of fsb. If f isbIs set to be in ratio BwMuch smaller, the output of OSA512 is equivalent to the beat note described in the previous paragraph, except that the beat note frequency is now fbInstead of fsbAnd thus the term "low frequency" is used to designate this beat note. The amplitude of this beat note is also equivalent to the spectral correlation function defined by equations (4a) and (4b) In embodiments described herein, the spectral correlation function is a parameter to be measured or determined from measurements.
In current optical fiber systems, the symbol frequency fsbUp to 25GHz and more. On the other hand, B can be expectedwIn the range of several tens to several hundreds of MHz, so that B is usually satisfied in practicew<<fsb. Thus, the value of hundreds of kHz to about 2MHz should generally be large enough and be the beat frequency fbIs judiciously set so that the inequality f is satisfiedb<<Bw<<fsb. Therefore, consider the case for fsb25GHz and fbTypical of 1MHz, fbAnd fsbCompared with the actual factIs a very low frequency.
To further digitally process the output of the photodetector, the beat note P (t, f \ f ·) is sampled and converted into digital data. For this purpose, the system 500 of FIG. 5 may include an analog-to-digital (A/D) converter 526. Due to beat frequency fbLower in the LFB method and therefore generally do not require a high speed a/D converter. In good sampling practice, it will be possible to have a cut-off frequency fc≤feIs applied to the analog signal, then at a rate feSampling is performed. Then, in principle, the minimum condition for the sampling rate is fe≥fbOr even smaller if undersampling is used. However, in order to make room for possible phase and/or amplitude fluctuations of the beat note in the frequency domain, f may be consideredeSlightly larger than that specified by this minimum condition. In practice, but without limitation, the value fe~2fbIt is expected to be safely large enough and a judicious general setting of the sampling rate.
Still referring to fig. 5, the digital data output by a/D converter 526 is received by processor 518. Once the digital data has been received by processor 518, subsequent data processing depends on whether 2-v shifter 506 is on (first acquisition mode) or off (second acquisition mode). Alternately turning the 2-v shifter 506 on and off is a simple and convenient way to delineate the principle. It could literally be this, but in a more general case, the term "shifter-off" means that the optical signal 502 at point [1] is sent to the input of the OSA512 (point [2]) without undergoing any spectral shift or other special transformation. The function of turning off the 2-v shifter 506 is a simple way, using any suitable means for achieving this. For example, some embodiments may include an optical switch to bypass the entire 2-v shifter 506, thus sending the signal at point [1] directly to point [2], as in fig. 4. Therefore, OSA512 will receive double sideband signal 508 in the first acquisition mode generally corresponding to the first acquisition time, and will receive unconverted optical signal 502 in the second acquisition mode generally corresponding to the second acquisition time. Thus, optical signal 502 and double sideband signal 508 can be detected and spectrally resolved independently of one another.
Closing the shifter: when the 2-v shifter 506 is turned off or bypassed (second acquisition mode), the average value of P (t, f) over the acquisition time Δ t constitutes the optical power spectrum P of the optical signal 502sη(f) The measurement result of (1). In this case, no specific processing is required. That is, the processor 518 may receive the spectral data 516 corresponding to the detected optical signal 502 and simply identify or determine that this spectral data 516 represents Psη(f) In that respect In some embodiments, Psη(f) Averaging may be performed by processor 518 over K number of acquisitions.
Opening the shifter: when the 2-v shifter 506 is turned on (first acquisition mode), the squared modulus P (t) of the DFT of the sampled beat tones 514 can be calculated as
S(f)=|DFT[P(t)]|2。 (21)
In general, s (f) exhibits three large narrow peaks or tones on a relatively small broadband background, as represented by the graph [4 ] in fig. 5]Schematically depicted, wherein S is actually drawn1/2(f)=|DFT[P(t)]L. Related item Is measured by f ═ fbThe value of the large narrow peak at (1) is given, and the DC term
 The measured value of (d) is given by the value of the large peak at f-0. Mathematically, this can be expressed as follows:


in some embodiments, the above process can be performed K times while maintaining the same value of f or f, whether in the range of 2-vShifter 506 is turned on (f) or off (f). For example, when the 2-v shifter 506 is turned on, the measured value obtained according to equation (22) Stored in memory at each iteration K, K0. (K-1), and the average result is calculated as
 Alternatively, the averaging may be performed by accumulating sums, i.e. measuring the first value
 And stored in the memory as the first sum sigma(0)Then measuring the second value
 And added to the first sum to obtain a second sum
 Then measuring a third value
 And added to the second sum to obtain a third sum
 And so on, to calculate the sum k at each iteration as
 The average result is obtained as
 Another alternative is to have the entire curve Sk(f)Rather than a single value
 Carrying out averaging; the process is the same as above except that
 Is replaced by Sk(f) In that respect Then calculated from the averaged S (f) according to equation (22)
 The advantage of this last alternative is that the final non-negligible background (electronics) of the additive noise can be determined and subtracted with greater accuracy. In some embodiments of the present invention, the,
 can also be combined with
 Averaging together by using a process that may correspond to any of the alternatives described above, and as such, when the 2-
v shifter 506 is turned off, for Psη(f) As well as so.
From the above discussion regarding step 0 and equation (7), the duration Δ t of the sampled beat note from which S (f) is calculated may be selected such that Beq·Δt>>1. When averaging is performed as described above, the correlation Δ t to be put into equation (7) becomes the acquisition time of each iteration, not the total acquisition time K · Δ t. Therefore, unless for other practical reasons (see, for example, the exemplary embodiments of fig. 7A and 7B below), it is generally preferred to perform a single acquisition (iteration K0) with an acquisition time Δ t K · δ t instead of averaging over K acquisitions with individual acquisition times δ t.
Reference is now made to fig. 7A and 7B. Fig. 7A is a schematic block diagram of another exemplary embodiment of a system 700 for spectrally characterizing an optical signal 702 propagating along an optical communication link 704. Fig. 7B is a schematic diagram of the principle of operation and information flow of the embodiment of fig. 7A. The embodiment of fig. 7A and 7B shares some features with the embodiment of fig. 4 and 5, which will not be described in detail again, except to highlight possible differences and variants. However, the main difference is that it includes a polarization analyzer 728, the purpose and operation of which will be described below.
It should be noted that if the pair is strictly performed Such as described above with reference to the embodiments of fig. 4 and 5, the PMD along the
 optical communication link 704 becomes greater than a certain value PMDsbIn some cases, the regressive adjustable parameter α is intended to compensate for the relative correlation Cr(see step 4 of method 300 of fig. 3 discussed above) may become unexpectedly small. PMD is not less thansbTime, frequency spectrum correlation function And sometimes as small as lost in additive noise. In addition, the passing symbol frequency fsbThe two separate spectral components (which would have the same polarization state and be correlated in the absence of PMD) can become orthogonally polarized to each other and see their spectral dependence vanishing or significantly reduced at some PMD level. Furthermore, there is exactly an offset 1/2T for synchronization between two symbol sequencessb=1/(2fsb) In the absence of PMD, if the two powers are equal, the observed correlation term disappears completely. I.e. each originating from having a polarization state
 And
And the two beat tones of the signal of (a) are out of phase and therefore cancel each other if their amplitudes are equal. The
 polarization analyzer 728 of fig. 7A and 7B is provided to eliminate or at least reduce these potential problems.
In the current embodiment, polarization analyzer 728 is located before 2-v spectrum shifter 706 in fig. 7A and 7B, but principleAbove, may be located at any point upstream of the spectrum resolution detector unit 712, e.g., after the 2-v spectrum shifter 706. The polarization analyzer 728 may include a polarization scrambler 730 and followed by a polarizer 732. The polarization scrambler 730 is configured to change the polarization state of the optical signal 702 over time, typically periodically and randomly. This time-variation of the polarization state is typically performed in a manner that is substantially independent of the frequency within the bandwidth of the optical signal 702. In this case, the polarization scrambler 730 will change the absolute, rather than relative, polarization state of the various spectral components of the optical signal 702. The polarizer 732 is configured to receive and transmit a fixed polarization component of the time-varying polarization scrambled optical signal produced by the polarization scrambler 730, and to transmit a fixed polarization component thereof. By combining the functionality of the polarization scrambler 730 and the polarizer 732, the polarization analyzer 728 in fig. 7A and 7B may allow the determination and averaging of the optical power spectrum P over multiple polarization states of the optical signal 702sη(f) And a spectral correlation function And controls or mitigates the potentially adverse effects of PMD.
The time-varying polarization state selected by the polarization analyzer 728 may be represented by a three-dimensional normalized Stokes vector Meaning that the vector can be viewed as the position of a point on the surface of a unit sphere (called Poincar sphere). In some embodiments, it may be desirable or required that the polarization scrambling performed by the
 polarization scrambler 730 causes vectors to be generated Any point on the surface of the poincare sphere can be reached so as to cover substantially the entire surface thereof during the measurement period, preferably uniformly (e.g. uniformly random scrambling). However, it has been found that in many cases it is easy to meet the homogeneity condition, since it is usually sufficient to
 At least one point in each of the eight octants of the poincare sphere can be reached. More specifically, it is generally also desirable to avoid
 All possible values of (c) are concentrated around only one or two points on the ball.
In some embodiments, to make the axis of the polarization scrambler 730 Randomizing to correspond to
 Is averaged over K randomly arranged K random polarization state settings to obtain a meaningful average value, it is generally preferred to perform the averaging out of K acquisitions with an acquisition time at such that the variation between each iteration is made
 Rather than performing a single acquisition with an acquisition time K · Δ t. In this way, the pair can be performed without increasing the total measurement time
 Desired random scrambling. Of course, some embodiments may use different acquisition schemes without departing from the scope of the present techniques. In some embodiments, it has been found that,
 just a few different settings of (c) may be sufficient to avoid the disappearance of the value of Cr and it is already possible to obtain meaningful average values with K10 for physical interpretation purposes. Further, it has also been found that in some applications, a value of K-100 may be a reasonable and appropriate default value.
Referring now to fig. 8, a schematic diagram is provided of a configuration of an example of a 2-v spectrum shifter 806 that may be used in the system embodiments described herein and shown in the drawings. In FIG. 8, the 2-v spectrum shifter 806 is implemented by an electro-optical modulator, more specifically a dual drive Mach-Zehnder (DDMZ) electro-optical interferometer configured as an amplitude modulator. A non-limiting example of a commercially available DDMZ electro-optic modulator is the LN05S-FC intensity modulator manufactured by Thorlabs. In some embodiments, the use of a DDMZ amplitude modulator may reduce cost and complexity. Of course, in other embodiments, the 2-v spectrum shifter may be implemented by other types of mach-zehnder or electro-optic modulators or other suitable types or modulators and optical devices.
In fig. 8, the optical signals 802 at the input 834 of the DDMZ spectrum shifter 806 are evenly split between the first arm 836a and the second arm 836b of the DDMZ spectrum shifter 806 and recombined at the output 838 into a double sideband signal 808 consisting of two sideband image signals 810a, 810 b. The first and second arms 836a and 836b cause a phase shift by applying a voltage to the first and second electrodes 840a and 840b, respectively And
And a voltage v applied by a power source to the first and
 second arms 836a, 836b via the first and second RF inputs 842a, 842bm(t) may be frequency fmThe sine wave of (2) modulates the voltage. Modulation frequency fmEquivalent to the shift discussed above So that fm=1/2(fsb+fb) Or 1/2 (f)sb-fb). The
 bias input 844 is a constant voltage added to one of the two electrodes 840a, 840b to fine tune the operating point, i.e., the phase difference when both RF inputs 842a, 842b are zero
 In FIG. 8, the operating points are set to
 Such that when both RF inputs are zero, the amplitude of the output
 optical wave 808 is zero. V is to beπDefined as the voltage that causes a phase shift of pi, the modulation voltage can be written as


Where Δ a is the modulation depth of the amplitude. In this configuration, a 100% modulation depth (Δ a ═ 1) can be achieved, corresponding to the phase swing But then generates a fourier transform at ± 3f in the
 output light wave 808mRather than at ± fmOnly two desired images 810a, 810 b. Relative to fmAmplitude c of fundamental wave1Amplitude c of the third harmonic of3Is then r3=c3/c10.122. In some cases, the relative amplitude r of the parasitic image, if not taken into account3Such values of (a) may result in non-negligible measurement errors. In some embodiments, the two solutions may be combined to overcome or at least mitigate the effects of the third harmonic: a) reducing the modulation depth Δ A, thereby correspondingly reducing r3The disadvantage is the equivalent total power loss, as if the power of the input light wave is small; and b) taking into account non-negligible third harmonics and other harmonics (if desired) in the nonlinear regression analysis described above.
In some embodiments, it is contemplated to process such parasitic images, so long as the harmonic | q | ═ 2+Relative amplitude r ofqAre reasonably well known. Instead of equation (15), the difference to be minimized may be usedA somewhat more complex expression of the value Δ (f), wherein the influence of the parasitic harmonics on the correlation term will be taken into account But the overall analysis will remain substantially unchanged. For completeness, the effect of spurious harmonics on the correlation term can be written as

In fig. 9A to 9C, the amplitude C for q ═ 1 (thick solid line), 3 (broken line), and 5 (thin solid line) is providedq(FIG. 9A) and relative amplitude rq(FIGS. 9B and 9C) as graphs of phase swings induced as a function of modulation voltage applied by a DDMZ electro-optic modulator (such as that of FIG. 8) Plotted as a function of (c).
Returning to fig. 7A, in some embodiments, the spectrum-resolving detector unit 712 may be implemented by an optical heterodyne OSA. It should be noted that the general principles of optical heterodyne detection are known in the art and need not be explained in detail herein. In this regard, reference is made to US patents 6,256,103B 1 and US 6,515,276B 2, the disclosures of which are incorporated herein by reference in their entirety. A non-limiting example of a commercially available optical heterodyne OSA is WaveAnalyzer manufactured by FinisarTM1500S spectrum analyzer.
In the illustrated embodiment, the optical heterodyne OSA 712 may generally include a Local Oscillator (LO) source 750, an optical coupler 752, a heterodyne receiver 754, and a scan controller 756. LO source 752 (e.g., a laser source) generates and sends LO signal 758 having tunable LO frequency v toward optical coupler 754 (e.g., a PM fiber (PMF) coupler). In the first acquisition mode (spectrum shifter 706 is on), optical coupler 754 combines LO signal 758 and double sideband signal 708 into first combined signal 760, while in the second acquisition mode (spectrum shifter 706 is off), optical coupler 754 combines LO signal 758 and optical signal 702 into second combined signal 762.
The scan controller 756 is coupled to the LO source 750 for scanning the tunable LO frequency v of the LO signal 758 within the spectral range of interest in both the first and second acquisition modes.
As described above, the detected signals 714, 716 may be sent to a processor 718 for determining or identifying a measured spectral correlation function And optical power spectrum Psη(f) And for obtaining therefrom a representation Psη(f) Of the data carrying signal power spectral component Ps(f) The solution of (c).
It should be noted that in the current embodiment, the optical components of heterodyne OSA 712 need not have polarization diversity, and the function of heterodyne OSA 712 is to mix the input signal (optical signal 702 or double sideband signal 708, depending on the acquisition mode) with LO signal 758. This is because the polarization of the input signals 702, 708 determined by the polarizer 732 of the polarization analyzer 728 is fixed and known. Thus, if the optical path between the polarization analyzer 728 and the optical coupler 752 of the heterodyne OSA 712 is comprised of PM fiber, the known polarization state of the input signals 702, 708 at the output of the polarization analyzer 728 will generally remain at the input of the optical coupler 752. This feature may simplify the optical components of heterodyne OSA 712.
Should also noteIt is intended that the scanning OSA, whose function is to display the spectrum, comprises an electronic or digital low-pass filter 772 at the output of the photodetector 764, the bandwidth of which is typically only a few tens of kHz, or even less if a slow or low-resolution scanning is acceptable. In the current embodiment, observed as the square law or power detector 770 output in the first acquisition mode is the beat note amplitude function from which the spectral correlation function is to be determined Therefore, the cut-off frequency f of this low-
pass filter 772cPreferably above a selected beat frequency fbAs mentioned previously, the beat frequency may be expected to be about 1MHz, for example in the range of hundreds of kHz to 2 MHz.
Referring now to fig. 10, there is shown a schematic block diagram of another exemplary embodiment of a system 1000 for spectrally characterizing an optical signal 1002 propagating along an optical communication link 1004. As with the embodiments of fig. 7A and 7B, the spectrally resolved detector unit 1012 in the embodiment of fig. 10 is a heterodyne OSA, but differs primarily in that in the first acquisition mode, LO signal 1058 is converted to a double sideband LO signal 1076, rather than optical signal 1002. More details regarding this embodiment are provided below.
Heterodyne OSA 1012 in fig. 10 includes LO source 1050 (e.g., a laser source), LO spectrum shifter 1078, optical coupler 1052, heterodyne receiver 1054, and scan controller 1056 that generate LO signal 1058 having tunable LO frequency v. LO spectral shifter 1078 is configured to generate, in a first acquisition mode, a double sideband LO signal 1076 from LO signal 1058, the double sideband LO signal comprising a first LO image signal and a second LO image signal spectrally separated from each other by a spectral shift equal to symbol frequency fsbPlus or minus beat frequency fb. As mentioned above, the beat frequency fbBelow the symbol frequency fsb. As with the spectrum shifter described above, the LO spectrum shifter 1078 may be implemented, for example, by a DDMZ amplitude modulator. In addition, LO spectrum shifter 1078 may be driven by the LO signal in the second acquisition mode, depending on the application1058 bypass (e.g., via optical switch 1046) or turn off its spectral shifting capability when LO signal 1058 passes therethrough.
Optical coupler 1052 is configured to combine double sideband LO signal 1076 and optical signal 1002 into first combined signal 1060 in the first acquisition mode (LO spectrum shifter 1078 is on) and to combine LO signal 1058 and optical signal 1002 into second combined signal 1062 in the second acquisition mode (LO spectrum shifter 1078 is off). As in fig. 7A, the optocoupler may be a PMF coupler. Heterodyne receiver 1054 is configured to receive first combined signal 1060 and generate first detected signal 1014 from first combined signal 1060 in a first acquisition mode, and to receive second combined signal 1062 and generate second detected signal 1016 from second combined signal 1062 in a second acquisition mode. The configuration of heterodyne receiver 1054 corresponds to that in fig. 7A and will not be described again. A scan controller 1056 is coupled to the LO source 1050 for scanning the tunable LO frequency v of the LO signal 1058 over the spectral range of interest in both the first and second acquisition modes.
The detected signals 1014, 1016 may be sent to processor 1018 for use in determining or identifying a measured spectral correlation function, as described above And optical power spectrum Psη(f) And for obtaining therefrom a representation Psη(f) Of the data carrying signal power spectral component Ps(f) The solution of (1).
It should be noted that the integration of polarizer analyzer 1028 within OSA heterodyne 1012 in fig. 10, as compared to the embodiment of fig. 7A, may reduce the length of the optical path between polarizer analyzer 1028 and optical coupler 1052. In the variant shown in fig. 11, the optical coupler 1152 is not a PMF coupler and no polarizer is provided after the polarization scrambler 1130. As an option in fig. 11, a polarizer 1132 may be inserted between the LO spectrum shifter 1178 and the optical coupler 1152 to ensure or help ensure that the polarization state of the double sideband LO signal 1176 remains stable and known, regardless of its actual polarization state at the output of the LO source 1150 and the polarization state transformation (if any) caused by the LO spectrum shifter 1178.
In some implementations, several advantages may result from applying a double sideband spectral shift to the LO signal rather than to the optical signal. First, the use of a channel λ -selector can in principle be avoided, and therefore the scanning of f and f can cover all channels in one acquisition, since there will be no need to acquire raw data channel by channel successively. Second, if a mach-zehnder modulator (such as that of fig. 8) is used, the output of the LO spectrum shifter may be used to actively lock the operating point through a feedback loop. In a more general aspect, control of harmonics may be achieved by applying a double sideband spectral shift to the LO signal, for example by actively setting any adjustable parameters of the LO spectral shifter to reduce and stabilize undesirable harmonics.
In an embodiment such as that of fig. 10, the operating parameters of the LO spectrum shifter 1078 may be actively locked, at least in principle, by a feedback loop, since a double sideband LO signal 1076 may be used. As mentioned above, in the first acquisition mode, the double sideband LO signal 1076 is the LO signal to be mixed with the signal under test in the heterodyne detection technique. Thus, based on the observed frequency spectrum, the operating parameters may be actively adjusted such that undesirable harmonics are reduced and stabilized. The general concept is illustrated in fig. 12, which shows a portion 1280 of the double sideband LO signal 1276 being extracted and sent to a harmonic control unit 1282, which in turn may dynamically adjust the operation of the LO spectrum shifter 1278 through a feedback loop 1284. It will be appreciated that depending on the particular implementation of LO spectrum shifter 1278, the actual operating parameters of harmonic control unit 1282, as well as the characteristics and number of harmonics, may be controlled, and the degree to which it is controlled may be decided.
Referring now to fig. 13, an example of an embodiment of a system 1300 that includes harmonic control capabilities is shown. In this embodiment, LO spectrum shifter 1378 is implemented by a DDMZ modulator. As mentioned in the description relating to fig. 8, the presence of odd harmonics in the frequency spectrum of the double sideband LO signal 1376 may be difficult to avoid in such implementations.However, in contrast, even harmonics ( q 0, 2, … …) may be suppressed or at least significantly reduced if the operating parameters of the DDMZ LO spectrum shifter 1378 are set appropriately, as discussed above. In some embodiments, these operating parameters are (i) the combined input split and output coupling ratio of the interferometer, (ii) the amplitude ratio, and (iii) the ratio to the first RF input 1342a and the second RF input 1342b (RF)1And RF2) (iii) the phase difference of the applied sinusoidal voltages, and (iv) the bias voltage at bias input 1344. Then, the even harmonics are suppressed or at least attenuated to a sufficient degree if the following conditions are met:
1. the two optical waves (the first optical wave from the first arm and the second optical wave from the second arm) that are combined at the output 1338 of the DDMZ LO spectral shifter 1378 have the same amplitude. (the arms are not shown in FIG. 13; see, for example, FIG. 8).
2. The sinusoidal phase modulation caused by the first and second arms has an equal phase swing. This condition may be set by adjusting the power ratio of the sinusoidal voltages applied to the first RF input 1342a and the second RF input 1342 b.
3. The sinusoidal phase modulation caused by the first and second arms is out of phase (i.e., the phase difference is pi). This condition may be set by adjusting the phase difference between the sinusoidal voltages applied to the first RF input 1342a and the second RF input 1342 b.
4. The bias at the bias input 1344 is set such that when the two RF inputs 1342a, 1342b are zero, the difference between the phase shifts induced by the first and second arms Is composed of
 Since in this case the amplitude of the output optical wave is zero.
In some embodiments, assuming that condition 1 is satisfied by careful fabrication of the DDMZ LO spectrum shifter 1378, the remaining conditions can be satisfied by carefully setting the parameters mentioned in conditions 2 to 4 based on the power of the harmonic q ═ 2 in the spectrum of the 2-v-shifted lightwave.
Still referring to fig. 13, an example of a possible implementation of the harmonic control unit 1382 will be described. Centered at f ═ q · fmThe band-pass filter 1386 selects the harmonic q, the power of which is PqMeasured by power detector 1388. In the case where q is 2, the processing unit 1390 connected to the power detector 1388 is configured to search the set vhc=(vbiasvδφvatt) Parameter v inbiasvδφvattUntil a minimum is found or otherwise optimized with respect to PqBy the set of values of the specified condition, where vbiasIs a bias voltage, and vδφAnd vattRespectively, the control voltages of the RF phase shifter 1392(δ Φ) and the attenuator 1394(Att) associated with the DDMZ LO spectral shifter 1378. Depending on the application, this optimization process may be performed during manufacturing or occasionally or periodically during an operational phase of the system 1300, e.g., each time the instrument is powered on or before each measurement, depending on the stability of the optimization process over time.
In some embodiments, undesirable harmonics in the spectrum of 2-v-shifted laser light waves can be suppressed or at least significantly reduced by filtering them out using a tunable 2-v optical filter, which can be a tunable filter having a wavelength centered at v±=(ν±fm) Is narrow (i.e.,<<fm) A passband tunable optical filter, where v is the optical frequency of the tunable laser. Referring to fig. 14, an example of such an implementation is depicted in which a tunable 2-v optical filter 1496 receives the double sideband LO signal 1476 and filters out undesirable harmonics before it is mixed with the measured optical signal 1402. In operation, the two passband frequencies v of the tunable 2-v optical filter 1496±=(ν±fm) Can be continuously varied to follow the optical frequency v of the tunable LO source 1450 as it is varied for scanning the spectrum, or locked in some manner. In some implementations, active locking may be performed, in which case it may be useful to provide samples 1498 of LO signal 1458 (i.e., before LO spectrum shifter 1478) to 2-vA control box for tunable optical filter 1496, as depicted in fig. 14.
According to another aspect, there is provided a non-transitory computer-readable storage medium having stored thereon computer-readable instructions which, when executed by a processor, cause the processor to perform a method for spectrally characterizing an optical signal propagating along an optical communication link, such as disclosed herein.
Herein, the terms "computer-readable storage medium" and "computer-readable memory" are intended to refer to a non-transitory and tangible computer product that can store and transfer executable instructions for implementing various steps of the methods disclosed herein. The computer readable memory may be any computer data storage device or component of such a device, including Random Access Memory (RAM); a dynamic RAM; read Only Memory (ROM); magnetic storage devices, such as hard disk drives, solid state drives, floppy disks, and magnetic tape; optical storage devices, such as compact discs (CD or CDROM), Digital Video Discs (DVD) and Blu-RayTMA disc; a flash drive memory; and/or other non-transitory memory technologies. A plurality of such storage devices may be provided, as will be appreciated by those skilled in the art. The computer-readable memory may be associated with, coupled to, or included in a computer or processor that is configured to execute instructions contained in a computer program stored in the computer-readable memory and that relate to various functions associated with the computer.
In some embodiments, a computer program stored in a computer readable storage medium may instruct a processor to perform the steps of: receiving a measured optical power spectrum of an optical signal over a spectral range within a data-carrying signal bandwidth, the measured optical power spectrum including a data-carrying signal power spectral component associated with a data-carrying signal component of the optical signal and a noise power spectral component associated with a noise component of the optical signal; receiving measured spectral correlation functions for a set of pairs of spectral components of the optical signal, the spectral components in each pair being spectrally separated from each other by a symbol frequency, the set of pairs of spectral components being respectively centered on a corresponding set of center frequencies over a center frequency range within the spectral range, the measured spectral correlation functions correlating a strength of correlation between the spectral components in each pair with a center frequency of the pair over the center frequency range; and obtaining a solution representing the data-carrying signal power spectral component based on the measured optical power spectrum of the optical signal, such that a spectral correlation function calculated for pairs of spectral components spectrally separated by the symbol frequency in the solution representing the data-carrying signal power spectral component matches the measured spectral correlation function.
In some embodiments, the step of obtaining the power spectral content of the data carrying signal may comprise: determining a solution representative of the noise power spectral content; and deriving the solution representative of the data carrying signal power spectral component from the solution representative of the noise power spectral component and the measured optical power spectrum.
In some embodiments, obtaining the solution representative of the power spectral content of the data-carrying signal may include: providing a non-linear regression model relating the measured optical power spectrum to the measured spectral correlation function; and determining the solution representative of the power spectral content of the data-carrying signal using the non-linear regression model. In some embodiments, the non-linear regression model may include a set of adjustable parameters, such as: a model function representing a normalized model of the noise power spectral components; a noise-to-signal ratio parameter representing the relative amplitude of the noise power spectral component relative to the data-carrying signal power spectral component; and a dispersion parameter conveying information indicative of the dispersion and/or polarization mode dispersion of the optical signal.
In some embodiments, the method may further comprise the steps of: determining an optical signal-to-noise ratio (OSNR) based on the measured optical power spectrum and the solution representing the data carrying signal power spectral components.
It should be understood that the systems and methods described herein may be applied to maintenance, monitoring, and/or troubleshooting.
Although the above description relates to a portable test instrument (such as a portable OSA), it should be mentioned that some of the signal characterization methods described herein may be used to monitor applications that employ fixed (as opposed to portable) test instruments.
It should be noted that all equations provided herein as a function of frequency may be suitably expressed as a function of wavelength, wavenumber, and the like. Thus, all equations given herein can be readily adapted to find equivalents as a function of wavelength or wavenumber.
It should be understood that the above-described method is not limited to the characterization of optical signals having unique signal carrier wavelengths. The optical signal under test may comprise a plurality of data carrying signal components multiplexed using nyquist wavelength division multiplexing (N-WDM) (also referred to as "super-channel" in the scientific literature), such as dual carrier PM-16-QAM (which is currently deployed for 400G transmission) or all-optical Orthogonal Frequency Division Multiplexing (OFDM), for example, as long as the variation of the signal portion of such optical signal under test is significantly greater than the ASE noise variation over at least a portion of the optical signal bandwidth.
Of course, many modifications may be made to the above-described embodiments without departing from the scope of the appended claims.
Claims (24)
1. A method for spectrally characterizing an optical signal propagating along an optical communication link, the optical signal including a data-carrying signal component modulated at a symbol frequency within a data-carrying signal bandwidth and a noise component, the method comprising:
measuring an optical power spectrum of the optical signal over a spectral range within the data-carrying signal bandwidth, the measured optical power spectrum including a data-carrying signal power spectral component associated with the data-carrying signal component of the optical signal and a noise power spectral component associated with the noise component of the optical signal;
determining from the measurements a spectral correlation function for a set of pairs of spectral components of the optical signal, the spectral components in each pair being spectrally separated from each other by the symbol frequency, the set of pairs of spectral components being respectively centred on a corresponding set of centre frequencies over a centre frequency range within the spectral range, the measured spectral correlation function relating the strength of correlation between the spectral components of each pair to the centre frequency of that pair over the centre frequency range; and
using a processor to obtain a solution representing the data-carrying signal power spectral component based on the measured optical power spectrum of the optical signal such that a spectral correlation function calculated for pairs of spectral components spectrally separated by the symbol frequency in the solution representing the data-carrying signal power spectral component matches the measured spectral correlation function,
wherein obtaining the solution representative of the data-carrying signal power spectral content comprises:
providing a non-linear regression model relating the measured optical power spectrum to the measured spectral correlation function; and
determining the solution representative of the data-carrying signal power spectral content using the non-linear regression model.
2. The method of claim 1, wherein obtaining the solution representative of the data carrying signal power spectral content comprises:
determining a solution representative of the noise power spectral content; and
deriving the solution representative of the data-carrying signal power spectral component from the solution representative of the noise power spectral component and the measured optical power spectrum.
3. The method of claim 1, wherein the non-linear regression model comprises a set of adjustable parameters, the adjustable parameters comprising at least one of:
a model function representing a normalized model of the noise power spectral components;
a noise-to-signal ratio parameter representing the relative amplitude of the noise power spectral component relative to the data carrying signal power spectral component; and
a dispersion parameter conveying information indicative of at least one of dispersion and polarization mode dispersion of the optical signal.
4. The method of claim 1, further comprising: determining an optical signal-to-noise ratio (OSNR) based on the measured optical power spectrum and the solution representing the data carrying signal power spectral components.
5. The method of claim 1, further comprising: averaging the measured optical power spectrum and the measured spectral correlation function over a plurality of polarization states of the optical signal.
6. The method of claim 1, wherein determining the measured spectral correlation function from a measurement comprises: measuring beat tone amplitude functions of a set of beat frequency component pairs respectively associated with the set of spectral component pairs in the optical signal that are spectrally separated by the symbol frequency, the beat frequency components in each pair being spectrally separated from each other by beat frequencies that are lower than the symbol frequency, the beat tone amplitude functions representing the measured spectral correlation functions.
7. The method of claim 6, wherein a ratio of the symbol frequency to the beat frequency is at 103To 106Within the range.
8. The method of claim 6, wherein measuring the beat note amplitude function comprises:
generating from the optical signal a double sideband signal comprising a first image signal and a second image signal, the first and second image signals representing sideband images of the optical signal, the first and second image signals being spectrally separated from each other by a spectral shift equal to the symbol frequency plus or minus the beat frequency;
detecting and spectrally resolving the double sideband signal within the spectral range; and
determining the beat tone amplitude function for the set of pairs of beat frequency components from the detected double sideband signal, wherein one beat frequency component of each pair is associated with the first image signal and the other beat frequency component is associated with the second image signal.
9. The method of claim 8, wherein detecting and spectrally resolving the double sideband signal further comprises:
generating a Local Oscillator (LO) signal having a tunable LO frequency;
combining the LO signal and the double sideband signal into a combined signal; and
detecting the combined signal while scanning the tunable LO frequency within the spectral range.
10. The method of claim 6, wherein measuring the beat note amplitude function comprises:
generating a Local Oscillator (LO) signal having a tunable LO frequency within the spectral range;
generating, from the LO signal, a double-sideband LO signal comprising a first LO image signal and a second LO image signal, the first and second LO image signals representing sideband images of the LO signal, the first and second LO image signals being spectrally separated from each other by a spectral shift equal to the symbol frequency plus or minus a beat frequency, the beat frequency being lower than the symbol frequency;
combining the double sideband LO signal with the optical signal into a combined signal;
while scanning the tunable LO frequency, detecting and spectrally resolving the combined signal within the spectral range; and
determining the beat tone amplitude function for the set of beat component pairs from the detected combined signal, wherein one beat component of each pair is associated with the first LO image signal and the other beat component is associated with the second LO image signal.
11. The method of claim 10, further comprising: reducing harmonics in the double sideband LO signal.
12. The method of claim 1, wherein the measured optical power spectrum and the measured spectral correlation function are obtained using a heterodyne optical spectrum analyzer.
13. A non-transitory computer readable storage medium having stored thereon computer readable instructions that, when executed by a processor, cause the processor to perform a method for spectrally characterizing an optical signal propagating along an optical communication link, the optical signal including a data-carrying signal component modulated at a symbol frequency within a data-carrying signal bandwidth and a noise component, the method comprising:
receiving a measured optical power spectrum of the optical signal over a spectral range within the data-carrying signal bandwidth, the measured optical power spectrum including a data-carrying signal power spectral component associated with the data-carrying signal component of the optical signal and a noise power spectral component associated with the noise component of the optical signal;
receiving measured spectral correlation functions for a set of pairs of spectral components of the optical signal, the spectral components in each pair being spectrally separated from each other by the symbol frequency, the set of pairs of spectral components being respectively centered on a corresponding set of center frequencies over a center frequency range within the spectral range, the measured spectral correlation functions correlating a strength of correlation between the spectral components of each pair with a center frequency of the pair over the center frequency range; and
obtaining a solution representing the data-carrying signal power spectral components based on the measured optical power spectrum of the optical signal such that spectral correlation functions calculated for pairs of spectral components spectrally separated by the symbol frequency in the solution representing the data-carrying signal power spectral components match the measured spectral correlation functions;
wherein obtaining the solution representative of the data-carrying signal power spectral content comprises:
providing a non-linear regression model relating the measured optical power spectrum to the measured spectral correlation function; and
determining the solution representative of the data-carrying signal power spectral content using the non-linear regression model.
14. The non-transitory computer-readable storage medium of claim 13, wherein obtaining the solution representative of the data-carrying signal power spectral content comprises:
determining a solution representative of the noise power spectral content; and
deriving the solution representative of the data-carrying signal power spectral component from the solution representative of the noise power spectral component and the measured optical power spectrum.
15. The non-transitory computer-readable storage medium of claim 13, wherein the non-linear regression model comprises a set of adjustable parameters, the adjustable parameters comprising at least one of:
a model function representing a normalized model of the noise power spectral components;
a noise-to-signal ratio parameter representing the relative amplitude of the noise power spectral component relative to the data carrying signal power spectral component; and
a dispersion parameter conveying information indicative of at least one of dispersion and polarization mode dispersion of the optical signal.
16. The non-transitory computer-readable storage medium of claim 13, wherein the method further comprises: determining an optical signal-to-noise ratio (OSNR) based on the measured optical power spectrum and the solution representing the data carrying signal power spectral components.
17. A system for spectrally characterizing an optical signal propagating along an optical communication link, the optical signal including a data-carrying signal component modulated at a symbol frequency within a data-carrying signal bandwidth and a noise component, the system comprising:
a spectral shifter configured to generate, in a first acquisition mode, a double sideband signal from the optical signal, the double sideband signal comprising a first image signal and a second image signal spectrally separated from each other by a spectral shift equal to the symbol frequency plus or minus a beat frequency, the beat frequency being lower than the symbol frequency;
a spectrally resolving detector unit operable within a spectral range within the data-carrying signal bandwidth, the spectrally resolving detector unit being configured to detect the double sideband signal and output a first detected signal in the first acquisition mode, and to detect the optical signal and output a second detected signal in a second acquisition mode; and
a processor coupled to the spectrally resolving detector unit and configured to:
determining or identifying a measured optical power spectrum of the optical signal based on the second detected signal, the measured optical power spectrum comprising a data-carrying signal power spectral component associated with the data-carrying signal component of the optical signal and a noise power spectral component associated with the noise component of the optical signal;
determining spectral correlation functions within pairs of spectral components of the optical signal, the spectral components in each pair being spectrally separated from each other by the symbol frequency, the spectral correlation functions being determined by determining beat amplitude functions within pairs of beat components respectively associated with the pairs of spectral components based on the first detected signal, the beat components in each pair being spectrally separated from each other by the beat frequency, one being associated with the first image signal and the other being associated with the second image signal; and
obtaining a solution representing the data-carrying signal power spectral components based on the measured optical power spectrum of the optical signal such that a spectral correlation function calculated for pairs of spectral components spectrally separated by the symbol frequency in the solution representing the data-carrying signal power spectral components matches the measured spectral correlation function;
wherein obtaining the solution representative of the data-carrying signal power spectral content comprises:
providing a non-linear regression model relating the measured optical power spectrum to the measured spectral correlation function; and
determining the solution representative of the data-carrying signal power spectral content using the non-linear regression model.
18. The system of claim 17, wherein the spectrally resolving detector unit further comprises:
a Local Oscillator (LO) source that generates an LO signal having a tunable LO frequency;
an optical coupler for combining the LO signal and the double sideband signal into a first combined signal in the first acquisition mode and combining the LO signal and the optical signal into a second combined signal in the second acquisition mode;
a heterodyne receiver for receiving the first combined signal in the first acquisition mode and generating the first detected signal from the first combined signal, and receiving the second combined signal in the second acquisition mode and generating the second detected signal from the second combined signal; and
a scan controller coupled to the LO source to scan the tunable LO frequency over the spectral range in the first acquisition mode and the second acquisition mode.
19. The system of claim 17, wherein the spectral shifter is an electro-optic modulator.
20. The system of claim 17, further comprising a polarization analyzer disposed upstream of the spectrally resolving detector unit, the polarization analyzer comprising:
a polarization scrambler configured to change a polarization state of the optical signal or the double sideband signal as a function of time; and
a polarizer configured to pass a fixed polarization component of the optical signal or the double sideband signal at a changed polarization state.
21. The system of claim 17, further comprising an optical channel selector configured to select the optical signal from a selected one of a plurality of spaced apart optical channels.
22. A system for spectrally characterizing an optical signal propagating along an optical communication link, the optical signal including a data-carrying signal component modulated at a symbol frequency within a data-carrying signal bandwidth and a noise component, the system comprising:
a spectrally resolving detector unit operable over a spectral range in the data carrying signal bandwidth, the spectrally resolving detector unit comprising:
a Local Oscillator (LO) source that generates an LO signal having a tunable LO frequency;
an LO spectral shifter configured to generate, in a first acquisition mode, a double-sideband LO signal from the LO signal, the double-sideband LO signal comprising a first LO image signal and a second LO image signal spectrally separated from each other by a spectral shift equal to the symbol frequency plus or minus a beat frequency, the beat frequency being lower than the symbol frequency;
an optical coupler for combining the double sideband LO signal with the optical signal into a first combined signal in the first acquisition mode and combining the LO signal with the optical signal into a second combined signal in the second acquisition mode;
a heterodyne receiver for receiving the first combined signal in the first acquisition mode and generating a first detected signal from the first combined signal, and receiving the second combined signal in the second acquisition mode and generating a second detected signal from the second combined signal; and
a scan controller coupled to the LO source to scan the tunable LO frequency within the spectral range in the first acquisition mode and the second acquisition mode; and
a processor coupled to the spectrally resolving detector unit and configured to:
determining or identifying a measured optical power spectrum of the optical signal based on the second detected signal, the measured optical power spectrum comprising a data-carrying signal power spectral component associated with the data-carrying signal component of the optical signal and a noise power spectral component associated with the noise component of the optical signal;
determining spectral correlation functions within pairs of spectral components of the optical signal, the spectral components in each pair being spectrally separated from each other by the symbol frequency, the spectral correlation functions being determined by determining beat amplitude functions within pairs of beat components respectively associated with the pairs of spectral components based on the first detected signal, the beat components in each pair being spectrally separated from each other by the beat frequency, one being associated with the first LO image signal and the other being associated with the second LO image signal; and
obtaining a solution representative of the data-carrying signal power spectral component based on the measured optical power spectrum of the optical signal such that a spectral correlation function calculated for pairs of spectral components spectrally separated by the symbol frequency in the solution representative of the data-carrying signal power spectral component matches the measured spectral correlation function;
wherein obtaining the solution representative of the data-carrying signal power spectral content comprises:
providing a non-linear regression model relating the measured optical power spectrum to the measured spectral correlation function; and
determining the solution representative of the data-carrying signal power spectral content using the non-linear regression model.
23. The system of claim 22 wherein the LO spectral shifter is an electro-optic modulator.
24. The system of claim 22, further comprising a polarization analyzer disposed upstream of the spectrally resolving detector unit, the polarization analyzer comprising:
a polarization scrambler configured to change a polarization state of the optical signal according to time; and
a polarizer configured to pass a fixed polarization component of the optical signal having a changed polarization state.
Applications Claiming Priority (3)
| Application Number | Priority Date | Filing Date | Title |
|---|---|---|---|
| US201762490113P | 2017-04-26 | 2017-04-26 | |
| US62/490,113 | 2017-04-26 | ||
| PCT/IB2018/052423 WO2018197975A1 (en) | 2017-04-26 | 2018-04-06 | Noise-free measurement of the spectral shape of a modulated signal using spectral correlation |
Publications (2)
| Publication Number | Publication Date |
|---|---|
| CN110383714A CN110383714A (en) | 2019-10-25 |
| CN110383714B true CN110383714B (en) | 2022-06-17 |
Family
ID=63918973
Family Applications (1)
| Application Number | Title | Priority Date | Filing Date |
|---|---|---|---|
| CN201880015245.8A Active CN110383714B (en) | 2017-04-26 | 2018-04-06 | Noiseless measurement of spectral shape of modulated signal using spectral correlation |
Country Status (5)
| Country | Link |
|---|---|
| US (1) | US10727940B2 (en) |
| EP (1) | EP3616336B1 (en) |
| JP (1) | JP7169980B2 (en) |
| CN (1) | CN110383714B (en) |
| WO (1) | WO2018197975A1 (en) |
Families Citing this family (6)
| Publication number | Priority date | Publication date | Assignee | Title |
|---|---|---|---|---|
| US10812183B2 (en) | 2019-02-15 | 2020-10-20 | Viavi Solutions Inc. | Mitigating polarization dependent loss (PDL) by transforming frequency components to a ball |
| EP3758258B1 (en) * | 2019-06-27 | 2023-04-12 | Viavi Solutions Inc. | Measuring linear and non-linear transmission perturbations in optical transmission systems |
| CN110768718B (en) * | 2019-10-29 | 2021-05-11 | Oppo广东移动通信有限公司 | Ultraviolet light communication method and related product |
| CN114079505B (en) * | 2020-08-19 | 2023-07-18 | 华为技术有限公司 | Optical signal power detection circuit, system, method and chip |
| US11515946B1 (en) | 2021-11-24 | 2022-11-29 | Rockwell Collins, Inc. | System and method for analog estimation and streaming of a spectral correlation function (SCF) |
| US11539431B1 (en) * | 2022-01-18 | 2022-12-27 | Huawei Technologies Co., Ltd. | Systems and methods for optical filter fault localization |
Citations (2)
| Publication number | Priority date | Publication date | Assignee | Title |
|---|---|---|---|---|
| WO2011020195A1 (en) * | 2009-08-19 | 2011-02-24 | Exfo Inc. | In-band optical noise measurement using differential polarization response |
| CN102714544A (en) * | 2010-02-15 | 2012-10-03 | 爱斯福公司 | Reference-based in-band OSNR measurement on polarization-multiplexed signals |
Family Cites Families (18)
| Publication number | Priority date | Publication date | Assignee | Title |
|---|---|---|---|---|
| US6256103B1 (en) | 2000-02-17 | 2001-07-03 | Agilent Technologies, Inc. | System and method for optical heterodyne detection of an optical signal |
| JP2002168691A (en) * | 2000-11-28 | 2002-06-14 | Ando Electric Co Ltd | Apparatus and method for measuring noise factor |
| US6515276B2 (en) | 2001-03-17 | 2003-02-04 | Agilent Technologies, Inc. | Heterodyne optical spectrum analyzer with provisions for intensity noise subtraction |
| RU2518182C2 (en) * | 2009-08-31 | 2014-06-10 | Хуавэй Текнолоджиз Ко., Лтд. | Method and apparatus for detecting in-band optical signal-to-noise ratio |
| EP2393223B1 (en) * | 2010-04-26 | 2013-01-16 | JDSU Deutschland GmbH | In-band SNR measurement based on spectral correlation |
| JP5631636B2 (en) * | 2010-06-07 | 2014-11-26 | アンリツ株式会社 | OSNR evaluation apparatus and OSNR evaluation method |
| EP2676384B1 (en) * | 2011-02-18 | 2021-03-31 | EXFO Inc. | Characterization of non-ase noise on optical signals |
| US20160072579A1 (en) * | 2013-05-01 | 2016-03-10 | The University Of Sydney | A system and a method for generating information indicative of an impairment of an optical signal |
| US9596027B2 (en) | 2013-05-03 | 2017-03-14 | Exfo Inc. | Signal deformation measurement on polarization-multiplexed signals |
| JP6273806B2 (en) * | 2013-12-03 | 2018-02-07 | 富士通株式会社 | Apparatus and method for generating calibration coefficients for optical signal-to-noise ratio monitoring |
| EP3018839B1 (en) | 2014-11-05 | 2020-01-15 | EXFO Inc. | In-band noise and/or spectral deformation measurement on polarization-multiplexed signals |
| US9954610B2 (en) * | 2014-11-05 | 2018-04-24 | Exfo Inc. | In-band noise determination on optical communication signals |
| US9825698B2 (en) * | 2014-12-09 | 2017-11-21 | Viavi Solutions Inc. | Determining in-band optical signal-to-noise ratio in polarization-multiplexed optical signals using signal correlations |
| JP6651881B2 (en) * | 2016-02-04 | 2020-02-19 | 富士通株式会社 | Optical receiver evaluation method and light source device |
| US10367584B2 (en) * | 2016-07-29 | 2019-07-30 | PSquared Technologies LLC | Electro-mechanic-photonic delay line for analog signal processing |
| JP7003428B2 (en) * | 2017-03-30 | 2022-01-20 | 富士通株式会社 | Unbalance compensation device, transmitter, receiver, and imbalance compensation method |
| CN108088655B (en) * | 2017-12-18 | 2019-05-10 | 南京航空航天大学 | Based on double sideband modulation and the optical device measurement method of frequency displacement, device |
| US10677726B2 (en) * | 2017-12-19 | 2020-06-09 | International Business Machines Corporation | Tunable diode laser absorption spectroscopy with corrected laser ramping nonlinearities |
-
2018
- 2018-04-06 EP EP18791589.7A patent/EP3616336B1/en active Active
- 2018-04-06 CN CN201880015245.8A patent/CN110383714B/en active Active
- 2018-04-06 JP JP2019547286A patent/JP7169980B2/en active Active
- 2018-04-06 WO PCT/IB2018/052423 patent/WO2018197975A1/en unknown
-
2019
- 2019-06-19 US US16/445,992 patent/US10727940B2/en active Active
Patent Citations (2)
| Publication number | Priority date | Publication date | Assignee | Title |
|---|---|---|---|---|
| WO2011020195A1 (en) * | 2009-08-19 | 2011-02-24 | Exfo Inc. | In-band optical noise measurement using differential polarization response |
| CN102714544A (en) * | 2010-02-15 | 2012-10-03 | 爱斯福公司 | Reference-based in-band OSNR measurement on polarization-multiplexed signals |
Non-Patent Citations (3)
| Title |
|---|
| In-Band Estimation of Optical Signal-to-Noise Ratio From Equalized Signals in Digital Coherent Receivers;Faruk,Md Saifuddin等;《IEEE PHOTONICS JOURNAL》;20140204;全文 * |
| Non-intrusive OSNR measurement of polarization-multiplexed signals with spectral shaping and subject to fiber non-linearity with minimum channel spacing of 37.5GHz;Gariepy,Daniel等;《OPTICS EXPRESS》;20160915;第24卷(第18期);全文 * |
| 偏振复用光通信系统信号处理技术研究;易安林;《中国优秀博硕士学位论文全文数据库(博士)信息科技辑》;20141015;I136-65 * |
Also Published As
| Publication number | Publication date |
|---|---|
| WO2018197975A1 (en) | 2018-11-01 |
| CN110383714A (en) | 2019-10-25 |
| JP2020518146A (en) | 2020-06-18 |
| EP3616336B1 (en) | 2021-11-17 |
| US20190305845A1 (en) | 2019-10-03 |
| EP3616336A4 (en) | 2021-01-13 |
| US10727940B2 (en) | 2020-07-28 |
| EP3616336A1 (en) | 2020-03-04 |
| JP7169980B2 (en) | 2022-11-11 |
Similar Documents
| Publication | Publication Date | Title |
|---|---|---|
| CN110383714B (en) | Noiseless measurement of spectral shape of modulated signal using spectral correlation | |
| CN111279631B (en) | Monitoring performance of optical network equipment using pilot tones | |
| US20200235821A1 (en) | Coherent optical receiver testing | |
| EP1878142A1 (en) | Method and device for in-band optical performance monitoring | |
| JP2020518146A5 (en) | ||
| JP5637358B2 (en) | Spectrum measuring apparatus and measuring method | |
| JP2005260938A (en) | Method and system for superheterodyne-detecting optical input signal | |
| JP2002323383A (en) | Heterodyne optical spectrum analyzer with provision for intensity noise subtraction | |
| US8160443B2 (en) | Calibration factor for interferometric optical signal-to-noise ratio measurement | |
| US8666245B2 (en) | System and method for measuring optical signal-to-noise ratio | |
| US20190334628A1 (en) | Coherent optical receiver testing | |
| US8160442B2 (en) | Interferometric optical signal-to-noise ratio measurement using a calibration factor | |
| Zhong et al. | A robust reference optical spectrum based in-Band OSNR monitoring method suitable for flexible optical networks | |
| WO2006128254A1 (en) | Wdm optical performance monitoring | |
| Roudas et al. | Coherent frequency-selective polarimeter for polarization-mode dispersion monitoring | |
| RU208857U1 (en) | Device for determining the Doppler frequency measurement of the reflected radar signal | |
| CN113472448B (en) | Chromatic dispersion monitoring method based on coherent optical communication system | |
| Bo et al. | A simple time-domain CSPR measurement method for optical single sideband signal | |
| KR100325685B1 (en) | Optical signal wavelength and optical power monitoring apparatus, monitoring method and recording medium therefor | |
| BR102021022826A2 (en) | METHOD AND APPARATUS FOR MEASURING THE COEFFICIENT OF NONLINEARITY OF THE INDEX OF REFRACTION OF SINGLE MODE OPTICAL GUIDES. | |
| JP2012042380A (en) | Optical spectrum analyzer | |
| WO2016023196A1 (en) | Method and apparatus for determining optical signal-to-noise ratio | |
| WO2012031784A1 (en) | An optical measurement method and system |
Legal Events
| Date | Code | Title | Description |
|---|---|---|---|
| PB01 | Publication | ||
| PB01 | Publication | ||
| SE01 | Entry into force of request for substantive examination | ||
| SE01 | Entry into force of request for substantive examination | ||
| GR01 | Patent grant | ||
| GR01 | Patent grant |