CN110106229B - Method for isolating microvesicles - Google Patents
Method for isolating microvesicles Download PDFInfo
- Publication number
- CN110106229B CN110106229B CN201910000819.0A CN201910000819A CN110106229B CN 110106229 B CN110106229 B CN 110106229B CN 201910000819 A CN201910000819 A CN 201910000819A CN 110106229 B CN110106229 B CN 110106229B
- Authority
- CN
- China
- Prior art keywords
- rna
- microvesicle
- microvesicles
- plasma
- membrane
- Prior art date
- Legal status (The legal status is an assumption and is not a legal conclusion. Google has not performed a legal analysis and makes no representation as to the accuracy of the status listed.)
- Active
Links
Images


Classifications
-
- C—CHEMISTRY; METALLURGY
- C12—BIOCHEMISTRY; BEER; SPIRITS; WINE; VINEGAR; MICROBIOLOGY; ENZYMOLOGY; MUTATION OR GENETIC ENGINEERING
- C12Q—MEASURING OR TESTING PROCESSES INVOLVING ENZYMES, NUCLEIC ACIDS OR MICROORGANISMS; COMPOSITIONS OR TEST PAPERS THEREFOR; PROCESSES OF PREPARING SUCH COMPOSITIONS; CONDITION-RESPONSIVE CONTROL IN MICROBIOLOGICAL OR ENZYMOLOGICAL PROCESSES
- C12Q1/00—Measuring or testing processes involving enzymes, nucleic acids or microorganisms; Compositions therefor; Processes of preparing such compositions
- C12Q1/68—Measuring or testing processes involving enzymes, nucleic acids or microorganisms; Compositions therefor; Processes of preparing such compositions involving nucleic acids
- C12Q1/6806—Preparing nucleic acids for analysis, e.g. for polymerase chain reaction [PCR] assay
-
- C—CHEMISTRY; METALLURGY
- C12—BIOCHEMISTRY; BEER; SPIRITS; WINE; VINEGAR; MICROBIOLOGY; ENZYMOLOGY; MUTATION OR GENETIC ENGINEERING
- C12N—MICROORGANISMS OR ENZYMES; COMPOSITIONS THEREOF; PROPAGATING, PRESERVING, OR MAINTAINING MICROORGANISMS; MUTATION OR GENETIC ENGINEERING; CULTURE MEDIA
- C12N15/00—Mutation or genetic engineering; DNA or RNA concerning genetic engineering, vectors, e.g. plasmids, or their isolation, preparation or purification; Use of hosts therefor
- C12N15/09—Recombinant DNA-technology
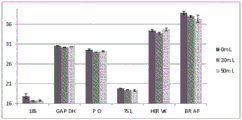
- C12N15/10—Processes for the isolation, preparation or purification of DNA or RNA
- C12N15/1003—Extracting or separating nucleic acids from biological samples, e.g. pure separation or isolation methods; Conditions, buffers or apparatuses therefor
- C12N15/1006—Extracting or separating nucleic acids from biological samples, e.g. pure separation or isolation methods; Conditions, buffers or apparatuses therefor by means of a solid support carrier, e.g. particles, polymers
-
- C—CHEMISTRY; METALLURGY
- C12—BIOCHEMISTRY; BEER; SPIRITS; WINE; VINEGAR; MICROBIOLOGY; ENZYMOLOGY; MUTATION OR GENETIC ENGINEERING
- C12N—MICROORGANISMS OR ENZYMES; COMPOSITIONS THEREOF; PROPAGATING, PRESERVING, OR MAINTAINING MICROORGANISMS; MUTATION OR GENETIC ENGINEERING; CULTURE MEDIA
- C12N15/00—Mutation or genetic engineering; DNA or RNA concerning genetic engineering, vectors, e.g. plasmids, or their isolation, preparation or purification; Use of hosts therefor
- C12N15/09—Recombinant DNA-technology
- C12N15/10—Processes for the isolation, preparation or purification of DNA or RNA
- C12N15/1003—Extracting or separating nucleic acids from biological samples, e.g. pure separation or isolation methods; Conditions, buffers or apparatuses therefor
- C12N15/1017—Extracting or separating nucleic acids from biological samples, e.g. pure separation or isolation methods; Conditions, buffers or apparatuses therefor by filtration, e.g. using filters, frits, membranes
Abstract
The present invention provides novel methods for isolating microvesicles from a biological sample and for extracting nucleic acids from the microvesicles.
Description
The application is a divisional application of an invention patent application with the application date of 2014, 1, 3, and the application number of 201480002901.2, and the name of the invention is 'a method for separating microvesicles'. This application claims priority and benefit of U.S. provisional application No. 61/748,575, filed on 3/1/2013, the contents of which are incorporated herein by reference in their entirety.
Technical Field
The present invention provides novel methods and kits for isolating microvesicles from a biological sample and for extracting nucleic acids from the microvesicles.
Background
Membrane vesicles shed by the cells and having a diameter of < 0.8 μm are collectively referred to as microvesicles. Microvesicles from various cellular sources have been extensively studied with respect to protein and lipid content. Recently, microvesicles have been found to also contain DNA and RNA, including genomic DNA, cDNA, mitochondrial DNA, microrna (miRNA), and messenger RNA (mRNA).
Due to the genetic and proteomic information contained in microvesicles shed by cells, current research is aimed at utilizing microvesicles to gain further insight into these cellular states, such as disease states or disease predispositions. Accordingly, there is a need for methods of isolating microvesicles from a biological sample, and methods of extracting high quality nucleic acids for accurate diagnosis of medical conditions and diseases.
Disclosure of Invention
The present invention provides methods and kits for isolating microvesicles by capturing the microvesicles to a surface and then lysing the microvesicles to release nucleic acids contained therein. In some embodiments, the methods and kits isolate and extract RNA from the microvesicle fraction. These methods and kits are referred to herein as EXO50 or EXO 50-based methods and/or kits. In some embodiments, the methods and kits isolate and extract DNA from the microvesicle fraction. The RNA can then be processed for further analysis. These methods and kits are referred to herein as EXO52 or EXO 52-based methods and/or kits, and may include derivatives of the EXO52 methods and/or kits, referred to herein as EXO52.2. The DNA can then be processed for further analysis.
The invention also provides methods and kits for isolating microvesicles by capturing the microvesicles to a surface and subsequently eluting the microvesicles from the captured surface. These methods and kits are referred to herein as EXO51. The microvesicles may then be processed for further analysis.
Previous procedures for separating microvesicle fractions from biological samples and extracting nucleic acids from the microvesicle fractions relied on the use of ultracentrifugation, e.g. spinning at less than 10,000xg for 1-3 hours, followed by removal of the supernatant, washing of the pellet, lysis of the pellet and purification of the nucleic acids, e.g. RNA, on a column. These previous methods demonstrate several drawbacks such as being slow, cumbersome, subject to batch-to-batch variability, and not suitable for scalability. Methods and kits for separation and extraction overcome these disadvantages and provide a spin-based column for separation and extraction that is fast, robust, and easily scalable to large volumes.
The methods and kits use the following general procedure to isolate and extract RNA from a biological sample, referred to herein as "EXO 50. First, the microvesicle fraction is bound to a membrane filter, and the filter is washed. Subsequently, on-membrane lysis and RNA release were performed using reagents. Chloroform extraction was then performed using a PLG tube, followed by ethanol conditioning. The RNA is then bound to a silica column, washed and then eluted. The RNA is subsequently processed for further analysis.
Membranes used in the EXO50 method and kit have large pores and are generally positively charged. In some embodiments, more than one membrane is used in the EXO50 methods and kits, e.g., two or more membranes are used. In some embodiments, three membranes are used. In some embodiments, more than three membranes are used. In some embodiments, each membrane is a different type of membrane. In some embodiments, each film is the same type of film. In some embodiments, the film layer is a combination of at least two different types of films. In some embodiments, each film is composed of a different material. In some embodiments, each layer of film is composed of the same material. In some embodiments, each film is charged. In some embodiments, at least one layer is uncharged. In some embodiments, each film has the same charge. In some embodiments, each film has the same charge. In some embodiments, each film has a different charge.
In some embodiments, the or at least one of the membranes is a positively charged membrane. In some embodiments, the capture surface or at least one layer is a regenerated cellulose, strongly basic anion exchanger ("RC/SBAE") membrane, which is a positively charged membrane and is an anion exchanger with a quaternary amine. For example, RC/SBAE films are made of quaternary ammonium, R-CH 2 -N + (CH 3 ) 3 And (4) functionalizing. In some embodiments, the membrane has a pore size of at least 3 um.
The number of membranes used in the EXO50 method and kit correlates to the total sample volume that can be analyzed at one time. The number of layers and the capacity of each layer, e.g., binding capacity, flow-through rate, or other measure, used in the methods and kits affect the total volume of sample sizes that can be used. More layers may be used in the method and/or kit when one or each layer has a higher binding capacity and fewer layers may be used in the method and/or kit when one or each layer has a lower binding capacity. In addition, the viscosity and composition of the sample also affects the total volume of sample sizes that can be used. For example, in some embodiments where the sample is plasma, about 1ml sample is processed for each membrane used in the EXO50 methods and kits.
In some embodiments, the agent used for on-membrane cleavage is QIAzol. In some embodiments, QIAzol is used in a volume of about 700 ul.
The method and kit isolate and extract DNA from a biological sample using the following general procedure, which is referred to herein as "EXO52". First, the microvesicle fraction is bound to a membrane filter, and the filter is washed. Subsequently, on-membrane lysis and nucleic acid, e.g., RNA, release is performed using reagents. Ethanol precipitation followed by lysis and protease degradation was then performed. The DNA is then bound to a silica column, washed and then eluted. The DNA was subsequently processed for further analysis.
The membranes used in the EXO52 methods and kits have large pores and are generally positively charged. In some embodiments, more than one membrane is used in the EXO52 methods and kits, e.g., two or more membranes are used. In some embodiments, three membranes are used. In some embodiments, more than three membranes are used. In some embodiments, each membrane is a different type of membrane. In some embodiments, each membrane is the same type of membrane. In some embodiments, the film layer is a combination of at least two different types of films. In some embodiments, each film is composed of a different material. In some embodiments, each film is composed of the same material. In some embodiments, each film is charged. In some embodiments, at least one layer is uncharged. In some embodiments, each film has the same charge. In some embodiments, each film has the same charge. In some embodiments, each film has a different charge.
In some embodiments, the membrane or at least one of the membranes is a positively charged membrane. In some embodiments of the present invention, the substrate is,the capture surface or at least one layer is a regenerated cellulose, strongly basic anion exchanger ("RC/SBAE") membrane, which is a positively charged membrane and is an anion exchanger with a quaternary amine. For example, RC/SBAE films are made of quaternary ammonium, R-CH 2 -N + (CH 3 ) 3 And (4) functionalizing. In some embodiments, the membrane has a pore size of at least 3 um.
The number of membranes used in the EXO52 method and kit correlates to the total sample volume that can be analyzed at one time. The number of layers and the capacity of each layer, e.g., binding capacity, flow-through rate, or other measure, used in the methods and kits affect the total volume of sample sizes that can be used. More layers may be used in the method and/or kit when one or each layer has a higher binding capacity and fewer layers may be used in the method and/or kit when one or each layer has a lower binding capacity. In addition, the viscosity and composition of the sample also affects the total volume of sample sizes that can be used. For example, in some embodiments where the sample is plasma, about 1ml sample is processed for each membrane used in the EXO52 method and kit.
In some embodiments, the agent used for on-membrane cleavage is QIAzol. In some embodiments, QIAzol is used in a volume of about 700 ul.
The membranes used in the EXO51 methods and kits have large pores and are generally positively charged. In some embodiments, more than one membrane is used in the EXO51 methods and kits, e.g., two or more membranes are used. In some embodiments, three membranes are used. In some embodiments, more than three membranes are used. In some embodiments, each membrane is a different type of membrane. In some embodiments, each film is the same type of film. In some embodiments, the film layer is a combination of at least two different types of films. In some embodiments, each film is composed of a different material. In some embodiments, each layer of film is composed of the same material. In some embodiments, each film is charged. In some embodiments, at least one layer is uncharged. In some embodiments, each film has the same charge. In some embodiments, each film has the same charge. In some embodiments, each film has a different charge.
In some embodiments, the membrane or at least one of the membranes is a positively charged membrane. In some embodiments, the capture surface or at least one layer is a regenerated cellulose, strongly basic anion exchanger ("RC/SBAE") membrane, which is a positively charged membrane and is an anion exchanger with a quaternary amine. For example, RC/SBAE films are made of quaternary ammonium, R-CH 2 -N + (CH 3 ) 3 And (4) functionalizing. In some embodiments, the membrane has a pore size of at least 3 um.
The number of membranes used in the EXO51 method and kit correlates to the total sample volume that can be analyzed at one time. The number of layers and the capacity of each layer, e.g., binding capacity, flow-through rate, or other measure, used in the methods and kits affect the total volume of sample sizes that can be used. More layers may be used in the method and/or kit when one or each layer has a higher binding capacity and fewer layers may be used in the method and/or kit when one or each layer has a lower binding capacity. In addition, the viscosity and composition of the sample also affects the total volume of sample sizes that can be used. For example, in some embodiments where the sample is plasma, about 1ml sample is processed for each membrane used in the EXO51 method and kit.
In some embodiments, the agent used for on-membrane cleavage is QIAzol. In some embodiments, QIAzol is used in a volume of about 700 ul.
Purification of the microvesicle fraction in any of these methods and/or kits is performed using ion exchange techniques. In some embodiments, the ion exchange technique is a technique selected from those shown in the working examples provided herein.
In one aspect, a method for extracting nucleic acids from a biological sample comprises (a) providing a biological sample; (b) Contacting the biological sample with the capture surface under conditions sufficient to retain the microvesicle fraction on or in the capture surface; (c) Lysing the microvesicle fraction while the microvesicles are on or in the capture surface; and (d) extracting nucleic acid from the microvesicle fraction. Alternatively, a further method for extracting nucleic acids from a biological sample comprises eluting a microvesicle fraction from a capture surface after step (b), collecting the eluted microvesicle fraction, and extracting nucleic acids from the eluted microvesicle fraction. Optionally, the eluted microvesicle fraction may be concentrated by a rotary concentrator to obtain a concentrated microvesicle fraction, and then extracting nucleic acids from the concentrated microvesicle fraction.
In one embodiment, the capture surface is positively charged. In another embodiment, the capture surface is negatively charged. In another embodiment, the capture surface is neutral. In some embodiments, the capture surface comprises more than one layer. In some embodiments, more than one membrane is used in the EXO51 methods and kits, e.g., two or more membranes are used. In some embodiments, three membranes are used. In some embodiments, more than three membranes are used. In some embodiments, each membrane is a different type of membrane. In some embodiments, each membrane is the same type of membrane. In some embodiments, the film layer is a combination of at least two different types of films. In some embodiments, each film is composed of a different material. In some embodiments, each film is composed of the same material. In some embodiments, each membrane is charged. In some embodiments, at least one layer is uncharged. In some embodiments, each film has the same charge. In some embodiments, each film has the same charge. In some embodiments, each film has a different charge.
In one embodiment, the capture surface is a bead. For example, the beads are magnetic. Alternatively, the beads are non-magnetic. In another embodiment, the beads are functionalized with affinity ligands.
Preferably, the capture surface is a membrane. In one aspect, the membrane comprises regenerated cellulose. For example, the membrane has a pore size in the range of 3-5 um. In another aspect, the membrane comprises Polyvinylsulfone (PES). For example, the membrane has a pore size in the range of 20 nm-0.8 um. In another aspect, the membrane is positively charged.
In some aspects, the membrane is functionalizedIn (1). For example, membranes made from quaternary ammonium R-CH 2 -N + (CH 3 ) 3 And (4) functionalizing.
In one embodiment, the capture surface comprises three membranes, wherein the three membranes are directly adjacent to each other.
Preferably, the biological sample is plasma, serum, urine, cerebrospinal fluid or cell culture supernatant.
In some aspects, the methods and/or kits described herein further comprise contacting the biological sample with a loading buffer. The loading buffer is in the pH range of 4-8. In one aspect, the loading buffer has a neutral pH.
The methods and/or kits described herein provide for the extraction of nucleic acids from microvesicles. Preferably, the extracted nucleic acid is RNA. The extracted RNA may comprise messenger RNA, ribosomal RNA, transfer RNA, small RNAs such as microrna, non-coding RNA and any other short RNA and/or RNA fragments, or any combination thereof.
In some embodiments, the methods and/or kits are used to remove nucleic acid species from a biological sample. For example, the EXO50 and/or kit is used to remove RNA species from a biological sample, including by way of non-limiting example removing vesicle-bound RNA from the biological sample to isolate one or more reciprocal RNAs (recipro RNAs) from the flow-through.
Various aspects and embodiments of the invention will now be described in detail. It will be understood that modifications in detail can be made without departing from the scope of the invention. Further, unless the context requires otherwise, singular terms shall include the plural and plural terms shall include the singular.
All patents, patent applications, and publications identified are expressly incorporated herein by reference for the purpose of describing and disclosing, for example, the methodologies described in such publications, which could be used in connection with the present invention. These publications are provided solely for their disclosure prior to the filing date of the present application. Nothing in this regard should be construed as an admission that the inventors are not entitled to antedate such disclosure by virtue of prior invention or any other reason. All statements as to the date or representation as to the contents of these documents is based on the information available to the applicants and does not constitute any admission as to the correctness of the dates or contents of these documents.
Drawings
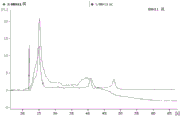
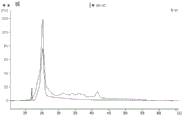
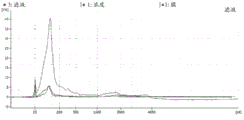
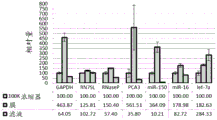
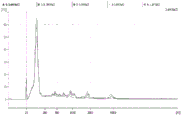
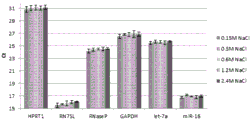
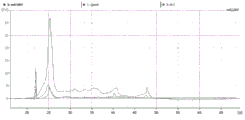
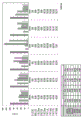
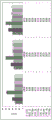
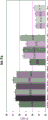
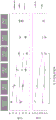
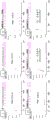
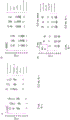
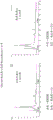
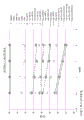
FIG. 1 is a series of graphs depicting how plasma microvesicle RNA can be isolated using a 0.65um positively charged Q PES filter (Millipore) in vacuum form. Figure 1A depicts a bioanalyzer plot comparing the quality, concentration, and size distribution of microvesicle total RNA extracted from 4mL normal control plasma by ultracentrifugation and 0.65um positively charged Q Polyvinylsulfone (PES) vacuum filtration (filter and filtrate). Relative Fluorescence Units (FU) are plotted against time. 25 The s peak represents the internal standard. The most prominent peak represents small RNA. The peaks at 41S and 47S represent 18S and 28S, respectively. Figure 1B depicts mRNA and mature miRNA levels analyzed from the same sample using quantitative RT-PCR. Relative magnitudes are presented as mean ± SD.
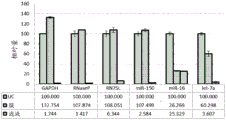
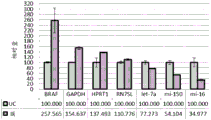
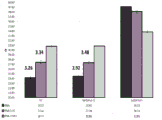
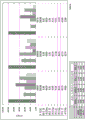
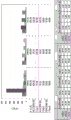
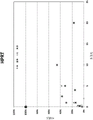
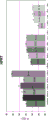
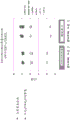
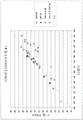
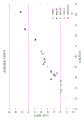
Fig. 2 is a series of graphs depicting how BRAF V600E mutations can be detected in 2mL plasma and 12mL plasma using 0.65um positively charged Q PES filters (Millipore) in vacuum format. BRAF V600E copy number was evaluated using quantitative RT-PCR from 2mL and 12mL plasma extracted by ultracentrifugation and 0.65um positively charged Q PES vacuum filtration (filter, filtrate and wash).
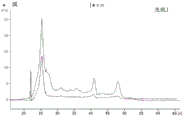
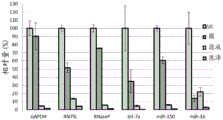
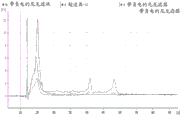
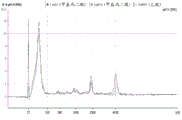
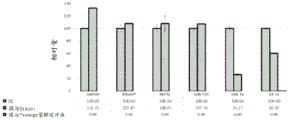
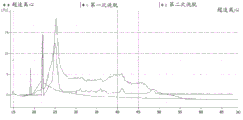
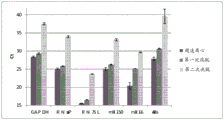
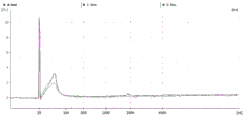
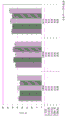
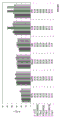
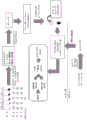
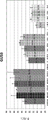
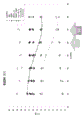
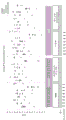
FIG. 3 is a series of graphs depicting how plasma microvesicle RNA can be isolated using a 3-5um positively charged Q regenerated cellulose filter (Sartorius) in a spin column format. Figure 3A depicts a bioanalyzer plot comparing the quality, concentration, and size distribution of microvesicle total RNA extracted from 4mL normal control plasma by ultracentrifugation and 3-5um positively charged Q regenerated cellulose spin column filtration (filter, filtrate, and wash). Relative Fluorescence Units (FU) are plotted against time. 25 The s peak represents the internal standard. The most prominent peak represents small RNA. The peaks at 41S and 47S represent 18S and 28S, respectively. Figure 3B depicts mRNA and mature miRNA levels analyzed from the same sample using quantitative RT-PCR. Relative magnitudes are presented as mean ± SD.
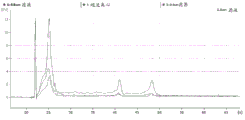
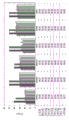
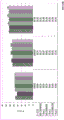
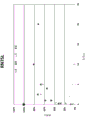
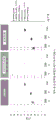
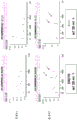
FIG. 4 is a series of charts describing how plasma microvesicle RNA can be isolated using a 0.8um negatively charged S PES filter (Pall) in the form of an in-house spin column. Figure 4A is a bioanalyzer plot comparing the mass, concentration, and size distribution of microvesicle total RNA extracted from 4mL normal control plasma by ultracentrifugation and 0.8um negatively charged S PES spin column filtration. Relative Fluorescence Units (FU) are plotted against time. 25 The s peak represents the internal standard. The most prominent peak represents small RNA. The peaks at 41S and 47S represent 18S and 28S, respectively. Figure 4B depicts mRNA and mature miRNA levels analyzed from the same sample using quantitative RT-PCR. Relative magnitudes are presented as mean ± SD.
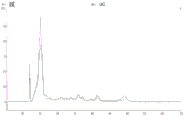
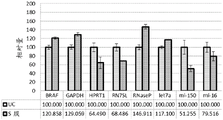
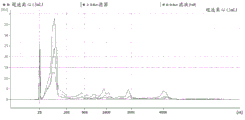
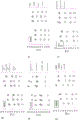
Figure 5 is a series of charts describing how plasma microvesicle RNA can be isolated using a 0.8um positively charged Q PES filter (Pall) in the form of an in-house spin column. FIG. 5A is a bioanalyzer plot comparing the quality, concentration and size distribution of microvesicle total RNA extracted from 4mL normal control plasma by ultracentrifugation and 0.8um positively charged Q PES spin column filtration. Relative Fluorescence Units (FU) are plotted against time. 25 The s peak represents the internal standard. The most prominent peak represents small RNA. The peak at-41S represents 18S. Figure 5B depicts mRNA and mature miRNA levels analyzed from the same sample using quantitative RT-PCR. Relative magnitudes are presented as mean ± SD.
Figure 6 is a graph depicting how plasma microvesicle RNA can be isolated using a Q PES syringe filter (Pall) positively charged at 0.8 um. Plasma microvesicle RNA can be isolated with 0.8um negatively charged S PES syringe filter (Pall). mRNA and mature miRNA levels were analyzed using quantitative RT-PCR from 4mL plasma extracted by ultracentrifugation, 0.8um positively charged Q PES syringe filtration (filter and filtrate) and 0.8um negatively charged S PES syringe filtration (filter and filtrate). Relative magnitudes are presented as mean ± SD.
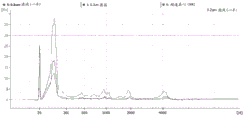
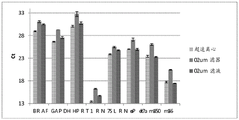
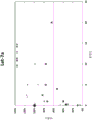
Figure 7 is a series of graphs depicting how plasma microvesicle RNA can be isolated using a charged nylon syringe filter. Figure 7A is a bioanalyzer plot comparing the mass, concentration and size distribution of microvesicle total RNA extracted from 4mL normal control plasma by ultracentrifugation and negatively charged nylon syringe filtration (filter and filtrate). Relative Fluorescence Units (FU) are plotted against time. 25 The s peak represents the internal standard. The most prominent peak represents small RNA. The peaks at 41S and 47S represent 18S and 28S, respectively. Figure 7B depicts mRNA and mature miRNA levels analyzed on the same samples using quantitative RT-PCR. The cycle threshold (Ct) is presented as mean ± SD.
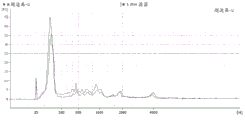
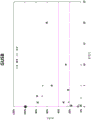
FIG. 8 is a series of graphs depicting how urine microvesicle RNA can be isolated using a 0.65um positively charged Q PES filter (Millipore) in vacuum format. FIG. 8A is a bioanalyzer plot comparing the quality, concentration, and size distribution of microvesicle total RNA extracted from 10mL normal control urine by ultracentrifugation and 0.65um positively charged Q PES vacuum filtration (filter and filtrate). Relative Fluorescence Units (FU) are plotted against size (nt). 25 The s peak represents the internal standard. The most prominent peak represents small RNA. The peaks at 1900 nt and 3900 nt represent 18S and 28S, respectively. Figure 8B depicts mRNA and mature miRNA levels analyzed from the same sample using quantitative RT-PCR. Relative magnitudes are presented as mean ± SD.
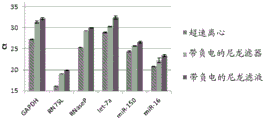
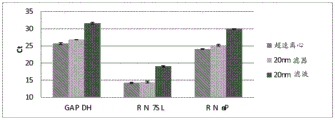
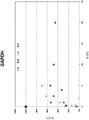
FIG. 9 is a graph depicting how qRT-PCR was inhibited in plasma samples extracted using negatively charged S regenerated cellulose filters (Thermo Scientific) in the form of spin columns. GAPDH levels were analyzed using quantitative RT-PCR on 4mL plasma samples extracted using ultracentrifugation, 3-5um positively charged Q regenerated cellulose spin column filtration, and 3-5um negatively charged S regenerated cellulose spin column filtration. All RNA samples were diluted 1. The cycle threshold (Ct) is presented as mean ± SD.
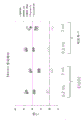
Figure 10 is a series of graphs depicting how microvesicles are stable at acidic pH. Figure 10A is a bioanalyzer plot comparing the mass, concentration and size distribution of microvesicle total RNA extracted from 1.9mL normal control plasma by centrifugation. Relative Fluorescence Units (FU) are plotted against size (nt). 25 The nt peak represents the internal standard. The most prominent peak represents small RNA. The peaks at 1900 nt and 4000 nt represent 18S and 28S, respectively. Figure 10B depicts mRNA and mature miRNA levels analyzed on the same samples using quantitative RT-PCR. The cycle threshold (Ct) is presented as mean ± SD.
Figure 11 is a series of graphs depicting how microvesicles are unstable at alkaline pH. Figure 11A is a bioanalyzer plot comparing the mass, concentration and size distribution of microvesicle total RNA extracted from 1.9mL normal control plasma by centrifugation. Relative Fluorescence Units (FU) are plotted against size (nt). 25 The nt peak represents the internal standard. The most prominent peak represents small RNAs. It should be shown at-150 nt. However, due to technical errors, the peak is shown at 0 nt. In addition, due to technical errors, the peaks at 1500 nt and 3700 nt represent 18S and 28S, respectively. In contrast, the 18S and 28S peaks should be shown at 1900 nt and 4700 nt, respectively. Figure 11B depicts mRNA and mature miRNA levels analyzed on the same samples using quantitative RT-PCR. The cycle threshold (Ct) is presented as mean ± SD.
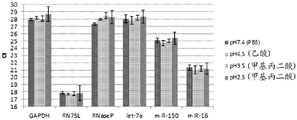
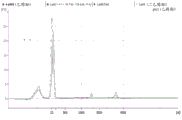
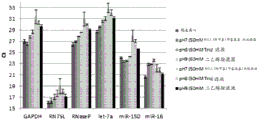
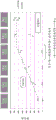
Figure 12 is a series of graphs depicting how microvesicle capture and/or microvesicle stability on a charged filter is affected by buffer pH and/or buffer concentration and/or buffer type (compare buffers at the same concentration, but different concentrations of functional groups). Figure 12A is a bioanalyzer plot comparing the quality, concentration, and size distribution of microvesicle total RNA extracted from 4.8mL normal control plasma by ultracentrifugation and positively charged Q regenerated cellulose centrifugation filtration (filter and filtrate). The filtered sample was separated with the following buffer settings:
100mM bis [ tris (hydroxymethyl) methylamino ] propane, 150mM NaCl, pH6.8 (2 XLoading buffer) and 50mM bis [ tris (hydroxymethyl) methylamino ] propane, 150mM NaCl, pH7 (equilibration and wash buffers)
100mM Tris, 150mM NaCl, pH8 (2X loading buffer) and 50mM Tris, 150mM NaCl, pH8 (equilibration and wash buffers)
100mM diethanolamine, 150mM NaCl, pH9 (2X loading buffer) and 50mM diethanolamine, 150mM NaCl, pH9 (equilibration and wash buffers)
In fig. 12A, the legend identifies the samples by equilibration and wash buffers only. Relative Fluorescence Units (FU) are plotted against time. 25 The s peak represents the internal standard. The most prominent peak represents small RNA. The peaks at 41S and 47S represent 18S and 28S, respectively. Figure 12B depicts mRNA and mature miRNA levels analyzed from the same sample using quantitative RT-PCR. The cycle threshold (Ct) is presented as mean ± SD.
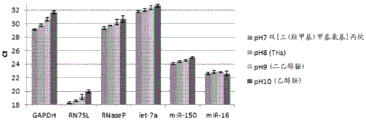
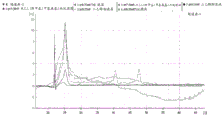
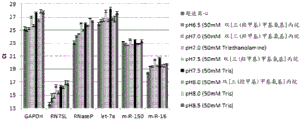
Figure 13 is a series of graphs depicting how microvesicle capture and/or microvesicle stability on a charged filter is affected by buffer pH and/or buffer concentration and/or buffer type (compare buffers at the same concentration, but different concentrations of functional groups). Figure 13A is a bioanalyzer plot comparing the quality, concentration, and size distribution of microvesicle total RNA extracted from 3.8mL normal control plasma by ultracentrifugation and positively charged Q regenerated cellulose centrifugal filtration. The filtered sample was separated with the following buffer settings:
100mM bis [ tris (hydroxymethyl) methylamino ] propane, 150mM NaCl, pH6 (2X loading buffer) and 50mM bis [ tris (hydroxymethyl) methylamino ] propane, 150mM NaCl, pH6.5 (equilibration and wash buffers)
100mM bis [ tris (hydroxymethyl) methylamino ] propane, 150mM NaCl, pH6.8 (2X loading buffer) and 50mM bis [ tris (hydroxymethyl) methylamino ] propane, 150mM NaCl, pH7 (equilibration and wash buffers)
100mM Triethanolamine (TEA), 150mM NaCl, pH6.5 (2X loading buffer) and 50mM triethanolamine, 150mM NaCl, pH7.0 (equilibration and wash buffers)
100mM bis [ tris (hydroxymethyl) methylamino ] propane, 150mM NaCl, pH7.4 (2X loading buffer) and 50mM bis [ tris (hydroxymethyl) methylamino ] propane, 150mM NaCl, pH7.5 (equilibration and wash buffers)
100mM Tris, 150mM NaCl, pH7.4 (2X loading buffer) and 50mM Tris, 150mM NaCl, pH7.5 (equilibration and wash buffers)
100mM bis [ tris (hydroxymethyl) methylamino ] propane, 150mM NaCl, pH8 (2X loading buffer) and 50mM bis [ tris (hydroxymethyl) methylamino ] propane, 150mM NaCl, pH8 (equilibration and wash buffer)
100mM Tris, 150mM NaCl, pH8 (2 XLoading buffer) and 50mM Tris, 150mM NaCl, pH8 (equilibration and wash buffers)
100mM Tris, 150mM NaCl, pH8.5 (2X loading buffer) and 50mM Tris, 150mM NaCl, pH8.5 (equilibration and wash buffers)
In fig. 13A, the legend identifies the samples by equilibration and wash buffers only. Relative Fluorescence Units (FU) are plotted against time. 25 The s peak represents the internal standard. The most prominent peak represents small RNA. Figure 14B depicts mRNA and mature miRNA levels analyzed from the same sample using quantitative RT-PCR. The cycle threshold (Ct) is presented as mean ± SD.
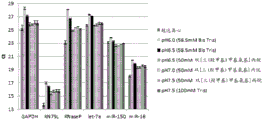
Figure 14 is a series of graphs depicting how microvesicle capture and/or microvesicle stability on a charged filter is affected by buffer pH and buffer concentration (compare it to the same functional group concentration, but not to the overall concentration of the buffer). Figure 14A is a bioanalyzer plot comparing the quality, concentration, and size distribution of microvesicle total RNA extracted from 3.8mL normal control plasma by ultracentrifugation and positively charged Q regenerated cellulose centrifugal filtration. The filtered sample was separated with the following buffer settings:
117mM Tris, 150mM NaCl, pH1.9 (2X loading buffer) and 58.5mM Tris, 150mM NaCl, pH6 (equilibration and wash buffers)
117mM Tris, 150mM NaCl, pH6.1 (2X loading buffer) and 58.5mM Tris, 150mM NaCl, pH6.5 (equilibration and wash buffers)
100mM bis [ tris (hydroxymethyl) methylamino ] propane, 150mM NaCl, pH6 (2X loading buffer) and 50mM bis [ tris (hydroxymethyl) methylamino ] propane, 150mM NaCl, pH6.5 (equilibration and wash buffers)
100mM bis [ tris (hydroxymethyl) methylamino ] propane, 150mM NaCl, pH6.8 (2X loading buffer) and 50mM bis [ tris (hydroxymethyl) methylamino ] propane, 150mM NaCl, pH7 (equilibration and wash buffers)
100mM bis [ tris (hydroxymethyl) methylamino ] propane, 150mM NaCl, pH7.4 (2X loading buffer) and 50mM bis [ tris (hydroxymethyl) methylamino ] propane, 150mM NaCl, pH7.5 (equilibration and wash buffers)
200mM Tris, 150mM NaCl, pH7.5 (2X loading buffer) and 100mM Tris, 150mM NaCl, pH7.5 (equilibration and wash buffers)
In fig. 14A, the legend identifies the samples only by equilibration and wash buffers. Relative Fluorescence Units (FU) are plotted against time. 25 The s peak represents the internal standard. The most prominent peak represents small RNA. The peaks at 41S and 47S represent 18S and 28S, respectively. Figure 14B depicts mRNA and mature miRNA levels analyzed from the same sample using quantitative RT-PCR. The cycle threshold (Ct) is presented as mean ± SD.
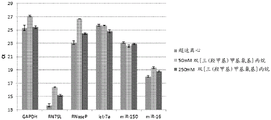
Figure 15 is a series of graphs depicting how microvesicle capture and microvesicle stability on a charged filter are affected by the concentration of a buffer. Figure 15A is a bioanalyzer plot comparing the quality, concentration, and size distribution of microvesicle total RNA extracted from 3.8mL normal control plasma by ultracentrifugation and positively charged Q regenerated cellulose centrifugal filtration. The filtered sample was separated using the following buffer settings:
100mM bis [ tris (hydroxymethyl) methylamino ] propane, 0.15mM NaCl, pH6 (2X Loading buffer) and 50mM bis [ tris (hydroxymethyl) methylamino ] propane, 0.15mM NaCl, pH6.5 (equilibration and wash buffers)
500mM bis [ tris (hydroxymethyl) methylamino ] propane, 900mM NaCl, pH6.4 (2X loading buffer) and 250mM bis [ tris (hydroxymethyl) methylamino ] propane, 450mM NaCl, pH6.5 (equilibration and wash buffers)
In fig. 15A, the legend identifies the samples by equilibration and wash buffers only. Relative Fluorescence Units (FU) are plotted against time. 25 The s peak represents the internal standard. The most prominent peak represents small RNAs. The peaks at 41S and 47S represent 18S and 28S, respectively. Figure 15B depicts mRNA and mature miRNA levels analyzed from the same sample using quantitative RT-PCR. The cycle threshold (Ct) is presented as mean ± SD.
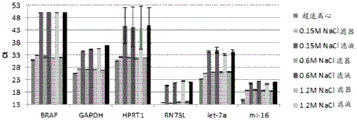
Figure 16 is a series of graphs depicting how microvesicles are stable and overall RNA yield is not affected by low to high salt concentrations. Figure 16A is a bioanalyzer plot comparing the mass, concentration and size distribution of microvesicle total RNA extracted from 1.9mL normal control plasma by centrifugation. The microvesicle pellet was resuspended in 50mM bis [ tris (hydroxymethyl) methylamino ] propane, ph6.5 buffer, with the following NaCl concentration and incubated for 20 minutes before lysis: 0.15M NaCl, 0.3M NaCl, 0.6M NaCl, 1.2M NaCl and 2.4M NaCl.
Relative Fluorescence Units (FU) are plotted against size (nt). 25 The nt peak represents the internal standard. The most prominent peak represents small RNAs. The peaks at-1900 nt and-3900 nt represent 18S and 28S, respectively. Figure 16B depicts mRNA and mature miRNA levels analyzed on the same samples using quantitative RT-PCR. The cycle threshold (Ct) is presented as mean ± SD.
Figure 17 is a series of graphs depicting how microvesicle capture and microvesicle stability on a charged filter is not affected by the salt concentration of the loading buffer. Figure 17A is a bioanalyzer plot comparing the quality, concentration, and size distribution of microvesicle total RNA extracted from 3.8mL normal control plasma by ultracentrifugation and positively charged Q regenerated cellulose centrifugation filtration (filter and filtrate). The filtered sample was separated with the following buffer settings:
100mM bis [ tris (hydroxymethyl) methylamino ] propane, 0.15M NaCl, pH6.0 (2X Loading buffer) and 50mM bis [ tris (hydroxymethyl) methylamino ] propane, 0.15M NaCl, pH6.5 (equilibration buffer)
100mM bis [ tris (hydroxymethyl) methylamino ] propane, 1.05M NaCl, pH6.0 (2X loading buffer) and 50mM bis [ tris (hydroxymethyl) methylamino ] propane, 0.6M NaCl, pH6.5 (equilibration buffer)
100mM bis [ tris (hydroxymethyl) methylamino ] propane, 2.25M NaCl, pH6.0 (2X loading buffer) and 50mM bis [ tris (hydroxymethyl) methylamino ] propane, 1.2M NaCl, pH6.5 (equilibration buffer)
100mM bis [ tris (hydroxymethyl) methylamino ] propane, 4.65M NaCl, pH6.0 (2X loading buffer) and 50mM bis [ tris (hydroxymethyl) methylamino ] propane, 2.4M NaCl, pH6.5 (equilibration buffer)
The filtered sample was not washed before elution. In FIG. 17A, the legend identifies the samples by equilibration buffer only. Relative Fluorescence Units (FU) are plotted against time. 25 The s peak represents the internal standard. The most prominent peak represents small RNA. Figure 17B depicts mRNA and mature miRNA levels analyzed from the same sample using quantitative RT-PCR. The cycle threshold (Ct) is presented as mean ± SD.
Figure 18 is a series of graphs depicting how microvesicle capture and microvesicle stability on a charged filter is not affected by the salt concentration of the loading or washing buffer. Figure 18A is a bioanalyzer plot comparing the quality, concentration, and size distribution of microvesicle total RNA extracted from 3.8mL normal control plasma by ultracentrifugation and positively charged Q regenerated cellulose centrifugal filtration. The filtered sample was separated with the following buffer settings:
100mM bis [ tris (hydroxymethyl) methylamino ] propane, 0.15mM NaCl, pH6 (2X Loading buffer) and 50mM bis [ tris (hydroxymethyl) methylamino ] propane, 0.15mM NaCl, pH6.5 (equilibration and wash buffers)
100mM bis [ tris (hydroxymethyl) methylamino ] propane, 1.05M NaCl, pH6 (2X loading buffer) and 50mM bis [ tris (hydroxymethyl) methylamino ] propane, 0.6M NaCl, pH6.5 (equilibration and wash buffers)
100mM bis [ tris (hydroxymethyl) methylamino ] propane, 2.25M NaCl, pH6 (2 XLoading buffer) and 50mM bis [ tris (hydroxymethyl) methylamino ] propane, 1.2M NaCl, pH6.5 (equilibration and wash buffers)
100mM bis [ tris (hydroxymethyl) methylamino ] propane, 4.65M NaCl, pH6 (2X loading buffer) and 50mM bis [ tris (hydroxymethyl) methylamino ] propane, 2.4M NaCl, pH6.5 (equilibration and wash buffers).
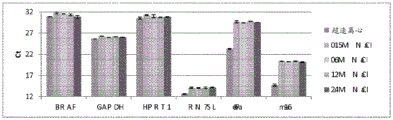
In fig. 18A, the legend identifies samples only by NaCl concentration in equilibration and wash buffers. Relative Fluorescence Units (FU) are plotted against time. 25 The s peak represents the internal standard. The most prominent peak represents small RNA. The peaks at S and S represent 18S and 28S, respectively. Figure 18B depicts mRNA and mature miRNA levels analyzed from the same sample using quantitative RT-PCR. The cycle threshold (Ct) is presented as mean ± SD.
FIG. 19 is a graph depicting how RNA lysis buffer affects RNA yield from microvesicles isolated with a charged filter. mRNA and mature miRNA levels were analyzed using quantitative RT-PCR from 4mL plasma extracted by ultracentrifugation and positively charged Q PES vacuum filtration. The filtered samples were separated with Qiazol or Promega lysis buffer. Relative magnitudes are presented as mean ± SD.
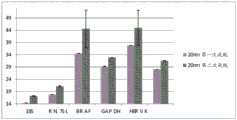
Figure 20 is a series of graphs depicting how the second volume of Qiazol does not significantly improve RNA yield when microvesicles are isolated on a charged filter. Figure 20A is a bioanalyzer plot comparing the quality, concentration, and size distribution of microvesicle total RNA extracted from 2mL normal control plasma by ultracentrifugation and positively charged Q PES vacuum filtration. The filter samples were separated with two volumes of Qiazol lysis buffer. Relative Fluorescence Units (FU) are plotted against time. 25 The s peak represents the internal standard. The most prominent peak represents small RNAs. The peaks at 41S and 47S represent 18S and 28S, respectively. There are technical difficulties with the second Qiazol elution sample. The internal standard was modified to 18s and the small RNA peak at 25 s. Figure 20B depicts mRNA and mature miRNA levels analyzed from the same sample using quantitative RT-PCR. The cycle threshold (Ct) is presented as mean ± SD.
Figure 21 is a series of graphs depicting how the second volume of Qiazol does not significantly improve RNA yield when microvesicles are isolated on a charged filter. Figure 21A is a bioanalyzer plot comparing the quality, concentration, and size distribution of microvesicle total RNA extracted from 4mL normal control plasma by ultracentrifugation and positively charged Q regenerated cellulose centrifugal filtration. The filtered samples were separated with two volumes of Qiazol lysis buffer. Relative Fluorescence Units (FU) are plotted against size (nt). 25 The nt peak represents the internal standard. The most prominent peak represents small RNAs. The peaks at-1900 nt and-3900 nt represent 18S and 28S, respectively. Figure 21B depicts mRNA and mature miRNA levels analyzed from the same sample using quantitative RT-PCR. The cycle threshold (Ct) is presented as mean ± SD.
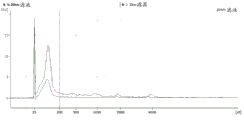
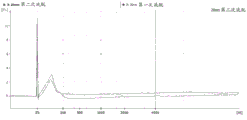
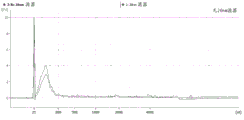
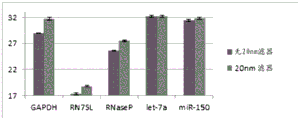
Figure 22 is a series of graphs depicting how microvesicle RNA can be isolated using a 20nm PES neutral syringe filter. FIG. 22A is a bioanalyzer plot comparing the quality, concentration and size distribution of microvesicle total RNA extracted from 4mL of normal control plasma by ultracentrifugation and 20nm neutral PES syringe filtration. Relative Fluorescence Units (FU) are plotted against size (nt). 25 The nt peak represents the internal standard. The most prominent peak represents small RNAs. The peaks at-1900 nt and-3900 nt represent 18S and 28S, respectively. FIG. 22B depicts mRNA levels analyzed from the same samples using quantitative RT-PCR. The cycle threshold (Ct) is presented as mean ± SD.
Figure 23 is a series of graphs depicting how microvesicle RNA can be isolated using a 20nm PES neutral syringe filter. FIG. 23A is a bioanalyzer plot comparing the quality, concentration and size distribution of microvesicle total RNA extracted from 4mL of normal control plasma by ultracentrifugation and 20nm neutral PES syringe filtration. Relative Fluorescence Units (FU) are plotted against time. 25 The s peak represents the internal standard. The most prominent peak represents small RNAs. The peaks at 41S and 47S represent 18S and 28S, respectively. FIG. 23B depicts mRNA levels analyzed from the same samples using quantitative RT-PCR. The cycle threshold (Ct) is presented as mean ± SD.
Figure 24 is a series of charts describing how microvesicle mirnas can be isolated using a 20nm PES neutral syringe filter (Tisch). FIG. 24A is a bioanalyzer plot comparing the quality, concentration and size distribution of microvesicle total RNA extracted from 2mL of normal control plasma by ultracentrifugation and 20nm neutral PES syringe filtration. Relative Fluorescence Units (FU) are plotted against size (nt). 25 The nt peak represents the internal standard. The most prominent peak represents small RNAs. The peaks at-1900 nt and-3900 nt represent 18S and 28S, respectively. Figure 24B depicts mature miRNA levels analyzed from the same samples using quantitative RT-PCR. The cycle threshold (Ct) is presented as mean ± SD.
Figure 25 is a series of graphs depicting how microvesicle capture is RNA-dependent. Some RNAs were more efficiently captured on the filter than others (GAPDH versus miR-451). This may depend on whether the RNA is protected by proteins and/or microvesicles and on the size of the microvesicles. Figure 25A is a bioanalyzer plot comparing the mass, concentration, and size distribution of microvesicle total RNA extracted from 2mL normal control plasma by filtration with a neutral PES syringe (filter and filtrate). Relative Fluorescence Units (FU) are plotted against size (nt). 25 The nt peak represents the internal standard. The most prominent peak represents small RNA. The peaks at-1900 nt and-3900 nt represent 18S and 28S, respectively. Figure 25B depicts mRNA and mature miRNA levels analyzed from the same sample using quantitative RT-PCR. The cycle threshold (Ct) is presented as mean ± SD.
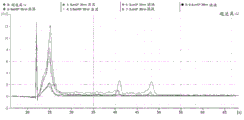
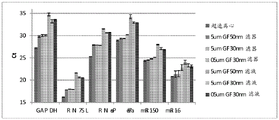
Figure 26 is a series of graphs depicting how microvesicle RNA can be isolated using 30nm and 50nm PES neutral syringe filters. Fig. 26A is a bioanalyzer plot comparing the mass, concentration, and size distribution of microvesicle total RNA extracted from 2mL normal control plasma by ultracentrifugation and 30nm (5 um or 0.05um Glass Fiber (GF) prefilter) and 50nm (5 um GF prefilter) neutral PES syringe filtration (filter and filtrate). Relative Fluorescence Units (FU) are plotted against time. 25 The s peak represents the internal standard. The most prominent peak represents small RNA. The peaks at 41S and 47S represent 18S and 28S, respectively. Figure 26B depicts mRNA and mature miRNA levels analyzed from the same sample using quantitative RT-PCR. The cycle threshold (Ct) is presented as mean ± SD.
FIG. 27 is a series of charts describing how microvesicle RNA can be isolated using a 0.2um PES neutral filter (Pall) in spin column format. Figure 27A is a bioanalyzer plot comparing the quality, concentration, and size distribution of microvesicle total RNA extracted from 4mL normal control plasma by ultracentrifugation and neutral 0.2um PES centrifugation (filter and filtrate). Relative Fluorescence Units (FU) are plotted against size (nt). 25 The nt peak represents the internal standard. The most prominent peak represents small RNA. The peaks at 1900 nt and 4200 nt represent 18S and 28S, respectively. Figure 27B depicts mRNA and mature miRNA levels analyzed from the same sample using quantitative RT-PCR. The cycle threshold (Ct) is presented as mean ± SD.
Figure 28 is a series of graphs depicting how microvesicle RNA can be isolated using a 0.8um PES neutral syringe filter. Figure 28A is a bioanalyzer plot comparing the quality, concentration, and size distribution of microvesicle total RNA extracted from 4mL normal control plasma by ultracentrifugation and neutral 0.8um PES syringe filtration (filter and filtrate). Relative Fluorescence Units (FU) are plotted against time. 25 The s peak represents the internal standard. The most prominent peak represents small RNA. The peaks at 41S and 47S represent 18S and 28S, respectively. Figure 28B depicts mRNA and mature miRNA levels analyzed from the same sample using quantitative RT-PCR. The cycle threshold (Ct) is presented as mean ± SD.
Figure 29 is a series of graphs describing how microvesicle RNA can be isolated using a 0.8um PES neutral filter (Pall) in spin column format. Figure 29A is a bioanalyzer plot comparing the quality, concentration, and size distribution of microvesicle total RNA extracted from 4mL normal control plasma by ultracentrifugation and neutral 0.8um PES centrifugation filtration (filter and filtrate). The 0.8um filtrate sample was separated from only half of the total sample volume. Relative Fluorescence Units (FU) are plotted against size (nt). 25 The nt peak represents the internal standard. The most prominent peak represents small RNA. The peaks at 1900 nt and 4200 nt represent 18S and 28S, respectively. Figure 29B depicts mRNA and mature miRNA levels analyzed from the same sample using quantitative RT-PCR. The cycle threshold (Ct) is presented as mean ± SD. The Ct values for the "0.8um filter" and "ultracentrifugation" samples have been adjusted to compensate for only partial separation.
Figure 30 is a graph depicting how microvesicle RNA yield is affected by lysis buffer type when microvesicles are isolated on a neutral PES filter. FIG. 30 is a bioanalyzer plot comparing the mass, concentration and size distribution of microvesicle total RNA extracted from 6mL of normal control plasma by filtration through a neutral PES syringe. The filtered samples were lysed with Qiazol (Qiagen), RLT (Qiagen) or miCURY (Exiqon). Relative Fluorescence Units (FU) are plotted against time. 25 The s peak represents the internal standard. The most prominent peak represents small RNA. The peaks at 41S and 47S represent 18S and 28S, respectively.
Figure 31 is a series of graphs depicting how additional elution with Qiazol does not significantly improve RNA yield in microvesicle RNA isolation on a 20nm PES neutral syringe filter. Fig. 31A is a bioanalyzer plot comparing the mass, concentration, and size distribution of microvesicle total RNA extracted from 6mL normal control plasma by filtration through a neutral PES syringe. The filtered sample was lysed with two volumes of Qiazol. Relative Fluorescence Units (FU) are plotted against size (nt). 25 The nt peak represents the internal standard. The most prominent peak represents small RNA. The peaks at 1900 nt and 4200 nt represent 18S and 28S, respectively. FIG. 31B depicts mRNA levels analyzed from the same samples using quantitative RT-PCR. The cycle threshold (Ct) is presented as mean ± SD.
Figure 32 is a series of graphs depicting how microvesicle stability and/or microvesicle RNA yield is affected by a washing step when microvesicles are isolated on a neutral filter. Fig. 32A is a bioanalyzer plot comparing the mass, concentration, and size distribution of microvesicle total RNA extracted from 6mL normal control plasma by filtration through a neutral PES syringe. The filtered sample was washed with 0mL, 20mL or 50mL of 10mM sodium phosphate, 2mM potassium phosphate, 2.7mM KCl, 137mM NaCl, pH7.4 buffer. Relative Fluorescence Units (FU) are plotted against size (nt). 25 The nt peak represents the internal standard. The most prominent peak represents small RNA. The peaks at 1900 nt and 4200 nt represent 18S and 28S, respectively. Figure 32B depicts mRNA and mature miRNA levels analyzed from the same sample using quantitative RT-PCR. The cycle threshold (Ct) is presented as mean ± SD.
FIG. 33 is a series of graphs depicting how RNA adheres to a 20nm PES filter in the form of a syringe and cannot be easily eluted. Larger RNAs (e.g., GAPDH) are more difficult to elute than smaller RNAs (let-7 a). Figure 33A is a bioanalyzer plot comparing the quality, concentration, and size distribution of 10ng of control total RNA isolated by resuspension in Qiazol and subsequent RNA isolation, or by 20nm neutral PES syringe filtration followed by elution in Qiazol and subsequent RNA isolation. Relative Fluorescence Units (FU) are plotted against size (nt). 25 The nt peak represents the internal standard. The most prominent peak represents small RNA. The peaks at-1900 nt and-3900 nt represent 18S and 28S, respectively. Figure 33B depicts mRNA and mature miRNA levels analyzed from the same sample using quantitative RT-PCR. The cycle threshold (Ct) is presented as mean ± SD.
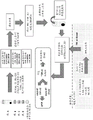
Fig. 34 is an illustration of a general flow chart for microvesicle isolation and RNA extraction using beads.
Fig. 35 is a graph depicting microvesicle separation using different types of magnetic beads.
FIG. 36 is a graph depicting microvesicle recovery using different types of magnetic beads.
Fig. 37 is a diagram of a flow chart for microvesicle isolation and RNA extraction using magnetic beads.
Figure 38 is a graph depicting microvesicle isolation using TEA treatment versus imidazole treated epoxy beads tested with RT-qPCR (threshold = 0.1) on selected mRNA targets.
Figure 39 is a graph depicting selected mRNA targets recovered from microvesicles isolated with TEA treatment versus imidazole treated epoxy beads.
Figure 40 is a graph depicting microvesicle isolation using TEA treatment versus imidazole treated epoxy beads tested with RT-qPCR (threshold = 0.1) on selected microrna targets.
Figure 41 is a chart depicting selected microrna targets recovered from microvesicles that were separated using TEA treatment versus imidazole treatment epoxy beads.
Fig. 42 is a graph depicting pcr using RT-qPCR, threshold = 0.1, x: cation, R: graph of microvesicle separation with non-magnetic beads tested for anions on selected mRNA targets.
Figure 43 is a graph depicting selected mRNA targets recovered from microvesicles separated with a non-magnetic cation/anion exchange resin.
Fig. 44 is a graph depicting the results obtained using RT-qPCR, threshold = 0.1,x: cation, R: graph of anion vs. microrna target assay with microvesicle separation on non-magnetic beads.
FIG. 45 is a graph depicting recovery analysis on a mini mRNA cation/anion exchange resin.
Figure 46 is a graph depicting microvesicle isolation using control beads tested with RT-qPCR, threshold = 0.1) on selected mRNA.
Figure 47 is a graph depicting selected mRNA targets recovered from microvesicles isolated with control beads.
Figure 48 is a graph depicting microvesicle isolation using control beads tested with RT-qPCR, threshold = 0.1 pair microrna.
FIG. 49 is a graph depicting the recovery of microRNA targets from microvesicles isolated with control beads.
FIG. 50 is a diagram depicting bead titration for microvesicle isolation and RNA extraction.
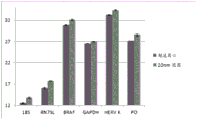
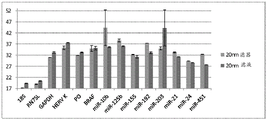
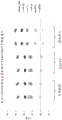
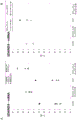
FIGS. 51A-51G are a series of graphs depicting assessment of microvesicle capture using RT-qPCR for RN7SL (FIG. 51A), GAPDH (FIG. 51B), RNaseP (FIG. 51C), B2M (FIG. 51D), GUSB (FIG. 51E), HPRT1 (FIG. 51F), and Let-7a (FIG. 51G).
Fig. 52 is a graph depicting the Ct comparison between individual and mixed beads (at a bead/microvesicle (B/E) ratio of 2:1 for all targets).
FIG. 53 is a graph depicting the recovery comparison between individual versus mixed beads at a B/E ratio 2:1.
Fig. 54 is a diagram depicting microvesicle isolation and RNA extraction using Magnetic Beads (MBs).
FIGS. 55A-55G are a series of graphs depicting assessment of microvesicle recovery using plasma titration at a fixed bead to microvesicle ratio (B/E) for RN7SL (FIG. 55A), GAPDH (FIG. 55B), RNaseP (FIG. 55C), B2M (FIG. 55D), GUSB (FIG. 55E), HPRT1 (FIG. 55F) and Let-7a (FIG. 55G).
FIG. 56 is a graph depicting a comparison of plasma titrations from 0.4 mL, 1mL to 4mL with respect to recovery of multiple targets at a B/E ratio of 5:1.
Fig. 57 is a graph depicting a time course study of MB binding upon microvesicle separation.
Fig. 58 is a graph depicting a time course study (1 minute, 5 minutes, 15 minutes, 30 minutes, and 60 minutes) for epoxy bead-microvesicle binding.
Fig. 59 is a graph depicting a time course study of bead-microvesicle binding (B/E = 5.
Fig. 60 is a graph depicting a time course study of bead-microvesicle binding (B/E = 5.
Figure 61 is a graph depicting a sensitive examination study on microvesicle-epoxy MB binding.
Figure 62 is a graph depicting the mean Ct of selected RNA targets (epoxy beads only) in the collected fractions.
FIG. 63 is a graph depicting the% recovery of selected RNA targets (epoxy beads only).
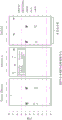
FIG. 64 is a series of schematic diagrams showing an EXO50 column. The panel on the left side shows the outside of the filter holder. The middle panel shows a cross section showing the placement of the inner tube within the filter holder. The upper right shows the membrane filter held in place at the bottom of the filter holder, between the inner tube (above the membrane) and the outer frit (column bottom). The bottom right shows the configuration of the outer frit that allows fluid communication.
FIG. 65 is a series of photographs showing the complete assembly of an EXO50 column with collection tubes. The collection tube shown in the left and middle photographs was a 50mL conical tube. The right photograph shows a top view of the EXO50 filter holder.
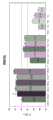
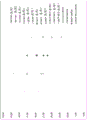
FIG. 66 is a graph depicting different functionalized membranes when the same buffer conditions are used. The y-axis shows Ct values for selected mRNA targets extracted from microvesicles separated using different functionalized membranes listed in the x-axis. The functionalized membrane is: q, S, D, IDA, aldehydes and DE81.
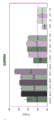
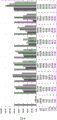
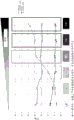
FIG. 67 is a graph depicting the binding capacity of an EXO50 column. Increasing volumes (0.5 ml, 1.0ml, 2.0ml, 4.0ml, 8.0ml and 16 ml) of plasma were added to the EXO50 column. The extracted RNA was evaluated for Ct values of selected mRNA targets. The graph demonstrates that a volume of 0.5ml to 4.0ml results in a linear increase in expression signal.
Fig. 68 is a graph depicting the binding capacity of EXO50 columns as evidenced by increasing copy number assays relative to the volume of biological sample (plasma).
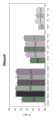
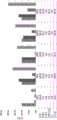
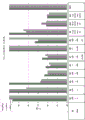
Figure 69 is a graph depicting the loading capacity of a column with 3 layers of membrane. The first set of bar values for each volume represents the expression detected from the plasma sample, while the second set of bar values for each volume represents the expression detected from the flow-through after capture of the first microvesicle fraction. Use 2 △CT The percent of copies from the flow-through that are associated with the normal sample loading step are calculated.
Figure 70 is a graph demonstrating the number of membrane layers required to capture all microvesicles from 4ml plasma, as measured by RNA detection of specific mRNA targets from the microvesicles captured on the membrane.
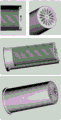
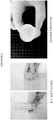
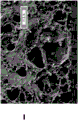
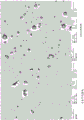
FIG. 71 is a scanning electron microscopy photograph showing exosomes captured on and in the membrane of a loaded EXO50 column.
FIG. 72 is a graph showing that a wide range of types of loading buffers for biological samples are compatible with EXO50 procedures. The y-axis represents the Ct value for the mRNA target tested. Showing a repeat experiment.
FIG. 73 is a graph showing that EXO50 operation is tolerant to low pH buffer conditions. The y-axis represents the Ct value for the mRNA target tested. Showing a repeat experiment.
FIG. 74 is a graph showing that the EXO50 operation is also resistant to different concentrations of detergents such as SDS, tween20, and TritonX-100 in buffer systems. The y-axis represents the Ct value for the mRNA target tested.
FIG. 75 is a graph showing a series of bioanalyzer profiles demonstrating that total RNA isolated by EXO50 can be separated into large and small fractions by using different ethanol concentrations in silica column binding buffer during extraction.
FIG. 76 is a graph showing that RNA purified by EXO50 is PCR amplifiable RNA (i.e., suitable for amplification and PCR processing). Expression of the mRNA target tested was detected by amplification-based qPCR.
Figure 77 is a graph showing that ethanol titration can be optimized to isolate mRNA and miRNA.
Figure 78 is a graph showing EXO50 purification of 100% mRNA from commercially available cancer exosomes (at 3000, 1500 and 150 ng dry weight). Extracted total RNA (direct lysis) was compared to EXO50 isolation (EXO 50) and extraction from flow through (EXO 50 flow through).
FIG. 79 is a graph showing that an EXO50 procedure without any additional process steps isolated very little DNA. Incubations with turbo dnase or rnase were compared to EXO50. Negative control is represented by RT- (no reverse transcriptase). Showing repeated separations.
FIG. 80 is a graph demonstrating that EXO50 is robust to parallel processing of many samples. 8 EXO50 replicates were performed with the addition of 3 minute aspiration delay for each individual step in the separation. The standard deviation for individual determinations between separation replicates was <0.5 Ct.
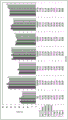
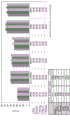
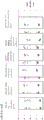
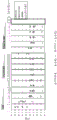
FIG. 81 is a series of graphs showing EXO50 analysis performed on different laboratories in different continents with different operators and PCR chemicals for two input volumes (0.2 ml and 2 ml). (A) MUC; (B) MSP; (C) CMH; (D) MEM; (E) IND; (F) LAX; (G) SAN; (H) AUS. Experiments were performed in triplicate.
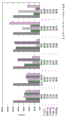
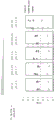
FIG. 82 is a series of graphs showing that EXO50 analysis was performed by the first user in different laboratories using the same plasma and PCR chemistry.
FIG. 83 is a graph demonstrating that the EXO50 can be modified into a small spin column format. Ct values for target mRNA were compared between EXO50 mini spin columns and ultracentrifugation.
FIG. 84 is a graph demonstrating different functionalized membranes in a micro regenerated cellulose column compared to ultracentrifugation for two different input sample volumes.
FIG. 85 is two scanning electron microscopy photographs showing the microvesicle ultracentrifugation (left) and EXO50 (right) separation methods.
FIG. 86 is a graph of two bioanalyzers showing that profiles of RNA extracted from plasma by EXO50 and ultracentrifugation have similar RNA size distributions. (a) cancer patient # 1; (B) cancer patient # 2.
FIG. 87 is a graph showing a comparison between RNA extraction from plasma by self-assembling column, EXO50 and ultracentrifugation. Repeated experiments were performed.
FIG. 88 is a graph showing a comparison between RNA extraction from 200ul plasma by ultracentrifugation, direct lysis and EXO50. RNA extraction from EXO50 flow-through was also analyzed.
FIG. 89 is a graph showing a comparison between RNA extraction from 200ul plasma by the EXO50 kit and miRNeasy and from 4ml plasma by the EXO50 kit and ultracentrifugation.
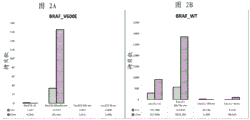
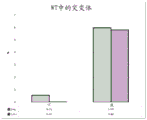
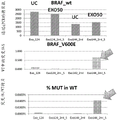
Figure 90 is a graph showing EXO50 isolation of RNA containing mutations from melanoma BRAF V600E compared to ultracentrifugation.
FIG. 91 is a graph showing that RNA isolation after elution from an EXO50 column yields as much RNA as the EXO50 process.
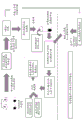
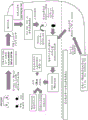
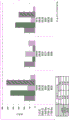
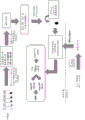
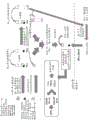
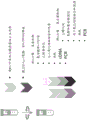
Figure 92 is a schematic demonstrating the EXO52 protocol for isolating microvesicle fractions, releasing microvesicle nucleic acids, and extracting RNA and DNA using two separate protocols.
Figure 93 is a schematic demonstrating the EXO52.2 protocol for isolating microvesicle fractions, releasing microvesicle nucleic acids, and extracting RNA and DNA using a single protocol.
Fig. 94 is a graph showing the effect of chloroform concentration in phase separation on isolating microvesicle RNA and DNA in a single extraction, as confirmed by wild-type BRAF RNA and DNA detection.
Figure 95 is a graph showing the effect of chloroform concentration in phase separation on isolating microvesicle RNA and DNA in a single extraction, as confirmed by GAPDH RNA and DNA detection.
FIG. 96 is a graph showing that pH adjustment in phase separation affects DNA extraction and detection.
FIG. 97 is a graph showing the effect of titration of sample volume of cerebrospinal fluid (CSF) on microvesicle RNA extraction and detection.
FIG. 98 is a graph showing a comparison of detection of microvesicle RNA targets from ultracentrifugation and EXO60 isolation methods.
Figure 99 is a graph showing comparison of microvesicle RNA target detection from ultracentrifugation and EXO60 isolation methods for different patient CSF samples. Patient samples are designated by patient ID. Different sample volumes were used. (. Indicates) post mortem samples.
Figure 100 is a graph showing the effect of CSF sample volumes (0.25 ml, 0.5ml, 1.0ml and 2.0 ml) on different microvesicle RNA isolation and extraction methods. UC (ultracentrifugation), ucc (urine filtration method) and EXO60.
Figure 101 is a series of bioanalyzer curves depicting RNA profiles extracted from two different urine samples using the EXO70 protocol compared to the urine circulating stem cell (uCSC) method.
FIG. 102 is a graph showing the correlation between RNA detection after isolation and extraction by EXO70, compared to the urineCSC method.
FIG. 103 is two graphs showing detection of different RNA targets after isolation and extraction by the EXO70 or uCSC method. RNA was extracted and analyzed from the isolated microvesicle fraction (EXO 70 or uCSC) and the flow-through or supernatant fraction (EXO 70 flow or uCSC flow) after isolation. (a) an mRNA target; (B) a miRNA target.
FIG. 104 is a graph depicting CT (y-axis) for 4 mRNAs across 4 sample types. All points are the average of duplicate experiments with 2 microvesicles isolated from each. "SJCRH" is plasma from a pediatric patient, "DAOY" is a myeloblastoid cell line, and "DAOY MED" is a microvesicle from a culture medium of these cells. No results were obtained with commercially available plasma.
FIG. 105 is a graph depicting the ability of the EXO50 to isolate all mRNA from 100 μ L cell culture supernatant.
Detailed Description
The present invention provides a method for isolating microvesicles by capturing them to a surface and subsequently lysing them to release the nucleic acids, in particular RNA, contained therein. Microvesicles are shed by eukaryotic cells or plasma membrane budding off (budded off) to the outside of the cell. These membrane vesicles are heterogeneous in size, having a size ranging from about 10 nm to about 5000 nm in diameter. All membrane vesicles with a diameter < 0.8 μm that are shed by the cells are herein collectively referred to as "microvesicles". These microvesicles include microvesicles, microvesicle-like particles, prostasomes, dendritic cell exosomes (dexosomes), tumor cell exosomes (texomes), exosomes, oncogens (oncosomes), apoptotic bodies, retrovirus-like particles, and Human Endogenous Retrovirus (HERV) particles. Small microvesicles (approximately 10-1000nm in diameter, and more typically 30-200 nm) released by exocytosis of intracellular vesicles are known in the art as "microvesicles".
Current methods of isolating microvesicles include ultracentrifugation, ultrafiltration, for example using a 100 kD filter, polymer precipitation techniques, and/or size-based filtration. However, there is a need for alternative methods that are effective and efficient for isolating microvesicles and optionally extracting nucleic acids (preferably microvesicle RNA) contained therein for a variety of applications, including diagnostic uses.
In some embodiments, the present invention provides methods for isolating microvesicles by capturing the microvesicles to a surface and subsequently lysing the microvesicles to release nucleic acids, in particular RNA, contained therein. In some embodiments, the present invention provides methods for isolating microvesicles by capturing the microvesicles to a surface and subsequently eluting intact microvesicles from the capture surface.
Microvesicles are a rich source of high quality nucleic acids that are secreted by all cells and present in all human biological fluids. RNA in the microvesicles provides a real-time snapshot of the transcriptome of the primary tumor, the metastasis and the surrounding microenvironment. Thus, accurate assessment of the RNA profile of microvesicles by assay provides companion diagnosis and real-time monitoring of disease. This development has been arrested by current standards for exosome isolation, which are slow, cumbersome, variable, and unsuitable for diagnostic settings.
The separation and extraction methods and/or kits provided herein, referred to as EXO50 plasma exosome RNA extraction methods and/or kits, use spin column-based purification processes, using affinity membranes bound to microvesicles. The disclosed methods and kits allow the ability to run large numbers of clinical samples in parallel, using volumes of 0.2 up to 4mL on a single column. The isolated RNA is highly pure, protected by the vesicle membrane until lysis occurs, and intact vesicles can be eluted from the EXO50 membrane. The EXO50 procedure was able to deplete all mRNA from plasma input and was equal or better in mRNA/miRNA yield when compared to ultracentrifugation or direct lysis. In contrast, the EXO50 methods and/or kits are enriched for microvesicle-bound miRNA fractions, and they can be easily extended to a large number of input materials. This amplification capability allows for the study of interesting low abundance transcripts. The methods and kits of the disclosure provide the unique capabilities demonstrated by the examples provided herein, as compared to other commercially available products on the market.
The EXO50 methods and kits use the following general procedures to isolate and extract nucleic acids, such as RNA, from biological samples. First, the microvesicle fraction is bound to a membrane filter, and the filter is washed. Subsequently, the reagents are used to perform on-membrane lysis and release of nucleic acids, such as RNA. Chloroform extraction was then performed using a PLG tube followed by ethanol conditioning. Nucleic acids such as RNA are then bound to a silica column, washed and then eluted.
A schematic representation of a general procedure for isolating microvesicle RNA from a biological sample using the capture surface method is shown below:

a schematic representation of a general procedure for isolating microvesicle RNA from a plasma sample using a membrane process is shown below:

a schematic representation of a general procedure for isolating microvesicle RNA from a plasma sample using the bead method is shown below:

a schematic representation of the general procedure for isolating microvesicle RNA from a urine sample using the capture surface method is shown below:

as demonstrated by the working examples provided herein, the form of the capture surface, e.g., bead or filter (also referred to herein as a membrane), does not affect the ability of the methods provided herein to effectively capture microvesicles from a biological sample. Furthermore, the surface charge of the capture surface does not affect the ability of the methods provided herein to effectively capture microvesicles. In addition, working examples demonstrate that the ionic strength of binding and washing buffers has limited importance in the methods provided herein.
A wide range of surfaces are capable of trapping microvesicles according to the methods provided herein, but not all surfaces (some surfaces do not trap anything).
The present disclosure also describes an apparatus for separating and concentrating microvesicles from a biological or clinical sample using a disposable plastic part and a centrifugation device. In addition, the device includes a column containing a capture surface (i.e., a membrane filter), a scaffold that secures the capture surface between the outer frit and the inner tube, and a collection tube. The outer frit comprises a large mesh structure to allow the passage of liquid, and preferably at one end of the column. The inner tube holds the capture surface in place and is preferably slightly conical. The collection tube may be commercially available, i.e. a 50ml Falcon tube. The column is preferably adapted to spin, i.e. is of a size compatible with standard centrifugation and microcentrifuges.
In embodiments where the capture surface is a membrane, the means for separating a microvesicle fraction from a biological sample contains at least one membrane. In some embodiments, the device contains one, two, three, four, five, or six membranes. Preferably, the device comprises three membranes. In embodiments where the device comprises more than one membrane, the membranes are all directly adjacent to each other at one end of the column. In embodiments where the device comprises more than one membrane, the membranes are all the same as each other, i.e., have the same charge and/or have the same functional group.
As demonstrated by working examples 1-32 provided herein, the selection of one or more buffer components, the pH of the buffer, and the selection of the lysis buffer affect the ability of the methods provided herein to effectively capture microvesicles and release nucleic acids, particularly RNA, contained therein. In some embodiments, the lysis buffer is a phenol-based lysis buffer. For example, the lysis buffer was QIAzol ® lysis reagent (Qiagen).
Working examples 1-32 provided herein also demonstrate that capture by pore size filtration smaller than microvesicles is not the primary capture mechanism by the methods provided herein. However, the filter pore size is still very important, for example because mRNA sticks to the 20nm filter and cannot be recovered, while micro-RNAs can be easily eluted, and for example because filter pore size is an important parameter in the available capture surface area.
Working examples 1-32 provided herein also demonstrate the feasibility of microvesicle separation using beads (magnetic or non-magnetic) that would be a more suitable form in clinical utility. The results show that positively, negatively and neutral beads all show good microvesicle capture efficiency. This observation suggests that they may act on different ligands on the surface of the microvesicles, so that one microvesicle may be captured with different (functionalized) particles via different (multiple) forces.
The methods provided herein use any of a variety of capture surfaces. In some embodiments, the capture surface is a membrane, also referred to herein as a filter or membrane filter. In some embodiments, the capture surface is a commercially available membrane. In some embodiments, the capture surface is a charged commercially available membrane. In some embodiments, the capture surface is neutral. In some embodiments, the capture surface is selected from Mustang ion exchange membranes from PALL Corporation; vivapure Q membranes from Sartorius AG; sartobind Q or Vivapure Q Maxi H; sartobind D from Sartorius AG, sartobind (S) from Sartorius AG, sartobind Q from Sartorius AG, sartobind IDA from Sartorius AG, sartobind Aldehyde from Sartorius AG, whatman DE81 from Sigma, fast Trap virus purification columns from EMD Millipore; thermo Scientific. Pierce strong cation and anion exchange spin columns.
In embodiments where the capture surface is charged, the capture surface may be a charged filter selected from the group consisting of: 0.65um positively charged Q PES vacuum filtration, 3-5um positively charged Q RC rotating column filtration, 0.8um positively charged Q PES home spin column filtration, 0.8um positively charged Q PES injector filtration, 0.8um negatively charged S PES home spin column filtration, 0.8um negatively charged S PES injector filtration, and 50nm negatively charged nylon injector filtration. Preferably, the charged filter is not housed in the syringe filtration instrument, as Qiazol/RNA is more difficult to exit the filter in these embodiments. Preferably, the charging container is accommodated at one end of the column.
In embodiments where the capture surface is a membrane, the membrane may be made of a variety of suitable materials. In some embodiments, the membrane is Polyvinylsulfone (PES) (e.g., from Millipore or PALL corp.). In some embodiments, the membrane is Regenerated Cellulose (RC) (e.g., from Sartorius or Pierce).
In some embodiments, the capture surface is a positively charged membrane. In some embodiments, the capture surface is a Q membrane, which is a positively charged membrane and is an anion exchanger with a quaternary amine. For example, Q films made from quaternary ammonium, R-CH 2 -N + (CH 3 ) 3 And (4) functionalizing. In some embodiments, the capture surface is a negatively charged membrane. In some embodiments, the capture surface is an S-membrane, which is a negatively charged membrane and is a cation exchanger having sulfonic acid groups. For example, S membranes are made of sulfonic acids, R-CH 2 -SO 3 - And (4) functionalizing. In some embodiments, the capture surface is a D-membrane, which is a membrane with a diethylamino group, R-CH 2 -NH + (C 2 H 5 ) 2 A weakly basic anion exchanger. In some embodiments, the capture surface is a metal chelate membrane. For example, the membrane is made of iminodiacetic acid (minodiacetic acid) -N (CH) 2 COOH - ) 2 Functionalized IDA membranes. In some embodiments, the capture surface is a microporous membrane functionalized with aldehyde groups, -CHO. In other embodiments, the membrane is a weakly basic anion exchanger with Diethylaminoethyl (DEAE) cellulose. Not all charged membranes are suitable for use in the methods provided herein, e.g., RNA isolated using regenerated cellulose, strongly basic cation exchanger ("RC/SACE") membrane spin columns exhibits RT-qPCR inhibition and is therefore not suitable for PCR-related downstream assays.
In embodiments where the capture surface is charged, the microvesicles may be separated with a positively charged filter. In embodiments where the capture surface is charged, the capture surface is preferably not a negatively charged regenerated cellulose S filter, as this embodiment causes PCR inhibition. In contrast, negatively charged PES filters do not show this phenomenon.
In embodiments where the capture surface is charged, the pH during microvesicle capture is pH ≦ 7. In some embodiments, the pH is greater than 4 and less than or equal to 8.
In embodiments where the capture surface is a positively charged Q-filter, the buffer system comprises a wash buffer comprising 250mM bis [ tris (hydroxymethyl) methylamino ] propane, ph 6.5-7.0. In embodiments where the capture surface is a positively charged Q filter, the lysis buffer is Qiazol. In embodiments where the capture surface is a positively charged Q-filter, the lysis buffer is present in one volume. In embodiments where the capture surface is a positively charged Q-filter, the lysis buffer is present in more than one volume.
In embodiments wherein the capture surface is neutral, the capture surface is a filter selected from the group consisting of: 20nm neutral PES syringe filtration (Tisch and Exomir), 30nm neutral PES syringe filtration (Sterlitech), 50nm neutral PES syringe filtration (Sterlitech), 0.2um neutral PES home spin column filtration (Pall), 0.8um neutral PES home spin column filtration (Pall), and 0.8um neutral PES syringe filtration (Pall). In embodiments where the capture surface is neutral, preferably the neutral capture surface is not contained in a syringe filter.
In embodiments where the capture surface is neutral, the lysis buffer is Qiazol. In embodiments where the capture surface is neutral, the lysis buffer is present in one volume. In embodiments where the capture surface is neutral, the lysis buffer is present in more than one volume. In embodiments where the capture surface is neutral, the method comprises a washing step.
The pore size of the membrane ranged from 3 μm to 20nm, depending on the membrane material. For example, in embodiments where the capture surface is a commercially available PES membrane, the membrane has a pore size of 20nm (Exomir), 0.65 μm (Millipore), or 0.8 μm (Pall). In embodiments where the capture surface is a commercially available RC membrane, the membrane has a pore size in the range of 3-5 μm (Sartorius, pierce).
The surface charge of the capture surface may be positive, negative or neutral. In some embodiments, the capture surface is one or more positively charged beads. In some embodiments, the capture surface is one or more negatively charged beads. In some embodiments, the capture surface is one or more neutral beads. In some embodiments, the capture surface is a neutral filter, such as a PES membrane that is not surface modified with charged groups.
In some embodiments, the methods provided herein include a variety of buffers, including loading and washing buffers. In some embodiments, the loading and washing buffers may have high or low ionic strength. In some embodiments, the salt concentration, e.g., naCl concentration, may be 0-2.4M. The buffer may include a variety of components. In some embodiments, the buffer comprises one or more of the following components: tris, bis [ Tris (hydroxymethyl) methylamino ] propane, imidazole, citrate, methylmalonic acid, acetic acid, ethanolamine, diethanolamine, triethanolamine (TEA), and sodium phosphate. In the methods provided herein, the pH of the loading and washing buffers is important. When the plasma sample is set to pH 5.5 or less prior to loading, the filter tends to clog (plasma will not be centrifuged through the column at all), and at higher pH, microvesicle RNA recovery is lower due to the instability of the microvesicles. At neutral pH, RNA recovery from microvesicles is optimal. In some embodiments, the buffer used is at a 1X concentration, a 2X concentration, a 3X concentration, or a 4X concentration. For example, the loading or binding buffer is at 2X concentration, while the wash buffer is at 1X concentration.
In some embodiments, the method comprises one or more washing steps, e.g., after contacting the biological sample with the capture surface. In some embodiments, a detergent is added to the wash buffer to facilitate removal of non-specific binding (i.e., contaminants, cell debris, and circulating protein complexes or nucleic acids) to obtain a purer microvesicle fraction. Suitable detergents include, but are not limited to, sodium Dodecyl Sulfate (SDS), tween-20, tween-80, triton X-100, nonidet P-40 (NP-40), brij-35, brij-58, octyl glucoside, octyl thioglucoside, CHAPS, or CHAPSO.
In some embodiments, a capture surface, such as a membrane, is contained within the device; the device is used for centrifugation, e.g. spin columns, or for vacuum systems, e.g. vacuum filter holders, or for filtration by pressure, e.g. syringe filters. In a preferred embodiment, the capture surface is contained in a spin column or vacuum system.
Isolation of microvesicles from a biological sample prior to extraction of nucleic acids is advantageous for the following reasons: 1) Extracting nucleic acids from microvesicles provides the opportunity to selectively analyze disease or tumor specific nucleic acids by isolating disease or tumor specific microvesicles from within a fluid sample in addition to other microvesicles; 2) Nucleic acid-containing microvesicles provide significantly higher yields of nucleic acid species with higher integrity, compared to the yield/integrity obtained by extracting nucleic acids directly from a fluid sample without first isolating the microvesicles; 3) Scalability, e.g., for detecting nucleic acids expressed at low levels, sensitivity may be increased by concentrating microvesicles from a larger volume of sample using the methods and/or kits described herein; 4) A purer or higher quality/integrity of the extracted nucleic acids, as proteins, lipids, cell debris, cells and other potential contaminants and PCR inhibitors naturally found within the biological sample are excluded prior to the nucleic acid extraction step; and 5) more options in nucleic acid extraction methods can be utilized, as the isolated microvesicle fractions can have a smaller volume than the starting sample volume, enabling the extraction of nucleic acids from these fractions or pellets using a small volume column filter.
Several methods for isolating microvesicles from a biological sample have been described in the art. For example, differential centrifugation methods are described in the paper by Raposo et al (Raposo et al, 1996), the paper by Skog et al (Skog et al, 2008) and the paper by Nilsson et al (Nilsson et al, 2009). Ion exchange and/or gel permeation chromatography methods are described in U.S. Pat. Nos. 6,899,863 and 6,812,023. Sucrose density gradient or organelle electrophoresis methods are described in U.S. Pat. No. 7,198,923. The Magnetic Activated Cell Sorting (MACS) method is described in the paper by Taylor and Gercel Taylor (Taylor and Gercel-Taylor, 2008). The nano-membrane ultrafiltration concentration method is described in a paper by Cheruvanky et al (Cheruvanky et al, 2007). The Percoll gradient separation method is described in the publication by Miranda et al (Miranda et al, 2010). Further, microvesicles can be identified and isolated from a bodily fluid of a subject by a microfluidic device (Chen et al, 2010). In research and development and commercial applications of nucleic acid biomarkers, it is desirable to extract high quality nucleic acids from biological samples in a consistent, reliable, and practical manner.
It is therefore an object of the present invention to provide a method for rapidly and easily separating nucleic acid-containing particles from a biological sample, such as a body fluid, and extracting high-quality nucleic acids from the separated particles. The methods of the invention may be adapted to be adapted and incorporated into compact devices or apparatus for use in a laboratory or clinical setting or in the field.
In the working examples provided herein, human plasma from normal healthy controls was obtained from bioreduction LLC having a blood pool SOP developed by Exosome Diagnostic Inc. Briefly, blood was collected into K2 EDTA tubes and mixed well using a full inversion. Subsequently, the tubes were centrifuged at 1300Xg for 10 minutes to separate blood cells and plasma. The plasma was then removed and filtered through a 0.8 μm filter to remove cell debris and platelets. All plasma samples were then aliquoted into 1ml frozen vials and stored at-80 ℃ until the time of use.
Prior to RNA isolation, the membrane was conditioned by passing through an equilibration buffer. Thawed plasma samples were diluted with loading buffer. The diluted plasma sample slowly passes through the membrane adsorbing the microvesicles. The membrane is then washed with a wash buffer to remove any weakly bound plasma components. Subsequently, a lysis reagent is passed through the membrane to lyse the microvesicles. RNA was isolated using miRNeasy kit (Qiagen).
RNA was evaluated for mass and concentration using a RNA 6000 Pico Chip with a 2100 Bioanalyzer (Agilent). The relative amount of extracted RNA was measured by RT-qPCR using a selected human gene expression Assay from Applied Biosystems (Taqman Assay).
Although the examples provided herein use plasma samples, the skilled artisan will appreciate that these methods can be applied to a variety of biological samples. Other suitable biological samples include urine, cerebrospinal fluid, blood including blood components such as plasma and serum, sputum, pleural fluid, nipple aspirates, lymph fluid, respiratory, intestinal and genitourinary fluids, tears, saliva, breast milk, fluids from the lymphatic system, semen, fluids in the organ system (intrabodily fluid), ascites, tumor cyst fluid, amniotic fluid, cell culture supernatant, and combinations thereof.
The methods and kits of the disclosure are suitable for use with samples derived from human subjects. The methods and kits of the disclosure are suitable for use with samples derived from non-human subjects, such as rodents, non-human primates, companion animals (e.g., cats, dogs, horses) and/or farm animals (e.g., chickens).
In some embodiments, a pre-processing step prior to microvesicle isolation, purification, or enrichment is performed to remove a number of unwanted particles, cells and/or cell debris and other contaminants present in the biological sample. The pre-processing step may be achieved by one or more centrifugation steps (e.g. differential centrifugation) or one or more filtration steps (e.g. ultrafiltration) or a combination thereof. When more than one centrifugation preprocessing step is performed, the biological sample may be centrifuged first at a low speed and then at a high speed. If desired, further suitable centrifugation preprocessing steps may be performed. Alternatively or additionally to one or more centrifugation preprocessing steps, the biological sample may be filtered. For example, a biological sample may be first centrifuged at 20,000g for 1 hour to remove a large amount of unwanted particles; the sample may be filtered, for example, through a 0.8 μm filter.
In some embodiments, one or more centrifugation steps are performed before or after contacting the biological sample with the capture surface to separate microvesicles and concentrate microvesicles separated from the biological fraction. For example, the sample is centrifuged at 20,000g for 1 hour at 4 ℃. To remove a large amount of unwanted particles, cells and/or cell debris, the sample may be centrifuged at a low speed of about 100-500g, preferably about 250-300 g. Alternatively or additionally, the sample may be centrifuged at a higher speed. Suitable centrifugation speeds are up to about 200,000g; for example from about 2,000g to less than about 200,000g. Speeds in excess of about 15,000g and less than about 200,000g or in excess of about 15,000g and less than about 100,000g or in excess of about 15,000g and less than about 50,000g are preferred. About 18,000g to about 40,000g or about 30,000g; and a speed of about 18,000g to about 25,000g is more preferred. Particularly preferred is a centrifugation speed of about 20,000g. Generally, a suitable time for centrifugation is from about 5 minutes to about 2 hours, for example from about 10 minutes to about 1.5 hours, or more preferably from about 15 minutes to about 1 hour. A time of about 0.5 hours may be preferred. It is sometimes preferred to subject the biological sample to centrifugation at about 20,000g for about 0.5 hours. However, the above speeds and times may be suitably used in any combination (e.g., about 18,000g to about 25,000g, or about 30,000g to about 40,000g for about 10 minutes to about 1.5 hours, or about 15 minutes to about 1 hour, or about 0.5 hours, etc.). One or more centrifugation steps may be performed at sub-ambient temperatures, for example at 0-10 ℃, preferably about 1-5 ℃, for example about 3 ℃ or about 4 ℃.
In some embodiments, one or more filtration steps are performed before or after contacting the biological sample with the capture surface. Filters having a size in the range of about 0.1 to about 1.0 μm, preferably about 0.8 μm or 0.22 μm, may be employed. The filtration may also be performed by sequential filtration using filters with decreasing porosity.
In some embodiments, one or more centrifugation steps are performed in order to reduce the volume of sample to be treated during the chromatography phase, before or after contacting the biological sample with the capture surface. The concentration can be adjusted by centrifugation of the sample at high speed, e.g., 10,000-100,000 g, to cause the microvesicles to settle. This may consist of a series of differential centrifugations. The microvesicles in the obtained mass can be reconstituted with a smaller volume and in a suitable buffer for the subsequent steps of the process. The concentration step may also be performed by ultrafiltration. In fact, this ultrafiltration concentrates the biological sample and performs an additional purification of the microvesicle fraction. In another embodiment, the filtration is ultrafiltration, preferably tangential ultrafiltration. Tangential ultrafiltration consists of concentration and fractionation of a solution between two compartments (filtrate and retentate) separated by a membrane with a defined cut-off threshold. The separation is performed by applying a flow in the retentate compartment and applying a transmembrane pressure between the compartment and the filtrate compartment. Different systems can be used to perform ultrafiltration, such as spiral membranes (Amicon), flat membranes or hollow fibers (Amicon, millipore, sartorius, pall, GF, sephacor). Within the scope of the present invention, the use of membranes having a cut-off threshold of less than 1000 kDa, preferably from 100 kDa to 1000 kDa, or even more preferably from 100 kDa to 600 kDa is advantageous.
In some embodiments, one or more size exclusion chromatography steps or gel permeation chromatography steps are performed before or after contacting the biological sample with the capture surface. For performing the gel permeation chromatography step, it is preferred to use a support selected from the group consisting of silica, acrylamide, agarose, dextran, ethylene glycol-methacrylate copolymer or mixtures thereof, e.g. agarose-dextran mixtures. For example, such vectors include, but are not limited to: SUPERDEX 200HR (Pharmacia), TSK G6000 (TosoHaas) or SEPHACRYL S (Pharmacia).
In some embodiments, one or more affinity chromatography steps are performed before or after contacting the biological sample with the capture surface. Some microvesicles may also be characterized by certain surface molecules. Because microvesicles bud from the cytoplasmic membrane, these microvesicles typically share many of the same surface molecules found on the cell from which they are derived. As used herein, "surface molecule" collectively refers to antigens, proteins, lipids, carbohydrates and markers found on the surface or in or on the membrane of the microvesicles. These surface molecules may include, for example, receptors, tumor associated antigens, membrane protein modifications (e.g., glycosylation structures). For example, microvesicles that bud from tumor cells typically display tumor-associated antigens on their cell surface. As such, affinity chromatography or affinity exclusion chromatography may also be utilized in combination with the methods provided herein to isolate, identify, and or enrich a specific population of microvesicles from a specific donor cell type (Al-Nedawi et Al, 2008 Taylor and Gercel-Taylor, 2008. For example, tumor (malignant or non-malignant) microvesicles carry tumor cell surface antigens and can be detected, isolated and/or enriched via these specific tumor-associated surface antigens. In one example, the surface antigen is an epithelial cell adhesion molecule (EpCAM) that is specific for microvesicles from cancers of pulmonary (long), colorectal, breast, prostate, head and neck and liver origin, but not of hematopoietic cell origin (Balzar et al, 1999 went et al, 2004. In addition, tumor-specific microvesicles can also be characterized by the absence of certain surface markers, such as CD80 and CD 86. In these cases, microvesicles with these markers can be excluded from further analysis of the tumor-specific markers, e.g. by affinity exclusion chromatography. Affinity chromatography may be accomplished, for example, by using different carriers, resins, beads, antibodies, aptamers, aptamer analogs, molecularly imprinted polymers, or other molecules known in the art that specifically target the desired surface molecule on the microvesicles.
Optionally, control particles can be added to the sample prior to microvesicle isolation or nucleic acid extraction to serve as an internal control to assess the efficiency or quality of microvesicle purification and/or nucleic acid extraction. The methods and/or kits described herein provide for efficient separation of the control particles along with the microvesicle fraction. These control particles include Q-beta bacteriophage, viral particles, or any other particle containing a control nucleic acid (e.g., at least one control target gene) that may be naturally occurring or engineered by recombinant DNA techniques. In some embodiments, the number of control particles is known prior to addition to the sample. Control target genes can be quantified using real-time PCR analysis. Quantification of the control target gene can be used to determine the efficiency or quality of the microvesicle purification or nucleic acid extraction process.
Preferably, the control particle is a Q-beta bacteriophage, referred to herein as a "Q-beta particle". The Q-beta particles used in the methods and/or kits described herein can be naturally occurring viral particles or can be recombinant or engineered viruses, wherein at least one component of the viral particle (e.g., a portion of a genomic or coat protein) is synthesized by recombinant DNA or molecular biology techniques known in the art. Q- β is a member of the luoviridae family, characterized by a linear, single-stranded RNA genome, consisting of 3 genes encoding four viral proteins: coat protein, mature protein, cleavage protein and RNA replicase. Due to its similar size to the average microvesicles, Q- β can be easily purified from a biological sample using the same purification method as described herein for isolating microvesicles. In addition, the low complexity of the single-stranded gene structure of Q-beta virus is advantageous due to its use as a control in amplification-based nucleic acid assays. The Q-beta particles contain a control target gene or control target sequence to be detected or measured for quantifying the amount of Q-beta particles in the sample. For example, the control target gene is the Q- β coat protein gene. After the Q-beta particles are added to the biological sample, the nucleic acids from the Q-beta particles are extracted along with the nucleic acids from the biological sample using the extraction methods and/or kits described herein. Detection of the Q- β control target gene can be determined by RT-PCR analysis, e.g., simultaneously with the biomarker of interest (i.e., BRAF). A standard curve of at least 2, 3 or 4 known concentrations in a 10-fold dilution of a control target gene can be used to determine copy number. The detected copy number and the amount of added Q-beta particles can be compared to determine the quality of the separation and/or extraction process.
In a preferred embodiment, the Q-beta particles are added to the urine sample prior to nucleic acid extraction. For example, Q-beta particles are added to the urine sample before ultrafiltration and/or after the prefiltration step.
In some embodiments, 50, 100, 150, 200, 250, 300, 350, 400, 450, 500, 1,000, or 5,000 copies of Q-beta particles are added to a bodily fluid sample. In a preferred embodiment, 100 copies of the Q-beta particles are added to the body fluid sample. The copy number of Q-beta particles can be calculated based on the ability of the Q-beta bacteriophage to infect the target cell. Thus, the copy number of Q-beta particles correlates with the colony forming units of the Q-beta bacteriophage.
Nucleic acid extraction
The present invention relates to the use of a capture surface for improved separation, purification or enrichment of microvesicles. The methods disclosed herein provide highly enriched microvesicle fractions for extracting high quality nucleic acids from the microvesicles. The nucleic acid extraction obtained by the methods and/or kits described herein can be used in a variety of applications where high quality nucleic acid extraction is required or preferred, for example in the diagnosis, prognosis or monitoring of a disease or medical condition.
Recent studies have revealed that nucleic acids within microvesicles have a role as biomarkers. For example, WO 2009/100029 describes, inter alia, the use of nucleic acids extracted from microvesicles in the serum of GBM patients for medical diagnosis, prognosis and treatment assessment. WO 2009/100029 also describes the use of nucleic acids extracted from microvesicles in human urine for the same purpose. The use of nucleic acids extracted from microvesicles is thought to potentially circumvent the need for biopsy, highlighting the enormous diagnostic potential of microvesicle biology (Skog et al, 2008).
The quality or purity of the isolated microvesicles can directly affect the quality of the extracted microvesicle nucleic acid, which in turn directly affects the efficiency and sensitivity of the biomarker assay for disease diagnosis, prognosis and/or monitoring. In view of the importance of accurate and sensitive diagnostic tests in the clinical field, there is a need for methods for isolating highly enriched microvesicle fractions from biological samples. To address this need, the present invention provides methods for isolating microvesicles from a biological sample for extracting high quality nucleic acids from the biological sample. As shown herein, the highly enriched microvesicle fraction is isolated from the biological sample by the methods and/or kits described herein, and wherein high quality nucleic acids are subsequently extracted from the highly enriched microvesicle fraction. These high quality extracted nucleic acids can be used to measure or evaluate the presence or absence of biomarkers for aiding in the diagnosis, prognosis, and/or monitoring of diseases or other medical conditions.
As used herein, the term "biological sample" refers to a sample containing biological material, such as DNA, RNA, and proteins. In some embodiments, the biological sample may suitably comprise a bodily fluid from a subject. The bodily fluid may be a fluid isolated from any location in the subject's body, preferably a peripheral location, including, but not limited to, for example, blood, plasma, serum, urine, sputum, spinal fluid, cerebrospinal fluid, pleural fluid, nipple aspirates, lymph fluid, respiratory, intestinal, and genitourinary fluids, tears, saliva, breast milk, fluids from the lymphatic system, semen, fluids in the organ system, ascites fluid, tumor cyst fluid, amniotic fluid, and cell culture supernatant, and combinations thereof. In some embodiments, the preferred body fluid for use as a biological sample is urine. In other embodiments, it is preferred that the body fluid is serum. In yet other embodiments, it is preferred that the body fluid is plasma. In other embodiments, it is preferred that the bodily fluid is cerebrospinal fluid. Suitably, a sample volume of about 0.1m1 to about 30m1 of fluid may be used. The volume of fluid may depend on a few factors, such as the type of fluid used. For example, the volume of the serum sample may be about 0.1ml to about 4m1, preferably about 0.2ml to 4ml. The volume of the plasma sample may be from about 0.1ml to about 4ml, preferably from 0.5ml to 4ml. The volume of the urine sample can be about 10 m1 to about 30m1, preferably about 20 ml. The biological sample may also include a stool or caecum sample, or a supernatant isolated therefrom.
The term "subject" is intended to include all animals that are shown or expected to have nucleic acid-containing particles. In particular embodiments, the subject is a mammal, human or non-human primate, dog, cat, horse, cow, other farm animal, or rodent (e.g., mouse, rat, guinea pig, etc.). The human subject may be a normal human without observable abnormalities such as disease. The human subject may be a human with an observable abnormality, such as a disease. Observable abnormalities may be observed by the human self or by a medical professional. The terms "subject", "patient" and "individual" are used interchangeably herein.
As used herein, the term "nucleic acid" refers to DNA and RNA. The nucleic acid may be single-stranded or double-stranded. In some cases, the nucleic acid is DNA. In some cases, the nucleic acid is RNA. RNA includes, but is not limited to, messenger RNA, transfer RNA, ribosomal RNA, non-coding RNA, microrna, and HERV elements.
As used herein, the term "high quality" in reference to nucleic acid extraction means extraction in which 18S and 28S rRNA can be detected, preferably at a rate of about 1:1 to about 1:2; and more preferably a ratio of about 1:2. Desirably, the high quality nucleic acid extraction obtained by the methods and/or kits described herein also has an RNA integrity number greater than or equal to 5 for low protein biological samples (e.g., urine), or greater than or equal to 3 for high protein biological samples (e.g., serum), and a nucleic acid yield greater than or equal to 50 pg/ml from 20m low protein biological samples or 1ml high protein biological samples.
High quality RNA extraction is desirable because RNA degradation can adversely affect downstream evaluation of extracted RNA, for example in gene expression and mRNA analysis, and in analysis of non-coding RNAs such as small RNAs and micrornas. The novel methods and/or kits described herein allow for the extraction of high quality nucleic acids from microvesicles isolated from a biological sample, thereby allowing for the performance of accurate analysis of nucleic acids within the microvesicles.
After isolation of microvesicles from a biological sample, nucleic acids may be extracted from the isolated or enriched microvesicle fraction. To achieve this, in some embodiments, the microvesicles may be first lysed. The lysis of microvesicles and extraction of nucleic acids can be achieved using various methods known in the art. In one embodiment, the lysis and extraction steps can be achieved using a commercially available Qiagen RNeasy Plus kit. In another embodiment, the lysis and extraction steps can be accomplished using a commercially available Qiagen miRNeasy kit. In another embodiment, nucleic acid extraction can be accomplished using phenol chloroform according to standard procedures and techniques known in the art. Such methods may also utilize a nucleic acid binding column to capture nucleic acids contained within the microvesicles. Once bound, the nucleic acid can then be eluted using a buffer or solution suitable for disrupting the interaction between the nucleic acid and the binding column, thereby successfully eluting the nucleic acid.
In some embodiments, the nucleic acid extraction method further comprises the step of removing or mitigating adverse factors that prevent high quality nucleic acid extraction from the biological sample. Such adverse factors are heterogeneous in that different biological samples may contain multiple species of adverse factors. In some biological samples, factors such as excess DNA can affect the quality of nucleic acid extraction from such samples. In other samples, factors such as excess endogenous rnase may affect the quality of nucleic acid extraction from such samples. A number of reagents and methods may be used to remove these disadvantages. These methods and reagents are collectively referred to herein as "extraction enhancement operations". In some cases, the extraction enhancement operation may involve the addition of nucleic acid extraction enhancing reagents to the biological sample. Such extraction enhancing agents as defined herein may include, but are not limited to, rnase inhibitors, such as, for example, supra-In (commercially available from Ambion inc.) or RNaseINplus (commercially available from Promega corp.), or other agents that function In a similar manner, in order to remove adverse factors such as endogenous rnases; proteases (which can act as RNA inhibitors); a DNA enzyme; a reducing agent; decoy substrates such as synthetic RNA and/or carrier RNA; a soluble receptor that can bind rnase; small interfering RNA (siRNA); RNA binding molecules such as anti-RNA antibodies, basic proteins or chaperone proteins; rnase denaturing substances, such as a hypertonic solution, detergents, or combinations thereof.
For example, the extraction enhancement operation can include adding an rnase inhibitor to the biological sample and/or the isolated microvesicle fraction prior to extracting the nucleic acid; preferably, the rnase inhibitor has a concentration greater than 0.027 AU (I X) for a sample volume equal to or greater than 1 μ Ι; alternatively, a concentration greater than or equal to 0.1 AU (5X) for samples equal to or greater than 1 μ Ι; alternatively, a concentration greater than or equal to 0.27 AU (10X) for samples equal to or exceeding I μ l; alternatively, a concentration greater than or equal to 0.675 AU (25X) for samples equal to or greater than 1 μ Ι; or alternatively, a concentration greater than or equal to 1.35 AU (50X) for samples equal to or greater than 1 μ l; wherein I X concentration refers to enzymatic conditions wherein 0.027 AU or more rnase inhibitor is used for the treatment of microvesicles isolated from 1 μ l or more body fluid, 5X concentration refers to enzymatic conditions wherein 0.135 AU or more rnase inhibitor is used for the treatment of microvesicles isolated from 1 μ l or more body fluid, 10X protease concentration refers to enzymatic conditions wherein 0.27 AU or more rnase inhibitor is used for the treatment of particles isolated from 1 μ l or more body fluid, 25X concentration refers to enzymatic conditions wherein 0.675 AU or more rnase inhibitor is used for the treatment of microvesicles isolated from 1 μ l or more body fluid, and 50X protease concentration refers to enzymatic conditions wherein 1.35 AU or more rnase inhibitor is used for the treatment of particles isolated from 1 μ l or more body fluid. Preferably, the rnase inhibitor is a protease, in which case 1 AU is protease activity that releases folin positive amino acids and peptides corresponding to 1 μmol tyrosine/min.
These enhancing agents can function in a variety of ways, such as by inhibiting rnase activity (e.g., rnase inhibitors), by ubiquitous degradation of proteins (e.g., proteases), or by chaperones that bind and protect RNA (e.g., RNA binding proteins). In all cases, such extraction enhancing agents remove or at least mitigate some or all of the adverse factors in the biological sample or associated with the isolated particles that otherwise prevent or interfere with high quality extraction of nucleic acids from the isolated particles.
In some embodiments, quantification of the extracted 18S and 28S rRNA can be used to determine the quality of nucleic acid extraction.
Detection of nucleic acid biomarkers
In some embodiments, the extracted nucleic acids comprise RNA. In this case, the RNA is preferably reverse transcribed into complementary DNA (cDNA) before further amplification. Such reverse transcription may be performed alone or in combination with an amplification step. One example of a method that combines reverse transcription and amplification steps is reverse transcription polymerase chain reaction (RT-PCR), which can be further modified to be quantitative, for example quantitative RT-PCR as described in U.S. patent No. 5,639,606, which is incorporated herein by reference for this teaching. Another example of the method includes two separate steps: a first reverse transcription step to convert RNA into cDNA, and a second step to quantify the amount of cDNA using quantitative PCR. As demonstrated in the examples below, RNA extracted from nucleic acid-containing particles using the methods disclosed herein includes a number of transcript species, including but not limited to ribosomal 18S and 28S rRNA, microrna, transfer RNA, transcripts associated with a disease or medical condition, and biomarkers of importance for the diagnosis, prognosis, and monitoring of medical conditions.
For example, RT-PCR analysis determines Ct (cycle threshold) values for each reaction. In RT-PCR, positive reactions are detected by the accumulation of fluorescent signals. The Ct value is defined as the number of cycles required for the fluorescence signal to cross the threshold (i.e., exceed the background level). The Ct level is inversely proportional to the amount of target or control nucleic acid in the sample (i.e., the lower the Ct level, the greater the amount of control nucleic acid in the sample).
In another embodiment, the copy number of the control nucleic acid can be measured using any of a variety of art-recognized techniques, including but not limited to RT-PCR. The copy number of the control nucleic acid can be determined using methods known in the art, for example, by generating and using a calibration or standard curve.
In some embodiments, the one or more biomarkers can be one or a collection of genetic abnormalities, which are used herein to refer to the amount of nucleic acid within the nucleic acid-containing particle as well as nucleic acid variants. Specifically, genetic abnormalities include, but are not limited to, overexpression of a gene (e.g., an oncogene) or set of genes, underexpression of a gene (e.g., a tumor suppressor gene such as p53 or RB) or set of genes, selective production of splice variants of a gene or set of genes, copy Number Variants (CNVs) (e.g., DNA double minute (Hahn, 1993), nucleic acid modifications (e.g., methylation, acetylation, and phosphorylation), single Nucleotide Polymorphisms (SNPs), chromosomal rearrangements (e.g., inversions, deletions, and duplications), and mutations (insertions, deletions, duplications, missense, nonsense, synonyms, or any other nucleotide change) of a gene or set of genes that ultimately affect the activity and function of the gene product, resulting in a change in the level of alternative transcriptional splice variants and/or gene expression), or a combination of any of the foregoing.
The analysis of the nucleic acids present in the isolated particles is quantitative and/or qualitative. For quantitative analysis, the relative or absolute amount (expression level) of a specific nucleic acid of interest within the isolated particle is measured using methods known in the art (described below). For qualitative analysis, the identity of the specific nucleic acid of interest, whether wild-type or variant, within the isolated microvesicle is identified using methods known in the art.
The invention also includes the multiple uses of the novel method of isolating microvesicles from a biological sample for high quality nucleic acid extraction to (i) aid in the diagnosis of a subject, (ii) monitor the progression or recurrence of a disease or other medical condition in a subject, or (iii) aid in assessing the efficacy of a treatment in a subject undergoing or considering treatment for a disease or other medical condition; wherein the presence or absence of one or more biomarkers in the nucleic acid extract from the method is determined and the one or more biomarkers are correlated with the diagnosis, progression or recurrence, or efficacy of treatment, respectively, of the disease or other medical condition.
Kit for isolating microvesicles from a biological sample
One aspect of the invention further relates to kits for use in the methods disclosed herein. The kit includes a capture surface apparatus sufficient to separate microvesicles from a biological sample from unwanted particles, debris, and small molecules also present in the biological sample. The invention also optionally includes instructions for using the aforementioned reagents in the isolation and optional subsequent nucleic acid extraction processes.
Examples
Although the examples provided herein use various membranes and devices for centrifugation and/or filtration purposes, it will be appreciated that these methods may be used with any capture surface and/or containment device that allows for efficient capture of microvesicles, and release of nucleic acids, particularly RNA, contained therein.
Example 1 plasma microvesicle RNA can be isolated using a 0.65um positively charged Q PES filter in vacuum form
Normal control plasma was obtained from bioreclaimation LLC. Blood was collected into K2 EDTA tubes and mixed well using a full inversion. The tubes were centrifuged at 1300Xg for 10 minutes to separate blood cells from plasma. Subsequently, the plasma was filtered through a 0.8 μm mixed cellulose ester filter (Millipore, billerica, ma., USA) to remove cell debris and platelets, and divided into 1ml aliquots. Aliquots were frozen at-80 ℃ until needed.
Isolation of 4mL plasma microvesicle RNA was performed using ultracentrifugation or Fast Trap adenovirus purification and concentration kit (Millipore, billerica, ma., USA) 0.65um positively charged Q-polyvinylsulfone vacuum filtration.
In the ultracentrifugation method, one 1mL plasma aliquot from four subjects was transferred to 5mL of a heteroisomorphous polymer (polyallomer) tube (Beckman-Coulter, miami, fl., USA) containing 8 μ L rnase inhibitor (40U/μ L, promega, madison, wi., USA) and incubated for 5 minutes at room temperature. After incubation, plasma was diluted in 1mL PBS (10 mM sodium phosphate, 2mM potassium phosphate, 2.7mM KCl, 137mM NaCl, pH 7.4). The microvesicles were formed into clumps by ultracentrifugation at 120,000g for 80 minutes at 8 ℃. Microvesicle pellets were washed in 42 μ L PBS and 8 μ L RNasin Plus and incubated for 20 minutes at room temperature. The microvesicle pellet was lysed in 700ul Qiazol reagent (Qiagen, valencia, ca., USA).
In the 0.65um positively charged Q-polyethylene sulfone vacuum filtration method, one 1mL plasma aliquot from the same four subjects used in the ultracentrifugation method was taken, diluted with 5mL PBS, and mixed with 1mL 10X binding buffer (Millipore). The filter was conditioned by passing 25mL of equilibration buffer (Millipore) through a vacuum prior to application of the plasma sample. Subsequently, the plasma sample is passed through the filter via vacuum. The filtrate was saved for further analysis. The filters were washed with 20mL of wash buffer (Millipore) via vacuum. Subsequently, the microvesicles were lysed with Qiazol. 2.25mL of Qiazol was applied to the membrane and dispensed through the filter by drawing approximately 5 drops of Qiazol via vacuum. The filter was then incubated at room temperature for 5 minutes and eluted via vacuum.
The filtrate samples were transferred to two 5mL heterogenous polymer tubes (Beckman-Coulter, miami, fl., USA) containing 8. Mu.L RNase Plus (40U/. Mu.l, promega, madison, wi., USA) RNase inhibitor and incubated for 5 minutes at room temperature. The microvesicles were pelleted by centrifugation at 120,000g for 80 min at 8 ℃. Microvesicle pellets were washed in 42 μ L PBS and 8 μ L RNasin Plus and incubated for 20 minutes at room temperature. The microvesicle pellet was lysed in 700ul Qiazol reagent (Qiagen, valencia, ca., USA).
For ultracentrifugation and filtration (filter and filtrate) samples, microvesicle RNA was isolated using miRNeasy kit (Qiagen) according to manufacturer's recommendations. RNA quality and concentration were assessed using a RNA 6000 Pico Chip (FIG. 1A) with a 2100 Bioanalyzer (Agilent, palo Alto, ca., USA). Two-thirds and two-ninth of the total microvesicle RNA volume were converted to cDNA using the SuperScript VILO cDNA synthesis kit (Invitrogen, carlsbad, ca., USA) and the Taqman MicroRNA reverse transcription kit (Applied Biosystems, foster City, ca., USA), respectively, according to the manufacturer's protocol.
To compare microvesicle RNA isolated by filtration (filter and filtrate) and ultracentrifugation, RT-PCR was performed on mRNA and non-coding RNA (including microrna) using primers and probes specific for GAPDH, RN7SL, rnaspep, miR-16, miR-150, and let-7 a. For GAPDH and rnaspep, amplification reactions were performed in 20ul volumes containing 2X Taqman gene expression premix (Applied Biosystems, foster City, ca., USA), 20X Taqman gene expression assay (Applied Biosystems, foster City, ca., USA), and 1. For RN7SL, the amplification reaction was performed in a 20ul volume containing 2X Taqman gene expression premix, 900nM RN7SL forward CAAAACTCCCGTGCTGATCA (SEQ ID NO 1), 900nM RN7SL reverse GGCTGGAGTGCAGTGGCTAT (SEQ ID NO 2), 250nM RN7SL probe TGGGATCGCGCCTGT (SEQ ID NO 3), and fraction 1. For miR-16, miR-150, and let-7a, amplification reactions were performed in 20ul volumes containing 2X Taqman universal PCR premix, 20X Taqman MicroRNA assay (Applied Biosystems, foster City, ca., USA), and 1. The amplification conditions consisted of: 1 cycle of 2 minutes at 50 ℃;1 cycle at 95 ℃ for 10 minutes; 40 cycles of 95 ℃,10 min and 60 ℃,1 min. See fig. 1B.
Example 2 detection of the BRAF _ V600E mutation in plasma samples from melanoma patients Using Millipore Fast Trap Virus purification columns
Melanoma plasma was obtained from Ludwig maximinians University following protocol approved by IRB and as described in example 1.
Isolation of 2mL and 12mL plasma microvesicle RNA was performed using ultracentrifugation or Fast Trap adenovirus purification and concentration kit (Millipore, billerica, ma., USA) 0.65um positively charged Q polyvinylsulfone vacuum filtration.
In the ultracentrifugation method, 2mL and 3X4mL of plasma were transferred to 5mL heterogeneous isomorphous polymer tubes (Beckman-Coulter, miami, fl., USA) containing 8 μ L RNase Plus (40U/μ L, promega, madison, wi., USA) RNase inhibitor and incubated for 5 minutes at room temperature. After incubation, 2mL and 4mL each plasma were diluted in 3mL and 1mL PBS, respectively. The microvesicles were agglomerated and lysed as described in example 1.
In the 0.65um positively charged Q polyethylene sulfone vacuum filtration method, 2mL and 12mL plasma with 2.5 mL and 15mL PBS diluted, respectively, and with 500ul and 3mL 10X binding buffer (Millipore) mixed. The filter was conditioned by passing 25mL of equilibration buffer (Millipore) through a vacuum prior to application of the plasma sample. Subsequently, the plasma sample is passed through the filter via vacuum. The filtrate was saved for further analysis. The filter was washed with 20mL of wash buffer (Millipore) via vacuum. The washes were saved for further analysis. The filter was lysed as described in example 1.
2mL and 12mL plasma filtrate samples were transferred to one and six 5mL heteroisomorphic polymer tubes (Beckman-Coulter, miami, fl., USA), respectively. The washed samples were each transferred to four 5mL heteromorphic polymer tubes. The heteromorphic polymer tubes were incubated with 8 μ L RNase Plus (40U/μ L, promega, madison, wi., USA) RNase inhibitor for 5 minutes at room temperature. The microvesicles were agglomerated and lysed as described in example 1.
For ultracentrifugation and filtration (filter, filtrate and wash) samples, microvesicle RNA was isolated and evaluated for quality and concentration, as described in example 1.
For ultracentrifugation and filtration (filter, filtrate and wash) samples, microvesicle RNA was isolated and evaluated for quality and concentration as described in example 1. See fig. 12A. Six seventeen of the total microvesicle RNA volume was converted into cDNA using the SuperScript VILO cDNA synthesis kit (Invitrogen, carlsbad, ca., USA) according to the manufacturer's protocol.
To compare the ability to detect BRAF mutations by filtration (filter, filtrate and wash) and ultracentrifugation of isolated microvesicle RNA, RT-PCR was performed on wild-type and mutant BRAF mRNA. BRAF Mutation assay uses ARMS (amplification refractive and Mutation System) allele specific PCR. The assay was modified by AstraZeneca (Cheshire, UK). The mutation assay contains primers specific for amplifying BRAF T1799A (detecting V600E, V K or V600D, depending on the presence of additional mutations at position 1798 or 1800). The amplification reaction was performed in a 20ul volume containing 2X Taqman universal PCR premix, 900nM BRAF WT forward AAAAATAGGTGATTTTGGTCTAGCTACAGT (SEQ ID NO 4), 900nM BRAF MT ARMS forward AAAAATAGGTGATTTTGGTCTAGCTACATA (SEQ ID NO 5), 900nM BRAF JS eh15 reverse TGGATCCAGACAACTGTTCAA (SEQ ID NO 6), 250nM BRAF AZ eh15 probe GATGGAGTGGGTCCCATCAG (SEQ ID NO 7) and 1. The amplification conditions consisted of: 1 cycle of 2 minutes at 50 ℃;1 cycle of 10 minutes at 95 ℃; 50 cycles of 95 ℃,10 min and 60 ℃ for 1 min. See fig. 2.
Example 3 regenerated cellulose spin column
Normal control plasma was obtained from bioreclaimation LLC as described in example 1.
Isolation of 4mL plasma microvesicles RNA was performed using ultracentrifugation or 3um positively charged Q regenerated cellulose centrifugation filtration.
Ultracentrifugation samples were prepared, pelleted and lysed as described in example 1.
In the 3um positively charged Q regenerated cellulose centrifugation method, 1mL plasma aliquots from the same four subjects used in the ultracentrifugation method were combined and diluted with 444ul 10X loading buffer (Sartorius). The filters were conditioned by passing 5ml of 1X wash buffer (Sartorius) at 500xg for 5 minutes before applying the plasma sample. Subsequently, the plasma sample was passed through the filter at 500Xg for 5 minutes. The filtrate was saved for further analysis. The filter was washed twice with 18mL of wash buffer (Sartorius) at 500Xg for 5 minutes. The first wash was saved for further analysis. Subsequently, the microvesicles were lysed with Qiazol. 1mL of Qiazol was applied to the membrane and dispensed at 100Xg for 1 second. The filter was then incubated at room temperature for 10 minutes and eluted at 500Xg for 5 minutes.
The filtrate and washed samples were transferred to one and four 5mL heteroisomorphic polymer tubes (Beckman-Coulter, miami, fl., USA), respectively. The heteromorphic polymer tubes were incubated with 8 μ L RNase Plus (40U/μ L, promega, madison, wi., USA) RNase inhibitor for 5 minutes at room temperature. Wash the heteromorphic polymer tubes diluted with 500ul PBS. The microvesicles were agglomerated and lysed as described in example 1.
For ultracentrifugation and filtration (filter, filtrate and wash) samples, microvesicle RNA was isolated and evaluated for quality and concentration, as described in example 1. See fig. 3A. cDNA was synthesized as described in example 1.
To compare microvesicle RNA isolated by filtration (filter, filtrate and wash) and ultracentrifugation, RT-PCR was performed on mRNA and non-coding (including microrna) using primers and probes specific for GAPDH, RN7SL, rnaspep, miR-16, miR-150 and let-7a, as described in example 1. See fig. 3B.
Example 4 Pall Mustang S Membrane in spin columns (homemade columns)
Normal control plasma was obtained from bioreduction LLC as described in example 1.
Isolation of 4mL plasma microvesicles RNA was performed using ultracentrifugation or Mustang S (Pall, port Washington, ny., USA) 0.8um negatively charged S polyvinylsulfone centrifugation using a homemade spin column apparatus.
Ultracentrifuged samples were prepared, pelleted and lysed as described in example 1.
In the 0.8um negatively charged S-polyethylene sulfone centrifugal filtration method, by three cutting filter layer in the spin column housing and Viton O ring seal, preparation of spin column. One 1mL plasma aliquot from the same four subjects used in the ultracentrifugation method was taken and diluted with 2X loading buffer (100 mM sodium phosphate, ph 6.8). The filter was conditioned by passing 18mL of equilibration buffer (50 mM sodium phosphate, 150mM NaCl, pH 6.8) at 500Xg for 5 minutes before applying the plasma sample. Subsequently, the plasma sample was passed through the filter at 200Xg for 2 minutes. The filter was washed at 200Xg with 18mL of washing buffer (50 mM sodium phosphate, 150mM NaCl, pH 6.8) for 2 minutes. Subsequently, the microvesicles were lysed with Qiazol. 1mL of Qiazol was applied to the membrane and dispensed at 100Xg for 1 minute. The filter was then incubated at room temperature for 10 minutes and eluted at 100xg for 2 minutes followed by 2 minutes for 2,000xg.
For ultracentrifugation and filtration samples, microvesicle RNA was isolated and the quality and concentration were evaluated as described in example 1. See fig. 4A. cDNA was synthesized as described in example 1.
To compare microvesicle RNA isolated by filtration and ultracentrifugation, RT-PCR was performed on mRNA and non-coding (including microrna) using primers and probes specific for GAPDH, RN7SL, rnaspep, miR-16, miR-150, and let-7a, as described in example 1. See fig. 4B.
Example 5 Pall Mustang Membrane in spin columns
Normal control plasma was obtained from bioreduction LLC as described in example 1.
Isolation of 4mL plasma microvesicles RNA was performed using ultracentrifugation or 0.8um Mustang Q (Pall) positively charged Q polyvinylsulfone centrifugation filtration using a home-made spin column apparatus.
Ultracentrifugation samples were prepared, pelleted and lysed as described in example 1.
In a 0.8um positively charged Q-polyethylene sulfone centrifugation filtration process, spin columns were prepared as described in example 4. One 1mL plasma aliquot from the same four subjects used in the ultracentrifugation method was taken, diluted with 5mL PBS, and mixed with 1mL 10X loading buffer (1M Tris, 1M NaCl, 0.1M MaCl) 2 pH 8). Prior to application of the plasma sample, the filter was passed through 18mL of equilibration buffer (0.1M Tris, 0.1M NaCl, 0.01M MaCl) at 500Xg 2 pH 8) 5 minutes. Subsequently, the plasma sample was passed through the filter at 200Xg for 2 minutes. The filters were washed at 200Xg with 18mL of washing buffer (0.1M Tris, 0.2M NaCl, 0.01M MgCl) 2 pH 8) for 2 minutes. Subsequently, the microvesicles were lysed with Qiazol. 1mL of Qiazol was applied to the membrane and dispensed at 100Xg for 1 second. The filter was then incubated at room temperature for 10 minutes and eluted at 100Xg for 2 minutes followed by 2 minutes for 2,000Xg.
For ultracentrifugation and filtration samples, microvesicle RNA was isolated and quality and concentration were evaluated as described in example 1. See fig. 5A. cDNA was synthesized as described in example 1.
To compare microvesicle RNA isolated by filtration and ultracentrifugation, RT-PCR was performed on mRNA and non-coding (including microrna) using primers and probes specific for GAPDH, RN7SL, rnaspep, miR-16, miR-150, and let-7a, as described in example 1. See fig. 5B.
Example 6 Pall Mustang Membrane Q or S in Syringe Filter
Normal control plasma was obtained from bioreduction LLC as described in example 1.
Isolation of 4mL plasma microvesicles RNA was performed using ultracentrifugation or filtration with a Mustang Q (Pall) 0.8um positively charged Q polyvinylsulfone syringe or filtration with a Mustang S (Pall) 0.8um negatively charged S polyvinylsulfone syringe.
Ultracentrifuged samples were prepared, pelleted and lysed as described in example 1.
In the 0.8um positively charged Q polyethylene sulfone syringe filtration method and 0.8um negatively charged S polyethylene sulfone syringe filtration method, two 1mL plasma aliquots from the same four subjects used in the ultracentrifugation method were combined and diluted with 5mL PBS and mixed with 1mL 10X loading buffer (Q: 200mM Tris, 100mM NaCl, pH 7.4S: 200mM phosphate, 100mM NaCl, pH 7.4). Before applying the plasma samples, the filters were conditioned by passing through a syringe with 20mL of the appropriate equilibration buffer (Q: 20mM Tris, 100mM NaCl, pH 7.4S: 20mM phosphate, 100mM NaCl, pH 7.4). Subsequently, the plasma sample was passed through the filter via a syringe. The filtrate was saved for further analysis. The filters were washed via syringe with 20mL of the appropriate wash buffer (Q: 20mM Tris, 100mM NaCl, pH 7.4S: 20mM phosphate, 100mM NaCl, pH 7.4). Subsequently, residual fluid was removed from the filter and the microvesicles were lysed with Qiazol. 700ul Qiazol was applied to the membrane and dispensed via syringe. The filter was then incubated at room temperature for 5 minutes and eluted via syringe.
Ultracentrifugation samples were prepared, pelleted and lysed as described in example 1.
For ultracentrifugation and filtration (filter and filtrate) samples, microvesicle RNA was isolated and evaluated for quality and concentration as described in example 1. cDNA was synthesized as described in example 1.
To compare microvesicle RNA isolated by filtration (filter and filtrate) and ultracentrifugation, RT-PCR was performed on mRNA and non-coding (including microrna) using primers and probes specific for GAPDH, RN7SL, rnaspep, miR-16, miR-150 and let-7a, as described in example 1. See fig. 6.
Example 7 negatively charged Nylon (Syringe Filter)
Normal control plasma was obtained from bioreduction LLC as described in example 1.
Isolation of 4mL plasma microvesicle RNA was performed using ultracentrifugation or 50nm negatively charged nylon syringe filtration (Sterlitech, kent, wa., USA).
Ultracentrifugation samples were prepared, pelleted and lysed as described in example 1.
In the 50nm negatively charged nylon syringe filtration method, one 1mL plasma aliquot from the same four subjects used in the ultracentrifugation method was taken. The plasma sample was passed through the filter via syringe. The filtrate was saved for further analysis. Filters were washed with 20mL PBS via syringe. Subsequently, the residual fluid was removed from the filter via syringe. For lysis, 700ul of Qiazol was applied to the membrane and dispensed via syringe. The filter was then incubated at room temperature for 20 seconds and eluted via syringe.
The filtrate was transferred to 5mL heterogeneous isomorphous polymer tubes (Beckman-Coulter, miami, fl., USA) containing 8 μ L RNase Plus (40U/μ L, promega, madison, wi., USA) RNase inhibitor and incubated for 5 minutes at room temperature. After incubation, the filtrate was diluted with 1mL PBS. The microvesicles were agglomerated and lysed as described in example 1.
For ultracentrifugation and filtration (filter and filtrate) samples, microvesicle RNA was isolated and quality and concentration were evaluated as described in example 1. See fig. 7A. cDNA was synthesized as described in example 1.
To compare microvesicle RNA isolated by filtration (filter and filtrate) and ultracentrifugation, RT-PCR was performed on mRNA and non-coding (including microrna) using primers and probes specific for GAPDH, RN7SL, rnaspep, miR-16, miR-150 and let-7a, as described in example 1. See fig. 7B.
Example 8 isolation of microvesicle RNA from urine samples
Normal control urine was obtained internally and filtered through a 0.8 μm mixed cellulose ester filter (Millipore) to remove cell debris. The filtered urine was stored at 4 ℃ until needed.
Isolation of 10mL of urine microvesicle RNA was performed using 100K centrifugal filter unit concentration (Millipore) or Fast Trap adenovirus purification and concentration kit (Millipore, billerica, ma., USA) 0.65um positively charged Q polyvinylsulfone vacuum filtration.
In 100K centrifugal filter unit concentration, 10mL urine was transferred to 100K centrifugal filter unit filtration and centrifuged at 4,500Xg for 5 minutes. The concentrated microvesicle sample was subsequently lysed in 700ul Qiazol.
In the 0.65um positively charged Q-polyethylene sulfone vacuum filtration method, 10mL of urine from the same subject used in the concentration of a 100K centrifugal filter unit was diluted with 8mL of PBS and mixed with 2mL of 10X binding buffer (Millipore). Filters were equilibrated, loaded with plasma samples, washed and lysed as described in example 1.
The filtrate samples were transferred to four 5mL heterogeneous isomorphous polymer tubes (Beckman-Coulter, miami, fl., USA) containing 8 μ L RNase Plus (40U/μ L, promega, madison, wi., USA) RNase inhibitor and incubated for 5 minutes at room temperature. The microvesicles were agglomerated and lysed as described in example 1.
For ultracentrifugation and filtration (filter and filtrate) samples, microvesicle RNA was isolated and quality and concentration were evaluated as described in example 1. See fig. 8A. cDNA was synthesized as described in example 1.
To compare the urinary microvesicle RNA isolated by filtration (filter and filtrate) and concentration in a 100K centrifugal filter unit, RT-PCR was performed on mRNA and non-coding (including microrna) using primers and probes specific for GAPDH, RN7SL, RNaseP, miR-16, miR-150 and let-7a, as described in example 1. See fig. 8B.
Example 9 surface Charge (S inhibition)
Normal control plasma was obtained from bioreclaimation LLC as described in example 1.
Separation of 4mL plasma microvesicle RNA was performed using ultracentrifugation or modified 3um positively charged Q regenerated cellulose centrifugation or modified 3um negatively charged S regenerated cellulose centrifugation.
Ultracentrifugation samples were prepared, pelleted and lysed as described in example 1.
In the 3um positively charged Q regenerated cellulose centrifugal filtration method and the 3um negatively charged S regenerated cellulose centrifugal filtration method, spin columns were each modified by removing 21 of 24 filter layers. One 1mL plasma aliquot from the same four subjects used in the ultracentrifugation method was taken.
For ultracentrifugation and filtration samples, microvesicle RNA was isolated and the quality and concentration were evaluated as described in example 1. Prior to cDNA synthesis, RNA was diluted 1. Three fifths of the total microvesicle RNA volume, 1, 10 RNA dilution and 1.
To determine whether there was any RT-PCR inhibition at the RNA level, dilutions of microvesicle RNA isolated by filtration and ultracentrifugation were compared. RT-PCR was performed on GAPDH. Amplification reactions were performed in 20ul volumes containing 2X Taqman gene expression premix (Applied Biosystems, foster City, ca., USA), 20X Taqman gene expression assay (Applied Biosystems, foster City, ca., USA), and 1. The amplification conditions were as described in example 1. See fig. 9.
Each 1. However, for 3um negatively charged S regenerated cellulose centrifugation, the average Ct value decreased with dilution, indicating RT-PCR inhibition at the RNA level.
It was observed that when the plasma sample was at a pH setting of less than or equal to 5.5 prior to loading, the filter tended to clog and the plasma would not rotate through the column.
Example 10 microvesicles are stable at acidic pH
Normal control plasma was obtained from bioreduction LLC as described in example 1.
Isolation of 1.9mL plasma microvesicles RNA was performed using centrifugation. The pellet was resuspended in duplicate in the following buffer:
50mM methylmalonic acid, 150mM NaCl, pH2.5
50mM methylmalonic acid, 150mM NaCl, pH3.5
50mM acetic acid, 150mM NaCl, pH4.5
10mM sodium phosphate, 2mM potassium phosphate, 2.7mM KCl, 137mM NaCl, pH7.4
Specifically, 16 1mL plasma aliquots from one subject were pooled. 1.9mL of the pooled plasma was transferred to eight 2.0mL Eppendorf tubes and a pellet was formed at 21,130xg for 30 minutes at 8 ℃. The microvesicle pellet was resuspended in 150ul of an appropriate buffer and incubated at room temperature for 20 minutes. The microvesicle pellet was then lysed in 700ul Qiazol reagent (Qiagen, valencia, ca., USA).
Microvesicle RNA was isolated and the quality and concentration were evaluated as described in example 1. See fig. 10A. cDNA was synthesized as described in example 1.
To determine the stability of plasma microvesicles at acidic pH, RT-PCR was performed on mRNA and non-coding RNAs (including micrornas), using primers and probes specific for GAPDH, RN7SL, rnaspep, miR-16, miR-150 and let-7a, as described in example 1. See fig. 10B.
Example 11 microvesicles are unstable at alkaline pH.
Normal control plasma was obtained from bioreduction LLC as described in example 1.
To determine the stability of plasma microvesicles at alkaline pH, the microvesicle pellet was resuspended in the following buffer:
50mM bis [ tris (hydroxymethyl) methylamino ] propane, 150mM NaCl, pH7
· 50mM Tris、150mM NaCl,pH8
50mM diethanolamine, 150mM NaCl, pH9
50mM ethanolamine, 150mM NaCl, pH10
Plasma microvesicle RNA isolation and analysis were performed as described in example 10. See fig. 11A and 11B.
Example 12 microvesicle capture and/or microvesicle stability on a charged membrane is influenced by buffer pH and/or buffer concentration and/or buffer type.
Normal control plasma was obtained from bioreduction LLC as described in example 1.
Isolation of 4.8mL plasma microvesicle RNA was performed using ultracentrifugation or 3um positively charged Q regenerated cellulose centrifugation filtration.
In the ultracentrifugation method, 1mL plasma aliquots from five subjects were pooled. 4.8mL of pooled plasma was transferred to 5mL heterogeneous isomorphous polymer tubes (Beckman-Coulter, miami, fl., USA) containing 8. Mu.L RNase Plus (40U/. Mu.l, promega, madison, wi., USA) and incubated for 5 minutes at room temperature. The microvesicles were agglomerated and lysed as described in example 1.
In the 3um positively charged Q regenerated cellulose centrifugation method, equilibration, loading and wash buffers were tested with different buffer types and pH. The following buffer settings were used:
100mM bis [ tris (hydroxymethyl) methylamino ] propane, 150mM NaCl, pH6.8 (2X loading buffer) and 50mM bis [ tris (hydroxymethyl) methylamino ] propane, 150mM NaCl, pH7 (equilibration and wash buffers),
100mM Tris, 150mM NaCl, pH8 (2X loading buffer) and 50mM Tris, 150mM NaCl, pH8 (equilibration and wash buffers), or
100mM diethanolamine, 150mM NaCl, pH9 (2X loading buffer) and 50mM diethanolamine, 150mM NaCl, pH9 (equilibration and wash buffers).
First, three 1mL plasma aliquots from the same five subjects used in the ultracentrifugation method were pooled. 4.8mL of pooled plasma was aliquoted into separate 50mL conical tubes for each buffer set and mixed with 4.8mL of the appropriate 2 Xloading buffer. The pH accuracy of each diluted plasma sample was evaluated. The filter was conditioned by passing 5mL of the appropriate equilibration buffer at 500Xg for 5 minutes before applying the plasma sample. Subsequently, the plasma sample was passed through the filter at 500Xg for 5 minutes. The filtrate was saved for further analysis. The filter was washed twice with 18mL of the appropriate wash buffer at 500xg for 5 minutes. Subsequently, the microvesicles were lysed with Qiazol. 1mL of Qiazol was applied to the membrane and dispensed by centrifugation at 100Xg for 1 second. The filter was then incubated at room temperature for 10 minutes and eluted at 500Xg for 5 minutes.
The filtrate samples were each prepared, pelleted and lysed as described in example 1.
For ultracentrifugation and filtration (filter and filtrate) samples, microvesicle RNA was isolated and evaluated for quality and concentration as described in example 1. See fig. 12A. cDNA was synthesized as described in example 1.
To determine the preferred pH for microvesicle RNA filtration, and to compare microvesicle RNA isolated by filtration (filter and filtrate) and ultracentrifugation, RT-PCR was performed on mRNA and non-coding (including microrna) using primers and probes specific for GAPDH, RN7SL, rnaspep, miR-16, miR-150 and let-7a, as described in example 1.
As shown in figure 12B, pH and/or buffer type had a significant effect on filtered samples for GAPDH, RN7SL, RNaseP, let-7a, and miR-150. A buffer setting of 100mM bis [ tris (hydroxymethyl) methylamino ] propane, 150mM NaCl, pH6.8 (2X loading buffer) and 50mM bis [ tris (hydroxymethyl) methylamino ] propane, 150mM NaCl, pH7 (equilibration and wash buffers) is preferred for the filter samples. pH and/or buffer type did not have a significant effect on the filtered samples for miR-16. In addition, RNA levels for GAPDH, RN7SL and RNaseP were similar for the filter and ultracentrifuge samples. In the ultracentrifuge samples, the average Ct values were 0.9Ct lower for let-7a and 0.7Ct higher for miR-150, compared to the preferred filter samples. In the ultracentrifuge samples, the average Ct value was 2.3Ct lower for miR-16 compared to the preferred filter samples. This is most likely due to differences in microrna packaging in microvesicles. Some micrornas are found in ribonucleoprotein complexes in plasma and are not necessarily captured by positively charged filtration.
Example 13 microvesicle capture and/or microvesicle stability on a charged filter is influenced by buffer pH and/or buffer concentration and/or buffer type.
Normal control plasma was obtained from bioreduction LLC as described in example 1.
Isolation of 3.8mL plasma microvesicle RNA was performed using ultracentrifugation or 3um positively charged Q regenerated cellulose centrifugation filtration.
In the ultracentrifugation method, 1mL plasma aliquots from four subjects were pooled. 3.8mL of pooled plasma was transferred to 5mL heterogeneous isomorphous polymer tubes (Beckman-Coulter, miami, fl., USA) containing 8. Mu.L RNase Plus (40U/μ L, promega, madison, wi., USA) and incubated for 5 minutes at room temperature. After incubation, plasma was diluted in 1.2mL PBS. The microvesicles were agglomerated and lysed as described in example 1.
In the 3um positively charged Q regenerated cellulose centrifugation method, equilibration, loading and wash buffers were tested with different buffer types and pH. The following buffer settings were used:
100mM bis [ tris (hydroxymethyl) methylamino ] propane, 150mM NaCl, pH6 (2X loading buffer) and 50mM bis [ tris (hydroxymethyl) methylamino ] propane, 150mM NaCl, pH6.5 (equilibration and wash buffers)
100mM bis [ tris (hydroxymethyl) methylamino ] propane, 150mM NaCl, pH6.8 (2X loading buffer) and 50mM bis [ tris (hydroxymethyl) methylamino ] propane, 150mM NaCl, pH7 (equilibration and wash buffers)
100mM triethanolamine, 150mM NaCl, pH6.5 (2X loading buffer) and 50mM triethanolamine, 150mM NaCl, pH7.0 (equilibration and wash buffers)
100mM bis [ tris (hydroxymethyl) methylamino ] propane, 150mM NaCl, pH7.4 (2X loading buffer) and 50mM bis [ tris (hydroxymethyl) methylamino ] propane, 150mM NaCl, pH7.5 (equilibration and wash buffers)
100mM Tris, 150mM NaCl, pH7.4 (2X loading buffer) and 50mM Tris, 150mM NaCl, pH7.5 (equilibration and wash buffers)
100mM bis [ tris (hydroxymethyl) methylamino ] propane, 150mM NaCl, pH8 (2X loading buffer) and 50mM bis [ tris (hydroxymethyl) methylamino ] propane, 150mM NaCl, pH8 (equilibration and wash buffer)
100mM Tris, 150mM NaCl, pH8 (2 XLoading buffer) and 50mM Tris, 150mM NaCl, pH8 (equilibration and wash buffers)
100mM Tris, 150mM NaCl, pH8.5 (2X loading buffer) and 50mM Tris, 150mM NaCl, pH8.5 (equilibration and wash buffers)
First, eight 1mL plasma aliquots from the same four subjects used in the ultracentrifugation method were pooled. 3.8mL of pooled plasma was aliquoted into separate 50mL conical tubes for each buffer set and mixed with 3.8mL of the appropriate 2 Xloading buffer. The pH of each diluted plasma sample was evaluated for accuracy. The filter was conditioned by passing 5mL of the appropriate equilibration buffer at 500Xg for 5 minutes before applying the plasma sample. Subsequently, the plasma samples were passed through the filter at 500Xg for 5 minutes. The filter was washed twice with 18mL of the appropriate wash buffer at 500xg for 5 minutes. Subsequently, the microvesicles were lysed with Qiazol. 1mL of Qiazol was applied to the membrane and dispensed by centrifugation at 100Xg for 1 second. The filter was then incubated at room temperature for 10 minutes and eluted at 500Xg for 5 minutes.
For ultracentrifugation and filtration samples, microvesicle RNA was isolated and quality and concentration were evaluated as described in example 1. See fig. 13A. The cDNA was synthesized as described in example 1.
To determine the preferred pH and buffer type for microvesicle RNA filtration, and to compare microvesicle RNA isolated by filtration and ultracentrifugation, RT-PCR was performed on mRNA and non-coding (including microrna) using primers and probes specific for GAPDH, RN7SL, RNaseP, miR-16, miR-150 and let-7a, as described in example 1. See fig. 13B.
The following buffer settings are preferred: 100mM bis [ tris (hydroxymethyl) methylamino ] propane, 150mM NaCl, pH6 (2X loading buffer) and 50mM bis [ tris (hydroxymethyl) methylamino ] propane, 150mM NaCl, pH6.5 (equilibration and wash buffers); and 100mM bis [ tris (hydroxymethyl) methylamino ] propane, 150mM NaCl, pH6.8 (2X loading buffer) and 50mM bis [ tris (hydroxymethyl) methylamino ] propane, 150mM NaCl, pH7 (equilibration and wash buffers).
Example 14 microvesicle capture and/or microvesicle stability on a charged filter is affected by buffer pH and buffer concentration.
Normal control plasma was obtained from bioreduction LLC as described in example 1.
Isolation of 3.8mL plasma microvesicle RNA was performed using ultracentrifugation or 3um positively charged Q regenerated cellulose centrifugation filtration.
Ultracentrifugation samples were prepared, pelleted and lysed as described in example 13.
In the 3um positively charged Q regenerated cellulose centrifugation method, equilibration, loading and wash buffers were tested with different buffer types and pH. The following buffer settings were used:
117mM Bis Tris, 150mM NaCl, pH1.9 (2X loading buffer) and 58.5mM Bis Tris, 150mM NaCl, pH6 (equilibration and wash buffers)
117mM Bis Tris, 150mM NaCl, pH6.1 (2X loading buffer) and 58.5mM Bis Tris, 150mM NaCl, pH6.5 (equilibration and wash buffers)
100mM bis [ tris (hydroxymethyl) methylamino ] propane, 150mM NaCl, pH6 (2X loading buffer) and 50mM bis [ tris (hydroxymethyl) methylamino ] propane, 150mM NaCl, pH6.5 (equilibration and wash buffers)
100mM bis [ tris (hydroxymethyl) methylamino ] propane, 150mM NaCl, pH6.8 (2X loading buffer) and 50mM bis [ tris (hydroxymethyl) methylamino ] propane, 150mM NaCl, pH7 (equilibration and wash buffers)
100mM bis [ tris (hydroxymethyl) methylamino ] propane, 150mM NaCl, pH7.4 (2X loading buffer) and 50mM bis [ tris (hydroxymethyl) methylamino ] propane, 150mM NaCl, pH7.5 (equilibration and wash buffers)
200mM Tris, 150mM NaCl, pH7.5 (2X loading buffer) and 100mM Tris, 150mM NaCl, pH7.5 (equilibration and wash buffers)
First, six 1mL plasma aliquots from the same four subjects used in the ultracentrifugation method were pooled. 3.8mL of pooled plasma was aliquoted into separate 50mL conical tubes for each buffer set up and mixed with 3.8mL of the appropriate 2 XLoading buffer. The pH accuracy of each diluted plasma sample was evaluated. Filters were equilibrated, loaded with plasma samples, washed and lysed as described in example 13.
For ultracentrifugation and filtration samples, microvesicle RNA was isolated and the quality and concentration were evaluated as described in example 1. See fig. 14A. cDNA was synthesized as described in example 1.
To determine the preferred pH and buffer type for microvesicle RNA filtration, and to compare microvesicle RNA isolated by filtration and ultracentrifugation, RT-PCR was performed on mRNA and non-coding (including microrna) using primers and probes specific for GAPDH, RN7SL, RNaseP, miR-16, miR-150 and let-7a, as described in example 1. See fig. 14B.
The following buffer settings are preferred: 100mM bis [ tris (hydroxymethyl) methylamino ] propane, 150mM NaCl, pH6 (2X loading buffer) and 50mM bis [ tris (hydroxymethyl) methylamino ] propane, 150mM NaCl, pH6.5 (equilibration and wash buffers); and 100mM bis [ tris (hydroxymethyl) methylamino ] propane, 150mM NaCl, pH6.8 (2 XLoading buffer) and 50mM bis [ tris (hydroxymethyl) methylamino ] propane, 150mM NaCl, pH7 (equilibration and wash buffers).
Example 15 microvesicle capture and microvesicle stability on a charged filter were affected by the concentration of the buffer.
Normal control plasma was obtained from bioreduction LLC as described in example 1.
Isolation of 3.8mL plasma microvesicle RNA was performed using ultracentrifugation or 3um positively charged Q regenerated cellulose centrifugation filtration.
Ultracentrifugation samples were prepared, pelleted and lysed as described in example 13.
In the 3um positively charged Q regenerated cellulose centrifugal filtration method, equilibration, loading and washing buffers were tested with different buffer concentrations. The following buffer settings were used:
100mM bis [ tris (hydroxymethyl) methylamino ] propane, 0.15mM NaCl, pH6 (2X Loading buffer) and 50mM bis [ tris (hydroxymethyl) methylamino ] propane, 0.15mM NaCl, pH6.5 (equilibration and wash buffers)
500mM bis [ tris (hydroxymethyl) methylamino ] propane, 900mM NaCl, pH6.4 (2X loading buffer) and 250mM bis [ tris (hydroxymethyl) methylamino ] propane, 450mM NaCl, pH6.5 (equilibration and wash buffers)
First, two 1mL plasma aliquots from the same four subjects used in the ultracentrifugation method were pooled. 3.8mL of pooled plasma was aliquoted into separate 50mL conical tubes for each buffer set and mixed with 3.8mL of the appropriate 2 Xloading buffer. The pH accuracy of each diluted plasma sample was evaluated. Filters were equilibrated, loaded with plasma samples, washed and lysed as described in example 13.
For ultracentrifugation and filtration samples, microvesicle RNA was isolated and quality and concentration were evaluated as described in example 1. See fig. 15A. The cDNA was synthesized as described in example 1.
To determine the preferred buffer concentration for microvesicle RNA filtration, and to compare microvesicle RNA isolated by filtration and ultracentrifugation, RT-PCR was performed on mRNA and non-coding (including microrna) using primers and probes specific for GAPDH, RN7SL, rnaspep, miR-16, miR-150, and let-7a, as described in example 1. See fig. 15B.
Example 16 microvesicles were stable and overall RNA yield was not affected by low to high salt concentrations.
Normal control plasma was obtained from bioreduction LLC as described in example 1.
To determine the stability of plasma microvesicles in NaCl, the microvesicle pellet was resuspended in duplicate in 50mM bis [ tris (hydroxymethyl) methylamino ] propane, ph6.5 buffer, with the following NaCl concentration:
• 0.15M NaCl
• 0.3M NaCl
• 0.6M NaCl
• 1.2M NaCl
• 2.4M NaCl。
specifically, 201 mL plasma aliquots from one subject were pooled, and 1.9mL pooled plasma was transferred to ten 2.0mL Eppendorf tubes. Plasma microvesicles were pelleted, resuspended and lysed as described in example 10.
Microvesicle RNA was isolated and the quality and concentration were evaluated as described in example 1. See fig. 16A. cDNA was synthesized as described in example 1.
To determine the stability of plasma microvesicles at different salt concentrations, RT-PCR was performed on mRNA and non-coding (including microrna) using primers and probes specific for GAPDH, HPRT1, RN7SL, RNaseP, miR-16 and let-7 a. For GAPDH, rnaspep, and HPRT1, amplification reactions were performed in 20ul volumes containing 2X Taqman gene expression premix (Applied Biosystems, foster City, ca., USA), 20X Taqman gene expression assay (Applied Biosystems, foster City, ca., USA), and 1. For RN7SL, the amplification reaction was performed in a 20ul volume containing 2X Taqman gene expression premix, 900nM RN7SL forward CAAAACTCCCGTGCTGATCA (SEQ ID NO 1), 900nM RN7SL reverse GGCTGGAGTGCAGTGGCTAT (SEQ ID NO 2), 250nM RN7SL probe TGGGATCGCGCCTGT (SEQ ID NO 3), and fraction 1. For miR-16 and let-7a, the amplification reaction was performed in a 20ul volume containing 2 XTaqman Universal PCR premix, 20 XTaqman MicroRNA assay (Applied Biosystems, foster City, ca., USA), and 1. The amplification conditions were performed as described in example 1. See fig. 16B.
Example 17 microvesicle capture and microvesicle stability on a charged filter are not affected by the salt concentration of the loading buffer.
Normal control plasma was obtained from bioreduction LLC as described in example 1.
Isolation of 3.8mL plasma microvesicle RNA was performed using ultracentrifugation or 3um positively charged Q regenerated cellulose centrifugation filtration.
Ultracentrifugation samples were prepared, pelleted and lysed as described in example 13.
In the 3um positively charged Q regenerated cellulose centrifugal filtration method, the balance and loading buffer with different salt concentration test. The following buffer settings were used:
100mM bis [ tris (hydroxymethyl) methylamino ] propane, 0.15M NaCl, pH6.0 (2X Loading buffer) and 50mM bis [ tris (hydroxymethyl) methylamino ] propane, 0.15M NaCl, pH6.5 (equilibration buffer)
100mM bis [ tris (hydroxymethyl) methylamino ] propane, 1.05M NaCl, pH6.0 (2X loading buffer) and 50mM bis [ tris (hydroxymethyl) methylamino ] propane, 0.6M NaCl, pH6.5 (equilibration buffer)
100mM bis [ tris (hydroxymethyl) methylamino ] propane, 2.25M NaCl, pH6.0 (2X loading buffer) and 50mM bis [ tris (hydroxymethyl) methylamino ] propane, 1.2M NaCl, pH6.5 (equilibration buffer)
100mM bis [ tris (hydroxymethyl) methylamino ] propane, 4.65M NaCl, pH6.0 (2X loading buffer) and 50mM bis [ tris (hydroxymethyl) methylamino ] propane, 2.4M NaCl, pH6.5 (equilibration buffer)
First, four 1mL plasma aliquots from the same four subjects used in the ultracentrifugation method were pooled. 3.8mL of pooled plasma was aliquoted into separate 50mL conical tubes for each buffer set and mixed with 3.8mL of the appropriate 2 Xloading buffer. The filter was conditioned by passing 5mL of the appropriate equilibration buffer at 100xg for 5 minutes before applying the plasma sample. Subsequently, the plasma sample was passed through the filter at 100Xg for 5 minutes. The filtrate was saved for further analysis. Without washing, microvesicles were lysed with Qiazol. 1mL of Qiazol was applied to the membrane and dispensed by centrifugation at 100Xg for 1 second. The filter was then incubated at room temperature for 10 minutes and eluted at 200Xg for 2 minutes followed by 5000Xg for 2 minutes.
3.8mL plasma filtrate samples were each transferred to two 5mL heteroisomorphous polymer tubes (Beckman-Coulter, miami, fl., USA) containing 8 μ L RNase Plus (40U/μ L, promega, madison, wi., USA) and incubated for 5 minutes at room temperature. After incubation, each filtrate aliquot was diluted in 1.2mL PBS. The microvesicles were agglomerated and lysed as described in example 1.
For ultracentrifugation and filtration samples, microvesicle RNA was isolated and quality and concentration were evaluated as described in example 1. See fig. 17A. cDNA was synthesized as described in example 1.
To determine the preferred salt concentration for loading plasma samples in the filtration method, and to compare microvesicle RNA isolated by filtration (filter and filtrate) and ultracentrifugation, RT-PCR was performed on mRNA and non-coding (including microrna) using primers and probes specific for GAPDH, HPRT1, RN7SL, BRAF, miR-16 and let-7 a. For GAPDH and HPRT1, amplification reactions were performed in 20ul volumes containing 2X Taqman gene expression premix (Applied Biosystems, foster City, ca., USA), 20X Taqman gene expression assay (Applied Biosystems, foster City, ca., USA), and 120 fractions of cDNA reverse transcribed with the SuperScript VILO cDNA synthesis kit. For RN7SL, the amplification reaction was performed in a 20ul volume containing 2X Taqman gene expression premix, 900nM RN7SL forward CAAAACTCCCGTGCTGATCA (SEQ ID NO 1), 900nM RN7SL reverse GGCTGGAGTGCAGTGGCTAT (SEQ ID NO 2), 250nM RN7SL probe TGGGATCGCGCCTGT (SEQ ID NO 3), and fraction 1. For BRAF, the amplification reaction was performed in a 20ul volume containing 2X Taqman gene expression premix, 900nM BRAF WT forward AAAAATAGGTGATTTTGGTCTAGCTACAGT (SEQ ID NO 4), 900nM BRAF JS eh15 reverse TGGATCCAGACAACTGTTCAA (SEQ ID NO 6), 250nM BRAF AZ e15 probe GATGGAGTGGGTCCCATCAG (SEQ ID NO 7), and 1. For miR-16 and let-7a, the amplification reaction was performed in a 20ul volume containing 2 XTaqman Universal PCR premix, 20 XTaqman MicroRNA assay (Applied Biosystems, foster City, ca., USA), and 1. The amplification conditions were performed as described in example 1. See fig. 17B.
Example 18 microvesicle capture and microvesicle stability on a charged filter are not affected by the salt concentration of the loading or washing buffer.
Normal control plasma was obtained from bioreduction LLC as described in example 1.
Isolation of 3.8mL plasma microvesicle RNA was performed using ultracentrifugation or 3um positively charged Q regenerated cellulose centrifugation filtration.
Ultracentrifugation samples were prepared, pelleted and lysed as described in example 13.
In the 3um positively charged regenerated cellulose centrifugation filtration method, equilibration and loading buffers were tested with different salt concentrations. The following buffer settings were used:
100mM bis [ tris (hydroxymethyl) methylamino ] propane, 0.15mM NaCl, pH6 (2X Loading buffer) and 50mM bis [ tris (hydroxymethyl) methylamino ] propane, 0.15mM NaCl, pH6.5 (equilibration and wash buffers)
100mM bis [ tris (hydroxymethyl) methylamino ] propane, 1.05M NaCl, pH6 (2X loading buffer) and 50mM bis [ tris (hydroxymethyl) methylamino ] propane, 0.6M NaCl, pH6.5 (equilibration and wash buffers)
100mM bis [ tris (hydroxymethyl) methylamino ] propane, 2.25M NaCl, pH6 (2X loading buffer) and 50mM bis [ tris (hydroxymethyl) methylamino ] propane, 1.2M NaCl, pH6.5 (equilibration and wash buffers)
100mM bis [ tris (hydroxymethyl) methylamino ] propane, 4.65M NaCl, pH6 (2 XLoading buffer) and 50mM bis [ tris (hydroxymethyl) methylamino ] propane, 2.4M NaCl, pH6.5 (equilibration and wash buffers)
First, four 1mL plasma aliquots from the same four subjects used in the ultracentrifugation method were pooled. 3.8mL of pooled plasma was aliquoted into separate 50mL conical tubes for each buffer set and mixed with 3.8mL of the appropriate 2 Xloading buffer. The filter was conditioned by passing 5mL of the appropriate equilibration buffer at 100xg for 5 minutes before applying the plasma sample. Subsequently, the plasma sample was passed through the filter at 100Xg for 5 minutes. The filtrate was saved for further analysis. The filter was washed with 18mL of the appropriate wash buffer at 100Xg for 5 minutes. Subsequently, the microvesicles were lysed with Qiazol. 1mL of Qiazol was applied to the membrane and dispensed by centrifugation at 100Xg for 1 second. The filter was then incubated at room temperature for 10 minutes and eluted at 200Xg for 2 minutes followed by 5000Xg for 2 minutes.
For ultracentrifugation and filtration samples, microvesicle RNA was isolated and quality and concentration were evaluated as described in example 1. See fig. 18A. The cDNA was synthesized as described in example 1.
To determine the preferred salt concentration for washing plasma samples in the filtration method, and to compare microvesicle RNA isolated by filtration and ultracentrifugation, RT-PCR was performed on mRNA and non-coding (including microrna) using primers and probes specific for GAPDH, RN7SL, HPRT1, BRAF, miR-16 and let-7a, as described in example 17. See fig. 18B.
Example 19 RNA lysis buffer Effect on RNA yield from microvesicles isolated with a charged Filter
Normal control plasma was obtained from bioreduction LLC as described in example 1.
Isolation of 4mL plasma microvesicle RNA was performed using ultracentrifugation or Fast Trap adenovirus purification and concentration kit (Millipore, billerica, ma., USA) 0.65um positively charged Q-polyvinylsulfone vacuum filtration. Microvesicle RNA was cleaved with Qiazol (Qiagen) or Promega cleavage reagent (Promega) in the 0.65um positively charged Q-polyethylene sulfone vacuum filtration procedure.
Ultracentrifugation samples were prepared, pelleted and lysed as described in example 1.
4mL of plasma for 0.65um positively charged Q polyvinylsulfone vacuum filtration lysed by Qiazol (Qiagen) was prepared and the filter equilibrated, loaded with plasma sample, washed and lysed as described in example 1.
Microvesicle RNA was isolated for ultracentrifugation and vacuum filtration of 0.65um positively charged Q polyvinylsulfone samples lysed by Qiazol as described in example 1.
Positively charged Q polyethylene 0.65um after cleavage with Promega cleavage reagent (Promega)In the ene sulfone vacuum filtration method, one 1mL plasma aliquot from the same four subjects used in the ultracentrifugation method was combined and mixed with 4ml of 2X loading buffer (20mM tris, ph 7). The filters were conditioned by passing 25mL of equilibration buffer (Millipore) via vacuum prior to application of the plasma sample. Subsequently, the plasma sample was passed through the filter via vacuum. The filters were washed with 20mL of washing buffer (10mM Tris, pH7) via vacuum. Subsequently, the microvesicles were lysed with Promega lysis reagent. 2.25mL of Promega lysis reagent was applied to the membrane and dispensed through the filter by drawing approximately 5 drops of Promega lysis reagent via vacuum. The filter was then incubated at room temperature for 5 minutes and eluted via vacuum. To isolate the microvesicle RNA, 0.27 volume of 100% isopropanol was added to the lysate, mixed by pipette, transferred to spin column, and centrifuged at 13,000xg for 30 seconds until all lysate was applied. The column was then washed twice with 500ul of RNA wash solution (Promega) at 13,000xg for 30 seconds. The last 300ul RNA wash solution was applied to the column at 13,000xg for 2 minutes. To dry the membrane, the column was centrifuged at 13,000xg for 2 minutes. The RNA was applied to 20ul H 2 O was eluted into a 1.5mL Eppendorf tube and incubated at room temperature for 1 min and centrifuged at 10,000xg for 1 min.
For all microvesicle RNA samples, the quality and concentration were evaluated, as described in example 1. cDNA was synthesized as described in example 1.
To determine the preferred lysis buffer for microvesicle RNA filtration, and to compare microvesicle RNA isolated by filtration and ultracentrifugation, RT-PCR was performed on mRNA and non-coding (including microrna) using primers and probes specific for GAPDH, RN7SL, rnaspep, miR-16, miR-150 and let-7a, as described in example 1. See fig. 19.
Example 20 Qiazol of the second volume did not significantly improve RNA yield when microvesicles were isolated on a charged filter.
Normal control plasma was obtained from bioreclaimation LLC as described in example 1.
Isolation of 4mL plasma microvesicle RNA was performed using ultracentrifugation or Fast Trap adenovirus purification and concentration kit (Millipore, billerica, ma., USA) 0.65um positively charged Q-polyvinylsulfone vacuum filtration.
Ultracentrifuged samples were prepared, pelleted and lysed as described in example 1.
4mL of plasma was prepared for 0.65um positively charged Q-polyvinylsulfone vacuum filtration and the filters were equilibrated, loaded with plasma samples and washed as described in example 1. Filter microvesicles were lysed with Qiazol. 2.25mL of Qiazol was applied to the membrane and dispensed through the filter by drawing approximately 5 drops of Qiazol through the vacuum. The filter was then incubated at room temperature for 5 minutes and eluted via vacuum. The lysis was repeated with another 2.25mL Qiazol. Two lysates were separately isolated for microvesicle RNA.
For ultracentrifugation and filtration samples, microvesicle RNA was isolated and quality and concentration were evaluated as described in example 1. See fig. 20A. cDNA was synthesized as described in example 1.
To determine the preferred and required number of lysis buffer volumes for microvesicle RNA filtration, and to compare microvesicle RNA isolated by filtration and ultracentrifugation, RT-PCR was performed on mRNA and non-coding (including microrna) using primers and probes specific for GAPDH, RN7SL, rnaspep, miR-16, miR-150 and let-7a, as described in example 1. See fig. 20B.
Example 21 Qiazol of the second volume did not significantly improve RNA yield when microvesicles were isolated on a charged filter.
Normal control plasma was obtained from bioreduction LLC as described in example 1.
Isolation of 4mL plasma microvesicle RNA was performed using ultracentrifugation or 3um positively charged Q regenerated cellulose centrifugation filtration.
Ultracentrifugation samples were prepared, pelleted and lysed as described in example 1.
4mL of plasma for 3um positively charged Q regenerated cellulose centrifugal filtration was prepared and the filter was equilibrated, loaded with plasma samples and washed as described in example 1. Filter microvesicles were lysed with Qiazol. 1mL of Qiazol was applied to the membrane and dispensed at 100Xg for 1 second. The filter was then incubated at room temperature for 10 minutes and eluted at 500Xg for 5 minutes. Lysis was repeated with another 1mL Qiazol. Two lysates were separately isolated for microvesicle RNA.
For ultracentrifugation and filtration samples, microvesicle RNA was isolated and quality and concentration were evaluated as described in example 1. See fig. 21A. cDNA was synthesized as described in example 1.
To determine the preferred and required number of lysis buffer volumes for microvesicle RNA filtration, and to compare microvesicle RNA isolated by filtration and ultracentrifugation, RT-PCR was performed on mRNA and non-coding (including microrna) using primers and probes specific for GAPDH, RN7SL, rnaspep, miR-16, miR-150 and let-7a, as described in example 1. See fig. 21B.
Example 22 isolation of microvesicle RNA Using a 20nm PES neutral Syringe Filter
Normal control plasma was obtained internally as described in example 1.
Isolation of 4mL plasma microvesicle RNA was performed using ultracentrifugation or ExoMir kit (bio Scientific, austin, tx., USA) 20nm neutral polyethylene sulfone syringe filtration.
In the ultracentrifugation method, 4mL plasma aliquots from the same subjects were transferred to 5mL heteroisomorphous polymer tubes (Beckman-Coulter, miami, fl., USA) containing 8 μ L rnase inhibitor (40U/μ L, promega, madison, wi., USA) and incubated at room temperature for 5 minutes. After incubation, plasma was diluted with 1mL PBS. The microvesicles were agglomerated and lysed as described in example 1.
In the 20nm neutral polyethylene sulfone syringe filtration method, 4mL from the same subjects used in the ultracentrifugation method were treated with 200ul proteinase K (> 600 mAU/mL, qiagen) for 15 minutes at room temperature. After incubation, the plasma was passed through a stack of filters (0.8 um neutral mixed cellulose ester filter (Millipore) + 20nm neutral polyvinyl sulfone filter (bio Scientific) via syringe, which was washed with 20mL PBS via syringe, then the 0.8um neutral mixed cellulose ester filter was discarded and residual fluid was removed from the 20nm neutral polyvinyl sulfone filter via syringe only for lysis, 700ul Qiazol was applied to the filter via syringe and dispensed, then the filter was incubated at room temperature for 20 seconds and eluted through syringe.
For ultracentrifugation and filtration samples, microvesicle RNA was isolated and quality and concentration were evaluated as described in example 1. See fig. 22A. Six-seventeen of the total microvesicle RNA volume was converted to cDNA using the SuperScript VILO cDNA synthesis kit (Invitrogen, carlsbad, ca., USA) according to the manufacturer's protocol.
To compare microvesicle RNA isolated by filtration and ultracentrifugation, RT-PCR was performed on mRNA and noncoding using primers and probes specific for GAPDH, RN7SL, 18S, BRAF, HERV K and PO. For GAPDH, 18S and PO, amplification reactions were performed in 20ul volumes containing 2X Taqman gene expression premix (Applied Biosystems, foster City, ca., USA), 20X Taqman gene expression assay (Applied Biosystems, foster City, ca., USA), and 1. For RN7SL, the amplification reaction was performed in a 20ul volume containing 2X Taqman gene expression premix, 900nM RN7SL forward CAAAACTCCCGTGCTGATCA (SEQ ID NO 1), 900nM RN7SL reverse GGCTGGAGTGCAGTGGCTAT (SEQ ID NO 2), 250nM RN7SL probe TGGGATCGCGCCTGT (SEQ ID NO 3), and 1. For BRAF, the amplification reaction was performed in a 20ul volume containing 2X Taqman gene expression premix, 900nM BRAF WT forward AAAAATAGGTGATTTTGGTCTAGCTACAGT (SEQ ID NO 4), 900nM BRAF JS eh15 reverse TGGATCCAGACAACTGTTCAA (SEQ ID NO 6), 250nM BRAF AZ eh15 probe GATGGAGTGGGTCCCATCAG (SEQ ID NO 7), and 1. For HERV K, amplification reactions were performed in 20ul volumes containing 2X Taqman gene expression premix, 900nM HERV K forward ACCCAACAGCTCCGAAGAGA (SEQ ID NO 8), 900nM HERV K reverse CCCCACATTTCCCCCTTT (SEQ ID NO 9), HERV K probe CGACCATCGAGAACAG (SEQ ID NO 10), and 1. The amplification conditions were as described in example 1. See fig. 22B.
Example 23 isolation of microvesicle RNA Using a 20nm PES neutral Syringe Filter
Normal control plasma was obtained from bioreduction LLC as described in example 1.
Isolation of 4mL plasma microvesicle RNA was performed using ultracentrifugation or 20nm neutral polyethylene sulfone syringe filtration (Tisch, north band, oh., USA).
Ultracentrifugation samples were prepared, pelleted and lysed as described in example 1.
In the 20nm neutral polyethylene sulfone syringe filtration method, one 1mL plasma aliquot from the same four subjects used in the ultracentrifugation method was combined and passed through the filter via syringe. The filter was washed with 20mL PBS via syringe. Subsequently, the residual fluid was removed via a syringe. For lysis, 700ul Qiazol was applied to the filter via syringe and dispensed. The filter was then incubated at room temperature for 20 seconds and eluted by syringe.
For ultracentrifugation and filtration samples, microvesicle RNA was isolated and the quality and concentration were evaluated as described in example 1. See fig. 23A. cDNA was synthesized as described in example 22.
To compare microvesicle RNA isolated by filtration and ultracentrifugation, RT-PCR was performed on mRNA and noncoding using primers and probes specific for GAPDH, RN7SL and rnaspep. For GAPDH and rnaspep, amplification reactions were performed in 20ul volumes containing 2X Taqman gene expression premix (Applied Biosystems, foster City, ca., USA), 20X Taqman gene expression assay (Applied Biosystems, foster City, ca., USA), and 1. For RN7SL, the amplification reaction was performed in a 20ul volume containing 2X Taqman gene expression premix, 900nM RN7SL forward (SEQ ID NO 1), 900nM RN7SL reverse (SEQ ID NO 2), 250nM RN7SL probe (SEQ ID NO 3), and 1. The amplification conditions were as described in example 1. See fig. 23B.
Example 24 isolation of microvesicle miRNA using 20nm PES neutral Syringe Filter (Tisch)
Microvesicle mirnas can be isolated using a 20nm PES neutral syringe filter (Tisch). See fig. 24.
Example 25 Effect of RNA on microvesicle Capture
Microvesicle capture is RNA-dependent. Some RNAs were more efficiently captured on the filter than others (GAPDH vs miR-451). This may depend on whether the RNA is protected by proteins and/or microvesicles and on the size of the microvesicles. See fig. 25.
Example 26 microvesicle RNA isolation Using a neutral Filter
Microvesicle RNA can be isolated using 30nm and 50nm PES neutral syringe filters. See fig. 26.
Microvesicle RNA can be isolated using a 0.2um PES neutral filter (Pall) in spin column format. See fig. 27.
Microvesicle RNA can be isolated using a 0.8um PES neutral syringe filter. See fig. 28.
Microvesicle RNA can be isolated using a 0.8um PES neutral filter (Pall) in spin column format. See fig. 29.
When microvesicles are isolated on a neutral PES filter, the microvesicle RNA yield is affected by the lysis buffer type. See fig. 30.
In microvesicle RNA isolation on 20nm PES neutral syringe filters, additional elution with Qiazol did not significantly improve RNA yield. See fig. 31.
When microvesicles are isolated on a neutral filter, microvesicle stability and/or microvesicle RNA yield is affected by the washing step. See fig. 32.
RNA was bound to a 20nm PES filter in the form of a syringe and could not be easily eluted. Larger RNAs (e.g., GAPDH) are more difficult to elute than smaller RNAs (let-7 a). See fig. 33.
Example 27 microvesicle RNA isolation Using beads
The studies provided herein demonstrate the feasibility of using charged or neutral (magnetic) beads for isolating microvesicle RNA. These studies confirmed affinity capture by beads under a variety of different conditions of charge or functional groups, binding and washing buffers, bead loading/concentrations, and/or incubation times. A general flow chart for microvesicle isolation and RNA extraction with beads is shown in fig. 34.
Screening of different types of magnetic beads: the following four types of magnetic beads were evaluated in the study described herein:

the microvesicle separation and recovery obtained using each of these types of beads is shown in fig. 35 and 36. The results show that amine (JAM) -functionalized and Carboxyl (CMX) -functionalized beads similarly capture microvesicles in most targets, as assessed by RT-qPCR.
Microvesicle RNA isolation using quaternary amine beads: the epoxy beads were treated with imidazole to generate imidazolium cations or TEA to generate positively charged quaternary amines, where it was expected that these positively charged amines could capture microvesicles more efficiently than 1 ° or 2 ° amines. An overview of the methods used in this study is presented in fig. 37. The following types of amine magnetic beads were evaluated:

microvesicle capture was assessed using RT-qPCR. In short, the following steps are performed: lysis of the capture microvesicles and extraction of total RNA by the Qiazole method; total RNA purification using Qiagen miRNeasy kit/MinElute column (20 uL); RNA profile examined on a Bioanalyzer (1 uL); RT reactions using VILO RT kit (12 uL) and Micro RT kit (4 uL); real-time PCR using 2uL cDNA for the following targets: VILO products (GAPDH (New assay kit), RN7SL, RNaseP, B2M, GUSB, HPRT 1) and Micro RT products (miR 16, miR150, let-7 a). The microvesicle isolation results tested using the selected mRNA target are shown in fig. 38, and the recovery of the selected mRNA target from the isolated microvesicles is shown in fig. 39. The microvesicle isolation results tested using the selected microrna target are shown in fig. 40, and the recovery of the selected microrna target from the isolated microvesicles is shown in fig. 41.
Reproducibility study: the reproducibility of microvesicle separation using TEA-treated beads was evaluated in the study described herein. Briefly, triplicate microvesicle separations were performed with TEA beads, 0.4 mL plasma pool BH11, qiiazole lysis and total RNA extraction (miRNeasy kit). The results are summarized in the following table:
data summarization: isolation of microvesicles in triplicate with TEA beads

Preliminary results show that TEA beads appear to be 1 to 2 times better than imidazole beads in microvesicle separation. RT-qPCR results show a gene-dependent pattern in microvesicle RNA distribution between supernatant and bead extraction:
GAPDH and RN7SL: distribution close to 1:1
RNaseP 2.1-2.8X in beads > in supernatant
B2M 6.6-7.3X in beads > in supernatant
miR16: 3.3-6.5X in beads > in supernatant
Let-7a: 4.6-7.1X in beads > in supernatant
GUSB 2-3X in supernatant > in beads
HPRT1: 3X in supernatant > in beads
miR150: 3-4X in supernatant > in beads
Without intending to be bound by theory, the data suggest that there may be classes of microvesicles that are loaded with different surface (membrane) characteristics, such as charge, polarity, etc. In addition to its membrane properties, each type of microvesicle may also carry a different RNA expression pattern.
Confirmation of microvesicle isolation using other beads: the studies described herein were designed to demonstrate microvesicle separation using other quaternary amine or sulfonate functionalized non-magnetic ion exchange beads. The following beads were evaluated: commercially manufactured (Ham)ilton); quaternary amine (cationic) resins: PRP-X400 and sulfonate (anion exchange) resins: RCX30. The characteristics of each bead type are summarized in the following table:
cation exchange resin tested

Tested anion exchange resins

The results of microvesicle isolation for non-magnetic beads using selected mRNA targets are shown in fig. 42, where X is cationic and R is anionic. The recovery of these selected mRNA targets is shown in figure 43. The results of microvesicle isolation for non-magnetic beads using selected microrna targets are shown in fig. 44, where X is cationic and R is anionic. The recovery of these selected microRNA targets is shown in FIG. 45.
In summary, the results show that microvesicles cannot be detected by cation exchange resins, as analyzed by RT-qPCR on selected mRNA and microrna targets. The anion exchange resin is similar to TEA treated magnetic beads capturing microvesicles on the RNA target tested. A gene-dependent pattern in microvesicle RNA distribution between supernatant and bead extraction was observed:
GAPDH, GUSB, RN7SL, HPRT distribution close to 1:1
RNaseP: 2.5X in beads > in supernatant
B2M 10-15X in beads > in supernatant
MiR16: -2X in beads > in supernatant
Let-7a: -3.5X in beads > in supernatant
miR150: 3-4X in supernatant > in beads
Assessment of binding of microvesicles to selected control beads: in the studies described herein, beads were evaluated against various controlsBackground level of binding of (a). In these studies, untreated epoxy beads and unfunctionalized polystyrene beads were used. In particular, the following beads were tested:
control beads tested:

the results of microvesicle isolation using selected mRNA targets for control beads are shown in fig. 46, and the recovery of these selected mRNA targets is shown in fig. 47. The results of microvesicle isolation using selected microrna targets for control beads are shown in fig. 48, and the recovery of these selected microrna targets is shown in fig. 49.
In summary, a similar microvesicle separation pattern was observed with both anion exchangers (Hamilton TEA resin and internal TEA modified beads). Sulfonate exchangers (cation exchange resins) showed very weak microvesicle recovery as assessed via RT-qPCR. Without intending to be bound by theory, this may be due to weak microvesicle capture and/or leaching of RT-qPCR inhibitors from the cationic resin. However, preliminary studies using carboxyl beads (cationic) did not show such effects as sulfonate resins; therefore, it may not be a general problem of the cation exchanger. The results show a gene-dependent pattern in microvesicle RNA distribution between supernatant and bead extraction. Again, without intending to be bound by theory, the data suggest that there may be multiple classes of microvesicles loaded with different surface (membrane) characteristics, such as charge, polarity, protein (antigen), carbohydrate, and the like. The differential RNA expression observed may be indirectly related to its microvesicle origin.
Example 28 bead titration Effect of Capture efficiency and RNA yield
In the studies described herein, four types of beads were evaluated using a fixed plasma volume (0.4 mL) and increasing amounts of beads (to extend the bead to microvesicle ratio (also referred to herein as B: E ratio) from 0.05 to 1 to 20). The following table presents the characteristics of the magnetic beads used for microvesicle RNA isolation in these studies:

the bead titration in this study gave a B/E (= ratio of bead SA to cutting SA of microvesicle) from 0.05, 0.25; B/E for bead C is given from 0.1, 0.5, 2:1, 5:1 to 10; and B/E for bead D from 0.2, 1:1, 4:1, 10. The standard control was an ultracentrifugation on 0.4 mL plasma. An overview of the methods used in this study is shown in figure 50.
Assessment of microvesicle capture was performed via RT-qPCR. Real-time PCR was performed on the following 7 targets and the ultracentrifugation results were used as 100% calculated recovery: VILO products (GAPDH, RN7SL, RNaseP, B2M, GUSB and HPRT 1) and Micro RT products (Let-7 a). The percent recovery according to the B: E ratio for each target is shown in FIGS. 51A-51G.
A Ct comparison between individual and mixed beads is shown in fig. 52, where the bead/microvesicle ratio for all targets is 2:1. Ct values from mixed beads were similar to bead C (PM), i.e., significantly higher than individual beads, except for let-7a target. Without intending to be bound by theory, this is most likely the inhibitory effect of bead C.
A comparison of recovery between individual and mixed beads is shown in figure 53, where the bead/microvesicle ratio for all targets is 2:1. The% recovery from mixed beads was similar to bead C, i.e. significantly lower for all targets than individual beads, except for let-7 a. Without intending to be bound by theory, weak recovery for mixed beads is most likely the inhibitory effect from bead C. The% recovery for each target is summarized in the following table:

in summary, bead titration studies on selected RNA targets showed that a 2.5. The results show that microvesicles are captured by beads with different surface characteristics (charged, neutral, hydrophobic, etc.). Without intending to be bound by theory, this is consistent with previous assumptions: there may be several types of microvesicles that are loaded with different surface (membrane) characteristics, such as charge, polarity, etc. In addition to their membrane properties, each type of microvesicles may also carry a different RNA expression pattern.
Bead C (PM) appeared inhibitory to all targets tested, except let-7 a. Inhibition can be at RT level (microRT kit for let-7 a) or microvesicle capture. A. B, C and D bead mixing behaved similarly to bead C, suggesting inhibition of inheritance by bead C. This also reduces the likelihood of inhibition acting on microvesicle capture. The source of inhibition can be confirmed by simply eliminating C from the mix of 4 beads.
Example 29 plasma volume titration Using fixed bead to microvesicle ratio
In the studies described herein, plasma titration was evaluated using four bead types to evaluate microvesicle recovery at a fixed bead to microvesicle ratio. The characteristics of the beads used are shown in the table below:


ultracentrifugation with 0.4, 1, 4mL plasma in 1X PBS was used as a control. Bead aliquots were prepared as shown in the following table:

* Note: the tubes for bead A-1 mL and bead B-1 mL were dropped from the magnetic separator, which resulted in some bead loss in both samples.
An overview of the methods used in these studies is shown in figure 54. The average Ct values for each target are shown in FIGS. 55A-55G. A comparison of the recovery of various targets at a 5:1 bead-to-microvesicle ratio and a plasma titration from 0.4 mL, 1mL to 4mL is shown in figure 56. A summary of the% recovery results is shown in the table below:

in summary, plasma titration at a fixed bead/microvesicle ratio (5:1) showed moderate reproducibility in the range of 0.4, 1 and 4mL plasma volumes.
Example 30 time course study of bead-microvesicle binding in plasma
In the studies described herein, epoxy magnetic beads (EPM-30) were evaluated for binding to microvesicles (at a bead: microvesicle ratio of 5:1) from 0.4 mL plasma. The following table presents the magnetic beads used for microvesicle isolation in these studies:

an overview of the methods used in these studies is shown in figure 57. Five aliquots of EPM-30 beads mixed with 0.4 mL plasma (B/E = 5:1) were incubated at 4 ℃ (on the rotor) and stopped at 1 minute, 5 minutes, 15 minutes, 30 minutes and 60 minutes. Beads were isolated and washed with 1X BB followed by Qiazol lysis and total RNA isolation using miRNeasy kit. RT-qPCR was performed on selected mRNA targets and let-7a microRNAs. The standard control was an ultracentrifugation using 0.4 mL plasma.
The average Ct values for various targets in the time course study for epoxy bead-microvesicle binding at 1 min, 5 min, 15 min, 30 min, and 60 min are shown in fig. 58, and the% recovery values for each target at the same time point are shown in fig. 59. The% recovery according to bead-microvesicle binding time is shown in figure 60.
The results show that 30 min (15 min for HPRT and let-7 a) incubation gave the highest detection of microvesicle RNA for all targets except EGFR. The signal began to fall at 60 minutes. EGFR was detected with very weak signal (4.4% recovery at 5 min). Each single type of bead (epoxy) appeared to behave similarly (in% recovery) (as previously observed).
Future studies will be designed to assess whether microvesicles captured to one bead type are identical to those bound by other types of beads, but bind by different affinities/interactions.
Example 31 additional study of Microvesicle binding to epoxy beads
The study described herein was designed to assess (if not fully captured) whether the remaining microvesicles in the supernatant could be further captured by additional fresh beads and to assess the background level of microvesicle adsorption to Eppendorf tubes. A summary of these studies is shown in figure 61. Briefly, these studies were performed using the following steps:
sequential binding of one plasma (0.4 mL, premixed in 1mL 1X BB) to two epoxy bead aliquots (B/E ratio = 5) was performed. The supernatant was monitored for the presence of bead-bound microvesicles (with both aliquots) and free unbound microvesicles.
Simulated bead binding was performed by adding pre-mixed plasma (0.4 mL) to empty Eppendorf tubes. The supernatant was monitored for the presence of bound tubes and free unbound microvesicles.
The amount of microvesicles bound or free to beads/tubes in the supernatant is measured via RT-qPCR and expressed as the amount of selected RNA target (note: qPCR is performed as single target assay).
The average Ct values for various RNA targets in the collection fractions (epoxy beads only) are shown in fig. 62, and the recovery percentages for these RNA targets are shown in fig. 63.
High linearity (R2 > 0.99) curves for EGFR or BRAF standard assays, indicating reliable RT-qPCR assays for either target. Results from sequential bead binding studies showed that microvesicles were predominantly (90 to 124%) captured to the first bead aliquot and <10% captured to the second bead aliquot. However, 7 to 59% of microvesicles were still present in the supernatant, suggesting that these microvesicles were either inactivated or not in optimal conditions for bead binding. Simulated bead binding results showed that the microvesicles were considered exclusively in the supernatant, with only 0.05 to 0.51% adsorbed to the tube. Although capture of EGFR microvesicles remains problematic, future studies on screening and testing of various beads will be performed.
The studies provided herein have demonstrated the feasibility of microvesicle isolation using beads (magnetic or non-magnetic) that would be a more suitable form in clinical utility. The results show that positively, negatively and neutral beads all show good microvesicle capture efficiency. This observation suggests that they may act on different ligands on the surface of the microvesicles, so that one microvesicle may be captured with different (functionalized) particles via different (multiple) forces.
Example 32: EXO50 microvesicle isolation and RNA extraction
This example describes an EXO50 spin column and protocol for microvesicle isolation, subsequent RNA extraction, and target expression analysis of RNA preparations. The method described in this example was used in the experiments described below, optionally with some variations as described in the specific working examples.
The EXO50 spin column, referred to herein as EXO50, comprises a membrane filter (preferably, Q-functionalized). The column may also include a column holder that holds the membrane filter between the outer frit and the inner tube (fig. 64). The column was placed in the collection tube (FIG. 65). After the biological sample is added to the membrane filter, the column is spun and the flow-through is discarded. Wash buffer was added to the membrane and the column was spun and the flow-through discarded. The washing step may be repeated as necessary. Lysis buffer, qiazol, is then added to the membrane for microvesicle lysis and subsequent release of microvesicle RNA. The column was again rotated to collect the microvesicle RNA. RNA extraction may be performed by chloroform extraction and ethanol conditioning, and/or using a silica column and eluting the isolated RNA from the silica column.
Subsequent detection of RNA targets by quantitative PCR is used to measure the quality of microvesicle isolation and/or RNA extraction. Once the RNA is extracted from the microvesicle fraction, the RNA is reverse transcribed into cDNA, for example by using the SuperScriptII VILO cDNA Synthesis kit for mRNA (Life Technologies) or the MiScriptII RT kit for short RNA (Qiagen). Quantitative PCR or Taqman analysis is performed using specific RNA target primers and optional probes to determine Ct values. Expression analysis was performed in duplicate or triplicate.
Multiple RNA targets were selected for expression analysis. Both large (i.e., ribosomal RNA and messenger RNA) and small (i.e., miRNA) RNAs are detected. Examples of ribosomal RNA detected include 18S and 28S. Target messenger RNA includes housekeeping genes, e.g., HPRT1, GAPDH. Other messenger RNAs include cancer specific genes such as wild type (wt) BRAF, mutant BRAF V600E. Examples of target mirnas include let7a, miR16. In some experiments, target genes (i.e., Q β coat protein) from control particles, such as Q β, were evaluated.
Example 33 analysis of different Membrane filters
Membrane filters suitable for separating microvesicles are preferably charged. The following table presents classes of membrane filters suitable for separating microvesicles:
| sample numbering | Film | Separation method | Functional group |
| (1)+(7) | The regenerated cellulose is prepared by the method of regenerating cellulose,>3. mum pore size ('RC/WBAE') | Weakly basic anion exchangers | Diethylamine R-CH 2 -NH + (C 2 H 5 ) 2 |
| (2)+(8) | The regeneration of the cellulose is carried out,>3. mum pore size ('RC/SACE') | Strongly acidic cation exchangers | Sulfonic acid R-CH 2 -SO 3 - |
| (3)+(9) | The regenerated cellulose is prepared by the method of regenerating cellulose,>3. mum pore size ('RC/SBAE') | Strongly basic anion exchangers | Quaternary ammonium R-CH 2 -N + (CH 3 ) 3 |
| (4)+(10) | Metal chelate membrane, 3-5 μm, pore size ("MCM") | Metal chelate film | Iminodiacetic acid-N (CH) 2 COOH - ) 2 |
| (5)+(11) | Regenerated cellulose coupled membranes, 0.45 μm pore size ("RCCM") | Microporous membrane | aldehyde-CHO |
| (6)+(12) | DEAE cellulose paper ("DEAE") | Weakly basic anion exchangers | DEAE cellulose paper |
The membranes listed in the table above were each evaluated for their ability to isolate microvesicles. Specifically, evaluation of RNA target signal (Ct value) was determined as a method of quantifying the quality of microvesicle isolation. Microvesicles were isolated using the following membranes: the regenerated cellulose film is, for example, a reinforced stable cellulose film reinforced with regenerated cellulose, a metal chelate film, a regenerated cellulose coupling film, and DEAE cellulose paper. The separation method for each membrane tested is shown in the table above. The biological sample was added to a column containing different membranes, similar to the column described in example 32. The flow-through is discarded and the microvesicles are lysed using a lysis buffer, e.g. on a membrane. Microvesicle RNA was subsequently extracted using a silica column. The detection of mRNA target genes GAPDH, HPRT and wild type (wt) BRAF as well as miRNA target genes hsa-let-7a and hsa-miR16 was determined by qPCR analysis (fig. 66). Comparison of the Ct values obtained for each specific target gene for each membrane filter confirms the ability of the membrane to successfully isolate microvesicles from a biological sample, respectively. All buffer conditions were the same for each film.
As shown in figure 66, all membranes were able to isolate sufficient microvesicles for RNA extraction and detection of at least one RNA target. However, membrane RC/SBAE; RC/WBAE; and RCCM outperformed the other membranes tested. The RC/SBAE functionalized membrane performed best compared to all other membranes. Specifically, for each of the mRNA and miRNA targets assayed, a lower Ct value is obtained from the microvesicle RNA preparation isolated by the RC/SBAE membrane compared to any other membrane from the microvesicle fraction. The capture surface of the EXO50 column described in the examples below contained an RC/SBAE film.
These results confirm that positively charged (anionic) ion exchange membranes purify vesicles at physiological pH. However, negatively charged ion exchange is ineffective at purifying vesicles at physiological pH.
FIG. 71 shows microvesicles bound to an EXO50 membrane as detected by scanning electron microscopy. Arrows indicate trapped microvesicles.
Example 34 EXO50 Membrane input Capacity
Next, the input capacity of the RC/SBAE membrane was evaluated by titrating the amount of input plasma volume added to the membrane. Adding increasing volumes of sample input to the RC/SBAE membrane; such as 0.5ml, 1.0ml, 2.0ml, 4.0ml, 8.0ml and 16ml plasma. Microvesicle fractions were isolated and microvesicle RNA was extracted as described in example 32. QPCR analysis was performed to detect mRNA genes wt BRAF and HPRT1 and miRNAs let7a, miR16 and 18S. As shown in figure 67, qPCR signals for both mRNA and miRNA genes increased linearly (i.e., a linear decrease in Ct values) from 0.5ml to 4.0ml of sample. However, samples greater than 4.0ml (i.e., 8.0ml and 16 ml) failed to demonstrate additional increases in the detected signal. These results indicate that sample volumes greater than 4ml did not show any increase. In fig. 68, copy number of RNA extracted from microvesicle fractions isolated by EXO50 was compared to copy number from flow-through. This experiment identifies the maximum volume of sample input that saturates the membrane, such that microvesicles are present in the flow-through, and an RNA signal from the flow-through will be detected. For example, input volumes greater than 4.0ml do not demonstrate a linearly increasing signal when compared to the signal detected from a 4.0ml sample. Consistent with these results, the signal detected from the flow-through increased for volumes greater than 4.0 ml.
The relative expression levels of the various target genes were compared to the flow-through in the second EXO50 column between the initial loading and isolation of the biological sample in the first EXO50 column. The biological samples were added to EXO50, where microvesicle isolation, RNA extraction, and target gene analysis were performed as described in example 32. The flow-through from the first EXO50 column is then loaded onto a second EXO50 column for microvesicle isolation, RNA extraction and target gene analysis using the same method as the initial biological sample used for the first EXO50 column. Different volumes of the initial biological sample (0.5 ml-16ml plasma) were tested. Target genes include mRNA targets: wt BRAF, GAPDH and HPRT1; and mirnas let7a, miR16; and ribosomal RNA 18S. The expression level of each target gene is normalized to the expression level of the corresponding target gene detected by the first loading step. As shown in figure 69, the flow-through from the 0.5ml-4.0ml sample had little expression of any target genes, indicating that EXO50 had effectively captured all microvesicles from the biological sample. In contrast, flow-through from 8.0ml and 16ml samples showed at least a 10% increase in expression detected for some target genes, and up to 200% increase detected for other target genes. These results show that the flow-through from the larger sample input volume still contains microvesicles isolated from the second EXO50 column, confirming that sample volumes of 8ml and 16ml cannot be completely depleted of microvesicles. Furthermore, these results demonstrate that no two separation and lysis steps are required to isolate all microvesicles from a biological sample of 0.5ml to 4ml.
Example 35 determination of the number of layers of the depleted sample
The number of membrane layers was evaluated for complete depletion of microvesicle RNA from a 4.0ml plasma sample. One to six layers of RC/SBAE were placed adjacent to each other in an EXO50 column. Microvesicle RNA was extracted and analyzed from the samples and flow-through as described in example 32. The target genes evaluated were wt BRAF and GAPDH.
The results shown in figure 70 show that one and two layers are insufficient to capture all microvesicles from the sample, as evidenced by the signal detected from the flow-through (filtrate) data points. However, columns with 4 or more layers did not show any increase in signal from the input data points, while the flow-through (filtrate) was completely depleted of any signal. Thus, these results show that 3 layers are optimal to ensure sufficient microvesicle capture, while increasing the number of layers to 4 or more does not obtain any additional benefit with regard to microvesicle capture.
Example 36 EXO50 buffer conditions for microvesicle separation
Various buffer conditions were evaluated for optimal microvesicle separation using the EXO50 column and method as described in example 32. Evaluation the different loading buffers added to each sample for loading onto the column. The buffers tested included:
· 160mM Tris、142mM Cl - ,pH 7.0
192mM imidazole; 159mM Cl - ,pH 6.5-6.8
· 300mM Bis Tris、211mM Cl - ,pH 6.3-6.4
· 40mM citrate, 124mM Na + ,pH 6.7-6.9
50mM phosphate, 265mM Na + 、185mM Cl - ,pH 7.0-7.2
80mM bis [ tris (hydroxymethyl) methylamino ]]Propane, 14mM Cl - ,pH 6.7.
As shown in figure 72, all buffers resulted in successful microvesicle isolation, allowing the RNA targets BRAF, GAPDH and HPRT to be detected.
Different pH conditions were also evaluated. The buffer was prepared at 2X PBS pH 2.0, pH 4.75, pH 10.25 and pH 13.0 for loading the samples. The wash buffer was 1 ×. After loading into the EXO50 column, 1000 copies of Q β were spiked into the sample. Buffers with increasing pH demonstrated optimal buffering conditions between pH 2-10.25, while very basic buffers resulted in less efficient microvesicle separation (fig. 73). The optimal range for separation is between pH4 and 8.
Buffers with different amounts of detergent were tested to show that the process was tolerant to buffers with different strengths of detergent. Figure 74 demonstrates that detergents of up to 0.001% SDS, up to 0.01% Triton X-100, and up to 0.1% Tween in both binding and wash buffers resulted in successful microvesicle isolation and subsequent microvesicle RNA extraction analysis.
Example 37 preparation of EXO50 RNA
The results shown in FIG. 76 confirm that RNA purified by EXO50 is PCR amplifiable RNA, i.e., suitable for amplification and PCR processing, and that EXO50 isolates the same amount and mass of RNA from large volumes of plasma as by ultracentrifugation. 4ml plasma samples were processed either by EXO50 or by ultracentrifugation. Comparison of RNA target (wt BRAF, GAPDH, Q β, let7a, miR 16) isolation and detection shows EXO50 purification of RNA of similar quality as obtained by ultracentrifugation. For some target genes, EXO50 was shown to have improved RNA quality as indicated by increased Ct signal.
In addition, EXO50 purifies a high percentage of mRNA from microvesicles. For example, EXO50 purifies 100% mRNA from commercially available cancer exosomes or cancer cell culture supernatants. Increasing inputs of commercially available cancer exosomes from colon cancer cell lines (150, 1500 and 3000 ng) were processed by EXO50 or by direct lysis (using Qiagen miRNeasy RNA isolation kit). The results shown in fig. 78 confirm that the flow-through from EXO50 processing shows no detection of mRNA (no Ct signal for RPL0, and a very high Ct signal for GAPDH), thus indicating successful extraction of 100% mRNA from the microvesicle fraction of the sample.
The EXO50 RNA preparations also contained very little contaminating DNA. Background levels of detection of certain targets from RNA preparations that were not reverse transcribed (-RT) indicate that there was some background level of contaminating DNA (FIG. 79). EXO50 RNA preparations were digested with rnase a, which showed a loss of Ct signal to the target gene to show that the preparations contain mostly RNA and very little contaminating DNA. QPCR analysis of rnase digested RNA preparations showed very low background levels of BRAF, similar to that detected when the sample was not reverse transcribed. Addition of dnase showed removal of background DNA signal as indicated by signal loss in samples digested by non-reverse transcribed dnase.
Example 38 EXO50 operability test
EXO50 is robust to parallel processing of many samples. Eight 4ml plasma samples were processed in parallel using EXO50, where each sample had added a 3 minute aspiration delay for each individual step in the separation. Thus, one sample was processed as normal (0 minutes), a second sample was processed with 3 minutes between each step (3 minutes), a third sample was processed with 6 minutes between each step (6 minutes), etc., with the eighth sample being processed with 21 minutes between each step. For the targets GAPDH, wt BRAF, hsa-miR-142-3p and hsa-miR-92a, there was no significant difference in the Ct values detected even for 21 min between each step (fig. 80). The standard deviation for individual determinations between separation replicates was less than 0.5 Ct. This experiment demonstrates that the EXO50 process allows processing of a long row of replicates without variation in separation efficiency-each step allows up to 21 minutes of extraction time.
The operability of the EXO50 process with different qPCR assay reagents by different users at different study sites was compared in field experiments in order to assess the ease of use and reproducibility of the results of the EXO50 process. The samples used in this experiment contained a plasma pool from 900 single bleeds. Samples were shipped on dry ice to 8 different laboratories, some on different continents. EXO50 procedures were performed in triplicate with 2ml or 0.2ml plasma per laboratory. RT-qPCR analysis was performed for 2 mrnas (i.e. wt BRAF, GAPDH) and 2 mirnas (i.e. miR-16 and let-7 a) and the results compared in figure 81. In all laboratories, the EXO50 operation was reproducible and the PCR output was linearly amplified for plasma inputs from 0.2mL to 2 mL. The first user using the same PCR primers showed very similar output PCR signals (fig. 81). These results demonstrate the robustness of EXO50 with respect to reproducibility, independent of the user and the study site.
Example 39 EXO50 Small spin column format
The EXO50 format was also modified to a small spin column format to evaluate its reproducibility and scalability. The EXO50 miniature form comprises a miniature RC/SBAE membrane. Miniature RC/WBAE and RC/SACE membranes were also tested for comparison. 2ml and 0.2ml plasma samples were tested. Standard buffers were used: binding buffer (2X) 100mM phosphate buffer, 370mM NaCl; wash buffer (1X) 50mM phosphate buffer, 185mM NaCl. Results from the mini format were also compared to ultracentrifugation. Detection of target mRNA and miRNA showed the optimal Ct signal for the micro RC/SBAE membrane compared to the micro RC/SACE and micro RC/WBAE membranes (fig. 84). A comparison between the EXO50 mini-format (RC/SBAE membranes) and ultracentrifugation is shown in FIG. 83.
Example 40 comparison of EXO50 with other methods
Standard ultracentrifugation procedures involve pre-filtering the biological sample, i.e., plasma, through a 0.8 μm filter. The filtrate was then loaded into an ultracentrifuge and spun at >100,000xg for 1-3 hours. The supernatant was removed and the pellet containing the microvesicles was lysed. Microvesicle RNA was subsequently purified on a silica column, i.e. a commercially available RNA isolation column (Qiagen), using the manufacturer's protocol.
Comparison of bioanalyzer profiles from RNA extracted by ultracentrifugation or by EXO50 was similar in terms of RNA size distribution (fig. 86). EXO50 shows the isolation of both small and large RNAs. Isolation of microvesicle RNA was achieved by ethanol fractionation. rRNA (i.e., large RNA) peaks are clearly visible at 2Kb and 4 Kb. Most isolated small RNAs are between 50-200 base pairs.
A comparison between ultracentrifugation, EXO50, and self-assembled membrane capture systems is shown in fig. 87. The self-assembled membrane capture system also includes a Q-functionalized membrane. Two separate technical repeats of extraction are shown for each column. Open circles (miR-16 and miR-92 a) are known to exist as free circulating protein-bound miRNAs. The results presented herein demonstrate that EXO50 and self-assembled Q membranes result in increased Ct signals for microvesicle RNA targets.
Similar comparative experiments were also performed using 0.2ml plasma, comparing ultracentrifugation, direct lysis and EXO50. As shown in fig. 88, EXO50 also performed better than direct lysis for almost all genes. EXO50 flow-through confirmed that some miRNA signals were still detected in the flow-through.
However, increasing the sample volume to 4ml plasma showed that EXO50 had an increased Ct signal detected compared to ultracentrifugation (fig. 89).
Example 41 EXO50 detection of cancer mutations
Importantly, EXO50 showed successful detection of cancer mutations in 2ml plasma samples from melanoma patients. The samples were processed by Ultracentrifugation (UC) or EXO50. Copy number was determined by qPCR analysis of wild-type BRAF (wt BRAF) and compared to copy number of mutant BRAF (BRAF V600E). As shown in figure 90, both ultracentrifugation and EXO50 were able to detect wt BRAF copies. However, only EXO50 is able to detect the presence of mutant BRAF V600E. These results demonstrate that EXO50 is able to detect cancer mutations from microvesicle RNA, whereas ultracentrifugation cannot resolve the presence of cancer mutations.
Example 42 EXO51 elution step
This example shows an optional elution step to separate microvesicles from a filter membrane, also referred to herein as EXO51, prior to RNA lysis and extraction. Specifically, microvesicles are separated from the EXO50 column by a wash/elution step to separate intact isolated microvesicles from the membrane. 10ml of wash/elution buffer was added twice to the column. In some cases, a different NaCl concentration was used for the first time, and in some cases, the same NaCl concentration was used, as compared to the second time. For example, 185mM, 1000mM and 2000mM NaCl buffer are used for the first wash. For the second wash 185mM, 1000mM and 2000mM NaCl buffer were used. The column was spun at 5,000xg for 1 minute. Comparison of Ct values for various genes (i.e., GAPDH, BRAF, kras, etc.) using various elution protocols, compared to EXO50, confirms that RNA isolation of EXO51 is comparable to that of EXO50 (fig. 91).
Scanning electron microscopy of the eluted microvesicles from EXO51 revealed microvesicles of size 50-200 nm (fig. 85). In contrast, microvesicles isolated by ultracentrifugation reveal more fibrous protein structure-like material in the isolated microvesicles, which can potentially affect RNA lysis and extraction, RNA purity, and the ability to detect/amplify RNA sequences from RNA preparations. EXO51 separation contains particles similar to the purified material obtained using UC operations, but not similar to the source material. The flow-through from the EXO51 process still contains a large amount of particles different from the purified vesicle material.
Additional concentration steps may be utilized for the EXO51 protocol. Various rotary concentrators (e.g., vivaSpin 20 columns) with different size cut-offs were used, for example, 10,000 MW, 50,000 MW, and 100,000 MW cut-offs. The eluate was spun for 5 minutes. If the retentate volume is too high (> 200 μ L), the retentate is spun to the desired volume, i.e. less than 200 μ L, in 5 minute increments. The concentrated eluate from the upper compartment (filter side) of the concentrator was transferred with gentle resuspension. The concentrated eluate was filled up to 200 μ L in total volume by using 1x wash buffer. Subsequently, the sample is ready for lysis and RNA extraction. The concentration spin rate and time ranged between 800xg and 4500xg for concentrated microvesicle eluate without significantly altering the RNA yield or subsequent Ct value from the RNA expression analysis.
Example 43 EXO52 isolation of DNA
The EXO50 column can also be used to separate all DNA from plasma. Two methods for DNA isolation using EXO50 columns, in addition to RNA, are depicted in fig. 92 (EXO 52) and fig. 93 (EXO 52.2). In particular, the difference between the two processes EXO52 and EXO52.2 is that RNA and DNA extractions are combined in one tube in EXO52.2 for ease of use, laminar flow of the protocol and increased reproducibility. FIG. 94 shows the increase of 1.5 Ct in EXO50 RNA + DNA (EXO 52.2). FIG. 95 shows that increasing amounts of chloroform added the DNA back to the aqueous phase during phase separation, allowing the DNA to co-separate with normal EXO50 procedures. Further optimization of pH levels during phase separation DNA was also added to the formulation as shown in figure 96.
Thus, the EXO50 method can be used to isolate all DNA from plasma samples as shown in EXO52 and EXO52.2.DNA was recovered from the lower hydrophobic phase of QIAzol cleavage after phase separation. The EXO50 method, combined with the EXO52 method (e.g., EXO52 or EXO 52.2), separates RNA and DNA at similar levels for the same sample volume, and RNA and DNA can be separated from each other. These methods of the disclosure capture the same or more mRNA and much more miRNA compared to commercially available isolation kits such as Qiagen.
Example 44 isolation of EXO60 microvesicles from CSF and RNA extraction
This example demonstrates that microvesicle RNA can be isolated and extracted from cerebrospinal fluid (CSF) using a column containing EXO50 RC/SBAE membranes in a process referred to herein as EXO60.
Titration experiments were performed using increasing volumes of CSF samples (0.5 ml, 1ml, 2ml and 4 ml) from patients. CSF samples were pre-filtered through a 0.8um filter before freezing. CSF was processed through the column as described in example 32. The results from the qPCR analysis are shown in figure 97 and show that the Ct signal for the target gene (both mRNA and miRNA) increases linearly with sample volume. This experiment demonstrates the success of EXO60 in isolating microvesicles from CSF samples.
Additional experiments were performed comparing EXO60 and ultracentrifugation from different patient samples and sources. The flow-through from the EXO60 separation and the supernatant from the ultracentrifugation were also evaluated to determine the quality of the microvesicle extraction. The genes evaluated were the mRNA targets GAPDH and HIF1A, and the miRNAs target hsa-miR-16 and hsa-miR-124-3p. As shown in figure 99, microvesicle RNA was successfully isolated, similar to the results obtained from ultracentrifugation.
As shown in figure 100, EXO60 better isolates RNA from CSF than size filtration or ultracentrifugation based methods. For EXO60, RNA was extracted using 70% EtOH, whereas uCSC extraction used 30% isopropanol, and UC extraction used 60% EtOH. EXO60 demonstrates linear PCR output over at least a range of 0.2-2 mL CSF input. In the flow-through of EXO60, only some miR-16 mirnas were found, and GAPDH and HIF1A mRNA were not found. In contrast to the uccs extraction, miR-16 was found only in the column fraction, and GAPDH and HIF1A, as well as some miR-16, were found in the flow-through fraction. UC extraction showed that most of the mRNA and miRNA remained in the supernatant. HIF1a was not found and only some GAPDH was found in the pellet fraction.
Example 45 isolation of EXO70 microvesicles from urine and RNA extraction
The studies presented herein were designed to compare EXO 50-based microvesicle RNA isolation, referred to herein as EXO70, with filtration-based isolation (uCSC). Each separation method was run using a 20ml urine sample. For EXO70 isolation, RNA was extracted and isolated according to example 32, but 30% EtOH was used for mRNA capture only. For uCSC isolation, RNA was extracted and isolated according to example 32.
As shown in figure 101, RNA isolated by EXO70 and filtration exhibited a similar RNA size distribution when ethanol conditioning was adjusted to isolate only large RNA. This study also confirmed that both methods achieved the same intensity of PCR signal.
As shown in fig. 102, 103A, and 103B, loading of flow-through from EXO70 onto fresh uccs columns obtained a much higher Ct value for mRNA signal (approximately 8 Ct value), indicating that only less than 1% signal remained in the flow-through. Thus, EXO70 captures mRNA and miRNA with > 99% efficiency, since less than 1% of mRNA and miRNA remain in the flow-through.
Flow-through from the uccs loaded onto the EXO70 column gave little to no signal for mRNA in 2 of 4 patients, and if there was a detectable signal it was about 15 Ct higher than the data point on the column. Less than 1% mRNA signal remained in the urine flow-through for both EXO70 and uCSC.
Example 46 isolation of EXO50 microvesicles in a cell supernatant sample
The studies presented herein are designed to test the use of EXO50 methods and kits for cell supernatant samples. The samples were processed as described above in example 32.
As shown in fig. 104 and 105, EXO50 isolated vesicle RNA from human cell culture supernatants. As shown in figure 105, different concentrations of 2x Binding Buffer (BB) were used with Gli36 cell line supernatants.
Other embodiments
While the invention has been described in conjunction with the detailed description thereof, the foregoing description is intended to illustrate and not limit the scope of the invention, which is defined by the scope of the appended claims. Other aspects, advantages, and modifications are within the scope of the following.
Sequence listing
<110> Exosome Diagnostics, Inc.
Enderle, Daniel
Ramachandran, Aparna
Yan, Haoheng
Berghoff, Emily
Wei, Tai-Fen
Noerholm, Mikkel
Skog, Johan Karl Olov
<120> method for isolating microvesicles
<130> 41432-511001WO
<140> PCT/US2014/010173
<141> 2014-01-03
<150> US 61/748,575
<151> 2013-01-03
<160> 10
<170> PatentIn version 3.5
<210> 1
<211> 20
<212> DNA
<213> Artificial sequence
<220>
<223> chemically synthesized primer
<400> 1
<210> 2
<211> 20
<212> DNA
<213> Artificial sequence
<220>
<223> chemically synthesized primer
<400> 2
<210> 3
<211> 15
<212> DNA
<213> Artificial sequence
<220>
<223> chemically synthesized Probe
<400> 3
<210> 4
<211> 30
<212> DNA
<213> Artificial sequence
<220>
<223> chemically synthesized primer
<400> 4
aaaaataggt gattttggtc tagctacagt 30
<210> 5
<211> 30
<212> DNA
<213> Artificial sequence
<220>
<223> chemically synthesized primer
<400> 5
aaaaataggt gattttggtc tagctacata 30
<210> 6
<211> 21
<212> DNA
<213> Artificial sequence
<220>
<223> chemically synthesized primer
<400> 6
tggatccaga caactgttca a 21
<210> 7
<211> 20
<212> DNA
<213> Artificial sequence
<220>
<223> chemically synthesized Probe
<400> 7
<210> 8
<211> 20
<212> DNA
<213> Artificial sequence
<220>
<223> chemically synthesized primer
<400> 8
<210> 9
<211> 18
<212> DNA
<213> Artificial sequence
<220>
<223> chemically synthesized primer
<400> 9
<210> 10
<211> 16
<212> DNA
<213> Artificial sequence
<220>
<223> chemically synthesized Probe
<400> 10
Claims (23)
1. A method for extracting nucleic acids from a biological sample, comprising:
(a) Providing a biological sample;
(b) Contacting the biological sample with a capture surface under conditions sufficient to retain the microvesicle fraction on or in the capture surface, wherein the capture surface comprises at least one membrane that is positively charged and is comprised of a quaternary ammonium R-CH 2 -N + (CH 3 ) 3 Functionalization;
(c) Lysing the microvesicle fraction while the microvesicles are on or in the capture surface; and
(d) Extracting nucleic acids from the microvesicle fraction.
2. The method of claim 1, wherein the capture surface has two, three, four, five, or six membranes.
3. The method of claim 1, wherein the at least one membrane is a reinforced stabilized cellulose membrane.
4. The method of claim 1, wherein the at least one membrane has a pore size in the range of 3-5 um.
5. The method of claim 1, wherein the at least one membrane has a pore size of at least 3 um.
6. The method of claim 2, wherein the membranes are identical to each other.
7. The method of claim 1, wherein the biological sample is plasma, serum, urine, cerebrospinal fluid, or cell culture supernatant.
8. The method of claim 1, wherein step (a) further comprises contacting the biological sample with a loading buffer.
9. The method of claim 8, wherein the loading buffer has a neutral pH.
10. The method of claim 1, wherein the nucleic acid comprises RNA.
11. The method of claim 10, wherein the RNA comprises mRNA, miRNA, or a combination thereof.
12. A method for extracting nucleic acids from a biological sample, comprising:
(a) Providing a biological sample;
(b) Contacting the biological sample with a capture surface under conditions sufficient to retain the microvesicle fraction on or in the capture surface, wherein the capture surface comprises at least one membrane that is positively charged and is formed from a quaternary ammonium R-CH 2 -N + (CH 3 ) 3 Functionalization;
(c) Eluting the microvesicles from the capture surface to obtain a microvesicle fraction; and
(d) Extracting nucleic acids from the microvesicle fraction.
13. The method of claim 12, wherein the eluted microvesicle fraction from step (c) is concentrated by a rotary concentrator to obtain a concentrated microvesicle fraction, and wherein nucleic acids are extracted from the concentrated microvesicle fraction.
14. The method of claim 12, wherein the capture surface has two, three, four, five, or six membranes.
15. The method of claim 12, wherein the at least one membrane is a reinforced stabilized cellulose membrane.
16. The method of claim 12, wherein the at least one membrane has a pore size in the range of 3-5 um.
17. The method of claim 12, wherein the membrane has a pore size of at least 3 um.
18. The method of claim 14, wherein the membranes are identical to each other.
19. The method of claim 12, wherein the biological sample is plasma, serum, urine, cerebrospinal fluid, or cell culture supernatant.
20. The method of claim 12, wherein step (a) further comprises contacting the biological sample with a loading buffer.
21. The method of claim 20, wherein the loading buffer has a neutral pH.
22. The method of claim 12, wherein the nucleic acid comprises RNA.
23. The method of claim 22, wherein the RNA comprises mRNA, miRNA, or a combination thereof.
Applications Claiming Priority (4)
| Application Number | Priority Date | Filing Date | Title |
|---|---|---|---|
| US201361748575P | 2013-01-03 | 2013-01-03 | |
| US61/748575 | 2013-01-03 | ||
| CN201480002901.2A CN105026911B (en) | 2013-01-03 | 2014-01-03 | Method for separating microcapsule bubble |
| PCT/US2014/010173 WO2014107571A1 (en) | 2013-01-03 | 2014-01-03 | Methods for isolating microvesicles |
Related Parent Applications (1)
| Application Number | Title | Priority Date | Filing Date |
|---|---|---|---|
| CN201480002901.2A Division CN105026911B (en) | 2013-01-03 | 2014-01-03 | Method for separating microcapsule bubble |
Publications (2)
| Publication Number | Publication Date |
|---|---|
| CN110106229A CN110106229A (en) | 2019-08-09 |
| CN110106229B true CN110106229B (en) | 2023-03-28 |
Family
ID=51062472
Family Applications (2)
| Application Number | Title | Priority Date | Filing Date |
|---|---|---|---|
| CN201480002901.2A Active CN105026911B (en) | 2013-01-03 | 2014-01-03 | Method for separating microcapsule bubble |
| CN201910000819.0A Active CN110106229B (en) | 2013-01-03 | 2014-01-03 | Method for isolating microvesicles |
Family Applications Before (1)
| Application Number | Title | Priority Date | Filing Date |
|---|---|---|---|
| CN201480002901.2A Active CN105026911B (en) | 2013-01-03 | 2014-01-03 | Method for separating microcapsule bubble |
Country Status (11)
| Country | Link |
|---|---|
| US (2) | US20150353920A1 (en) |
| EP (2) | EP2941629B1 (en) |
| JP (1) | JP6449781B2 (en) |
| CN (2) | CN105026911B (en) |
| AU (2) | AU2014203987B2 (en) |
| BR (1) | BR112015016136A2 (en) |
| CA (1) | CA2897207C (en) |
| HK (1) | HK1217365A1 (en) |
| IL (2) | IL239786B (en) |
| MX (2) | MX366153B (en) |
| WO (1) | WO2014107571A1 (en) |
Families Citing this family (47)
| Publication number | Priority date | Publication date | Assignee | Title |
|---|---|---|---|---|
| ES2744589T3 (en) * | 2011-05-11 | 2020-02-25 | Exosome Diagnostics Inc | Nucleic acid extraction from heterogeneous biological materials |
| KR20150128687A (en) | 2013-03-14 | 2015-11-18 | 샤이어 휴먼 지네틱 테라피즈 인크. | Methods for purification of messenger rna |
| US20170165334A1 (en) * | 2015-12-11 | 2017-06-15 | Tianxin Wang | Methods to Treat Diseases with Protein, Peptide, Antigen Modification and Hemopurification |
| US11268085B2 (en) | 2014-05-27 | 2022-03-08 | Exosome Diagnostics, Inc. | Methods for isolating microvesicles and extracting nucleic acids from biological samples |
| US10465183B2 (en) | 2014-07-09 | 2019-11-05 | Exosome Diagnostics, Inc. | Methods for isolating microvesicles and extracting nucleic acids from biological samples |
| WO2016007951A1 (en) * | 2014-07-11 | 2016-01-14 | KARNAKIS, Jennifer A. | Compositions and methods for detecting rare sequence variants in nucleic acid sequencing |
| CA2965500A1 (en) | 2014-10-24 | 2016-04-28 | Abbott Molecular Inc. | Enrichment of small nucleic acids |
| EP3112474A1 (en) | 2015-06-29 | 2017-01-04 | Evonik Degussa GmbH | Method of detecting avian necrotic enteritis |
| WO2017062901A2 (en) * | 2015-10-07 | 2017-04-13 | Tymora Analytical Operations Llc | Methods to isolate extracellular vesicles in biofluids for biomarker discovery and disease diagnosis |
| US20190093172A1 (en) * | 2016-04-15 | 2019-03-28 | Exosome Diagnostics, Inc. | Plasma-based detection of anaplastic lymphoma kinase (alk) nucleic acids and alk fusion transcripts and uses thereof in diagnosis and treatment of cancer |
| CN105716923A (en) * | 2016-04-21 | 2016-06-29 | 华南理工大学 | Preparation method of scanning electron microscope sample for polymer vesicae |
| DK3452613T3 (en) | 2016-05-05 | 2022-03-21 | Exosome Diagnostics Inc | PROFILE OF MICROVESICLE NUCLEIC ACIDS AND USE THEM AS SIGNATURES FOR DIAGNOSIS OF KIDNEY TRANSPLANT REJECTION |
| AU2017263886B2 (en) * | 2016-05-13 | 2023-11-09 | Exosome Diagnostics, Inc. | Automated and manual methods for isolation of extracellular vesicles and co-isolation of cell-free DNA from biofluids |
| WO2018070479A1 (en) | 2016-10-13 | 2018-04-19 | 合同会社みらか中央研究所 | Method for recovering extracellular vesicles |
| WO2018076018A1 (en) | 2016-10-21 | 2018-04-26 | Exosome Diagnostics, Inc. | Sequencing and analysis of exosome associated nucleic acids |
| EP3548635B1 (en) | 2016-11-30 | 2021-04-28 | Exosome Diagnostics, Inc. | Methods to detect mutations in plasma using exosomal rna and cell free dna from non-small cell lung cancer patients |
| CN110072994A (en) * | 2016-12-23 | 2019-07-30 | 埃克波菲尔有限公司 | For purifying or separating the method and composition of microvesicle and excretion body |
| EP3562959A2 (en) | 2017-01-02 | 2019-11-06 | Exosome Diagnostics, Inc. | Methods to distinguish rna and dna in a combined preparation |
| KR101875594B1 (en) * | 2017-01-13 | 2018-07-06 | ㈜로제타엑소좀 | Method of isolating extracellular vesicles using metal |
| CA3063287A1 (en) | 2017-05-12 | 2018-11-15 | Evonik Operations Gmbh | Method for detecting c. perfringens induced diseases in animals |
| CN110945145A (en) | 2017-05-17 | 2020-03-31 | 外来体诊断公司 | Microvesicle nucleic acids and/or proteins and their use as markers for renal transplant rejection |
| CN107271655A (en) * | 2017-05-18 | 2017-10-20 | 成都中医药大学附属医院 | A kind of kit and method for detecting urine excretion body load miRNAs |
| EP3652314B1 (en) * | 2017-07-12 | 2023-08-23 | Illumina, Inc. | Nucleic acid extraction materials and methods |
| US11899024B2 (en) | 2017-07-12 | 2024-02-13 | Exosome Diagnostics, Inc. | Treatment and diagnosis of parkinson's disease using isolated and enriched populations of biofluid-derived extracellular vesicles |
| US11345957B2 (en) | 2017-07-18 | 2022-05-31 | Exosome Diagnostics, Inc. | Methods of treating glioblastoma in a subject informed by exosomal RNA signatures |
| KR102107844B1 (en) * | 2017-07-26 | 2020-05-07 | ㈜로제타엑소좀 | Method of isolating extracellular vesicles using cation |
| RU2745613C1 (en) * | 2017-12-26 | 2021-03-29 | Общество с ограниченной ответственностью "Простагност" (ООО "Простагност") | Method and device for recovering extracellular vesicles from biological fluids by means of cascade ultrafiltration |
| US20210230701A1 (en) | 2018-06-06 | 2021-07-29 | Exosome Diagnostics, Inc. | Methods for developing urine biomarkers and for detecting bladder cancer |
| CN108841777A (en) * | 2018-06-22 | 2018-11-20 | 北京恩泽康泰生物科技有限公司 | The extracting method and device of extracellular vesica based on Electrostatic Absorption and its content |
| AU2019292939A1 (en) * | 2018-06-27 | 2021-01-07 | The Trustees Of Indiana University | Methods for analyzing DNA in urine |
| CN109337859A (en) * | 2018-10-08 | 2019-02-15 | 南昌大学 | A method of separation cell surface vesica |
| US20220026323A1 (en) * | 2018-10-30 | 2022-01-27 | National University Corporation Tokai National Higher Education And Research System | Device to be used for capturing extracellular vesicles, and preservation method and transport method for extracellular vesicles |
| EP3884045B1 (en) | 2018-11-20 | 2023-01-11 | Exosome Diagnostics, Inc. | Methods for internal controls of microvesicle isolations |
| JP7344973B2 (en) | 2019-03-01 | 2023-09-14 | マーシー バイオアナリティクス, インコーポレイテッド | Systems, compositions, and methods for detecting target entities |
| US20220387906A1 (en) * | 2019-03-21 | 2022-12-08 | Codiak Biosciences, Inc. | Process for preparing extracellular vesicles |
| CN112048462B (en) * | 2019-06-05 | 2022-08-23 | 北京丰特云基科技发展有限公司 | Extracellular vesicle separation and enrichment method based on anionic polymer modified matrix |
| EP4031865A2 (en) | 2019-09-18 | 2022-07-27 | Exosome Diagnostics, Inc. | Compositions, methods, and kits for the isolation of extracellular vesicles |
| WO2021122855A1 (en) * | 2019-12-16 | 2021-06-24 | Qiagen Gmbh | Method for enriching vesicular rna |
| US20230028205A1 (en) | 2019-12-16 | 2023-01-26 | Qiagen Gmbh | Enrichment method |
| JP7425403B2 (en) | 2020-02-17 | 2024-01-31 | 株式会社Jvcケンウッド | Biological sample analysis method |
| EP4141107A4 (en) * | 2020-04-24 | 2024-04-17 | Univ Korea Res & Bus Found | Microvesicle isolation method and microvesicle isolation device |
| EP4158065A1 (en) | 2020-05-29 | 2023-04-05 | Exosome Diagnostics, Inc. | Use of microvesicle signature for the diagnosis and treatment of kidney transplant rejection |
| EP4217087A2 (en) * | 2020-09-23 | 2023-08-02 | Codiak BioSciences, Inc. | Process for preparing extracellular vesicles |
| CN112391382B (en) * | 2020-12-07 | 2022-10-11 | 湖北盛齐安生物科技股份有限公司 | Method for rapidly extracting vesicle DNA |
| WO2023288130A1 (en) | 2021-07-16 | 2023-01-19 | Exosome Diagnostics, Inc. | Methods of detecting sjögren's syndrome using salivary exosomes |
| WO2023158869A1 (en) | 2022-02-18 | 2023-08-24 | Exosome Diagnostics, Inc. | Use of microvesicle signatures in the identification and treatment of renal disorders |
| WO2024054572A1 (en) | 2022-09-07 | 2024-03-14 | Exosome Diagnostics, Inc. | Methods of detecting sjögren's syndrome using salivary exosomes |
Citations (5)
| Publication number | Priority date | Publication date | Assignee | Title |
|---|---|---|---|---|
| US5438128A (en) * | 1992-02-07 | 1995-08-01 | Millipore Corporation | Method for rapid purifiction of nucleic acids using layered ion-exchange membranes |
| JP2004105009A (en) * | 2002-09-13 | 2004-04-08 | Dojindo Laboratories | Reagent for separating nucleic acid comprising tetraphenylboron compound and method for separating nucleic acid using the same |
| WO2012087241A1 (en) * | 2010-12-20 | 2012-06-28 | Agency For Science, Technology And Research | Method of purifying exosomes |
| CN102596177A (en) * | 2009-07-01 | 2012-07-18 | 阿昂梅迪克斯公司 | Microvesicles derived from nucleated, mammalian cells and use thereof |
| WO2012174282A2 (en) * | 2011-06-16 | 2012-12-20 | Caris Life Sciences Luxembourg Holdings, S.A.R.L. | Biomarker compositions and methods |
Family Cites Families (10)
| Publication number | Priority date | Publication date | Assignee | Title |
|---|---|---|---|---|
| US4935342A (en) * | 1986-12-01 | 1990-06-19 | Syngene, Inc. | Method of isolating and purifying nucleic acids from biological samples |
| US5639606A (en) | 1993-04-06 | 1997-06-17 | The University Of Rochester | Method for quantitative measurement of gene expression using multiplex competitive reverse transcriptase-polymerase chain reaction |
| FR2788780B1 (en) | 1999-01-27 | 2001-03-30 | Ap Cells Inc | PROCESS FOR THE PREPARATION OF MEMBRANE VESICLES |
| GB9927320D0 (en) | 1999-11-18 | 2000-01-12 | Chiron Spa | Exosome separation |
| US6812023B1 (en) | 2000-04-27 | 2004-11-02 | Anosys, Inc. | Methods of producing membrane vesicles |
| DK2245199T3 (en) | 2008-02-01 | 2014-02-03 | Gen Hospital Corp | APPLICATION OF MICROVESCIES IN DIAGNOSTICATION, PROGRAMMING AND TREATMENT OF MEDICAL DISEASES AND CONDITIONS |
| WO2010065765A2 (en) * | 2008-12-04 | 2010-06-10 | Aethlon Medical, Inc. | Affinity capture of circulating biomarkers |
| US20120077263A1 (en) * | 2009-06-05 | 2012-03-29 | Mayo Foundation For Medical Education And Research | Methods and materials for isolating exosomes |
| US20130323756A1 (en) * | 2010-07-07 | 2013-12-05 | Aethlon Medical, Inc. | Methods and compositions for quantifying exosomes |
| EP2638057B1 (en) * | 2010-11-10 | 2019-03-06 | Exosome Diagnostics, Inc. | Method for isolation of nucleic acid containing particles and extraction of nucleic acids therefrom |
-
2014
- 2014-01-03 CN CN201480002901.2A patent/CN105026911B/en active Active
- 2014-01-03 JP JP2015551774A patent/JP6449781B2/en active Active
- 2014-01-03 US US14/759,238 patent/US20150353920A1/en not_active Abandoned
- 2014-01-03 AU AU2014203987A patent/AU2014203987B2/en active Active
- 2014-01-03 BR BR112015016136A patent/BR112015016136A2/en not_active IP Right Cessation
- 2014-01-03 MX MX2015008727A patent/MX366153B/en active IP Right Grant
- 2014-01-03 CA CA2897207A patent/CA2897207C/en active Active
- 2014-01-03 CN CN201910000819.0A patent/CN110106229B/en active Active
- 2014-01-03 WO PCT/US2014/010173 patent/WO2014107571A1/en active Application Filing
- 2014-01-03 EP EP14735397.3A patent/EP2941629B1/en active Active
- 2014-01-03 EP EP18199291.8A patent/EP3499212B1/en active Active
-
2015
- 2015-07-03 MX MX2019007742A patent/MX2019007742A/en unknown
- 2015-07-05 IL IL239786A patent/IL239786B/en active IP Right Grant
-
2016
- 2016-05-11 HK HK16105369.4A patent/HK1217365A1/en unknown
-
2018
- 2018-04-20 AU AU2018202789A patent/AU2018202789B2/en active Active
-
2019
- 2019-06-19 IL IL267526A patent/IL267526B/en active IP Right Grant
-
2020
- 2020-06-05 US US16/893,966 patent/US20210171934A1/en active Pending
Patent Citations (5)
| Publication number | Priority date | Publication date | Assignee | Title |
|---|---|---|---|---|
| US5438128A (en) * | 1992-02-07 | 1995-08-01 | Millipore Corporation | Method for rapid purifiction of nucleic acids using layered ion-exchange membranes |
| JP2004105009A (en) * | 2002-09-13 | 2004-04-08 | Dojindo Laboratories | Reagent for separating nucleic acid comprising tetraphenylboron compound and method for separating nucleic acid using the same |
| CN102596177A (en) * | 2009-07-01 | 2012-07-18 | 阿昂梅迪克斯公司 | Microvesicles derived from nucleated, mammalian cells and use thereof |
| WO2012087241A1 (en) * | 2010-12-20 | 2012-06-28 | Agency For Science, Technology And Research | Method of purifying exosomes |
| WO2012174282A2 (en) * | 2011-06-16 | 2012-12-20 | Caris Life Sciences Luxembourg Holdings, S.A.R.L. | Biomarker compositions and methods |
Also Published As
| Publication number | Publication date |
|---|---|
| AU2018202789A1 (en) | 2018-05-10 |
| CA2897207C (en) | 2022-08-02 |
| MX2019007742A (en) | 2019-08-29 |
| MX2015008727A (en) | 2016-04-21 |
| IL267526A (en) | 2019-08-29 |
| CN105026911A (en) | 2015-11-04 |
| JP2016502862A (en) | 2016-02-01 |
| IL267526B (en) | 2020-10-29 |
| EP3499212A1 (en) | 2019-06-19 |
| EP3499212B1 (en) | 2020-08-12 |
| BR112015016136A2 (en) | 2017-07-11 |
| AU2018202789B2 (en) | 2020-01-02 |
| US20150353920A1 (en) | 2015-12-10 |
| CN105026911B (en) | 2019-01-22 |
| CN110106229A (en) | 2019-08-09 |
| IL239786A0 (en) | 2015-08-31 |
| WO2014107571A1 (en) | 2014-07-10 |
| MX366153B (en) | 2019-06-28 |
| EP2941629A4 (en) | 2017-03-22 |
| IL239786B (en) | 2019-07-31 |
| JP6449781B2 (en) | 2019-01-09 |
| US20210171934A1 (en) | 2021-06-10 |
| AU2014203987A1 (en) | 2015-08-20 |
| EP2941629B1 (en) | 2018-10-10 |
| HK1217365A1 (en) | 2017-01-06 |
| EP2941629A1 (en) | 2015-11-11 |
| CA2897207A1 (en) | 2014-07-10 |
| AU2014203987B2 (en) | 2018-01-25 |
Similar Documents
| Publication | Publication Date | Title |
|---|---|---|
| CN110106229B (en) | Method for isolating microvesicles | |
| AU2019250221B2 (en) | Methods for isolating microvesicles and extracting nucleic acids from biological samples | |
| US20210238582A1 (en) | Automated and manual methods for isolation of extracellular vesicles and co-isolation of cell-free dna from biofluids | |
| US11268085B2 (en) | Methods for isolating microvesicles and extracting nucleic acids from biological samples |
Legal Events
| Date | Code | Title | Description |
|---|---|---|---|
| PB01 | Publication | ||
| PB01 | Publication | ||
| SE01 | Entry into force of request for substantive examination | ||
| SE01 | Entry into force of request for substantive examination | ||
| GR01 | Patent grant | ||
| GR01 | Patent grant |