Disclosure of Invention
The invention aims to overcome the defects that the accuracy of lane line detection results is influenced by lane number change, lane line shielding, lane line abrasion and shadows projected on a road surface in the prior art, and provides a lane line detection method in a complex traffic environment, which is suitable for the lane line detection of various traffic environments.
In order to achieve the above purpose, the invention provides the following technical scheme:
a method of lane line detection in a complex traffic environment, the method comprising the steps of:
mapping a video sequence acquired by a camera to an aerial view containing road information by using an inverse projection method;
step two, performing gradient enhancement on the mapped aerial view;
extracting lane line candidate pixels from the gradient-enhanced overhead view by using an edge extraction method;
step four, fitting the lane line candidate pixels into a lane line by using a RANSC method of color constraint and geometric constraint;
step five, verifying the fitted lane line; taking the slope parameter of the lane line passing the verification as the geometric constraint for fitting the next lane line;
and sixthly, estimating the space position parameters of the lane lines by a least square method for the pixels of the lane lines passing the verification.
Preferably, the back projection method:
any point P (x, y is 0, z) on the road plane corresponds to P (r, c) in the image plane, and the color value of the point P is replaced by the color value of the point P to form an overhead view of the road plane; the correspondence between world coordinates (x, y) and image coordinates (r, c) is,
wherein the yaw angle and the roll angle of a camera shooting the video sequence are both 0 and the depression angle is
f is the focal length, H is the erection height, z is the horizontal distance from the P point to the imaging point, (r)
0,c
0) Is the principal point coordinates of the camera.
Preferably, the gradient enhancement method comprises:
using dynamically generated transition vectors [ w ]r,wg,wb]Determining a gray value y of the aerial view:
y=wrR+wgG+wbB (2)
wherein the ratio of (R,g, B) represent color values of red, green and blue, respectively; conversion vector [ wr,wg,wb]And updating by linear discriminant analysis, wherein a training set of the linear discriminant analysis is composed of the detected lane line pixels and the road surface pixels.
Preferably, the method for edge extraction comprises:
using two symmetric kernels KlAnd KrRespectively extracting a left edge gradient and a right edge gradient, wherein I is an IPM image;
the gray values of the pixels which are larger than the left edge and the right edge are larger than the gradient threshold value T, and the sum of the gradients of the left edge and the right edge is larger than the gradient threshold value TeThe pixels of (a) are used as lane line candidate pixels;
wherein the gradient threshold value TeDetermined by an adaptive threshold segmentation algorithm.
Preferably, the method for edge extraction further includes:
the entire edge map E (x, y) is traversed using two windows, removing noise blobs, i.e.,
wherein
And
line number T, which is the number of lines with edge values in the upper and lower windows respectively
uIs R
uThreshold value of (x, y), T
dIs R
dThreshold value of (x, y), T
udIs R
u(x, y) and R
d(x, y) andthe threshold value, ε (t), is a unit step function.
Preferably, the RANSC method includes:
a) hypothesis model generation: randomly sampling two points p and q with similar colors
(Rp-Rq)2+(Gp-Gq)2+(Bp-Bq)2<Tc (6)
Wherein, T
cA threshold for determining similar colors; straight line parameter composed of points p and q
Average RGB vector
b) And (3) geometric constraint verification: estimated straight line parameters
Is reduced to [ A ]
d,A
u],
Wherein a is determined by the estimation result of the previously fitted lane line or the previous frame, A0Is a slope threshold; if the parameters of the hypothesis model are not in the parameter range, returning to the step a) to regenerate the hypothesis model;
c) and (3) assuming model verification: calculating the sum of the distances between all lane line candidate pixels and the hypothesis model and the color consistency degree:
the first term represents the degree of distance coincidence, and the second term represents the degree of coincidence of the colors of R, G, and B; to D
tMaximum value of D
mAnd its corresponding set of candidate points, using minimumTwo-multiplication estimation of lane model parameters
Preferably, the method for verifying the lane line includes:
cutting out a lane line image from the aerial view:
wherein
I is an overhead view, r is 0,1
r-1,c=-N
c,...,0,...,N
c,n
rAnd n
cNumber of rows and columns of overhead view, respectively, and size of lane line image n
r×(2N
c+1);
Describing the appearance outline of the lane line in the cut lane line image by adopting a HoG characteristic diagram, and verifying whether the lane line exists in the lane line image by using a Support Vector Machine (SVM);
verifying whether the lane lines in the lane line image are solid lines or broken lines;
the color values of the lane line pixels are predicted as:
v=wr′R+w′gG+wb′B (12)
wherein [ wr′,w′g,wb′]Determining by a linear discriminant analysis method; after projection, the yellow and white lane markers pass through a color threshold TcolorTo distinguish.
Preferably, the method of estimating the coordinates of the vanishing point and recalculating the camera according to the vanishing point position comprises:
a pair of line segments (L)i,Lj) The intersection points of (c) obey a gaussian distribution in the image plane:
wherein (m)ij;x,mij;x) Is (L)i,Lj) Coordinates of the intersection ofijAs standard deviation:
wherein, tauiAs a line strength value, i.e. lane length liAnd width wiRatio of τi=liwi;αiFor a fitted lane line LiA classification confidence of (2);
the confidence probability voting function P (x, y) of the lane line is:
wherein N is the number of line segments.
Preferably, the coordinates of the vanishing point are estimated by using a confidence probability voting function of the lane line, and the shooting position and angle of the camera are recalculated according to the position of the vanishing point;
the location of the vanishing point can be estimated as:
V(x,y)=argmax(P(x,y)) (16)
abscissa of vanishing point
The pitch angle between the vehicle camera and the ground plane is updated as:
preferably, the fifth step further includes performing semantic recognition and classification according to the verification result of the fitted lane line: white solid line, white dotted line, yellow solid line, yellow dotted line.
Compared with the prior art, the invention has the beneficial effects that:
in the prior art, the lane line detection method only detects left and right lane lines, and verifies the fitted assumed lane line only through some geometric constraint conditions. The invention does not assume that the road surface has specific lane lines, but fits a plurality of lane lines according to the condition of the candidate pixels of the lane lines, then verifies the lane lines, removes false lane lines and does not miss the lane lines.
And the aerial view map is mapped to an aerial view which does not contain roadside buildings, trees and sky through an inverse projection method so as to eliminate irrelevant information comprising the roadside buildings, the trees and the sky.
And performing gradient enhancement on the mapped aerial view, converting the colored aerial view into a gray image, and increasing the contrast between the lane line pixels and other pixels.
And (4) carrying out edge extraction on the aerial view after gradient enhancement to obtain lane line candidate pixels so as to achieve the purposes of removing the influence of vehicles, roadbed and shadow and completely storing lane lines.
The lane line is fitted through the RANSC method of color constraint and geometric constraint, so that the model fitting of the lane line is more efficient.
The shooting position and angle of the camera are recalculated according to the position of the vanishing point, so that the condition that the shooting of the camera is influenced when the vehicle encounters an up-down slope and bumpy road conditions is overcome.
Detailed Description
The present invention will be described in further detail with reference to test examples and specific embodiments. It should be understood that the scope of the above-described subject matter is not limited to the following examples, and any techniques implemented based on the disclosure of the present invention are within the scope of the present invention.
The following describes a method for detecting a lane line in a complex traffic environment according to the present invention with reference to the accompanying drawings and specific embodiments.
The method for detecting the lane line in the complex traffic environment comprises the following steps in sequence:
step one, mapping a video sequence acquired by a camera to an aerial view containing road information by using an inverse projection method.
The vehicle is arranged on the front windshieldThe camera obtains a driving video sequence. Camera coordinate system X
c-Y
c-Z
cWith the world coordinate system X
w-Y
w-Z
WThe relationship between the two is shown in figure 1, and the longitudinal axis of the vehicle body is Z
WAxis, ground plane X
W-Z
WAnd (4) a plane. In order to ensure that the method for detecting the lane line does not lose generality, the implementation assumes that the imaging model of the camera is a pinhole model, the yaw angle and the roll angle of the camera are both 0, and the depression angle of the camera is
As shown in fig. 2.
In addition to lane lines, the onboard camera captures a lot of irrelevant information, such as vehicles on the road, trees and buildings near the lane. Detecting the entire image not only increases the amount of computation, but also increases the computational difficulty. Mapping the captured image to an aerial view will eliminate most of the irrelevant information and lane line extraction will therefore become more efficient.
The essence of the overhead view map is to find out that the corresponding point of any point P (x, y is 0, z) on the road plane is P (r, c) in the image plane, and replace the P-point color value with the P-point color value to form the overhead view of the road plane. At this time, the corresponding relation between the world coordinate (x, y) and the image coordinate (r, c) is,
where H is the height of the image point, z is the horizontal distance from P to the image point, f is the focal length, point (r)0, c0) Is the principal point coordinates of the camera.
And step two, performing gradient enhancement on the mapped aerial view.
The color aerial view is converted into a gray image by a gradient enhancement method so as to achieve the purpose of increasing the contrast between the lane line pixels and other pixels, and the gradient enhancement comprises the following steps:
s1, a color RGB image acquisition model is established for capturing RGB values of an image,
s2 dynamically generates a conversion vector based on the change in RGB values, converts a current frame of an image into a gray-scale image through the conversion vector to provide a maximum lane gradient,
s3, the lane line detection is performed on the converted gray-scale image, and training data is extracted,
s4, training and updating the conversion vector by adopting an LDA algorithm according to the training data, wherein the updated conversion vector comprises: the white lane gradient is enhanced and the yellow lane gradient is enhanced,
the above-described steps S2 to S4 are repeated for each frame of image of the video sequence, and the conversion is performed continuously.
In order to solve the problem of variable illumination conditions, the method adopts a conversion vector [ w ] generated dynamicallyr,wg,wb]Converting the color image into a grayscale image to produce maximum lane gradient, i.e. grayscale value y:
y=wrR+wgG+wbB (2)
the conversion vector is updated by Linear Discriminant Analysis (LDA), and a training set of the Linear Discriminant Analysis is composed of detected lane line pixels and road surface pixels. This ensures that the projected gray value y has the best separability between the lane line pixels and the road surface pixels.
And step three, extracting lane line candidate pixels from the gradient-enhanced overhead view by using an edge extraction method.
According to the fact that the gray value of a pixel on a lane line is higher than that of a left pixel and that of a pixel on a right pixel, an edge extraction rule of the lane line is provided, namely the gray value of the pixel which is larger than the gray values of the pixels on the left side and the right side at the same time is considered as a lane line pixel candidate when the sum of gradients of the left edge and the right edge is larger than a threshold value; wherein the threshold is determined by an adaptive threshold segmentation algorithm.
The ridge feature (gray-white-gray mode) of the lane line indicates that the gray value of the pixel on the lane line is higher than that of the left and right pixels thereof, so the edge extraction method defines two 5 × 5 symmetric kernels K as shown in fig. 3lAnd KrTo extract the left edge gradient and the right edge gradient, respectively, I is an IPM image.
The gray values of the pixels which are larger than the left edge and the right edge are larger than the gradient threshold value T, and the sum of the gradients of the left edge and the right edge is larger than the gradient threshold value TeAs the lane line candidate pixel.
The convolution calculation in equation (3) can be accelerated by the integral image method and the gradient threshold T is determined by the adaptive threshold segmentation algorithm, OTSU methode. However, this method may produce isolated small spots in addition to the true lane line edges. These noise spots increase the computational cost and affect the lane line fitting accuracy. The entire edge map E (x, y) is first traversed using two windows of size 3 × 5, and then by comparing Ru(x,y),Rd(x, y) and their sum and corresponding threshold Tu、TdAnd TudThe noise spots are removed, that is,
wherein
And
the line values of the edge values in the upper window and the lower window are respectively, and epsilon (t) is a unit step function.
The results of generating lane line candidate pixels using the ridge operator, Canny operator, and cLoG operator are shown in fig. 4. It can be seen that the ridge operator removes most of the edges of the vehicles, road bed and shadows, and the lane lines are relatively intact, compared to the Canny operator and the cLoG operator.
And step four, fitting the lane line candidate pixels into the lane line by using a RANSC method of color constraint and geometric constraint.
Random Sample Consensus (RANSC) has a great advantage in lane line model fitting. Since the pixels of the lane line should have similar colors, estimating the lane line model using the pixels of similar colors will greatly reduce the number of iterations of RANSAC. In addition, in most cases, there is more than one lane line on the road, and the RANSC will be used for extracting the lane lines many times, and the lane lines are actually parallel to each other, so using the parameters of the previously estimated lane lines to constrain the subsequent estimation will also greatly reduce the number of iterations of RANSC. Even because the lane line difference between the two frames should be small, the parameter range can be reduced. With the two constraint conditions, the lane line model fitting is more efficient. On the basis, a double-constraint RANSAC (D-RANSAC) algorithm is provided. The algorithm consists of T cycles, each cycle comprising,
a) hypothesis model generation: randomly sampling two points p and q with similar colors
(Rp-Rq)2+(Gp-Gq)2+(Bp-Bq)2<Tc (6)
Wherein (R, G, B) represent color values of red, green and blue, respectively. Wherein, T
tA threshold for determining similar colors; straight line parameter composed of points p and q
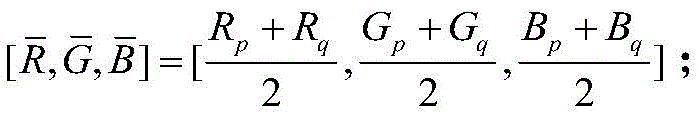
Thus, average RGB vector
b) And (3) geometric constraint verification: since the difference in slope parameter between lane lines in the same frame image should be small, the estimated straight line parameter
Is reduced to [ A ]
d,A
u],
Wherein a is determined by the estimation result of the previously fitted lane line or the previous frame, A0Is a slope threshold. If the parameters of the hypothesis model are not in the parameter range, the hypothesis is considered to be incorrect, and the step a) is returned to regenerate the hypothesis model;
c) and (3) assuming model verification: the sum of the distances and the color consistency degrees between all the lane line candidate pixels and the hypothesis model is calculated, as shown in formula (8). The first term in equation (8) measures the degree of distance coincidence, and the second term measures the degree of coincidence of R, G, and B colors.
Finally, find D
tMaximum value of D
mAnd its corresponding candidate point set, and then estimating the lane model parameters using Least Square (LS) method
Step five, verifying the fitted lane line; and taking the slope parameter of the verified lane line as the geometric constraint for fitting the next lane line.
Verifying the lane lines and performing semantic identification and classification; the slope parameter feedback of the verified lane line is the geometric constraint of the D-RANSC;
since the number of visible lane lines is not fixed in actual traffic conditions, most existing methods detect only the left and right lane lines of the main lane or a fixed number of lane lines. When there is much noise and interference in the candidate pixels, neither the lane line detection accuracy nor the detection rate is optimistic. Therefore, the result of lane line detection greatly depends on the accuracy of generation of the lane line candidates. In fact, in the overhead view, there are still some objects geometrically similar to the lane lines, such as road signs, guardrails, certain parts on the vehicle, etc., which means that the correctness of the detection cannot be guaranteed. Fig. 5(a) shows the lane line fitting result of the overhead view, in which the number of lane lines to be fitted is fixed to 4. There are two visible virtual lane lines and one visible real lane line in the overhead view. It can be seen that the flower bed next to the real lane line is also detected as the lane line because it is parallel to the lane and similar in edge. In addition, identifying the type of lane line may also help the driver learn its underlying semantics to avoid driving violations. Therefore, to solve these problems, the method adds steps of lane verification and semantic recognition.
Different shapes of lane lines indicate different meanings. In fact, the types of lane lines are simply white/yellow, real/virtual lane lines and combinations thereof. Thus, the method divides the task into three steps. Firstly, verifying the fitted lane line hypothesis, then dividing the lane line into a solid line and a dotted line, and finally determining the color of the lane line. This may further improve the accuracy of lane line detection and may identify the underlying semantics of the lane line.
Since the lane lines have a fixed texture profile feature, we first crop out the lane line image from the overhead view, which is derived from N of the lane line model estimated in the previous stepcThe pixel composition within the pixel width is as follows:
wherein
I is an overhead view, r is 0,1
r-1,c=-N
c,...,0,...,N
c,n
rAnd n
cThe number of rows and columns, respectively, of the overhead view, so that the size of the lane line image is n
r×(2N
c+1). Herein
N c5. After clipping according to equation (2-21), the slope of the lane line is corrected, and thus the inter-class variance of the lane line image is reduced.
The HoG feature is used for describing the appearance outline of the lane line due to the strong appearance outline expression capability of the HoG feature. Fig. 5(b) shows the detected lane line image L and its corresponding HoG feature map F, and it can be seen that the HoG feature maps of the real lane line, the virtual lane line and the edge of the flower bed are distinguishable even when the lane line is partially blocked by the vehicle. Due to its powerful classification capability, the Support Vector Machine (SVM) is used to perform lane line verification (see equation (10)) and solid/dashed line differentiation (see equation (11)).
Fig. 6 shows the distribution of the yellow and white lane line pixels in the RGB space, indicating that the yellow and white lane line pixels are separable in the RGB space. The color values of the lane line pixels can be predicted as:
v=wr′R+w′gG+wb′B (12)
wherein [ wr′,w′g,wb′]Determined by linear discriminant analysis. After projection, the yellow and white lane markers are distributed in different areas, as shown in fig. 7. Thus, they may pass through the color threshold TcolorTo distinguish (as shown in fig. 8), the color threshold is the balance point of the error rates of the two lane-like markings.
Using equation (12) and color threshold TcolorThe colors of M pixels randomly selected from the lane lines are recognized, and the colors of the lane lines are determined by voting. Thus, the shadow and stain on the lane line have less influence on the lane color recognition.
And sixthly, estimating the space position parameters of the lane lines by a least square method for the pixels of the lane lines passing the verification.
As the vehicle travels, it is inevitable to go downhill and uphill, or encounter bumpy road conditions, and therefore the pitch angle of the camera will change. Obviously, a wrong pitch angle has a negative effect on the back-projection result. When the pitch angle used in the back projection is very different from the true value, the lane line will not be parallel in the top view (as shown in fig. 9), which will cause the geometric constraint of the lane line to be invalid, and thus it is necessary to update the pitch angle. The method maps the lane line pixels detected in the overhead view to an image coordinate system, then uses a least square method to estimate the lane line parameters in the perspective view, and finally uses an improved confidence probability voting function of the lane line to estimate the coordinates of the vanishing points.
Suppose a pair of line segments (L)i,Lj) The intersection points of (a) are considered to follow a gaussian distribution in the image plane, as shown in equation (13):
wherein (m)ij;x,mij;x) Is (L)i,Lj) Coordinates of the intersection ofijIs the standard deviation of the measured data to be measured,
wherein, tauiAs a line strength value, i.e. lane length liAnd width wiRatio of τi=liwi;αiIs a line segment LiThe classification confidence of the lane line is given by a lane line verification function (see equation (10)). Thus, for a pair of line segments with higher line segment intensity values and lane line classification confidence, the gaussian model described in equation (13) has a sharper and narrower distribution, that is, (m)ij;x,mij;x) The probability of being a vanishing point is higher. Thus, the confidence probability voting function P (x, y) for a lane line is:
wherein N is the number of line segments. The location of the last vanishing point can be estimated as,
V(x,y)=argmax(P(x,y)) (16)
due to the abscissa of the vanishing point
Thus, the pitch angle between the vehicle camera and the ground plane is
The present embodiment was verified in different traffic environments (e.g., rush hour, low light and rainy day). The test environment is divided into four cases of 'simple', 'crowded', 'poorly illuminated' and 'multi-labeled' according to different traffic environments. Wherein the simple condition is that the lane lines are clearly visible and the traffic flow is less; the 'crowded' condition is that the vehicles coming and going are dense, and the lane line has more shelters; a "poorly illuminated" condition is a vehicle traveling in a tunnel with poor lighting. A "multi-marking" situation is a road surface with a large number of other road traffic markings (e.g., arrow-shaped road markings, zebra stripes, warning markings, etc.) and a dense concentration of vehicles coming and going. The accuracy and recall are used to evaluate lane line detectors on the data sets mentioned in this section.
Wherein TP, FP and FN refer to the number of detected positive samples (Truth positive), the number of False detections (False positive) and the number of missed detections (False negative), respectively. Higher accuracy rates indicate less false positives and higher recall rates indicate less missed positives.
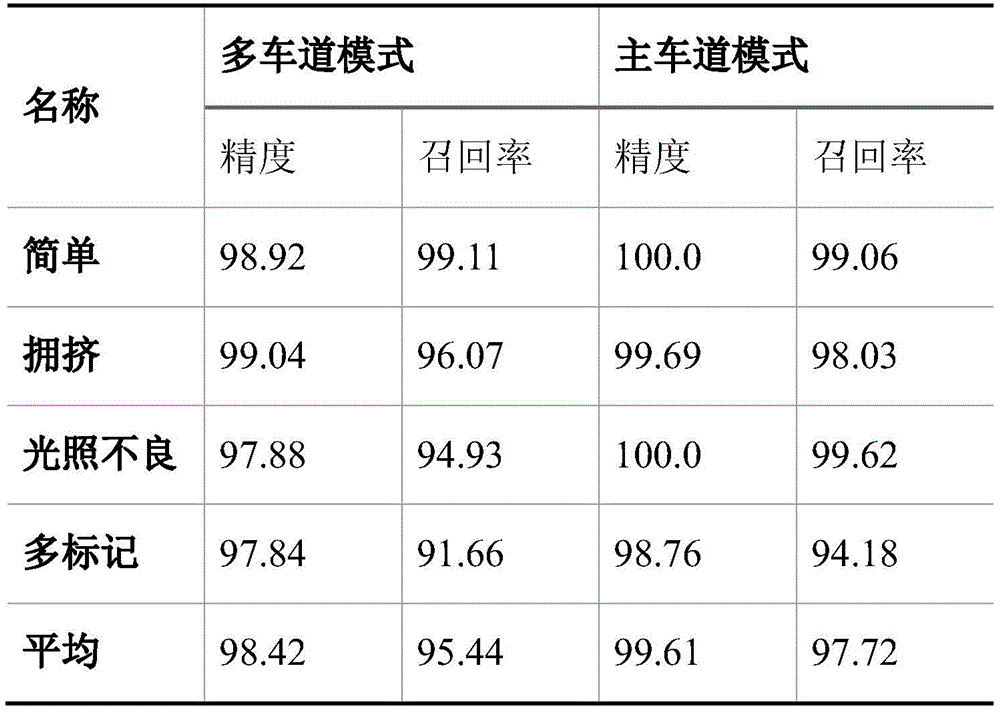
Table 1 shows the accuracy and recall ratio of lane line detection algorithm in both multilane and primary lane modes
Table 1 shows the accuracy and recall of the multilane mode and the main lane mode on the test set by the method. It can be seen that the accuracy and recall in the main lane mode are substantially higher than in the multi-lane mode, since the main lane line is clearer, there is relatively less obstruction, and there is some a priori knowledge of the lane lines with respect to the number and location of the lanes. Since most lane lines in the "easy" subset are clearly visible and less disturbing, the detection accuracy and recall rate is satisfactory whether in the main lane mode or in the multi-lane mode. In the main lane mode, the detection accuracy and recall rate of the 'tunnel' subset are much higher than those of the multi-lane mode, which is the reason why the main lane has stronger light and is less obstructed and interfered than other lanes. Due to the large number of occlusion cases in the "crowded" subset, the detection recall rate is slightly lower than for the "simple subset". Because a large amount of shelters exist in the 'multi-mark' subset, and other road marks (such as guide marks, Chinese characters, zebra stripes and the like) with similar characteristics to the lane lines exist on the road surface, the recall rate of the 'multi-mark' subset is lower than that of other subsets. Surprisingly, the detection accuracy of the four subsets does not differ much, which means that the algorithm can filter most of the false detection results. Although we want the higher the accuracy the better, the higher the recall the better, in practice the two are contradictory, so the accuracy-recall curve is more illustrative of the performance of the detection algorithm. Fig. 10 depicts a detection accuracy-recall curve of a lane line. FIG. 11 further depicts accuracy-recall curves for real and imaginary lane lines. Obviously, the recall rate of the real lane line is higher than that of the virtual lane line under the same detection precision, because the shape of the virtual lane line is more diversified and is more similar to other lane marks, especially the guide mark.
In the semantic recognition task, the recognition rate of the real lane line is as important as the recognition rate of the virtual lane line, so the semantic discrimination performance is evaluated by the recall rate of the real lane line, and the total recall rate, which is actually the accuracy (accuracy), that is,
wherein TS, TB, FS, and FB refer to the number of correctly detected real lane lines, the number of correctly detected virtual lane lines, the number of erroneously detected real lane lines, and the number of erroneously detected virtual lane lines, respectively. As shown in fig. 12, as the classifier threshold increases, the recall rate of the virtual lane line increases, the recall rate of the real lane line decreases, and the accuracy rate increases and decreases. Therefore, it is most appropriate to select the threshold corresponding to the maximum accuracy.
As shown in table 2, the recall rate of the real lane lines is lower than that of the virtual lane lines, especially in the "congested" subset and the "multi-marked" subset. This is because the real lane line exists in an intermittent form when being blocked, which is similar to the virtual lane line and is easily mistakenly identified as the virtual lane line.
TABLE 2 Lane line semantic identification Performance
Fig. 13 shows lane line detection and semantic recognition results on the test set, respectively, a "simple" subset such as fig. 13(a), "tunnel" subset such as fig. 13(b), "crowded" subset such as fig. 13(c), "multi-labeled" subset such as fig. 13(D), where the first column of images is an original image captured by the vehicle-mounted camera, the second column of images is a lane line detection result in an overhead view, and the third column of images is a lane line detection and semantic recognition result in the original image, where letters "S", "D", "W", and "Y" respectively represent a solid line, a dotted line, a white line, and a yellow line, and numbers represent confidence degrees of the lane lines. As shown in the figure, the method can reliably detect the lane lines and identify the semantics thereof in complex traffic environments, no matter whether the lane lines are clear, the situation of little occlusion, or a large amount of shadow, or poor lighting conditions, or the situation of dense traffic, or complex road surface marks.