CN109074430B - Molecular marker counting adjustment method - Google Patents
Molecular marker counting adjustment method Download PDFInfo
- Publication number
- CN109074430B CN109074430B CN201780028283.2A CN201780028283A CN109074430B CN 109074430 B CN109074430 B CN 109074430B CN 201780028283 A CN201780028283 A CN 201780028283A CN 109074430 B CN109074430 B CN 109074430B
- Authority
- CN
- China
- Prior art keywords
- molecular markers
- sequencing
- target
- molecular
- targets
- Prior art date
- Legal status (The legal status is an assumption and is not a legal conclusion. Google has not performed a legal analysis and makes no representation as to the accuracy of the status listed.)
- Active
Links
Images


Classifications
-
- G—PHYSICS
- G06—COMPUTING; CALCULATING OR COUNTING
- G06K—GRAPHICAL DATA READING; PRESENTATION OF DATA; RECORD CARRIERS; HANDLING RECORD CARRIERS
- G06K19/00—Record carriers for use with machines and with at least a part designed to carry digital markings
- G06K19/06—Record carriers for use with machines and with at least a part designed to carry digital markings characterised by the kind of the digital marking, e.g. shape, nature, code
- G06K19/06009—Record carriers for use with machines and with at least a part designed to carry digital markings characterised by the kind of the digital marking, e.g. shape, nature, code with optically detectable marking
- G06K19/06018—Record carriers for use with machines and with at least a part designed to carry digital markings characterised by the kind of the digital marking, e.g. shape, nature, code with optically detectable marking one-dimensional coding
- G06K19/06028—Record carriers for use with machines and with at least a part designed to carry digital markings characterised by the kind of the digital marking, e.g. shape, nature, code with optically detectable marking one-dimensional coding using bar codes
-
- G—PHYSICS
- G16—INFORMATION AND COMMUNICATION TECHNOLOGY [ICT] SPECIALLY ADAPTED FOR SPECIFIC APPLICATION FIELDS
- G16B—BIOINFORMATICS, i.e. INFORMATION AND COMMUNICATION TECHNOLOGY [ICT] SPECIALLY ADAPTED FOR GENETIC OR PROTEIN-RELATED DATA PROCESSING IN COMPUTATIONAL MOLECULAR BIOLOGY
- G16B30/00—ICT specially adapted for sequence analysis involving nucleotides or amino acids
-
- G—PHYSICS
- G16—INFORMATION AND COMMUNICATION TECHNOLOGY [ICT] SPECIALLY ADAPTED FOR SPECIFIC APPLICATION FIELDS
- G16B—BIOINFORMATICS, i.e. INFORMATION AND COMMUNICATION TECHNOLOGY [ICT] SPECIALLY ADAPTED FOR GENETIC OR PROTEIN-RELATED DATA PROCESSING IN COMPUTATIONAL MOLECULAR BIOLOGY
- G16B40/00—ICT specially adapted for biostatistics; ICT specially adapted for bioinformatics-related machine learning or data mining, e.g. knowledge discovery or pattern finding
- G16B40/10—Signal processing, e.g. from mass spectrometry [MS] or from PCR
Abstract
Disclosed herein are methods and systems for determining the number of targets. In some embodiments, the method comprises: randomly barcoding the target with a random barcode; obtaining sequencing data; for one or more of these targets: counting the number of molecular markers having different sequences associated with the target in the sequencing data; clusters of molecular markers that identify the target using directional adjacency; folding the sequencing data using clusters of molecular markers of the identified targets; and estimates the number of targets.
Description
Cross Reference to Related Applications
Priority of united states provisional patent number 62/342137 filed 2016, 5, 26, 2016, 8, 31, 2016, and united states provisional patent number 62/381945 filed 2016, 9, 29, each of which is hereby expressly incorporated herein by reference in its entirety, as required by 35 u.s.c. § 119 (e).
Background
Technical Field
The present disclosure relates generally to the field of molecular barcodes, and more specifically to the use of molecular markers to correct PCR and sequencing errors.
Description of the related Art
Methods and techniques such as stochastic barcoding are useful for cell analysis, particularly to determine the status of cells using, for example, reverse transcription, Polymerase Chain Reaction (PCR) amplification, and Next Generation Sequencing (NGS) to decipher gene expression profiles. However, these methods and techniques may introduce errors (such as substitution errors (including one or more bases) and non-substitution errors) that if uncorrected may result in an overestimated molecular count. Therefore, methods and techniques are needed that can correct various errors to obtain accurate molecular counts estimated using stochastic barcoding.
Disclosure of Invention
Disclosed herein are methods for determining the number of targets. In some embodiments, the method comprises: (a) randomly barcoding a plurality of targets using a plurality of random barcodes, wherein each of the plurality of random barcodes comprises a molecular marker, to create a plurality of randomly barcoded targets; (b) obtaining sequencing data for randomly barcoded targets; and (c) for one or more of the plurality of targets: (i) counting the number of molecular markers having different sequences associated with the target in the sequencing data; (ii) determining a quality status of the target in the sequencing data obtained in (b); (iii) determining one or more sequencing data errors in the sequencing data obtained in (b), wherein determining one or more sequencing data errors in the sequencing data comprises determining one or more of: the number of molecular markers having different sequences associated with the target in the sequencing data, the mass status of the target in the sequencing data, the number of molecular markers having different sequences in the plurality of random barcodes; and (iv) estimating the number of targets, wherein the estimated number of targets is correlated with the number of molecular markers having different sequences associated with the targets in the sequencing data counted in (i) adjusted for one or more sequencing data errors determined in (iii). Steps (i), (ii), (iii), and (iv) may be performed on each of the plurality of targets. The method may be multiplexed.
In some embodiments, the method further comprises: folding the sequencing data obtained in (b) prior to determining one or more sequencing data errors. Folding the sequencing data obtained in (b), comprising: copies of a target having a similar molecular signature and an occurrence that is less than a predetermined fold occurrence threshold are designated as having the same molecular signature for the plurality of targets, wherein two copies of a target have a similar molecular signature if their molecular signatures differ in sequence by at least one base.
In some embodiments, the predetermined fold occurrence threshold may be 7 if the stochastic barcode contains about 6561 molecular markers with different sequences. If the stochastic barcode contains about 65536 molecular labels with different sequences, the predetermined fold occurrence threshold may be 17. Two copies of a target have similar molecular markers if the molecular markers of the two copies differ in sequence by at least one base. In some embodiments, the molecular tag comprises 5-20 nucleotides. The molecular markers of different stochastic barcodes may be different from each other. The plurality of random barcodes comprises about 6561 molecular markers with different sequences. The plurality of random barcodes comprises about 65536 molecular markers with different sequences.
In some embodiments, the sequencing data comprises sequences having a plurality of targets that read at 50 or more nucleotides in length. The sequencing data comprises sequences of a plurality of targets having read lengths of 75 or more nucleotides. The sequencing data comprises sequences of a plurality of targets having read lengths of 100 or more nucleotides. (b) The sequencing data obtained in (a) may be generated by Polymerase Chain Reaction (PCR) amplification of a plurality of randomly barcoded targets.
In some embodiments, the one or more sequencing data errors may be PCR-introduced errors, sequencing-introduced errors, errors caused by barcode contamination, library preparation errors, or any combination thereof. The PCR-introduced error can be the result of PCR amplification errors, PCR amplification bias, PCR underamplification, or any combination thereof. Sequencing-induced errors can be the result of imprecise base calls, insufficient sequencing, or any combination thereof.
In some embodiments, the mass status of the target in the sequencing data can be full sequencing, incomplete sequencing, or saturated sequencing. The mass status of the target in the sequencing data can be determined by the number of molecular markers having different sequences in the plurality of stochastic barcodes and the number of molecular markers having different sequences associated with the target in the counted sequencing data. The quality status of the target in the sequencing data can be classified as incomplete sequencing if the quality status of the target in the sequencing data obtained in (b) is not complete sequencing and is not saturated sequencing.
In some embodiments, the full sequencing quality status can be determined by a dispersion index relative to the poisson distribution that is greater than or equal to a predetermined full sequencing discrete threshold, wherein the predetermined full sequencing discrete threshold can be 0.9, 1, or 4. The full sequencing quality status may further be determined by the molecular marker having an occurrence that is greater than or equal to a predetermined full sequencing occurrence threshold in the sequencing data obtained in (b), wherein the predetermined full sequencing occurrence threshold may be 10 or 18.
In some embodiments, the saturated sequencing quality status can be determined by targets having a number of molecular markers with different sequences that is greater than a predetermined saturation threshold. The saturated sequencing quality status can be further determined by another target of the plurality of targets having a number of molecular markers having different sequences greater than a predetermined saturation threshold. If the stochastic barcode contains about 6561 molecular labels with different sequences, the predetermined saturation threshold may be 6557. If the stochastic barcode contains about 65536 molecular labels with different sequences, the predetermined saturation threshold may be 65532.
In some embodiments, the number of molecular markers having different sequences associated with the target in the sequencing data counted in (i) is adjusted in (iv) by: determining all of the sub-molecular markers for one or more of the parent molecular markers if the target has a complete sequencing quality status; performing a first statistical analysis of the at least one daughter molecular marker and the parent molecular marker; and attributing the occurrence of the child molecular marker to the parent molecular marker if subjected to the null hypothesis of the first statistical analysis.
In some embodiments, the one or more parent molecular markers comprise a molecular marker having an occurrence greater than or equal to a predetermined full sequencing parent threshold, wherein the predetermined full sequencing parent threshold is equal to a predetermined full sequencing occurrence threshold. The daughter molecular markers comprise molecular markers that differ from the parent molecular marker by one base and occur with a full sequencing subthreshold less than or equal to a predetermined full sequencing subthreshold, wherein the predetermined full sequencing subthreshold can be 3 or 5. The zero hypothesis of the first statistical analysis may be accepted if the probability that the zero hypothesis is true is lower than the false discovery rate, wherein the false discovery rate is 5% or 10%. The first statistical analysis may be a multiple two-term test.
In some embodiments, the number of molecular markers having different sequences associated with the target in the sequencing data counted in (i) is adjusted in (iv) by: defining a threshold for molecular markers of the target to determine true molecular markers and false molecular markers associated with the target in the sequencing data obtained in (b) if the target has a complete sequencing quality status. Defining a threshold value for the molecular marker of the target comprises performing a second statistical analysis on the molecular marker of the target.
In some embodiments, performing the second statistical analysis comprises: fitting the molecular markers of the target and their occurrence distributions to two poisson distributions; determining the number n of authentic molecular markers using two poisson distributions; and removing false molecular markers from the sequencing data obtained in (b), wherein the false molecular markers comprise molecular markers having an occurrence that is lower than the nth most abundant molecular marker, and wherein the true molecular markers comprise molecular markers having an occurrence that is greater than or equal to the nth most abundant molecular marker. The two poisson distributions comprise a first poisson distribution corresponding to a true molecular marker, and a second poisson distribution corresponding to a false molecular marker.
In some embodiments, the number of molecular markers having different sequences associated with the target in the sequencing data counted in (i) may be determined in (iv) by: determining whether the target in the sequencing data obtained in (b) is noise if the quality status of the target in the sequencing data obtained in (b) is an incomplete sequencing quality status; and removing noise targets from the sequencing data obtained in (b). A noisy target can be noisy if its molecular markers appear less than or equal to an incomplete sequencing noisy target threshold, wherein the incomplete sequencing noisy gene threshold is 5. The incomplete sequencing noise target threshold may be equal to the median or mean occurrence of molecular markers for multiple targets with a fully sequenced mass state.
In some embodiments, the number of molecular markers having different sequences associated with the target in the sequencing data counted in (i) may be determined in (iv) by: defining a threshold for molecular markers of the target to determine true molecular markers and false molecular markers in the sequencing data obtained in (b) if the quality status of the target in the sequencing data obtained in (b) is an incomplete sequencing quality status.
In some embodiments, defining a threshold value for the molecular marker of the target comprises performing a third statistical analysis on the molecular marker. Performing a third statistical analysis on the molecular marker comprises: determining the number n of true molecular markers by using a zero-truncation Poisson model; and removing false molecular markers from the sequencing data obtained in (b), wherein the false molecular markers comprise molecular markers having an occurrence that is lower than the nth most abundant molecular marker, and wherein the true molecular markers comprise molecular markers having an occurrence that is greater than or equal to the nth most abundant molecular marker.
In some embodiments, at least 50% or 80% of the molecular markers in the sequencing data obtained in (b) may be retained after adjusting the sequencing data counted in (i) for one or more sequencing data errors determined in (iii).
In some embodiments, randomly barcoding the plurality of targets comprises hybridizing a plurality of random barcodes to the plurality of targets to create randomly barcoded targets. Randomly barcoding the plurality of targets includes generating an indexed library of randomly barcoded targets. Generating an indexed library of randomly barcoded targets can be performed with a solid support comprising a plurality of random barcodes. The solid support comprises a plurality of synthesized particles associated with a plurality of random barcodes. The solid support comprises a plurality of random barcodes in two or three dimensions. The solid support comprises a polymer, a matrix, a hydrogel, a needle array device, an antibody, or any combination thereof.
In some embodiments, each of the plurality of stochastic barcodes comprises one or more of a sample label, a universal label, and a cell label, wherein the sample label can be the same for the plurality of stochastic barcodes on the solid support, wherein the universal label can be the same for the plurality of stochastic barcodes on the solid support and the cell label can be the same for the plurality of stochastic barcodes on the solid support. The sample tag comprises 5-20 nucleotides. The universal label comprises 5-20 nucleotides. The cell marker comprises 5-20 nucleotides.
In some embodiments, the synthetic particles may be beads. The beads may be silica gel beads, controlled pore glass beads, magnetic beads, dynabeads, sephadex/agarose beads, beaded cellulose, polystyrene beads, or any combination thereof.
In some embodiments, a plurality of targets may be included in a sample. The sample comprises one or more cells. The sample may be a single cell. The one or more cells comprise one or more cell types. At least one of the one or more cell types is a brain cell, a heart cell, a cancer cell, a circulating tumor cell, an organ cell, an epithelial cell, a metastatic cell, a benign cell, a primary cell, a circulating cell, or any combination thereof.
In some embodiments, the plurality of targets comprises ribonucleic acids (RNAs), messenger RNAs (mrnas), micrornas, small interfering RNAs (sirnas), RNA degradation products, RNAs each containing a poly (a) tail, or any combination thereof.
In some embodiments, the method may further comprise lysing the one or more cells. Lysing the one or more cells comprises heating the sample, contacting the sample with a detergent, changing the pH of the sample, or any combination thereof.
Disclosed herein are methods for determining the number of targets. In some embodiments, the method comprises: (a) randomly barcoding a plurality of targets using a plurality of random barcodes, wherein each of the plurality of random barcodes comprises a molecular marker, to create a plurality of randomly barcoded targets; (b) obtaining sequencing data for randomly barcoded targets; and (c) for one or more of the plurality of targets: (i) counting the number of molecular markers having different sequences associated with the target in the sequencing data; (ii) clusters of molecular markers that identify the target using directional adjacency; (iii) (iii) folding the sequencing data obtained in (b) using clusters of molecular markers of the target identified in (ii); and (iv) estimating the number of targets, wherein after folding the sequencing data in (ii), the estimated number of targets is correlated with the number of molecular markers having different sequences associated with the targets in the sequencing data counted in (i). The plurality of targets comprises targets of the entire transcriptome of the cell.
In some embodiments, the molecular markers of the targets in the cluster are within a predetermined orientation adjacency threshold of each other. The directional adjacency threshold is a Hamming distance (Hamming distance). The molecular markers of the targets within a cluster comprise one or more parent molecular markers and sub-molecular markers of the one or more parent molecular markers, wherein the occurrence of the parent molecular markers is greater than or equal to a predetermined orientational adjacency occurrence threshold. The predetermined directional adjacency occurrence threshold may be twice-1 as large as the occurrence of the sub-molecular label.
In some embodiments, the folding of the sequencing data obtained in (b) using clusters of molecular markers of the target identified in (ii) comprises: the appearance of the daughter molecular markers was attributed to the parent molecular markers.
In some embodiments, the method may further comprise: determining the sequencing depth of the target. (ii) if the sequencing depth of the target is above a predetermined sequencing depth threshold, estimating the number of targets comprises adjusting the sequencing data counted in (i). The predetermined sequencing depth threshold may be between 15 and 20. (ii) adjusting the sequencing data counted in (i) comprises: defining a threshold for molecular markers of the target to identify true molecular markers and false molecular markers associated with the target in the sequencing data obtained in (b). Defining a threshold value for the molecular marker of the target comprises performing a statistical analysis of the molecular marker of the target. Performing the statistical analysis comprises: fitting the molecular markers of the target and their occurrence distributions to two poisson distributions; determining the number n of authentic molecular markers using two poisson distributions; and removing false molecular markers from the sequencing data obtained in (b), wherein the false molecular markers comprise molecular markers having an occurrence that is lower than the nth most abundant molecular marker, and wherein the true molecular markers comprise molecular markers having an occurrence that is greater than or equal to the nth most abundant molecular marker.
Disclosed herein is a computer system for determining the number of targets. In some embodiments, the computer system comprises: a computer readable memory storing executable instructions; and one or more computer processors in communication with the computer-readable memory, wherein the one or more computer processors are programmed with executable instructions to (a) randomly barcode a plurality of targets using a plurality of random barcodes, wherein each of the plurality of random barcodes comprises molecular markers, to create a plurality of randomly barcoded targets; (b) obtaining sequencing data for randomly barcoded targets; and (c) for one or more of the plurality of targets: (i) counting the number of molecular markers having different sequences associated with the target in the sequencing data; (ii) determining a quality status of the target in the sequencing data obtained in (b); (iii) determining one or more sequencing data errors in the sequencing data obtained in (b), wherein determining one or more sequencing data errors in the sequencing data comprises determining one or more of: the number of molecular markers having different sequences associated with the target in the sequencing data, the mass status of the target in the sequencing data, the number of molecular markers having different sequences in the plurality of random barcodes; and (iv) estimating the number of targets, wherein the estimated number of targets is correlated with the number of molecular markers having different sequences associated with the targets in the sequencing data counted in (i) adjusted for one or more sequencing data errors determined in (iii). Performing steps (i), (ii), (iii), and (iv) for each of the plurality of targets. Steps (a), (b), (c), (i), (ii), (iii), and (iv) may be multiplexed.
In some embodiments, the executable instructions may further program the one or more computer processors to: folding the sequencing data obtained in (b) prior to determining one or more sequencing data errors. Folding the sequencing data obtained in (b), comprising: copies of a target having a similar molecular signature and an occurrence that is less than a predetermined fold occurrence threshold are designated as having the same molecular signature for the plurality of targets, wherein two copies of a target have a similar molecular signature if their molecular signatures differ in sequence by at least one base.
In some embodiments, the predetermined fold occurrence threshold may be 7 if the stochastic barcode contains about 6561 molecular markers with different sequences. If the stochastic barcode contains about 65536 molecular labels with different sequences, the predetermined fold occurrence threshold may be 17. Two copies of a target have similar molecular markers if the molecular markers of the two copies differ in sequence by at least one base. In some embodiments, the molecular tag comprises 5-20 nucleotides. The molecular markers of different stochastic barcodes may be different from each other. The plurality of random barcodes comprises about 6561 molecular markers with different sequences. The plurality of random barcodes comprises about 65536 molecular markers with different sequences.
In some embodiments, the sequencing data comprises sequences having a plurality of targets that read at 50 or more nucleotides in length. The sequencing data comprises sequences of a plurality of targets having read lengths of 75 or more nucleotides. The sequencing data comprises sequences of a plurality of targets having read lengths of 100 or more nucleotides. (b) The sequencing data obtained in (a) may be generated by Polymerase Chain Reaction (PCR) amplification of a plurality of randomly barcoded targets.
In some embodiments, the one or more sequencing data errors may be PCR-introduced errors, sequencing-introduced errors, errors caused by barcode contamination, library preparation errors, or any combination thereof. The PCR-introduced error can be the result of PCR amplification errors, PCR amplification bias, PCR underamplification, or any combination thereof. Sequencing-induced errors can be the result of imprecise base calls, insufficient sequencing, or any combination thereof.
In some embodiments, the executable instructions may further program the one or more computer processors to determine a quality status of a target in the sequencing data as full sequencing, incomplete sequencing, or saturated sequencing. The mass status of the target in the sequencing data can be determined by the number of molecular markers having different sequences in the plurality of stochastic barcodes and the number of molecular markers having different sequences associated with the target in the counted sequencing data. The quality status of the target in the sequencing data can be classified as incomplete sequencing if the quality status of the target in the sequencing data obtained in (b) is not complete sequencing and is not saturated sequencing.
In some embodiments, the executable instructions may further program the one or more computer processors to determine a full sequencing quality state by a dispersion index relative to a poisson distribution being greater than or equal to a predetermined full sequencing discrete threshold, wherein the predetermined full sequencing discrete threshold may be 0.9, 1, or 4. The full sequencing quality status may further be determined by the molecular marker having an occurrence that is greater than or equal to a predetermined full sequencing occurrence threshold in the sequencing data obtained in (b), wherein the predetermined full sequencing occurrence threshold may be 10 or 18.
In some embodiments, the executable instructions may further program the one or more computer processors to determine from the target a number of molecular markers having different sequence saturation sequencing quality states that are greater than a predetermined saturation threshold. The saturated sequencing quality status can be further determined by another target of the plurality of targets having a number of molecular markers with different sequences that is greater than a predetermined saturation threshold. If the stochastic barcode contains about 6561 molecular labels with different sequences, the predetermined saturation threshold may be 6557. If the stochastic barcode contains about 65536 molecular labels with different sequences, the predetermined saturation threshold may be 65532.
In some embodiments, the executable instructions may further program the one or more computer processors to adjust the number of molecular markers having different sequences associated with the targets in the sequencing data counted in (i) in (iv) by: determining all of the sub-molecular markers for one or more of the parent molecular markers if the target has a complete sequencing quality status; performing a first statistical analysis of the at least one daughter molecular marker and the parent molecular marker; and attributing the occurrence of the child molecular marker to the parent molecular marker if subjected to the null hypothesis of the first statistical analysis.
In some embodiments, the one or more parent molecular markers comprise a molecular marker having an occurrence greater than or equal to a predetermined full sequencing parent threshold, wherein the predetermined full sequencing parent threshold is equal to a predetermined full sequencing occurrence threshold. The daughter molecular markers comprise molecular markers that differ from the parent molecular marker by one base and occur with a full sequencing subthreshold less than or equal to a predetermined full sequencing subthreshold, wherein the predetermined full sequencing subthreshold can be 3 or 5. The zero hypothesis of the first statistical analysis may be accepted if the probability that the zero hypothesis is true is lower than the false discovery rate, wherein the false discovery rate is 5% or 10%. The first statistical analysis may be a multiple two-term test.
In some embodiments, the executable instructions may further program the one or more computer processors to adjust the number of molecular markers having different sequences associated with the targets in the sequencing data counted in (i) in (iv) by: defining a threshold for molecular markers of the target to determine true molecular markers and false molecular markers associated with the target in the sequencing data obtained in (b) if the target has a complete sequencing quality status. Defining a threshold value for the molecular marker of the target comprises performing a second statistical analysis on the molecular marker of the target.
In some embodiments, the executable instructions may further program the one or more computer processors to perform a second statistical analysis by: fitting the molecular markers of the target and their occurrence distributions to two poisson distributions; determining the number n of authentic molecular markers using two poisson distributions; and removing false molecular markers from the sequencing data obtained in (b), wherein the false molecular markers comprise molecular markers having an occurrence that is lower than the nth most abundant molecular marker, and wherein the true molecular markers comprise molecular markers having an occurrence that is greater than or equal to the nth most abundant molecular marker. The two poisson distributions comprise a first poisson distribution corresponding to a true molecular marker, and a second poisson distribution corresponding to a false molecular marker.
In some embodiments, the executable instructions may further program the one or more computer processors to adjust the number of molecular markers having different sequences associated with the targets in the sequencing data counted in (i) in (iv) by: determining whether the target in the sequencing data obtained in (b) is noise if the quality status of the target in the sequencing data obtained in (b) is an incomplete sequencing quality status; and removing noise targets from the sequencing data obtained in (b). A noisy target can be noisy if its molecular markers appear less than or equal to an incomplete sequencing noisy target threshold, wherein the incomplete sequencing noisy gene threshold is 5. The incomplete sequencing noise target threshold may be equal to the median or mean occurrence of molecular markers for multiple targets with a fully sequenced mass state.
In some embodiments, the executable instructions may further program the one or more computer processors to adjust the number of molecular markers having different sequences associated with the targets in the sequencing data counted in (i) in (iv) by: defining a threshold for molecular markers of the target to determine true molecular markers and false molecular markers in the sequencing data obtained in (b) if the quality status of the target in the sequencing data obtained in (b) is an incomplete sequencing quality status.
In some embodiments, the executable instructions may further program the one or more computer processors to define a threshold value for the molecular marker of the target by performing a third statistical analysis on the molecular marker. Performing a third statistical analysis on the molecular marker comprises: determining the number n of true molecular markers by using a zero-truncation Poisson model; and removing false molecular markers from the sequencing data obtained in (b), wherein the false molecular markers comprise molecular markers having an occurrence that is lower than the nth most abundant molecular marker, and wherein the true molecular markers comprise molecular markers having an occurrence that is greater than or equal to the nth most abundant molecular marker.
In some embodiments, at least 50% or 80% of the molecular markers in the sequencing data obtained in (b) may be retained after adjusting the sequencing data counted in (i) for one or more sequencing data errors determined in (iii).
Disclosed herein is a computer system for determining the number of targets. In some embodiments, the computer system comprises: a computer readable memory storing executable instructions; and one or more computer processors in communication with the computer-readable memory, wherein the one or more computer processors are programmed by executable instructions to: (a) randomly barcoding a plurality of targets using a plurality of random barcodes, wherein each of the plurality of random barcodes comprises a molecular marker, to create a plurality of randomly barcoded targets; (b) obtaining sequencing data for randomly barcoded targets; and (c) for one or more of the plurality of targets: (i) counting the number of molecular markers having different sequences associated with the target in the sequencing data; (ii) clusters of molecular markers that identify the target using directional adjacency; (iii) (iii) folding the sequencing data obtained in (b) using clusters of molecular markers of the target identified in (ii); and (iv) estimating the number of targets, wherein after folding the sequencing data in (ii), the estimated number of targets is correlated with the number of molecular markers having different sequences associated with the targets in the sequencing data counted in (i). The plurality of targets comprises targets of the entire transcriptome of the cell.
In some embodiments, the molecular markers of the targets in the cluster are within a predetermined orientation adjacency threshold of each other. The directional adjacency threshold is a Hamming distance (Hamming distance). The molecular markers of the targets within a cluster comprise one or more parent molecular markers and sub-molecular markers of the one or more parent molecular markers, wherein the occurrence of the parent molecular markers is greater than or equal to a predetermined orientational adjacency occurrence threshold. The predetermined directional adjacency occurrence threshold may be twice-1 as large as the occurrence of the sub-molecular label.
In some embodiments, the folding of the sequencing data obtained in (b) using clusters of molecular markers of the target identified in (ii) comprises: the appearance of the daughter molecular markers was attributed to the parent molecular markers.
In some embodiments, the executable instructions may further program the one or more computer processors to: determining the sequencing depth of the target. (ii) if the sequencing depth of the target is above a predetermined sequencing depth threshold, estimating the number of targets comprises adjusting the sequencing data counted in (i). The predetermined sequencing depth threshold may be between 15 and 20. (ii) adjusting the sequencing data counted in (i) comprises: defining a threshold for molecular markers of the target to identify true molecular markers and false molecular markers associated with the target in the sequencing data obtained in (b). Defining a threshold value for the molecular marker of the target comprises performing a statistical analysis of the molecular marker of the target. Performing the statistical analysis comprises: fitting the molecular markers of the target and their occurrence distributions to two poisson distributions; determining the number n of authentic molecular markers using two poisson distributions; and removing false molecular markers from the sequencing data obtained in (b), wherein the false molecular markers comprise molecular markers having an occurrence that is lower than the nth most abundant molecular marker, and wherein the true molecular markers comprise molecular markers having an occurrence that is greater than or equal to the nth most abundant molecular marker.
Disclosed herein are one or more non-transitory computer-readable media containing executable code that, when executed, causes one or more computing devices to determine a quantity of targets. In some embodiments, the code, when executed, causes one or more computing devices to perform a process comprising: (a) randomly barcoding a plurality of targets using a plurality of random barcodes, wherein each of the plurality of random barcodes comprises a molecular marker, to create a plurality of randomly barcoded targets; (b) obtaining sequencing data for randomly barcoded targets; and (c) for one or more of the plurality of targets: (i) counting the number of molecular markers having different sequences associated with the target in the sequencing data; (ii) determining a quality status of the target in the sequencing data obtained in (b); (iii) determining one or more sequencing data errors in the sequencing data obtained in (b), wherein determining one or more sequencing data errors in the sequencing data comprises determining one or more of: the number of molecular markers having different sequences associated with the target in the sequencing data, the mass status of the target in the sequencing data, the number of molecular markers having different sequences in the plurality of random barcodes; and (iv) estimating the number of targets, wherein the estimated number of targets is correlated with the number of molecular markers having different sequences associated with the targets in the sequencing data counted in (i) adjusted for one or more sequencing data errors determined in (iii). Steps (i), (ii), (iii), and (iv) may be performed on each of the plurality of targets. The method may be multiplexed.
In some embodiments, the process further comprises: folding the sequencing data obtained in (b) prior to determining one or more sequencing data errors. Folding the sequencing data obtained in (b), comprising: copies of a target having a similar molecular signature and an occurrence that is less than a predetermined fold occurrence threshold are designated as having the same molecular signature for the plurality of targets, wherein two copies of a target have a similar molecular signature if their molecular signatures differ in sequence by at least one base.
In some embodiments, the predetermined fold occurrence threshold may be 7 if the stochastic barcode contains about 6561 molecular markers with different sequences. If the stochastic barcode contains about 65536 molecular labels with different sequences, the predetermined fold occurrence threshold may be 17. Two copies of a target have similar molecular markers if the molecular markers of the two copies differ in sequence by at least one base. In some embodiments, the molecular tag comprises 5-20 nucleotides. The molecular markers of different stochastic barcodes may be different from each other. The plurality of random barcodes comprises about 6561 molecular markers with different sequences. The plurality of random barcodes comprises about 65536 molecular markers with different sequences.
In some embodiments, the sequencing data comprises sequences having a plurality of targets that read at 50 or more nucleotides in length. The sequencing data comprises sequences of a plurality of targets having read lengths of 75 or more nucleotides. The sequencing data comprises sequences of a plurality of targets having read lengths of 100 or more nucleotides. (b) The sequencing data obtained in (a) may be generated by Polymerase Chain Reaction (PCR) amplification of a plurality of randomly barcoded targets.
In some embodiments, the one or more sequencing data errors may be PCR-introduced errors, sequencing-introduced errors, errors caused by barcode contamination, library preparation errors, or any combination thereof. The PCR-introduced error can be the result of PCR amplification errors, PCR amplification bias, PCR underamplification, or any combination thereof. Sequencing-induced errors can be the result of imprecise base calls, insufficient sequencing, or any combination thereof.
In some embodiments, the mass status of the target in the sequencing data can be full sequencing, incomplete sequencing, or saturated sequencing. The mass status of the target in the sequencing data can be determined by the number of molecular markers having different sequences in the plurality of stochastic barcodes and the number of molecular markers having different sequences associated with the target in the counted sequencing data. The quality status of the target in the sequencing data can be classified as incomplete sequencing if the quality status of the target in the sequencing data obtained in (b) is not complete sequencing and is not saturated sequencing.
In some embodiments, the full sequencing quality status can be determined by a dispersion index relative to the poisson distribution that is greater than or equal to a predetermined full sequencing discrete threshold, wherein the predetermined full sequencing discrete threshold can be 0.9, 1, or 4. The full sequencing quality status may further be determined by the molecular marker having an occurrence that is greater than or equal to a predetermined full sequencing occurrence threshold in the sequencing data obtained in (b), wherein the predetermined full sequencing occurrence threshold may be 10 or 18.
In some embodiments, the saturated sequencing quality status can be determined by targets having a number of molecular markers with different sequences that is greater than a predetermined saturation threshold. The saturated sequencing quality status can be further determined by another target of the plurality of targets having a number of molecular markers with different sequences that is greater than a predetermined saturation threshold. If the stochastic barcode contains about 6561 molecular labels with different sequences, the predetermined saturation threshold may be 6557. If the stochastic barcode contains about 65536 molecular labels with different sequences, the predetermined saturation threshold may be 65532.
In some embodiments, the number of molecular markers having different sequences associated with the target in the sequencing data counted in (i) is adjusted in (iv) by: determining all of the sub-molecular markers for one or more of the parent molecular markers if the target has a complete sequencing quality status; performing a first statistical analysis of the at least one daughter molecular marker and the parent molecular marker; and attributing the occurrence of the child molecular marker to the parent molecular marker if subjected to the null hypothesis of the first statistical analysis.
In some embodiments, the one or more parent molecular markers comprise a molecular marker having an occurrence greater than or equal to a predetermined full sequencing parent threshold, wherein the predetermined full sequencing parent threshold is equal to a predetermined full sequencing occurrence threshold. The daughter molecular markers comprise molecular markers that differ from the parent molecular marker by one base and occur with a full sequencing subthreshold less than or equal to a predetermined full sequencing subthreshold, wherein the predetermined full sequencing subthreshold can be 3 or 5. The zero hypothesis of the first statistical analysis may be accepted if the probability that the zero hypothesis is true is lower than the false discovery rate, wherein the false discovery rate is 5% or 10%. The first statistical analysis may be a multiple two-term test.
In some embodiments, the number of molecular markers having different sequences associated with the target in the sequencing data counted in (i) is adjusted in (iv) by: defining a threshold for molecular markers of the target to determine true molecular markers and false molecular markers associated with the target in the sequencing data obtained in (b) if the target has a complete sequencing quality status. Defining a threshold value for the molecular marker of the target comprises performing a second statistical analysis on the molecular marker of the target.
In some embodiments, performing the second statistical analysis comprises: fitting the molecular markers of the target and their occurrence distributions to two poisson distributions; determining the number n of authentic molecular markers using two poisson distributions; and removing false molecular markers from the sequencing data obtained in (b), wherein the false molecular markers comprise molecular markers having an occurrence that is lower than the nth most abundant molecular marker, and wherein the true molecular markers comprise molecular markers having an occurrence that is greater than or equal to the nth most abundant molecular marker. The two poisson distributions comprise a first poisson distribution corresponding to a true molecular marker, and a second poisson distribution corresponding to a false molecular marker.
In some embodiments, the number of molecular markers having different sequences associated with the target in the sequencing data counted in (i) may be determined in (iv) by: determining whether the target in the sequencing data obtained in (b) is noise if the quality status of the target in the sequencing data obtained in (b) is an incomplete sequencing quality status; and removing noise targets from the sequencing data obtained in (b). A noisy target can be noisy if its molecular markers appear less than or equal to an incomplete sequencing noisy target threshold, wherein the incomplete sequencing noisy gene threshold is 5. The incomplete sequencing noise target threshold may be equal to the median or mean occurrence of molecular markers for multiple targets with a fully sequenced mass state.
In some embodiments, the number of molecular markers having different sequences associated with the target in the sequencing data counted in (i) may be determined in (iv) by: defining a threshold for molecular markers of the target to determine true molecular markers and false molecular markers in the sequencing data obtained in (b) if the quality status of the target in the sequencing data obtained in (b) is an incomplete sequencing quality status.
In some embodiments, defining a threshold value for the molecular marker of the target comprises performing a third statistical analysis on the molecular marker. Performing a third statistical analysis on the molecular marker comprises: determining the number n of true molecular markers by using a zero-truncation Poisson model; and removing false molecular markers from the sequencing data obtained in (b), wherein the false molecular markers comprise molecular markers having an occurrence that is lower than the nth most abundant molecular marker, and wherein the true molecular markers comprise molecular markers having an occurrence that is greater than or equal to the nth most abundant molecular marker.
In some embodiments, at least 50% or 80% of the molecular markers in the sequencing data obtained in (b) may be retained after adjusting the sequencing data counted in (i) for one or more sequencing data errors determined in (iii).
Disclosed herein are one or more non-transitory computer-readable media containing executable code that, when executed, causes one or more computing devices to determine a quantity of targets. In some embodiments, the code, when executed, causes one or more computing devices to perform a process comprising: (a) randomly barcoding a plurality of targets using a plurality of random barcodes, wherein each of the plurality of random barcodes comprises a molecular marker, to create a plurality of randomly barcoded targets; (b) obtaining sequencing data for randomly barcoded targets; and (c) for one or more of the plurality of targets: (i) counting the number of molecular markers having different sequences associated with the target in the sequencing data; (ii) clusters of molecular markers that identify the target using directional adjacency; (iii) (iii) folding the sequencing data obtained in (b) using clusters of molecular markers of the target identified in (ii); and (iv) estimating the number of targets, wherein after folding the sequencing data in (ii), the estimated number of targets is correlated with the number of molecular markers having different sequences associated with the targets in the sequencing data counted in (i). The plurality of targets comprises targets of the entire transcriptome of the cell.
In some embodiments, the molecular markers of the targets in the cluster are within a predetermined orientation adjacency threshold of each other. The directional adjacency threshold is a Hamming distance (Hamming distance). The molecular markers of the targets within a cluster comprise one or more parent molecular markers and sub-molecular markers of the one or more parent molecular markers, wherein the occurrence of the parent molecular markers is greater than or equal to a predetermined orientational adjacency occurrence threshold. The predetermined directional adjacency occurrence threshold may be twice-1 as large as the occurrence of the sub-molecular label.
In some embodiments, the folding of the sequencing data obtained in (b) using clusters of molecular markers of the target identified in (ii) comprises: the appearance of the daughter molecular markers was attributed to the parent molecular markers.
In some embodiments, the method may further comprise: determining the sequencing depth of the target. (ii) if the sequencing depth of the target is above a predetermined sequencing depth threshold, estimating the number of targets comprises adjusting the sequencing data counted in (i). The predetermined sequencing depth threshold may be between 15 and 20. (ii) adjusting the sequencing data counted in (i) comprises: defining a threshold for molecular markers of the target to identify true molecular markers and false molecular markers associated with the target in the sequencing data obtained in (b). Defining a threshold value for the molecular marker of the target comprises performing a statistical analysis of the molecular marker of the target. Performing the statistical analysis includes: fitting the molecular markers of the target and their occurrence distributions to two poisson distributions; determining the number n of authentic molecular markers using two poisson distributions; and removing false molecular markers from the sequencing data obtained in (b), wherein the false molecular markers comprise molecular markers having an occurrence that is lower than the nth most abundant molecular marker, and wherein the true molecular markers comprise molecular markers having an occurrence that is greater than or equal to the nth most abundant molecular marker.
Disclosed herein are methods for correcting PCR or sequencing errors. In some embodiments, the method may comprise: (a) obtaining sequencing data for randomly barcoded targets; and (b) for one or more of the plurality of targets: (i) counting the number of molecular markers having different sequences associated with the target in the sequencing data; (ii) clusters of molecular markers that identify the target using directional adjacency; (iii) (iii) folding the sequencing data obtained in (a) using clusters of molecular markers of the target identified in (ii); and (iv) estimating the number of targets, wherein after folding the sequencing data in (ii), the estimated number of targets is correlated with the number of molecular markers having different sequences associated with the targets in the sequencing data counted in (i). The plurality of targets comprises targets of the entire transcriptome of the cell. In some embodiments, the method can be used to determine the number of targets. The method may further include (c) randomly barcoding a plurality of targets with a plurality of random barcodes to create a plurality of randomly barcoded targets; and (d) sequencing the randomly barcoded target to generate sequencing data for the received randomly barcoded target.
In some embodiments, the molecular markers of the targets in the cluster are within a predetermined orientation adjacency threshold of each other. The directional adjacency threshold is a Hamming distance (Hamming distance). The molecular markers of the targets within a cluster comprise one or more parent molecular markers and sub-molecular markers of the one or more parent molecular markers, wherein the occurrence of the parent molecular markers is greater than or equal to a predetermined orientational adjacency occurrence threshold. The predetermined directional adjacency occurrence threshold may be twice-1 as large as the occurrence of the sub-molecular label.
In some embodiments, the folding of the sequencing data obtained in (b) using clusters of molecular markers of the target identified in (ii) comprises: the appearance of the daughter molecular markers was attributed to the parent molecular markers.
In some embodiments, the method further comprises: determining the sequencing depth of the target. (ii) if the sequencing depth of the target is above a predetermined sequencing depth threshold, estimating the number of targets comprises adjusting the sequencing data counted in (i). The predetermined sequencing depth threshold may be between 15 and 20. (ii) adjusting the sequencing data counted in (i) comprises: defining a threshold for molecular markers of the target to identify true molecular markers and false molecular markers associated with the target in the sequencing data obtained in (b). Defining a threshold value for the molecular marker of the target comprises performing a statistical analysis of the molecular marker of the target. Performing the statistical analysis includes: fitting the molecular markers of the target and their occurrence distributions to two negative binomial distributions; determining the number n of authentic molecular markers using the two negative binomial distributions; and removing false molecular markers from the sequencing data obtained in (b), wherein the false molecular markers comprise molecular markers having an occurrence that is lower than the nth most abundant molecular marker, and wherein the true molecular markers comprise molecular markers having an occurrence that is greater than or equal to the nth most abundant molecular marker.
Disclosed herein is a computer system for determining the number of targets. In some embodiments, the computer system comprises: a computer readable memory storing executable instructions; and one or more computer processors in communication with the computer-readable memory, wherein the one or more computer processors are programmed by executable instructions to: (a) randomly barcoding a plurality of targets using a plurality of random barcodes, wherein each of the plurality of random barcodes comprises a molecular marker, to create a plurality of randomly barcoded targets; (b) obtaining sequencing data for randomly barcoded targets; and (c) for one or more of the plurality of targets: (i) counting the number of molecular markers having different sequences associated with the target in the sequencing data; (ii) clusters of molecular markers that identify the target using directional adjacency; (iii) (iii) folding the sequencing data obtained in (b) using clusters of molecular markers of the target identified in (ii); and (iv) estimating the number of targets, wherein after folding the sequencing data in (ii), the estimated number of targets is correlated with the number of molecular markers having different sequences associated with the targets in the sequencing data counted in (i). The plurality of targets comprises targets of the entire transcriptome of the cell.
In some embodiments, the molecular markers of the targets in the cluster are within a predetermined orientation adjacency threshold of each other. The directional adjacency threshold is a Hamming distance (Hamming distance). The molecular markers of the targets within a cluster comprise one or more parent molecular markers and sub-molecular markers of the one or more parent molecular markers, wherein the occurrence of the parent molecular markers is greater than or equal to a predetermined orientational adjacency occurrence threshold. The predetermined directional adjacency occurrence threshold may be twice-1 as large as the occurrence of the sub-molecular label.
In some embodiments, the folding of the sequencing data obtained in (b) using clusters of molecular markers of the target identified in (ii) comprises: the appearance of the daughter molecular markers was attributed to the parent molecular markers.
In some embodiments, the executable instructions further program the one or more computer processors to: determining the sequencing depth of the target. (ii) if the sequencing depth of the target is above a predetermined sequencing depth threshold, estimating the number of targets comprises adjusting the sequencing data counted in (i). The predetermined sequencing depth threshold may be between 15 and 20. (ii) adjusting the sequencing data counted in (i) comprises: defining a threshold for molecular markers of the target to identify true molecular markers and false molecular markers associated with the target in the sequencing data obtained in (b). Defining a threshold value for the molecular marker of the target comprises performing a statistical analysis of the molecular marker of the target. Performing the statistical analysis includes: fitting the molecular markers of the target and their occurrence distributions to two negative binomial distributions; determining the number n of authentic molecular markers using the two negative binomial distributions; and removing false molecular markers from the sequencing data obtained in (b), wherein the false molecular markers comprise molecular markers having an occurrence that is lower than the nth most abundant molecular marker, and wherein the true molecular markers comprise molecular markers having an occurrence that is greater than or equal to the nth most abundant molecular marker.
Disclosed herein are methods for correcting PCR or sequencing errors. In some embodiments, the method comprises: (a) obtaining sequencing data for randomly barcoded targets; and (b) for one or more of the plurality of targets: (i) counting the number of molecular markers having different sequences associated with the target in the sequencing data; (ii) determining the number of noise molecule markers having different sequences associated with the target in the sequencing data; and (iii) estimating the number of targets, wherein the estimated number of targets is correlated with the number of molecular markers having different sequences associated with the targets in the sequencing data counted in (i) adjusted according to the number of noise molecular markers determined in (ii). In some embodiments, the method further comprises determining a sequencing status of the target in the sequencing data. The sequencing state of the target in the sequencing data is saturated sequencing, under sequencing, or over sequencing. In some embodiments, the method can be used to determine the number of targets. The method may further include (c) randomly barcoding a plurality of targets with a plurality of random barcodes to create a plurality of randomly barcoded targets; and (d) sequencing the randomly barcoded target to generate sequencing data for the received randomly barcoded target.
In some embodiments, the saturated sequencing state is determined by targets having a number of molecular markers greater than a predetermined saturation threshold, the molecular markers having different sequences. If the stochastic barcode contains about 6561 molecular labels with different sequences, the predetermined saturation threshold is about 6557. If the stochastic barcode contains about 65536 molecular labels with different sequences, the predetermined saturation threshold is about 65532. (iii) the number of noise molecule markers determined in (ii) is zero if the sequencing state of the target in the sequencing data is a saturated sequencing state.
In some embodiments, the under-sequencing state can be determined by targets having a depth (e.g., average, minimum, or maximum depth) that is less than a predetermined under-sequencing threshold. The under sequencing threshold was about four. The under-sequencing threshold can be independent of the number of molecular markers having different sequences. (iii) if the sequencing status of the target in the sequencing data is an under-sequencing status, the number of noise molecule markers determined in (ii) is zero.
In some embodiments, the over-sequencing state is determined by the target having a number of molecular markers with different sequences that is greater than a predetermined over-sequencing threshold. For example, if the stochastic barcode contains about 6561 molecular markers with different sequences, the over-sequencing threshold can be about 250. If the sequencing state of the target in the sequencing data is an over-sequencing state, the method comprises: the number of molecular markers having different sequences associated with the target in the sequencing data is sub-sampled to about a predetermined over-sequencing threshold.
In some embodiments, determining the number of noise molecule markers having different sequences associated with the target in the sequencing data comprises: (iii) if a negative binomial distribution fitting condition is met, (iv) fitting a signal negative binomial distribution to the number of molecular markers having different sequences associated with the target in the sequencing data counted in (i), wherein the signal negative binomial distribution corresponds to the number of molecular markers (which are signal molecular markers) having different sequences associated with the target in the sequencing data counted in (i); (iv) (ii) fitting a negative binomial distribution of noise to the number of molecular markers having different sequences associated with the target in the sequencing data counted in (i), wherein the negative binomial distribution of noise corresponds to the number of molecular markers having different sequences associated with the target in the sequencing data counted in (i), which are noise molecular markers; and (vi) determining the number of noisy molecular markers using the fitted negative binomial distribution of signals in (v) and the fitted negative binomial distribution of noise in (vi).
In some embodiments, the negative binomial distribution fitting condition comprises: the sequencing state of the target in the sequencing data is not an under-sequencing state or an over-sequencing state. Determining the number of noise molecule markers using the fitted negative binomial distribution of signals in (v) and the fitted negative binomial distribution of noise in (vi) comprises, for each of the different sequences associated with the target in the sequencing data: determining the signal probability of different sequences in the signal negative binomial distribution; determining the noise probability of different sequences in the noise negative binomial distribution; and determining the different sequences as noise molecule markers if the signal probability is less than the noise probability.
In some embodiments, determining the number of noise molecule markers having different sequences associated with the target in the sequencing data comprises: (iii) if the sequencing state of the target in the sequencing data is not an under-sequencing state or an over-sequencing state and the number of molecular markers having different sequences associated with the target in the sequencing data counted in (i) is less than the false point threshold, adding a false point to the number of molecular markers having different sequences associated with the target in the sequencing data before determining the number of noise molecular markers having different sequences associated with the target in the sequencing data in (ii). The pseudo-point threshold is ten.
In some embodiments, determining the number of noise molecule markers having different sequences associated with the target in the sequencing data comprises: removing the non-unique molecular markers when it is determined that there are numbers of noise molecular markers associated with the different sequences associated with the target in the sequencing data in (ii) if the sequencing state of the target in the sequencing data is not an under-sequencing state or an over-sequencing state and the number of molecular markers having different sequences associated with the target in the sequencing data counted in (i) is less than the false point threshold.
In some embodiments, removing the non-unique molecular markers comprises: (iii) if the number of molecular markers having different sequences associated with the target in the sequencing data is greater than a predetermined threshold of recycling molecular markers, removing the non-unique molecular markers when determining the number of noise molecular markers having different sequences associated with the target in the sequencing data in (ii). For example, if the stochastic barcode contains about 6561 molecular markers with different sequences, the recycling molecular marker threshold can be about 650.
In some embodiments, removing the non-unique molecular markers comprises: determining a theoretical number of non-unique molecular markers for the number of molecular markers having different sequences associated with the target in the sequencing data; and removing the molecular marker that occurs more than the nth most abundant molecular marker of molecular markers having different sequences associated with the target in the sequencing data, wherein n is a theoretical number of non-unique molecular markers.
Disclosed herein is a computer system for determining the number of targets. In some embodiments, the computer system comprises: a computer readable memory storing executable instructions; and one or more computer processors in communication with the computer-readable memory, wherein the one or more computer processors are programmed by executable instructions to: (a) randomly barcoding a plurality of targets using a plurality of random barcodes, wherein each of the plurality of random barcodes comprises a molecular marker, to create a plurality of randomly barcoded targets; (b) obtaining sequencing data for randomly barcoded targets; and (c) for one or more of the plurality of targets: (i) counting the number of molecular markers having different sequences associated with the target in the sequencing data; (ii) determining the number of noise molecule markers having different sequences associated with the target in the sequencing data; and (iii) estimating the number of targets, wherein the estimated number of targets is correlated with the number of molecular markers having different sequences associated with the targets in the sequencing data counted in (i) adjusted according to the number of noise molecular markers determined in (ii). In some embodiments, the method further comprises determining a sequencing status of the target in the sequencing data. The sequencing state of the target in the sequencing data is saturated sequencing, under sequencing, or over sequencing.
In some embodiments, the saturated sequencing state is determined by targets having a number of molecular markers greater than a predetermined saturation threshold, the molecular markers having different sequences. For example, if the stochastic barcode contains about 6561 molecular labels with different sequences, the predetermined saturation threshold may be about 6557. If the stochastic barcode contains about 65536 molecular labels with different sequences, the predetermined saturation threshold may be about 65532. (iii) the number of noise molecule markers determined in (ii) is zero if the sequencing state of the target in the sequencing data is a saturated sequencing state.
In some embodiments, the under-sequencing state can be determined by targets having a depth (e.g., average, minimum, or maximum depth) that is less than a predetermined under-sequencing threshold. The under sequencing threshold was about four. The under-sequencing threshold can be independent of the number of molecular markers having different sequences. (iii) if the sequencing status of the target in the sequencing data is an under-sequencing status, the number of noise molecule markers determined in (ii) is zero.
In some embodiments, the over-sequencing state is determined by the target having a number of molecular markers with different sequences that is greater than a predetermined over-sequencing threshold. For example, if the stochastic barcode contains about 6561 molecular markers with different sequences, the over-sequencing threshold can be about 250. If the sequencing state of the target in the sequencing data is an over-sequencing state, the method comprises: the number of molecular markers having different sequences associated with the target in the sequencing data is sub-sampled to about a predetermined over-sequencing threshold.
In some embodiments, determining the number of noise molecule markers having different sequences associated with the target in the sequencing data comprises: (iii) if a negative binomial distribution fitting condition is met, (iv) fitting a signal negative binomial distribution to the number of molecular markers having different sequences associated with the targets in the sequencing data counted in (i), wherein the signal negative binomial distribution corresponds to the number of molecular markers (which are signal molecular markers) having different sequences associated with the targets in the sequencing data counted in (i); (iv) (ii) fitting a negative binomial distribution of noise to the number of molecular markers having different sequences associated with the target in the sequencing data counted in (i), wherein the negative binomial distribution of noise corresponds to the number of molecular markers having different sequences associated with the target in the sequencing data counted in (i), which are noise molecular markers; and (vi) determining the number of noisy molecular markers using the fitted negative binomial distribution of signals in (v) and the fitted negative binomial distribution of noise in (vi).
In some embodiments, the negative binomial distribution fitting condition comprises: the sequencing state of the target in the sequencing data is not an under-sequencing state or an over-sequencing state. Determining the number of noise molecule markers using the fitted negative binomial distribution of signals in (v) and the fitted negative binomial distribution of noise in (vi) comprises, for each of the different sequences associated with the target in the sequencing data: determining the signal probability of different sequences in the signal negative binomial distribution; determining the noise probability of different sequences in the noise negative binomial distribution; and determining the different sequences as noise molecule markers if the signal probability is less than the noise probability.
In some embodiments, determining the number of noise molecule markers having different sequences associated with the target in the sequencing data comprises: (iii) if the sequencing state of the target in the sequencing data is not an under-sequencing state or an over-sequencing state and the number of molecular markers having different sequences associated with the target in the sequencing data counted in (i) is less than the false point threshold, adding a false point to the number of molecular markers having different sequences associated with the target in the sequencing data before determining the number of noise molecular markers having different sequences associated with the target in the sequencing data in (ii). The pseudo-point threshold is ten.
In some embodiments, determining the number of noise molecule markers having different sequences associated with the target in the sequencing data comprises: removing the non-unique molecular markers when it is determined that there are numbers of noise molecular markers associated with the different sequences associated with the target in the sequencing data in (ii) if the sequencing state of the target in the sequencing data is not an under-sequencing state or an over-sequencing state and the number of molecular markers having different sequences associated with the target in the sequencing data counted in (i) is less than the false point threshold.
In some embodiments, removing the non-unique molecular markers comprises: (iii) if the number of molecular markers having different sequences associated with the target in the sequencing data is greater than a predetermined threshold of recycling molecular markers, removing the non-unique molecular markers when determining the number of noise molecular markers having different sequences associated with the target in the sequencing data in (ii). For example, if the stochastic barcode contains about 6561 molecular markers with different sequences, the recycling molecular marker threshold can be about 650.
Disclosed herein are one or more non-transitory computer-readable media containing executable code that, when executed, performs any of the methods disclosed herein.
Brief description of the drawings
FIG. 1 illustrates a non-limiting exemplary random barcode.
FIG. 2 shows a non-limiting exemplary workflow of random barcoding and digital counting.
FIG. 3 is a schematic diagram showing a non-limiting exemplary process for generating an indexed library of randomly barcoded targets from a plurality of targets.
FIG. 4 is a schematic diagram showing non-limiting exemplary distributions of molecular labeling errors, sample labeling errors, and true molecular labeling signals.
FIG. 5 is a flow chart showing a non-limiting exemplary embodiment for correcting PCR and sequencing errors using molecular markers.
FIG. 6 is a schematic diagram showing sequencing data obtained by complete sequencing and incomplete sequencing.
FIG. 7 is a flow chart showing a non-limiting exemplary embodiment for correcting PCR and sequencing errors using molecular markers based on directional adjacency.
FIG. 8 is a flow chart showing a non-limiting exemplary embodiment of correcting PCR and sequencing errors based on recursive substitution error correction and second derivative of molecular marker depth change.
FIG. 9 is a flow diagram showing a non-limiting exemplary embodiment for correcting PCR and sequencing errors based on recursive substitution error correction and distribution-based error correction.
FIG. 10 is a flow chart illustrating a non-limiting exemplary embodiment of error correction using two negative binomial distributions.
FIG. 11 is a flow diagram showing a non-limiting exemplary embodiment for correcting PCR and sequencing errors based on recursive substitution error correction and distribution-based error correction by sub-sampling of microplates and mapping of molecular markers.
FIG. 12 is a flow chart showing a non-limiting exemplary embodiment for correcting PCR and sequencing errors based on recursive substitution error correction and distribution-based error correction by sub-sampling of genes and mapping of molecular markers.
FIG. 13 is a flow diagram showing a non-limiting exemplary embodiment for correcting PCR and sequencing errors by recursive-based replacement error correction and distribution-based error correction.
FIG. 14 is a flow chart showing a non-limiting exemplary embodiment for correcting PCR and sequencing errors based on recursive substitution error correction and distribution-based error correction by using the second highest molecular marker for the initial parameter estimate.
FIG. 15 shows a non-limiting exemplary instrument suitable for use in the methods of the present disclosure.
FIG. 16 illustrates a non-limiting exemplary architecture for a computer system that may be used in conjunction with embodiments of the present disclosure.
FIG. 17 illustrates a non-limiting exemplary architecture showing a network having multiple computer systems suitable for use in the method of the present disclosure.
FIG. 18 illustrates a non-limiting exemplary architecture of a multiprocessor computer system using a shared virtual address memory space in accordance with the methods of the present disclosure.
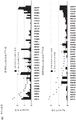
FIGS. 19A-19B show non-limiting examples of fully and incompletely sequenced genes.
FIG. 20 is a non-limiting exemplary plot of sequencing reads for rank after correction for one base sequencing error and threshold to separate correct and incorrect barcodes.
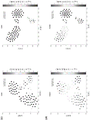
FIG. 21 is a non-limiting exemplary illustration of a zero-tailed Poisson model.
Figure 22 shows a bar graph of the total sequencing reads per well.
Figure 23 shows a bar graph of the complete sequencing gene%, the molecular Markers (ML)%, retained as true barcodes, and the% retained reads mapped to those ML retained for each well.
Fig. 24 shows a boxplot of% of readings retained, varying according to the gene of each well.
FIGS. 25A-25B show Principal Component Analysis (PCA) plots using the original ML compared to the corrected MI after the algorithm was applied from both plates.
FIG. 26 is an exemplary plot of theoretical calculations for unique molecular markers used as input molecule increments.
Fig. 27 is an exemplary diagram showing the molecular marker coverage of each molecular marker of the microplate highly expressing the gene-ATCB, in which different distributions are observed between the erroneous molecular marker and the authentic molecular marker.
Fig. 28 is an exemplary graph showing the molecular marker overlay fit of two negative binomial distributions for each molecular marker of a microplate highly expressing gene-ATCB. The fit of the two negative binomial distributions demonstrates that molecular marker errors with lower molecular marker depths can be statistically distinguished from true molecular markers with higher molecular marker depths. The x-axis is the molecular depth.
FIG. 29 shows molecular marker correction where the pairwise Hamming distance of 1 is over-represented. After molecular marker correction, molecular markers one Hamming distance apart were clustered and folded into the same parent molecular marker.
FIG. 30 shows a plot of corrected molecular marker number versus corrected read coverage number.
Fig. 31 shows a schematic diagram of an example of recursive replacement error correction.
FIG. 32 FIGS. (a) - (e) show exemplary results of correcting PCR and sequencing errors based on the second derivative of molecular marker depth changes.
Fig. 33 panels (a) - (c) show exemplary results of correcting PCR and sequencing errors based on the two negative binomial distributions of CD 69.
Fig. 34 fig. (a) - (c) show exemplary results of correcting PCR and sequencing errors based on the two negative binomial distributions of CD 3E.
FIG. 35 FIGS. (a) - (c) show exemplary results of correcting PCR and sequencing errors based on two negative binomial distributions of highly expressed genes.
Fig. 36 shows exemplary results of recycling of G-rich molecular markers of highly expressed genes.
Fig. 37 (a) - (b) show exemplary results of adjusting input data for highly expressed genes before fitting two negative binomial distributions.
FIG. 38 FIGS. (a) - (j) show non-limiting exemplary verifications of a data set corrected using two negative binomial distributions.
FIG. 39 Panels (a) - (d) show Precise from 96-well mixed Jurkat and breast cancer (BrCa) single cells (86 genes examined)TMExemplary t-random neighborhood embedding (t-SNE) visualization of targeted assays.
Fig. 40 panels (a) - (b) are non-limiting exemplary diagrams showing differential expression analysis between cell clusters with >0 ML genes in two selected clusters calculated by DBS scanning and determined by gene marker levels in each cluster.
FIG. 41 FIGS. (a) - (d) are BD Precise showing mixed Jurkat and breast cancer (T47D) single cells (with 86 genes examined) from 96-well platesTMNon-limiting exemplary graph of t-random neighborhood embedding (t-SNE) visualization of targeting assays.
Fig. 42 panels (a) - (b) are non-limiting exemplary heat maps that demonstrate differential gene expression by molecular marker counts between different cell clusters identified in fig. 41, before any error correction steps (fig. 42, raw ML shown in panel (a)), and after RSEC and DBEC correction (adjusted ML shown in fig. 42, panel (b)).
Detailed Description
In the following detailed description, reference is made to the accompanying drawings, which form a part hereof. In the drawings, like numerals generally identify like components, unless context dictates otherwise. The illustrative embodiments described in the detailed description, drawings, and claims are not meant to be limiting. Other embodiments may be utilized, and other changes may be made, without departing from the spirit or scope of the subject matter presented here. It will be readily understood that the aspects of the present disclosure, as generally described herein, and illustrated in the figures, can be arranged, substituted, combined, separated, and designed in a wide variety of different configurations, all of which are explicitly contemplated herein and make part of this disclosure.
All patents, published patent applications, other publications, and sequences from GenBank, as well as other databases mentioned herein, are incorporated by reference in their entirety for related technologies.
Quantification of small amounts of nucleic acids, such as messenger ribonucleotide (mRNA) molecules, is clinically important for determining, for example, genes expressed in cells at different developmental stages or under different environmental conditions. However, determining the absolute number of nucleic acid molecules (e.g., mRNA molecules) can also be very challenging, especially when the number of molecules is very small. One method of determining the absolute number of molecules in a sample is the digital Polymerase Chain Reaction (PCR). Ideally, PCR produces identical copies of the molecule in each cycle. However, PCR can have the disadvantage of having a random probability of replication per molecule, and this probability varies according to PCR cycles and gene sequence, which leads to amplification bias and inaccurate gene expression measurements. Random barcodes with unique molecular markers (also known as Molecular Index (MI)) can be used to count the number of molecules and correct for amplificationThe deviation is increased. Such as PreciseTMStochastic barcoding of assays (Cellular Research, Inc.) by Cellular Research (palo alto, california) can correct bias induced by PCR and library preparation steps by labeling mRNA during Reverse Transcription (RT) using molecular Markers (ML).
PreciseTMThe assay may utilize a non-depleted pool with a large number (e.g., 6561 to 65536) of random barcodes, unique molecular markers on the poly (T) oligonucleotide, to hybridize to all poly (a) -mRNA in the sample during the RT step. In addition to molecular markers, sample tags of random barcodes (also known as Sample Index (SI)) can be used to identify precisesTMEach hole of the plate. The random barcode may contain universal PCR priming sites. During RT, the target gene molecule reacts arbitrarily with the random barcode. Each target molecule can hybridize to a random barcode, thereby producing randomly barcoded complementary ribonucleotide (cDNA) molecules. After labeling, randomly barcoded cDNA molecules from microwells of a microplate can be pooled into a single tube for PCR amplification and sequencing. Raw sequencing data can be analyzed to generate the number of reads, the number of random barcodes with unique molecular markers, and the number of mRNA molecules based on poisson correction or on a two-negative binomial distribution correction method.
In addition to bias correction, molecular labeling can also better understand the statistical quality of the results by revealing the initial number of cDNA molecules present in the observed sequencing reads. For example, a large number of reads may indicate a statistically accurate answer, but if the reads are from only a small number of starting mRNA molecules, the measurement accuracy may be affected.
Although the bias in amplification induced by PCR and library preparation steps can be corrected by, for example, molecular labeling, quantification of the absolute number of molecules remains challenging due to several other factors. First, the estimation of the number of mRNA molecules can be limited by the overall diversity of the molecular markers. In stochastic barcoding, mRNA molecules can be arbitrarily reacted with available stochastic barcodes. Thus, each mRNA molecule can hybridize to a random barcode; however, his molecular signature may not necessarily be unique to any given gene. When the number of mRNA molecules is small relative to the number of stochastic barcodes, each mRNA molecule may hybridize to a stochastic barcode having a unique molecular marker, and the number of counting molecules may be equal to the number of counting molecular markers.
As the number of mRNA molecules increases, it becomes more and more likely that multiple mRNA molecules will hybridize to a random barcode with the same molecular label. Thus, the number of molecules can be underestimated using the counting of unique molecular markers. In some cases, the number of mRNA molecules can be estimated based on a poisson correction or a correction based on two negative binomial distributions for the total observed number of unique molecular markers. However, in the extreme case where the entire set of 6561 random barcodes was observed, poisson correction or correction based on two negative binomial distributions is no longer possible. For example, a maximum of 6561 saturated random barcodes would be expected in any case, regardless of 65000 or 100000 starting mRNA molecules.
Second, PCR errors (i.e., errors that occur during PCR amplification) can be introduced into the artificial random barcode and the molecular marker count increased as desired. Third, PCR amplification bias and inefficient PCR can produce low copies of barcode molecules that cannot be distinguished from errors. Fourth, sequencing errors (inaccurate calling of the random barcode sequence) can introduce artificial random barcodes and increase the molecular marker counts. In addition, the depth of sequencing can be important, especially when sequencing is too shallow to detect all randomly barcoded mrnas present in the sample library.
Disclosed herein are methods and systems for determining the number of targets in which one or more PCR or sequencing errors are corrected or adjusted. In some embodiments, the method comprises: (a) randomly barcoding a plurality of targets using a plurality of random barcodes, wherein each of the plurality of random barcodes comprises a molecular marker, to create a plurality of randomly barcoded targets; (b) obtaining sequencing data for randomly barcoded targets; and (c) for one or more of the plurality of targets: (i) counting the number of molecular markers having different sequences associated with the target in the sequencing data; (ii) determining a quality status of the target in the sequencing data obtained in (b); (iii) determining one or more sequencing data errors in the sequencing data obtained in (b), wherein determining one or more sequencing data errors in the sequencing data comprises determining one or more of: the number of molecular markers having different sequences associated with the target in the sequencing data, the mass status of the target in the sequencing data, the number of molecular markers having different sequences in the plurality of random barcodes; and (iv) estimating the number of targets, wherein the estimated number of targets is correlated with the number of molecular markers having different sequences associated with the targets in the sequencing data counted in (i) adjusted for one or more sequencing data errors determined in (iii).
Methods for determining the number of targets in which one or more PCR or sequencing errors are corrected or adjusted based on directional adjacency are disclosed. In some embodiments, the method comprises: (a) randomly barcoding a plurality of targets using a plurality of random barcodes, wherein each of the plurality of random barcodes comprises a molecular marker, to create a plurality of randomly barcoded targets; (b) obtaining sequencing data for randomly barcoded targets; (c) for one or more of the plurality of targets: (i) counting the number of molecular markers having different sequences associated with the target in the sequencing data; (ii) clusters of molecular markers that identify the target using directional adjacency; (iii) (iii) folding the sequencing data obtained in (b) using clusters of molecular markers of the target identified in (ii); (iv) estimating the number of targets, wherein after folding the sequencing data in (ii), the estimated number of targets correlates with the number of molecular markers having different sequences associated with the targets in the sequencing data counted in (i).
Disclosed herein are computer systems for determining the number of targets in which one or more PCR or sequencing errors are corrected or adjusted. Non-transitory computer-readable media containing executable code that, when executed, causes one or more computing devices to determine a number of targets in which one or more PCR or sequencing errors are corrected or adjusted are disclosed.
Definition of
Unless defined otherwise, technical and scientific terms used herein have the same meaning as commonly understood by one of ordinary skill in the art to which this disclosure belongs. See, e.g., Singleton et al, Dictionary of Microbiology and Molecular Biology [ Dictionary of Microbiology and Molecular Biology ], 2 nd edition, john wiley & Sons, (n.y, 1994); sambrook et al, Molecular Cloning, A Laboratory Manual [ Molecular Cloning: a laboratory manual ], cold spring harbor laboratory press (cold spring harbor, new york, 1989). For the purposes of this disclosure, the following terms are defined as follows.
As used herein, the term "adapter" may mean a sequence that facilitates amplification or sequencing of a nucleic acid of interest. The nucleic acid of interest can comprise a target nucleic acid. The nucleic acid of interest may comprise one or more of a spatial tag, a target tag, a sample tag, an index tag, a barcode, a random barcode, or a molecular tag. The adapters may be linear. The adaptor may be a pre-adenylated adaptor. The adapters may be double stranded or single stranded. One or more adaptors can be located at the 5 'or 3' end of the nucleic acid. When the adapter comprises known sequences at the 5 'and 3' ends, the known sequences may be the same or different sequences. Adapters located at the 5 'and/or 3' end of the polynucleotide are capable of hybridizing to one or more oligonucleotides immobilized on a surface. In some embodiments, the adaptor may comprise a universal sequence. A universal sequence may be a region of a nucleotide sequence that is common to two or more nucleic acid molecules. Two or more nucleic acid molecules may also have regions of different sequences. Thus, for example, the 5 'adaptor may comprise the same and/or universal nucleic acid sequence, and the 3' adaptor may comprise the same and/or universal sequence. A universal sequence that may be present in different members of a plurality of nucleic acid molecules may allow for the replication or amplification of multiple different sequences using a single universal primer that is complementary to the universal sequence. Similarly, at least one, two (e.g., a pair), or more universal sequences that may be present in different members of a collection of nucleic acid molecules may allow for the replication or amplification of multiple different sequences using at least one, two (e.g., a pair), or more single universal primers that are complementary to the universal sequences. Thus, a universal primer includes a sequence that can hybridize to such a universal sequence. Molecules carrying target nucleic acid sequences can be modified to attach universal adaptors (e.g., non-target nucleic acid sequences) to one or both ends of different target nucleic acid sequences. One or more universal primers attached to the target nucleic acid can provide a site for hybridization of the universal primers. The one or more universal primers attached to the target nucleic acid can be the same or different from each other.
As used herein, the term "associated" or "associated with … …" may mean that two or more categories may be identified as co-located at a certain point in time. Association may mean that two or more species are or were within similar containers. The association may be an informatics association, where for example digital information about two or more categories is stored and may be used to determine that one or more of the categories is co-located at a certain point in time. The association may also be a physical association. In some embodiments, two or more associated species are "connected," "attached," or "fixed" to each other or to a common solid or semi-solid surface. Association may refer to covalent or non-covalent means for attaching labels to solid or semi-solid supports, such as beads. The association may be a covalent bond between the target and the label.
As used herein, the term "complementarity" may refer to the ability to pair precisely between two nucleotides. For example, two nucleic acids are considered to be complementary to each other at a given position if the nucleotide at that position of the nucleic acid is capable of hydrogen bonding with a nucleotide of the other nucleic acid. Complementarity between two single-stranded nucleic acid molecules may be "partial," in which only some of the nucleotides bind, or may be complete when complete complementarity exists between the single-stranded molecules. A first nucleotide sequence can be considered the "complement" of a second sequence if the first nucleotide sequence is complementary to the second nucleotide sequence. A first nucleotide sequence can be considered to be the "reverse complement" of a second sequence if it is complementary to the sequence opposite the second sequence (i.e., in reverse nucleotide order). As used herein, the terms "complement", "complementary" and "reverse complement" may be used interchangeably. It will be understood from the present disclosure that if one molecule can hybridize to another molecule, it can be the complement of the hybridized molecule.
As used herein, the term "digital count" may refer to a method for estimating the number of target molecules in a sample. Digital counting can include the step of determining the number of unique markers that have been associated with a target in a sample. This random approach translates the problem of counting molecules from one of the localization and identification of the same molecule to a series of yes/no numerical problems with the detection of a set of predefined markers.
As used herein, the term "marker(s)" may refer to a nucleic acid code associated with a target in a sample. The label may be, for example, a nucleic acid label. The label may be a fully or partially amplifiable label. The label may be a fully or partially sequencable label. The marker may be a portion of a natural nucleic acid that is identifiable as distinct. The tag may be a known sequence. The marker may comprise a junction of nucleic acid sequences, for example a junction of natural and non-natural sequences. As used herein, the term "tag" may be used interchangeably with the terms "index," label, "or" tag-label. The indicia may convey information. For example, in various embodiments, the label can be used to determine the identity of the sample, the source of the sample, the identity of the cells, and/or the target.
As used herein, the term "non-depleting reservoir" may refer to a pool of random barcodes consisting of a number of different labels. The non-depleting reservoirs may contain a large number of different random barcodes, such that when a non-depleting reservoir is associated with a target pool, each target may be associated with a unique random barcode. The uniqueness of the target molecule of each marker can be determined by randomly selected statistics and depends on the number of copies of the same target molecule in the collection compared to the multiplicity of markers. The size of the resulting collection of labeled target molecules can be determined by the random nature of the barcoding process, and then analysis of the number of detected random barcodes allows the number of target molecules present in the original collection or sample to be calculated. Tagged target molecules are highly unique (i.e., the probability of tagging more than one target molecule with a given tag is very low) when the ratio of the number of copies of the target molecule present to the number of unique random barcodes is low.
As used herein, the term "nucleic acid" refers to a polynucleotide sequence, or a fragment thereof. The nucleic acid may comprise nucleotides. The nucleic acid may be exogenous or endogenous to the cell. The nucleic acid may be present in a cell-free environment. The nucleic acid may be a gene or a fragment thereof. The nucleic acid may be DNA. The nucleic acid may be RNA. The nucleic acid may comprise one or more analogues (e.g. altered backbone, sugar or nucleobases). Some non-limiting examples of analogs include: 5-bromouracil, peptide nucleic acids, foreign nucleic acids, morpholinos, locked nucleic acids, diol nucleic acids, threose nucleic acids, dideoxynucleotides, cordycepin, 7-deaza-GTP, fluorophores (e.g., rhodamine or fluorescent flavins linked to a sugar), thiols containing nucleotides, biotin-linked nucleotides, fluorescent analogs, CpG islands, methyl-7-guanosine, methylated nucleotides, inosine, thiouridine, pseudouridine, dihydrouridine, braided glycosides, and tetris. "nucleic acid," "polynucleotide," "target polynucleotide," and "target nucleic acid" are used interchangeably.
The nucleic acid may include one or more modifications (e.g., base modifications, backbone modifications) to provide new or enhanced features to the nucleic acid (e.g., improved stability). The nucleic acid may comprise a nucleic acid affinity tag. Nucleosides can be base-sugar combinations. The base portion of the nucleoside can be a heterocyclic base. The two most common classes of such heterocyclic bases are purines and pyrimidines. The nucleotide may be a nucleoside further comprising a phosphate group covalently linked to the sugar portion of the nucleoside. For those nucleosides that comprise pentofuranosyl sugars, the phosphate group can be attached to the 2', 3', or 5' hydroxyl portion of the sugar. In forming nucleic acids, phosphate groups can covalently link adjacent nucleosides to one another to form linear macromolecular compounds. The respective ends of the linear polymer compound may be further joined to form a cyclic compound; however, linear compounds are generally suitable. Furthermore, linear compounds may have internal nucleotide base complementarity and may therefore fold in a manner that produces a fully or partially double stranded compound. In nucleic acids, the phosphate group may be generally referred to as forming the internucleoside backbone of the nucleic acid. The linkage or backbone may be a 3 'to 5' phosphodiester linkage.
The nucleic acid may comprise a modified backbone and/or modified internucleoside linkages. Modified backbones can include those that retain phosphorus atoms in the backbone and those that do not have phosphorus atoms in the backbone. Suitable modified nucleic acid backbones containing phosphorus atoms therein may comprise, for example, phosphorothioates; a chiral phosphorothioate; a phosphorodithioate ester; a phosphoric acid triester; aminoalkyl phosphotriesters; methyl phosphonates and other alkyl phosphonates such as 3 '-alkylene phosphonates, 5' -alkylene phosphonates; a chiral phosphonate; a phosphite ester; phosphoramidates including 3' -phosphoramidate and aminoalkyl phosphoramidates; a phosphorodiamidate ester; thiocarbonylphosphoramide ester; thiocarbonylalkylphosphonate; thiocarbonylalkylphosphoric acid triesters; a selenophosphate ester; and borane phosphate with normal 3'-5' linkages, 2'-5' linked analogs and those with reversed polarity, wherein one or more internucleotide linkages is a 3 'to 3', 5 'to 5' or 2 'to 2' linkage.
The nucleic acid may comprise a polynucleotide backbone formed of short chain alkyl or cycloalkyl internucleoside linkages, mixed heteroatoms, and alkyl or cycloalkyl internucleoside linkages or one or more short chain heteroatomic or heterocyclic internucleoside linkages. These may include those having the following structures: morpholino linkages (formed in part from the sugar portion of a nucleoside); a siloxane backbone; sulfide, sulfoxide and sulfone backbones; a formylacetyl and thiocarbonylacetyl backbone; methylene formyl acetyl and thio formyl acetyl skeletons; a ribose acetyl backbone; an alkene-containing backbone; a sulfamate skeleton; methylene imino and methylene hydrazino skeletons; sulfonate and sulfonamide backbones; an amide skeleton; and other backbones having mixed N, O, S and CH2 component moieties.
The nucleic acid may comprise a nucleic acid mimetic. The term "mimetic" may be intended to include polynucleotides in which only the furanose ring or both the furanose ring and the internucleotide linkages are replaced with a non-furanose group, and replacement of only the furanose ring may also be referred to as a sugar substitute. The heterocyclic base moiety or modified heterocyclic base moiety can be maintained for hybridization with an appropriate target nucleic acid. One such nucleic acid may be a Peptide Nucleic Acid (PNA). In PNA, the sugar backbone of the polynucleotide may be replaced by an amide-containing backbone (in particular an aminoethylglycine backbone). The nucleotides may be held and bound directly or indirectly to the aza nitrogen atom of the amide portion of the backbone. The backbone in PNA compounds can include two or more attached aminoethylglycine units, which impart an amide-containing backbone to the PNA. The heterocyclic base moiety may be directly or indirectly attached to the aza nitrogen atom of the amide moiety of the backbone.
The nucleic acid may comprise a morpholino scaffold structure. For example, the nucleic acid may include a 6-membered morpholino ring in place of a ribose ring. In some of these embodiments, a phosphodiester or other non-phosphodiester internucleoside linkage can be substituted for the phosphodiester linkage.
The nucleic acid may comprise a linked morpholino unit having a heterocyclic base attached to a morpholino ring (i.e., a morpholino nucleic acid). The linking group can link morpholino monomer units in a morpholino nucleic acid. The non-ionic morpholino based oligomeric compound can have fewer undesirable interactions with cellular proteins. The morpholino-based polynucleotide can be a non-ionic mimic of a nucleic acid. The various compounds in the morpholino class can be linked using different linking groups. Another class of polynucleotide mimetics can be referred to as cyclohexenyl nucleic acids (CeNA). The furanose ring normally present in a nucleic acid molecule may be replaced by a cyclohexenyl ring. CeNA DMT protected phosphoramidite monomers can be prepared and used for oligomeric compound synthesis using phosphoramidite chemistry. Incorporation of CeNA monomers into nucleic acid strands can increase the stability of DNA/RNA hybrids. CeNA oligoadenylates can form complexes with nucleic acid complements with stability similar to natural complexes. Additional modifications may include Locked Nucleic Acids (LNAs) in which a 2 '-hydroxyl group is attached to the 4' carbon atom of the sugar ring, thereby forming a 2'-C,4' -C-oxymethylene linkage, thereby forming a bicyclic sugar moiety. The bond may be a methylene group (-CH2) bridging the 2 'oxygen atom and the 4' carbon atom, where n is 1 or 2. LNAs and LNA analogues can exhibit very high duplex thermal stability (Tm ═ 3 ℃ to +10 ℃) with complementary nucleic acids, stability to 3' -exonuclease degradation, and good solubility characteristics.
Nucleic acids may also include nucleobase (often referred to simply as "base") modifications or substitutions. As used herein, an "unmodified" or "natural" nucleobase can include purine bases (e.g., adenine (a) and guanine (G)), as well as pyrimidine bases (e.g., thymine (T), cytosine (C), and uracil (U)). Modified nucleobases may include other synthetic and natural nucleobases, such as 5-methylcytosine (5-me-C), 5-hydroxymethylcytosine, xanthine, hypoxanthine, 2-aminoadenine, 6-methyl and other alkyl derivatives of adenine and guanine, 2-propyl and other alkyl derivatives of adenine and guanine, 2-thiouracil, 2-thiothymine and 2-thiocytosine, 5-halouracil and cytosine, 5-propynyl (— C — CH3) uracil and other alkynyl derivatives of cytosine and pyrimidine bases, 6-azoyluracil, cytosine and thymine, 5-uracil (pseudouracil), 4-thiouracil, 8-halo, 8-amino, 8-mercapto, 8-sulfanyl, 8-hydroxy and other 8-substituted adenines and guanines, 5-halo especially 5-bromo, 5-trifluoromethyl and other 5-substituted uracils and cytosines, 7-methylguanine and 7-methyladenine, 2-F-adenine, 2-aminoadenine, 8-azaguanine and 8-azaadenine, 7-deazaguanine and 7-deazaadenine, and 3-deazaguanine and 3-deazaadenine. Modified nucleobases may include tricyclic pyrimidines such as phenoxazine cytidine (1H-pyrimido (5,4-b) (1,4) benzoxazin-2 (3H) -one), phenothiazine cytidine (1H-pyrimido (5,4-b) (1,4) benzothiazin-2 (3H) -one), G-clips (clams) such as substituted phenoxazine cytidine (e.g., 9- (2-aminoethoxy) -H-pyrimido (5,4- (b) (1,4) benzoxazin-2 (3H) -one), phenothiazine cytidine (1H-pyrimido (5,4-b) (1,4) benzothiazin-2 (3H) -one), G-clips (clams) such as substituted phenoxazine cytidine (e.g., 9- (2-aminoethoxy) -H-pyrimido (5,4- (b) (1,4) benzoxazine-2 (3H) -one), carbazole cytidine (2H-pyrimido (4,5-b) indol-2-one), pyridoindole cytidine (H pyrido (3',: 4,5) pyrrolo [2,3-d ] pyrimidin-2-one).
As used herein, the term "sample" may refer to a composition that includes a target. Suitable samples for analysis by the disclosed methods, devices, and systems include cells, tissues, organs, or organisms.
As used herein, the term "sampling device" or "device" may refer to a device that may take a portion of a sample and/or place the portion on a substrate. The sampling device may refer to, for example, a Fluorescence Activated Cell Sorting (FACS) machine, a cell sorter, a biopsy needle, a biopsy device, a tissue sectioning device, a microfluidic device, a cascade, and/or an microtome.
As used herein, the term "solid support" may refer to a discrete solid or semi-solid surface to which a plurality of random barcodes may be attached. The solid support may comprise any type of solid, porous or hollow sphere, ball, socket, cylinder, or other similar configuration, composed of a plastic, ceramic, metal, or polymeric material (e.g., a hydrogel) onto which nucleic acids may be immobilized (e.g., covalently or non-covalently). The solid support may comprise discrete particles that may be spherical (e.g., microspheres) or have a non-spherical or irregular shape, such as cubic, rectangular, pyramidal, cylindrical, conical, elliptical, or disk-shaped, and the like. The plurality of solid supports spaced apart in the array may not include a substrate. The solid support may be used interchangeably with the term "bead".
The solid support may be referred to as a "substrate". The substrate may be a solid support. A substrate may refer to a continuous solid or semi-solid surface upon which the methods of the present disclosure may be performed. For example, a substrate may refer to arrays, cassettes, chips, devices, and slides.
As used herein, the term "spatial marker" may refer to a marker that may be correlated in space with a location.
As used herein, the term "random barcode" may refer to a polynucleotide sequence comprising a tag. The stochastic barcode may be a polynucleotide sequence that can be used for stochastic barcode encoding. Random barcodes may be used to quantify the target in a sample. The random barcode can be used to control errors that may occur after the tag is associated with the target. For example, random barcodes can be used to assess amplification or sequencing errors. The stochastic barcode associated with the target can be referred to as a stochastic barcode-target or a stochastic barcode-tag-target.
As used herein, the term "gene-specific random barcode" may refer to a polynucleotide sequence comprising a label and a gene-specific target binding region. The stochastic barcode may be a polynucleotide sequence that can be used for stochastic barcode encoding. Random barcodes may be used to quantify the target in a sample. The random barcode can be used to control errors that may occur after the tag is associated with the target. For example, random barcodes can be used to assess amplification or sequencing errors. The stochastic barcode associated with the target can be referred to as a stochastic barcode-target or a stochastic barcode-tag-target.
As used herein, the term "stochastic barcoding" can refer to random labeling (e.g., barcoding) of a nucleic acid. Stochastic barcoding can utilize a recursive poisson strategy to correlate and quantify the label associated with a target. As used herein, the term "stochastic barcoding" may be used interchangeably with "gene-specific stochastic barcoding".
As used herein, the term "target" can refer to a composition that can be associated with a stochastic barcode. Exemplary suitable targets for analysis by the disclosed methods, devices, and systems include oligonucleotides, DNA, RNA, mRNA, microrna, tRNA, and the like. The target may be single-stranded or double-stranded. In some embodiments, the target may be a protein. In some embodiments, the target is a lipid.
As used herein, the term "reverse transcriptase" may refer to a group of enzymes that have reverse transcriptase activity (i.e., catalyze the synthesis of DNA from an RNA template). Typically, such enzymes include, but are not limited to, retroviral reverse transcriptase, retrotransposon reverse transcriptase, retroplasmid reverse transcriptase, retrotransposon reverse transcriptase, bacterial reverse transcriptase, group II intron derived reverse transcriptase, and mutants, variants or derivatives thereof. Non-retroviral reverse transcriptases include non-LTR retrotransposon reverse transcriptase, retroplasmid reverse transcriptase and group II intron reverse transcriptase. Examples of group II intron reverse transcriptases include lactococcus lactis li. ltrb intron reverse transcriptase, synechococcus elongatus TeI4c intron reverse transcriptase or geobacillus stearothermophilus GsI-IIC intron reverse transcriptase. Other classes of reverse transcriptases may include many types of non-retroviral reverse transcriptases (i.e., retroposons, group II introns, and diversity producing reverse transcription elements, among others).
The terms "universal adaptor primer," "universal primer adaptor," or "universal adaptor sequence" are used interchangeably to refer to a nucleotide sequence that can be used to hybridize to a stochastic barcode to generate a gene-specific stochastic barcode. The universal adaptor sequence may be, for example, a known sequence that is universal to all random barcodes used in the methods of the present disclosure. For example, when multiple targets are labeled using the methods disclosed herein, each target-specific sequence can be ligated to the same universal adaptor sequence. In some embodiments, more than one universal adaptor sequence may be used in the methods disclosed herein. For example, when labeling multiple targets using the methods disclosed herein, at least two target-specific sequences are ligated to different universal adaptor sequences. The universal adaptor primer and its complement may be included in two oligonucleotides, one of which contains the target-specific sequence and the other contains a random barcode. For example, the universal adaptor sequence may be part of an oligonucleotide comprising a target-specific sequence to produce a nucleotide sequence complementary to the target nucleic acid. A second oligonucleotide comprising a complement of the stochastic barcode and the universal adaptor sequence can hybridize to the nucleotide sequence and generate a target-specific stochastic barcode. In some embodiments, the universal adaptor primers have a different sequence than the universal PCR primers used in the methods of the present disclosure.
Disclosed herein are methods and systems for detecting and/or correcting errors that occur during PCR and/or sequencing. The type of error can vary, for example, including but not limited to substitution errors (one or more bases) and non-substitution errors. Among the substitution errors, the frequency of substitution errors of one base is much higher than those different from one base. These methods and systems can be used, for example, to provide accurate counting of molecular targets by stochastic barcoding.
Random bar code
Stochastic barcoding has been described in, for example, US 20150299784, WO 2015031691, and Fu et al, Proc Natl Acad Sci u.s.a. [ journal of the american national academy of sciences ]2011, 5 months and 31 days; 108(22) 9026-31, the contents of which are incorporated herein by reference in their entirety. Briefly, a stochastic barcode can be a polynucleotide sequence that can be used to randomly label (e.g., barcode, tag) a target. The random barcode may include one or more indicia. Exemplary markers can include universal markers, cellular markers, molecular markers, sample markers, plate markers, spatial markers, and/or pre-spatial (pre-spatial) markers. FIG. 1 illustrates an exemplary random barcode 104 with spatial indicia. The stochastic barcode 104 can comprise a 5' amine that can attach the stochastic barcode to the solid support 105. The stochastic barcode may comprise a universal label, a dimensional label, a spatial label, a cellular label, and/or a molecular label. The order of different labels (including but not limited to universal labels, dimensional labels, spatial labels, cellular labels, and molecular labels) in the stochastic barcode can vary. For example, as shown in fig. 1, the universal tag may be a 5 '-end tag and the molecular tag may be a 3' -end tag. Spatial labeling, dimensional labeling, and cell labeling can be in any order. In some embodiments, the universal label, the spatial label, the dimensional label, the cellular label, and the molecular label are in any order.
A marker (e.g., a cellular marker) may comprise a set of unique nucleic acid subsequences of defined length, e.g., seven nucleotides each (corresponding to the number of bits used in some hamming error correction codes), which may be designed to provide error correction capability. A set of error correcting subsequences comprising seven nucleotide sequences can be designed such that any pair-wise combination of sequences in the set exhibits a defined "genetic distance" (or number of mismatched bases), e.g., a set of error correcting subsequences can be designed to exhibit a genetic distance of three nucleotides. In this case, examination of error correction sequences in the sequence data set for labeled target nucleic acid molecules (described more fully below) can allow for detection or correction of amplification or sequencing errors. In some embodiments, the length of the nucleic acid subsequences used to generate the error correction codes can vary, for example, they can be, or are, about 1, 2, 3, 4, 5, 6, 7, 8, 9, 10, 15, 20, 30, 31, 40, 50, or a number or range of nucleotides in length between any two of these values. In some embodiments, nucleic acid subsequences of other lengths may be used to generate error correction codes.
The stochastic barcode can include a target binding region. The target binding region can interact with a target in the sample. The target may be, or comprise, ribonucleic acid (RNA), messenger RNA (mrna), microrna, small interfering RNA (sirna), RNA degradation products, RNA each containing a poly (a) tail, or any combination thereof. In some embodiments, the plurality of targets can include deoxyribonucleic acid (DNA).
In some embodiments, the target binding region may include an oligo (dT) sequence that can interact with the poly (a) tail of mRNA. One or more labels (e.g., universal labels, dimensional labels, spatial labels, cellular labels, and molecular labels) of the stochastic barcode can be separated from another or two of the remaining labels of the stochastic barcode by a spacer. The spacer can be, for example, 1, 2, 3, 4, 5, 6, 7, 8, 9, 10, 11, 12, 13, 14, 15, 16, 17, 18, 19, or 20 or more nucleotides. In some embodiments, none of the marks of the random barcode are separated by a spacer.
Universal tag
The random barcode can contain one or more universal indicia. In some embodiments, the one or more universal labels may be the same for all of the random barcodes in the set of random barcodes (attached to a given solid support). In some embodiments, the one or more universal indicia may be the same for all of the random barcodes attached to the plurality of beads. In some embodiments, the universal tag can comprise a nucleic acid sequence capable of hybridizing to a sequencing primer. Sequencing primers can be used to sequence random barcodes that include a universal tag. Sequencing primers (e.g., universal sequencing primers) can include sequencing primers associated with a high-throughput sequencing platform. In some embodiments, the universal marker may comprise a nucleic acid sequence capable of hybridizing to a PCR primer. In some embodiments, the universal marker may comprise a nucleic acid sequence capable of hybridizing to sequencing primers and PCR primers. A universally labeled nucleic acid sequence capable of hybridizing to a sequencing or PCR primer may be referred to as a primer binding site. The universal tag may include a sequence that can be used to initiate transcription of the stochastic barcode. The universal mark may include a sequence that may be used to extend the random barcode or regions within the random barcode. The length of the universal label can be or be about 1, 2, 3, 4, 5, 10, 15, 20, 25, 30, 35, 40, 45, 50 nucleotides, or a number or range of nucleotides between any two of these values. For example, a universal label can comprise at least about 10 nucleotides. The universal label can be at least, or at most 1, 2, 3, 4, 5, 10, 15, 20, 25, 30, 35, 40, 45, 50, 100, 200, or 300 nucleotides in length. In some embodiments, the cleavable linker or modified nucleotide may be part of a universal tag sequence to enable the stochastic barcode to be cleaved from the support.
Dimension mark
The random barcode may include one or more dimensional indicia. In some embodiments, a dimension tag can include a nucleic acid sequence that provides information about the dimension at which the random tag occurred. For example, the dimensional indicia may provide information about the time at which the target was randomly barcoded. The dimension mark may be associated with a time of random barcoding in the sample. The dimension mark may be activated at the time of the random mark. Different dimension markers may be activated at different times. The dimensional labels provide information about the order in which the targets, target sets, and/or samples are randomly barcoded. For example, cell populations may be randomly barcoded during the G0 phase of the cell cycle. During the G1 phase of the cell cycle, the cells may be pulsed again with the stochastic barcode. During the S phase of the cell cycle, the cells may be pulsed again with random barcodes, and so on. At each pulse period (e.g., each period of the cell cycle), the stochastic barcode can include different dimensional labels. In this way, the dimensional labels provide information about which targets are labeled at which phase of the cell cycle. Dimensional markers can interrogate many different biological stages. Exemplary biological times can include, but are not limited to, cell cycle, transcription (e.g., transcription initiation), and transcript degradation. In another example, a sample (e.g., a cell, a population of cells) can be randomly labeled before and/or after treatment with a drug and/or therapy. A change in copy number of different targets may indicate a response of the sample to the drug and/or therapy.
The dimension label may be activatable. An activatable dimension marker may be activated at a particular point in time. The activatable labels may be, for example, constitutively activated (e.g., not closed). The activatable dimension marker may be, for example, reversibly activated (e.g., the activatable dimension marker may be turned on and off). The dimension label can be, for example, reversibly activated at least 1, 2, 3, 4, 5, 6, 7, 8, 9, or 10 or more times. The dimension mark may be reversibly activated, for example, at least 1, 2, 3, 4, 5, 6, 7, 8, 9, or 10 or more times. In some embodiments, fluorescence may be used; a light; chemical events (e.g., cleavage, attachment of another molecule, addition of a modification (e.g., pegylation, SUMO modification, acetylation, methylation, deacetylation, demethylation), photochemical events (e.g., photopinning), and introduction of an unnatural nucleotide activates the dimensional label.
In some embodiments, the dimensional labels may be the same for all random barcodes attached to a given solid support (e.g., bead), but different for different solid supports (e.g., beads). In some embodiments, at least 60%, 70%, 80%, 85%, 90%, 95%, 97%, 99%, or 100% of the random barcodes on the same solid support may comprise the same dimensional indicia. In some embodiments, at least 60% of the stochastic barcodes on the same solid support may comprise the same dimensional indicia. In some embodiments, at least 95% of the stochastic barcodes on the same solid support can comprise the same dimensional indicia.
Multiple solid supports (e.g., beads) can exhibit up to 106One or more unique dimensional marker sequences. The length of the dimension label can be or be about 1, 2, 3, 4, 5, 10, 15, 20, 25, 30, 35, 40, 45, 50 nucleotides, or a number or range of nucleotides between any two of these values. The dimension label can be at least, or at most 1, 2, 3, 4, 5, 10, 15, 20, 25, 30, 35, 40, 45, 50, 100, 200, or 300 nucleotides in length. The dimension label can comprise between about 5 to about 200 nucleotides. The dimension labels can comprise between about 10 to about 150 nucleotides. The dimension labels can comprise between about 20 to about 125 nucleotides in length.
Spatial marking
The random barcode may contain one or more spatial markers. In some embodiments, the spatial signature can include a nucleic acid sequence that provides information on the spatial orientation of the target molecule associated with the stochastic barcode. The spatial signature may be associated with coordinates in the sample. The coordinates may be fixed coordinates. For example, the coordinates may be fixed with reference to the substrate. The spatial markers may reference a two-dimensional or three-dimensional grid. The coordinates may be fixed with reference to landmarks. Landmarks are identifiable in space. The landmarks may be structures that can be imaged. The landmark may be a biological structure, such as an anatomical landmark. The landmark may be a cellular landmark, such as an organelle. The landmark may be a non-natural landmark, such as a structure with a recognizable identifier (e.g., color code, barcode, magnetic, fluorescent, radioactive, or unique size or shape). Spatial markers may be associated with physical partitions (e.g., wells, containers, or droplets). In some embodiments, a plurality of spatial markers are used together to encode one or more locations in space.
The spatial signature can be the same for all random barcodes attached to a given solid support (e.g., bead), but different for different solid supports (e.g., beads). In some embodiments, the percentage of random barcodes on the same solid support comprising the same spatial signature can be, or about 60%, 70%, 80%, 85%, 90%, 95%, 97%, 99%, 100%, or a number or range between any two of these values. In some embodiments, the percentage of random barcodes on the same solid support comprising the same spatial signature can be at least, or at most 60%, 70%, 80%, 85%, 90%, 95%, 97%, 99%, or 100%. In some embodiments, at least 60% of the stochastic barcodes on the same solid support may comprise the same spatial signature. In some embodiments, at least 95% of the stochastic barcodes on the same solid support may comprise the same spatial signature.
Multiple solid supports (e.g., beads) can exhibit up to 106One or more unique spatial signature sequences. The length of the spatial label can be or be about 1, 2, 3, 4, 5, 10, 15, 20, 25, 30, 35, 40, 45, 50 nucleotides, or a number or range of nucleotides between any two of these values. The spatial label can be at least, or at most 1, 2, 3, 4, 5, 10, 15, 20, 25, 30, 35, 40, 45, 50, 100, 200, or 300 nucleotides in length. The spatial label may comprise between about 5 to about 200 nucleotides. The spatial label may comprise between about 10 to about 150 nucleotides. The spatial label may comprise between about 20 to about 125 nucleotides in length.
Cell markers
The stochastic barcode can include one or more cell markers. In some embodiments, a cell marker can comprise a nucleic acid sequence that provides information for determining which target nucleic acid is from which cell. In some embodiments, the cell label is the same for all random barcodes attached to a given solid support (e.g., bead), but different for different solid supports (e.g., beads). In some embodiments, the percentage of random barcodes on the same solid support comprising the same cellular marker can be, or about 60%, 70%, 80%, 85%, 90%, 95%, 97%, 99%, 100%, or a number or range between any two of these values. In some embodiments, the percentage of random barcodes on the same solid support comprising the same cell marker can be, or about 60%, 70%, 80%, 85%, 90%, 95%, 97%, 99%, or 100%. For example, at least 60% of the stochastic barcodes on the same solid support may comprise the same cell label. As another example, at least 95% of the stochastic barcodes on the same solid support may comprise the same cell label.
Multiple solid supports (e.g., beads) can exhibit up to 106One or more unique cell marker sequences. The length of the cellular marker can be or be about 1, 2, 3, 4, 5, 10, 15, 20, 25, 30, 35, 40, 45, 50 nucleotides, or a number or range of nucleotides between any two of these values. The cellular marker may be at least, or at most 1, 2, 3, 4, 5, 10, 15, 20, 25, 30, 35, 40, 45, 50, 100, 200, or 300 nucleotides in length. For example, a cell marker can include between about 5 to about 200 nucleotides. As another example, a cell marker can include between about 10 to about 150 nucleotides. As yet another example, the cell marker can comprise between about 20 to about 125 nucleotides in length.
Molecular markers
The stochastic barcode may comprise one or more molecular labels. In some embodiments, the molecular tag can comprise a nucleic acid sequence that provides identifying information for a particular type of target nucleic acid species that hybridizes to the random barcode. Molecular markers can include nucleic acid sequences that provide a counter for the specific occurrence of a target nucleic acid species hybridized to a stochastic barcode (e.g., target binding region).
In some embodiments, a set of different molecular labels are attached to a given solid support (e.g., a bead). In some embodiments, there may be, or about 102、103、104、105、106、107、108、109One, or a number or a range of unique molecular marker sequences. For example, the plurality of random barcodes may comprise about 6561 molecules with different sequencesAnd (4) marking. As another example, the plurality of stochastic barcodes may comprise about 65536 molecular labels having different sequences. In some embodiments, there may be at least, or at most 102、103、104、105、106、107、108Or 109A unique molecular marker sequence. The unique molecular marker sequences are attached to a given solid support (e.g., a bead).
The molecular marker can be about 1, 2, 3, 4, 5, 10, 15, 20, 25, 30, 35, 40, 45, 50, or a number or range of nucleotides between any two of these values in length. The molecular marker may be at least, or at most 1, 2, 3, 4, 5, 10, 15, 20, 25, 30, 35, 40, 45, 50, 100, 200, or 300 nucleotides in length.
Target binding region
The stochastic barcode can comprise one or more target binding regions. In some embodiments, the target binding region can hybridize to a target of interest. In some embodiments, the target binding region can include a nucleic acid sequence that specifically hybridizes (e.g., hybridizes) to a target (e.g., a target nucleic acid, a target molecule, such as a cellular nucleic acid to be analyzed). In some embodiments, a target-binding region can comprise a nucleic acid sequence that can be attached (e.g., hybridized) to a specific location of a particular target nucleic acid. In some embodiments, the target binding region may comprise a nucleic acid sequence capable of specifically hybridizing to a restriction enzyme site overhang (e.g., an EcoRI cohesive end overhang). The stochastic barcode can then be ligated to any nucleic acid molecule that contains sequences complementary to the restriction site overhangs.
In some embodiments, the target-binding region can comprise a non-specific target nucleic acid sequence. A non-specific target nucleic acid sequence may refer to a sequence that can bind to multiple target nucleic acids independently of the specific sequence of the target nucleic acid. For example, the target binding region may comprise a random multimeric sequence or an oligomeric (dT) sequence that hybridizes to a poly (a) tail on an mRNA molecule. The random multimeric sequences may be, for example, random dimeric, trimeric, tetrameric, pentameric, hexameric, heptameric, octameric, nonameric, decameric, or higher multimeric sequences of any length. In some embodiments, the target binding region is the same for all random barcodes attached to a given bead. In some embodiments, for multiple random barcodes attached to a given bead, the target-binding region can comprise two or more different target-binding sequences. The length of the target binding region can be or be about 5, 10, 15, 20, 25, 30, 35, 40, 45, 50 nucleotides, or a number or range of nucleotides between any two of these values. The target binding region can be up to about 5, 10, 15, 20, 25, 30, 35, 40, 45, 50 or more nucleotides in length.
In some embodiments, the target binding region may comprise an oligo (dT) that can hybridize to an mRNA comprising a polyadenylated terminus. The target binding region may be gene specific. For example, the target binding region can be configured to hybridize to a specific region of the target. The target binding region can be, or be, about 1, 2, 3, 4, 5, 6, 7, 8, 9, 10, 11, 12, 13, 14, 15, 16, 17, 18, 19, 20, 21, 22, 23, 24, 25, 26, 27, 28, 29, 30 nucleotides in length, or a number or range between any two of these values. The target binding region can be at least, or at most 1, 2, 3, 4, 5, 6, 7, 8, 9, 10, 11, 12, 13, 14, 15, 16, 17, 18, 19, 20, 21, 22, 23, 24, 25, 26, 27, 28, 29, or 30 nucleotides in length. The target binding region can be about 5-30 nucleotides in length. When the stochastic barcode includes a gene-specific target binding region, the stochastic barcode may be referred to as a gene-specific stochastic barcode.
Orientation feature
The stochastic barcode may comprise one or more orientation characteristics that can be used to orient (e.g., align) the stochastic barcode. The stochastic barcode may include a portion for isoelectric focusing. Different random barcodes may comprise different isoelectric focusing points. When the stochastic barcodes are introduced into a sample, the sample may undergo isoelectric focusing to facilitate positioning the stochastic barcodes in a known manner. In this way, the orientation feature can be used to develop a known map of the random barcodes in the sample. Exemplary orientation characteristics may include electrophoretic mobility (e.g., based on the size of the random barcode), isoelectric point, spin, conductivity, and/or self-assembly. For example, stochastic barcodes have the directional property of self-assembly, which when activated can self-assemble into a specific orientation (e.g., nucleic acid nanostructures).
Affinity characteristics
The stochastic barcode may comprise one or more affinity properties. For example, the spatial tag may comprise an affinity property. Affinity properties may be included in the chemical and/or biological moiety that may facilitate binding of the stochastic barcode to another entity (e.g., a cellular receptor). For example, the affinity property can comprise an antibody, e.g., an antibody specific for a particular moiety (e.g., receptor) on the sample. In some embodiments, the antibody can direct a random barcode onto a specific cell type or molecule. Targets at and/or near a particular cell type or molecule can be randomly labeled. In some embodiments, in addition to the sterically-tagged nucleotide sequence, the affinity properties can provide spatial information because the antibody can direct the stochastic barcode to a specific location. The antibody may be a therapeutic antibody, such as a monoclonal antibody or a polyclonal antibody. The antibody may be humanized or chimeric. The antibody may be a naked antibody or a fusion antibody.
Antibodies can be full-length (i.e., naturally occurring or formed by the process of recombination of normal immunoglobulin gene fragments) immunoglobulin molecules (e.g., IgG antibodies) or immunologically active (i.e., specifically binding) portions of immunoglobulin molecules (like antibody fragments).
Antibody fragments can be, for example, a portion of an antibody, such as F (ab ') 2, Fab', Fab, Fv, sFv, and the like. In some embodiments, the antibody fragment can bind to the same antigen recognized by the full-length antibody. Antibody fragments can include isolated fragments consisting of the variable regions of an antibody, such as the "Fv" fragments consisting of the variable regions of the heavy and light chains and recombinant single chain polypeptide molecules in which the light and heavy variable regions are linked by a peptide linker ("scFv proteins"). Exemplary antibodies may include, but are not limited to, cancer cell antibodies, viral antibodies, antibodies that bind to cell surface receptors (CD8, CD34, CD45), and therapeutic antibodies.
Universal adaptor primer
The random barcode may comprise one or more universal adaptor primers. For example, the gene-specific stochastic barcodes may comprise universal adaptor primers. A universal adaptor primer may refer to a nucleotide sequence that is universal across all random barcodes. Universal adaptor primers can be used to construct gene-specific random barcodes. The length of the universal adaptor primer may be, or be, about 1, 2, 3, 4, 5, 6, 7, 8, 9, 10, 11, 12, 13, 14, 15, 16, 17, 18, 19, 20, 21, 22, 23, 24, 25, 26, 27, 28, 29, 30 nucleotides in length, or a number or range between any two of these values. The universal adaptor primer may be at least, or at most 1, 2, 3, 4, 5, 6, 7, 8, 9, 10, 11, 12, 13, 14, 15, 16, 17, 18, 19, 20, 21, 22, 23, 24, 25, 26, 27, 28, 29, or 30 nucleotides in length. The length of the universal adaptor primer may be from 5-30 nucleotides.
Solid support
In some embodiments, the random barcodes disclosed herein can be associated with a solid support. For example, the solid support may be a synthetic particle. In some embodiments, some or all of the molecular labels (e.g., the first molecular label) of the plurality of stochastic barcodes (e.g., the first plurality of stochastic barcodes) on the solid support have a difference of at least one nucleotide. The cell labels of the random barcodes on the same solid support may be identical. The cell labels of the random barcodes on different solid supports may differ by at least one nucleotide. For example, first cell markers of a first plurality of stochastic barcodes on a first solid support may have the same sequence, and second cell markers of a second plurality of stochastic barcodes on a second solid support may have the same sequence. The first cellular labels of the first plurality of stochastic barcodes on the first solid support and the second cellular labels of the second plurality of stochastic barcodes on the second solid support may differ by at least one nucleotide. The cellular marker may be, for example, about 5-20 nucleotides in length. The molecular marker may be, for example, about 5-20 nucleotides in length. The synthetic particles may be, for example, beads.
The beads may be, for example, silica gel beads, controlled pore glass beads, magnetic beads, dynabeads, sephadex/agarose beads, beaded cellulose, polystyrene beads, or any combination thereof. The beads can comprise a material such as Polydimethylsiloxane (PDMS), polystyrene, glass, polypropylene, agarose, gelatin, hydrogel, paramagnetic, ceramic, plastic, glass, methylstyrene, acrylic polymer, titanium, latex, agarose, cellulose, nylon, silicone, or any combination thereof.
In some embodiments, the beads can be polymeric microspheres (e.g., deformable beads or gel beads) functionalized with random barcodes (e.g., gel beads from 10X Genomics (san francisco, california)). In some implementations, the gel beads can include a polymer-based gel. For example, gel beads may be produced by encapsulating one or more polymer precursors into droplets. Upon exposure of the polymer precursor to an accelerator, such as Tetramethylethylenediamine (TEMED), gel beads may be produced.
In some embodiments, polymeric microspheres can, for example, dissolve, melt, or degrade under desired conditions. The desired conditions may include environmental conditions. The desired conditions may result in the polymeric microspheres dissolving, melting, or degrading in a controlled manner. The gel beads may dissolve, melt, or degrade due to chemical stimulation, physical stimulation, biological stimulation, thermal stimulation, magnetic stimulation, electrical stimulation, optical stimulation, or any combination thereof.
Analytes and/or reagents (such as oligonucleotide barcodes) may be coupled/immobilized, for example, to the inner surface of the gel bead (the accessible interior of the oligonucleotide barcode and/or diffusion of the material used to generate the oligonucleotide barcode) and/or to the outer surface of the gel bead or any other microcapsule described herein. The coupling/immobilization may be via any form of chemical bond (e.g., covalent bond, ionic bond) or physical phenomenon (e.g., van der waals forces, dipole-dipole interactions, etc.). In some cases, coupling/immobilization of the agent to the gel bead or any other microcapsule described herein can be reversible, e.g., via a labile moiety (e.g., via a chemical crosslinker, including chemical crosslinkers described herein). Upon application of the stimulus, the labile moiety can be cleaved and the immobilized reagent released. In some cases, the labile moiety is a disulfide bond. For example, where the oligonucleotide barcodes are immobilized to the gel beads via disulfide bonds, exposure of the disulfide bonds to a reducing agent can cleave the disulfide bonds and release the oligonucleotide barcodes from the beads. The labile moiety may be included as part of the gel bead or microcapsule, as part of a chemical linker that links the reagent or analyte to the gel bead or microcapsule, and/or as part of the reagent or analyte.
In some embodiments, the gel beads may comprise a wide variety of different polymers, including but not limited to: polymers, thermosensitive polymers, photosensitive polymers, magnetic polymers, pH sensitive polymers, salt sensitive polymers, chemically sensitive polymers, polyelectrolytes, polysaccharides, peptides, proteins, and/or plastics. The polymer may include, but is not limited to, the following materials: such as poly (N-isopropylacrylamide) (PNIPAAm), poly (styrene sulfonate) (PSS), poly (allylamine) (PAAm), poly (acrylic acid) (PAA), poly (ethylenimine) (PEI), poly (diallyldimethyl-ammonium chloride) (PDADMAC), poly (pyrrole) (PPy), poly (vinylpyrrolidone) (PVPON), poly (vinylpyridine) (PVP), poly (methyl methacrylate) (PMAA), poly (methyl methacrylate) (PMMA), Polystyrene (PS), poly (tetrahydrofuran) (PTHF), poly (phthalaldehyde) (PTHF), poly (hexylviologen) (PHV), poly (L-lysine) (PLL), poly (L-arginine) (PARG), poly (lactic-glycolic acid) (PLGA).
A number of chemical stimuli can be used to trigger the destruction or degradation of the beads. Examples of such chemical changes may include, but are not limited to, pH-mediated changes to the bead wall, decomposition of the bead wall via chemical cleavage of cross-links, triggered disaggregation of the bead wall, and bead wall switching reactions. Batch changes can also be used to trigger bead destruction.
Batch or physical changes to microcapsules by various stimuli also provide many advantages in designing the capsules to release the agent. Batch or physical changes occur on a macroscopic scale, where bead rupture is the result of mechanical-physical forces caused by the stimulus. These processes may include, but are not limited to, pressure induced cracking, bead wall melting, or changes in the porosity of the bead wall.
Biostimulation can also be used to trigger the destruction or degradation of the beads. Generally, biological triggers are similar to chemical triggers, but many examples use biomolecules, or molecules common in living systems, such as enzymes, peptides, sugars, fatty acids, nucleic acids, and the like. For example, the beads may comprise a polymer with peptide crosslinks that are susceptible to cleavage by a particular protease. More specifically, one example may comprise microcapsules containing GFLGK peptide cross-links. Upon addition of a biological trigger (e.g. protease cathepsin B), the peptide cross-links of the shell pores are cleaved and the contents of the beads are released. In other cases, the protease may be heat-activated. In another example, the bead comprises a shell wall comprising cellulose. The addition of the hydrolase chitosan serves as a biological trigger for the cleavage of the cellulose linkages, the depolymerization of the shell wall, and the release of the internal contents.
The beads may also be induced to release their contents upon application of a thermal stimulus. Changes in temperature can result in various changes to the beads. The change in heat may cause the beads to melt, causing the bead walls to disintegrate. In other cases, the heat may increase the internal pressure of the internal components of the beads, causing the beads to rupture or explode. In still other cases, the heat may cause the beads to become a contracted dehydrated state. Heat can also act on the thermosensitive polymer within the bead wall, causing damage to the bead.
The inclusion of magnetic nanoparticles in the bead walls of the microcapsules may allow triggered rupture of the beads and direct the beads into an array. The devices of the present disclosure may contain magnetic beads for either purpose. In one example, Fe3O4The incorporation of nanoparticles into polyelectrolyte-containing beads triggers rupture in the presence of an oscillating magnetic field stimulus.
The beads may also be destroyed or degraded as a result of the electrical stimulation. Similar to the magnetic particles described in the previous section, the electrically sensitive beads may allow triggered rupture of the beads as well as other functions such as alignment in an electric field, conductivity or redox reactions. In one example, beads containing electrically sensitive material are aligned in an electric field so that the release of internal reagents can be controlled. In other examples, the electric field may cause a redox reaction within the bead walls themselves, which may increase porosity.
The beads can also be disrupted by light stimulation. Many optical triggers are possible and may include systems using various molecules such as nanoparticles and chromophores capable of absorbing photons of a particular wavelength range. For example, a metal oxide coating may be used as a capsule trigger. Coated with SiO2The UV irradiation of the polyelectrolyte capsule of (a) may result in disintegration of the bead wall. In yet another example, a photo-switchable material (such as an azobenzene group) may be incorporated into the bead wall. Chemicals such as these undergo reversible cis-trans isomerization upon absorption of a photon upon application of UV or visible light. In this regard, the incorporation of photon switching results in the bead wall being disintegrable or becoming more porous upon application of the photo-trigger.
For example, in the non-limiting example of random barcoding illustrated in fig. 2, after introducing a cell (e.g., a single cell) into a plurality of microwells of a microwell array at block 208, beads may be introduced onto the plurality of microwells of the microwell array at block 212. Each microwell may contain one bead. The beads may comprise a plurality of random barcodes. The stochastic barcode can comprise a 5' amine region attached to a bead. The stochastic barcode may comprise a universal label, a molecular label, a target binding region, or any combination thereof.
The stochastic barcodes disclosed herein can be associated with (e.g., attached to) a solid support (e.g., a bead). The random barcodes associated with the solid support may each comprise a molecular tag selected from the group consisting of: at least 100 or 1000 molecular markers having a unique sequence. In some embodiments, different random barcodes associated with a solid support can comprise different sequences of molecular tags. In some embodiments, a percentage of the random barcodes associated with the solid support comprise the same cell label. For example, the percentage may be, or be about 60%, 70%, 80%, 85%, 90%, 95%, 97%, 99%, 100%, or a number or range between any two of these values. As another example, the percentage may be at least, or at most, 60%, 70%, 80%, 85%, 90%, 95%, 97%, 99%, or 100%. In some embodiments, the random barcodes associated with the solid supports can have the same cellular label. The random barcodes associated with the different solid supports may have different cellular markers selected from the group consisting of: at least 100 or 1000 cell markers with unique sequences.
The random barcodes disclosed herein can be associated with (e.g., attached to) a solid support (e.g., a bead). In some embodiments, a plurality of targets in a sample can be randomly barcoded with a solid support comprising a plurality of synthesized particles associated with a plurality of random barcodes. In some embodiments, the solid support can include a plurality of synthesized particles associated with a plurality of random barcodes. The spatial labels of the plurality of stochastic barcodes on different solid supports may differ by at least one nucleotide. The solid support can, for example, comprise a plurality of random barcodes in two or three dimensions. The synthetic particles may be beads. The beads may be silica gel beads, controlled pore glass beads, magnetic beads, dynabeads, sephadex/agarose beads, beaded cellulose, polystyrene beads, or any combination thereof. The solid support may comprise a polymer, a matrix, a hydrogel, a needle array device, an antibody, or any combination thereof. In some embodiments, the solid support can be free floating. In some embodiments, the solid support can be embedded in a semi-solid or solid array. The random barcode may not be associated with a solid support. The random barcode may be an individual nucleotide. A random barcode may be associated with the substrate.
As used herein, the terms "tether," "attach," and "immobilization" are used interchangeably and may refer to a covalent or non-covalent means for attaching a stochastic barcode to a solid support. Any of a variety of different solid supports can be used as a solid support for attaching pre-synthesized stochastic barcodes or for in situ solid phase synthesis of stochastic barcodes.
In some embodiments, the solid support is a bead. The beads may comprise one or more types of solid, porous, or hollow spheres, seats, cylinders, or other similar configurations on which nucleic acids may be immobilized (e.g., covalently or non-covalently). The beads may be constructed, for example, of plastic, ceramic, metal, polymeric material, or any combination thereof. The beads may be, or comprise, discrete particles that are spherical (e.g., microspheres) or have an aspherical or irregular shape, such as cubic, oblong, pyramidal, cylindrical, conical, elliptical, or disk-shaped, and the like. In some embodiments, the shape of the beads may be non-spherical.
The beads may comprise a variety of materials including, but not limited to, paramagnetic materials (e.g., magnesium, molybdenum, lithium, and tantalum), superparamagnetic materials (e.g., ferrite (Fe) 3O4(ii) a Magnetite), ferromagnetic materials (e.g., iron, nickel, cobalt, some alloys thereof, and some rare earth metal compounds), ceramics, plastics, glass, polystyrene, silica, methylstyrene, acrylic polymers, titanium, latex, crosslinked agarose, hydrogel, polymers, cellulose, nylon, or any combination thereof.
In some embodiments, the beads (e.g., beads to which the random marker is attached) are hydrogel beads. In some embodiments, the bead comprises a hydrogel.
Some embodiments disclosed herein include one or more particles (e.g., beads). Each of the particles may comprise a plurality of oligonucleotides (e.g., random barcodes). Each of the plurality of oligonucleotides can comprise a molecular marker sequence, a cellular marker sequence, and target binding (e.g., an oligo dT sequence, a gene-specific sequence, a random multimer, or a combination thereof). The cellular marker sequence of each of the plurality of oligonucleotides may be the same. The cellular marker sequences of the oligonucleotides on different particles may be different, so that the oligonucleotides on different particles can be identified. In different implementations, the number of different cell marker sequences can be different. In some embodiments, the number of cell marker sequences can be, or is about 10, 100, 200, 300, 400, 500, 600, 700, 800, 900, 1000, m, 2000、3000、4000、5000、6000、7000、8000、9000、10000、20000、30000、40000、50000、60000、70000、80000、90000、100000、106、107、108、109A number or range between any two of these values, or more. In some embodiments, the number of cell marker sequences can be at least, or at most 10, 100, 200, 300, 400, 500, 600, 700, 800, 900, 1000, 2000, 3000, 4000, 5000, 6000, 7000, 8000, 9000, 10000, 20000, 30000, 40000, 50000, 60000, 70000, 80000, 90000, 100000, 106、107、108、109. In some embodiments, no more than 1, 2, 3, 4, 5, 6, 7, 8, 9, 10, 20, 30, 40, 50, 60, 70, 80, 90, 100, 200, 300, 400, 500, 600, 700, 800, 900, 1000, or more of the plurality of particles comprise oligonucleotides having the same cellular sequence. In some embodiments, the plurality of particles comprising oligonucleotides having the same cellular sequence may be at most 0.1%, 0.2%, 0.3%, 0.4%, 0.5%, 0.6%, 0.7%, 0.8%, 0.9%, 1%, 2%, 3%, 4%, 5%, 6%, 7%, 8%, 9%, 10% or more. In some embodiments, none of the plurality of particles have the same cell marker sequence.
The plurality of oligonucleotides on each particle may comprise different molecular marker sequences. In some embodiments, the number of molecular marker sequences can be, or is, about 10, 100, 200, 300, 400, 500, 600, 700, 800, 900, 1000, 2000, 3000, 4000, 5000, 6000, 7000, 8000, 9000, 10000, 20000, 30000, 40000, 50000, 60000, 70000, 80000, 90000, 100000, 10 6、107、108、109Or a number or range between any two of these values, or more. In some embodiments, the number of molecular marker sequences may be at least, or at most 10, 100, 200, 300, 400, 500, 600, 700, 800, 900, 1000, 2000, 3000, 4000, 5000, 6000, 7000, 8000, 9000, 10000, 20000, 30000, 40000, 50000, 60000, 70000, 80000, 90000, 100000, 106、107、108、109. For example, at least 100 of the plurality of oligonucleotides comprise different molecular marker sequences. As another example, at least 100, 500, 1000, 5000, 10000, 15000, 20000, 50000, numbers or ranges between any two of these values, or more of the plurality of oligonucleotides comprise different molecular marker sequences in a single particle. Some embodiments provide a plurality of particles comprising a random barcode. In some embodiments, the ratio of occurrences (or copies or numbers) of target to be labeled and different molecular marker sequences may be at least 1:1, 1:2, 1:3, 1:4, 1:5, 1:6, 1:7, 1:8, 1:9, 1:10, 1:11, 1:12, 1:13, 1:14, 1:15, 1:16, 1:17, 1:18, 1:19, 1:20, 1:30, 1:40, 1:50, 1:60, 1:70, 1:80, 1:90, or higher. In some embodiments, each of the plurality of oligonucleotides further comprises a sample tag, a universal tag, or both. The particles may be, for example, nanoparticles or microparticles.
The size of the beads may vary. For example, the beads may range from 0.1 microns to 50 microns in diameter. In some embodiments, the diameter of the bead may be or be about 0.1, 0.5, 1, 2, 3, 4, 5, 6, 7, 8, 9, 10, 20, 30, 40, 50 microns, or between any two of these values or a number or range.
The diameter of the bead may be related to the diameter of the pores of the substrate. In some embodiments, the diameter of the bead may be longer or shorter, or about 10%, 20%, 30%, 40%, 50%, 60%, 70%, 80%, 90%, 100%, or a number or range between any two of these values, than the diameter of the pore. The diameter of a bead may be related to the diameter of a cell (e.g., a single cell trapped by a pore of a substrate). In some embodiments, the diameter of the bead may be longer or shorter, or about 10%, 20%, 30%, 40%, 50%, 60%, 70%, 80%, 90%, 100%, 150%, 200%, 250%, 300%, or a number or range between any two of these values, as compared to the diameter of the cell.
The beads may be attached to and/or embedded in a substrate. The beads may be attached to and/or embedded in a gel, hydrogel, polymer, and/or matrix. The spatial location of a bead in a substrate (e.g., a gel, substrate, scaffold, or polymer) can be identified using spatial tags present on random barcodes that can serve as location addresses in the bead.
Examples of beads may include, but are not limited to, streptavidin beads, agarose beads, magnetic beads, and the like, Microbeads, antibody-conjugated beads (e.g., anti-immunoglobulin microbeads), protein A-conjugated beads, protein G-conjugated beads, protein A/G conjugated beads, protein L-conjugated beads, oligo (dT) conjugated beads, silica-like beads, avidin beads, anti-fluorescent dye beads, and BcMagTMA carboxyl-terminated magnetic bead.
The beads may be associated with (e.g. impregnated with) quantum dots or fluorescent dyes so that they are fluorescent in a fluorescent light channel or channels. The beads may be associated with iron oxide or chromium oxide to render them paramagnetic or ferromagnetic. The beads are identifiable. For example, the beads can be imaged using a camera. The beads may have a detectable code associated with the beads. For example, the beads may comprise a random barcode. The size of the beads may vary, for example due to swelling in organic or inorganic solutions. The beads may be hydrophobic. The beads may be hydrophilic. The beads may be biocompatible.
The solid support (e.g., beads) can be visualized. The solid support may include a visualization tag (e.g., a fluorescent dye). The solid support (e.g., bead) can be etched with an identifier (e.g., a number). The identifier can be visualized by imaging the bead.
Substrate and microwell array
As used herein, a substrate may refer to a solid support. A substrate may refer to a solid support that may comprise a random barcode of the present disclosure. For example, the substrate may include a plurality of micropores. For example, the substrate may be an array of wells comprising two or more microwells. In some embodiments, the microwell may include a small reaction chamber having a defined volume. In some embodiments, the microwells can retain one or more cells. In some embodiments, the microwells can retain only one cell. In some embodiments, the microwells can retain one or more solid supports. In some embodiments, the microwells can retain only one solid support. In some embodiments, the microwells retain a single cell and a single solid support (e.g., a bead).
Random bar code method
The present disclosure provides methods for estimating the number of different targets at different locations in a body sample (e.g., tissue, organ, tumor, cell). These methods can include placing a random barcode near the sample, lysing the sample, associating different targets with the random barcode, amplifying the targets and/or digitally counting the targets. The method may further include analyzing and/or visualizing information obtained from the spatial indicia on the stochastic barcode. In some embodiments, the method comprises visualizing a plurality of targets in the sample. Mapping the plurality of targets onto the map of the sample may include generating a two-dimensional map or a three-dimensional map of the sample. The two-dimensional map and the three-dimensional map may be generated before or after random barcoding of a plurality of targets in the sample. Visualizing the plurality of targets in the sample includes mapping the plurality of targets onto a map of the sample. Mapping the plurality of targets onto the map of the sample may include generating a two-dimensional map or a three-dimensional map of the sample. The two-dimensional map and the three-dimensional map may be generated before or after random barcoding of a plurality of targets in the sample. In some embodiments, the two-dimensional map and the three-dimensional map may be generated before or after lysing the sample. Lysing the sample before or after generating the two-dimensional map or the three-dimensional map may include heating the sample, contacting the sample with a detergent, changing the pH of the sample, or any combination thereof.
In some embodiments, randomly barcoding the plurality of targets comprises hybridizing a plurality of random barcodes to the plurality of targets to create randomly barcoded targets. Randomly barcoding a plurality of targets can include generating an indexed library of randomly barcoded targets. Generating an indexed library of randomly barcoded targets can be performed with a solid support comprising a plurality of random barcodes.
Contacting the sample with a random barcode
The present disclosure provides methods for contacting a sample (e.g., a cell) with a substrate of the present disclosure. A sample comprising, for example, a thin slice of a cell, organ, or tissue can be contacted with a random barcode. For example, the cells may be contacted by gravity flow, wherein the cells may be pelleted and a monolayer of cells produced. The sample may be a thin section of tissue. The thin slices may be placed on a substrate. The sample may be one-dimensional (e.g., form a plane). The sample (e.g., cells) can be coated on the substrate, for example, by growing/culturing the cells on the substrate.
When the stochastic barcode is close to the target, the target can hybridize to the stochastic barcode. The stochastic barcodes can be contacted at a non-exhaustible rate such that each different target can be associated with a different stochastic barcode of the disclosure. To ensure a valid association between the target and the stochastic barcode, the target may be cross-linked with the stochastic barcode.
Cell lysis
After distribution of the cells and the random barcodes, the cells can be lysed to release the target molecule. Cell lysis may be accomplished by any of a variety of means, such as by chemical or biochemical means, by osmotic shock, or by thermal, mechanical, or optical lysis. The cells may be lysed by adding a cell lysis buffer comprising a detergent (e.g., SDS, lithium dodecyl sulfate, Triton X-100, Tween-20, or NP-40), an organic solvent (e.g., methanol or acetone), or a digestive enzyme (e.g., proteinase K, pepsin, or trypsin), or any combination thereof. To increase the association of the target and the stochastic barcode, the diffusion rate of the target molecules can be altered by, for example, reducing the temperature and/or increasing the viscosity of the lysate.
In some embodiments, the sample may be lysed using filter paper. The filter paper may be impregnated with lysis buffer on top of the filter paper. The filter paper may be applied to the sample under pressure that may facilitate lysis of the sample and hybridization of the target of the sample to the substrate.
In some embodiments, the lysing may be performed by mechanical lysing, thermal lysing, optical lysing, and/or chemical lysing. Chemical cleavage may include the use of digestive enzymes such as proteinase K, pepsin, and trypsin. Lysis may be performed by adding lysis buffer to the substrate. The lysis buffer may comprise Tris HCl. The lysis buffer may comprise at least about 0.01M, 0.05M, 0.1M, 0.5M, or 1M or more Tris HCl. The lysis buffer may comprise up to about 0.01M, 0.05M, 0.1M, 0.5M, or 1M or more Tris HCL. The lysis buffer may comprise about 0.1M Tris HCl. The pH of the lysis buffer can be at least about 1, 2, 3, 4, 5, 6, 7, 8, 9, or 10, or higher. The pH of the lysis buffer may be up to about 1, 2, 3, 4, 5, 6, 7, 8, 9, or 10, or higher. In some embodiments, the pH of the lysis buffer is about 7.5. The lysis buffer may include a salt (e.g., LiCl). The concentration of the salt in the lysis buffer may be at least about 0.1M, 0.5M, or 1M, or higher. The concentration of salt in the lysis buffer may be up to about 0.1M, 0.5M, or 1M, or higher. In some embodiments, the concentration of salt in the lysis buffer is about 0.5M. Lysis buffer may include detergents (e.g., SDS, lithium dodecyl sulfate, Triton X, Tween, NP-40). The concentration of the detergent in the lysis buffer can be at least about 0.0001%, 0.0005%, 0.001%, 0.005%, 0.01%, 0.05%, 0.1%, 0.5%, 1%, 2%, 3%, 4%, 5%, 6%, or 7%, or higher. The concentration of the detergent in the lysis buffer may be up to about 0.0001%, 0.0005%, 0.001%, 0.005%, 0.01%, 0.05%, 0.1%, 0.5%, 1%, 2%, 3%, 4%, 5%, 6%, or 7%, or higher. In some embodiments, the concentration of the detergent in the lysis buffer is about 1% lithium dodecyl sulfate. The time used in the lysis process may depend on the amount of detergent used. In some embodiments, the more detergent used, the shorter the time required for lysis. The lysis buffer may include a chelating agent (e.g., EDTA, EGTA). The concentration of the chelating agent in the lysis buffer may be at least about 1mM, 5mM, 10mM, 15mM, 20mM, 25mM, or 30mM or higher. The concentration of the chelating agent in the lysis buffer may be up to about 1, 5, 10, 15, 20, 25, or 30mM or more. In some embodiments, the concentration of the chelating agent in the lysis buffer is about 10 mM. The lysis buffer may include a reducing agent (e.g., beta-mercaptoethanol, DTT). The concentration of the reducing agent in the lysis buffer can be at least about 1, 5, 10, 15, or 20mM or higher. The concentration of the reducing agent in the lysis buffer may be up to about 1, 5, 10, 15, or 20mM or more. In some embodiments, the concentration of the reducing agent in the lysis buffer is about 5 mM. In some embodiments, the lysis buffer may comprise about 0.1M Tris HCl, about pH 7.5, about 0.5M LiCl, about 1% lithium dodecyl sulfate, about 10mM EDTA, and about 5mM DTT.
The cleavage can be carried out at a temperature of about 4 deg.C, 10 deg.C, 15 deg.C, 20 deg.C, 25 deg.C, or 30 deg.C. Lysis may be performed for about 1 minute, 5 minutes, 10 minutes, 15 minutes, or 20 minutes or more. The lysed cells can comprise at least about 100000, 200000, 300000, 400000, 500000, 600000, or 700000 target nucleic acid molecules, or more. Lysed cells can comprise up to about 100000, 200000, 300000, 400000, 500000, 600000, or 700000 target nucleic acid molecules, or more.
Attaching random barcodes to target nucleic acid molecules
After cell lysis and release of nucleic acid molecules therefrom, the nucleic acid molecules may be randomly associated with the random barcode of the co-located solid support. Association can include hybridization of the target recognition region of the stochastic barcode to a complementary portion of the target nucleic acid molecule (e.g., oligo (dT) of the stochastic barcode can interact with the poly (a) tail of the target). The assay conditions (e.g., buffer pH, ionic strength, temperature, etc.) used for hybridization can be selected to facilitate the formation of a particular stable hybrid. In some embodiments, the nucleic acid molecule released from the lysed cells can be associated with (e.g., hybridized to) a plurality of probes on a substrate. When the probe comprises oligo (dT), an mRNA molecule may be hybridized to the probe and reverse transcribed. The oligo (dT) portion of the oligonucleotide may be used as a primer for first strand synthesis of a cDNA molecule. For example, in the non-limiting example of stochastic barcoding illustrated in fig. 2 (at block 216), mRNA molecules can hybridize to the stochastic barcodes on the beads. For example, a single-stranded nucleotide fragment can hybridize to the target-binding region of the stochastic barcode.
Attachment may also include the attachment of a target recognition region of a stochastic barcode to a portion of a target nucleic acid molecule. For example, the target binding region may comprise a nucleic acid sequence that may be capable of specifically hybridizing to a restriction site overhang (e.g., an EcoRI sticky end overhang). The assay procedure may also include treating the target nucleic acid with a restriction enzyme (e.g., EcoRI) to create a restriction site overhang. The stochastic barcode can then be ligated to any nucleic acid molecule that contains sequences complementary to the restriction site overhangs. A ligase (e.g., T4 DNA ligase) may be used to join the two fragments.
For example, in the non-limiting example of stochastic barcoding illustrated in fig. 2 (at block 220), labeled targets (e.g., target-barcode molecules) from multiple cells (or multiple samples) can then be pooled, for example, into a tube. The labeled target may be pooled by, for example, recovering the stochastic barcode and/or the beads to which the target-barcode molecule is attached.
Retrieval of the set of attached target-barcode molecules based on a solid support can be achieved by using magnetic beads and an externally applied magnetic field. Once the target-barcode molecule has pooled, all further processing can be performed in a single reaction vessel. Further processing may include, for example, reverse transcription reactions, amplification reactions, cleavage reactions, dissociation reactions, and/or nucleic acid extension reactions. Further processing reactions can be performed within the microwells, i.e., without first pooling labeled target nucleic acid molecules from multiple cells.
Reverse transcription
The present disclosure provides methods of generating random target-barcode conjugates using reverse transcription (in block 224 of fig. 2). The random target-barcode conjugate can include a random barcode and a complementary sequence of all or part of the target nucleic acid (i.e., a random barcode-encoded cDNA molecule). Reverse transcription of the associated RNA molecule can occur by the addition of a reverse transcription primer in conjunction with a reverse transcriptase. The reverse transcription primer may be an oligo dT primer, a random hexanucleotide primer or a target specific oligonucleotide primer. The oligo (dT) primer may be, or may be, about 12-18 nucleotides in length and binds to the endogenous poly (A) tail at the 3' end of mammalian mRNA. Random hexanucleotide primers can bind to mRNA at multiple complementary sites. Target-specific oligonucleotide primers typically selectively prime the mRNA of interest.
In some embodiments, reverse transcription of the labeled RNA molecule can be performed by adding a reverse transcription primer. In some embodiments, the reverse transcription primer is an oligo (dT) primer, a random hexanucleotide primer, or a target-specific oligonucleotide primer. Typically, oligo (dT) primers are 12-18 nucleotides in length and bind to the endogenous poly (A) + tail at the 3' end of mammalian mRNA. Random hexanucleotide primers can bind to mRNA at multiple complementary sites. Target-specific oligonucleotide primers typically selectively prime the mRNA of interest.
Reverse transcription can occur repeatedly to produce multiple labeled cDNA molecules. The methods disclosed herein can include performing at least about 1, 2, 3, 4, 5, 6, 7, 8, 9, 10, 11, 12, 13, 14, 15, 16, 17, 18, 19, or 20 reverse transcription reactions. The method may comprise performing at least about 25, 30, 35, 40, 45, 50, 55, 60, 65, 70, 75, 80, 85, 90, 95, or 100 reverse transcription reactions.
Amplification of
One or more nucleic acid amplification reactions can be performed (e.g., in block 228 of fig. 2) to generate multiple copies of a labeled target nucleic acid molecule. Amplification can be performed in a multiplex format, in which multiple target nucleic acid sequences are amplified simultaneously. Amplification reactions can be used to add sequencing adaptors to nucleic acid molecules. The amplification reaction may comprise amplifying at least a portion of the label (if present) of the sample. The amplification reaction may comprise amplifying at least a portion of the cells and/or the molecular marker. The amplification reaction can include amplifying at least a portion of the sample tag, the cellular marker, the spatial marker, the molecular marker, the target nucleic acid, or a combination thereof. The amplification reaction can include amplifying 0.5%, 1%, 2%, 3%, 4%, 5%, 6%, 7%, 8%, 9%, 10%, 15%, 20%, 25%, 30%, 35%, 40%, 45%, 50%, 55%, 60%, 65%, 70%, 75%, 80%, 85%, 90%, 95%, 97%, 100%, or a number or range between any two of these values, of the plurality of nucleic acids. The method may further comprise performing one or more cDNA synthesis reactions to produce one or more cDNA copies of the target-barcode molecule comprising the sample tag, the cellular tag, the spatial tag, and/or the molecular tag.
In some embodiments, the amplification may be performed using Polymerase Chain Reaction (PCR). As used herein, PCR may refer to a reaction for the in vitro amplification of specific DNA sequences by simultaneous primer extension of complementary strands of DNA. As used herein, PCR may include derivatives of the reaction, including but not limited to RT-PCR, real-time PCR, nested PCR, quantitative PCR, multiplex PCR, digital PCR, and assembly PCR.
Amplification of the labeled nucleic acid may include non-PCR based methods. Examples of non-PCR based methods include, but are not limited to, Multiple Displacement Amplification (MDA), Transcription Mediated Amplification (TMA), Nucleic Acid Sequence Based Amplification (NASBA), Strand Displacement Amplification (SDA), real-time SDA, rolling circle amplification, or loop-to-loop amplification. Other non-PCR-based amplification methods include DNA-dependent RNA polymerase driven RNA transcription amplification or multiple cycles of RNA-guided DNA synthesis and transcription to amplify DNA or RNA targets, Ligase Chain Reaction (LCR), and Q β replicase (Q β) methods, use of palindromic probes, strand displacement amplification, oligonucleotide driven amplification using restriction endonucleases, amplification methods that hybridize primers to nucleic acid sequences and cleave the resulting duplexes prior to extension reaction and amplification, strand displacement amplification using nucleic acid polymerases lacking 5' exonuclease activity, rolling circle amplification, and branch extension amplification (RAM). In some embodiments, amplification does not produce circularized transcripts.
In some embodiments, the methods disclosed herein further comprise performing a polymerase chain reaction on the labeled nucleic acids (e.g., labeled RNA, labeled DNA, labeled cDNA) to generate randomly labeled amplicons. The labeled amplicon may be a double stranded molecule. The double-stranded molecule may comprise a double-stranded RNA molecule, a double-stranded DNA molecule, or an RNA molecule that hybridizes to a DNA molecule. One or both strands of the double-stranded molecule may comprise a sample label, a spatial label, a cellular label, and/or a molecular label. The randomly labeled amplicon may be a single stranded molecule. The single-stranded molecule may comprise DNA, RNA, or a combination thereof. The nucleic acids of the disclosure may comprise synthetic or altered nucleic acids.
Amplification may include the use of one or more non-natural nucleotides. Non-natural nucleotides can include photolabile or triggerable nucleotides. Examples of non-natural nucleotides may include, but are not limited to, Peptide Nucleic Acids (PNA), morpholino and Locked Nucleic Acids (LNA), and diol nucleic acids (GNA) and Threose Nucleic Acids (TNA). Non-natural nucleotides can be added to one or more cycles of the amplification reaction. The addition of non-natural nucleotides can also be used to identify products at specific cycles or time points in the amplification reaction.
Performing one or more amplification reactions may include using one or more primers. One or more primers can comprise, for example, 1, 2, 3, 4, 5, 6, 7, 8, 9, 10, 11, 12, 13, 14, or 15 or more nucleotides. The one or more primers can comprise at least 1, 2, 3, 4, 5, 6, 7, 8, 9, 10, 11, 12, 13, 14, or 15 or more nucleotides. The one or more primers may comprise less than 12-15 nucleotides. One or more primers can anneal to at least a portion of the plurality of randomly labeled targets. One or more primers can anneal to the 3 'end or the 5' end of a plurality of randomly labeled targets. One or more primers can anneal to an interior region of a plurality of randomly labeled targets. The inner region can be at least about 50, 100, 150, 200, 220, 230, 240, 250, 260, 270, 280, 290, 300, 310, 320, 330, 340, 350, 360, 370, 380, 390, 400, 410, 420, 430, 440, 450, 460, 470, 480, 490, 500, 510, 520, 530, 540, 550, 560, 570, 580, 590, 600, 650, 700, 750, 800, 850, 900, or 1000 nucleotides from the 3' end of the plurality of randomly labeled targets. The one or more primers may comprise a set of immobilized primers. The one or more primers can include at least one or more custom primers. The one or more primers can include at least one or more control primers. The one or more primers may comprise at least one or more gene-specific primers.
The one or more primers may comprise a universal primer. The universal primer can anneal to the universal primer binding site. One or more custom primers can anneal to a first sample tag, a second sample tag, a spatial tag, a cellular tag, a molecular tag, a target, or any combination thereof. The one or more primers can include a universal primer and a custom primer. Custom primers can be designed to amplify one or more targets. The target may comprise a subset of the total nucleic acids in one or more samples. The target may comprise a subset of the total randomly labeled target in the one or more samples. The one or more primers can include at least 96 or more custom primers. The one or more primers can include at least 960 or more custom primers. The one or more primers can include at least 9600 or more custom primers. One or more custom primers can anneal to two or more different labeled nucleic acids. Two or more different labeled nucleic acids may correspond to one or more genes.
Any amplification protocol can be used in the methods of the present disclosure. For example, in one protocol, a first round of PCR can amplify molecules attached to beads using gene specific primers and primers directed to universal hamma (Illumina) sequencing primer 1 sequences. The second round of PCR can amplify the first PCR product using nested gene-specific primers flanked by the sequences of the universal promodia sequencing primer 1 and primers directed against the sequences of the promodia sequencing primer 2. The third round of PCR adds P5 and P7, as well as sample indexing, to bring the PCR products into the hammda sequencing library. Sequencing using 150bp x 2 sequencing can reveal cellular and molecular markers on read 1, genes on read 2, and sample indices on index 1 reads.
In some embodiments, the nucleic acid may be removed from the substrate using chemical cleavage. For example, chemical groups or modified bases present in nucleic acids can be used to facilitate their removal from the solid support. For example, enzymes may be used to remove nucleic acids from a substrate. For example, nucleic acids can be removed from the substrate by restriction endonuclease digestion. For example, treatment of nucleic acids containing dUTP or ddUTP with uracil-d-glycosylase (UDG) can remove the nucleic acids from the substrate. For example, nucleic acids can be removed from a substrate using an enzyme for nucleotide excision, e.g., a base excision repair enzyme (e.g., an apurinic/Apyrimidinic (AP) endonuclease). In some embodiments, nucleic acids can be removed from the substrate using photolabile (photolabile) groups as well as light. In some embodiments, nucleic acids can be removed from a substrate using a cleavable linker. For example, the cuttable joint may include at least one of: biotin/avidin, biotin/streptavidin, biotin/neutravidin, Ig protein a, a photolabile linker, an acid or base labile linker group, or an aptamer.
When the probes are gene-specific, these molecules can be hybridized to the probes and reverse transcribed and/or amplified. In some embodiments, the nucleic acid can be amplified after it has been synthesized (e.g., reverse transcribed). Amplification can be performed in a multiplex format, in which multiple target nucleic acid sequences are amplified simultaneously. Amplification may add sequencing adapters to the nucleic acids.
In some embodiments, amplification can be performed on a substrate, for example, with bridging amplification. The cDNA may be homopolymeric tail, using an oligo (dT) probe on a substrate to create compatible ends for bridge amplification. In bridging amplification, the primer complementary to the 3' end of the template nucleic acid may be the first primer of each pair of primers covalently attached to a solid particle. When a sample containing template nucleic acid is contacted with the particle and subjected to a single thermal cycle, the template molecule can anneal to the first primer, and the first primer is extended forward by the addition of nucleotides to form a duplex molecule comprised of the template molecule and a newly formed DNA strand that is complementary to the template. In the next cycle of heating steps, the duplex molecules may denature, releasing the template molecules from the particles, and attaching the complementary DNA strands to the particles by the first primer. In the annealing stage of the subsequent annealing and extension steps, the complementary strand may hybridize to a second primer that is complementary to a fragment of the complementary strand at the location removed from the first primer. This hybridization can result in the formation of a bridge between the first and second primers that is covalently immobilized to the first primer, and the formation of the second primer by hybridization. In the extension phase, the second primer can be extended in the opposite direction by adding nucleotides to the same reaction mixture, thereby converting the bridge to a double-stranded bridge. The next cycle is then started and the double stranded bridge can be denatured to produce two single stranded nucleic acid molecules, one end of each single stranded nucleic acid molecule being attached to the particle surface via the first and second primers respectively, wherein the other end of each single stranded nucleic acid molecule is unattached. In this second cycle of annealing and extension steps, each strand can hybridize to the same particle as an additional complementary primer not previously used to form a new single-stranded bridge. The now hybridized two previously unused primers are extended to convert the two new bridges into double-stranded bridges.
The amplification reaction can include amplifying at least 1%, 2%, 3%, 4%, 5%, 6%, 7%, 8%, 9%, 10%, 15%, 20%, 25%, 30%, 35%, 40%, 45%, 50%, 55%, 60%, 65%, 70%, 75%, 80%, 85%, 90%, 95%, 97%, or 100% of the plurality of nucleic acids.
Amplification of the labeled nucleic acid may include a PCR-based method or a non-PCR-based method. Amplification of the labeled nucleic acid may comprise exponential amplification of the labeled nucleic acid. Amplification of the labeled nucleic acid may comprise linear amplification of the labeled nucleic acid. Amplification may be performed by Polymerase Chain Reaction (PCR). PCR may refer to a reaction for the in vitro amplification of specific DNA sequences by simultaneous primer extension of complementary strands of DNA. PCR may encompass derivatives of this reaction, including, but not limited to, RT-PCR, real-time PCR, nested PCR, quantitative PCR, multiplex PCR, digital PCR, inhibition PCR, semi-inhibition PCR, and assembly PCR.
In some embodiments, the amplification of the labeled nucleic acid comprises a non-PCR-based method. Examples of non-PCR based methods include, but are not limited to, Multiple Displacement Amplification (MDA), Transcription Mediated Amplification (TMA), Nucleic Acid Sequence Based Amplification (NASBA), Strand Displacement Amplification (SDA), real-time SDA, rolling circle amplification, or loop-to-loop amplification. Other non-PCR-based amplification methods include DNA-dependent RNA polymerase driven RNA transcription amplification or multiple cycles of RNA-guided DNA synthesis and transcription to amplify DNA or RNA targets, Ligase Chain Reaction (LCR), Q β replicase (Q β), use of palindromic probes, strand displacement amplification, oligonucleotide driven amplification using restriction endonucleases, amplification methods that hybridize primers to nucleic acid sequences and cleave the resulting duplexes prior to extension reaction and amplification, strand displacement amplification using a nucleic acid polymerase lacking 5' exonuclease activity, rolling circle amplification, and branch extension amplification (RAM).
In some embodiments, the methods disclosed herein further comprise performing a nested polymerase chain reaction on the amplified amplicons (e.g., targets). The amplicon may be a double-stranded molecule. The double-stranded molecule may comprise a double-stranded RNA molecule, a double-stranded DNA molecule, or an RNA molecule that hybridizes to a DNA molecule. One or both strands of the double-stranded molecule may comprise a sample tag or molecular identifier label. Alternatively, the amplicon may be a single-stranded molecule. The single-stranded molecule may comprise DNA, RNA, or a combination thereof. The nucleic acids of the invention may include synthetic or altered nucleic acids.
In some embodiments, the method comprises iteratively amplifying the labeled nucleic acid to produce a plurality of amplicons. The methods disclosed herein can comprise performing at least about 1, 2, 3, 4, 5, 6, 7, 8, 9, 10, 11, 12, 13, 14, 15, 16, 17, 18, 19, or 20 amplification reactions. Alternatively, the method comprises performing at least about 25, 30, 35, 40, 45, 50, 55, 60, 65, 70, 75, 80, 85, 90, 95, or 100 amplification reactions.
Amplification may further comprise adding one or more control nucleic acids to one or more samples comprising a plurality of nucleic acids. Amplification may further comprise adding one or more control nucleic acids to the plurality of nucleic acids. The control nucleic acid can include a control marker.
Amplification may include the use of one or more non-natural nucleotides. Non-natural nucleotides can include photolabile and/or triggerable nucleotides. Examples of non-natural nucleotides include, but are not limited to, Peptide Nucleic Acids (PNA), morpholino and Locked Nucleic Acids (LNA), and diol nucleic acids (GNA) and Threose Nucleic Acids (TNA). Non-natural nucleotides can be added to one or more cycles of the amplification reaction. The addition of non-natural nucleotides can also be used to identify products at specific cycles or time points in the amplification reaction.
Performing one or more amplification reactions may include using one or more primers. The one or more primers may comprise one or more oligonucleotides. The one or more oligonucleotides may comprise at least about 7 to 9 nucleotides. One or more of the oligonucleotides may comprise less than 12-15 nucleotides. One or more primers can anneal to at least a portion of the plurality of labeled nucleic acids. The one or more primers can anneal to the 3 'end and/or the 5' end of the plurality of labeled nucleic acids. One or more primers can anneal to an internal region of the plurality of labeled nucleic acids. The inner region can be at least about 50, 100, 150, 200, 220, 230, 240, 250, 260, 270, 280, 290, 300, 310, 320, 330, 340, 350, 360, 370, 380, 390, 400, 410, 420, 430, 440, 450, 460, 470, 480, 490, 500, 510, 520, 530, 540, 550, 560, 570, 580, 590, 600, 650, 700, 750, 800, 850, 900, or 1000 nucleotides from the 3' end of the plurality of labeled nucleic acids. The one or more primers may comprise a set of immobilized primers. The one or more primers can include at least one or more custom primers. The one or more primers can include at least one or more control primers. The one or more primers may include at least one or more housekeeping gene primers. The one or more primers may comprise a universal primer. The universal primer can anneal to the universal primer binding site. The one or more custom primers can anneal to the first sample tag, the second sample tag, the molecular identifier marker, the nucleic acid, or a product thereof. The one or more primers can include a universal primer and a custom primer. Custom primers can be designed to amplify one or more target nucleic acids. The target nucleic acid can include a subset of the total nucleic acids in one or more samples. In some embodiments, the primers are probes attached to an array of the present disclosure.
In some embodiments, randomly barcoding the plurality of targets in the sample further comprises generating an indexed library of randomly barcoded fragments. The molecular markers of different stochastic barcodes may be different from each other. Generating an indexed library of randomly barcoded targets includes generating a plurality of index polynucleotides from a plurality of targets in a sample. For example, for an indexed library of randomly barcoded targets comprising a first indexing target and a second indexing target, the tag region of the first indexing polynucleotide may have, have about, have at least, or have at most 1, 2, 3, 4, 5, 6, 7, 8, 9, 10, 20, 30, 40, 50 nucleotide differences, or a number or range of nucleotide differences between any two of these values, from the tag region of the second indexing polynucleotide. In some embodiments, generating an indexed library of randomly barcoded targets comprises contacting a plurality of targets (e.g., mRNA molecules) with a plurality of oligonucleotides comprising a poly (T) region and a labeling region; and performing first strand synthesis using reverse transcriptase to generate single-stranded labeled cDNA molecules (each comprising a cDNA region and a label region), wherein the plurality of targets comprises at least two mRNA molecules of different sequences, and the plurality of oligonucleotides comprises at least two oligonucleotides of different sequences. Generating an indexed library of randomly barcoded targets may further comprise amplifying the single-stranded labeled cDNA molecules to generate double-stranded labeled cDNA molecules; and performing nested PCR on the double-stranded labeled cDNA molecules to produce labeled amplicons. In some embodiments, the method can include generating an adaptor-tagged amplicon.
Random barcodes can use nucleic acid barcodes or tags to label individual nucleic acid (e.g., DNA or RNA) molecules. In some embodiments, it involves the addition of a DNA barcode or tag to a cDNA molecule as they are generated from mRNA. Nested PCR can be performed to minimize PCR amplification bias. Adapters can be added for sequencing using Next Generation Sequencing (NGS). The sequencing results can be used, for example, at block 232 of fig. 2, to determine the sequence of one or more copies of the cellular marker, molecular marker, and nucleotide fragment of the target.
FIG. 3 is a schematic diagram showing a non-limiting exemplary process of generating an indexed library of randomly barcoded targets (e.g., mRNAs). As shown in step 1, the reverse transcription process can encode every mRNA molecule with a unique molecular marker, cellular marker, and universal PCR site. In particular, the RNA molecule 302 can be reverse transcribed to produce a labeled cDNA molecule 304 (including cDNA region 306) by randomly hybridizing a set of molecular identifier labels 310 to the poly (a) tail region 308 of the RNA molecule 302. Each molecular identifier label 310 may comprise a target binding region, such as a poly (dT) region 312, a labeling region 314, and a universal PCR region 316.
In some embodiments, the cell marker can include 3 to 20 nucleotides. In some embodiments, the molecular marker may comprise 3 to 20 nucleotides. In some embodiments, each of the plurality of stochastic barcodes further comprises one or more of a universal label and a cellular label, wherein the universal label is the same for the plurality of stochastic barcodes on the solid support and the cellular label is the same for the plurality of stochastic barcodes on the solid support. In some embodiments, the universal label can include 3 to 20 nucleotides. In some embodiments, the cell marker comprises 3 to 20 nucleotides.
In some embodiments, the marker region 314 can include a molecular marker 318 and a cellular marker 320. In some embodiments, the label region 314 can include one or more of a universal label, a dimensional label, and a cellular label. The length of the molecular marker 318 can be, can be about, can be at least, or can be at most 1, 2, 3, 4, 5, 6, 7, 8, 9, 10, 20, 30, 40, 50, 60, 70, 80, 90, 100 nucleotides, or a number or range between any of these values. The length of the cell marker 320 can be, can be about, can be at least, or can be at most 1, 2, 3, 4, 5, 6, 7, 8, 9, 10, 20, 30, 40, 50, 60, 70, 80, 90, 100 nucleotides, or a number or range of nucleotides between any of these values. The length of the universal label can be, can be about, can be at least, or can be at most 1, 2, 3, 4, 5, 6, 7, 8, 9, 10, 20, 30, 40, 50, 60, 70, 80, 90, 100 nucleotides, or a number or range of nucleotides between any of these values. The universal label may be the same for a plurality of random barcodes on the solid support, and the cellular label is the same for a plurality of random barcodes on the solid support. The length of the dimension label can be, can be about, can be at least, or can be at most 1, 2, 3, 4, 5, 6, 7, 8, 9, 10, 20, 30, 40, 50, 60, 70, 80, 90, 100 nucleotides, or a number or range of nucleotides between any of these values.
In some embodiments, the label region 314 can comprise, comprise about, comprise at least, or comprise at most 1, 2, 3, 4, 5, 6, 7, 8, 9, 10, 20, 30, 40, 50, 60, 70, 80, 90, 100, 200, 300, 400, 500, 600, 700, 800, 900, 1000 different labels, or numbers or ranges between any of these values, such as the molecular label 318 and the cellular label 320. Each label may be, may be about, may be at least, or may be at most 1, 2, 3, 4, 5, 6, 7, 8, 9, 10, 20, 30, 40, 50, 60, 70, 80, 90, 100 nucleotides in length, or a number or range between any of these values. A set of molecular identifier markers 310 can contain, contain about, contain at least, or can be at most 10, 20, 40, 50, 70, 80, 90, 102、103、104、105、106、107、108、109、1010、1011、1012、1013、1014、1015、1020Individual molecular identifier markers 310, or a number or range between any of these values of molecular identifier markers 310. And the sets of molecular identifier labels 310 may each contain a unique label region 314, for example. The labeled cDNA molecules 304 may be purified to remove excess molecular identifier labels 310. Purification may include Ampure bead purification.
As shown in step 2, the products from the reverse transcription process can be pooled into 1 tube in step 1 and PCR amplified with the 1 st PCR primer pool and the 1 st universal PCR primer. Pooling is possible because of the unique mark zone 314. In particular, the labeled cDNA molecules 304 can be amplified to produce nested cDNA moleculesPCR labeled amplicon 322. The amplification may comprise multiplex PCR amplification. Amplification may comprise multiplex PCR amplification with 96 multiplex primers in a single reaction volume. In some embodiments, multiplex PCR amplification can utilize, utilize about, utilize at least, or utilize up to 10, 20, 40, 50, 70, 80, 90, 10 in a single reaction volume2、103、104、105、106、107、108、109、1010、1011、1012、1013、1014、1015、1020Multiple primers, or multiple primers of numbers or ranges between any of these values. Amplification may include custom primers 326A-C targeting specific genes and a 1 st PCR primer pool 324 of universal primers 328. The custom primer 326 can hybridize to a region within the cDNA portion 306' of the labeled cDNA molecule 304. The universal primer 328 can hybridize to the universal PCR region 316 of the labeled cDNA molecule 304.
As shown in step 3 of FIG. 3, the products from the PCR amplification in step 2 can be amplified using the nested PCR primer pool and the 2 nd universal PCR primer. Nested PCR can minimize PCR amplification bias. In particular, nested PCR labeled amplicon 322 can be further amplified by nested PCR. Nested PCR can include in a single reaction volume with nested PCR primers 332a-c nested PCR primer pool 330 and 2 universal PCR primer 328' of multiplex PCR. The nested PCR primer pool 328 can contain, contain about, contain at least, or contain at most 1, 2, 3, 4, 5, 6, 7, 8, 9, 10, 20, 30, 40, 50, 60, 70, 80, 90, 100, 200, 300, 400, 500, 600, 700, 800, 900, 1000 different nested PCR primers 330, or different nested PCR primers 330 at numbers or ranges between any of these values. Nested PCR primers 332 can contain an adapter 334 and hybridize to a region within cDNA portion 306 "of labeled amplicon 322. The universal primer 328' may contain an adaptor 336 and hybridizes to the universal PCR region 316 of the labeled amplicon 322. Thus, step 3 produces an adaptor-tagged amplicon 338. In some embodiments, nested PCR primer 332 and 2 nd universal PCR primer 328' may not contain adapters 334 and 336. Instead, adapters 334 and 336 can be ligated to the products of nested PCR to produce adapter-labeled amplicon 338.
As shown in step 4, the PCR products from step 3 can be PCR amplified using library amplification primers for sequencing. In particular, the adapters 334 and 336 may be used to perform one or more additional assays on the adapter-labeled amplicon 338. Adapters 334 and 336 can hybridize to primers 340 and 342. One or more of primers 340 and 342 can be PCR amplification primers. One or more of primers 340 and 342 can be sequencing primers. One or more adapters 334 and 336 may be used for further amplification of the adapter-tagged amplicon 338. One or more of the adaptors 334 and 336 may be used to sequence the adaptor-tagged amplicon 338. The primers 342 may contain a plate index 344 so that amplicons generated using the same set of molecular identifier markers 318 can be sequenced in one sequencing reaction using Next Generation Sequencing (NGS).
Correcting PCR and sequencing errors
Disclosed herein are methods for determining the number of targets. In some embodiments, the method comprises: (a) randomly barcoding a plurality of targets using a plurality of random barcodes, wherein each of the plurality of random barcodes comprises a molecular marker, to create a plurality of randomly barcoded targets; (b) obtaining sequencing data for randomly barcoded targets; and (c) for one or more of the plurality of targets: (i) counting the number of molecular markers having different sequences associated with the target in the sequencing data; (ii) determining a mass status of the target in the sequencing data; (iii) determining one or more sequencing data errors in the sequencing data, wherein determining one or more sequencing data errors in the sequencing data comprises determining one or more of: the number of molecular markers having different sequences associated with the target in the sequencing data, the mass status of the target in the sequencing data, the number of molecular markers having different sequences in the plurality of random barcodes; and (iv) estimating the number of targets, wherein the estimated number of targets is correlated with the number of molecular markers having different sequences associated with targets in the sequencing data for counts adjusted according to one or more sequencing data errors. Steps (i), (ii), (iii), and (iv) may be performed on each of the plurality of targets. The method may be multiplexed.
In some embodiments, the methods further comprise: folding the sequencing data prior to determining that one or more of the sequencing data are erroneous. Folding the sequencing data, comprising: copies of a target having a similar molecular signature and an occurrence that is less than a predetermined fold occurrence threshold are designated as having the same molecular signature for the plurality of targets, wherein two copies of a target have a similar molecular signature if their molecular signatures differ in sequence by at least one base.
The percentage of molecular markers in the retained sequencing data can vary after the sequencing data is adjusted for one or more sequencing data errors. In some embodiments, the percentage of molecular markers in the retained sequencing data after adjustment of the sequencing data according to one or more sequencing data errors may be, or be about 50%, 60%, 70%, 80%, 90%, 95%, 99%, 99.9%, or a number or range between any two of these values. In some embodiments, the percentage of molecular markers in the sequencing data that is retained after adjustment of the sequencing data according to one or more sequencing data errors may be at least, or at most 50%, 60%, 70%, 80%, 90%, 95%, 99%, or 99.9%.
Determining molecular marker counts
FIG. 5 is a flow chart showing a non-limiting exemplary embodiment 500 for correcting PCR and sequencing errors using molecular markers. After randomly barcoding the plurality of targets using a plurality of random barcodes, wherein each of the plurality of random barcodes comprises a molecular marker, to create a plurality of randomly barcoded targets, and after obtaining sequencing data for the randomly barcoded targets, embodiment 500 begins at start block 504.
For a target (e.g., a gene derived from a cell in a microwell of a microwell array), molecular markers having different sequences that correlate with the target in the sequencing data can be counted at block 508. In sequencing data, two copies of a target may have similar molecular markers, e.g., the molecular markers of the two copies of the target may have a one base difference in sequence. Both copies of the target may be correct, one copy of the target may be correct and the other copy of the target may be the result of a sequencing error or a PCR error, or both copies of the target may be the result of a sequencing error or a PCR error.
Folding sequencing data
At block 512, the sequencing data may be folded. Folding sequencing data can include designating copies of a target having similar molecular markers and having an occurrence that is less than a predetermined fold occurrence threshold as having the same molecular marker for multiple targets. The predetermined fold occurrence threshold may vary, ranging from 1 to 100. In some embodiments, if the stochastic barcode contains about 6561 molecular markers with different sequences, the predetermined fold occurrence threshold can be either about 1, 2, 3, 4, 5, 6, 7, 8, 9, 10, 20, 30, 40, 50, 60, 70, 80, 90, 100, or between any two of these values or a number or range. In some embodiments, if the stochastic barcode contains about 6561 molecular markers with different sequences, the predetermined fold occurrence threshold can be at least, or at most 1, 2, 3, 4, 5, 6, 7, 8, 9, 10, 20, 30, 40, 50, 60, 70, 80, 90, or 100. For example, the molecular marker may be 8 nucleotides in length and each nucleotide position may have three possibilities, such as adenine (a), cytosine (C), guanine (G); C. g, thymine (T); A. g, T, respectively; or A, C, T, yield 3 86561 unique molecular markers.
In some embodiments, if the stochastic barcode contains about 65536 molecular markers with different sequences, the predetermined fold occurrence threshold can be either about 1, 2, 3, 4, 5, 6, 7, 8, 9, 10, 17, 20, 30, 40, 50, 60, 70, 80, 90, 100, or between any two of these values or a number or range. In some embodiments, the predetermined fold is if the stochastic barcode contains about 65536 molecular labels with different sequencesThe occurrence threshold may be at least, or at most 1, 2, 3, 4, 5, 6, 7, 8, 9, 10, 17, 20, 30, 40, 50, 60, 70, 80, 90, or 100. For example, the molecular tag may be 8 nucleotides in length and each nucleotide position may have four possibilities A, C, G, T, yielding 3465536 unique molecular markers.
For example, the target may have five copies. The five copies of the target may have TGTGCGTG, TGTGCGCG、TGTGCGGG、GGTGCGTG and TGGMolecular markers for GCGTG, where the readings per molecular marker are 261, 2, 1, and 1, respectively. Molecular marker TGTGCGCG、TGTGCGGG、GGTGCGTG, and TGGGCGTG is similar to the molecular marker TGTGCGTG in that they differ from the molecular marker TGTGCGTG by one nucleotide (underlined). If there are 6561 molecular markers having different sequences and the predetermined threshold for fold appearance is 7, the molecular marker TGTGCG CG、TGTGCGGG、GGTGCGTG, and TGGThe appearance of GCGTG can be attributed to the molecular marker TGTGCGTG.
As another example, the target may have seven copies. The seven copies of the target may have CGTGTCTG, GGGGGCGA, GCTGCTGG, TCGGGCGA, CGCGTTCA, CGCGTTTA. And molecular markers of TGGGCTTG, where the reads per molecular marker are 10, 7, 5, 4, 1, and 1, respectively. Molecular marker CGCGCGTTTA is similar to the molecular marker CGCGTTCA in that it differs from each other by one nucleotide (underlined). If there are 6561 molecular markers having different sequences and the predetermined threshold for fold occurrence is 7, the molecular marker CGCGTTTThe occurrence of A can be attributed to the molecular marker CGCGCGTTCA.
Sequencing data errors
The methods disclosed herein can be used to identify and/or correct sequencing data errors, such as errors that occur in methods for counting one or more target nucleic acids. In some embodiments, the sequencing data error may comprise, or be, a PCR-introduced error, a sequencing-introduced error, an error caused by barcode contamination, a library preparation error, or any combination thereof. The errors introduced by PCR may comprise, or be the result of, PCR amplification errors, PCR amplification bias, PCR under-amplification, or any combination thereof. Sequencing-induced errors may comprise, or be the result of, imprecise base calls, insufficient sequencing, or any combination thereof. The error may comprise, or be a deletion of one or more nucleotides, a substitution of one or more nucleotides, and an addition of one or more nucleotides, or any combination thereof.
Determining sequencing status
As described above, the plurality of targets may be randomly barcoded using the plurality of random barcodes to create a plurality of randomly barcoded targets, and each of the plurality of random barcodes may comprise a molecular marker, and sequencing data of the randomly barcoded targets is obtained. For targets (e.g., genes derived from cells in microwells of a microwell array), molecular markers having different sequences that correlate with the targets in the sequencing data can be counted. The counted sequencing data can be folded, for example, by: copies of targets having similar molecular markers and having an occurrence less than a predetermined fold occurrence threshold are assigned as having the same molecular marker for multiple targets. After the sequencing data is folded, the quality status of the target can be determined.
Referring to fig. 5, in some embodiments, at block 516, the quality status of the target in the sequencing data can be determined to be full sequencing, incomplete sequencing, or saturated sequencing. The quality state of the target may depend on whether all true or authentic molecular markers are observed in the depth of the sequencing run. True or authentic molecular markers may refer to molecular markers that are not false or false molecular markers. A false or false molecular marker may refer to a molecular marker having a sequence caused by a PCR error, an artifact (artifact), or a sequencing error. The mass status of the target in the sequencing data can be determined by the number of molecular markers having different sequences in the plurality of stochastic barcodes and the number of molecular markers having different sequences associated with the target in the counted sequencing data.
In some embodiments, the full sequencing quality status can be determined by a dispersion index relative to the poisson distribution that is greater than or equal to a predetermined full sequencing dispersion threshold. The dispersion index may be defined as the variance/average of the target. FIG. 6 is a schematic diagram showing sequencing data obtained by complete sequencing and incomplete sequencing. FIG. 6 shows three copies of gene A and six copies of gene B in the library (left circle). If three copies of gene a had six, five, and one sequencing reads in the sequencing data (upper right circle), the variance was 7, the mean was 4, and the dispersion index was 1.75. If six copies of gene B had nine, two, one, and one sequencing reads in the sequencing data (upper right circle), the variance was 9.36, the mean was 2.83, and the dispersion index was 3.31. With these sequencing data, gene a and gene B can be considered to have a fully sequenced state if the predetermined full sequencing scatter threshold is, for example, 0.9 for full sequencing.
If one copy of gene a is not observed and the other two copies of gene a have two and three sequencing reads in the sequencing data (bottom right circle), the variance is 0.5, the mean is 2.5, and the dispersion index is 0.2. If no two copies of gene B were observed, and the other four copies of gene B had four, two, one, and one sequencing reads in the sequencing data (bottom right circle), the variance was 2, the mean 2, and the scatter index was 2. With these sequencing data, gene a and gene B can be considered to have incomplete sequencing status if a predetermined complete sequencing dispersion threshold, for example, is 1.1 for complete sequencing.
The predetermined discrete threshold for complete sequencing can vary, ranging from 0.5 to 5. In some embodiments, the predetermined full sequencing discrete threshold can be or be about 0.5, 0.6, 0.7, 0.8, 0.9, 1, 2, 3, 4, 5, 6, or between any two of these values or a number or range. In some embodiments, the predetermined complete sequencing discrete threshold can be at least, or at most 0.5, 0.6, 0.7, 0.8, 0.9, 1, 2, 3, 4, 5, or 6.
In some embodiments, the full sequencing quality status can be further determined by the molecular marker having an occurrence greater than or equal to a predetermined full sequencing occurrence threshold in the sequencing data. The predetermined threshold for complete sequencing to occur may vary, ranging from 8 to 20. In some embodiments, the complete sequencing appearance threshold can be, or is, about 8, 9, 10, 11, 12, 13, 14, 15, 16, 17, 18, 19, 20, or between any two of these values or a number or range. In some embodiments, the threshold for complete sequencing to occur may be at least, or at most, 8, 9, 10, 11, 12, 13, 14, 15, 16, 17, 18, 19, or 20.
In some embodiments, the saturated sequencing quality status can be determined by targets having a number of molecular markers with different sequences that is greater than a predetermined saturation threshold. The saturated sequencing quality status can be further determined by another target of the plurality of targets having a number of molecular markers with different sequences that is greater than a predetermined saturation threshold.
The predetermined saturation threshold may vary. In some embodiments, if the stochastic barcode contains about 6561 molecular labels with different sequences, the predetermined saturation threshold may be, or be, about 6000, 6100, 6200, 6300, 6400, 6500, 6557, 6558, 6559, 6560, 6561, or between any two of these values or a number or range. In some embodiments, if the stochastic barcode contains about 6561 molecular labels with different sequences, the predetermined saturation threshold can be at least, or at most, 6000, 6100, 6200, 6300, 6400, 6500, 6557, 6558, 6559, 6560, or 6561. In some embodiments, if the stochastic barcode contains about 65536 molecular labels with different sequences, the predetermined saturation threshold may be, or be, about 64000, 64100, 64200, 64300, 64400, 64500, 64600, 64700, 64800, 64900, 65000, 65100, 65200, 65300, 65400, 65500, 65510, 65520, 65530, 65532, 65533, 65534, 65535, or between any two of these values or a number or range. In some embodiments, if the stochastic barcode contains about 65536 molecular labels with different sequences, the predetermined saturation threshold may be at least, or at most 64000, 64100, 64200, 64300, 64400, 64500, 64600, 64700, 64800, 64900, 65000, 65100, 65200, 65300, 65400, 65500, 65510, 65520, 65530, 65532, 65533, 65534, or 65535.
In some embodiments, the quality status of the target in the sequencing data can be classified as incomplete sequencing if the quality status of the target in the sequencing data is not complete sequencing and is not saturated sequencing.
Complete sequencing quality status
The methods disclosed herein can provide an estimate of the number of targets in a sequencing library if the targets have a complete sequencing quality status. When the targets in the sequencing library have a complete sequencing quality status, a threshold can be established by a separate poisson model for the sequencing reads of correct and incorrect random barcodes. The quality state of the target may depend on whether all true or authentic molecular markers are observed in the depth of the sequencing run. True or authentic molecular markers may refer to molecular markers that are not false or false molecular markers. A false or false molecular marker may refer to a molecular marker having a sequence caused by a PCR error, an artifact (artifact), or a sequencing error.
Referring to fig. 5, at decision state 520, if the target molecule has a fully sequenced state, the embodiment 500 proceeds to block 524. At block 524, one base sequencing error may be removed by the following steps. Step (1), if the sequencing read is larger than 25, selecting the molecular marker related to the most abundant sequencing read as the first parent molecular marker. For example, after counting the number of molecular markers having different sequences associated with the target in the sequencing data, the molecular marker associated with the target in the sequencing data is selected, which has the highest sequencing read.
Step (2), identifying molecular markers: a molecular marker with a sequencing read of less than or equal to 3 and one base different from the parent molecular marker; if no sub-molecular marker or no one-base sub-molecular marker is found, go to step (5). Step (3), a multiplex binary test is performed on all the daughter molecular markers and the parent molecular markers, and those daughter molecular markers that accept the null hypothesis are removed and their sequencing reads are attributed to their parents. If no null hypothesis is accepted, this means that all of the daughter molecular markers are not one base sequencing error of the parent molecular marker and no read corrections are required. And (4) updating the molecular marker sequence and sequencing reading. For example, if a null hypothesis of a multiplex binomial test is accepted, the occurrence of a daughter molecular marker can be attributed to a parent molecular marker. Step (5), selecting the molecular marker with the next largest sequencing read as the parent molecular marker, and repeating the above steps until no qualified parent molecular marker or no qualified daughter molecular marker remains.
In some embodiments, the number of molecular markers having different sequences associated with the target in the counted sequencing data is adjusted by: determining all of the sub-molecular markers for one or more of the parent molecular markers if the target has a complete sequencing quality status; performing a statistical analysis (e.g., a multiplex binary test) on the at least one daughter molecular marker and the parent molecular marker; and attributing the occurrence of the child molecular marker to the parent molecular marker if subjected to a null hypothesis of statistical analysis.
In some embodiments, a daughter molecular marker may comprise a molecular marker that differs from a parent molecular marker by one base and has an occurrence that is less than or equal to a predetermined complete sequencing subthreshold. The predetermined complete sequencing subthreshold may vary. In some embodiments, the predetermined complete sequencing subthreshold may be, or is, about 1, 2, 3, 4, 5, 6, 7, 8, 9, 10, or between any two of these values or a number or range. In some embodiments, the predetermined complete sequencing subthreshold can be at least, or at most 1, 2, 3, 4, 5, 6, 7, 8, 9, or 10.
In some embodiments, the one or more parent molecular markers comprise a molecular marker having an occurrence greater than or equal to a predetermined full sequencing parent threshold, wherein the predetermined full sequencing parent threshold is equal to a predetermined full sequencing occurrence threshold (e.g., 8). The zero hypothesis of the first statistical analysis may be accepted if the probability that the zero hypothesis is true is lower than the false discovery rate. The false discovery rate may vary. In some embodiments, the false percentage may be, or be about 1%, 2%, 3%, 4%, 5%, 6%, 7%, 8%, 9%, 10%, 11%, 12%, 13%, 14%, 15%, 16%, 17%, 18%, 19%, 20%, or a number or range between any two of these values. In some embodiments, the false discovery rate may be at least, or at most, 1%, 2%, 3%, 4%, 5%, 6%, 7%, 8%, 9%, 10%, 11%, 12%, 13%, 14%, 15%, 16%, 17%, 18%, 19%, or 20%. The first statistical analysis may be a multiple two-term test.
At block 528, the poisson model may be used to define thresholds for molecular markers of the target to determine true and false molecular markers associated with the target in the sequencing data. For example, a poisson model may be applied to sequencing reads to distinguish "likely to be genuine" molecular markers from artifacts.
In some embodiments, the number of molecular markers having different sequences associated with the target in the counted sequencing data is adjusted by: if the target has a complete sequencing quality status, a threshold of molecular markers for the target is defined to determine true molecular markers and false molecular markers associated with the target in the sequencing data. Defining a threshold value for the molecular marker of the target may comprise performing a statistical analysis of the molecular markers of the target.
In some embodiments, performing the statistical analysis comprises: fitting the molecular markers of the target and their occurrence distributions to two poisson distributions; determining the number n of authentic molecular markers using two poisson distributions; and removing false molecular markers from the sequencing data, wherein the false molecular markers comprise molecular markers having an occurrence that is lower than the nth most abundant molecular marker, and wherein the true molecular markers comprise molecular markers having an occurrence that is greater than or equal to the nth most abundant molecular marker. The two poisson distributions may comprise a first poisson distribution corresponding to a true molecular marker, and a second poisson distribution corresponding to a false molecular marker.
At block 532, after correcting or adjusting the sequencing data using multiple binomial tests or poisson distribution, the number of targets can be estimated to produce an output. Embodiment 500 ends at end block 536.
Saturated sequencing quality status
If the target has a saturated sequencing quality status, because of the large uncertainty in estimating the molecular marker count, the methods disclosed herein cannot provide an estimate of the number of targets in the sequencing library. In some embodiments, referring to fig. 5, at decision state 520, if the sequencing state is not a full sequencing state, embodiment 500 proceeds to decision state 540. At decision state 540, if the target has a saturated sequencing state, the embodiment 500 proceeds to end block 536. For a saturated sequencing state, the number of targets may not be determined due to the large uncertainty in estimating the molecular marker counts.
Incomplete sequencing quality status
If the target has an incomplete sequencing quality status, the methods disclosed herein can provide an estimate of the number of targets in the sequencing library. Noisy targets (e.g., noisy genes) can be removed when the targets in the sequencing library have an incomplete sequencing quality status. A target is noise if its amplification rate (mean reads per molecular marker) is similar to the erroneous amplification rate derived from a fully sequenced gene in the same library containing the target. A zero-tailed poisson model can be applied to sequencing reads of targets with a quality state of incomplete sequencing to infer an estimate of the number of random barcodes comprising targets with different molecular markers present in the library.
If some truly random barcodes for labeling the starting target are not observed due to insufficient sequencing depth, example 500 can provide an estimate of the number of targets in the sequencing library. At decision state 540, if the target does not have a saturated sequencing state, then the target has an incomplete sequencing state, and the embodiment 500 proceeds to block 544 to remove noisy targets (e.g., noisy genes).
Using a poisson model to derive a threshold to separate correct and incorrect barcodes can still provide a reasonable estimate if the target's dispersion index is >4 and the maximum sequencing reading for that target is > 18. If the sequencing data shows moderate over-dispersion, e.g., 1.5< dispersion index ≦ 4, with a maximum sequencing read for this target ≦ 18, then using the Poisson model to deduce the threshold value may underestimate the true molecular marker count. The reason for underestimation may be because molecular markers with low read-outs may be a mixture of true or false molecular markers. Thus, those true molecular markers with low sequencing reads may be forced into the poisson model as errors, and the poisson model of true molecular markers may have fewer molecular markers than they should. An ad-hoc approach may be used, for example using molecular marker counting after removing molecular markers with a low count (e.g. one). If the dispersion index is close to unity (e.g., between 0.9 and 1.5), then the observed molecular marker counts can yield a reasonable estimate. A zero-truncated poisson model characterized by an under-dispersed poisson model may yield a reasonable estimate if the dispersion index is between 0.1 and 0.9; but this model may be overestimated if there are errors in the sequencing data.
In some embodiments, the number of molecular markers having different sequences associated with a target in sequencing data can be determined by: determining whether the target in the sequencing data is noise if the quality status of the target in the sequencing data is an incomplete sequencing quality status; and removing noise targets from the sequencing data. A noisy target can be noisy if its molecular markers appear less than or equal to the incomplete sequencing noisy target threshold. Incomplete sequencing noise gene threshold can vary. In some embodiments, the incomplete sequencing noise target threshold can be equal to the median or mean occurrence of molecular markers for multiple targets with a fully sequenced mass state. In some embodiments, the incomplete sequencing noise gene threshold can be, or is, about 1, 2, 3, 4, 5, 6, 7, 8, 9, 10, or between any two of these values or a number or range. In some embodiments, the incomplete sequencing noise gene threshold can be at least, or at most 1, 2, 3, 4, 5, 6, 7, 8, 9, or 10.
In block 548, a zero-tailed poisson model is applied to the sequencing reads of targets with a quality state of incomplete sequencing to infer an estimate of the number of random barcodes comprising targets with different molecular markers present in the library. In some embodiments, the number of molecular markers having different sequences associated with the target in the sequencing data is determined by: determining whether the target in the sequencing data is noise if the quality status of the target in the obtained sequencing data is an incomplete sequencing quality status; and removing targets that are noise.
In some embodiments, the number of molecular markers having different sequences associated with a target in sequencing data can be determined by: if the mass state of the target in the sequencing data is an incomplete sequencing mass state, a threshold of molecular markers of the target is defined to determine true molecular markers and false molecular markers in the sequencing data. Defining a threshold value for the molecular marker of the target may comprise performing a statistical analysis of the molecular marker. Performing statistical analysis on the molecular markers may include: determining the number n of true molecular markers by using a zero-truncation Poisson model; and removing the pseudo-molecular marker from the sequencing data.
In some embodiments, the pseudo-molecular markers may comprise molecular markers that occur at a lower frequency than the nth most abundant molecular marker. Authentic molecular markers may comprise molecular markers whose occurrence is greater than or equal to the occurrence of the nth most abundant molecular marker.
Sequencing data errors
The methods disclosed herein can be used to identify and/or correct sequencing data errors, such as errors that occur in methods for counting one or more target nucleic acids. In some embodiments, the error may comprise, or be a deletion of one or more nucleotides, a substitution of one or more nucleotides, and an addition of one or more nucleotides, or any combination thereof. Errors may be present on molecular tags (ML), sample tags (SL), or other tags on the stochastic barcode. In some embodiments, the sequencing data error may comprise, or be, a PCR-introduced error, a sequencing-introduced error, a Reverse Transcription (RT) primer contamination error, or any combination thereof. The errors introduced by PCR may comprise, or be the result of, PCR amplification errors, PCR amplification bias, PCR under-amplification, or any combination thereof. Sequencing-induced errors may comprise, or be the result of, imprecise base calls, insufficient sequencing, or any combination thereof. RT primer contamination errors may be errors caused by reverse transcription primers entering into the PCR.
As used herein, the term "overlay" or "sequencing depth" can refer to the reading of a barcoded target having a particular ML and a particular SL in the sequencing data. For example, a barcoded target may be sequenced multiple times. Thus, barcoded targets with specific ML and SL can be viewed multiple times. As another example, a cell may contain multiple copies of a target (e.g., multiple copies of an mRNA molecule of a gene). Multiple copies of the target may be barcoded. After PCR amplification (e.g., block 28 in the figure), there may be multiple copies of the barcoded target with specific ML and SL. During sequencing, some or all of the multiple copies of the barcoded target with the particular ML and SL may be sequenced. The number of reads observed in the sequencing data for barcoded targets with the same ML and SL can be referred to as "coverage" or "sequencing depth.
In some embodiments, sequencing data errors may be identified and/or corrected. For example, copies of a target from a cell can be barcoded with different MLs and the same SL. Barcoded targets with ML can have multiple reads in the sequencing data. Barcoded targets with different MLs may have only a few readings (e.g., one reading). The former barcoded targets are more likely to have the correct ML (or true ML or signal ML) than the latter barcoded targets. The latter barcoded target may include false ML (or false ML or noisy ML). This may be because two MLs can be expected to have similar coverage or sequencing depths. The latter barcoded target with only a few reads may be an artifact or error generated during sequencing or PCR.
As another example, random barcodes entered into PCR can lead to RT primer contamination errors. In some embodiments, after reverse transcription of an mRNA molecule into a cDNA molecule (e.g., figure 24), the random barcodes that are not incorporated into the cDNA molecule can be removed by, for example, Ampure bead purification. Removal methods (e.g., Ampure bead purification) may not completely remove the random barcodes that are not extended by reverse transcription to be incorporated into randomly barcoded cDNA molecules. For example, a random barcode that is not extended by reverse transcription to be incorporated into a randomly barcoded cDNA molecule of 15%, 10%, 9%, 8%, 7%, 6%, 5%, 4%, 3%, 2%, 1%, 0.5%, 0.1%, or a range between any of these two values cannot be removed by Ampure bead purification. These random barcodes that are not removed can lead to sequencing data errors during amplification of the cDNA molecules (e.g., at box 28 of the figure). The random barcodes between samples may be highly similar. For example, the sample label of the random barcode may be the same for the sample. Thus, PCR crossover can occur because these non-removed stochastic barcodes can hybridize to other nucleic acid molecules from the same sample (e.g., SL regions of the stochastic barcoded mRNA molecules) during PCR and can lead to sequencing data errors known as SL errors.
The correct ML, the incorrect ML, and the SL errors may have different distributions. FIG. 4 is a schematic diagram showing non-limiting exemplary distributions of molecular labeling errors, sample labeling errors, and true molecular labeling signals. As illustrated in fig. 4, the erroneous ML may be more likely to have lower ML coverage because the erroneous ML may be the result of a PCR or sequencing error. For example, the error ML may be the result of most sequencing errors and some PCR errors. SL errors may be more likely to have lower ML coverage because SL errors may primarily come from random barcodes entering the PCR.
Correcting PCR and sequencing errors based on directed adjacency
Disclosed herein are methods for correcting PCR or sequencing errors. In some embodiments, the method comprises: (a) sequencing data for randomly barcoded targets is received. Randomly barcoded targets can be obtained by: randomly barcoding a plurality of targets using a plurality of random barcodes, wherein each of the plurality of random barcodes comprises a molecular marker, to create a plurality of randomly barcoded targets. In some embodiments, the method comprises: (b) for one or more of the plurality of targets: (i) counting the number of molecular markers having different sequences associated with the target in the sequencing data; (ii) clusters of molecular markers that identify the target using directional adjacency; (iii) folding the sequencing data received in (b) using clusters of molecular markers of the target identified in (ii); and (iv) estimating the number of targets, wherein after folding the sequencing data in (ii), the estimated number of targets is correlated with the number of molecular markers having different sequences associated with the targets in the sequencing data counted in (i). The plurality of targets may comprise targets of the entire transcriptome of the cell. In some embodiments, the method further comprises: (c) randomly barcoding a plurality of targets with a plurality of random barcodes to create a plurality of randomly barcoded targets; and (d) sequencing the randomly barcoded target to generate sequencing data for the received randomly barcoded target.
FIG. 7 is a flow diagram showing a non-limiting exemplary embodiment 700 for correcting PCR and sequencing errors using molecular markers based on directional adjacency. Correcting PCR and sequencing errors using molecular markers based on directional adjacency may be referred to as Recursive Substitution Error Correction (RSEC) method 700 begins at block 704 after accepting sequencing data for a plurality of randomly barcoded targets. In some embodiments, method 700 further comprises randomly barcoding a plurality of targets using a plurality of random barcodes, wherein each of the plurality of random barcodes comprises a molecular marker, to create a plurality of randomly barcoded targets. In some embodiments, method 700 further comprises sequencing a plurality of randomly barcoded targets to obtain sequencing data.
At block 708, for one or more of the plurality of targets: the number of molecular markers having different sequences associated with the target in the sequencing data can be counted. At block 712, clusters of molecular markers that can identify the target using directional adjacency. The molecular markers of the targets in the cluster can be within a predetermined orientation adjacency threshold of each other. The directional adjacency threshold may vary. In some embodiments, the hamming distance of the predetermined directional adjacency threshold may be, about, at least, or at most one or two.
In some embodiments, the molecular markers of the targets within a cluster may comprise one or more parent molecular markers and child molecular markers of the one or more parent molecular markers. The occurrence of the parent molecular marker may be greater than or equal to a predetermined directional adjacency occurrence threshold. In some embodiments, the predetermined directional adjacency occurrence threshold may be, about, at least, or at most twice-1 the occurrence of the molecular marker. In some embodiments, the predetermined directional adjacency occurrence threshold may be, or be about 1.5-fold, 2-fold, 3-fold, 4-fold, 5-fold, 6-fold, 7-fold, 8-fold, 9-fold, 10-fold of the occurrence of the sub-molecular marker, between any two of these values, or a number or range. In some embodiments, the predetermined directional adjacency occurrence threshold may be at least or at most 1.5-fold, 2-fold, 3-fold, 4-fold, 5-fold, 6-fold, 7-fold, 8-fold, 9-fold, or 10-fold greater than the occurrence of the sub-molecular label.
In block 720, the sequencing data is folded using the molecularly labeled cluster of targets. Folding sequencing data may include attributing the appearance of a daughter molecular marker to a parent molecular marker. In block 732, the number of targets may be estimated to produce an output after folding the sequencing data. The method ends at block 736.
In some embodiments, the methods further comprise: determining the sequencing depth of the target. (ii) if the sequencing depth of the target is above a predetermined sequencing depth threshold, estimating the number of targets comprises adjusting the sequencing data counted in (i). The predetermined sequencing depth threshold may be between 15 and 20. (ii) adjusting the sequencing data counted in (i) comprises: defining a threshold for molecular markers of the target to identify true molecular markers and false molecular markers associated with the target in the sequencing data obtained in (b). Defining a threshold value for the molecular marker of the target comprises performing a statistical analysis of the molecular marker of the target. Performing the statistical analysis includes: fitting the molecular markers of the target and their occurrence distributions to two distributions, such as two negative binomial distributions; determining the number n of authentic molecular markers using the two negative binomial distributions; and removing false molecular markers from the sequencing data obtained in (b), wherein the false molecular markers comprise molecular markers having an occurrence that is lower than the nth most abundant molecular marker, and wherein the true molecular markers comprise molecular markers having an occurrence that is greater than or equal to the nth most abundant molecular marker.
Correcting PCR and sequencing errors based on oriented adjacency and second derivative
Disclosed herein are methods for determining the number of targets. In some embodiments, the method comprises: (a) randomly barcoding a plurality of targets using a plurality of random barcodes, wherein each of the plurality of random barcodes comprises a molecular marker, to create a plurality of randomly barcoded targets; (b) obtaining sequencing data for randomly barcoded targets; and (c) for one or more of the plurality of targets: (i) counting the number of molecular markers having different sequences associated with the target in the sequencing data; (ii) clusters of molecular markers that identify the target using directional adjacency; (iii) (iii) folding the sequencing data obtained in (b) using clusters of molecular markers of the target identified in (ii); and (iv) estimating the number of targets, wherein after folding the sequencing data in (ii), the estimated number of targets is correlated with the number of molecular markers having different sequences associated with the targets in the sequencing data counted in (i). The plurality of targets may comprise targets of the entire transcriptome of the cell.
In some embodiments, the method includes determining a sequencing state of the target in the sequencing data. The sequencing state of the target in the sequencing data may include, or be, saturated sequencing. In some embodiments, if the sequencing state of the target in the sequencing data is a saturated sequencing state, the number of targets estimated in (iv) is correlated with the number of molecular markers having different sequences associated with the targets in the sequencing data counted in (i).
In some embodiments, the estimated number of targets is correlated with the number of molecular markers having different sequences associated with the targets in the sequencing data counted in (i) after correcting the SL error. Correcting the SL errors may include generating a cumulative sum plot of molecular markers having different sequences associated with the targets in the sequencing data; determining a second derivative of the cumulative sum map; and determining a ML reading depth cutoff value based on a minimum of the second derivative of the cumulative sum map. In some embodiments, correcting the SL error can include removing molecular tags having different sequences associated with the target in the sequencing data (whose read depth is below the determined ML read depth cutoff).
FIG. 8 is a flow diagram showing a non-limiting exemplary embodiment 800 for correcting PCR and sequencing errors using molecular markers based on directional adjacency and second derivative. After accepting sequencing data for a plurality of randomly barcoded targets, method 800 begins at block 804. In some embodiments, the method 800 further comprises randomly barcoding a plurality of targets using a plurality of random barcodes, wherein each of the plurality of random barcodes comprises a molecular marker, to create a plurality of randomly barcoded targets. In some embodiments, method 800 further comprises sequencing a plurality of randomly barcoded targets to obtain sequencing data.
At block 808, for one or more of the plurality of targets: the number of molecular markers having different sequences associated with the target in the sequencing data can be counted. At decision block 812, it can be determined whether the sequencing data has a saturated sequencing state. The saturated sequencing state can be determined by targets having a number of molecular markers, having different sequences, greater than a predetermined saturation threshold. In different implementations, the predetermined saturation threshold may be different. For example, if the stochastic barcode contains about 6561 molecular labels with different sequences, the predetermined saturation threshold may be about 6557. As another example, if the stochastic barcode contains about 65536 molecular labels with different sequences, the predetermined saturation threshold may be about 65532.
If the sequencing data does not have a saturated sequencing state at decision block 812, the method 800 proceeds to block 816, where the molecular marker count may be adjusted based on the directional adjacency. For example, a target is considered to have a saturated sequencing state if it has a number of molecular markers with different sequences that is greater than 1000, 2000, 3000, 4000, 5000, 6000, 7000, 8000, 9000, 10000, 20000, 30000, 40000, 50000, 60000, 70000, 80000, 90000, 100000, or a number or range between any two of these. As another example, a target can be considered to have a saturated sequencing state if it has a greater number of molecular markers having different sequences than 50%, 60%, 70%, 80%, 90%, 95%, 99%, 99.9%, or a number or range between any two of these, of the molecular barcodes of the random barcodes having different sequences. In some embodiments, adjusting the molecular count based on directional adjacency may be described with reference to fig. 7. For example, adjusting the molecular count based on the dictionary can include identifying clusters of molecular markers of the target using directional adjacency; folding the sequencing data using the clusters of molecular markers of the identified targets; and estimating the number of targets, wherein after folding the sequencing data, the estimated number of targets is correlated with the number of molecular markers having the counted number of different sequences associated with the targets in the sequencing data.
At block 820, the second derivative of the cumulative sum map may be determined. Determining the second derivative of the cumulative sum map can include generating a cumulative sum map of molecular markers having different sequences associated with the target in the sequencing data.
At block 824, the molecular markers may be adjusted based on the ML read depth cutoff. The ML reading depth cutoff value may be based on a minimum (e.g., a local minimum or a global minimum) of the second derivative of the cumulative sum map. In some embodiments, correcting the SL error can include removing molecular tags having different sequences associated with the target in the sequencing data (whose read depth is below the determined ML read depth cutoff).
In block 828, the number of targets can be estimated to produce an output after folding the sequencing data and correcting the SL error. At decision block 812, if the sequencing data has a saturated sequencing state, the method 800 may proceed to block 828 to generate an output without folding the sequencing data and correcting the SL error. The method ends at block 832 at 800.
Correcting PCR and sequencing errors based on directed adjacency and distribution-based error correction
Disclosed herein are methods for correcting PCR or sequencing errors. The number of targets can be determined using this method. In some embodiments, the method comprises: (a) sequencing data for randomly barcoded targets is received. Randomly barcoded targets can be obtained by: randomly barcoding a plurality of targets using a plurality of random barcodes, wherein each of the plurality of random barcodes comprises a molecular marker, to create a plurality of randomly barcoded targets. In some embodiments, the method comprises (b) for one or more of the plurality of targets: (i) counting the number of molecular markers having different sequences associated with the target in the sequencing data; (ii) determining the number of noise molecule markers having different sequences associated with the target in the sequencing data; and (iii) estimating the number of targets, wherein the estimated number of targets is correlated with the number of molecular markers having different sequences associated with the targets in the sequencing data counted in (i) adjusted according to the number of noise molecular markers determined in (ii). In some embodiments, the method includes determining a sequencing state of the target in the sequencing data. In some embodiments, the method further comprises: (c) randomly barcoding a plurality of targets with a plurality of random barcodes to create a plurality of randomly barcoded targets; and (d) sequencing the randomly barcoded target to generate sequencing data for the received randomly barcoded target.
FIG. 9 is a flow diagram showing a non-limiting exemplary embodiment 900 for correcting PCR and sequencing errors based on recursive substitution error correction and distribution-based error correction. After accepting sequencing data for a plurality of randomly barcoded targets, method 900 begins at block 904. In some embodiments, the method 900 further comprises randomly barcoding a plurality of targets using a plurality of random barcodes, wherein each of the plurality of random barcodes comprises a molecular marker, to create a plurality of randomly barcoded targets. In some embodiments, method 900 further comprises sequencing a plurality of randomly barcoded targets to obtain sequencing data.
At block 908, for one or more of the plurality of targets: the number of molecular markers having different sequences associated with the target in the sequencing data can be counted. At decision block 912, it may be determined whether the sequencing data has a saturated sequencing state. For example, a target is considered to have a saturated sequencing state if it has a number of molecular markers with different sequences that is greater than 1000, 2000, 3000, 4000, 5000, 6000, 7000, 8000, 9000, 10000, 20000, 30000, 40000, 50000, 60000, 70000, 80000, 90000, 100000, or a number or range between any two of these. As another example, a target can be considered to have a saturated sequencing state if it has a greater number of molecular markers having different sequences than 50%, 60%, 70%, 80%, 90%, 95%, 99%, 99.9%, or a number or range between any two of these, of the molecular barcodes of the random barcodes having different sequences.
In some embodiments, the saturated sequencing state can be determined by targets having a number of molecular markers with different sequences that is greater than a predetermined saturation threshold. In different implementations, the predetermined saturation threshold may be different. For example, the predetermined saturation threshold may be, or be, about 1000, 2000, 3000, 4000, 5000, 6000, 6557, 7000, 8000, 9000, 10000, 20000, 30000, 40000, 50000, 60000, 65532, 70000, 80000, 90000, 100000, or between any two of these values or a number or range. As another example, the predetermined saturation threshold may be at least, or at most, 1000, 2000, 3000, 4000, 5000, 6000, 6557, 7000, 8000, 9000, 10000, 20000, 30000, 40000, 50000, 60000, 65532, 70000, 80000, 90000, or 100000.
In some embodiments, the saturated sequencing state may depend on the number of molecular markers with different sequences of the stochastic barcode. For example, if the stochastic barcode contains about 6561 molecular labels with different sequences, the predetermined saturation threshold may be about 6557. As another example, if the stochastic barcode contains about 65536 molecular labels with different sequences, the predetermined saturation threshold may be about 65532. In some embodiments, the sequencing state of saturation may not depend on the number of molecular tags with different sequences of the stochastic barcode.
If the sequencing data does not have a saturated sequencing state at decision block 912, the method 900 proceeds to block 916, where the molecular marker count may be adjusted based on the directional adjacency. In some embodiments, adjusting the molecular count based on directional adjacency may be described with reference to fig. 7. For example, adjusting the molecular count based on the dictionary can include identifying clusters of molecular markers of the target using directional adjacency; folding the sequencing data using clusters of molecular markers of the identified targets; and estimating the number of targets, wherein after folding the sequencing data, the estimated number of targets is correlated with the number of molecular markers having the counted number of different sequences associated with the targets in the sequencing data.
At block 920, the sequencing status of the target in the sequencing data can be determined. The sequencing state of the target in the sequencing data may include, or be under sequencing. At decision block 924, it can be determined whether the sequencing status of the target in the sequencing data is an under sequencing status. For example, a target can be considered to have a sequencing deficient state if the depth (e.g., average, minimum, or maximum depth) of the target is less than, or less than, about 1, 2, 3, 4, 5, 6, 7, 8, 9, 10, 20, 30, 40, 50, 60, 70, 80, 90, 100, or a number or range between any two of these. As another example, a target can be considered to have a sequencing deficient state if the depth of the target is less than at least, or at most 1, 2, 3, 4, 5, 6, 7, 8, 9, 10, 20, 30, 40, 50, 60, 70, 80, 90, or 100.
In some embodiments, the under-sequencing state can be determined by targets having a depth (e.g., average, minimum, or maximum depth) that is less than a predetermined under-sequencing threshold. In different implementations, the under-sequencing threshold can be different. For example, the under-sequencing threshold can be, or is, about 1, 2, 3, 4, 5, 6, 7, 8, 9, 10, 20, 30, 40, 50, 60, 70, 80, 90, 100, or between any two of these values or a number or range. As another example, the under-sequencing threshold can be at least, or at most 1, 2, 3, 4, 5, 6, 7, 8, 9, 10, 20, 30, 40, 50, 60, 70, 80, 90, or 100.
In some embodiments, the under-sequencing state may depend on the number of molecular tags with different sequences of the stochastic barcode. For example, if the stochastic barcode comprises, or is about 1000, 2000, 3000, 4000, 5000, 6000, 6561, 7000, 8000, 9000, 10000, 20000, 30000, 40000, 50000, 60000, 65532, 70000, 80000, 90000, 100000 molecular labels having different sequences, or molecular labels having different sequences at numbers or ranges between any two of these values, the under-sequencing threshold may be 10 (or another threshold number). As another example, the under-sequencing threshold can be 10 (or another threshold number) if the stochastic barcode contains at least, or at most, 1000, 2000, 3000, 4000, 5000, 6000, 6561, 7000, 8000, 9000, 10000, 20000, 30000, 40000, 50000, 60000, 65532, 70000, 80000, 90000, or 100000. In some embodiments, the under-sequencing state may not depend on the number of molecular tags with different sequences of the stochastic barcode.
At decision block 924, if the sequencing status of the target in the sequencing data is not an under-sequencing status, the method 900 may proceed to block 928 to filter the molecular marker counts. Filtering the molecular marker counts can include determining, at decision block 932, the number of molecular markers having different sequences associated with the target in the sequencing data that are less than the false point threshold. In different implementations, the pseudo-point threshold may be different. For example, if the random barcode contains about 6561 molecular markers with different sequences, the pseudo-point threshold can be, or be, about 1, 2, 3, 4, 5, 6, 7, 8, 9, 10, 20, 30, 40, 50, 60, 70, 80, 90, 100, or between any two of these values or a number or range. As another example, if the stochastic barcode contains about 6561 molecular markers with different sequences, the pseudo-point sequencing threshold can be at least, or at most 1, 2, 3, 4, 5, 6, 7, 8, 9, 10, 20, 30, 40, 50, 60, 70, 80, 90, or 100.
At decision block 932, if the number of molecular markers having different sequences associated with the target in the sequencing data is less than the threshold of false points, the method 900 can optionally proceed to block 936, where false points can be added to the number of molecular markers having different sequences associated with the target in the sequencing data before determining the number of noise molecular markers having different sequences associated with the target in the sequencing data. In different implementations, the pseudo-points may have different molecular marker counts. For example, the molecular marker count of a pseudo-point may be, or be, about 0.0001, 0.001, 0.01, 0.1, 1, 2, 3, 4, 5, 6, 7, 8, 9, 10, 20, 30, 40, 50, 60, 70, 80, 90, 100, or between any two of these values or a number or range. As another example, the molecular marker count of a pseudo-point can be at least, or at most 0.0001, 0.001, 0.01, 0.1, 1, 2, 3, 4, 5, 6, 7, 8, 9, 10, 20, 30, 40, 50, 60, 70, 80, 90, or 100. In some embodiments, if the number of molecular markers having different sequences associated with the target in the sequencing data is less than the false point threshold, method 900 can proceed to block if the number of molecular markers having different sequences associated with the target in the sequencing data is less than the false point threshold, method 944.
At decision block 932, if the number of molecular markers having different sequences associated with the target in the sequencing data is not less than the false point threshold, the non-unique molecular markers can be removed at block 940. At block 944, the number of noise molecular markers that are used to determine different sequences associated with targets in the sequencing data can be removed. Non-unique molecular markers can include molecular markers having different sequences associated with targets in sequencing data that are greater than a predetermined threshold of recycling molecular markers. In different implementations, the threshold for recycling molecular markers can be different. For example, if the random barcode contains about 6561 molecular markers having different sequences, the recycling molecular marker threshold can be, or be, about 100, 200, 300, 400, 500, 600, 650, 700, 900, 1000, 2000, or between any two of these values or a number or range. As another example, if the stochastic barcode contains about 6561 molecular markers with different sequences, the recycling molecular marker threshold can be at least, or at most, 100, 200, 300, 400, 500, 600, 650, 700, 900, 1000, or 2000.
In some embodiments, removing the non-unique molecular markers comprises: the theoretical number of non-unique molecular markers is determined for the number of molecular markers having different sequences that are associated with the target in the sequencing data. Removing the non-unique molecular marker can include removing a molecular marker that occurs more than the nth most abundant molecular marker of a molecular marker having a different sequence associated with the target in the sequencing data. The number n may be a theoretical number that is not a unique molecular marker.
At block 944, the molecular marker counts may be adjusted using a distribution-based error correction method. The distribution-based error correction method can include determining the number of noise molecule markers having different sequences associated with targets in the sequencing data. Determining the number of noise molecule markers may comprise: two negative binomial distributions were fitted to the number of molecular markers with different sequences associated with the target in the sequencing data. For example, determining the number of noise molecule markers may comprise: fitting a signal negative binomial distribution (one of two negative binomial distributions) to the number of molecular markers having different sequences associated with the target in the counted sequencing data, wherein the signal negative binomial distribution corresponds to the number of molecular markers having different sequences associated with the target in the counted sequencing data as signal molecular markers; determining the number of noise molecule markers may comprise: fitting a noise negative binomial distribution (the other of the two negative binomial distributions) to the number of molecular markers having different sequences associated with the target in the counted sequencing data, wherein the noise negative binomial distribution corresponds to the number of molecular markers having different sequences associated with the target in the counted sequencing data that are noise molecular markers; determining the number of noise molecule markers may comprise determining the number of noise molecule markers using the fitted signal negative binomial distribution and the fitted noise negative binomial distribution.
In some embodiments, determining the number of noise molecule markers using the fitted signal negative binomial distribution and the fitted noise negative binomial distribution comprises, for each of the different sequences associated with the target in the sequencing data: determining the signal probability of the different sequences in the negative binomial distribution of the signal. And the noise probability of the different sequences in the noise negative binomial distribution can be determined. In addition, if the signal probability is less than the noise probability, the different sequence can be determined to be a noise molecule marker. In some embodiments, if less than two peaks are found (because two peaks are needed to determine the signal negative binomial distribution and the noise negative binomial distribution), adjusting the molecular marker count at block 944 can include removing a single element (e.g., a single base substitution).
At block 948, the number of targets may be estimated after the proximity-based and distribution-based error correction to produce an output. At decision block 912, if the sequencing state of the target in the sequencing data is a saturated sequencing state, the method 900 may proceed to block 948 to generate an output without adjusting the molecular markers based on directional adjacency and distribution-based error correction. For example, the number of noise molecule markers determined may be zero.
At decision block 924, if the sequencing state of the target in the sequencing data is an under-sequencing state, the method 900 may proceed to block 948 to generate an output without adjusting the molecular marker based on the distribution-based error correction. For example, the number of noise molecule markers determined may be zero. The method ends at block 952 at 900.
FIG. 10 is a flow chart illustrating a non-limiting exemplary embodiment 1000 of error correction using two negative binomial distributions. The blocks of method 1000 (e.g., block 904 and 952) have been described with reference to fig. 9. Briefly, method 1000 begins at block 904 after accepting sequencing data for a plurality of randomly barcoded targets. In some embodiments, the method 1000 further comprises randomly barcoding a plurality of targets using a plurality of random barcodes, wherein each of the plurality of random barcodes comprises a molecular marker, to create a plurality of randomly barcoded targets. In some embodiments, method 1000 further comprises sequencing a plurality of randomly barcoded targets to obtain sequencing data.
At block 908, for one or more of the plurality of targets: the number of molecular markers having different sequences associated with the target in the sequencing data can be counted. At block 916, the molecular marker count may be adjusted based on the directional adjacency. In some embodiments, adjusting the molecular count based on directional adjacency may be described with reference to fig. 7.
At block 920, the sequencing status of the target in the sequencing data can be determined. The sequencing state of the target in the sequencing data may include, or be under sequencing. At decision block 924, it can be determined whether the sequencing status of the target in the sequencing data is an under sequencing status.
At decision block 924, if the sequencing status of the target in the sequencing data is not an under sequencing status, the method 1000 may optionally proceed to decision block 1004. At decision block 1004, the sequencing depth of the target can be compared to a predetermined sequencing depth threshold. In different implementations, the sequencing depth threshold can be different. For example, the sequencing depth of the target can be, or is, about 1, 2, 3, 4, 5, 6, 7, 8, 9, 10, 20, 30, 40, 50, 60, 70, 80, 90, 100, or between any two of these values or a number or range. As another example, the sequencing depth of the target can be at least, or at most 1, 2, 3, 4, 5, 6, 7, 8, 9, 10, 20, 30, 40, 50, 60, 70, 80, 90, or 100.
If the sequencing depth of the target is greater than the sequencing depth threshold, the method 1000 proceeds to block 928. If the sequencing depth of the target is not greater than the sequencing depth threshold, the method 1000 proceeds to block 1008. At block 1008, single elements (e.g., single base substitutions) may be removed prior to generating an output at block 948.
At block 928, the molecular marker count may be filtered. Filtering the molecular marker counts can include, at decision block 912, determining whether the sequencing data has a saturated sequencing state. If the sequencing data does not have a saturated sequencing state at decision block 912, the method 1000 may proceed to decision block 932. At decision block 932, the number of molecular markers having different sequences associated with the target in the sequencing data that are less than the false point threshold can be determined.
At decision block 932, if the number of molecular markers having different sequences associated with the target in the sequencing data is less than the threshold of false points, the method 900 can optionally proceed to block 936, where false points can be added to the number of molecular markers having different sequences associated with the target in the sequencing data before determining the number of noise molecular markers having different sequences associated with the target in the sequencing data. In some embodiments, if the number of molecular markers having different sequences associated with the target in the sequencing data is less than the false point threshold, method 900 can proceed to block if the number of molecular markers having different sequences associated with the target in the sequencing data is less than the false point threshold, method 944.
At decision block 932, if the number of molecular markers having different sequences associated with the target in the sequencing data is not less than the false point threshold, the non-unique molecular markers can be removed at block 940. At block 944, the number of noise molecular markers that are used to determine different sequences associated with targets in the sequencing data can be removed. Non-unique molecular markers can include molecular markers having different sequences associated with targets in sequencing data that are greater than a predetermined threshold of recycling molecular markers.
At block 944, the molecular marker counts may be adjusted using a distribution-based error correction method. The distribution-based error correction method can include determining the number of noise molecule markers having different sequences associated with targets in the sequencing data. Determining the number of noise molecule markers may comprise: two negative binomial distributions, a signal negative binomial distribution, and a noise negative binomial distribution are fitted to the number of molecular markers having different sequences associated with the target in the sequencing data. The distribution of negative two terms of signal corresponds to the number of molecular markers having different sequences associated with the target in the sequencing data as signal molecular markers. The negative binomial distribution of noise corresponds to the number of molecular markers with different sequences associated with the target in the sequencing data as noise molecular markers. Determining the number of noise molecule markers may comprise determining the number of noise molecule markers using the fitted signal negative binomial distribution and the fitted noise negative binomial distribution.
At block 948, the number of targets may be estimated after the proximity-based and distribution-based error correction to produce an output. At decision block 912, if the sequencing state of the target in the sequencing data is a saturated sequencing state, the method 1000 may proceed to block 948 to generate an output without adjusting the molecular markers based on directional adjacency and distribution-based error correction.
At decision block 924, if the sequencing state of the target in the sequencing data is an under sequencing state, the method 1000 may proceed to block 948 to generate an output without adjusting the molecular marker based on the distribution-based error correction. For example, the number of noise molecule markers determined may be zero. The method ends at block 952 at 1000.
Directional adjacency-based, distribution-based error correction, subsampling corrected PCR and sequencing errors
FIG. 11 is a flow chart illustrating a non-limiting exemplary embodiment 1100 of error correction using two negative binomial distributions. The blocks of method 1100 (e.g., block 904 and 952) have been described with reference to FIG. 9. Briefly, method 1100 begins at block 904 after accepting sequencing data for a plurality of randomly barcoded targets. In some embodiments, the method 1100 further comprises randomly barcoding a plurality of targets using a plurality of random barcodes, wherein each of the plurality of random barcodes comprises a molecular marker, to create a plurality of randomly barcoded targets. In some embodiments, method 1100 further comprises sequencing a plurality of randomly barcoded targets to obtain sequencing data.
At block 908, for one or more of the plurality of targets: the number of molecular markers having different sequences associated with the target in the sequencing data can be counted. At decision block 912, it may be determined whether the sequencing data has a saturated sequencing state. If the sequencing data does not have a saturated sequencing state at decision block 912, the method 1100 proceeds to block 916, where the molecular marker count may be adjusted based on the directional adjacency. In some embodiments, adjusting the molecular count based on directional adjacency may be described with reference to fig. 7.
At block 920, the sequencing status of the target in the sequencing data can be determined. The sequencing state of the target in the sequencing data may include, or be under sequencing. At decision block 924, it can be determined whether the sequencing status of the target in the sequencing data is an under sequencing status.
At decision block 924, if the sequencing status of the target in the sequencing data is not an under sequencing status, the method 1100 may optionally proceed to decision block 1104. At decision block 1104, it can be determined whether the sequencing state of the target in the sequencing data is an over-sequencing state. For example, a target can be considered to have an over-sequencing state or to be a high-expression target if the depth (e.g., average, minimum, or maximum depth) of the target is greater than, or greater than, about 50, 100, 200, 250, 300, 400, 500, 600, 700, 800, 900, 1000, or a number or range between any two of these. As another example, a target can be considered to have a sequencing deficient status if the depth of the target is greater than at least, or at most, 50, 100, 200, 250, 300, 400, 500, 600, 700, 800, 900, or 1000.
In some embodiments, the over-sequencing state or high expression target can be determined by a target having a depth (e.g., average, minimum, or maximum depth) greater than a predetermined over-sequencing threshold. In different implementations, the over-sequencing threshold can be different. For example, the over-sequencing threshold can be, or is, about 50, 100, 200, 250, 300, 400, 500, 600, 700, 800, 900, 1000, or a number or range between any two of these. As another example, the over-sequencing threshold can be at least, or at most, 50, 100, 200, 250, 300, 400, 500, 600, 700, 800, 900, 1000.
In some embodiments, the over-sequencing state may depend on the number of molecular markers with different sequences of the stochastic barcode. For example, if the stochastic barcode contains about 6561 molecular markers with different sequences, the over-sequencing threshold can be, or be, about 50, 100, 200, 250, 300, 400, 500, 600, 700, 800, 900, 1000, or between any two of these values or a number or range. As another example, if the stochastic barcode contains about 6561 molecular markers with different sequences, the over-sequencing threshold can be at least, or at most, 50, 100, 200, 250, 300, 400, 500, 600, 700, 800, 900, 1000. In some embodiments, the under-sequencing state may not depend on the number of molecular tags with different sequences of the stochastic barcode.
At decision block 1104, if the target has an over-sequencing state, the method 1100 proceeds to block 1108. At block 1108, the ML coverage of the target may be reduced, for example, by performing ML coverage subsampling of all targets. For example, the number of molecular markers having different sequences associated with targets in the sequencing data can be sub-sampled to about a predetermined over-sequencing threshold (e.g., 10) for all targets. From block 1108, the method 1100 proceeds to block 928.
At decision block 1104, if the target does not have an over-sequencing state, the method 1100 proceeds to block 928 to filter the molecular marker counts. Filtering the molecular marker counts can include determining, at decision block 932, the number of molecular markers having different sequences associated with the target in the sequencing data that are less than the false point threshold.
At decision block 932, if the number of molecular markers having different sequences associated with the target in the sequencing data is less than the threshold of false points, the method 900 can optionally proceed to block 936, where false points can be added to the number of molecular markers having different sequences associated with the target in the sequencing data before determining the number of noise molecular markers having different sequences associated with the target in the sequencing data. In some embodiments, if the number of molecular markers having different sequences associated with the target in the sequencing data is less than the false point threshold, method 900 can proceed to block if the number of molecular markers having different sequences associated with the target in the sequencing data is less than the false point threshold, method 944.
At decision block 932, if the number of molecular markers having different sequences associated with the target in the sequencing data is not less than the false point threshold, the non-unique molecular markers can be removed at block 940. At block 944, the number of noise molecular markers that are used to determine different sequences associated with targets in the sequencing data can be removed. Non-unique molecular markers can include molecular markers having different sequences associated with targets in sequencing data that are greater than a predetermined threshold of recycling molecular markers.
At block 944, the molecular marker counts may be adjusted using a distribution-based error correction method. The distribution-based error correction method can include determining the number of noise molecule markers having different sequences associated with targets in the sequencing data. Determining the number of noise molecule markers may comprise: two negative binomial distributions, a signal negative binomial distribution, and a noise negative binomial distribution are fitted to the number of molecular markers having different sequences associated with the target in the sequencing data. The distribution of negative two terms of signal corresponds to the number of molecular markers having different sequences associated with the target in the sequencing data as signal molecular markers. The negative binomial distribution of noise corresponds to the number of molecular markers with different sequences associated with the target in the sequencing data as noise molecular markers. Determining the number of noise molecule markers may comprise determining the number of noise molecule markers using the fitted signal negative binomial distribution and the fitted noise negative binomial distribution.
At block 944, after adjusting the molecular marker counts using a distribution-based error correction method, the method 1100 optionally proceeds to block 1112. At block 1112, the adjusted molecular marker count from block 944 may be combined with the molecular marker count adjusted based on the oriented adjacency determined at block 916. For example, the non-unique molecular markers are removed at block 940 and are not used for distribution fitting at block 944. However, these molecular markers are still present in the molecular marker counts adjusted based on directional adjacency determined at block 916. Thus, at block 948, the adjusted molecular marker count from block 944 and the adjusted molecular marker count at block 944 may be combined to produce an output.
At decision block 912, if the sequencing state of the target in the sequencing data is a saturated sequencing state, the method 1100 may proceed to block 948 to generate an output without adjusting the molecular markers based on directional adjacency and distribution-based error correction. At decision block 924, if the sequencing state of the target in the sequencing data is an under sequencing state, the method 1100 may proceed to block 948 to generate an output without adjusting the molecular marker based on the distribution-based error correction. For example, the number of noise molecule markers determined may be zero. The method 1100 may end, for example, at block 952.
FIG. 12 is a flow diagram illustrating a non-limiting exemplary embodiment 1200 of error correction using two negative binomial distributions. The blocks of method 1200 (e.g., blocks 904 and 952 and 1104) have been described with reference to fig. 9 and 11. Briefly, method 1200 begins at block 904 after accepting sequencing data for a plurality of randomly barcoded targets. In some embodiments, the method 1200 further comprises randomly barcoding a plurality of targets using a plurality of random barcodes, wherein each of the plurality of random barcodes comprises a molecular marker, to create a plurality of randomly barcoded targets. In some embodiments, the method 1200 further comprises sequencing the plurality of randomly barcoded targets to obtain sequencing data.
At block 908, for one or more of the plurality of targets: the number of molecular markers having different sequences associated with the target in the sequencing data can be counted. At decision block 912, it may be determined whether the sequencing data has a saturated sequencing state. If the sequencing data does not have a saturated sequencing state at decision block 912, the method 1200 proceeds to block 916 where the molecular marker count may be adjusted based on the directional adjacency. In some embodiments, adjusting the molecular count based on directional adjacency may be described with reference to fig. 7.
At block 920, the sequencing status of the target in the sequencing data can be determined. The sequencing state of the target in the sequencing data may include, or be under sequencing. At decision block 924, it can be determined whether the sequencing status of the target in the sequencing data is an under sequencing status.
At decision block 924, if the sequencing status of the target in the sequencing data is not an under sequencing status, the method 1200 may optionally proceed to decision block 1104. At decision block 1104, it can be determined whether the sequencing state of the target in the sequencing data is an over-sequencing state.
At decision block 1104, if the target has an over-sequencing state or if the target is a high expression target, the method 1200 optionally proceeds to block 1208. At block 1208, the ML coverage of the target is reduced, for example, by sub-sampling the target-by-target ML coverage. For example, the number of molecular markers having different sequences associated with targets in the sequencing data can be sub-sampled to a predetermined over-sequencing threshold on a target-by-target basis. From block 1208, the method 1200 proceeds to block 928.
At decision block 1104, if the target does not have an over-sequencing state, the method 1200 proceeds to block 928 to filter the molecular marker counts. Filtering the molecular marker counts can include determining, at decision block 932, the number of molecular markers having different sequences associated with the target in the sequencing data that are less than the false point threshold.
At decision block 932, if the number of molecular markers having different sequences associated with the target in the sequencing data is less than the threshold of false points, the method 900 can optionally proceed to block 936, where false points can optionally be added to the number of molecular markers having different sequences associated with the target in the sequencing data before determining the number of noise molecular markers having different sequences associated with the target in the sequencing data. In some embodiments, if the number of molecular markers having different sequences associated with the target in the sequencing data is less than the false point threshold, method 900 can proceed to block if the number of molecular markers having different sequences associated with the target in the sequencing data is less than the false point threshold, method 944.
At decision block 932, if the number of molecular markers having different sequences associated with the target in the sequencing data is not less than the false point threshold, the non-unique molecular markers can be removed at block 940. At block 944, the number of noise molecular markers that are used to determine different sequences associated with targets in the sequencing data can be removed. Non-unique molecular markers can include molecular markers having different sequences associated with targets in sequencing data that are greater than a predetermined threshold of recycling molecular markers.
At block 944, the molecular marker counts may be adjusted using a distribution-based error correction method. The distribution-based error correction method can include determining the number of noise molecule markers having different sequences associated with targets in the sequencing data. Determining the number of noise molecule markers may comprise: two negative binomial distributions, a signal negative binomial distribution, and a noise negative binomial distribution are fitted to the number of molecular markers having different sequences associated with the target in the sequencing data. The distribution of negative two terms of signal corresponds to the number of molecular markers having different sequences associated with the target in the sequencing data as signal molecular markers. The negative binomial distribution of noise corresponds to the number of molecular markers with different sequences associated with the target in the sequencing data as noise molecular markers. Determining the number of noise molecule markers may comprise determining the number of noise molecule markers using the fitted signal negative binomial distribution and the fitted noise negative binomial distribution.
At block 944, after adjusting the molecular marker counts using a distribution-based error correction method, the method 1200 optionally proceeds to block 1112. At block 1112, the adjusted molecular marker count from block 944 may be combined with the molecular marker count adjusted based on the oriented adjacency determined at block 916. For example, the non-unique molecular markers are removed at block 940 and are not used for distribution fitting at block 944. However, these molecular markers are still present in the molecular marker counts adjusted based on directional adjacency determined at block 916. Thus, at block 948, the adjusted molecular marker count from block 944 and the adjusted molecular marker count at block 944 may be combined to produce an output.
At decision block 912, if the sequencing state of the target in the sequencing data is a saturated sequencing state, the method 1200 may proceed to block 948 to generate an output without adjusting the molecular markers based on directional adjacency and distribution-based error correction. At decision block 924, if the sequencing state of the target in the sequencing data is an under sequencing state, the method 1200 may proceed to block 948 to generate an output without adjusting the molecular marker based on the distribution-based error correction. For example, the number of noise molecule markers determined may be zero. The method ends at block 1200 at block 952.
Correcting based on directional adjacency and distribution-based error correction (with initial parameter evaluation for distribution fitting)
PCR and sequencing errors
FIG. 13 is a flow chart showing a non-limiting exemplary embodiment 13 of correcting PCR and sequencing errors by recursive-based replacement error correction and distribution-based error correction. The blocks of method 1300 (e.g., block 904 and 952) have been described with reference to FIG. 9. Briefly, method 1300 begins at block 904 after accepting sequencing data for a plurality of randomly barcoded targets. In some embodiments, method 1300 further comprises randomly barcoding a plurality of targets using a plurality of random barcodes, wherein each of the plurality of random barcodes comprises a molecular marker, to create a plurality of randomly barcoded targets. In some embodiments, method 1300 further comprises sequencing a plurality of randomly barcoded targets to obtain sequencing data.
At block 908, for one or more of the plurality of targets: the number of molecular markers having different sequences associated with the target in the sequencing data can be counted. At decision block 912, it may be determined whether the sequencing data has a saturated sequencing state. If the sequencing data does not have a saturated sequencing state at decision block 912, the method 1300 proceeds to block 916 where the molecular marker count may be adjusted based on the directional adjacency. In some embodiments, adjusting the molecular count based on directional adjacency may be described with reference to fig. 7.
At block 920, the sequencing status of the target in the sequencing data can be determined. The sequencing state of the target in the sequencing data may include, or be under sequencing. At decision block 924, it can be determined whether the sequencing status of the target in the sequencing data is an under sequencing status.
At decision block 924, if the sequencing status of the target in the sequencing data is not an under-sequencing status, the method 1300 may proceed to block 928 to filter the molecular marker counts. Filtering the molecular marker counts can include determining, at decision block 932, the number of molecular markers having different sequences associated with the target in the sequencing data that are less than the false point threshold.
At decision block 932, if the number of molecular markers having different sequences associated with the target in the sequencing data is less than the threshold of false points, the method 900 can optionally proceed to block 936, where false points can be added to the number of molecular markers having different sequences associated with the target in the sequencing data before determining the number of noise molecular markers having different sequences associated with the target in the sequencing data. In some embodiments, if the number of molecular markers having different sequences associated with the target in the sequencing data is less than the false point threshold, method 900 can proceed to block if the number of molecular markers having different sequences associated with the target in the sequencing data is less than the false point threshold, method 944.
At decision block 932, if the number of molecular markers having different sequences associated with the target in the sequencing data is not less than the false point threshold, the non-unique molecular markers can be removed at block 940.
Initial parameters for the two negative binomial distributions may optionally be estimated at block 1304 before adjusting the molecular marker counts at block 944. In different implementations, the initial parameters of the two negative binomial distributions may be different. In some embodiments, the mean and dispersion of each of the two negative binomial distributions may be one. In some embodiments, the mean and dispersion of the two negative binomial distributions may be estimated as the mean and dispersion of the non-empty subset of filtered molecular marker counts from block 928. For example, the subset may be the 25% -75% quantile of the filtered molecular marker count from block 928. The upper or lower range of quantiles may vary in different implementations. In some embodiments, the upper or lower range may be, or be about 1%, 2%, 3%, 4%, 5%, 6%, 7%, 8%, 9%, 10%, 20%, 30%, 40%, 50%, 70%, 80%, 90%, 99%, or a number or range between any two of these values. In some embodiments, the upper or lower range may be at least, or at most 1%, 2%, 3%, 4%, 5%, 6%, 7%, 8%, 9%, 10%, 20%, 30%, 40%, 50%, 70%, 80%, 90%, 99%, or 100%.
At block 944, the molecular marker counts may be adjusted using a distribution-based error correction method. The distribution-based error correction method can include determining the number of noise molecule markers having different sequences associated with targets in the sequencing data. Determining the number of noise molecule markers may comprise: two negative binomial distributions, a signal negative binomial distribution, and a noise negative binomial distribution are fitted to the number of molecular markers having different sequences associated with the target in the sequencing data. The distribution of negative two terms of signal corresponds to the number of molecular markers having different sequences associated with the target in the sequencing data as signal molecular markers. The negative binomial distribution of noise corresponds to the number of molecular markers with different sequences associated with the target in the sequencing data as noise molecular markers. Determining the number of noise molecule markers may comprise determining the number of noise molecule markers using the fitted signal negative binomial distribution and the fitted noise negative binomial distribution.
At block 948, the number of targets may be estimated after the proximity-based and distribution-based error correction to produce an output. At decision block 912, if the sequencing state of the target in the sequencing data is a saturated sequencing state, the method 1300 may proceed to block 948 to generate an output without adjusting the molecular markers based on directional adjacency and distribution-based error correction.
At decision block 924, if the sequencing state of the target in the sequencing data is an under sequencing state, the method 1300 may proceed to block 948 to generate an output without adjusting the molecular marker based on the distribution-based error correction. For example, the number of noise molecule markers determined may be zero. The method 1300 may end, for example, at block 952.
FIG. 14 is a flow chart showing a non-limiting exemplary embodiment for correcting PCR and sequencing errors based on recursive substitution error correction and distribution-based error correction by using the second highest molecular marker for the initial parameter estimate. The blocks of method 1400 (e.g., block 904 and 952) have been described with reference to FIG. 9. Briefly, the method 1400 begins at block 904 after accepting sequencing data for a plurality of randomly barcoded targets. In some embodiments, the method 1400 further comprises randomly barcoding a plurality of targets using a plurality of random barcodes, wherein each of the plurality of random barcodes comprises a molecular marker, to create a plurality of randomly barcoded targets. In some embodiments, method 1400 further comprises sequencing the plurality of randomly barcoded targets to obtain sequencing data.
At block 908, for one or more of the plurality of targets: the number of molecular markers having different sequences associated with the target in the sequencing data can be counted. At decision block 912, it may be determined whether the sequencing data has a saturated sequencing state. If the sequencing data does not have a saturated sequencing state at decision block 912, the method 1400 proceeds to block 916, where the molecular marker count may be adjusted based on the directional adjacency. In some embodiments, adjusting the molecular count based on directional adjacency may be described with reference to fig. 7.
At block 920, the sequencing status of the target in the sequencing data can be determined. The sequencing state of the target in the sequencing data may include, or be under sequencing. At decision block 924, it can be determined whether the sequencing status of the target in the sequencing data is an under sequencing status.
At decision block 924, if the sequencing status of the target in the sequencing data is not an under-sequencing status, the method 1400 may proceed to block 928 to filter the molecular marker counts. Filtering the molecular marker counts can include determining, at decision block 932, the number of molecular markers having different sequences associated with the target in the sequencing data that are less than the false point threshold.
At decision block 932, if the number of molecular markers having different sequences associated with the target in the sequencing data is less than the threshold of false points, the method 900 can optionally proceed to block 936, where false points can be added to the number of molecular markers having different sequences associated with the target in the sequencing data before determining the number of noise molecular markers having different sequences associated with the target in the sequencing data.
At decision block 932, if the number of molecular markers having different sequences associated with the target in the sequencing data is not less than the false point threshold, the non-unique molecular markers can be removed at block 940.
At block 944, the molecular marker counts may be adjusted using a distribution-based error correction method. An initial parameter of the distribution-based error correction method may be based on the counts of molecular markers. For example, an initial parameter (e.g., mean and distribution) for one of the negative binomial distributions (e.g., signal negative binomial distribution or noise negative binomial distribution) can be based on the count of one molecular marker, or on the mean or average of the counts of a number of molecular markers. The molecular marker may be the molecular marker having the second highest count, or a molecular marker having any ranking (e.g., having the 10 th highest count). In different implementations, the ranking of the molecular markers may be different. In some embodiments, the rating may be, or be about 1, 2, 3, 4, 5, 6, 7, 8, 9, 10, 20, 30, 40, 50, 60, 70, 80, 90, 100, or between any two of these values or a number or range. In some embodiments, the rating may be at least, or at most 1, 2, 3, 4, 5, 6, 7, 8, 9, 10, 20, 30, 40, 50, 60, 70, 80, 90, or 100. In different implementations, the number of molecular markers may be different. In some embodiments, the number of molecular markers can be, or is, about 1, 2, 3, 4, 5, 6, 7, 8, 9, 10, 20, 30, 40, 50, 60, 70, 80, 90, 100, or between any two of these values or a number or range. In some embodiments, the number of molecular markers can be at least, or at most 1, 2, 3, 4, 5, 6, 7, 8, 9, 10, 20, 30, 40, 50, 60, 70, 80, 90, or 100.
At block 948, the number of targets may be estimated after the proximity-based and distribution-based error correction to produce an output. At decision block 912, if the sequencing state of the target in the sequencing data is a saturated sequencing state, the method 1400 may proceed to block 948 to generate an output without adjusting the molecular markers based on directional adjacency and distribution-based error correction.
At decision block 924, if the sequencing state of the target in the sequencing data is an under-sequencing state, the method 1400 may proceed to block 948 to generate an output without adjusting the molecular marker based on the distribution-based error correction. For example, the number of noise molecule markers determined may be zero. The method ends at block 952.
Sequencing
In some embodiments, estimating the number of different randomly barcoded targets may include determining the sequence of labeled targets, spatial labels, molecular labels, sample labels, cellular labels, or any product thereof (e.g., labeled amplicons, or labeled cDNA molecules). The amplified target may be subjected to sequencing. Determining the sequence of the randomly barcoded target or any product thereof may include performing a sequencing reaction to determine the sequence of at least a portion of a sample marker, a spatial marker, a cellular marker, a molecular marker, the sequence of at least a portion of a randomly labeled target, its complement, its reverse complement, or any combination thereof.
The sequence of the randomly barcoded target (e.g., amplified nucleic acid, labeled nucleic acid, cDNA copy of labeled nucleic acid, etc.) can be determined using a variety of sequencing methods including, but not limited to, Sequencing By Hybridization (SBH), Sequencing By Ligation (SBL), Quantitative Incremental Fluorescent Nucleotide Addition Sequencing (QIFNAS), fragmentation and fragmentation, Fluorescence Resonance Energy Transfer (FRET), molecular beacons, TaqMan reporter probe digestion, pyrosequencing, Fluorescence In Situ Sequencing (FISSEQ), seq beads, wobble sequencing (12), multiplex sequencing, clustered (polymerized colony) (POLONY) sequencing; nanogrid rolling circle sequencing (rolny), allele-specific oligonucleotide ligation assay (e.g., Oligonucleotide Ligation Assay (OLA), single template molecule with ligated linear probes and Rolling Circle Amplification (RCA) readout, single template molecule with ligated held-lock probes (OLA) OLA, or single template molecule with ligated circular held-lock probes and Rolling Circle Amplification (RCA) readout), and the like.
In some embodiments, determining the sequence of the randomly barcoded target or any product thereof comprises paired-end sequencing, nanopore sequencing, high-throughput sequencing, shotgun sequencing, dye terminator sequencing, multi-primer DNA sequencing, primer walking, sanger dideoxy sequencing, maxm-Gilbert (Maxim-Gilbert) sequencing, pyrosequencing, true single molecule sequencing, or any combination thereof. Alternatively, the sequence of the randomly barcoded target or any product thereof can be determined by electron microscopy analysis or a chemically sensitive field effect transistor (chemFET) array.
High throughput sequencing methods such as circular array sequencing using platforms such as Roche 454, Illumina Solexa, ABI-SOLID, ION Torrent, Complete Genomics, Pacific Bioscience, Helicos, or Polonator platforms may also be used. In some embodiments, sequencing may comprise MiSeq sequencing. In some embodiments, sequencing may comprise HiSeq sequencing.
The randomly labeled target may include nucleic acids representing about 0.01% of genes from the genome of the organism to about 100% of genes from the genome of the organism. For example, about 0.01% of the genomic genes of an organism to about 100% of the genomic genes of an organism can be sequenced by capturing genes containing complementary sequences from the sample using a target complementary region comprising a plurality of multimers. In some embodiments, the randomly barcoded target includes nucleic acids representing from about 0.01% of the transcriptome of the organism to about 100% of the transcriptome of the organism. For example, about 0.501% of the transcriptome transcripts of an organism to about 100% of the transcriptome transcripts of an organism may be sequenced by capturing mRNA from the sample using a target complementary region comprising a poly (T) tail.
Determining the sequence of the spatial and molecular markers of the plurality of random barcodes can comprise sequencing 0.00001%, 0.0001%, 0.001%, 0.01%, 0.1%, 1%, 2%, 3%, 4%, 5%, 6%, 7%, 8%, 9%, 10%, 20%, 30%, 40%, 50%, 60%, 70%, 80%, 90%, 99%, 100%, or a number or range between any two of these values for the plurality of random barcodes. Determining the sequence of the tags (e.g., sample tag, spatial tag, and molecular tag) of the plurality of stochastic barcodes can comprise sequencing 1, 10, 20, 30, 40, 50, 60, 70, 80, 90, 100, 10, of the plurality of stochastic barcodes3、104、105、106、107、108、109、1010、1011、1012、1013、1014、1015、1016、1017、1018、1019、1020Or a number or range between any two of these values. Sequencing some or all of the plurality of random barcodes can include generating a random barcode having, or having at leastSequences that are few, or have a read length of at most 10, 20, 30, 40, 50, 60, 70, 80, 90, 100, 200, 300, 400, 500, 600, 700, 800, 900, 1000, 2000, 3000, 4000, 5000, 6000, 7000, 8000, 9000, 10000 nucleotides or bases, or between any two of these values or numbers or ranges.
Sequencing may comprise sequencing at least or at least about 10, 20, 30, 40, 50, 60, 70, 80, 90, 100 or more nucleotides or base pairs of the randomly barcoded target. For example, sequencing can include generating sequencing data by Polymerase Chain Reaction (PCR) amplification of a plurality of randomly barcoded targets, wherein the sequences have a read length of 50, 75, or 100, or more nucleotides. Sequencing may comprise sequencing at least or at least about 200, 300, 400, 500, 600, 700, 800, 900, 1,000 or more nucleotides or base pairs of a randomly barcoded target. Sequencing may comprise sequencing at least or at least about 1500, 2000, 3000, 4000, 5000, 6000, 7000, 8000, 9000, or 10000 or more nucleotides or base pairs of a randomly barcoded target.
Sequencing may include at least about 200, 300, 400, 500, 600, 700, 800, 900, 1,000 or more sequencing reads/runs. In some embodiments, sequencing comprises sequencing at least or at least about 1500, 2000, 3000, 4000, 5000, 6000, 7000, 8000, 9000, or 10000 or more sequencing reads per run. Sequencing may include less than or equal to about 1,600,000,000 sequencing reads/runs. Sequencing may include less than or equal to about 200,000,000 reads per run.
Sample (I)
In some embodiments, multiple targets may be included in one or more samples. The sample may comprise one or more cells, or nucleic acids from one or more cells. The sample may be a single cell or nucleic acid from a single cell. The one or more cells may be of one or more cell types. At least one of the one or more cell types may be a brain cell, a heart cell, a cancer cell, a circulating tumor cell, an organ cell, an epithelial cell, a metastatic cell, a benign cell, a primary cell, a circulating cell, or any combination thereof.
A sample for use in a method of the present disclosure may comprise one or more cells. A sample may refer to one or more cells. In some embodiments, the plurality of cells may include one or more cell types. At least one of the one or more cell types may be a brain cell, a heart cell, a cancer cell, a circulating tumor cell, an organ cell, an epithelial cell, a metastatic cell, a benign cell, a primary cell, a circulating cell, or any combination thereof. In some embodiments, the cell is a cancer cell excised from a cancerous tissue, such as breast cancer, lung cancer, colon cancer, prostate cancer, ovarian cancer, pancreatic cancer, brain cancer, melanoma, and non-melanoma skin cancers, among others. In some embodiments, the cell is derived from a cancer, but is collected from a bodily fluid (e.g., a circulating tumor cell). Non-limiting examples of cancer may include adenoma, adenocarcinoma, squamous cell carcinoma, basal cell carcinoma, small cell carcinoma, large cell undifferentiated carcinoma, chondrosarcoma, and fibrosarcoma. The sample may comprise a tissue, a monolayer of cells, fixed cells, a tissue section, or any combination thereof. The sample may comprise a biological sample, a clinical sample, an environmental sample, a biological fluid, a tissue or a cell from a subject. The sample may be obtained from a human, mammal, dog, rat, mouse, fish, fly, worm, plant, fungus, bacterium, virus, vertebrate, or invertebrate.
In some embodiments, the cell is a cell that has been infected with a virus and contains a viral oligonucleotide. In some embodiments, the viral infection may be caused by a virus such as a single-stranded (+ strand or "sense") DNA virus (e.g., a parvovirus), or a double-stranded RNA virus (e.g., a respiratory enterovirus). In some embodiments, the cell is a bacterium. These may include gram positive bacteria or gram negative bacteria. In some embodiments, the cell is a fungus. In some embodiments, the cell is a protozoan or other parasite.
As used herein, the term "cell" may refer to one or more cells. In some embodiments, the cells are normal cells, e.g., human cells at different developmental stages, or human cells from different organ or tissue types. In some embodiments, the cell is a non-human cell, such as other types of mammalian cells (e.g., mouse, rat, pig, dog, cow, or horse). In some embodiments, the cell is other types of animal or plant cells. In other embodiments, the cell may be any prokaryotic or eukaryotic cell.
In some embodiments, the cells are sorted prior to associating the cells with the beads. For example, the cells may be sorted by fluorescence activated cell sorting or magnetic activated cell sorting, or more generally by flow cytometry. Cells may be filtered by size. In some embodiments, the retentate comprises cells to be associated with beads. In some embodiments, the flow through contains the cells to be associated with the beads.
A sample may refer to a plurality of cells. The sample may refer to a monolayer of cells. A sample may refer to a thin section (e.g., a thin section of tissue). A sample may refer to a solid or semi-solid collection of cells, which may be placed in one dimension on an array.
Data analysis and display software
Data analysis and visualization of spatial resolution of a target
The present disclosure provides methods for estimating the number and location of targets with random barcodes and numeric counts using spatial labeling. The data obtained from the disclosed methods can be visualized on a map. The information generated using the methods herein can be used to construct a map of the number and location of targets from a sample. The map can be used to locate the physical location of the target. The map can be used to identify the location of multiple targets. The multiple targets can be the same target species, or the multiple targets can be multiple different targets. For example, maps of the brain can be constructed to show the numerical counts and locations of multiple targets.
A profile may be generated from data from a single sample. The profiles may be constructed using data from multiple samples, thereby generating a combined profile. Profiles can be constructed using data from tens, hundreds, and/or thousands of samples. A profile constructed from a plurality of samples can show a distribution of digital counts of targets associated with a common region of the plurality of samples. For example, duplicate assays may be displayed on the same map. At least 1, 2, 3, 4, 5, 6, 7, 8, 9, or 10, or more repetitions (e.g., overlays) may be displayed on the same figure. Up to 1, 2, 3, 4, 5, 6, 7, 8, 9, or 10, or more repetitions (e.g., overlays) may be shown on the same figure. The spatial distribution and the number of targets can be represented by various statistics.
Combining data from multiple samples can increase the positional resolution of the combined profile. The orientation of multiple samples may be recorded by common landmarks, where measurements are at least partially discontinuous across the various locations of the sample. One particular example is to slice a sample using a microtome on one axis and then slice a second sample along a different path. The combined data set will give a three-dimensional spatial position associated with the digital count of the target. Multiplexing the above methods will allow for a high resolution three-dimensional atlas of digital counting statistics.
In some embodiments of the instrument system, the system will include a computer-readable medium including code for providing data analysis for a sequence dataset generated by performing a single cell, random barcoding assay. Examples of data analysis functions that can be provided by data analysis software include, but are not limited to, (i) algorithms for decoding/demultiplexing sample markers, cell markers, spatial markers and molecular markers and target sequence data provided by sequencing a random barcode library generated in a running assay, (ii) algorithms for determining the number of reads per gene per cell and the number of unique transcript molecules per gene per cell based on data and creating a summary table, (iii) statistical analysis of sequence data, e.g., for clustering cells by gene expression data, or for predicting confidence intervals to determine the number of transcript molecules per gene per cell, etc., (iv) algorithms for identifying rare cell subpopulations, e.g., using principal component analysis, hierarchical clustering, k-means clustering, self-organizing mapping, Neural networks, and the like, (v) sequence alignment capabilities of gene sequence data to known reference sequences and detection of mutations, polymorphic markers, and splice variants, and (vi) automated clustering of molecular markers to compensate for amplification or sequencing errors. In some embodiments, commercially available software can be used to perform all or a portion of the data analysis, for example, Seven-bridge (Seven Bridges, https:// www.sbgenomics.com /) software can be used to compile a table of copy numbers of one or more genes present in each cell in the entire collection of cells. In some embodiments, the data analysis software may include an option for outputting sequencing results in a useful graphical format, e.g., a heat map indicating the copy number of one or more genes present in each cell of a collection of cells. In some embodiments, the data analysis software may also include algorithms for extracting biological significance from the sequencing results, for example by correlating the copy number of one or more genes present in each cell of the collection of cells with a cell, a rare cell, or a cell derived from a subject having a particular disease or disorder. In some embodiments, the data analysis software may also include algorithms for comparing cell populations across different biological samples.
In some embodiments, all data analysis functions may be packaged in a single software package. In some embodiments, the complete set of data analysis capabilities may comprise a suite of software packages. In some embodiments, the data analysis software may be a stand-alone package made available to the user independent of the assay instrument system. In some embodiments, the software may be web-based and may allow users to share data.
In some embodiments, all data analysis functions may be packaged in a single software package. In some embodiments, the complete set of data analysis capabilities may comprise a suite of software packages. In some embodiments, the data analysis software may be a stand-alone package made available to the user independent of the assay instrument system. In some embodiments, the software may be web-based and may allow users to share data.
System processor and network
In general, a computer or processor used in a method suitable for the presently disclosed instrumentation system (as illustrated in FIG. 15) may be further understood as a logic device that may read instructions from media 1511 or network port 1505, which may optionally be connected to a server 1509 having fixed media 1512. The system 1500 (shown in fig. 15) may include a CPU 1501, a disk drive 1503, an optional input device (such as a keyboard 1515 or mouse 1516), and an optional monitor 1507. Data communication may be accomplished by transmission from a designated communication medium to a server at a local or remote location. The communication medium may include any means for transmitting or receiving data. For example, the communication medium may be a network connection, a wireless connection, or an internet connection. Such connections may provide for communication via the world wide web. It is contemplated that data related to the present disclosure may be transmitted over such a network or connection for receipt or review by recipient 1522, as illustrated in fig. 15.
FIG. 16 illustrates an exemplary embodiment of a first exemplary architecture for a computer system 1600 that may be used in conjunction with the exemplary embodiments of the present disclosure. As depicted in fig. 16, the exemplary computer system may include a processor 1602 for processing instructions. Non-limiting examples of processors include: intel Xeon processor, AMD OpteronTMProcessor, Samsung 32-bit RISC ARM1176JZ (F) -S v1.0TMA processor, an ARM Cortex-A8 Samsung S5PC100TM processor, an ARM Cortex-A8 apple A4TM processor, a Merwell (Marvell) PXA 930TM processor, or a functionally equivalent processor. Multiple threads of execution may be used for parallel processing. In some embodiments, multiple processors or processors with multiple cores may also be used, whether distributed across a system in a single computer system, in groups, or over a network that includes multiple computers, cell phones, or personal data assistant devices.
As illustrated in fig. 16, the cache 1604 may be coupled to or incorporated into the processor 1602 to provide a high-speed memory for instructions or data that have been recently or frequently used by the processor 1602. The processor 1602 is connected to a north bridge 1606 by a processor bus 1608. The north bridge 1606 is coupled to Random Access Memory (RAM)1610 via a memory bus 1612 and manages access to the RAM 1610 by the processor 1602. The north bridge 1606 is also connected to the south bridge 1614 via a chip lumped line 1616. The south bridge 1614 is further coupled to a peripheral bus 1618. The peripheral bus may be, for example, PCI-X, PCI Express, or other peripheral bus. The north bridge and south bridge are commonly referred to as a processor chipset and manage data transfers between the processor, RAM, and peripheral components on the peripheral bus 1618. In some alternative architectures, instead of using a separate north bridge chip, the functionality of the north bridge may be incorporated into the processor.
In some embodiments, the system 1600 may include an accelerator card 1622 attached to a peripheral bus 1618. The accelerator may include a Field Programmable Gate Array (FPGA) or other hardware for accelerating certain processes. For example, the accelerator may be used for adaptive data reconstruction or for evaluating algebraic expressions used in extended set processing.
Software and data are stored in external memory 1624 and may be loaded into RAM 1610 or cache 1604 for use by the processor. System 1600 includes an operating system for managing system resources; non-limiting examples of operating systems include: linux and WindowsTM、MACOSTM、BlackBerry OSTM、iOSTMAnd other functionally equivalent operating systems, and application software running on top of the operating system for managing data storage and optimization in accordance with exemplary embodiments of the present invention.
In this example, system 1600 also includes Network Interface Cards (NICs) 1620 and 1621 coupled to peripheral buses to provide network interfaces for external storage (e.g., Network Attached Storage (NAS)) and other computer systems that may be used for distributed parallel processing.
FIG. 17 illustrates an exemplary diagram showing a network 1700 having multiple computer systems 1702a and 1702b, multiple cell phones and personal data assistants 1702c, and attached network storage (NAS)1704a and 1704b suitable for use with the methods of the present disclosure. In an exemplary embodiment, the systems 1712a, 1712b, and 1712c may manage data storage and optimize data access for data stored in Network Attached Storage (NAS)1714a and 1714 b. Mathematical models can be used for data and evaluated using distributed parallel processing across computer systems 1712a and 1712b, and cell phones and personal data assistant systems 1712 c. The computer systems 1712a and 1712b and cell phones and personal data assistant system 1712c may also provide parallel processing for adaptive data reconstruction of data stored in Network Attached Storage (NAS)1714a and 1714 b. FIG. 17 illustrates only one example, and a wide variety of other computer architectures and systems can also be used in conjunction with the different embodiments of the present invention. For example, blade servers may be used to provide parallel processing. Processor blades may be connected through a backplane to provide parallel processing. The storage may also be attached to the backplane through a separate network interface or as Network Attached Storage (NAS).
In some example embodiments, processors may maintain separate memory spaces and transmit data over a network interface, backplane, or other connector for parallel processing by other processors. In other embodiments, some or all of the processors may use a shared virtual address memory space.
FIG. 18 shows an exemplary block diagram of a multiprocessor computer system 1800 that uses a shared virtual address memory space in accordance with one illustrative embodiment. The system includes a plurality of processors 1802a-f that have access to a shared memory subsystem 1804. The system incorporates a plurality of programmable hardware storage algorithm processors (MAP)1806a-f in the storage subsystem 1804. The MAPs 1806a-f may each include memory 1808a-f and one or more Field Programmable Gate Arrays (FPGAs) 1810 a-f. The MAP provides a configurable functional unit and specific algorithms or portions of algorithms may be provided to the FPGAs 1810a-f for processing in close cooperation with a corresponding processor. For example, MAP may be used to evaluate algebraic expressions against data models and for adaptive data reconstruction in example embodiments. In this example, each MAP is globally accessible by all processors for these purposes. In one configuration, each MAP may use Direct Memory Access (DMA) to access an associated memory 1808a-f, thereby allowing it to perform tasks independently and asynchronously from the corresponding microprocessor 1802 a-f. In such a configuration, a MAP may give the results directly to another MAP for pipelining and parallel execution of the algorithm.
The above computer architectures and systems are merely examples, and a wide variety of other computer, cell phone, and personal data assistant architectures and systems can be used in conjunction with the example embodiments, including systems using any combination of general purpose processors, co-processors, FPGAs and other programmable logic devices, systems on a chip (SOC), Application Specific Integrated Circuits (ASICs), and other processing and logic elements. In some embodiments, all or part of the computer system may be implemented in software or hardware. Any kind of data storage medium may be used in conjunction with the example embodiments, including random access memory, hard disk drives, flash memory, tape drives, disk arrays, Network Attached Storage (NAS), and other local or distributed data storage devices and systems.
In exemplary embodiments, the computer subsystems of the present disclosure can be implemented using software modules executing on any of the above or other computer architectures and systems. In other embodiments, the functionality of the system may be implemented partially or completely in: firmware, programmable logic devices such as Field Programmable Gate Arrays (FPGAs), system on a chip (SOL), Application Specific Integrated Circuits (ASICs), or other processing and logic elements. For example, the hub processor and optimizer may be implemented through hardware acceleration using a hardware accelerator card (e.g., an accelerator card).
System processor and network
In general, a computer or processor included in the presently disclosed instrumentation system (as illustrated in the figures) may be further understood as a logic device that may read instructions from medium 11 or network port 05, which may optionally be connected to a server 09 having a fixed medium 12. System 00 (as shown) may include a CPU 01, a disk drive 03, optional input devices (such as a keyboard 15 or mouse 16), and an optional monitor 07. Data communication may be accomplished by transmission from a designated communication medium to a server at a local or remote location. The communication medium may include any means for transmitting or receiving data. For example, the communication medium may be a network connection, a wireless connection, or an internet connection. Such connections may provide for communication via the world wide web. It is contemplated that data related to the present disclosure may be transmitted over such a network or connection for receipt or review by recipient 22, as illustrated.
An exemplary embodiment of a first exemplary architecture for a computer system 00 that may be used in conjunction with the exemplary embodiments of the present disclosure is illustrated. As depicted, the exemplary computer system may include a processor 02 for processing instructions. Non-limiting examples of processors include: intel Xeon processor, AMD Opteron TMProcessor, Samsung 32-bit RISC ARM 1176JZ (F) -S v 1.0.0TMA processor, an ARM Cortex-A8 Samsung S5PC100TM processor, an ARM Cortex-A8 apple A4TM processor, a Merwell (Marvell) PXA 930TM processor, or a functionally equivalent processor. Multiple threads of execution may be used for parallel processing. In some embodiments, multiple processors or processors with multiple cores may also be used, whether distributed across a system in a single computer system, in groups, or over a network including multiple computers, cell phones, or personal data assistant devices.
As illustrated, cache 04 may be coupled to or incorporated into processor 02 to provide a high speed memory for instructions or data that have been recently or frequently used by processor 02. The processor 02 is connected to the north bridge 06 by a processor bus 08. The north bridge 06 is connected to a Random Access Memory (RAM)10 through a memory bus 12 and manages access to the RAM 10 by the processor 02. The north bridge 06 is also connected to the south bridge 14 through a chipset bus 16. South bridge 14, in turn, connects to peripheral bus 18. The peripheral bus may be, for example, PCI-X, PCI Express, or other peripheral bus. The north bridge and south bridge are commonly referred to as a processor chipset and manage data transfers between the processor, RAM, and peripheral components on the peripheral bus 18. In some alternative architectures, instead of using a separate north bridge chip, the functionality of the north bridge may be incorporated into the processor.
In some embodiments, system 00 may include an accelerator card 22 attached to peripheral bus 18. The accelerator may include a Field Programmable Gate Array (FPGA) or other hardware for accelerating certain processes. For example, the accelerator may be used for adaptive data reconstruction or for evaluating algebraic expressions used in extended set processing.
Software and data are stored in external memory 24 and may be loaded into RAM 10 or cache 04 for use by the processor. System 00 includes an operating system for managing system resources; non-limiting examples of operating systems include: linux and WindowsTM、MACOSTM、BlackBerry OSTM、iOSTMAnd other functionally equivalent operating systems, and application software running on top of the operating system for managing data storage and optimization in accordance with exemplary embodiments of the present invention.
In this example, system 00 also includes Network Interface Cards (NICs) 20 and 21 connected to the peripheral bus to provide network interfaces for external storage (e.g., Network Attached Storage (NAS)) and other computer systems that may be used for distributed parallel processing.
An exemplary diagram showing a network 00 having a plurality of computer systems 02a and 02b, a plurality of handsets and personal data assistants 02c, and Network Attached Storage (NAS)04a and 04b is illustrated. In an exemplary embodiment, the systems 12a, 12b, and 12c may manage data storage and optimize data access for data stored in Network Attached Storage (NAS)14a and 14 b. Mathematical models can be used for data and evaluated using distributed parallel processing across computer systems 12a and 12b, and cell phones and personal data assistant systems 12 c. The computer systems 12a and 12b and handsets and personal data assistant system 12c may also provide parallel processing for adaptive data reconstruction of data stored in Network Attached Storage (NAS)14a and 14 b. The figure illustrates only one example, and a wide variety of other computer architectures and systems can be used in conjunction with different embodiments of the present invention. For example, blade servers may be used to provide parallel processing. Processor blades may be connected through a backplane to provide parallel processing. The storage may also be attached to the backplane through a separate network interface or as Network Attached Storage (NAS).
In some example embodiments, processors may maintain separate memory spaces and transmit data over a network interface, backplane, or other connector for parallel processing by other processors. In other embodiments, some or all of the processors may use a shared virtual address memory space.
There is illustrated an exemplary block diagram of a multiprocessor computer system 00 that uses a shared virtual address memory space in accordance with an exemplary embodiment. The system includes a plurality of processors 02a-f that may access a shared storage subsystem 04. The system incorporates a plurality of programmable hardware storage algorithm processors (MAP)06a-f in the storage subsystem 04. The MAPs 06a-f may each include a memory 08a-f and one or more Field Programmable Gate Arrays (FPGAs) 10 a-f. The MAP provides a configurable functional element and the specific algorithm or portions of the algorithm may be provided to the FPGAs 10a-f for processing in close cooperation with the corresponding processor. For example, MAP may be used to evaluate algebraic expressions against data models and for adaptive data reconstruction in example embodiments. In this example, each MAP is globally accessible by all processors for these purposes. In one configuration, each MAP may use Direct Memory Access (DMA) to access the associated memory 08a-f, allowing it to perform tasks independently and asynchronously from the corresponding microprocessor 02 a-f. In such a configuration, a MAP may give the results directly to another MAP for pipelining and parallel execution of the algorithm.
The above computer architectures and systems are merely examples, and a wide variety of other computer, cell phone, and personal data assistant architectures and systems can be used in conjunction with the example embodiments, including systems using any combination of general purpose processors, co-processors, FPGAs and other programmable logic devices, systems on a chip (SOC), Application Specific Integrated Circuits (ASICs), and other processing and logic elements. In some embodiments, all or part of the computer system may be implemented in software or hardware. Any kind of data storage medium may be used in conjunction with the example embodiments, including random access memory, hard disk drives, flash memory, tape drives, disk arrays, Network Attached Storage (NAS), and other local or distributed data storage devices and systems.
In exemplary embodiments, the computer subsystems of the present disclosure can be implemented using software modules executing on any of the above or other computer architectures and systems. In other embodiments, the functionality of the system may be implemented partially or completely in: firmware, programmable logic devices such as Field Programmable Gate Arrays (FPGAs), system on a chip (SOL), Application Specific Integrated Circuits (ASICs), or other processing and logic elements. For example, the hub processor and optimizer may be implemented through hardware acceleration using a hardware accelerator card (e.g., an accelerator card).
Examples of the invention
Some aspects of the embodiments discussed above are disclosed in further detail in the following examples, which are not intended to limit the scope of the disclosure in any way.
Example 1
Correcting single base substitution errors
This example demonstrates correcting PCR or sequencing errors involving one base substitution. Since there are the same molecular markers for multiple targets, if there are 38The unique stochastic barcodes, by similar molecular markers of the target, and with ≦ 7 (if there are 48 unique stochastic barcodes, 17) appearance (i.e., sequencing read) copy qualitative and will involve a base substitution PCR or sequencing error removal.
Stochastic barcoding can include, prior to the RT step, the use of 3 with oligo (dT)8(6561) Individual unique random barcode non-depleted pools serve as their target binding regions to label mRNA with poly (a) in the sample. The labeling process may be arbitrary, and each target molecule may be hybridized with one random barcode. For any target, if the number of target molecules is much smaller than randomThe number of barcodes, each target molecule may hybridize to a different random barcode. Thus, if only a small number of target molecules are present, it is unlikely that the small number of target molecules will hybridize to a random barcode with a similar molecular signature (ML) during hybridization.
Calculate from 38The probability that at least one pair of stochastic barcodes with similar molecular markers will be sampled from each non-depleted unique stochastic barcode. Two molecular markers may have similar sequences if they differ by one base. This sampling event may be considered a back sampling method because the random barcode may be effectively non-depleting. This probability can help eliminate random barcodes with similar molecular markers that are least likely to be present for a sample containing multiple targets. The problem can be expressed as the number of stochastic barcodes required, so that at least two stochastic barcodes with similar molecular markers can be selected with a certain probability. This problem can be expressed as the minimum sample size required, so that the probability of two random barcodes with similar sequences can be greater than 0.5 (at 3)8In the case of a single different molecular marker). Thus, this problem can be seen as a generalization of the classic birthday problem. The classic birthday question may determine the minimum sample size required so that the probability of two people sharing the same birthday may be greater than 0.5 (in the case of 365 different birthdays).
To derive this sample size r, the calculation is from 3 8The probability of having at least one pair of similar molecular markers (using their complementary events) in the case of r stochastic barcodes of a sample of individual unique stochastic barcodes. If only from 38Randomly selecting one random barcode from the unique random barcodes, and determining the probability p that the molecular marker of the random barcode may be dissimilar to the molecular markers of other random barcodes 11 because there is only one random barcode. If it is still from 38Optionally selecting the second random barcode from the unique random barcodes, and determining the probability p that the molecular markers of the second random barcode may be dissimilar to the molecular markers of the first random barcode2,=(38–16–1)/38. This is because it is assumed that there are three possibilities for each location in the random barcodeWith two possible nucleotide substitutions per base position for a given molecular tag, resulting in a total of 2 x 8 one base variants. If the third random barcode continues to randomly tag 3 with a unique molecular marker8The probability p that the molecular marker of the random barcode is dissimilar to the molecular markers of the two previous random barcodes when the random barcode is extracted3,=(38–1–16–1–16)/38=(38–2*17)/38. Can be from 38The unique random bar code is continuously extracted until the r-th random bar code. Probability p that the last random barcode may be dissimilar from the previous random barcode r=(3 8–(r–1)*17)/38. Since all r stochastic barcodes are independently extracted, the probability P (all molecular markers having no similar sequence) of extracting all stochastic barcodes having no similar sequence is P1*p2*p3*…*pr. Thus, in 3 from a tag with a unique molecule8A random bar codeIs/are as followsThe probability that at least one pair of the r random barcodes are similar is P (at least one pair of molecular tags having similar sequences) 1-P (all molecular tags that do not have similar sequences). The sample size r is then calculated by this equation by setting the expected value of 0.01, 0.05, 0.1, or the expected value for P (at least one pair of molecular markers with similar sequences).
TABLE 1 probability of observing random barcodes with similar molecular markers for a given number of unique molecular markers.

Table 1 shows that8The probability that there is at least one similar pair in r molecular markers of the one or 48 unique molecular markers. If there is 38Selecting 7 unique random barcodes (if 4)817 unique random barcodes), the probability of observing a pair of random barcodes with similar molecular markersLess than 0.05, which is negligible. Thus, as evidenced by this small probability, similar molecular markers are more likely to be artifacts than true likely choices of similar random barcodes and can be corrected for.
However, if there are more than 7 to 24 stochastic barcodes, then the probability of observing more than one pair of stochastic barcodes with similar molecular markers will be higher (e.g., 0.5). Thus, the possibility that these random barcodes are authentic rather than artifacts cannot be excluded with certainty. In contrast, the common intuition may erroneously conclude that if 24 random barcodes are drawn from only a large pool of 6561 unique possibilities, then any one base bias may be the result of a sequencing error rather than coincidence.
For example, if 115 stochastic barcodes were sampled arbitrarily, 100% determined that there would be at least one pair of stochastic barcodes with similar molecular markers because the calculated probability is one. Assuming there are 115 targets in the sample, two pairs of stochastic barcodes with similar molecular markers and 111 stochastic barcodes with dissimilar molecular markers (out of a total of 115 stochastic barcodes) can be observed after the hybridization and reverse transcription process. However, if in the sequencing data, three pairs of random barcodes with similar molecular markers and 110 random barcodes with dissimilar molecular markers (out of a total of 116 random barcodes) are observed, then the probability that only two pairs of random barcodes have similar molecular markers is true, and the third pair is created by some errors. This 100% probability indicates that, during stochastic barcoding, when 115 stochastic barcodes were arbitrarily sampled, an event could occur in which at least one pair of stochastic barcodes was observed to have similar molecular markers; however, this does not mean that all observed pairs of similar molecular markers are true. Stochastic barcodes with similar molecular markers can be generated from stochastic barcodes, true or correct molecular markers, or from PCR errors, artifacts, or sequencing errors, or false molecular markers. Thus, if similar molecular markers are observed, further evaluation may be required to determine whether a particular pair of molecular markers is authentic. When the total molecular weight is labeled from 3 8Is increased to 48At all times, for each probability, more stochastic barcodes are required in anticipation of similar molecular marker pairs.
Tables 2 and 3 show that when ≦ 7 random barcodes with unique molecular markers are observed, similar molecular markers are unlikely to occur because the probability of such occurrences is less than 0.05. Thus, those similar molecular markers may be caused by PCR errors, artifacts, or sequencing errors, and these should be removed from the molecular marker counts to correct or adjust the molecular marker counts. Thus, the total number of authentic molecular markers in tables 2 and 3 can be reduced from 5 to 1, and from 7 to 6, respectively. However, 23 unique barcodes were observed in table 4, which is expected to have a probability of about 50% for at least one pair of random barcodes with similar molecular markers. Thus, while 16 pairs of random barcodes with similar molecular markers may be authentic, each pair of similar molecular markers will require further evaluation to confirm whether they are authentic.
TABLE 2 CD69 raw data for 10pg input RNA from well H01 (4 pairs of similar molecular markers were observed from the most abundant barcodes)

TABLE 3 CD64 raw data of 500pg input RNA from well A01 (1 pair of similar molecular markers observed).

TABLE 4 TFRC raw data for 10pg input RNA from well E11 (16 pairs of similar molecular markers were observed in total from the 4 most abundant random barcodes)


Taken together, these data indicate that the number of observed stochastic barcodes with similar molecular markers are removed, as PCR errors, artifacts, or sequencing errors may result in these stochastic barcodes with similar molecular markers.
Example 2
Determining a mass status of a target in sequencing data
This example demonstrates that the mass status of a target in sequencing data is determined to be a full sequencing mass status, an incomplete sequencing mass status, or a saturated sequencing mass status. The quality status of the target depends on whether all true or authentic molecular markers are observed.
As illustrated in example 1, the complete count of random barcodes with unique molecular markers present in a library can depend greatly on the sequencing depth. The deeper the sequencing, the greater the likelihood of observing all true molecular markers. Shallow sequencing will be cheaper, but many molecular markers can be missed, and gene detection sensitivity may also be compromised. Complete sequencing may mean that all authentic molecular markers for the random barcodes that label the target molecule are observed, and incomplete sequencing may mean that only some authentic molecular markers are observed. In addition, there may be more than 48568 target molecules present in the starting sample (this would be based on seeing a lower limit on the number of molecules that are poisson corrected or adjusted for 6561-2 standard deviations of the different random barcodes). Saturation sequencing can then occur when it is difficult to determine the number of target molecules due to limitations on the diversity of total molecular markers. However, if a small amount of RNA is used as input for the random barcode, saturated sequencing will be unlikely.
To mathematically define complete or incomplete sequencing, each was compared to a theoretical model without any errors. Under perfect experimental conditions, given j cycles of PCR and C efficiency for each cycle, each copy of the target molecule in the starting sample can yield (1+ C)jAnd (4) copying. Then for the starting sampleEach barcode molecule in the article, Illumina sequencing, can be essentially considered as amplified (1+ C) from the original barcode moleculejPoisson sampling of clonal copies. Theoretically, sequencing k randomly barcoded target molecules for the same target gene can be considered from (1+ C)jDuplicate poisson sampling of individual copies, since all randomly barcoded molecules can be represented equally after PCR. An important assumption for the poisson model is that the mean is equal to the variance, and that the sequencing reads should follow equal dispersion. Dispersion may be defined as variance/mean.
In practice, because full sequencing can typically be accompanied by errors that typically cluster at much lower read frequencies. Unlike a true molecular marker, errors are less likely to participate in all PCR cycles, and therefore will produce fewer copies that result in a change in the frequency of readings (which is much greater compared to Poisson). FIGS. 19A-19B show examples of fully and incompletely sequenced genes. In fig. 19A, the maximum sequencing read is more than 350-fold the minimum sequencing read. Thus, complete sequencing tends to exhibit a larger dispersion index (>1) relative to poisson.
In contrast, for incomplete sequencing, only some of the random barcodes in the library with authentic molecular markers have been sequenced, and thus the sequencing reads will vary less compared to poisson. In fig. 19B, the maximum sequencing read is only about 3-fold the minimum sequencing read. Therefore, incomplete sequencing tends to exhibit a small dispersion index (<1) relative to poisson.
In addition to calculating the dispersion index, the sequencing reads of the most abundant molecular markers can be used to decide whether sequencing is complete. For example, if the read for the most abundant molecular index is 25 and the dispersion index is 5, the sequencing state may be classified as complete; otherwise, it may be classified as incomplete. A threshold of 25 reads may be used because sequencing may not be complete until a sequencing error begins to occur. If any molecular marker is found more than 25 times, sequencing errors may result.
In cases where sequencing data for high abundance genes in stochastic barcodes is saturated, e.g., for 3 with unique molecular markers8Each random stripCodes exceed 6557 and sequencing information for other low expressing genes in the same well can be used to calculate the discrete index and maximum sequencing read for that gene. For example, if the second most abundant gene in the same well is not saturated in random barcodes and is classified as incompletely sequenced, then the saturation of the first gene may be considered true and the number of molecules cannot be calculated. And if the second most abundant gene is classified as fully sequenced, saturation of the first gene may be an artifact and the occurrence of all random barcodes may be due to error. And a thresholding algorithm based on a poisson model can be used to identify the number of authentic molecular markers.
Taken together, these data demonstrate sequencing that determines the sequencing state as complete sequencing, incomplete sequencing, or saturated sequencing.
Example 3
Correction of PCR or sequencing errors with one base substitution for fully sequenced genes
This example shows that PCR or sequencing errors with one base substitution are corrected for a fully sequenced gene (i.e., a gene with a fully sequenced quality status in the sequencing data). This example also shows defining thresholds for molecular markers of a target (e.g., a gene) to identify true molecular markers and false molecular markers associated with the target in sequencing data.
The sequencing error rate/nucleotide can vary from 0.1% to 1% and can generally be considered a low frequency reading. As sequencing progresses, more sequencing errors may be generated. For example, if the eukaryotic nucleotide sequencing error is 0.5%, and the molecular tag is sequenced 100 times, then if the molecular tag is 8 nucleotides in length, the expected number of sequencing errors associated with this molecular tag may be about 4 (from 100 (1- (1-0.5%)8) Calculation). If the molecular marker is sequenced 300 times, the expected number of sequencing errors may be about 12. These sequencing errors can produce artifact molecular marker sequences that can swell the counts. These molecular markers may be removed prior to performing additional analyses.
Of all sequencing errors, one base error occurs much more frequently than those differing by one base. The probability of having a one base sequencing error can be derived from a binomial distribution with a sample size of 8 and a success probability equal to the one base sequencing error rate. One purpose is to correct one base sequencing error. One base sequencing error can be considered to be the most abundant and closest (e.g., in terms of hamming distance) molecular signature (parent molecular signature) child molecular signature. Sequencing errors are identified by finding the authentic molecular marker of the parent molecular marker (i.e., a daughter molecular marker that differs from the parent molecular marker by one base).
TABLE 5 updated TFRC sequencing data after removal of one base sequencing error from 10pg input RNA well E11

Selection of parent and child molecular markers
It may be required that the parent molecular tag may have>25 sequencing reads, and it may be required that the daughter molecular marker may have no more than 3 sequencing reads. These requirements are based on the following reasoning. The sequencing error rate per nucleotide was assumed to be 0.5%. If the molecular marker is sequenced 25 times and a total of 200 nucleotides are produced, one nucleotide is expected to be erroneous because 200 x 0.005 ═ 1. Thus, for each molecular marker with a sequencing read of 25, at least one daughter molecular marker is expected. It can be assumed that the sequencing read for the parent molecular marker should be 25. A sub-molecular marker with a sequencing read of 4 is unlikely to be a sequencing error. This is because the probability of introducing the same sequencing error four times into the molecular tag is 8 x 0.005 4=5*10-9. If there are 106 sequencing reads in total, then the expected number of sequencing errors for four repeats would be 5 x 109*106This is negligible at 0.005. Therefore, the reading of the sub-molecular marker should be ≦ 3.
How to determine the identity of a parent molecular marker given that the parent molecular marker and its associated daughter molecular marker differ by one base
Molecular markersIs a true sequencing error of the parent?
Given a parent molecular tag and a set of daughter molecular tags that differ from the parent molecular tag by one base (with sequencing reads (R)Seed 1、RSon 2、…、RSeed m) In the case of molecular markers, multiple binomial tests can be used to identify the molecular markers of the euglens. Under the null hypothesis, the abundance of molecular markers should be less than or equal to RParent strainP (mathematically, H)0:p<e/2); otherwise, it can be concluded that an alternative hypothesis is supported, i.e. abundance greater than RParent strain*p(HA:p>e/2) and can reject the assumption that the molecular signature is a genuine molecular signature. Then, the child molecule tag is different from its parent molecule tag by one base and the probability of being observed once will be p ═ e/2. Then mathematically, from the total abundance (R)Zi BaiRParent strain) Observing at least R of the molecular signatureSeed of Japanese apricotProbability of degree pSeed of Japanese apricotThe following will be:

probability p if the daughter molecular marker is indeed a sequencing error of its parent molecular marker Seed of Japanese apricotShould be greater than the critical value of 5%. Since multiple hypotheses are tested simultaneously, the critical value for rejecting the null hypothesis can be determined by controlling the False Discovery Rate (FDR) at the 5% level, and if at the 5% level pSeed of Japanese apricotGreater than FDR, the assumption may be accepted. Controlling FDR at 5% level, unadjusted p-values can be ordered in increasing order, e.g., p1≤p2≤…≤pm. Next, a test with a corresponding rank j can be found. If p isSeed of Japanese apricot≦ j/m 5%, the null hypothesis that the daughter molecular tag is one base sequencing error of the parent daughter tag may be accepted.
Taken together, these data demonstrate the steps to correct one base sequencing error of a fully sequenced gene: step (1), if the sequencing read is larger than 25, selecting the molecular marker with the most abundant sequencing read as the first parent molecular marker. Step (2), selecting molecular markers with sequencing reading less than or equal to 3, identifying those molecular markers which are different from the first parent molecular marker by one base, and calling the molecular markers as child molecular markers; if no sub-molecular marker or no one-base sub-molecular marker is found, go to step (5). Step (3), a multiplex binary test is performed on all the daughter molecular markers and the parent molecular markers, and those daughter molecular markers that accept the null hypothesis are removed and their sequencing reads are attributed to their parents. If no null hypothesis is accepted, this means that all of the daughter molecular markers are not one base sequencing error of the parent molecular marker and no read corrections are required. And (4) updating the molecular marker sequence and sequencing reading. Step (5), selecting the molecular marker with the next largest sequencing read as the parent molecular marker, and repeating the above steps until no qualified parent molecular marker or no qualified daughter molecular marker remains.
Table 5 shows that TFRC sequencing data alone was updated after one base sequencing error was removed using the above analysis. The unique number of molecular markers was reduced from 23 (shown in table 4) to 11.
Using Poisson model for defining threshold values
Sequencing errors are more likely to occur under full sequencing. Based on sequence similarity, some types of errors (such as one base sequencing errors) can be correctable, but other errors (such as the random incorporation of artifact molecular markers) cannot be corrected. Instead, these types of errors can be identified through modeling. As described above, complete sequencing tends to be over-dispersed relative to poisson. Thus, two unique poisson models have been created, which are characterized by excessive dispersion: one can be used to model sequencing reads for true molecular markers (i.e., molecular marker sequences used to label target molecules during stochastic barcoding), and a second model can be used for false molecular markers (i.e., molecular marker sequences that were not used during stochastic barcoding, but that appear after sequencing due to errors). The sequencing error rate may be about 0.1% to 1%, and the PCR error rate may be about 0.001%. PCR errors can occur more in subsequent cycles of PCR, resulting in erroneous molecular markers with low sequencing reads but contributing a large portion of all observed molecular marker sequences. Thus, errors generated by PCR and sequencing typically have lower sequencing reads than true molecular markers. Thus, it is assumed that the poisson mean of the sequencing reads for authentic molecular markers will be greater than the poisson mean for false molecular markers.
A total of k unique molecular markers are assumed, and t of them are true molecular markers (e.g., BC)1、BC2、…、BCt) And the remainder of them are the wrong molecular markers (e.g., BC)t+1、BCt+2、…、BCk). The sequencing reads mapped to those true and false molecular markers may be R1、R2、…、Rt andRt+1、Rt+2、…、Rk. True and false molecular markers were also used assuming that the Poisson mean was μt andμn(wherein μt>μn) Then the possibility for the entire process would be

Wherein P (X)i=Ri|μt) Indicates the probability of observing the ith molecule, where the abundance under the Poisson process RiHaving a mean value of μt。
To determine t (the number of authentic molecular markers), many models are considered, starting with a model that assumes that all molecular markers are authentic (so l ═ k); and a second model, assuming that the least abundant molecular marker is wrong and all other molecular markers are true (so l ═ k-1); up to the last model, it was assumed that only the most abundant molecular markers were true and all others were false molecular markers (so 1). Finally, the best model will be the model with the highest probability of all considered models, or a model equivalent to the smallest Akaike Information Criterion (AIC) that can be used for model selection by measuring the relative quality of each possible model for a given datum. Mathematically, AIC can be defined as AIC ═ 2logL +2p, where p is the number of parameters estimated in the model. Thus for Lk andL1p is 1 and for the other cases p is 2. The examples in table 6 show that of the 8 possible models compared, only the three molecular markers with the largest three sequencing reads were considered as authentic molecular markers. Furthermore, fig. 20 shows that the threshold derived from the selected model (maximum 3) clearly separates the apparent true molecular marker readings from those that are more likely to be erroneous.
TABLE 6 all possible models of TFRC from 10pg input RNA well E11 and their log-likelihood


These data demonstrate the corrected sequencing reads of fully sequenced genes by removing one base sequencing error and using a poisson model to define a threshold.
Example 4
Modulation of incompletely sequenced genes
This example shows the adjustment of incompletely sequenced genes by removing noisy genes and using a zero-tailed poisson model for estimating the total number of molecular markers expected to appear in the library.
Noise-removing gene
In addition to accounting for statistics of molecular markers and their sequencing reads, analysis at the gene level may also provide information. A gene can be considered to be noisy if few molecular markers are detected and each molecular marker has an abnormally low reading relative to a fully sequenced gene. This assumption is based on the following reasoning: random barcode molecules in the same library should be amplified and sequenced at approximately the same frequency. Such expectations may be affected by PCR or sequencing bias resulting from sequencing differences for each molecule, but are expected to be small relative to "noise" generated by events such as sample contamination or undesirable molecular recombination during PCR. A gene may be noisy if its amplification rate (mean reads per molecular marker) is similar to the erroneous amplification rate derived from a completely sequenced gene in the same library.
In particular, it is assumed that gene g is completely sequenced1Total of t1(molecular labeling) and e1(wrong molecular marker) composition such that Rg1,1、Rg1,2、…、Rg1,t1Is a sequencing read mapped to a true molecular marker, and R* g1,1、R* g1,2、…、R* g1,e1Is the sequencing read mapped to the wrong molecular marker. For g then1The amplification rate of erroneous molecular markers (EAMP) of (1) is Similarly, EAMPg can be calculated for all other fully sequenced genes2、g3、…、gx. The cut-off value can be used for the potential noise gene g'1, which in total is observed for less than 5 molecular markers, and Rg’1,1、Rg’1,2、…、Rg’1,kMapping the sequencing reads to each molecular marker and determining the amplification rate as amplification
 If p is amplifiedg’1<Median (amplification of p)g’1And amplifying pg’2…, amplification of pg’x) Then gene g'1Are considered to be noise genes. Otherwise, it can be considered as an incomplete gene. Other noise genes can be similarly tested and removed. The reason for choosing 5 molecular markers as cut-off values is because genes with lower amplification rates may need to be processed into two separate cases: artifact (observed molecular marker less than 5) and incomplete sequencing (observed molecular marker ≧ due to low PCR/sequencing primer failure5)。
Estimation using zero-tailed Poisson model
When sequencing is incomplete, errors may still be present in the data, but may be difficult to identify due to insufficient overall sequencing reads. When sequencing is shallow and all molecular markers present in the library are not observed, some assumptions may be required to perform meaningful analysis. It can be assumed that all observed molecular markers are true and that no observed true molecular markers are truncated at zero, i.e. the truncated molecular markers are observed zero times. Although not all random barcode transcripts for a given gene have been sequence sampled, the read frequency of the detected molecular markers can be used to estimate the total diversity of molecular markers present in the entire library by applying a zero-truncation poisson model.
Suppose that it is observed to have a reading (R)1、R2、…、Rk) Is/are as followsk unique molecular markers, and no (S-k) molecular markers reading zero were observed. One goal is to estimate S, the total number of molecular markers expected to be present in the library. Assuming that the frequencies of sequencing reads 1, 2, 3, or more are seen as poisson variables truncated at zero (where poisson mean is μ) and the sum of all sequencing reads is n, the probability is expressed as:
L(S,μ)∝S!/(S-k)!μnexp (-S.mu.). Equation (3)
Conventional reasoning processes can be used to estimate μ, S and their standard error. The Maximum Likelihood (MLE) of μ is n/S, and the MLE for S can be approximated as k/(1-e)–n/S) Or k/(1- (1-1/S)n). Figure 21 shows a fitted zero-truncated poisson model based on the number of molecular markers and their corresponding sequencing reads. As shown in fig. 21, 33 unique molecular markers were observed in a total of 39 reads in the partially sequenced library. Based on the frequency of molecular markers with sequencing reads 1, 2, 3, and 4, a poisson model was applied to estimate a total of 113 molecular markers in the complete library (sequencing proceeded to completion). An inference procedure is applied to estimate μ, S and their standard error. The MLE of μ is n/S, and the MLE of S can be approximated as k/(1-e) -n/S) Or k/(1- (1-1)/S)n)。
Taken together, these data demonstrate the sequencing reads of incompletely sequenced genes corrected by removing noisy genes and using a zero-cutoff poisson model for estimating the total number of molecular markers expected to be present in the library.
Example 5
Modulation of fully sequenced and incompletely sequenced genes
This example shows an example of the output generated after adjusting the sequencing reads for a fully sequenced gene and an incompletely sequenced gene.
Table 7 provides examples of the output generated after adjusting the sequencing reads for fully sequenced genes and incompletely sequenced genes. The following headings are described: "Gene ID" indicates the name of the gene detected. The "sequencing state" shows three possible results: complete, incomplete and saturated, which determines further analytical methods. The classification depends on the discrete index and sequencing reads that map to the most abundant molecular Markers (ML). "raw ML" shows the count of unique molecular markers observed for a gene (undetected gene is '0'). The "raw reads" show the sum of sequencing reads mapped to the raw ML (undetected genes are '0'). Corrected ML shows the counts of unique molecular markers considered to be true molecular markers after application of the algorithm (only for fully sequenced genes, ` NA ` for incomplete genes, ` 0 ` for noisy and undetected genes). The "corrected reads" show the sum of sequencing reads mapped to corrected MLs (only for the fully sequenced gene, as 'NA' for the incomplete gene, and '0' for the noisy and undetected gene). "putative ML" shows the estimated number of unique molecular markers by the zero-tailed Poisson model (only for incompletely sequenced data, ` NA ` for complete data, ` 0 ` for noisy and undetected genes). The "estimated Mol" shows the number of molecules estimated based on corrected ML (for fully sequenced genes) or putative ML (for incompletely sequenced genes), which is '0' for noisy genes and undetected genes. The "estimated Mol LB" shows the lower limit for the number of estimated molecules. The "estimated Mol UB" shows an upper limit for the number of estimated molecules.
In table 7, the estimated mol (n) (estimated number of starting molecules) is calculated as follows:
n-m log (1-k/m), equation (4)
Wherein m is the total species of molecular marker (3)8) And k is the total number of unique molecular markers observed. The variance of n (var (n)) is derived using Taylor expansion (Taylor expansion): var (n) ═ m/(m-k)2var(k) Wherein var (k) can be expressed as m (1- (1-1/m)n)(1–1/m)n+m(m–1)((1–2/m)n–(1–1/m)2n). Use of Lower and upper limits of estimated starting molecules (estimated Mol LB and estimated Mol UB) were calculated.
Taken together, these data demonstrate the modulation of fully sequenced genes and incompletely sequenced genes.
TABLE 7 example output from 10pg input RNA well A06


Example 6
Correction of completely sequenced genes and incompletely sequenced genes
This example shows the correction of sequencing reads for a fully sequenced gene. This was done based on the errors and noise removed in the raw molecular marker count data and the retained sequencing reads.
Several fully sequenced genes were selected to test the progression of sequencing reads that corrected the fully sequenced genes. Table 8 compares some measurements for those genes before and after correcting or adjusting the sequencing reads. Raw ML, raw readings, corrected ML, corrected readings are derived directly from the output table. Raw-amp (amplification using Raw data) and Filtered-amp (amplification using true molecular marker data after correction) were calculated using (Raw read/Raw ML) and (corrected read/corrected ML). After correcting the total number of observed molecular tags, the percentage of retained ML compared to the number of authentic molecular tags was 100 × corrected ML/raw ML, and the% retained of reads was similarly defined as 100 × corrected reads/raw reads. Table 8 shows example genes with different abundance levels of GAPDH and ACTB (showing higher molecular marker counts and total reads). The number of true molecular markers after applying the correction was less than 7% of the total molecular markers observed in the raw data, which means that more than 93% of the molecular markers were considered as false molecular markers and discarded. Although 93% of the original molecular markers are eliminated as noise, the authentic molecular markers contribute at least 72% of the readings, which means that those discarded erroneous molecular markers have much lower readings. Furthermore, the amplification rates after application of the algorithm ranged from 137 to 413, much higher than those obtained using the raw data (6.1 to 29.4). The corrected amplification rate is a more realistic measure related to a PCR efficiency of at least 75%.
TABLE 8 comparison of genes selected from dataset D704(10pg RNA input) and client 1 (Single cell, unknown RNA input) before and after using this algorithm


Taken together, these data indicate that correcting the sequencing reads for the fully sequenced gene significantly reduces errors and noise in the raw molecular marker count data, while still retaining the ability to utilize the most sequencing reads.
Example 7
Tool for summarizing and visualizing counting data of randomly barcoded targets
This example shows a tool for summarizing and visualizing the count data of randomly barcoded targets as explained in the previous example.
For test data, two single cell plates were generated for passage of PreciseTMThe assay (Cellular Research, Inc. (Palo alto, Calif.) treatment. this experiment uses two different cell types at a 4:1 ratio, and the identity of the cells assigned to each well is unclear to the investigator performing the experiment.
To assess the overall sequencing data quality for each well, the sum of the sequencing reads per well was added. And some statistical measures are tabulated and compared before and after applying the correction method in order to evaluate the performance of the correction method. In addition, the chart may provide a visual display of the data and facilitate detection of anomalies or patterns.
Tables 9 and 10 show the sum of sequencing reads per well of plate 1, with sequencing reads <5000 italicized. For those wells with much lower read-outs (e.g., <5000 read outs), it may be indicated that no single cells were assigned to the well, and further analysis should exclude the wells.
TABLE 9 for plate 1, sequencing reads Total/well
| 1 | 2 | 3 | 4 | 5 | 6 | 7 | 8 | 9 | 10 | 11 | 12 | |
| A | 58346 | 59687 | 141814 | 57269 | 106511 | 26894 | 5908 | 40547 | 16783 | 19896 | 8993 | 3885 |
| B | 3894 | 24164 | 52131 | 40458 | 61725 | 55568 | 3701 | 5189 | 3353 | 2690 | 3799 | 3848 |
| C | 98195 | 175593 | 3627 | 4508 | 22856 | 17253 | 3435 | 49083 | 29189 | 28969 | 4570 | 25593 |
| D | 59960 | 29342 | 27304 | 22649 | 29341 | 55575 | 2861 | 2298 | 78385 | 56112 | 3357 | 15843 |
| E | 18148 | 49333 | 25546 | 40571 | 4190 | 31746 | 111060 | 3956 | 57039 | 12688 | 13917 | 31934 |
| F | 37105 | 34979 | 88619 | 5457 | 3552 | 6499 | 2951 | 2874 | 3127 | 3118 | 166177 | 2848 |
| G | 11930 | 119412 | 2179 | 30913 | 29445 | 6002 | 4260 | 41497 | 16535 | 48453 | 15058 | 17844 |
| H | 29988 | 28987 | 3414 | 2548 | 74279 | 4609 | 4164 | 4043 | 35764 | 2911 | 3276 | 38723 |
TABLE 10 for plate 2, sequencing reads Total/well
| 1 | 2 | 3 | 4 | 5 | 6 | 7 | 8 | 9 | 10 | 11 | 12 | |
| A | 2291 | 45737 | 124283 | 95919 | 50637 | 3822 | 2770 | 4147 | 20528 | 93362 | 24443 | 29416 |
| B | 26870 | 26126 | 3350 | 42649 | 63897 | 2960 | 71319 | 13673 | 40682 | 28120 | 2439 | 3387 |
| C | 52029 | 51582 | 232 | 20538 | 28556 | 18871 | 49769 | 24187 | 43879 | 17136 | 106123 | 17861 |
| D | 41845 | 124785 | 26143 | 4836 | 2740 | 18416 | 37201 | 90892 | 87375 | 21552 | 29307 | 31768 |
| E | 22866 | 29578 | 8506 | 76852 | 15211 | 18138 | 4087 | 19625 | 17151 | 22380 | 15928 | 2242 |
| F | 16868 | 46605 | 21848 | 53195 | 3391 | 94041 | 29196 | 19468 | 38771 | 2801 | 5703 | 2735 |
| G | 22187 | 30552 | 20213 | 3010 | 3143 | 4578 | 1901 | 2873 | 163669 | 34898 | 60463 | 19940 |
| H | 30216 | 25110 | 112489 | 34535 | 3976 | 32726 | 17868 | 9807 | 58375 | 22972 | 38446 | 18290 |
Tables 10 and 11 compare several measurements before and after the use of the calibration method. From these tables, the large changes in 'raw data' (sum of sequencing reads/well) and 'raw ML' (total number of molecular tags/well) can be seen. These large variations may be due to their Standard Deviation (SD) being greater than the mean, again indicating the presence of low-read wells. Using this method, approximately 47% of the genes per well were classified as fully sequenced genes, among all the genes present. If most genes are classified as incomplete (e.g., 0%), the current methods may not remove noise from the data. For each well, only 15% of the molecular markers remained after correction of the complete gene, but those molecular markers mapped on average to 95% of the sequencing reads. The higher value of% of readings retained indicates that the calibration method can effectively capture the signal (readings provided by the authentic molecular marker) while removing noise. Furthermore, the amplification rate of each molecular marker remaining as a true molecular marker was 163.32, which was much higher than 22.76 before the calibration method was applied.
TABLE 11 summary statistics using different measurements before and after applying the algorithm using data from panel 1

TABLE 12 summary statistics using different measurements before and after applying the algorithm using data from panel 2

Figure 22 shows a bar graph of the total sequencing reads per well. Figure 22 provides a direct visualization of the relative input of 96 wells. The figure shows that wells C02 and F11 have higher readings than other wells, which may indicate multiple cells of these wells. Wells a12, B01, B07-B12, C03, C04, C07, C11, D07, D08, D11, E05, E08, F04-F10, F12, G03, G07, H03, H04, H07-H09, H10-H11 have lower readings relative to the other wells, which may indicate that no cells are placed in those wells.
Figure 23 shows a bar graph of the complete sequencing gene%, the molecular Markers (ML)%, retained as true molecular barcodes, and the% retained reads mapped to those ML retained for each well. FIG. 23 illustrates the percentage of genes in each well that are classified as complete, and a correction method can be applied to remove noise (lower row of each well); noise level per well using molecular markers (after applying the calibration method, the percentage of molecular markers relative to the molecular markers observed before applying the calibration method, considered as true molecular markers, top row of each well); and noise level per well using sequencing reads (percentage of reads mapped to true molecular markers relative to total raw reads, middle row per well). As shown, the% of fully sequenced genes varied from well to well, but was lower in wells a12, B01, V07-B12, C03, C04, C07, D07, D08, D11, E05, E08, F04, F07-F10, F12, G03, G07, H03, H06, H07, H10-H11, corresponding to those wells having lower readings. The retained ML% represented by the top row is typically less than 20% for all wells, while the retained readings% represented by the middle row collectively exceed 90% for all wells. This type of map may provide a general idea of how the correction method works in removing noise while maximizing the signal for each hole.
Fig. 24 shows a boxplot of% of readings retained, varying according to the gene of each well. The gene-level box plot reveals detailed information as to how the correction method works for each gene in the well, which may not be reflected by the bar plot at the well level. The retained read% box plots for all fully sequenced genes per well in fig. 24 revealed that variation between genes can be substantial, as for wells with whiskers extending beyond 0.6D 11, F4, F8, H3, and H8. However, these five wells correspond to much lower total sequencing reads, 3357, 5457, 2874, 3414, and 4043.
Clustering can be used to analyze gene expression data. Principal Component Analysis (PCA) can reduce multidimensional and possibly correlated variables into several linearly uncorrelated variables by orthogonal transformation for dimensionality reduction. The dominant principal component from the PCA can be used to search for clusters in the data.
FIGS. 25A-25B show (PCA) plots of using the original ML compared to the corrected MI after the algorithm was applied from both plates. Figure 25A shows PCA plots using raw ML of each gene per well for wells with total sequencing reads > 5000. The PCA plot was generated by: first remove wells with a total sequencing read <5000 (generate 139 wells and exclude 107 genes of the 3 control genes); second, the genes with zero original ML were removed from 139 wells (85 genes were retained); third, take the logarithm of the original ML plus 1 to incorporate zeros in the dataset, then apply PCA to the log data after centering and scaling. The PCA plot shows two clusters evident, but for wells like D02, D05, and F06, the distance from the two clusters is approximately equal, making it difficult to determine the cell type. The clustering results may be destroyed due to the addition of noise, even some noise variations may destroy the clear cluster structure. Thus, clustering may benefit from a pre-processing step of feature/variable selection or a filtering or de-noising step. By applying the correction method to the complete sequencing data, a well-defined cluster structure was generated, as shown in FIG. 25B. The PCA plot in fig. 25B was generated similarly to the previous PCA plot in fig. 25A, except that corrected ML (counts of true molecular markers for fully sequenced genes after application of the correction method) was used instead of raw ML (counts of molecular markers for all detected genes before application of the algorithm), which used 75 genes out of 139 wells in total. Two distinct clusters were observed, well separated by the y-axis (PC 2). The clusters in fig. 25B are more compact in size compared to fig. 25A, and the cells in each well are clearly assigned to the clusters. In addition, the smaller cluster to the right of the y-axis of fig. 25B consists of 31 holes, accounting for approximately 22% of the total holes and very close to the expected 20%.
In summary, these data demonstrate several tools for summarizing and visualizing the counting data of randomly barcoded targets.
Example 8
ML coverage of highly expressed Gene-ACTB per ML in plates
This example demonstrates that different distributions of ML errors derived during sequencing or PCR generally have different distributions than true ML.
In addition to absolute gene expression counts and PCR bias corrections, ML can provide a better understanding of the statistical quality of library preparation procedures and sequencing data. When looking at the number of reads that present the same gene, ML (referred to as ML coverage), sequencing error base calls or PCR errors generated during library preparation can be detected. For example, a gene ML from a given SL represented by multiple reads may be an accurate measurement compared to a gene ML from a given SL represented by only a single read. In the case of high ML coverage barcodes present in the same library, low ML coverage barcodes are typically artifacts or errors generated during the sequencing run or PCR step during library preparation. ML errors derived during sequencing or PCR often have a different distribution than true ML. Fig. 27 is an exemplary diagram showing the molecular marker coverage of each molecular marker of the microplate highly expressing the gene-ATCB, in which different distributions are observed between the erroneous molecular marker and the authentic molecular marker. Fig. 28 is an exemplary graph showing the molecular marker overlay fit of two negative binomial distributions for each molecular marker of a microplate highly expressing gene-ATCB. The fit of the two negative binomial distributions demonstrates that molecular marker errors with lower molecular marker depths can be statistically distinguished from true molecular markers with higher molecular marker depths. The x-axis is the molecular depth.
Taken together, these data demonstrate that ML errors derived during sequencing or PCR generally have a different distribution than true ML.
Example 9
Molecular markers for correction of substitution errors due to PCR or sequencing
This example demonstrates a method for correcting molecular markers due to PCR and sequencing substitution errors that can be applied to whole transcriptome assays without the assumption of uniform coverage and without the need for high sequencing coverage for a fully sequenced state.
Duplicate data deletions were performed on the first mapped coordinates and unique molecular markers (UMIs) of each read, and the reads were assumed to be identical with the same starting coordinates, UML and chains. After deduplication, the highest count UML per cluster is retained (table 13).
Molecular Markers (ML) are corrected on a per gene bias basis. For each gene, clusters of ML are identified with directional adjacency. The directed neighbor approach clusters ML if ML is within 1 Hamming distance and parent ML count ≧ 2 (child MI count) -1. All MLs in the same cluster are considered to originate from the same parent ML, and the child ML counts are folded to the parent ML. FIG. 29 shows molecular marker correction where the pairwise Hamming distance of 1 is over-represented. After molecular marker correction, molecular markers one Hamming distance apart were clustered and folded into the same parent molecular marker. Fig. 30 shows a plot of the number of corrections of ML versus the number of read coverages. This method can be used to remove one base PCR or sequencing errors since all reads are retained.
TABLE 13 after de-duplication of the molecular signature, only a deficient number of unique molecular signatures were considered as errors given the entire transcriptome assay


In summary, these data demonstrate a calibration method that can be used to calibrate or adjust the data for the entire transcriptome assay, since all reads are retained.
Example 10
Molecular marker counting for high input samples
This example describes the addition of unique molecular markers for use as input molecules.
BD Precise when used with small sample inputs (e.g., single cells)TMTargeted assays may be most suitably those that allow for random and unique labeling of mRNA. Because the number of transcripts increased relative to the barcode pool in the high RNA/cell input experiments, the percentage of ML was recycled to mark the same gene increase and theoretically calculated using poisson distribution (fig. 26). In these cases, quantifying gene expression using ML without statistical correction would underestimate the number of molecules initially present without any poisson correction or correction based on two negative binomial distributions.
In very high input samples, where the number of mrnas per gene exceeded the entire set of 6561 barcodes, poisson correction or correction based on two negative binomial distributions was no longer possible. For example, a maximum of 6561 saturated barcodes, whether 65000 or 100000 input molecules, are expected in any case. Thus, genes and samples that appear to have high sample input may be altered, potentially underestimating ML counts.
Taken together, these data demonstrate that when using ML to quantify gene expression, the raw data needs to be adjusted.
Example 11
Recursive Substitution Error Correction (RSEC)
This example demonstrates recursive replacement error correction.
In BD PreciseTMTwo cooperative methods can be applied in the targeted assay analysis pipeline to remove ML errors. Briefly, ML errors resulting from sequencing base call substitution errors are identified and adjusted to true ML barcodes using Recursive Substitution Error Correction (RSEC). Subsequently, distribution-based error correction (DBEC) is used to adjust ML errors resulting from library preparation steps or sequencing base deletion errors.
The RSEC algorithm can adjust ML errors resulting from PCR or sequencing substitutions. These rare error events have been observed when examining ML coverage. For example, ML coverage of incorrect ML can be significantly lower than true ML in fully sequenced samples (fig. 27); at the initial Molecular IndexingTMIn case two very similar MLs are used during the (reverse transcription) step, they usually have similar ML coverage and do not need to be eliminated. As sequencing depth increases, more ML errors occur, so RSEC is critical to adjust the ML count of highly sequenced barcode libraries.
In short, RSEC takes into account two factors in error correction: 1) similarity of ML sequences; and 2) its ML coverage. For each target gene, the MLs are ligated when their ML sequences are within 1 base (hamming distance ═ 1) of each other. For each connection between ML x and y, if:
overlay (y) >2 overlay (x) +1, equation (5)
Where y represents "parent ML" and x represents "child ML".
Based on this assignment, the child ML can be folded to its parent ML. This process is recursive until the gene has no more identifiable parent/daughter MLs.
Fig. 31 shows a schematic diagram of an example of recursive replacement error correction as outlined above. Prior to RSEC correction, the MLs in the raw data include nine unique MLs: GTCAAATT, GTCAAAAT, GTCAAAAA, TTCAAAAA, TTCAGAAA, CTCAAAAA, TTCAAACT, TTCAAAAT, and TTCAAACA. By using RSEC, GTCAAATT can be folded into GTCAAAAT, since two MLs have one nucleotide (underlined) difference, and the ML count of ML GTCAAATT is lower than GTCAAAAT. In turn, ML GTCAAAATCan be folded into ML GTCAAAAA(differences in ML sequence are underlined) which have a higher ML count than GTCAAAAT. Similarly, ML TTCAGAAA and ctcaaaaaa can fold into ML TTCAAAAA. ML TTCAAACT may be folded into ML TTCAAAAT, which may be in turn folded into ML TTCAAAAA. ML TTCAAACA have more than one nucleotide difference compared to all other MLs and therefore do not fold into any of the other eight MLs. Prior to RSEC correction, the raw ML count is nine. After RSEC correction, the ML count is two: ML TTCAAAAA and TTCAAAAA.
Taken together, these data demonstrate the use of RSEC to correct the raw ML count.
Example 12
ML coverage computation
This example describes ML coverage computation.
After RSEC, genetic ML techniques per well were calculated to determine if they were suitable for further correction. Genes with low ML coverage (per ML <4 reads) bypass the subsequent correction steps and are reported in the final ML data sheet and recorded as "low depth" in the bioinformatics pipeline. For genes with very high input, at least 6557 of the possible 6561 barcodes were observed, where determining the number of molecules became challenging due to barcode diversity and genes were marked as "saturated". For genes ML that do not fit any of the 2 decision points, we will proceed to the subsequent DBEC algorithm and mark as "ignore (Pass)" in the output log file. Furthermore, genes above an average of 650 MLs per well were recorded as "high input" because > 5% of these MLs were recycled based on poisson distribution (fig. 27).
In summary, this example describes ML coverage calculations.
Example 13
Distribution-based error correction(DBEC)
This example describes distribution-based error correction.
Unlike RSEC, the DBEC algorithm is a method of distinguishing whether ML is an erroneous or true signal, regardless of its ML sequence. While RSEC has both ML sequence and ML overlay information to correct errors, DBEC relies primarily on ML overlay to correct only non-replacement errors. As previously mentioned, error barcodes typically have low ML coverage, unlike true barcodes ML coverage; this difference in ML coverage can be observed in the histogram of ML coverage as a different distribution (fig. 27). In view of this difference, the DBEC fits two negative binomial distributions to statistically distinguish ML errors (with lower ML coverage) from true signals with higher ML coverage.
Removing recycled ML to achieve best distribution fit
For a given gene, as the detected ML increases, the percentage of ML that is recycled (i.e., the same ML is used to tag 2 or more mrnas from the same gene) increases and can be estimated. Using Poisson distribution (λ)Non-unique property) Estimate for hole i (n) from the ML recirculation rate equation (6)) (see equation (6))Dependent characteristics, i) The number of recycled MLs. If the estimated recirculated ML is greater than 5% of the total ML for a given gene in well i, then that gene in well i is labeled "high input". For these "high input" data, the leading ML coverage ML will be eliminated from the distribution fit-but retained for later counting steps-to obtain a better negative binomial distribution.
P(X>1|λIs not unique),λIs not unique
ML number/6561. Equation (6)

Adding pseudo-dots to underexpressed genes
If the unique number of MLs is less than 10, it is often more challenging to fit the distribution due to the sparsity of the data. To alleviate this problem, DBEC adds pseudo-points at 1% signal count for aiding the distribution fit, but does not affect the data.
Parameter estimation
To fit the two negative binomial distributions to separate the error from the signal ML, two sets of starting values for parameter estimation are approximated. The error distribution is assumed to have negative binomial with an average and a dispersion of 1.
Error/signal probability estimation
Suppose that the signal and error distributions are negative binomial (μ) respectivelySignalSize ofSignal) And negative two terms (mu)Error(s) inSize ofError(s) in). To determine the number of signals ML (in ascending order), the probability that a reading from a given ML is from the signal and error distribution is calculated until equation (8) is satisfied, where all previous MLs are considered erroneous MLs.
P(X=r|μ=μError(s) inDimension is defined as sizeError(s) in)
<P(X=r|μ=μSignalDimension is defined as sizeSignal). Equation (8)
In summary, this example shows a calculation for performing distribution-based error correction.
Example 14
Adjusting SL errors based on second derivative
This example demonstrates that SL errors are adjusted based on the second derivative.
FIG. 32 FIGS. (a) - (e) show exemplary results of correcting PCR and sequencing errors based on the second derivative of molecular marker depth changes. Fig. 32 diagram (a) shows that the SL error and the signal ML can be well separated. FIG. 32 Panels (b) and (d) show cumulative sum plots of molecular marker counts from the ML counts shown in Panels (c) and (e) of FIG. 32, respectively. In fig. 32, vertical lines of graphs (b) and (d) show the positions of the maximum values of the second derivative. The dashed lines in fig. 32, plots (c) and (e), show that the location of the maximum of the second derivative can be separated by ML in the plot of ML counts versus ML reading depth.
Taken together, these data show that the maximum of the second derivative of the molecular marker depth variation can be used to separate SL errors from the ML signal.
Example 15
Correcting PCR and sequencing errors based on DBEC
This example demonstrates correction of PCR and sequencing errors based on two negative binomial distributions.
Fig. 33 panels (a) - (c) show exemplary results of correcting PCR and sequencing errors based on the two negative binomial distributions of CD 69. FIG. 33 Panel (a) shows the two negative binomial distributions (D) of CD69nIs a distribution of negative two terms of noise, and DsSignal binomial distribution) on the count data shown in the ML depth histogram in diagram (b) of fig. 33. The dashed line in fig. 33, graph (b), shows the separation of the ML signal and SL error determined by the two negative binomial distributions shown in fig. 33, graph (a). The vertical lines in fig. 33 plot (c) show the local maxima of the second derivative as determined based on the cumulative sum plot of readings. Similar to fig. 33, fig. 34 panels (a) - (c) show exemplary results of correcting PCR and sequencing errors based on the two negative binomial distributions of CD 3E.
Taken together, these data show that DBEC can be used to correct PCR and sequencing errors.
Example 16
ML recycling
This example demonstrates ML recycling of highly expressed genes and the need to adjust the input data for highly expressed genes prior to distribution fitting.
Fig. 35 panels (a) - (c) show exemplary results of correcting PCR and sequencing errors based on two negative binomial distributions of the highly expressed gene (ACTB). Highly expressed genes may have an over-sequencing state (e.g., with ML coverage of 100 or higher). In some embodiments, other criteria may be used to determine a highly expressed gene. In fig. 35 (a), the molecular markers to the right of the vertical line correspond to the ML based on its possible recycling at high depth. FIG. 35 Panel (b) schematically illustrates that molecular tags can be classified into three classes in addition to ML errors: SL error, signal ML, and possibly recycled ML. Fig. 35 (c) demonstrates that the fitted two negative binomial distributions are non-ideal without adjusting the ML of possible recycles.
Fig. 36 shows exemplary results of recycling of G-rich molecular markers of highly expressed genes. FIG. 36 shows the first 20 high depths ML of the highly expressed genes GAPDH, ACTB, and HSP90AB 1. These high depths ML have high G's and T's, are more likely to be recycled and the barcode is not random. The ML doublet occurs earlier than the theoretical calculation assuming random marks. For ACTB, the actual double peak is about 4%, although theoretically there would be a 2.7% double peak if there were 350 ML per well.
Fig. 37 (a) - (b) show exemplary results of adjusting input data for highly expressed genes before fitting two negative binomial distributions. FIG. 37 Panel (a) shows the input data in FIG. 35 Panel (a) for high expression gene modulation. In contrast to the non-ideal distribution fit in fig. 35, fig. 37, fig. b, shows two negative binomial distributions that are fitted.
Taken together, these data show that it may be necessary to remove recycled ML from sequencing data of highly expressed genes before fitting the two negative binomial distributions.
Example 17
ML count correction using two negative binomial distributions
This example demonstrates ML counts for ten targets corrected using two negative binomial distributions.
FIG. 38 FIGS. (a) - (j) show non-limiting exemplary verifications of a data set corrected using two negative binomial distributions. As shown in fig. 38, ML counts for 10 targets were corrected. The vertical lines in each of fig. 38 show the separation of ML signal and SL error for the target determined using two negative binomial distributions.
In summary, these data verify ML count correction using two negative binomial distributions.
Example 18
TMBD Precise target from 96-well mixed Jurkat and Breast cancer (BrCa) single cellsTo the determined t-random neighbors
Domain-embedded visualization
This example demonstrates a method to correct PCR and sequencing errors based on recursive substitution error correction and distribution-based error correction for mixed Jurkat and breast cancer (BrCa) single cells.
FIG. 39 Panels (a) - (d) show Precise from 96-well mixed Jurkat and breast cancer (BrCa) single cells (86 genes examined)TMExemplary t-random neighborhood embedding (t-SNE) visualization of targeted assays. FIG. 39 Panel (a) shows the identification of cell clusters using DBSCAn with the same parameters before and after ML modulation. FIG. 39 FIGS. (b) - (d) show single marker expression scaled by color and dot size. Figure 39 panel (b) shows PSMB4 (housekeeping gene), which is present in both cell types and the absence of PSMB4 signal is further highlighted in the "low signal" cluster after ML modulation. FIG. 39 Panel (c) shows CD3E (highlighting lymphocyte markers for the Jurkat cell cluster). FIG. 39 Panel (d) shows CDH1 (epithelial cell marker highlighting BrCa cluster).
Taken together, these data demonstrate that ML modulation removes ML noise, which allows for a clear distinction of gene expression between cell clusters.
Example 19
Differential expression analysis between cell clusters
This example demonstrates a method to correct PCR and sequencing errors based on recursive substitution error correction and distribution-based error correction for low-signal and breast cancer (BrCa) cells.
Fig. 40 panels (a) - (b) are non-limiting exemplary diagrams showing differential expression analysis between cell clusters with >0 ML genes in two selected clusters calculated by DBS scanning and determined by gene marker levels in each cluster. FIG. 40 Panel (a) shows ` low signal ` cluster gene expression compared to the remaining cells. The top of fig. 40 panel (a) shows the raw ML comparison, which shows that ML noise is generally higher for genes with higher average expression in other cells. The bottom of panel (a) of fig. 40 shows that following ML modulation using RSEC and DBEC, the ML noise detected in the "low signal" clusters is reduced, which allows for a clearer differentiation of gene expression between clusters. FIG. 40 Panel (b) shows ` BrCa ` cluster gene expression compared to the remaining cells. The top of panel (b) of fig. 40 shows that the raw ML in non-BrCa cells also had significant ML counts for BrCa markers (e.g., KRT1, MUC 1). Figure 40 bottom panel of panel (b) shows that the modified ML of BrCa marker is highly enriched in BrCa clusters compared to other cells.
Taken together, these data demonstrate that for cells (e.g., low signal cells and breast cancer cells), PCR and sequencing errors can be corrected based on recursive substitution error correction and distribution-based error correction.
Example 20
Molecular marker enumeration of mixed Jurkat and T47D cells was adjusted
This example demonstrates a method of adjusting the molecular marker counts of mixed Jurkat and T47D cells.
FIG. 41 FIGS. (a) - (d) are BD Precise showing mixed Jurkat and breast cancer (T47D) single cells (with 86 genes examined) from 96-well platesTMNon-limiting exemplary graph of t-random neighborhood embedding (t-SNE) visualization of targeting assays. FIG. 41 Panel (a) shows the identification of cell clusters using DBSCAn with the same parameters before and after ML modulation. FIG. 41 FIGS. (b) - (d) show single marker expression scaled by color and dot size. FIG. 41 Panel (b) shows the scaling of PSMB4 (housekeeping gene present in both cell types and after ML adjustments). The lack of PSMB4 signal was further highlighted in the no-template control (NTC) cluster. FIG. 41 Panel (c) shows the scaling of CD3E (highlighting lymphocyte markers for the Jurkat cell cluster). Figure 41 panel (d) shows a scaling of CDH1 (highlighting epithelial cell markers of the T47D cluster).
Fig. 42 panels (a) - (b) are non-limiting exemplary heat maps that demonstrate differential gene expression by molecular marker counts between different cell clusters identified in fig. 41, before any error correction steps (fig. 42, raw ML shown in panel (a)), and after RSEC and DBEC correction (adjusted ML shown in fig. 42, panel (b)). The gene whose expression level is low is blue, and the gene whose expression level is high is orange. Genes with similar gene expression patterns cluster together between these cell types. Without correction errors, NTC has noise from highly expressed genes such as CD3E and KRT18 (which are Jurkat and T47D markers, respectively). In addition, error correction revealed a different gene expression pattern between Jurkat and T47D.
Taken together, these data demonstrate that ML modulation can remove ML noise, which allows for significant differentiation of gene expression between cell clusters.
In at least some of the previously described embodiments, one or more elements used in one embodiment may be used interchangeably in another embodiment unless such an alternative is not technically feasible. Those skilled in the art will appreciate that various other omissions, additions and modifications may be made to the methods and structures described above without departing from the scope of the claimed subject matter. All such modifications and variations are intended to fall within the scope of the subject matter defined by the appended claims.
With respect to the use of substantially any plural and/or singular terms herein, those having skill in the art can translate from the plural to the singular and/or from the singular to the plural as is appropriate to the context and/or application. Various singular/plural permutations may be expressly set forth herein for the sake of clarity. As used in this specification and the appended claims, the singular forms "a", "an" and "the" include plural referents unless the context clearly dictates otherwise. Any reference herein to "or" is intended to encompass "and/or" unless otherwise indicated.
It will be understood by those within the art that, in general, terms used herein, and especially in the appended claims (e.g., bodies of the appended claims) are generally intended as "open" terms (e.g., the term "including" should be interpreted as "including but not limited to" (closing at not limited to) ", the term" having "should be interpreted as" having at least (closing at least one) ", the term" includes "should be interpreted as" includes but not limited to "(closing at not limited to)", etc.). It will be further understood by those within the art that if a specific number of an introduced claim recitation is intended, such an intent will be explicitly recited in the claim, and in the absence of such recitation no such intent is present. For example, as an aid to understanding, the following appended claims may contain usage of the introductory phrases "at least one" and "one or more" to introduce claim recitations. However, the use of such phrases should not be construed to imply that the introduction of a claim recitation by the indefinite articles "a" or "an" limits any particular claim containing such introduced claim recitation to embodiments containing only one such recitation, even when the same claim includes the introductory phrases "one or more" or "at least one" and indefinite articles such as "a" or "an" (e.g., "a" and/or "an" should be interpreted to mean "at least one" or "one or more"); the same holds true for the use of definite articles used to introduce claim recitations. Furthermore, even if a specific number of an introduced claim recitation is explicitly recited, those skilled in the art will recognize that such recitation should be interpreted to mean at least the recited number (e.g., the bare recitation of "two recitations," without other modifiers, means at least two recitations, or two or more recitations). Further, in those instances where a convention analogous to "at least one of A, B and C, etc." is used, in general such a construction is intended in the sense one having skill in the art would understand the convention (e.g., "a system having at least one of A, B and C" would include, but not be limited to, systems having a alone, B alone, C alone, a and B together, a and C together, B and C together, and/or A, B, and C together, etc.). In those instances where a convention analogous to "A, B or at least one of C, etc." is used, in general such a syntactic structure is contemplated in the sense one having skill in the art would understand the convention (e.g., "a system having at least one of A, B or C" would include, but not be limited to, systems having a alone, B alone, C alone, a and B together, a and C together, B and C together, and/or A, B, and C together, etc.). It will be further understood by those within the art that, in fact, any disjunctive word and/or phrase presenting two or more alternative terms, whether in the description, claims, or drawings, should be understood to contemplate the possibilities of including one of the terms, either term, or both terms. For example, the phrase "a or B" will be understood to include the possibility of "a" or "B" or "a and B".
Further, while features or aspects of the disclosure are described in terms of Markush groups (Markush groups), those skilled in the art will recognize that the disclosure is also thereby described in terms of any individual member or subgroup of members of the Markush group.
As will be understood by those skilled in the art, for any and all purposes, such as in providing a written description, all ranges disclosed herein also include any and all possible subranges and combinations of subranges thereof. Any listed range can be easily identified as being fully descriptive and enabling the same range to be broken down into at least equal halves, thirds, quarters, fifths, tenths, etc. As a non-limiting example, each range discussed herein may be readily broken down into a lower third, a middle third, an upper third, and so on. As will also be understood by those skilled in the art, all languages, such as "up to," "at least," "greater than," "less than," and the like, include the recited number and refer to ranges that may be subsequently resolved into subranges as discussed above. Finally, as will be understood by those skilled in the art, a range includes each individual member. Thus, for example, a group having 1-3 items refers to a group having 1, 2, or 3 items. Similarly, a group having 1-5 items refers to groups having 1, 2, 3, 4, or 5 items, and so forth.
While various aspects and embodiments have been disclosed herein, other aspects and embodiments will be apparent to those skilled in the art. The various aspects and embodiments disclosed herein are for purposes of illustration and are not intended to limit the true scope and spirit indicated by the following claims.
Claims (18)
1. A method for determining the amount of a nucleic acid target, the method comprising:
(a) randomly barcoding a plurality of nucleic acid targets using a plurality of random barcodes, wherein each of the plurality of random barcodes comprises an oligonucleotide comprising a molecular tag comprising a nucleic acid sequence, to create a plurality of randomly barcoded nucleic acid targets;
(b) obtaining sequencing data for the randomly barcoded nucleic acid target; and
(c) for one or more of the plurality of nucleic acid targets:
(i) counting the number of unique molecular markers associated with a nucleic acid target in the sequencing data, wherein each unique molecular marker associated with the nucleic acid target differs from the nucleic acid sequence of another unique molecular marker associated with the nucleic acid target;
(ii) using clusters of unique molecular markers that are oriented adjacent to identify the nucleic acid target;
(iii) folding the sequencing data obtained in (b) using clusters of unique molecular markers of the nucleic acid target identified in (ii); and
(iv) (iv) estimating the number of nucleic acid targets, wherein after folding the sequencing data in (iii), the estimated number of nucleic acid targets is correlated with the number of unique molecular markers associated with the nucleic acid targets in the sequencing data counted in (i).
2. The method of claim 1, wherein the plurality of nucleic acid targets comprises nucleic acid targets of the entire transcriptome of the cell.
3. The method of claim 1, wherein the unique molecular markers of the nucleic acid targets in a cluster are within a predetermined directional adjacency threshold of each other.
4. The method of claim 3, wherein the directional adjacency threshold is a Hamming distance.
5. The method of any one of claims 1-4, wherein the unique molecular markers of the nucleic acid targets within the cluster comprise one or more parent molecular markers and child molecular markers of the one or more parent molecular markers, and wherein the occurrence of the parent molecular markers is greater than or equal to a predetermined orientational contiguity occurrence threshold.
6. The method of claim 5, wherein the predetermined directional adjacency occurrence threshold is: twice as many sub-molecule markers as-1.
7. The method of claim 5, wherein the folding of the sequencing data obtained in (b) using the cluster of unique molecular markers of the nucleic acid target identified in (ii) comprises:
The appearance of the daughter molecular markers was attributed to the parent molecular markers.
8. The method of any one of claims 1-4, 6, and 7, further comprising: determining the sequencing depth of the nucleic acid target.
9. The method of claim 8, wherein estimating the number of nucleic acid targets comprises adjusting the sequencing data counted in (i) if the sequencing depth of the nucleic acid targets is above a predetermined sequencing depth threshold.
10. The method of claim 9, wherein the predetermined sequencing depth threshold is between 15 and 20.
11. The method of any one of claims 9-10, wherein adjusting the sequencing data counted in (i) comprises:
defining a threshold for molecular markers of the nucleic acid target to determine true molecular markers and false molecular markers associated with the nucleic acid target in the sequencing data obtained in (b).
12. The method of claim 11, wherein defining a threshold value for molecular markers of the nucleic acid target comprises performing a statistical analysis of the molecular markers of the nucleic acid target.
13. The method of claim 12, wherein performing the statistical analysis comprises:
fitting the molecular markers of the nucleic acid target and the distribution of their occurrences to two negative binomial distributions;
using the two negative binomial distributions to determine the number n of authentic molecular markers; and
Removing false molecular markers from the sequencing data obtained in (b), wherein the false molecular markers comprise molecular markers whose occurrence is lower than the occurrence of the nth most abundant molecular marker, and wherein the true molecular markers comprise molecular markers whose occurrence is greater than or equal to the occurrence of the nth most abundant molecular marker.
14. The method of claim 13, wherein the two negative binomial distributions comprise a first negative binomial distribution corresponding to the true molecular markers, and a second negative binomial distribution corresponding to the false molecular markers.
15. The method of claim 12, wherein performing the statistical analysis comprises:
fitting the molecular markers of the nucleic acid target and the distribution of their occurrences to two poisson distributions;
determining the number n of authentic molecular markers using the two poisson distributions; and
removing false molecular markers from the sequencing data obtained in (b), wherein the false molecular markers comprise molecular markers that occur less than the occurrence of the nth most abundant molecular marker, and wherein the true molecular markers comprise molecular markers that occur greater than or equal to the occurrence of the nth most abundant molecular marker.
16. The method of claim 15, wherein the two poisson distributions comprise a first poisson distribution corresponding to a true molecular marker, and a second poisson distribution corresponding to a false molecular marker.
17. A computer system for determining the amount of a nucleic acid target, the computer system comprising:
a hardware processor; and
a non-transitory memory having instructions stored thereon that, when executed by the hardware processor, cause the processor to perform the method of any of claims 1-16.
18. A computer readable medium comprising a software program comprising code for performing the method of any one of claims 1-16.
Applications Claiming Priority (7)
| Application Number | Priority Date | Filing Date | Title |
|---|---|---|---|
| US201662342137P | 2016-05-26 | 2016-05-26 | |
| US62/342,137 | 2016-05-26 | ||
| US201662381945P | 2016-08-31 | 2016-08-31 | |
| US62/381,945 | 2016-08-31 | ||
| US201662401720P | 2016-09-29 | 2016-09-29 | |
| US62/401,720 | 2016-09-29 | ||
| PCT/US2017/034576 WO2017205691A1 (en) | 2016-05-26 | 2017-05-25 | Molecular label counting adjustment methods |
Publications (2)
| Publication Number | Publication Date |
|---|---|
| CN109074430A CN109074430A (en) | 2018-12-21 |
| CN109074430B true CN109074430B (en) | 2022-03-29 |
Family
ID=59014820
Family Applications (1)
| Application Number | Title | Priority Date | Filing Date |
|---|---|---|---|
| CN201780028283.2A Active CN109074430B (en) | 2016-05-26 | 2017-05-25 | Molecular marker counting adjustment method |
Country Status (5)
| Country | Link |
|---|---|
| US (2) | US11397882B2 (en) |
| EP (1) | EP3465502B1 (en) |
| JP (1) | JP7046007B2 (en) |
| CN (1) | CN109074430B (en) |
| WO (1) | WO2017205691A1 (en) |
Families Citing this family (45)
| Publication number | Priority date | Publication date | Assignee | Title |
|---|---|---|---|---|
| US8835358B2 (en) | 2009-12-15 | 2014-09-16 | Cellular Research, Inc. | Digital counting of individual molecules by stochastic attachment of diverse labels |
| EP3321378B1 (en) | 2012-02-27 | 2021-11-10 | Becton, Dickinson and Company | Compositions for molecular counting |
| KR102536833B1 (en) | 2013-08-28 | 2023-05-26 | 벡톤 디킨슨 앤드 컴퍼니 | Massively parallel single cell analysis |
| WO2016134078A1 (en) | 2015-02-19 | 2016-08-25 | Becton, Dickinson And Company | High-throughput single-cell analysis combining proteomic and genomic information |
| EP3262192B1 (en) | 2015-02-27 | 2020-09-16 | Becton, Dickinson and Company | Spatially addressable molecular barcoding |
| EP4180535A1 (en) | 2015-03-30 | 2023-05-17 | Becton, Dickinson and Company | Methods and compositions for combinatorial barcoding |
| WO2016172373A1 (en) | 2015-04-23 | 2016-10-27 | Cellular Research, Inc. | Methods and compositions for whole transcriptome amplification |
| US11124823B2 (en) | 2015-06-01 | 2021-09-21 | Becton, Dickinson And Company | Methods for RNA quantification |
| CN108026524A (en) | 2015-09-11 | 2018-05-11 | 赛卢拉研究公司 | Method and composition for nucleic acid library standardization |
| AU2017261189B2 (en) | 2016-05-02 | 2023-02-09 | Becton, Dickinson And Company | Accurate molecular barcoding |
| US10301677B2 (en) | 2016-05-25 | 2019-05-28 | Cellular Research, Inc. | Normalization of nucleic acid libraries |
| EP3465502B1 (en) | 2016-05-26 | 2024-04-10 | Becton, Dickinson and Company | Molecular label counting adjustment methods |
| US10202641B2 (en) | 2016-05-31 | 2019-02-12 | Cellular Research, Inc. | Error correction in amplification of samples |
| US10640763B2 (en) | 2016-05-31 | 2020-05-05 | Cellular Research, Inc. | Molecular indexing of internal sequences |
| JP7091348B2 (en) | 2016-09-26 | 2022-06-27 | ベクトン・ディキンソン・アンド・カンパニー | Measurement of protein expression using reagents with barcoded oligonucleotide sequences |
| AU2017359047A1 (en) | 2016-11-08 | 2019-05-02 | Becton, Dickinson And Company | Methods for cell label classification |
| KR20190077062A (en) | 2016-11-08 | 2019-07-02 | 셀룰러 리서치, 인크. | How to classify expression profiles |
| CN110573253B (en) | 2017-01-13 | 2021-11-02 | 赛卢拉研究公司 | Hydrophilic coating for fluid channels |
| CN110382708A (en) | 2017-02-01 | 2019-10-25 | 赛卢拉研究公司 | Selective amplification is carried out using blocking property oligonucleotides |
| CN110719959B (en) | 2017-06-05 | 2021-08-06 | 贝克顿迪金森公司 | Sample indexing for single cells |
| EP3460071A1 (en) | 2017-09-22 | 2019-03-27 | Lexogen GmbH | Estimating pre-pcr fragment numbers from post-pcr frequencies of unique molecular identifiers |
| CN111247589A (en) * | 2017-09-25 | 2020-06-05 | 贝克顿迪金森公司 | Immune receptor barcode error correction |
| US11946095B2 (en) | 2017-12-19 | 2024-04-02 | Becton, Dickinson And Company | Particles associated with oligonucleotides |
| US11905553B2 (en) | 2018-01-29 | 2024-02-20 | St. Jude Children's Research Hospital, Inc. | Method for nucleic acid amplification |
| WO2019213237A1 (en) | 2018-05-03 | 2019-11-07 | Becton, Dickinson And Company | Molecular barcoding on opposite transcript ends |
| WO2019213294A1 (en) | 2018-05-03 | 2019-11-07 | Becton, Dickinson And Company | High throughput multiomics sample analysis |
| JP2022511398A (en) | 2018-10-01 | 2022-01-31 | ベクトン・ディキンソン・アンド・カンパニー | Determining the 5'transcription sequence |
| JP2022506546A (en) | 2018-11-08 | 2022-01-17 | ベクトン・ディキンソン・アンド・カンパニー | Single-cell whole transcriptome analysis using random priming |
| EP3894552A1 (en) | 2018-12-13 | 2021-10-20 | Becton, Dickinson and Company | Selective extension in single cell whole transcriptome analysis |
| WO2020150356A1 (en) | 2019-01-16 | 2020-07-23 | Becton, Dickinson And Company | Polymerase chain reaction normalization through primer titration |
| EP4242322A3 (en) | 2019-01-23 | 2023-09-20 | Becton, Dickinson and Company | Oligonucleotides associated with antibodies |
| WO2020167830A1 (en) * | 2019-02-12 | 2020-08-20 | Becton, Dickinson And Company | Determining expressions of transcript variants and polyadenylation sites |
| CN110222745B (en) * | 2019-05-24 | 2021-04-30 | 中南大学 | Similarity learning based and enhanced cell type identification method |
| US11939622B2 (en) | 2019-07-22 | 2024-03-26 | Becton, Dickinson And Company | Single cell chromatin immunoprecipitation sequencing assay |
| CN114729350A (en) | 2019-11-08 | 2022-07-08 | 贝克顿迪金森公司 | Obtaining full-length V (D) J information for immunohistorian sequencing using random priming |
| WO2021146207A1 (en) | 2020-01-13 | 2021-07-22 | Becton, Dickinson And Company | Methods and compositions for quantitation of proteins and rna |
| US20230046438A1 (en) * | 2020-01-14 | 2023-02-16 | Peking University | Method for predicting cell spatial relation based on single-cell transcriptome sequencing data |
| CN111521591B (en) * | 2020-05-09 | 2021-04-16 | 艾普拜生物科技(苏州)有限公司 | Counting calibration device for droplet type digital PCR instrument, preparation method and use method |
| EP4150118A1 (en) | 2020-05-14 | 2023-03-22 | Becton Dickinson and Company | Primers for immune repertoire profiling |
| US11932901B2 (en) | 2020-07-13 | 2024-03-19 | Becton, Dickinson And Company | Target enrichment using nucleic acid probes for scRNAseq |
| EP4247967A1 (en) | 2020-11-20 | 2023-09-27 | Becton, Dickinson and Company | Profiling of highly expressed and lowly expressed proteins |
| EP4263868A1 (en) | 2021-03-12 | 2023-10-25 | Singular Genomics Systems, Inc. | Nanoarrays and methods of use thereof |
| US11884977B2 (en) | 2021-03-12 | 2024-01-30 | Singular Genomics Systems, Inc. | Nanoarrays and methods of use thereof |
| CN113096734B (en) * | 2021-05-11 | 2021-12-14 | 中国科学院水生生物研究所 | Method for screening molecular marker combination for diploid population paternity test |
| WO2023232940A1 (en) * | 2022-06-01 | 2023-12-07 | Gmendel Aps | A computer implemented method for identifying, if present, a preselected genetic disorder |
Citations (7)
| Publication number | Priority date | Publication date | Assignee | Title |
|---|---|---|---|---|
| CN101432439A (en) * | 2006-02-24 | 2009-05-13 | 考利达基因组股份有限公司 | High throughput genome sequencing on DNA arrays |
| CN102099480A (en) * | 2008-07-17 | 2011-06-15 | 巴斯夫植物科学有限公司 | Plants having enhanced yield-related traits and a method for making the same |
| CN102576020A (en) * | 2009-09-28 | 2012-07-11 | 皇家飞利浦电子股份有限公司 | Method for characterization of biological bonds |
| CN102725424A (en) * | 2010-01-25 | 2012-10-10 | Rd生物科技公司 | Self-folding amplification of target nucleic acid |
| WO2015002908A1 (en) * | 2013-07-01 | 2015-01-08 | Sequenta, Inc. | Large-scale biomolecular analysis with sequence tags |
| CN104364392A (en) * | 2012-02-27 | 2015-02-18 | 赛卢拉研究公司 | Compositions and kits for molecular counting |
| CN105492627A (en) * | 2013-03-15 | 2016-04-13 | 伯乐生命医学产品有限公司 | Digital assays with associated targets |
Family Cites Families (286)
| Publication number | Priority date | Publication date | Assignee | Title |
|---|---|---|---|---|
| US4510244A (en) | 1980-04-17 | 1985-04-09 | The Board Of Trustees Of The Leland Stanford Jr. University | Cell labeling with antigen-coupled microspheres |
| US4725536A (en) | 1985-09-19 | 1988-02-16 | Genetics Institute, Inc. | Reagent polynucleotide complex with multiple target binding regions, and kit and methods |
| US6150517A (en) | 1986-11-24 | 2000-11-21 | Gen-Probe | Methods for making oligonucleotide probes for the detection and/or quantitation of non-viral organisms |
| WO1989001050A1 (en) | 1987-07-31 | 1989-02-09 | The Board Of Trustees Of The Leland Stanford Junior University | Selective amplification of target polynucleotide sequences |
| US5149625A (en) | 1987-08-11 | 1992-09-22 | President And Fellows Of Harvard College | Multiplex analysis of DNA |
| US5124246A (en) | 1987-10-15 | 1992-06-23 | Chiron Corporation | Nucleic acid multimers and amplified nucleic acid hybridization assays using same |
| US5656731A (en) | 1987-10-15 | 1997-08-12 | Chiron Corporation | Nucleic acid-amplified immunoassay probes |
| WO1990001065A1 (en) | 1988-07-26 | 1990-02-08 | Genelabs Incorporated | Rna and dna amplification techniques |
| US6309822B1 (en) | 1989-06-07 | 2001-10-30 | Affymetrix, Inc. | Method for comparing copy number of nucleic acid sequences |
| US5800992A (en) | 1989-06-07 | 1998-09-01 | Fodor; Stephen P.A. | Method of detecting nucleic acids |
| US5925525A (en) | 1989-06-07 | 1999-07-20 | Affymetrix, Inc. | Method of identifying nucleotide differences |
| US6551784B2 (en) | 1989-06-07 | 2003-04-22 | Affymetrix Inc | Method of comparing nucleic acid sequences |
| US5744101A (en) | 1989-06-07 | 1998-04-28 | Affymax Technologies N.V. | Photolabile nucleoside protecting groups |
| US5143854A (en) | 1989-06-07 | 1992-09-01 | Affymax Technologies N.V. | Large scale photolithographic solid phase synthesis of polypeptides and receptor binding screening thereof |
| US6040138A (en) | 1995-09-15 | 2000-03-21 | Affymetrix, Inc. | Expression monitoring by hybridization to high density oligonucleotide arrays |
| US5871928A (en) | 1989-06-07 | 1999-02-16 | Fodor; Stephen P. A. | Methods for nucleic acid analysis |
| US5424186A (en) | 1989-06-07 | 1995-06-13 | Affymax Technologies N.V. | Very large scale immobilized polymer synthesis |
| US5200314A (en) | 1990-03-23 | 1993-04-06 | Chiron Corporation | Polynucleotide capture assay employing in vitro amplification |
| US5119316A (en) | 1990-06-29 | 1992-06-02 | E. I. Du Pont De Nemours And Company | Method for determining dna sequences |
| EP0834576B1 (en) | 1990-12-06 | 2002-01-16 | Affymetrix, Inc. (a Delaware Corporation) | Detection of nucleic acid sequences |
| US5981179A (en) | 1991-11-14 | 1999-11-09 | Digene Diagnostics, Inc. | Continuous amplification reaction |
| US5424413A (en) | 1992-01-22 | 1995-06-13 | Gen-Probe Incorporated | Branched nucleic acid probes |
| US5573905A (en) | 1992-03-30 | 1996-11-12 | The Scripps Research Institute | Encoded combinatorial chemical libraries |
| US5981176A (en) | 1992-06-17 | 1999-11-09 | City Of Hope | Method of detecting and discriminating between nucleic acid sequences |
| WO1995000530A1 (en) | 1993-06-25 | 1995-01-05 | Affymax Technologies N.V. | Hybridization and sequencing of nucleic acids |
| US5500356A (en) | 1993-08-10 | 1996-03-19 | Life Technologies, Inc. | Method of nucleic acid sequence selection |
| US6309823B1 (en) | 1993-10-26 | 2001-10-30 | Affymetrix, Inc. | Arrays of nucleic acid probes for analyzing biotransformation genes and methods of using the same |
| US5681697A (en) | 1993-12-08 | 1997-10-28 | Chiron Corporation | Solution phase nucleic acid sandwich assays having reduced background noise and kits therefor |
| US5714330A (en) | 1994-04-04 | 1998-02-03 | Lynx Therapeutics, Inc. | DNA sequencing by stepwise ligation and cleavage |
| US5604097A (en) | 1994-10-13 | 1997-02-18 | Spectragen, Inc. | Methods for sorting polynucleotides using oligonucleotide tags |
| US6013445A (en) | 1996-06-06 | 2000-01-11 | Lynx Therapeutics, Inc. | Massively parallel signature sequencing by ligation of encoded adaptors |
| US5846719A (en) | 1994-10-13 | 1998-12-08 | Lynx Therapeutics, Inc. | Oligonucleotide tags for sorting and identification |
| US5695934A (en) | 1994-10-13 | 1997-12-09 | Lynx Therapeutics, Inc. | Massively parallel sequencing of sorted polynucleotides |
| US6600996B2 (en) | 1994-10-21 | 2003-07-29 | Affymetrix, Inc. | Computer-aided techniques for analyzing biological sequences |
| DE69535240T2 (en) | 1994-10-28 | 2007-06-06 | Gen-Probe Inc., San Diego | Compositions and methods for the simultaneous detection and quantification of a majority of specific nucleic acid sequences |
| CA2216645A1 (en) | 1995-04-25 | 1996-11-21 | Irori | Remotely programmable matrices with memories and uses thereof |
| US5648245A (en) | 1995-05-09 | 1997-07-15 | Carnegie Institution Of Washington | Method for constructing an oligonucleotide concatamer library by rolling circle replication |
| US5968740A (en) | 1995-07-24 | 1999-10-19 | Affymetrix, Inc. | Method of Identifying a Base in a Nucleic Acid |
| US5763175A (en) | 1995-11-17 | 1998-06-09 | Lynx Therapeutics, Inc. | Simultaneous sequencing of tagged polynucleotides |
| US5854033A (en) | 1995-11-21 | 1998-12-29 | Yale University | Rolling circle replication reporter systems |
| US5962271A (en) | 1996-01-03 | 1999-10-05 | Cloutech Laboratories, Inc. | Methods and compositions for generating full-length cDNA having arbitrary nucleotide sequence at the 3'-end |
| US6458530B1 (en) | 1996-04-04 | 2002-10-01 | Affymetrix Inc. | Selecting tag nucleic acids |
| EP0912761A4 (en) | 1996-05-29 | 2004-06-09 | Cornell Res Foundation Inc | Detection of nucleic acid sequence differences using coupled ligase detection and polymerase chain reactions |
| JPH1021373A (en) | 1996-07-05 | 1998-01-23 | Fuji Photo Film Co Ltd | Picture analyzing device |
| US5935793A (en) | 1996-09-27 | 1999-08-10 | The Chinese University Of Hong Kong | Parallel polynucleotide sequencing method using tagged primers |
| US6124092A (en) | 1996-10-04 | 2000-09-26 | The Perkin-Elmer Corporation | Multiplex polynucleotide capture methods and compositions |
| US6117631A (en) | 1996-10-29 | 2000-09-12 | Polyprobe, Inc. | Detection of antigens via oligonucleotide antibody conjugates |
| US6046005A (en) | 1997-01-15 | 2000-04-04 | Incyte Pharmaceuticals, Inc. | Nucleic acid sequencing with solid phase capturable terminators comprising a cleavable linking group |
| CA2291180A1 (en) | 1997-05-23 | 1998-11-26 | Lynx Therapeutics, Inc. | System and apparatus for sequential processing of analytes |
| US6399334B1 (en) | 1997-09-24 | 2002-06-04 | Invitrogen Corporation | Normalized nucleic acid libraries and methods of production thereof |
| AU1603199A (en) | 1997-12-03 | 1999-06-16 | Curagen Corporation | Methods and devices for measuring differential gene expression |
| US6265163B1 (en) | 1998-01-09 | 2001-07-24 | Lynx Therapeutics, Inc. | Solid phase selection of differentially expressed genes |
| US6787308B2 (en) | 1998-07-30 | 2004-09-07 | Solexa Ltd. | Arrayed biomolecules and their use in sequencing |
| US6653077B1 (en) | 1998-09-04 | 2003-11-25 | Lynx Therapeutics, Inc. | Method of screening for genetic polymorphism |
| US6480791B1 (en) | 1998-10-28 | 2002-11-12 | Michael P. Strathmann | Parallel methods for genomic analysis |
| US6197554B1 (en) | 1998-11-20 | 2001-03-06 | Shi-Lung Lin | Method for generating full-length cDNA library from single cells |
| US6629040B1 (en) | 1999-03-19 | 2003-09-30 | University Of Washington | Isotope distribution encoded tags for protein identification |
| EP1165839A2 (en) | 1999-03-26 | 2002-01-02 | Whitehead Institute For Biomedical Research | Universal arrays |
| US6355431B1 (en) | 1999-04-20 | 2002-03-12 | Illumina, Inc. | Detection of nucleic acid amplification reactions using bead arrays |
| CA2304260C (en) | 1999-04-20 | 2009-03-24 | Japan Bioindustry Association | Method for determining a concentration of target nucleic acid molecules, nucleic acid probes for the method and method for analyzing data obtained by the method |
| US6326148B1 (en) | 1999-07-12 | 2001-12-04 | The Regents Of The University Of California | Detection of copy number changes in colon cancer |
| US6440706B1 (en) | 1999-08-02 | 2002-08-27 | Johns Hopkins University | Digital amplification |
| SE9903988D0 (en) | 1999-11-03 | 1999-11-03 | Amersham Pharm Biotech Ab | Method of analysis |
| US6489114B2 (en) | 1999-12-17 | 2002-12-03 | Bio Merieux | Process for labeling a ribonucleic acid, and labeled RNA fragments which are obtained thereby |
| US6235483B1 (en) | 2000-01-31 | 2001-05-22 | Agilent Technologies, Inc. | Methods and kits for indirect labeling of nucleic acids |
| DE60136166D1 (en) | 2000-02-07 | 2008-11-27 | Illumina Inc | NUCLEIC ACID PROOF METHOD WITH UNIVERSAL PRIMING |
| GB2364054B (en) | 2000-03-24 | 2002-05-29 | Smithkline Beecham Corp | Method of amplifying quinolone-resistance-determining-regions and identifying polymorphic variants thereof |
| AU2001253310A1 (en) | 2000-04-10 | 2001-10-23 | Matthew Ashby | Methods for the survey and genetic analysis of populations |
| US20030207300A1 (en) | 2000-04-28 | 2003-11-06 | Matray Tracy J. | Multiplex analytical platform using molecular tags |
| US7630063B2 (en) | 2000-08-02 | 2009-12-08 | Honeywell International Inc. | Miniaturized cytometer for detecting multiple species in a sample |
| CN100462433C (en) | 2000-07-07 | 2009-02-18 | 维西根生物技术公司 | Real-time sequence determination |
| ATE380883T1 (en) | 2000-10-24 | 2007-12-15 | Univ Leland Stanford Junior | DIRECT MULTIPLEX CHARACTERIZATION OF GENOMIC DNA |
| US20020142345A1 (en) | 2000-12-22 | 2002-10-03 | Nelsen Anita J. | Methods for encoding and decoding complex mixtures in arrayed assays |
| US20030049616A1 (en) | 2001-01-08 | 2003-03-13 | Sydney Brenner | Enzymatic synthesis of oligonucleotide tags |
| AU2002249116A1 (en) | 2001-01-11 | 2002-09-19 | Lion Bioscience Ag | Gene library for screening methods |
| WO2002059355A2 (en) | 2001-01-25 | 2002-08-01 | Tm Bioscience Corporation | Polynucleotides for use as tags and tag complements, manufacture and use thereof |
| US7027932B2 (en) | 2001-03-21 | 2006-04-11 | Olympus Optical Co., Ltd. | Biochemical examination method |
| CA2344599C (en) | 2001-05-07 | 2011-07-12 | Bioneer Corporation | Selective polymerase chain reaction of dna of which base sequence is completely unknown |
| US6905827B2 (en) | 2001-06-08 | 2005-06-14 | Expression Diagnostics, Inc. | Methods and compositions for diagnosing or monitoring auto immune and chronic inflammatory diseases |
| US6830931B2 (en) | 2001-07-12 | 2004-12-14 | Automated Cell, Inc. | Method and apparatus for monitoring of proteins and cells |
| US20060141493A1 (en) | 2001-11-09 | 2006-06-29 | Duke University Office Of Science And Technology | Atherosclerotic phenotype determinative genes and methods for using the same |
| AU2003206095A1 (en) | 2002-01-29 | 2003-09-02 | Global Genomics Ab | Methods and means for amplifying nucleic acid |
| US20030186251A1 (en) | 2002-04-01 | 2003-10-02 | Brookhaven Science Associates, Llc | Genome sequence tags |
| US20070178478A1 (en) | 2002-05-08 | 2007-08-02 | Dhallan Ravinder S | Methods for detection of genetic disorders |
| US7955800B2 (en) | 2002-06-25 | 2011-06-07 | Advpharma Inc. | Metastasis-associated gene profiling for identification of tumor tissue, subtyping, and prediction of prognosis of patients |
| US20040096368A1 (en) | 2002-06-28 | 2004-05-20 | Igen International, Inc. | Assay systems and components |
| US20050019776A1 (en) | 2002-06-28 | 2005-01-27 | Callow Matthew James | Universal selective genome amplification and universal genotyping system |
| WO2004017374A2 (en) | 2002-08-16 | 2004-02-26 | Clinical Microarrays, Inc. | Reading of fluorescent arrays |
| US7361821B2 (en) | 2002-09-20 | 2008-04-22 | Intel Corporation | Controlled alignment of nanobarcodes encoding specific information for scanning probe microscopy (SPM) reading |
| WO2004031408A1 (en) | 2002-09-30 | 2004-04-15 | F.Hoffmann-La Roche Ag | Oligonucleotides for genotyping thymidylate synthase gene |
| JP5695287B2 (en) | 2002-10-02 | 2015-04-01 | カリフォルニア インスティテュート オブ テクノロジー | Nucleic acid analysis of microfluids |
| US7424368B2 (en) | 2002-11-11 | 2008-09-09 | Affymetix, Inc. | Methods for identifying DNA copy number changes |
| US7822555B2 (en) | 2002-11-11 | 2010-10-26 | Affymetrix, Inc. | Methods for identifying DNA copy number changes |
| US7704687B2 (en) | 2002-11-15 | 2010-04-27 | The Johns Hopkins University | Digital karyotyping |
| WO2006102264A1 (en) | 2005-03-18 | 2006-09-28 | Fluidigm Corporation | Thermal reaction device and method for using the same |
| US7269518B2 (en) | 2003-04-30 | 2007-09-11 | Agilent Technologies, Inc. | Chemical array reading |
| US20060078941A1 (en) | 2003-06-09 | 2006-04-13 | Santin Alessandro D | Gene expression profiling in primary ovarian serous papillary tumors and normal ovarian epithelium |
| US20040259118A1 (en) | 2003-06-23 | 2004-12-23 | Macevicz Stephen C. | Methods and compositions for nucleic acid sequence analysis |
| EP2532745B1 (en) | 2003-07-05 | 2015-09-09 | The Johns Hopkins University | Method and Compositions for Detection and Enumeration of Genetic Variations |
| GB0319332D0 (en) | 2003-08-16 | 2003-09-17 | Astrazeneca Ab | Amplification |
| US20050048498A1 (en) | 2003-08-29 | 2005-03-03 | Applera Corporation | Compositions, methods, and kits for assembling probes |
| US7354706B2 (en) | 2003-09-09 | 2008-04-08 | The Regents Of The University Of Colorado, A Body Corporate | Use of photopolymerization for amplification and detection of a molecular recognition event |
| JP5171037B2 (en) | 2003-09-10 | 2013-03-27 | アルセア・ディーエックス,インク. | Expression profiling using microarrays |
| WO2005047521A2 (en) | 2003-11-10 | 2005-05-26 | Investigen, Inc. | Methods of preparing nucleic acid for detection |
| EP1709203A2 (en) | 2004-01-23 | 2006-10-11 | Lingvitae AS | Improving polynucleotide ligation reactions |
| CA2555377A1 (en) | 2004-02-12 | 2005-09-01 | Compass Genetics, Llc | Genetic analysis by sequence-specific sorting |
| US20100216153A1 (en) | 2004-02-27 | 2010-08-26 | Helicos Biosciences Corporation | Methods for detecting fetal nucleic acids and diagnosing fetal abnormalities |
| US10066268B2 (en) | 2004-05-07 | 2018-09-04 | The Henry M. Jackson Foundation For The Advancement Of Military Medicine, Inc. | Methods of diagnosing or treating prostate cancer using the ERG gene, alone or in combination with other over or under expressed genes in prostate cancer |
| US20050250147A1 (en) | 2004-05-10 | 2005-11-10 | Macevicz Stephen C | Digital profiling of polynucleotide populations |
| JP2008505345A (en) | 2004-06-07 | 2008-02-21 | アイアールエム エルエルシー | Dispensing system, software, and related methods |
| US20060035258A1 (en) | 2004-08-06 | 2006-02-16 | Affymetrix, Inc. | Methods for identifying DNA copy number changes |
| US20060041385A1 (en) | 2004-08-18 | 2006-02-23 | Bauer Kenneth D | Method of quantitating proteins and genes in cells using a combination of immunohistochemistry and in situ hybridization |
| US20060073506A1 (en) | 2004-09-17 | 2006-04-06 | Affymetrix, Inc. | Methods for identifying biological samples |
| WO2006071770A2 (en) | 2004-12-23 | 2006-07-06 | I-Stat Corporation | Molecular diagnostics system and methods |
| EP1836302B1 (en) | 2004-12-23 | 2010-04-14 | Amersham Biosciences Corp. | Ligation-based rna amplification |
| US7393665B2 (en) | 2005-02-10 | 2008-07-01 | Population Genetics Technologies Ltd | Methods and compositions for tagging and identifying polynucleotides |
| EP1845160A4 (en) | 2005-02-10 | 2009-07-01 | Riken | Method for amplification of nucleotide sequence |
| US20060211030A1 (en) | 2005-03-16 | 2006-09-21 | Sydney Brenner | Methods and compositions for assay readouts on multiple analytical platforms |
| US7695886B2 (en) | 2005-05-19 | 2010-04-13 | Fuji Xerox Co., Ltd. | Process for producing resin particle liquid dispersion for electrostatic image developing toner, electrostatic image developing toner and production process thereof |
| US20060263789A1 (en) | 2005-05-19 | 2006-11-23 | Robert Kincaid | Unique identifiers for indicating properties associated with entities to which they are attached, and methods for using |
| US8407013B2 (en) | 2005-06-07 | 2013-03-26 | Peter K. Rogan | AB initio generation of single copy genomic probes |
| US7796815B2 (en) | 2005-06-10 | 2010-09-14 | The Cleveland Clinic Foundation | Image analysis of biological objects |
| US20070020640A1 (en) | 2005-07-21 | 2007-01-25 | Mccloskey Megan L | Molecular encoding of nucleic acid templates for PCR and other forms of sequence analysis |
| CN101263227A (en) | 2005-09-16 | 2008-09-10 | 454生命科学公司 | CDNA library preparation |
| WO2007053692A1 (en) | 2005-11-01 | 2007-05-10 | Symyx Technologies, Inc. | Liquid dispensing for high-throughput experimentation |
| US7375211B2 (en) | 2005-11-18 | 2008-05-20 | Kou Zhong C | Method for detection and quantification of T-cell receptor Vβ repertoire |
| US20080070303A1 (en) | 2005-11-21 | 2008-03-20 | West Michael D | Methods to accelerate the isolation of novel cell strains from pluripotent stem cells and cells obtained thereby |
| US7636465B2 (en) | 2005-12-09 | 2009-12-22 | Cytyc Corporation | Cross-frame object reconstruction for image-based cytology applications |
| WO2007087312A2 (en) | 2006-01-23 | 2007-08-02 | Population Genetics Technologies Ltd. | Molecular counting |
| WO2007087310A2 (en) | 2006-01-23 | 2007-08-02 | Population Genetics Technologies Ltd. | Nucleic acid analysis using sequence tokens |
| US20080038727A1 (en) | 2006-03-10 | 2008-02-14 | Applera Corporation | MicroRNA and Messenger RNA Detection on Arrays |
| US7752233B2 (en) | 2006-03-29 | 2010-07-06 | Massachusetts Institute Of Technology | Techniques for clustering a set of objects |
| WO2007114772A1 (en) | 2006-04-04 | 2007-10-11 | Sidec Technologies Ab | Extended electron tomography |
| US20080194414A1 (en) | 2006-04-24 | 2008-08-14 | Albert Thomas J | Enrichment and sequence analysis of genomic regions |
| US9074242B2 (en) | 2010-02-12 | 2015-07-07 | Raindance Technologies, Inc. | Digital analyte analysis |
| WO2007136874A2 (en) | 2006-05-18 | 2007-11-29 | President And Fellows Of Harvard College | Genomic library construction |
| CA2655272C (en) | 2006-06-14 | 2017-04-18 | Living Microsystems, Inc. | Rare cell analysis using sample splitting and dna tags |
| EP2518162B1 (en) | 2006-11-15 | 2018-03-07 | Biospherex LLC | Multitag sequencing and ecogenomics analysis |
| US8050476B2 (en) | 2006-11-22 | 2011-11-01 | General Electric Company | Heart rate demodulation of periodic movement in ultrasound data for object identification |
| EP2653861B1 (en) | 2006-12-14 | 2014-08-13 | Life Technologies Corporation | Method for sequencing a nucleic acid using large-scale FET arrays |
| EP2096429A4 (en) | 2007-01-16 | 2009-12-16 | Olympus Corp | Fluorescent signal analyzing apparatus and fluorescent signal analyzing method |
| WO2008109207A2 (en) | 2007-01-30 | 2008-09-12 | The Regents Of The University Of California | Methods and devices for biomolecular arrays |
| US20080269068A1 (en) | 2007-02-06 | 2008-10-30 | President And Fellows Of Harvard College | Multiplex decoding of sequence tags in barcodes |
| WO2008096318A2 (en) | 2007-02-09 | 2008-08-14 | Koninklijke Philips Electronics N.V. | Identification system |
| KR100882711B1 (en) | 2007-03-12 | 2009-02-06 | 성균관대학교산학협력단 | Uracil-DNA glycosylase of Psychrobacter sp. HJ147 and use thereof |
| US20080274458A1 (en) | 2007-05-01 | 2008-11-06 | Latham Gary J | Nucleic acid quantitation methods |
| US20090061513A1 (en) | 2007-05-15 | 2009-03-05 | Picovitro Ab | Cell sorting and cell cultivation methods |
| EP2164985A4 (en) | 2007-06-01 | 2014-05-14 | 454 Life Sciences Corp | System and meth0d for identification of individual samples from a multiplex mixture |
| EP2171097A2 (en) | 2007-06-29 | 2010-04-07 | Population Genetics Technologies LTD. | Methods and compositions for isolating nucleic acid sequence variants |
| WO2009105670A2 (en) | 2008-02-21 | 2009-08-27 | Gentel Biosciences, Inc. | Substrates for multiplexed assays and uses thereof |
| US8687189B2 (en) | 2008-03-03 | 2014-04-01 | Ajjer, Llc | Analysis of arrays by laser induced breakdown spectroscopy |
| DE102008025656B4 (en) | 2008-05-28 | 2016-07-28 | Genxpro Gmbh | Method for the quantitative analysis of nucleic acids, markers therefor and their use |
| US20090298709A1 (en) | 2008-05-28 | 2009-12-03 | Affymetrix, Inc. | Assays for determining telomere length and repeated sequence copy number |
| WO2009148560A2 (en) | 2008-05-30 | 2009-12-10 | Board Of Regents, The Universtiy Of Texas System | Methods and compositions for nucleic acid sequencing |
| WO2010021936A1 (en) | 2008-08-16 | 2010-02-25 | The Board Of Trustees Of The Leland Stanford Junior University | Digital pcr calibration for high throughput sequencing |
| US8476013B2 (en) | 2008-09-16 | 2013-07-02 | Sequenom, Inc. | Processes and compositions for methylation-based acid enrichment of fetal nucleic acid from a maternal sample useful for non-invasive prenatal diagnoses |
| JP5632382B2 (en) | 2008-10-31 | 2014-11-26 | アッヴィ・インコーポレイテッド | Genomic classification of non-small cell lung cancer based on gene copy number change patterns |
| US20100159533A1 (en) | 2008-11-24 | 2010-06-24 | Helicos Biosciences Corporation | Simplified sample preparation for rna analysis |
| US8492096B2 (en) | 2008-12-24 | 2013-07-23 | Boris Pasche | TGFBR1 expression modifies risk for colorectal cancer |
| CN102333891A (en) | 2009-01-20 | 2012-01-25 | 利兰·斯坦福青年大学托管委员会 | Single cell gene expression for diagnosis, prognosis and identification of drug targets |
| US20100323348A1 (en) | 2009-01-31 | 2010-12-23 | The Regents Of The University Of Colorado, A Body Corporate | Methods and Compositions for Using Error-Detecting and/or Error-Correcting Barcodes in Nucleic Acid Amplification Process |
| CA2754446A1 (en) | 2009-03-05 | 2010-09-10 | Daiichi Sankyo Company, Limited | Pyridine derivative |
| EP2230312A1 (en) | 2009-03-19 | 2010-09-22 | Helmholtz-Zentrum für Infektionsforschung GmbH | Probe compound for detecting and isolating enzymes and means and methods using the same |
| EP3002337B1 (en) | 2009-03-30 | 2018-10-24 | Illumina, Inc. | Gene expression analysis in single cells |
| JP5985390B2 (en) | 2009-04-02 | 2016-09-06 | フリューダイム・コーポレイション | Multi-primer amplification method for adding barcode to target nucleic acid |
| US9085798B2 (en) | 2009-04-30 | 2015-07-21 | Prognosys Biosciences, Inc. | Nucleic acid constructs and methods of use |
| FR2945545B1 (en) | 2009-05-14 | 2011-08-05 | Univ Aix Marseille Ii | METHOD FOR DETECTION OF PROCARYOTE DNA EXTRACTED FROM A SAMPLE SAMPLE |
| GB0909923D0 (en) | 2009-06-09 | 2009-07-22 | Oxford Gene Tech Ip Ltd | Picowell capture devices for analysing single cells or other particles |
| CN102686728B (en) | 2009-06-29 | 2018-09-18 | 卢米耐克斯公司 | Chimeric primers with hairpin conformation and its application method |
| US8330957B2 (en) | 2009-06-29 | 2012-12-11 | Hager Enviromental and Atmospheric Technologies, LLC | Device and method for quantification of gases in plumes by remote sensing |
| EP2467479B1 (en) | 2009-08-20 | 2016-01-06 | Population Genetics Technologies Ltd | Compositions and methods for intramolecular nucleic acid rearrangement |
| US8936762B2 (en) | 2009-09-01 | 2015-01-20 | Trustees Of Boston University | High throughput multichannel reader and uses thereof |
| JP2013503605A (en) | 2009-09-01 | 2013-02-04 | コーニンクレッカ フィリップス エレクトロニクス エヌ ヴィ | Devices and methods for microarray selection |
| US9625454B2 (en) | 2009-09-04 | 2017-04-18 | The Research Foundation For The State University Of New York | Rapid and continuous analyte processing in droplet microfluidic devices |
| WO2011041308A1 (en) | 2009-09-30 | 2011-04-07 | Quest Diagnostics Investments Incorporated | Bcr-abl truncation mutations |
| US9315857B2 (en) * | 2009-12-15 | 2016-04-19 | Cellular Research, Inc. | Digital counting of individual molecules by stochastic attachment of diverse label-tags |
| US8835358B2 (en) | 2009-12-15 | 2014-09-16 | Cellular Research, Inc. | Digital counting of individual molecules by stochastic attachment of diverse labels |
| EP2513341B1 (en) | 2010-01-19 | 2017-04-12 | Verinata Health, Inc | Identification of polymorphic sequences in mixtures of genomic dna by whole genome sequencing |
| US20110245085A1 (en) | 2010-01-19 | 2011-10-06 | Rava Richard P | Methods for determining copy number variations |
| JP5901046B2 (en) | 2010-02-19 | 2016-04-06 | 国立大学法人 千葉大学 | Novel alternative splicing variant of OATP1B3 mRNA |
| WO2011123246A2 (en) | 2010-04-01 | 2011-10-06 | Illumina, Inc. | Solid-phase clonal amplification and related methods |
| SG185544A1 (en) | 2010-05-14 | 2012-12-28 | Fluidigm Corp | Nucleic acid isolation methods |
| US8828688B2 (en) | 2010-05-27 | 2014-09-09 | Affymetrix, Inc. | Multiplex amplification methods |
| EP3425062B1 (en) | 2010-06-09 | 2023-08-02 | Keygene N.V. | Combinatorial sequence barcodes for high throughput screening |
| EP2407242A1 (en) | 2010-07-13 | 2012-01-18 | Dublin City University | Direct clone analysis and selection technology |
| US20120040843A1 (en) | 2010-08-12 | 2012-02-16 | Dublin City University | Centrifugal capture system |
| ES2523140T3 (en) | 2010-09-21 | 2014-11-21 | Population Genetics Technologies Ltd. | Increased confidence in allele identifications with molecular count |
| WO2012042374A2 (en) | 2010-10-01 | 2012-04-05 | Anssi Jussi Nikolai Taipale | Method of determining number or concentration of molecules |
| EP2625320B1 (en) | 2010-10-08 | 2019-03-27 | President and Fellows of Harvard College | High-throughput single cell barcoding |
| US20120088691A1 (en) | 2010-10-08 | 2012-04-12 | Gao Chen | Highly multiplexed real-time pcr using encoded microbeads |
| US20130225623A1 (en) | 2010-10-27 | 2013-08-29 | Mount Sinai School Of Medicine | Methods of Treating Psychiatric or Neurological Disorders with MGLUR Antagonists |
| EP2646795B1 (en) | 2010-11-29 | 2019-02-20 | Dako Denmark A/S | Methods for analyzing images of specimens processed by a programmable quantitative assay |
| CN103403545B (en) | 2010-12-09 | 2018-06-22 | 阿科尼生物系统公司 | Sample analysis system |
| DK2652155T3 (en) | 2010-12-16 | 2017-02-13 | Gigagen Inc | Methods for Massive Parallel Analysis of Nucleic Acids in Single Cells |
| US10241075B2 (en) | 2010-12-30 | 2019-03-26 | Life Technologies Corporation | Methods, systems, and computer readable media for nucleic acid sequencing |
| US20120190020A1 (en) | 2011-01-25 | 2012-07-26 | Aria Diagnostics, Inc. | Detection of genetic abnormalities |
| US9365897B2 (en) | 2011-02-08 | 2016-06-14 | Illumina, Inc. | Selective enrichment of nucleic acids |
| WO2012112804A1 (en) | 2011-02-18 | 2012-08-23 | Raindance Technoligies, Inc. | Compositions and methods for molecular labeling |
| US9260753B2 (en) | 2011-03-24 | 2016-02-16 | President And Fellows Of Harvard College | Single cell nucleic acid detection and analysis |
| KR20120110431A (en) | 2011-03-29 | 2012-10-10 | 에스케이하이닉스 주식회사 | A semiconductor memory apparatus |
| GB201106254D0 (en) | 2011-04-13 | 2011-05-25 | Frisen Jonas | Method and product |
| EP3907297A1 (en) | 2011-04-15 | 2021-11-10 | The Johns Hopkins University | Safe sequencing system |
| EP2702175B1 (en) | 2011-04-25 | 2018-08-08 | Bio-Rad Laboratories, Inc. | Methods and compositions for nucleic acid analysis |
| CN112592960A (en) | 2011-05-20 | 2021-04-02 | 富鲁达公司 | Nucleic acid encoding reactions |
| RS64230B1 (en) | 2011-05-24 | 2023-06-30 | BioNTech SE | Individualized vaccines for cancer |
| US9518292B2 (en) | 2011-05-26 | 2016-12-13 | Brandeis University | Methods for suppression PCR |
| US8841071B2 (en) | 2011-06-02 | 2014-09-23 | Raindance Technologies, Inc. | Sample multiplexing |
| US9752176B2 (en) | 2011-06-15 | 2017-09-05 | Ginkgo Bioworks, Inc. | Methods for preparative in vitro cloning |
| US20140147860A1 (en) | 2011-06-27 | 2014-05-29 | Life Technologies Corporation | Acoustic Cytometry Methods and Protocols |
| WO2013019075A2 (en) | 2011-08-01 | 2013-02-07 | 연세대학교산학협력단 | Method of preparing nucleic acid molecules |
| KR101337094B1 (en) | 2011-11-30 | 2013-12-05 | 삼성에스디에스 주식회사 | Apparatus and method for sequence alignment |
| WO2013117595A2 (en) | 2012-02-07 | 2013-08-15 | Illumina Cambridge Limited | Targeted enrichment and amplification of nucleic acids on a support |
| EP3495817A1 (en) | 2012-02-10 | 2019-06-12 | Raindance Technologies, Inc. | Molecular diagnostic screening assay |
| US9176031B2 (en) | 2012-02-24 | 2015-11-03 | Raindance Technologies, Inc. | Labeling and sample preparation for sequencing |
| ES2776673T3 (en) | 2012-02-27 | 2020-07-31 | Univ North Carolina Chapel Hill | Methods and uses for molecular tags |
| US20150132754A1 (en) | 2012-05-14 | 2015-05-14 | Cb Biotechnologies, Inc. | Method for increasing accuracy in quantitative detection of polynucleotides |
| CN104471077B (en) | 2012-05-21 | 2017-05-24 | 富鲁达公司 | Single-particle analysis of particle populations |
| WO2013176767A1 (en) | 2012-05-25 | 2013-11-28 | The University Of North Carolina At Chapel Hill | Microfluidic devices, solid supports for reagents and related methods |
| ES2774165T3 (en) | 2012-06-15 | 2020-07-17 | Univ Texas | High-throughput sequencing of multiple transcripts from a single cell |
| AU2013273987B2 (en) | 2012-06-15 | 2018-08-09 | Adaptive Biotechnologies Corporation | Uniquely tagged rearranged adaptive immune receptor genes in a complex gene set |
| JP6181751B2 (en) | 2012-06-18 | 2017-08-16 | ニューゲン テクノロジーズ, インコーポレイテッド | Compositions and methods for negative selection of unwanted nucleic acid sequences |
| EP2875173B1 (en) | 2012-07-17 | 2017-06-28 | Counsyl, Inc. | System and methods for detecting genetic variation |
| EP2875131B1 (en) | 2012-07-18 | 2018-03-14 | Siemens Healthcare Diagnostics Inc. | A method of normalizing biological samples |
| AU2013293240A1 (en) | 2012-07-24 | 2015-03-05 | Adaptive Biotechnologies Corp. | Single cell analysis using sequence tags |
| CN113528634A (en) | 2012-08-14 | 2021-10-22 | 10X基因组学有限公司 | Microcapsule compositions and methods |
| US20140378349A1 (en) | 2012-08-14 | 2014-12-25 | 10X Technologies, Inc. | Compositions and methods for sample processing |
| US9567631B2 (en) | 2012-12-14 | 2017-02-14 | 10X Genomics, Inc. | Methods and systems for processing polynucleotides |
| US9388465B2 (en) | 2013-02-08 | 2016-07-12 | 10X Genomics, Inc. | Polynucleotide barcode generation |
| US20150005200A1 (en) | 2012-08-14 | 2015-01-01 | 10X Technologies, Inc. | Compositions and methods for sample processing |
| US20150005199A1 (en) | 2012-08-14 | 2015-01-01 | 10X Technologies, Inc. | Compositions and methods for sample processing |
| US10221442B2 (en) | 2012-08-14 | 2019-03-05 | 10X Genomics, Inc. | Compositions and methods for sample processing |
| US9951386B2 (en) | 2014-06-26 | 2018-04-24 | 10X Genomics, Inc. | Methods and systems for processing polynucleotides |
| US20140378322A1 (en) | 2012-08-14 | 2014-12-25 | 10X Technologies, Inc. | Compositions and methods for sample processing |
| US20140378345A1 (en) | 2012-08-14 | 2014-12-25 | 10X Technologies, Inc. | Compositions and methods for sample processing |
| JP6454281B2 (en) | 2012-11-05 | 2019-01-16 | タカラ バイオ ユーエスエー, インコーポレイテッド | Nucleic acids to be barcoded |
| US9489627B2 (en) | 2012-11-19 | 2016-11-08 | Bottomline Technologies (De), Inc. | Hybrid clustering for data analytics |
| WO2014108850A2 (en) | 2013-01-09 | 2014-07-17 | Yeda Research And Development Co. Ltd. | High throughput transcriptome analysis |
| WO2014116729A2 (en) | 2013-01-22 | 2014-07-31 | The Board Of Trustees Of The Leland Stanford Junior University | Haplotying of hla loci with ultra-deep shotgun sequencing |
| CN104955576A (en) | 2013-01-24 | 2015-09-30 | 沙特基础全球技术有限公司 | Microwell plate made from a polyester-polycarbonate |
| US10190963B2 (en) | 2013-02-01 | 2019-01-29 | Becton, Dickinson And Company | Methods and systems for assessing sample behavior in a flow cytometer |
| WO2014126937A1 (en) | 2013-02-14 | 2014-08-21 | The Board Of Trustees Of The Leland Stanford Junior University | Suspension arrays and multiplexed assays based thereon |
| US20140274811A1 (en) | 2013-03-14 | 2014-09-18 | Lyle J. Arnold | Methods for Amplifying a Complete Genome or Transcriptome |
| WO2014143729A1 (en) | 2013-03-15 | 2014-09-18 | Affinnova, Inc. | Method and apparatus for interactive evolutionary optimization of concepts |
| GB2584364A (en) | 2013-03-15 | 2020-12-02 | Abvitro Llc | Single cell bar-coding for antibody discovery |
| WO2014165762A1 (en) | 2013-04-05 | 2014-10-09 | Raindance Technologies, Inc. | Rare cell analysis after negative selection |
| EP2805769A1 (en) | 2013-05-24 | 2014-11-26 | European Molecular Biology Laboratory | Methods for nano-scale single cell analysis |
| WO2014201273A1 (en) | 2013-06-12 | 2014-12-18 | The Broad Institute, Inc. | High-throughput rna-seq |
| KR102366116B1 (en) | 2013-06-27 | 2022-02-23 | 10엑스 제노믹스, 인크. | Compositions and methods for sample processing |
| KR102536833B1 (en) * | 2013-08-28 | 2023-05-26 | 벡톤 디킨슨 앤드 컴퍼니 | Massively parallel single cell analysis |
| US10395758B2 (en) | 2013-08-30 | 2019-08-27 | 10X Genomics, Inc. | Sequencing methods |
| US20150132743A1 (en) | 2013-09-04 | 2015-05-14 | Fluidigm Corporation | Proximity assays for detecting nucleic acids and proteins in a single cell |
| CN105745334B (en) | 2013-09-30 | 2019-12-10 | 吴迪 | Method for profiling molecular complexes by using proximity barcoding |
| GB201317301D0 (en) | 2013-09-30 | 2013-11-13 | Linnarsson Sten | Method for capturing and encoding nucleic acid from a plurality of single cells |
| JP2017504307A (en) | 2013-10-07 | 2017-02-09 | セルラー リサーチ, インコーポレイテッド | Method and system for digitally counting features on an array |
| CN111534580A (en) | 2013-12-28 | 2020-08-14 | 夸登特健康公司 | Methods and systems for detecting genetic variations |
| DK3089822T3 (en) | 2013-12-30 | 2022-05-02 | Atreca Inc | ANALYSIS OF NUCLEIC ACIDS ASSOCIATED WITH INDIVIDUAL CELLS USING NUCLEIC ACID BAR CODES |
| WO2015134787A2 (en) | 2014-03-05 | 2015-09-11 | Adaptive Biotechnologies Corporation | Methods using randomer-containing synthetic molecules |
| US20150298091A1 (en) | 2014-04-21 | 2015-10-22 | President And Fellows Of Harvard College | Systems and methods for barcoding nucleic acids |
| GB201409282D0 (en) | 2014-05-23 | 2014-07-09 | Univ Sydney Tech | Sequencing process |
| CN113249435A (en) | 2014-06-26 | 2021-08-13 | 10X基因组学有限公司 | Methods of analyzing nucleic acids from individual cells or cell populations |
| KR20170026383A (en) | 2014-06-26 | 2017-03-08 | 10엑스 제노믹스, 인크. | Analysis of nucleic acid sequences |
| EP3165612B1 (en) | 2014-07-02 | 2021-08-18 | DNA Chip Research Inc. | Method for counting number of nucleic acid molecules |
| CA2960821A1 (en) * | 2014-09-09 | 2016-03-17 | Igenomx International Genomics Corporation | Methods and compositions for rapid nucleic acid library preparation |
| EP4105337A1 (en) | 2014-09-09 | 2022-12-21 | The Broad Institute, Inc. | A droplet-based method and apparatus for composite single-cell nucleic acid analysis |
| US20160289669A1 (en) | 2015-01-22 | 2016-10-06 | Becton, Dickinson And Company | Devices and systems for molecular barcoding of nucleic acid targets in single cells |
| WO2016134078A1 (en) | 2015-02-19 | 2016-08-25 | Becton, Dickinson And Company | High-throughput single-cell analysis combining proteomic and genomic information |
| EP3262192B1 (en) | 2015-02-27 | 2020-09-16 | Becton, Dickinson and Company | Spatially addressable molecular barcoding |
| EP3262189B1 (en) | 2015-02-27 | 2021-12-08 | Becton, Dickinson and Company | Methods for barcoding nucleic acids for sequencing |
| US20180073073A1 (en) | 2015-03-18 | 2018-03-15 | Cellular Research, Inc. | Methods and compositions for labeling targets and haplotype phasing |
| EP4180535A1 (en) | 2015-03-30 | 2023-05-17 | Becton, Dickinson and Company | Methods and compositions for combinatorial barcoding |
| EP3901281B1 (en) | 2015-04-10 | 2022-11-23 | Spatial Transcriptomics AB | Spatially distinguished, multiplex nucleic acid analysis of biological specimens |
| WO2016172373A1 (en) | 2015-04-23 | 2016-10-27 | Cellular Research, Inc. | Methods and compositions for whole transcriptome amplification |
| US9618871B2 (en) | 2015-04-28 | 2017-04-11 | Kyocera Document Solutions Inc. | Image forming apparatus |
| CN108026524A (en) | 2015-09-11 | 2018-05-11 | 赛卢拉研究公司 | Method and composition for nucleic acid library standardization |
| US20190218276A1 (en) | 2016-03-21 | 2019-07-18 | The Broad Institute, Inc. | Methods for determining spatial and temporal gene expression dynamics in single cells |
| AU2017261189B2 (en) | 2016-05-02 | 2023-02-09 | Becton, Dickinson And Company | Accurate molecular barcoding |
| EP3465502B1 (en) | 2016-05-26 | 2024-04-10 | Becton, Dickinson and Company | Molecular label counting adjustment methods |
| TWI600309B (en) | 2016-05-28 | 2017-09-21 | Hon Hai Prec Ind Co Ltd | Angle adjusting mechanism |
| US10640763B2 (en) | 2016-05-31 | 2020-05-05 | Cellular Research, Inc. | Molecular indexing of internal sequences |
| US10202641B2 (en) | 2016-05-31 | 2019-02-12 | Cellular Research, Inc. | Error correction in amplification of samples |
| US20180037942A1 (en) | 2016-08-03 | 2018-02-08 | Cellular Research, Inc. | Enzyme-independent molecular indexing |
| KR20190077062A (en) | 2016-11-08 | 2019-07-02 | 셀룰러 리서치, 인크. | How to classify expression profiles |
| AU2017359047A1 (en) | 2016-11-08 | 2019-05-02 | Becton, Dickinson And Company | Methods for cell label classification |
| US20180276332A1 (en) | 2017-03-24 | 2018-09-27 | Cellular Research, Inc. | Synthetic multiplets for multiplets determination |
| JP6518720B2 (en) | 2017-06-07 | 2019-05-22 | 日立ジョンソンコントロールズ空調株式会社 | Permanent magnet type rotary electric machine and compressor using the same |
| CN111247589A (en) | 2017-09-25 | 2020-06-05 | 贝克顿迪金森公司 | Immune receptor barcode error correction |
-
2017
- 2017-05-25 EP EP17728398.3A patent/EP3465502B1/en active Active
- 2017-05-25 JP JP2018561218A patent/JP7046007B2/en active Active
- 2017-05-25 WO PCT/US2017/034576 patent/WO2017205691A1/en unknown
- 2017-05-25 US US15/605,874 patent/US11397882B2/en active Active
- 2017-05-25 CN CN201780028283.2A patent/CN109074430B/en active Active
-
2022
- 2022-07-21 US US17/814,042 patent/US20230065324A1/en active Pending
Patent Citations (7)
| Publication number | Priority date | Publication date | Assignee | Title |
|---|---|---|---|---|
| CN101432439A (en) * | 2006-02-24 | 2009-05-13 | 考利达基因组股份有限公司 | High throughput genome sequencing on DNA arrays |
| CN102099480A (en) * | 2008-07-17 | 2011-06-15 | 巴斯夫植物科学有限公司 | Plants having enhanced yield-related traits and a method for making the same |
| CN102576020A (en) * | 2009-09-28 | 2012-07-11 | 皇家飞利浦电子股份有限公司 | Method for characterization of biological bonds |
| CN102725424A (en) * | 2010-01-25 | 2012-10-10 | Rd生物科技公司 | Self-folding amplification of target nucleic acid |
| CN104364392A (en) * | 2012-02-27 | 2015-02-18 | 赛卢拉研究公司 | Compositions and kits for molecular counting |
| CN105492627A (en) * | 2013-03-15 | 2016-04-13 | 伯乐生命医学产品有限公司 | Digital assays with associated targets |
| WO2015002908A1 (en) * | 2013-07-01 | 2015-01-08 | Sequenta, Inc. | Large-scale biomolecular analysis with sequence tags |
Also Published As
| Publication number | Publication date |
|---|---|
| US20230065324A1 (en) | 2023-03-02 |
| WO2017205691A1 (en) | 2017-11-30 |
| JP2019522268A (en) | 2019-08-08 |
| US11397882B2 (en) | 2022-07-26 |
| JP7046007B2 (en) | 2022-04-01 |
| US20170344866A1 (en) | 2017-11-30 |
| EP3465502A1 (en) | 2019-04-10 |
| EP3465502B1 (en) | 2024-04-10 |
| CN109074430A (en) | 2018-12-21 |
Similar Documents
| Publication | Publication Date | Title |
|---|---|---|
| CN109074430B (en) | Molecular marker counting adjustment method | |
| JP7169290B2 (en) | Composite multiplets for determining multiplets | |
| CN109906274B (en) | Methods for cell marker classification | |
| EP3688763B1 (en) | Immune receptor-barcode error correction | |
| AU2017359048B2 (en) | Methods for expression profile classification | |
| CN111954720A (en) | Methods and compositions for analyzing nucleic acids | |
| JP2023531720A (en) | Methods and compositions for analyzing nucleic acids |
Legal Events
| Date | Code | Title | Description |
|---|---|---|---|
| PB01 | Publication | ||
| PB01 | Publication | ||
| SE01 | Entry into force of request for substantive examination | ||
| SE01 | Entry into force of request for substantive examination | ||
| TA01 | Transfer of patent application right | ||
| TA01 | Transfer of patent application right |
Effective date of registration: 20210224 Address after: new jersey Applicant after: Becton, Dickinson and Co. Address before: California, USA Applicant before: Cellular Research, Inc. |
|
| GR01 | Patent grant | ||
| GR01 | Patent grant |