Lane tree target identification method based on vehicle-mounted 2D LiDAR point cloud data
Technical Field
The invention relates to the field of target identification, in particular to a road tree target identification method based on vehicle-mounted 2D LiDAR point cloud data.
Background
The street trees are important components of urban ecological systems and urban landscapes, and have important significance in the aspects of improving urban ecological environment, purifying air, regulating climate and conserving water sources in the face of the current increasingly severe environmental pollution problem. Under the influence of greenhouse effect, artificial interference and other factors, the diseases and insect pests of the street trees are increased day by day, so that the street trees are withered or dead, the greening and beautifying effects of the street trees are seriously influenced, the urban ecological environment and the life of residents are directly influenced, and the street trees become a restriction factor for fine management of landscaping.
Due to the phenomena of large spacing, different crown sizes or plant shortage of street trees, the continuous spraying pesticide application mode causes a large amount of pesticide to be lost to the ground or to drift and volatilize into the air, thus seriously polluting the urban environment and influencing the life and work of residents. At present, the target pesticide application technology is successfully applied to the disease and insect pest control of orchards and nurseries, and compared with a continuous spray pesticide application mode, the method can save 20-75% of pesticide liquid, effectively improve the deposition rate of the pesticide liquid on a tree target and reduce pesticide residue. Since urban streets contain various surface object targets such as buildings, street lamps, telegraph poles, signboards and the like, the difficulty of target identification is greatly increased, and higher requirements are put forward for target pesticide application technologies.
A vehicle-mounted 3D LiDAR (light detection and ranging) system is an effective means for remote sensing measurement of a street tree, and the adopted street tree identification method can be divided into three types, namely a grid method, a voxel method and a point cloud method according to a point cloud data organization structure. The grid method starts with an onboard LiDAR Canopy Height Model (CHM), divides a spatial region into two-dimensional regular grids, establishes a correspondence between laser points and the grids according to plane coordinates of LiDAR data points, and performs street tree positioning and segmentation by applying image processing means such as image segmentation, contour extraction, morphological operation and the like. The voxel method can be regarded as the expansion of a grid method in a three-dimensional space, the space is divided into voxels, and a complete street tree is extracted by carrying out spatial clustering or region growing on the voxels. The point cloud method directly operates the original or normalized LiDAR data, and in order to improve the point cloud retrieval efficiency, structures such as a quadtree, an octree, a KD tree (k-dimension tree) and the like are often adopted to organize the point cloud. The uniform spatial index structures such as grids and voxels can effectively reduce the data volume and data redundancy of point cloud and improve the neighborhood retrieval efficiency, but the condition of non-uniform density of point cloud is difficult to process, and meanwhile, the size selection and the segmentation precision of the grids/voxels are difficult to balance. Spatial index structures such as a quadtree, an octree, a KD tree and the like can be well suitable for the non-uniform distribution of data, the data precision is reserved, the point cloud is convenient to display and store in batches, but the method is not suitable for the condition of data online processing.
Disclosure of Invention
The invention aims to provide a pavement tree target identification method based on vehicle-mounted 2D LiDAR point cloud data, which is used for acquiring city street data by using vehicle-mounted 2D LiDAR with low data redundancy and easiness in online processing, identifying a pavement tree target and providing an accurate spraying basis for target pesticide application.
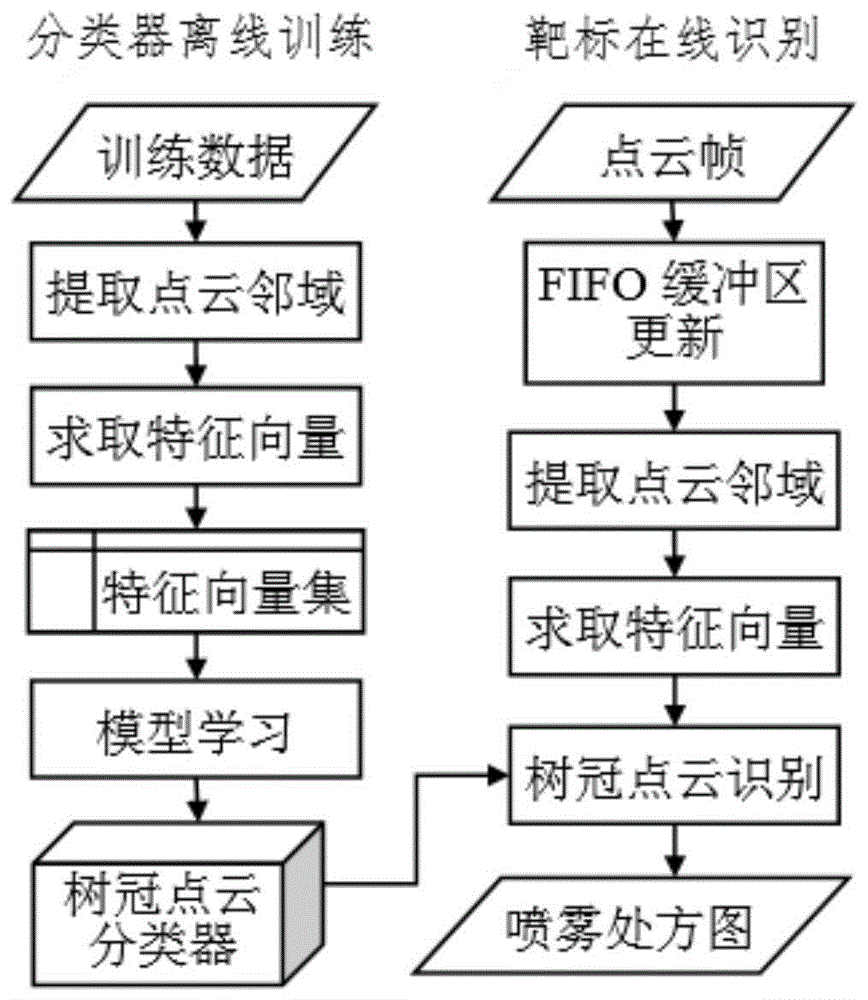
In order to achieve the aim, the invention provides a roadway tree target identification method based on vehicle-mounted 2D LiDAR point cloud data, which comprises the following steps:
the method comprises the following steps: acquiring street data by using a vehicle-mounted 2D LiDAR system, storing the street data as a point cloud file, and carrying out crown and non-crown type labeling on the point cloud file;
step two: constructing a variable-scale grid, and extracting a three-dimensional spherical domain from the variable-scale grid;
step three: calculating a point cloud feature vector in the three-dimensional spherical domain to obtain a point cloud feature vector set;
step four: the SVM algorithm centrally learns the crown point cloud classifier from the point cloud feature vectors;
step five: and carrying out online identification on the point cloud frame according to the crown point cloud classifier to obtain a spray prescription map.
The first step is specifically as follows:
step 101: acquiring street data comprising crown and non-crown point clouds and storing the street data as a point cloud file;
step 102: and establishing a point cloud coordinate system, wherein the x axis is the moving direction of the vehicle, the y axis is the depth direction, and the z axis is vertical to the ground and faces upwards, and carrying out crown and non-crown type labeling on the point cloud file.
The specific step of labeling the crown and non-crown types of the point cloud file in step 102 is as follows:
step 102.1: inputting a point cloud file and a marked file path, reading in the marked file, and if the marked file does not exist, newly building a marked file;
step 102.2: displaying an xz plane point cloud view, inputting a point cloud x coordinate range, and performing x-axis segmentation on a point cloud area;
step 102.3: displaying a yz plane point cloud view, inputting a y and z coordinate range of the point cloud, and performing yz plane segmentation on a point cloud area;
step 102.4: and marking the segmented point cloud area as a crown/non-crown, and displaying marking information.
The second step is specifically as follows:
step 201: constructing a variable-scale grid, wherein grid units correspond to measurement points in a point cloud frame one to one, the actual size of the grid units is represented by scale factors Sx and Sr, and the calculation formula is as follows:
Sx=vΔt
Sr=rΔα
wherein v represents a vehicle moving speed; Δ t represents a 2D LiDAR scan period; r represents a measurement distance; Δ α represents 2D LiDAR radian resolution;
step 202: suppose a measurement point P0Has grid coordinates of (i)0,j0) Calculating to measure the point P0Spherical neighborhood U (P) centered and δ being the radius0,δ);
Computing a spherical neighborhood U (P)0δ) is specifically:
step 202.1: defining the spherical neighborhood and the section of laser scanning beam as the neighborhood of circular grid, and converting the neighborhood of circular grid into the neighborhood of rectangular grid R (P)0,δ),
R(P0,δ)={(i,j)||i-i0|<δ/vΔt,|j-j0|<δ/rΔα};
Wherein, (i, j) represents grid coordinates of measurement points in the neighborhood of the rectangular grid;
step 202.2: in the rectangular grid neighborhood R (P)0δ) by searching for a coincidence P by the following formula0Point of spherical neighborhood condition, get P0Spherical neighborhood of U (P)0,δ);
Wherein (i ', j') represents the grid coordinates of the measurement points in the spherical neighborhood, x0,y0,z0Is P0Three-dimensional coordinates of (a). .
The third step is specifically as follows: and calculating point cloud characteristics describing the consistency of the tree crown and the difference between the tree crown and other ground object targets, wherein the point cloud characteristics comprise an elevation characteristic, a depth characteristic, a density characteristic and a covariance matrix characteristic.
Elevation features include elevation mean μ in spherical neighborhoodzElevation variance deltazAnd the elevation range Δ z ═ zmax-zmin;
The depth features include a depth mean μ in a spherical neighborhoodyDepth variance δyAnd the depth range Δ y ═ ymax-ymin;
The density characteristic is the number of measuring points in the spherical neighborhood;
the covariance matrix features include an all-around difference o, linear a in the spherical neighborhood1DPlanarity a2DSphericity a3DThe calculation formula is as follows:
wherein λ is1≥λ2≥λ3Is the characteristic value of the point cloud covariance matrix.
The fourth step is specifically as follows: fusing point cloud feature vector x [ mu ] by SVM algorithmz,δz,Δz,μy,δy,Δy,d,o,a1D,a2D,a3D]Training the crown point cloud classifier and calculating the classification to be carried outThe sample class label c, the calculation formula is:
in the formula, xlRepresenting a support vector, clIndicating a support vector class label, alphalRepresenting the weight of the support vector, n representing the number of the support vectors, and b representing the bias of the classifier;
mapping the samples to high-dimensional space classification through a Gaussian radial basis kernel function K (,) and calculating the formula as follows:
where σ denotes the kernel width.
The fifth step is specifically as follows:
step 501: constructing a FIFO buffer [ f ]1,f2,…,fN]Buffer intermediate frame f(N+1)/2For a frame to be processed, the buffer length N is calculated by the following formula,
new frame data fnewAfter the frame comes, the new frame data is updated to the FIFO buffer area, and the calculation formula is as follows:
fm=fm+1,m=1,2,…,N-1
fN=fnew
step 502: for intermediate frame f(N+1)/2And (4) processing point by point, identifying the crown point cloud according to the crown point cloud classifier, and providing a spray prescription map.
The invention has the beneficial effects that:
aiming at the problems that the continuous spraying pesticide application mode of the street trees seriously pollutes the environment, the target pesticide application technology of an orchard is difficult to popularize to the complex urban environment and the like, the street tree target recognition method adopts the vehicle-mounted 2D LiDAR which has low data redundancy and is easy to process on line to acquire the urban street data, recognizes the street tree target and provides accurate spraying basis for target pesticide application. And establishing a 2D LiDAR point cloud sequence space index structure which can keep the data precision, improve the neighborhood retrieval efficiency and meet the online processing requirement. And analyzing the difference between the tree crown and other ground object targets, and extracting the characteristic vector of the tree crown. And analyzing the characteristic distribution characteristics, establishing a crown identification model based on machine learning, and realizing accurate identification of the pavement tree target.
Drawings
FIG. 1 shows a process flow diagram of the present invention.
FIG. 2 shows a scanning and system setup schematic for an on-board 2D LiDAR point cloud data acquisition system.
Fig. 3 shows a schematic diagram of data to be annotated.
Fig. 4 shows an x-axis labeling diagram.
Fig. 5 shows a yz plane labeling diagram.
Fig. 6 shows a schematic diagram of a point cloud frame labeling result.
Fig. 7 shows a schematic diagram of a variable-scale grid.
FIG. 8 shows a map of spherical neighbors to mesh neighbors.
FIG. 9 shows a schematic representation of the UTM-30LX scan range.
FIG. 10 illustrates a sample set of point clouds.
Detailed Description
Preferred embodiments of the present invention will be described in more detail below with reference to the accompanying drawings. While the preferred embodiments of the present invention are shown in the drawings, it should be understood that the present invention may be embodied in various forms and should not be limited to the embodiments set forth herein.
As shown in FIG. 1, the invention provides a road tree target identification method based on vehicle-mounted 2D LiDAR point cloud data, comprising the following steps:
the method comprises the following steps: acquiring street data by using a vehicle-mounted 2D LiDAR system, storing the street data as a point cloud file, and carrying out crown and non-crown type labeling on the point cloud file;
step two: constructing a variable-scale grid, and extracting a three-dimensional spherical domain from the variable-scale grid;
step three: calculating a point cloud feature vector in the three-dimensional spherical domain to obtain a point cloud feature vector set;
step four: the SVM algorithm centrally learns the crown point cloud classifier from the point cloud feature vectors;
step five: and carrying out online identification on the point cloud frame according to the crown point cloud classifier to obtain a spray prescription map.
As shown in FIGS. 2-6, a vehicle-mounted 2D LiDAR system is used to obtain street data including crown and non-crown point clouds, which are stored as point cloud files. The on-board 2D LiDAR system measures sector scanning area distance information perpendicular to the direction of vehicle movement, returns 1 frame of data each time, contains measurement point distance information at different angles. The first step is specifically as follows:
step 101: acquiring street data comprising crown and non-crown point clouds and storing the street data as a point cloud file;
step 102: and establishing a point cloud coordinate system, wherein the x axis is the moving direction of the vehicle, the y axis is the depth direction, and the z axis is vertical to the ground and faces upwards, and carrying out crown and non-crown type labeling on the point cloud file.
The specific step of labeling the crown and non-crown types of the point cloud file in step 102 is as follows:
step 102.1: inputting a point cloud file and a marked file path, reading in the marked file, and if the marked file does not exist, newly building a marked file;
step 102.2: displaying an xz plane point cloud view, inputting a point cloud x coordinate range, and performing x-axis segmentation on a point cloud area;
step 102.3: displaying a yz plane point cloud view, inputting a y and z coordinate range of the point cloud, and performing yz plane segmentation on a point cloud area;
step 102.4: and marking the segmented point cloud area as a crown/non-crown, displaying marking information, and if marking is not finished, jumping to step 102.1.
As shown in fig. 7, the point cloud feature calculation needs to be statistically analyzed along with other points in the three-dimensional neighborhood, so that the neighborhood shape and size need to be considered. Because the crown point clouds are distributed in a disordered way and cannot be expressed as basic geometric elements such as lines, surfaces, columns and the like, the three-dimensional spherical neighborhood is adopted to extract the point cloud characteristics. The second step is specifically as follows:
step 201: constructing a variable-scale grid, wherein grid units correspond to measurement points in a point cloud frame one to one, the actual size of the grid units is represented by scale factors Sx and Sr, and the calculation formula is as follows:
Sx=vΔt
Sr=rΔα
wherein v represents a vehicle moving speed; Δ t represents a 2D LiDAR scan period; r represents a measurement distance; Δ α represents 2D LiDAR radian resolution;
step 202: suppose a measurement point P0Has grid coordinates of (i)0,j0) Calculating to measure the point P0Spherical neighborhood U (P) centered and δ being the radius0,δ);
Computing a spherical neighborhood U (P)0δ) is specifically:
step 202.1: defining the spherical neighborhood and the section of laser scanning beam as the neighborhood of circular grid, and converting the neighborhood of circular grid into the neighborhood of rectangular grid R (P)0,δ),
R(P0,δ)={(i,j)||i-i0|<δ/vΔt,j-j0|<δ/rΔα};
Wherein (i, j) represents grid coordinates of measurement points in the neighborhood of the rectangular grid, x0,y0,z0Is P0Three-dimensional coordinates of (a);
step 202.2: in the rectangular grid neighborhood R (P)0δ) by searching for a coincidence P by the following formula0Point of spherical neighborhood condition, get P0Spherical neighborhood of U (P)0,δ);
Where (i ', j') represents the grid coordinates of the measurement points in the spherical neighborhood.
The third step is specifically as follows: and calculating point cloud characteristics describing the consistency of the tree crown and the difference between the tree crown and other ground object targets, wherein the point cloud characteristics comprise an elevation characteristic, a depth characteristic, a density characteristic and a covariance matrix characteristic.
Elevation features include elevation mean μ in spherical neighborhoodzElevation variance deltazAnd the elevation range Δ z ═ zmax-zmin;
The depth features include a depth mean μ in a spherical neighborhoodyDepth variance δyAnd the depth range Δ y ═ ymax-ymin;
The density characteristic is the number of measuring points in the spherical neighborhood;
the covariance matrix features include an all-around difference o, linear a in the spherical neighborhood1DPlanarity a2DSphericity a3DThe calculation formula is as follows:
wherein λ is1≥λ2≥λ3Is the characteristic value of the point cloud covariance matrix.
The fourth step is specifically as follows: fusing point cloud feature vector x [ mu ] by SVM algorithmz,δz,Δz,μy,δy,Δy,d,o,a1D,a2D,a3D]Training a crown point cloud classifier, and calculating a class label c of a sample to be classified, wherein the calculation formula is as follows:
in the formula, xlRepresenting a support vector, clIndicating a support vector class label, alphalRepresenting the weight of the support vector, n representing the number of the support vectors, and b representing the bias of the classifier;
mapping the samples to high-dimensional space classification through a Gaussian radial basis kernel function K (,) and calculating the formula as follows:
where σ denotes the kernel width.
The fifth step is specifically as follows:
step 501: constructing a FIFO buffer [ f ]1,f2,…,fN]Buffer intermediate frame f(N+1)/2For a frame to be processed, the buffer length N is calculated by the following formula,
new frame data fnewAfter the frame comes, the new frame data is updated to the FIFO buffer area, and the calculation formula is as follows:
fm=fm+1,m=1,2,…,N-1
fN=fnew
step 502: for intermediate frame f(N+1)/2And (4) processing point by point, identifying the crown point cloud according to the crown point cloud classifier, and providing a spray prescription map.
As shown in FIG. 9, this embodiment employs 2D LiDAR UTM-30LX manufactured by Hokuyo corporation of Japan, a scanning range of 270 °, an angular resolution of 0.25 °, and a scanning period of 25 ms. The experimental program is developed by adopting Matlab2014b software, and point cloud labeling, feature extraction, classifier training and crown point cloud identification are realized.
Fig. 10 of the present embodiment is a point cloud sample set, which includes ground objects such as trees, buildings, parking sheds, bicycles, street lamps, shrubs, and pedestrians. Randomly extracting 5% of point clouds from the sample set for training, and the remaining 95% of point clouds for testing, wherein the number of samples is shown in table 1.
TABLE 1 Point cloud sample set
Table 2 records the error rate, detection rate and false alarm rate of the classifier on the training set and the test set when the radius delta of the sphere is changed at intervals of 0.1m within the range of [0.1m,0.8m ]. As can be seen from the table, the performance of the classifier is less affected by the radius of the spherical domain, the generalization performance of the classifier is better, the classification error rate of the test set is less than 0.8%, the detection rate is more than 99.4%, and the false alarm rate is less than 0.9%.
TABLE 2 Classification results for different neighborhood sizes
Having described embodiments of the present invention, the foregoing description is intended to be exemplary, not exhaustive, and not limited to the embodiments disclosed. Many modifications and variations will be apparent to those of ordinary skill in the art without departing from the scope and spirit of the described embodiments.