CN107111876B - Vessel lumen sub-resolution segmentation - Google Patents
Vessel lumen sub-resolution segmentation Download PDFInfo
- Publication number
- CN107111876B CN107111876B CN201680005546.3A CN201680005546A CN107111876B CN 107111876 B CN107111876 B CN 107111876B CN 201680005546 A CN201680005546 A CN 201680005546A CN 107111876 B CN107111876 B CN 107111876B
- Authority
- CN
- China
- Prior art keywords
- centerline
- lumen
- voxel
- intensity
- resolution
- Prior art date
- Legal status (The legal status is an assumption and is not a legal conclusion. Google has not performed a legal analysis and makes no representation as to the accuracy of the status listed.)
- Active
Links
- 230000011218 segmentation Effects 0.000 title description 11
- 238000003384 imaging method Methods 0.000 claims abstract description 27
- 238000004458 analytical method Methods 0.000 claims abstract description 12
- 238000000034 method Methods 0.000 claims description 17
- 238000005520 cutting process Methods 0.000 claims description 7
- 230000006870 function Effects 0.000 description 14
- 229910052791 calcium Inorganic materials 0.000 description 9
- 239000011575 calcium Substances 0.000 description 9
- OYPRJOBELJOOCE-UHFFFAOYSA-N Calcium Chemical compound [Ca] OYPRJOBELJOOCE-UHFFFAOYSA-N 0.000 description 8
- 230000008859 change Effects 0.000 description 8
- 230000007423 decrease Effects 0.000 description 5
- 238000001514 detection method Methods 0.000 description 5
- 238000005259 measurement Methods 0.000 description 5
- 238000002591 computed tomography Methods 0.000 description 4
- 210000004351 coronary vessel Anatomy 0.000 description 4
- 238000009499 grossing Methods 0.000 description 4
- 238000012800 visualization Methods 0.000 description 4
- 238000012886 linear function Methods 0.000 description 3
- 238000012417 linear regression Methods 0.000 description 3
- 238000005457 optimization Methods 0.000 description 3
- 238000003860 storage Methods 0.000 description 3
- 230000004075 alteration Effects 0.000 description 2
- 210000000709 aorta Anatomy 0.000 description 2
- 210000001367 artery Anatomy 0.000 description 2
- 210000004204 blood vessel Anatomy 0.000 description 2
- 230000000747 cardiac effect Effects 0.000 description 2
- 238000010968 computed tomography angiography Methods 0.000 description 2
- 208000029078 coronary artery disease Diseases 0.000 description 2
- 238000012986 modification Methods 0.000 description 2
- 230000004048 modification Effects 0.000 description 2
- 238000002604 ultrasonography Methods 0.000 description 2
- 230000002792 vascular Effects 0.000 description 2
- 238000012935 Averaging Methods 0.000 description 1
- 208000004434 Calcinosis Diseases 0.000 description 1
- 208000031481 Pathologic Constriction Diseases 0.000 description 1
- QVGXLLKOCUKJST-UHFFFAOYSA-N atomic oxygen Chemical compound [O] QVGXLLKOCUKJST-UHFFFAOYSA-N 0.000 description 1
- 239000008280 blood Substances 0.000 description 1
- 210000004369 blood Anatomy 0.000 description 1
- 238000004364 calculation method Methods 0.000 description 1
- 238000004891 communication Methods 0.000 description 1
- 238000013170 computed tomography imaging Methods 0.000 description 1
- 230000003247 decreasing effect Effects 0.000 description 1
- 238000002059 diagnostic imaging Methods 0.000 description 1
- 238000009826 distribution Methods 0.000 description 1
- 230000000694 effects Effects 0.000 description 1
- 238000001914 filtration Methods 0.000 description 1
- 239000004973 liquid crystal related substance Substances 0.000 description 1
- 238000002595 magnetic resonance imaging Methods 0.000 description 1
- 210000004165 myocardium Anatomy 0.000 description 1
- 230000003287 optical effect Effects 0.000 description 1
- 229910052760 oxygen Inorganic materials 0.000 description 1
- 239000001301 oxygen Substances 0.000 description 1
- 238000002600 positron emission tomography Methods 0.000 description 1
- 230000008569 process Effects 0.000 description 1
- 238000002603 single-photon emission computed tomography Methods 0.000 description 1
- 208000037804 stenosis Diseases 0.000 description 1
- 230000036262 stenosis Effects 0.000 description 1
- 230000000007 visual effect Effects 0.000 description 1
Images


Classifications
-
- G—PHYSICS
- G06—COMPUTING; CALCULATING OR COUNTING
- G06T—IMAGE DATA PROCESSING OR GENERATION, IN GENERAL
- G06T7/00—Image analysis
- G06T7/10—Segmentation; Edge detection
- G06T7/162—Segmentation; Edge detection involving graph-based methods
-
- A—HUMAN NECESSITIES
- A61—MEDICAL OR VETERINARY SCIENCE; HYGIENE
- A61B—DIAGNOSIS; SURGERY; IDENTIFICATION
- A61B6/00—Apparatus for radiation diagnosis, e.g. combined with radiation therapy equipment
- A61B6/02—Devices for diagnosis sequentially in different planes; Stereoscopic radiation diagnosis
- A61B6/03—Computerised tomographs
- A61B6/032—Transmission computed tomography [CT]
-
- A—HUMAN NECESSITIES
- A61—MEDICAL OR VETERINARY SCIENCE; HYGIENE
- A61B—DIAGNOSIS; SURGERY; IDENTIFICATION
- A61B6/00—Apparatus for radiation diagnosis, e.g. combined with radiation therapy equipment
- A61B6/50—Clinical applications
- A61B6/503—Clinical applications involving diagnosis of heart
-
- A—HUMAN NECESSITIES
- A61—MEDICAL OR VETERINARY SCIENCE; HYGIENE
- A61B—DIAGNOSIS; SURGERY; IDENTIFICATION
- A61B6/00—Apparatus for radiation diagnosis, e.g. combined with radiation therapy equipment
- A61B6/50—Clinical applications
- A61B6/504—Clinical applications involving diagnosis of blood vessels, e.g. by angiography
-
- A—HUMAN NECESSITIES
- A61—MEDICAL OR VETERINARY SCIENCE; HYGIENE
- A61B—DIAGNOSIS; SURGERY; IDENTIFICATION
- A61B6/00—Apparatus for radiation diagnosis, e.g. combined with radiation therapy equipment
- A61B6/52—Devices using data or image processing specially adapted for radiation diagnosis
- A61B6/5211—Devices using data or image processing specially adapted for radiation diagnosis involving processing of medical diagnostic data
-
- G—PHYSICS
- G06—COMPUTING; CALCULATING OR COUNTING
- G06T—IMAGE DATA PROCESSING OR GENERATION, IN GENERAL
- G06T7/00—Image analysis
- G06T7/0002—Inspection of images, e.g. flaw detection
- G06T7/0012—Biomedical image inspection
-
- G—PHYSICS
- G06—COMPUTING; CALCULATING OR COUNTING
- G06T—IMAGE DATA PROCESSING OR GENERATION, IN GENERAL
- G06T7/00—Image analysis
- G06T7/10—Segmentation; Edge detection
- G06T7/11—Region-based segmentation
-
- G—PHYSICS
- G06—COMPUTING; CALCULATING OR COUNTING
- G06T—IMAGE DATA PROCESSING OR GENERATION, IN GENERAL
- G06T7/00—Image analysis
- G06T7/10—Segmentation; Edge detection
- G06T7/12—Edge-based segmentation
-
- G—PHYSICS
- G06—COMPUTING; CALCULATING OR COUNTING
- G06T—IMAGE DATA PROCESSING OR GENERATION, IN GENERAL
- G06T7/00—Image analysis
- G06T7/60—Analysis of geometric attributes
- G06T7/62—Analysis of geometric attributes of area, perimeter, diameter or volume
-
- G—PHYSICS
- G16—INFORMATION AND COMMUNICATION TECHNOLOGY [ICT] SPECIALLY ADAPTED FOR SPECIFIC APPLICATION FIELDS
- G16H—HEALTHCARE INFORMATICS, i.e. INFORMATION AND COMMUNICATION TECHNOLOGY [ICT] SPECIALLY ADAPTED FOR THE HANDLING OR PROCESSING OF MEDICAL OR HEALTHCARE DATA
- G16H50/00—ICT specially adapted for medical diagnosis, medical simulation or medical data mining; ICT specially adapted for detecting, monitoring or modelling epidemics or pandemics
- G16H50/20—ICT specially adapted for medical diagnosis, medical simulation or medical data mining; ICT specially adapted for detecting, monitoring or modelling epidemics or pandemics for computer-aided diagnosis, e.g. based on medical expert systems
-
- G—PHYSICS
- G06—COMPUTING; CALCULATING OR COUNTING
- G06T—IMAGE DATA PROCESSING OR GENERATION, IN GENERAL
- G06T2207/00—Indexing scheme for image analysis or image enhancement
- G06T2207/10—Image acquisition modality
- G06T2207/10072—Tomographic images
-
- G—PHYSICS
- G06—COMPUTING; CALCULATING OR COUNTING
- G06T—IMAGE DATA PROCESSING OR GENERATION, IN GENERAL
- G06T2207/00—Indexing scheme for image analysis or image enhancement
- G06T2207/10—Image acquisition modality
- G06T2207/10072—Tomographic images
- G06T2207/10081—Computed x-ray tomography [CT]
-
- G—PHYSICS
- G06—COMPUTING; CALCULATING OR COUNTING
- G06T—IMAGE DATA PROCESSING OR GENERATION, IN GENERAL
- G06T2207/00—Indexing scheme for image analysis or image enhancement
- G06T2207/10—Image acquisition modality
- G06T2207/10072—Tomographic images
- G06T2207/10088—Magnetic resonance imaging [MRI]
-
- G—PHYSICS
- G06—COMPUTING; CALCULATING OR COUNTING
- G06T—IMAGE DATA PROCESSING OR GENERATION, IN GENERAL
- G06T2207/00—Indexing scheme for image analysis or image enhancement
- G06T2207/10—Image acquisition modality
- G06T2207/10072—Tomographic images
- G06T2207/10104—Positron emission tomography [PET]
-
- G—PHYSICS
- G06—COMPUTING; CALCULATING OR COUNTING
- G06T—IMAGE DATA PROCESSING OR GENERATION, IN GENERAL
- G06T2207/00—Indexing scheme for image analysis or image enhancement
- G06T2207/10—Image acquisition modality
- G06T2207/10132—Ultrasound image
-
- G—PHYSICS
- G06—COMPUTING; CALCULATING OR COUNTING
- G06T—IMAGE DATA PROCESSING OR GENERATION, IN GENERAL
- G06T2207/00—Indexing scheme for image analysis or image enhancement
- G06T2207/20—Special algorithmic details
- G06T2207/20081—Training; Learning
-
- G—PHYSICS
- G06—COMPUTING; CALCULATING OR COUNTING
- G06T—IMAGE DATA PROCESSING OR GENERATION, IN GENERAL
- G06T2207/00—Indexing scheme for image analysis or image enhancement
- G06T2207/20—Special algorithmic details
- G06T2207/20112—Image segmentation details
- G06T2207/20168—Radial search
-
- G—PHYSICS
- G06—COMPUTING; CALCULATING OR COUNTING
- G06T—IMAGE DATA PROCESSING OR GENERATION, IN GENERAL
- G06T2207/00—Indexing scheme for image analysis or image enhancement
- G06T2207/30—Subject of image; Context of image processing
- G06T2207/30004—Biomedical image processing
- G06T2207/30048—Heart; Cardiac
-
- G—PHYSICS
- G06—COMPUTING; CALCULATING OR COUNTING
- G06T—IMAGE DATA PROCESSING OR GENERATION, IN GENERAL
- G06T2207/00—Indexing scheme for image analysis or image enhancement
- G06T2207/30—Subject of image; Context of image processing
- G06T2207/30004—Biomedical image processing
- G06T2207/30101—Blood vessel; Artery; Vein; Vascular
-
- G—PHYSICS
- G06—COMPUTING; CALCULATING OR COUNTING
- G06T—IMAGE DATA PROCESSING OR GENERATION, IN GENERAL
- G06T2207/00—Indexing scheme for image analysis or image enhancement
- G06T2207/30—Subject of image; Context of image processing
- G06T2207/30172—Centreline of tubular or elongated structure
Abstract
An imaging system (100) comprising: a sub-resolution luminal narrowing detector (112) that detects sub-resolution narrowing of the vessel lumen in the image volume by centerline contour analysis and calculates a sub-resolution determined diameter by correcting the approximated visible lumen diameter using the detected sub-resolution narrowing.
Description
Technical Field
The following generally relates to medical imaging and is described with particular application to segmentation of luminal structures.
Background
The literature indicates that coronary artery disease is the only largest cause of death worldwide. Coronary artery disease is a narrowing of the lumen of the coronary artery that supplies oxygen to the heart muscle via blood. The lumen diameters of the coronary arteries vary. For example, the diameter of the left main coronary lumen is typically 4.5 ± 0.5mm and the diameter of the distal left anterior descending coronary lumen is typically 1.9 ± 0.4mm in healthy adult individuals.
One non-invasive technique to assess coronary lumen narrowing (e.g., stenosis) is Cardiac Computed Tomography Angiography (CCTA). In CCTA, one or more three-dimensional (3D) images (e.g., Computed Tomography (CT) images) of the coronary arteries are used to identify and quantify luminal narrowing. Another quantitative measurement uses a Fractional Flow Reserve (FFR) simulated pressure differential based on a 3D model of the lumen.
Visual imaging resolution or accuracy (e.g., imaging with CCTA) is typically about 1.5mm, e.g., one spatial dimension that is capable of accurately resolving differences in the image. Using the images to determine that narrowing of the lumen less than three to four times the visible resolution has an effect on: first, whether narrowing is detected; second, segmentation of the structure of the lumen affected by the narrowing is affected to quantify the accuracy of the measurement. Reconstruction algorithms typically utilize a low pass filter to smooth the image, which can blur lumen boundaries. In cases where the lumen diameter is smaller than the low pass filter support capability, the smoothing process may result in the segmentation algorithm overestimating the lumen diameter. Calcium deposits in arteries narrow the arteries, which can lead to blooming (blooming) artifacts in imaging and blooming artifacts in typical segmentation algorithms that simulate lumens larger than the underlying real lumen.
Disclosure of Invention
Aspects described herein address the above matters, and others.
Systems and methods for detecting sub-resolution narrowing of and segmenting a vessel lumen using a graph-based minimum cut algorithm with improved graphs are described below.
In one aspect, an imaging system includes: a sub-resolution luminal narrowing detector that detects sub-resolution narrowing of a vessel lumen in the image volume by centerline contour analysis and calculates a sub-resolution determined diameter by correcting the approximated visible lumen diameter using the detected sub-resolution narrowing.
In another aspect, a method of segmenting a luminal vessel comprises: detecting sub-resolution narrowing using centerline contour analysis of approximated visible lumen diameter in a vessel lumen in the image volume; calculating a sub-resolution determined diameter by modifying the approximated visible lumen diameter based on the detected sub-resolution narrowing.
In another aspect, an imaging system includes: a graph minimum cut change segmenter that constructs a graph with each voxel in a segmented region of the image volume represented by the nodes. Each node is connected to a lumen node and a background node. Edge utilization probability L connecting each node to the lumen nodeiAnd possibility LdIs weighted, wherein the likelihood LiIs the likelihood that the voxel is part of the segmented vessel lumen according to the intensity of the closest centerline voxel and the trained model, the likelihood LdIs the likelihood that the voxel is part of the segmented vessel lumen based on the spatial distance of the voxel from the closest centerline point and the sub-resolution determined diameter. Edges connecting each node to the background node pass through 1-Li*LdThe weighting is performed. Edges between neighboring voxels are weighted by a smoothness penalty. The graph minimum cut change segmenter and cuts the graph, the cutting of the graph dividing the graph into a first portion connected to the lumen node and a second portion connected to the background node based on a minimum cost, and the nodes in the first portion generating volumes of segmented vessel lumens.
Drawings
The invention may take form in various components and arrangements of components, and in various steps and arrangements of steps. The drawings are only for purposes of illustrating the preferred embodiments and are not to be construed as limiting the invention.
FIG. 1 schematically illustrates an exemplary sub-resolution luminal narrowing detection and segmentation system in combination with an imaging system.
Fig. 2 illustrates an example of an approximate lumen diameter using a Full Width Half Maximum (FWHM) rule.
Fig. 3 schematically illustrates an example of visualization of varying vessel diameters at a visible imaging resolution.
Figure 4 shows a graphical example of reduced intensity lumen narrowing.
Fig. 5 shows an example of calcium-blooming lumen narrowing.
Fig. 6 shows a graphical example of minimum and maximum threshold intensities at a cross-section of a lumen and a fitted linear model.
Figure 7 shows a graphical example of variance threshold intensity versus fitted linear model at a lumen cross-section.
Fig. 8 illustrates in a flow chart an exemplary method of sub-resolution luminal narrowing detection and segmentation.
Fig. 9 illustrates in a flow chart an exemplary method of approximating a visible lumen diameter.
Fig. 10 illustrates in a flow chart an exemplary method of detecting sub-resolution luminal narrowing.
Detailed Description
Referring initially to fig. 1, an exemplary sub-resolution luminal narrowing detection and segmentation system 100 is illustrated. An imaging device 102, such as a Computed Tomography (CT) imaging device, Ultrasound (US), Magnetic Resonance Imaging (MRI), Positron Emission Tomography (PET), Single Photon Emission Computed Tomography (SPECT), or the like, generates imaging data, e.g., projection data, raw data, etc., of a region of interest of a subject in an imaging bore 104 of the imaging device 102, the region of interest including structures, e.g., vascular structures, having lumens within a resolution of the imaging device. A reconstructor 106 receives the imaging data and reconstructs one or more images, e.g., reconstructed image volume(s), from the imaging data. For example, CT imaging devices generate cardiac CT angiography (CCTA) images. The reconstructed images can be received from the imaging device 102 and/or from a storage device 108, such as a Picture Archiving and Communication System (PACS), a Radiology Information System (RIS), a Hospital Information System (HIS), an Electronic Medical Record (EMR), etc.
The vessel centerline generator 110 generates a centerline through the lumen of the selected vessel to be segmented. The vessel centerline generator 110 can generate a centerline of the indicated vascular structure (e.g., coronary arteries) using techniques known in the art and/or other techniques. The vessel centerline generator 110 receives the reconstructed image and determines a centerline of the vessel lumen from the image volume from the received image, either automatically or manually directed.
A sub-resolution (sub-res.) lumen narrowing detector 112 approximates the visible lumen diameter based on the image volume and the determined centerline. The sub-resolution luminal narrowing detector 112 utilizes centerline intensity profile analysis to detect sub-resolution narrowing, e.g., a measurement of luminal narrowing with an accuracy greater than the visible resolution of the reconstructed image. Centerline intensity profile analysis includes detecting sub-resolution narrowing based on changes in the intensity profile and increased intensity indicative of calcium blooming. Based on the detected narrowing, the sub-resolution luminal narrowing detector 112 corrects the approximated visible lumen diameter to a sub-resolution determined diameter.
In one non-limiting example, the graphical minimum cut change segmenter 114 segments the lumen at sub-resolution based on likelihood based on voxel-wise intensity, likelihood based on voxel-wise diameter, smoothness penalty, and optimization.
The likelihood on a voxel-by-voxel intensity basis for each voxel is calculated using a trained model of the characteristics of the voxel intensities in cross-sections to the centerline. Each voxel in a segmented region (e.g., a region of a blood vessel) is assigned a value LiThis value represents the intensity of the voxel according to the closest centerline voxel and the likelihood that the trained model is part of the lumen. The trained model uses the intensity I of the closest centerline voxelctrTo calculate the maximum intensity threshold fmax(Ictr) And a minimum intensity threshold fmin(Ictr). The likelihood that a voxel is part of a segmented lumen can include the following function: l isi=1/(Wshu*((Ivoxel-Ictr)/((fmax(Ictr)-fminIctr) 2)) in which W isshuIs a weight, IvoxelIs the voxel intensity.
The likelihood based on voxel-by-voxel diameter for each voxel is calculated using a trained model of the characteristics of voxel intensity in cross-sections to the centerline. Each voxel in the segmented region is assigned a value LdThis value represents the likelihood that a voxel is part of the lumen based on the voxel's spatial distance from the closest centerline point and the sub-resolution determined diameter. The likelihood that a voxel is part of a segmented lumen based on distance can include the following function: wherein, WdIs a weight, dvoxelIs the spatial distance between the voxel and the closest centerline point, and D is the sub-resolution determined diameter at the centerline point.
A smoothness penalty is calculated based on the product of the local intensity difference, the surface direction and local intensity difference direction pair for the neighborhood voxel p and the neighborhood q, and the trained model. The local intensity difference for each pair of neighboring voxels can be given by: wherein, IpAnd IqIntensity of neighboring voxels in units of Hounsfield Units (HU), dp,qIs the spatial distance between voxels p and q, fvar(Ictr,p) Is a function of the trained model according to the variance of the intensity in HU at the closest centerline point to p. The surface direction can be given by:
 where abs is an absolute value function, (p-q) is a vector between voxels p and q, dir (ctr, p) is the direction to the centerline at the closest centerline point of p, θ is a constant, e.g. in the range of 0.1 to 0.5, e.g. 0.3 and/or other values, the local intensity difference direction is given by: if Ip–Iq>0 or p (q)>m is 1, where m is a constant of a predetermined threshold maximum intensity, e.g., a value in the range of 400-800HU, e.g., 600 HU; otherwise it is 0.
Based on a cut of the constructed graph (which separates the graph into a lumen and a background) at a minimum cost, an optimization assigns a label to each voxel in the segmented region as a value, e.g., background, that indicates whether the voxel is in the segmented lumen. The graph includes each voxel represented by a node, and two additional nodes represent a lumen and a background, e.g., non-lumen. Each voxel node is connected to a lumen node and a background node by edges. The weight of the edge between each voxel and the lumen node is given by Li*LdIs given, wherein LiAnd LdIs a likelihood value assigned to a voxel based on the intensity and distance. The weight of the edge between each voxel and the background node is 1-Li*LdIt is given. The nodes of each voxel are connected by edges weighted by a smoothness penalty, which is the product of the local intensity difference, the surface direction and the local intensity difference direction, to nodes of neighboring voxels, e.g., a predetermined set of neighboring voxels (e.g., those voxels adjacent to the voxel). The cutting of the constructed graph including nodes and weighted edges is performed using a minimal cutting algorithm such as Ford-Fulkerson, Edmonds-Karp, Push-Relabel, Boykov-Kolmogorov, and the like.
The graphical min-cut variation segmenter 114 segments the lumen at a sub-resolution based on the assigned labels according to the min-cut algorithm. The voxels in the cut portion connected to the lumen are defined as a sub-resolution segmented lumen 116. Voxels in the cut portion connected to the background are not included in the segmented lumen. The sub-resolution segmented lumen can be displayed on the display device 118, superimposed on the image volume, and/or stored with the image data 108.
Fractional flow reserve (frac.) analyzer 120 can calculate fractional flow reserve based on the sub-resolution segmented lumen 116. Fractional flow reserve analyzer 120 uses more accurately segmented structures (e.g., more accurately segmented structures) to determine fractional flow reserve, which includes sub-resolution narrowing according to reduced intensity and/or calcium bloom. The calculated fractional flow reserve can be displayed on the display device 118 and/or stored in a computer memory, for example, along with the image data.
The reconstructor 106, the vessel centerline generator 110, the sub-resolution luminal narrowing detector, the graph minimum cut change segmenter 114, and the fractional flow reserve analyzer 120 are suitably implemented by one or more configured data processors 122 (e.g., an electronic data processor, an optical data processor, a microprocessor, a digital processor, etc.). The data processor 122 is configured to execute computer-readable instructions stored in a non-transitory computer-readable storage medium ("memory"). The configured data processor 122 may also execute one or more computer readable instructions carried by a carrier wave, signal, or other transitory medium. The data processor 122 can include a computing device 124 such as a workstation, laptop, mobile computing device, smart phone, server, body worn computing device, and the like. The data processor 122 can be a distributed computing device, e.g., a point-to-point computing device, a client-server computing device, etc.
Referring to fig. 2, an example of an approximate visible lumen diameter determined using a Full Width Half Maximum (FWHM) rule is illustrated. The left anterior descending coronary lumen 200 is shown in a straight multi-planar view. The view uses the distance in millimeters (mm) from the generated centerline on the vertical axis and the distance in millimeters from the ostium on the horizontal axis. The approximate visible lumen diameter 202 is indicated as a white line.
Rays in planes perpendicular to the centerline at different angles are sampled for intensity values. A Full Width Half Maximum (FWHM) rule is applied to determine an approximate visible diameter for each sampled ray. The FWHM selects the diameter endpoints where the intensity values are half of the maximum intensity value or half of the peak intensity value and the maximum width of the intensity distribution curve. A diameter value (e.g., median) on the sampled rays in each plane is calculated for each cross-section to determine an approximate visible lumen diameter. In one example, the average of the sample rays is calculated for the diameter value. The filter is capable of smoothing diameter values in a plane perpendicular to the centerline.
Referring to fig. 3, an example of visualization of varying vessel diameters at a visible imaging resolution is schematically illustrated. Based on the reconstructed image, the vessel diameter is overestimated. Lumen profile 300 (e.g., true size) is illustrated with different profiles or diameters of 3mm 302, 1.5mm 304, 1.3mm 306, 1mm 308, and 0.5mm 310. The dimensions are shown on the horizontal axis with the centerline at 4mm and the intensity at 1.0 on the vertical axis. The lumen profile after convolution 312 (e.g., as viewed by an imaging device at resolution) is shown to correspond to each of the true lumen profiles. The convolved lumen profile uses the same axis as the true lumen profile. As the diameter narrows, the measurement of the intensity profile 314 after convolution decreases, as indicated, for example, by the peak, width, shape, and/or FWHM (defined above) measurements. For example, the peak intensities of the lumens in order of decreasing size are approximately 1.1, 1.0, 0.9, 0.8, and 0.4. The full width at half maximum (e.g., the size at 0.55, 0.5, 0.45, 0.4, and 0.2 intensities of the convolved profiles, respectively) overestimates the true lumen.
A two-dimensional (2D) visualization 316 of the lumen is illustrated for each of the different diameter lumens. A first area of intensity indicated in white represents the lumen 318 and a second area of intensity indicated by a dark area represents the non-lumen 320. As visualized and as the diameter of the lumen decreases, the first area decreases or narrows, and similarly, the intensity of the lumen 318 represented in the visualization also decreases.
Referring to fig. 4, a graphical example of reduced intensity lumen narrowing is shown. The first graph 400 depicts intensity values in HU along the centerline. The vertical or y-axis is the intensity value in HU and the horizontal or x-axis is the distance from the ostium along the centerline. The first plot on the graph is the intensity value along the centerline 402 and the second plot is a smoothing of the intensity value 404. Narrowing 406 is indicated by a decrease in intensity value between 19mm and 23mm from the mouth along the centerline, e.g., below a minimum threshold 408. The minimum threshold 408 is based on the centerline intensity value, e.g., the median centerline intensity value.
The sub-resolution luminal narrowing detector 112 calculates a multi-scale second derivative of the centerline profile, e.g., the second derivative of the smoothed line 404 representing intensity values along the centerline. Narrowing 406 is detected where the value (e.g., line) is below the threshold and the second derivative is positive (e.g., >).
Based on the change in intensity values as described with reference to fig. 3, the second graph 410 depicts the narrowing 412 as a percentage on the vertical axis and the distance from the ostium along the centerline on the horizontal axis, on the same scale as the first graph 400. A corresponding image 414 is displayed that includes a reduced intensity region 416, e.g., a darkened or less bright region, the reduced intensity region 416 corresponding to a narrowing detected by the sub-resolution luminal narrowing detector 112 based on intensity values along the centerline. The corresponding image 414 includes the same horizontal axis as the first graph 400 and the second graph 410. In one example, the sub-resolution luminal narrowing detector 112 receives input from the input device 126 indicating a search for a narrowed region and/or a presentation of a narrowed region.
The sub-resolution luminal narrowing detector 112 calculates a sub-resolution determined diameter from the approximated visible lumen diameter based on the detected narrowing. The calculation can include a formula
 Wherein D issubIs the diameter of the narrowing of the sub-lumen, DapproxIs the approximate visible lumen diameter, IctrIs the intensity value of the centerline, μ0Is a reference lumen intensity value, e.g., the intensity value of the aorta, α, β and γ are constants, e.g., 0.5, 0.16 and 0.14, respectively.
Referring to fig. 5, an example of calcium blooming as the lumen narrows is shown. The sub-resolution luminal narrowing detector 112 detects narrowing due to calcium blooming based on intensity values greater than a threshold. The first graph 500 includes a line 502 representing intensity values along a centerline and a second line 504 representing intensity values smoothed with a filter. The intensity values are represented on the vertical or y-axis and the distance along the center line on the horizontal or x-axis. Intensity values 506 exceeding threshold 508 are indicated as being between 9mm and 12mm from the mouth.
The sub-resolution luminal narrowing detector 112 detects narrowing of calcium halo, where the value (e.g., line) is above a maximum threshold 508 and the second derivative is negative (e.g., < 0). The intensity value of the upper threshold can use a reference value, for example, the intensity of the aorta. Based on the detected narrowing due to calcium blooming, the sub-resolution luminal narrowing detector 112 modifies the approximated visible resolution diameter to a sub-resolution determined diameter.
The second graph 510 indicates narrowing 512 as a percentage of the lumen on the vertical or y-axis and the distance from the ostium along the center line on the same horizontal axis as the first graph 500. A corresponding image 514 is displayed at a distance of 9 to 12mm corresponding to the detected narrowing due to calcium blooming, the corresponding image 514 including an increased intensity region 516, e.g., a lighter region. The corresponding image 514 includes a horizontal axis that is common to the first graphic 500 and the second graphic 510.
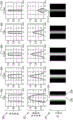
Referring to fig. 6, a graphical example of a fitted linear function 602 of minimum threshold intensity 600 at a tubular cross-section to a model and a fitted linear function 606 of maximum threshold intensity 604 at a lumen cross-section to a model is shown. The graphical minimum cut change segmenter 114 generates a model defining voxel-specific intensity limits for segmenting the lumen based on intensity characteristics of cross-sections along the centerline.
The graph minimum cut change segmenter 114 samples the characteristic intensities of voxels in a cross-section along the centerline. For example, at each cross section, the characteristics of the minimum, maximum and standard deviation of the intensity in the region to be segmented are calculated. FIG. 6 is a scatter plot of centerline intensity in HU on the horizontal or x-axis and maximum and minimum intensity in HU on the vertical or y-axis.
The graph min-cut variation segmenter 114 generates a model based on the sampled characteristics. The model includes a function of centerline intensity. The maximum intensity 606 is dimmed and a first function 606 is fitted to the maximum intensity to derive a maximum intensity threshold limit. The first function 606 can include the form fmax=aIctr+ b, wherein, fmaxIs the maximum intensity threshold, I, of the voxel in a plane perpendicular to the centerline defined by the diameter determined by the calculated sub-resolutionctrIs the intensity of the voxel at the centerline, and a and b are constants calculated by linear regression analysis. The minimum intensity 600 is brighter and a second function 602 is fitted to the minimum intensity 600 to derive a minimum intensity threshold. The second function 602 can include the form fmin=cIctr+ d, wherein, IminIs the minimum intensity, I, of a voxel in a plane perpendicular to the centerlinectrIs the intensity of the voxel at the centerline, and c and d are constants calculated by linear regression analysis. The model is different from a global value, such as a value derived from the aortic intensity or a value derived from the value of the centerline (e.g., an average of the centerline values).
Referring to fig. 7, a graphical example of plotted varying intensities 700 and a fitted linear function 702 of a lumen cross-section is shown. The model includes a fitting function 702 of the variance of the sampled centerline cross-sectional intensities. Centerline intensity is represented on the horizontal or x-axis in units of HU, and variance (e.g., standard deviation) is represented on the vertical or y-axis in units of HU. A third function 702 is fitted to the variance of the samples. The third function 702 can include the form fvar=eIctr+ f wherein, IvarIs the variance of the intensity of the voxels in a plane perpendicular to the centerline, IctrIs the intensity of the voxel at the centerline, and e and f are constants calculated by linear regression analysis.
Referring to fig. 8, an exemplary method of sub-resolution luminal narrowing detection and segmentation is illustrated in a flow chart. At 800, luminal narrowing is detected from image data, such as CCTA data, and vessel centerlines to calculate a sub-resolution determined lumen diameter. The visible lumen diameter is approximated from the image data and the centerline using FWHM rules and/or other methods. The intensity profile is sampled at a cross-section along the centerline. The centerline intensity profile is analyzed as described with reference to fig. 3, 4 and 5. Narrowing is detected as described with reference to fig. 4 and 5, which includes narrowing detected by intensities below a minimum threshold and intensities above a maximum threshold. Based on the detected narrowing and the approximated visible lumen diameter, a sub-resolution determined diameter for a cross-section along the centerline is calculated.
At 806, voxel-wise intensity limits are derived from the centerline intensity profile and a function of the trained model. Examples of functions of the trained model are described with reference to fig. 6 and 7.
At 810, a graph is constructed based on the likelihood based on voxel-wise intensity, the likelihood based on voxel-wise diameter, smoothness penalty, and optimization. The pattern is cut into two parts by a minimum cut segmentation algorithm. One portion defines a segmented lumen 812 and one portion is background, e.g., an undivided lumen. The segmented lumen 812 is represented as a three-dimensional spatial model, e.g., a coronary lumen.
Referring to fig. 9, an exemplary method of approximating a visible lumen diameter is illustrated in a flow chart. At 900, an image volume having a centerline of a generated blood vessel is received. At 902, a cross-section is sampled along a centerline. Each cross-section is sampled with rays of a plane of the cross-section and the rays are at k angles, where k is an integer > 0.
At 904, for each cross section, a lower threshold is calculated using FWHM rules. At 906, for each cross section, an upper threshold is calculated using a constant (e.g., a lower threshold of 2.3 times).
At 908, outliers, such as rays at an angle, below a lower or upper threshold are eliminated from each cross-section. At 910, a diameter is estimated for each remaining angle in the cross-section.
At 912, an approximate visible diameter is calculated from the estimated diameter at the remaining angles for each cross-section, e.g., median diameter, mean diameter, etc.
At 914, the approximate visible diameter at the cross-section along the centerline can be filtered. The filtering can use a smoothing filter, such as averaging over the cross-section, which smoothes the change in diameter from cross-section to approximation of the cross-section.
Referring to fig. 10, an exemplary method of detecting sub-resolution luminal narrowing is illustrated in a flow chart. At 1000, an image volume having a generated vessel centerline and an estimated approximate visible diameter of a lumen is received.
At 1002, an upper intensity threshold and a lower intensity threshold are determined. The upper threshold can be determined from the strength of the aortic lumen. The lower threshold can be determined from the strength of the centerline.
At 1004, a multiscale second derivative of the centerline profile is calculated.
At 1006, detection narrows. Intensity values that are greater than the maximum threshold and have a second derivative that is negative (e.g., a local maximum) identify a narrowing due to calcium blooming at a cross-section along the centerline. Intensity values that are less than a minimum threshold and have a second derivative that is positive (e.g., a local minimum) identify a narrowing detected at a cross-section along the centerline based on intensity.
At 1008, the approximated visible diameter is corrected based on the detected narrowing based on the narrowing according to the reduced intensity or the narrowing due to calcium blooming to calculate a sub-resolution determined diameter at each cross section.
The above may be implemented in the form of computer readable instructions encoded or embedded on a computer readable storage medium, which, when executed by a computer processor(s), cause the processor(s) to perform the described acts. Additionally or alternatively, at least one of the computer readable instructions is carried by a signal, carrier wave, or other transitory medium.
The invention has been described with reference to the preferred embodiments. Modifications and alterations may occur to others upon reading and understanding the preceding detailed description. It is intended that the invention be construed as including all such modifications and alterations insofar as they come within the scope of the appended claims or the equivalents thereof.
Claims (10)
1. An imaging system (100), comprising:
a vessel centerline generator (110) configured to receive the reconstructed image and to automatically or manually determine a centerline of a vessel lumen through a selected vessel to be segmented from the image volume from the received image;
a sub-resolution luminal narrowing detector (112) configured to detect sub-resolution narrowing of the vessel lumen in the image volume by centerline contour analysis and to calculate a sub-resolution determined diameter by correcting the approximated visible lumen diameter with the detected sub-resolution narrowing, wherein detecting sub-resolution narrowing means detecting narrowing of the vessel lumen with greater accuracy than the visible resolution of the imaging system;
wherein the centerline profile analysis detects narrowing based on intensity profiles of rays in a cross-section along the centerline of the segmented vessel lumen that are below a lower intensity threshold and/or greater than an upper intensity threshold;
wherein the approximate visible lumen diameter is determined from a diameter calculated using a full width half maximum intensity of the intensity profile for each cross section along the centerline of the segmented vessel lumen,
a graph minimum cut variation segmenter (114) configured to construct and cut a graph with each voxel in a segmented region represented by nodes, each node connected to a lumen node and a background node, and each node connected to an edge utilization likelihood L of the lumen nodeiAnd possibility LdIs weighted, wherein the likelihood LiA likelihood for the voxel according to the intensity of the closest centerline voxel and the trained model being part of a segmented vessel lumen, the likelihood LdA likelihood that a diameter determined for the voxel based on a spatial distance of the voxel from a closest centerline point and a sub-resolution is part of the segmented vessel lumen, and edges connecting each node to the background node are passed through 1-Li*LdThe weighting is performed and edges between neighboring voxels are weighted by a smoothness penaltyAnd cutting the graph divides the graph into a first portion connected to the lumen node and a second portion connected to the background node based on a minimum cost, and the nodes in the first portion segment the vessel lumen.
2. The imaging system (100) of claim 1, wherein for determining the likelihood LiThe trained model of (a) models a characteristic of voxel intensity in a cross section along the centerline.
3. The imaging system (100) of claim 2, wherein the trained model includes a function fitted to a minimum voxel intensity of a cross-section along the centerline.
4. The imaging system (100) according to either one of claims 2 and 3, wherein the trained model includes a function fitted to maximum voxel intensities of cross-sections along the centerline.
5. The imaging system (100) according to any one of claims 1-3, wherein the trained model includes a first function of the intensity of the closest centerline voxel, and the likelihood LiIs calculated using the first function.
6. The imaging system (100) according to any one of claims 1-3, wherein the likelihood LdIs calculated using a second function of the spatial distance of the voxel from the closest centerline point and the sub-resolution determined diameter.
7. A method of segmenting a luminal vessel comprising:
receiving the reconstructed image and automatically or manually determining a centerline of the vessel lumen through the selected vessel to be segmented from the image volume from the received image;
detecting (1006) sub-resolution narrowing using centerline contour analysis of an approximated visible lumen diameter in the vessel lumen in the image volume, wherein detecting sub-resolution narrowing means detecting narrowing of the vessel lumen with greater accuracy than a visible resolution of an imaging system;
calculating (1008) a sub-resolution determined diameter by modifying the approximated visible lumen diameter based on the detected sub-resolution narrowing;
wherein the centerline profile analysis detects narrowing based on intensity profiles of rays in a cross-section along the centerline of the segmented vessel lumen that are below a lower intensity threshold and/or greater than an upper intensity threshold;
wherein the approximate visible lumen diameter is determined from a diameter calculated using a full width half maximum intensity of the intensity profile for each cross section along the centerline of the segmented vessel lumen,
cutting (810) a constructed graph using a minimum cut algorithm and cutting the graph using a cut, and the constructed graph comprises nodes representing each voxel in a segmented region, each node being connected to a lumen node and a background node, and an edge utilization likelihood, L, connecting each node to the lumen nodeiAnd possibility LdIs weighted, wherein the likelihood LiA likelihood for the voxel according to the intensity of the closest centerline voxel and the trained model being part of a segmented vessel lumen, the likelihood LdA likelihood that a diameter determined for the voxel based on a spatial distance of the voxel from a closest centerline point and a sub-resolution is part of the segmented vessel lumen, and edges connecting each node to the background node are passed through 1-Li*LdWeighting and edges between adjacent voxels are weighted with a smoothness penalty, and said cutting said graph using cuts divides said graph into a first portion connected to said lumen node and a second portion connected to said background node based on a minimum costAnd the node in the first portion generates a volume of the segmented vessel lumen.
8. The method of claim 7, wherein for determining the likelihood LiThe trained model of (a) modeling a characteristic of voxel intensity in a cross section along the centerline; and optionally wherein the trained model comprises a function fitted to the minimum voxel intensity of a cross-section along the centerline and a function fitted to the maximum voxel intensity of a cross-section along the centerline.
9. The method according to any one of claims 7-8, wherein the trained model includes a first function of the intensity of the closest centerline voxel, and the likelihood LiIs calculated using the first function.
10. The method of any one of claims 7-8, wherein the likelihood LdIs calculated using a second function of the spatial distance of the voxel from the closest centerline point and the sub-resolution determined diameter.
Applications Claiming Priority (3)
| Application Number | Priority Date | Filing Date | Title |
|---|---|---|---|
| US201562104100P | 2015-01-16 | 2015-01-16 | |
| US62/104,100 | 2015-01-16 | ||
| PCT/IB2016/050156 WO2016113690A1 (en) | 2015-01-16 | 2016-01-14 | Vessel lumen sub-resolution segmentation |
Publications (2)
| Publication Number | Publication Date |
|---|---|
| CN107111876A CN107111876A (en) | 2017-08-29 |
| CN107111876B true CN107111876B (en) | 2021-01-05 |
Family
ID=55273303
Family Applications (1)
| Application Number | Title | Priority Date | Filing Date |
|---|---|---|---|
| CN201680005546.3A Active CN107111876B (en) | 2015-01-16 | 2016-01-14 | Vessel lumen sub-resolution segmentation |
Country Status (5)
| Country | Link |
|---|---|
| US (1) | US10580141B2 (en) |
| EP (1) | EP3245632B1 (en) |
| JP (1) | JP6653706B2 (en) |
| CN (1) | CN107111876B (en) |
| WO (1) | WO2016113690A1 (en) |
Families Citing this family (3)
| Publication number | Priority date | Publication date | Assignee | Title |
|---|---|---|---|---|
| WO2018208927A1 (en) | 2017-05-09 | 2018-11-15 | Heartflow, Inc. | Systems and methods for anatomic structure segmentation in image analysis |
| US10885630B2 (en) * | 2018-03-01 | 2021-01-05 | Intuitive Surgical Operations, Inc | Systems and methods for segmentation of anatomical structures for image-guided surgery |
| CA3209582A1 (en) * | 2021-01-26 | 2022-08-04 | Fluidda Respi Nv | Method for dimensional measurement of a vessel |
Citations (2)
| Publication number | Priority date | Publication date | Assignee | Title |
|---|---|---|---|---|
| US5872861A (en) * | 1993-07-22 | 1999-02-16 | U.S. Philips Corporation | Digital image processing method for automatic detection of stenoses |
| CN101541242A (en) * | 2006-11-30 | 2009-09-23 | 皇家飞利浦电子股份有限公司 | Visualizing a vascular structure |
Family Cites Families (37)
| Publication number | Priority date | Publication date | Assignee | Title |
|---|---|---|---|---|
| JPH0765154A (en) * | 1993-08-31 | 1995-03-10 | Toshiba Corp | Device and method for quantitatively analyzing blood vessel image |
| EP0796059B1 (en) * | 1995-10-06 | 2007-01-17 | Koninklijke Philips Electronics N.V. | Determining a dimension from a density distribution |
| JP4421203B2 (en) * | 2003-03-20 | 2010-02-24 | 株式会社東芝 | Luminous structure analysis processing device |
| CA2564240C (en) * | 2004-04-26 | 2014-10-07 | David F. Yankelevitz | Medical imaging system for accurate measurement evaluation of changes in a target lesion |
| US20060079746A1 (en) * | 2004-10-11 | 2006-04-13 | Perret Florence M | Apparatus and method for analysis of tissue classes along tubular structures |
| US7711165B2 (en) | 2005-07-28 | 2010-05-04 | Siemens Medical Solutions Usa, Inc. | System and method for coronary artery segmentation of cardiac CT volumes |
| DE102006002259A1 (en) * | 2006-01-17 | 2007-07-19 | Siemens Ag | Heart blood vessel examining method for cardiac infarction patient, involves generating signals based on sequence of determined blood vessel diameters, where change of blood vessel diameters is observed by signals |
| US7990379B2 (en) | 2006-10-25 | 2011-08-02 | Siemens Aktiengesellschaft | System and method for coronary segmentation and visualization |
| US8077939B2 (en) * | 2006-11-22 | 2011-12-13 | General Electric Company | Methods and systems for enhanced plaque visualization |
| US20090012382A1 (en) * | 2007-07-02 | 2009-01-08 | General Electric Company | Method and system for detection of obstructions in vasculature |
| JP5523681B2 (en) * | 2007-07-05 | 2014-06-18 | 株式会社東芝 | Medical image processing device |
| EP2219520B1 (en) | 2007-10-31 | 2012-12-12 | Cabra Technology A/S | Method for calculating pressures in a fluid stream through a tube section, especially a blood vessel with atherosclerotic plaque |
| US8126232B2 (en) | 2008-03-05 | 2012-02-28 | Siemens Aktiengesellschaft | System and method for 3D vessel segmentation with minimal cuts |
| JP2010000306A (en) * | 2008-06-23 | 2010-01-07 | Toshiba Corp | Medical image diagnostic apparatus, image processor and program |
| US8094898B2 (en) * | 2008-07-16 | 2012-01-10 | Siemens Medical Solutions Usa, Inc. | Functional image quality assessment |
| US8077954B2 (en) * | 2008-08-04 | 2011-12-13 | Siemens Aktiengesellschaft | System and method for image processing |
| DE102009023504A1 (en) * | 2009-06-02 | 2010-12-09 | Siemens Aktiengesellschaft | Method for determination of dimensional value of e.g. blockages of wall of hollow organ, involves determining dimension value based on profile process curve and ideal profile value |
| US20180344174A9 (en) * | 2009-09-23 | 2018-12-06 | Lightlab Imaging, Inc. | Lumen Morphology and Vascular Resistance Measurements Data Collection Systems, Apparatus and Methods |
| US8675941B2 (en) * | 2010-09-30 | 2014-03-18 | Siemens Aktiengesellschaft | Method for visualization of airway anatomical changes |
| AU2012207076A1 (en) * | 2011-01-20 | 2013-08-15 | University Of Iowa Research Foundation | Automated determination of arteriovenous ratio in images of blood vessels |
| US10186056B2 (en) * | 2011-03-21 | 2019-01-22 | General Electric Company | System and method for estimating vascular flow using CT imaging |
| US8600132B2 (en) * | 2011-05-03 | 2013-12-03 | General Electric Company | Method and apparatus for motion correcting medical images |
| WO2013031741A1 (en) * | 2011-08-26 | 2013-03-07 | イービーエム株式会社 | System for diagnosing bloodflow characteristics, method thereof, and computer software program |
| JP6204927B2 (en) | 2012-02-14 | 2017-09-27 | コーニンクレッカ フィリップス エヌ ヴェKoninklijke Philips N.V. | Method and computing system for generating image data |
| JP6101048B2 (en) * | 2012-02-20 | 2017-03-22 | キヤノン株式会社 | Image processing apparatus and image processing method |
| US9943233B2 (en) * | 2012-10-24 | 2018-04-17 | Cathworks Ltd. | Automated measurement system and method for coronary artery disease scoring |
| US9858387B2 (en) * | 2013-01-15 | 2018-01-02 | CathWorks, LTD. | Vascular flow assessment |
| JP6302922B2 (en) | 2012-11-06 | 2018-03-28 | コーニンクレッカ フィリップス エヌ ヴェKoninklijke Philips N.V. | Coronary flow reserve ratio (FFR) index |
| US9351698B2 (en) * | 2013-03-12 | 2016-05-31 | Lightlab Imaging, Inc. | Vascular data processing and image registration systems, methods, and apparatuses |
| US9196037B2 (en) * | 2013-03-15 | 2015-11-24 | Wake Forest University Health Sciences | Vascular territory segmentation using mutual clustering information from image space and label space |
| US10165955B2 (en) * | 2014-02-06 | 2019-01-01 | Reuven Gladshtein | Obtaining cardiovascular parameters using arterioles related transient time |
| US9943277B2 (en) * | 2014-04-02 | 2018-04-17 | International Business Machines Corporation | Detecting coronary stenosis through spatio-temporal tracking |
| US10349910B2 (en) * | 2015-03-31 | 2019-07-16 | Agency For Science, Technology And Research | Method and apparatus for assessing blood vessel stenosis |
| GB201506842D0 (en) * | 2015-04-22 | 2015-06-03 | Ucl Business Plc And Schooling Steven | Locally rigid vessel based registration for laparoscopic liver surgery |
| JP6516597B2 (en) * | 2015-07-07 | 2019-05-22 | キヤノン株式会社 | Image processing apparatus and image processing method |
| JP5890055B1 (en) * | 2015-07-09 | 2016-03-22 | 株式会社アルム | Blood vessel image processing apparatus, blood vessel image processing program, and blood vessel image processing method |
| CN109069014B (en) * | 2016-03-16 | 2021-07-06 | 哈特弗罗公司 | System and method for estimating healthy lumen diameter and stenosis quantification in coronary arteries |
-
2016
- 2016-01-14 EP EP16702447.0A patent/EP3245632B1/en active Active
- 2016-01-14 WO PCT/IB2016/050156 patent/WO2016113690A1/en active Application Filing
- 2016-01-14 CN CN201680005546.3A patent/CN107111876B/en active Active
- 2016-01-14 JP JP2017536972A patent/JP6653706B2/en active Active
- 2016-01-14 US US15/542,458 patent/US10580141B2/en active Active
Patent Citations (2)
| Publication number | Priority date | Publication date | Assignee | Title |
|---|---|---|---|---|
| US5872861A (en) * | 1993-07-22 | 1999-02-16 | U.S. Philips Corporation | Digital image processing method for automatic detection of stenoses |
| CN101541242A (en) * | 2006-11-30 | 2009-09-23 | 皇家飞利浦电子股份有限公司 | Visualizing a vascular structure |
Also Published As
| Publication number | Publication date |
|---|---|
| EP3245632B1 (en) | 2020-07-15 |
| JP2018501898A (en) | 2018-01-25 |
| US20180276828A1 (en) | 2018-09-27 |
| WO2016113690A1 (en) | 2016-07-21 |
| CN107111876A (en) | 2017-08-29 |
| EP3245632A1 (en) | 2017-11-22 |
| JP6653706B2 (en) | 2020-02-26 |
| US10580141B2 (en) | 2020-03-03 |
Similar Documents
| Publication | Publication Date | Title |
|---|---|---|
| JP6877868B2 (en) | Image processing equipment, image processing method and image processing program | |
| US9600877B2 (en) | Quantitative imaging | |
| Babin et al. | Brain blood vessel segmentation using line-shaped profiles | |
| CN107077731B (en) | Visualization of imaging uncertainty | |
| US20150063669A1 (en) | Visual suppression of selective tissue in image data | |
| CN108348206A (en) | Collateral stream for noninvasive blood flow reserve score (FFR) models | |
| EP3203914B1 (en) | Radiation dose applied to different anatomical stages | |
| Häme et al. | Adaptive quantification and longitudinal analysis of pulmonary emphysema with a hidden Markov measure field model | |
| CN107111876B (en) | Vessel lumen sub-resolution segmentation | |
| Öksüz et al. | A hybrid method for coronary artery stenoses detection and quantification in CTA images | |
| Han et al. | A fast seed detection using local geometrical feature for automatic tracking of coronary arteries in CTA | |
| US10993688B2 (en) | Method of data processing for computed tomography | |
| CN106415659B (en) | Imaging processing method and computing system | |
| EP3602487B1 (en) | Spectral imaging ffr | |
| JP7426824B2 (en) | Non-invasive imaging-based FFR interaction monitoring | |
| Hachaj et al. | Segmentation and visualization of tubular structures in computed tomography angiography | |
| EP4177843A1 (en) | Image processing device, medical imaging system and computer program element | |
| Polyanskaya et al. | Robust lumen segmentation of coronary arteries in 2D angiographic images |
Legal Events
| Date | Code | Title | Description |
|---|---|---|---|
| PB01 | Publication | ||
| PB01 | Publication | ||
| SE01 | Entry into force of request for substantive examination | ||
| SE01 | Entry into force of request for substantive examination | ||
| GR01 | Patent grant | ||
| GR01 | Patent grant |