CN101446552B - Determining fluid properties from fluid analyzer - Google Patents
Determining fluid properties from fluid analyzer Download PDFInfo
- Publication number
- CN101446552B CN101446552B CN2008101817029A CN200810181702A CN101446552B CN 101446552 B CN101446552 B CN 101446552B CN 2008101817029 A CN2008101817029 A CN 2008101817029A CN 200810181702 A CN200810181702 A CN 200810181702A CN 101446552 B CN101446552 B CN 101446552B
- Authority
- CN
- China
- Prior art keywords
- methane
- fluid
- gor
- mass
- molecules
- Prior art date
- Legal status (The legal status is an assumption and is not a legal conclusion. Google has not performed a legal analysis and makes no representation as to the accuracy of the status listed.)
- Expired - Lifetime
Links
Images


Classifications
-
- E—FIXED CONSTRUCTIONS
- E21—EARTH OR ROCK DRILLING; MINING
- E21B—EARTH OR ROCK DRILLING; OBTAINING OIL, GAS, WATER, SOLUBLE OR MELTABLE MATERIALS OR A SLURRY OF MINERALS FROM WELLS
- E21B47/00—Survey of boreholes or wells
- E21B47/10—Locating fluid leaks, intrusions or movements
- E21B47/103—Locating fluid leaks, intrusions or movements using thermal measurements
-
- G—PHYSICS
- G01—MEASURING; TESTING
- G01N—INVESTIGATING OR ANALYSING MATERIALS BY DETERMINING THEIR CHEMICAL OR PHYSICAL PROPERTIES
- G01N21/00—Investigating or analysing materials by the use of optical means, i.e. using sub-millimetre waves, infrared, visible or ultraviolet light
- G01N21/17—Systems in which incident light is modified in accordance with the properties of the material investigated
- G01N21/25—Colour; Spectral properties, i.e. comparison of effect of material on the light at two or more different wavelengths or wavelength bands
- G01N21/31—Investigating relative effect of material at wavelengths characteristic of specific elements or molecules, e.g. atomic absorption spectrometry
- G01N21/35—Investigating relative effect of material at wavelengths characteristic of specific elements or molecules, e.g. atomic absorption spectrometry using infrared light
- G01N21/359—Investigating relative effect of material at wavelengths characteristic of specific elements or molecules, e.g. atomic absorption spectrometry using infrared light using near infrared light
-
- E—FIXED CONSTRUCTIONS
- E21—EARTH OR ROCK DRILLING; MINING
- E21B—EARTH OR ROCK DRILLING; OBTAINING OIL, GAS, WATER, SOLUBLE OR MELTABLE MATERIALS OR A SLURRY OF MINERALS FROM WELLS
- E21B47/00—Survey of boreholes or wells
- E21B47/10—Locating fluid leaks, intrusions or movements
- E21B47/113—Locating fluid leaks, intrusions or movements using electrical indications; using light radiations
-
- G—PHYSICS
- G01—MEASURING; TESTING
- G01N—INVESTIGATING OR ANALYSING MATERIALS BY DETERMINING THEIR CHEMICAL OR PHYSICAL PROPERTIES
- G01N21/00—Investigating or analysing materials by the use of optical means, i.e. using sub-millimetre waves, infrared, visible or ultraviolet light
- G01N21/17—Systems in which incident light is modified in accordance with the properties of the material investigated
- G01N21/25—Colour; Spectral properties, i.e. comparison of effect of material on the light at two or more different wavelengths or wavelength bands
- G01N21/31—Investigating relative effect of material at wavelengths characteristic of specific elements or molecules, e.g. atomic absorption spectrometry
- G01N21/35—Investigating relative effect of material at wavelengths characteristic of specific elements or molecules, e.g. atomic absorption spectrometry using infrared light
- G01N21/3504—Investigating relative effect of material at wavelengths characteristic of specific elements or molecules, e.g. atomic absorption spectrometry using infrared light for analysing gases, e.g. multi-gas analysis
-
- G—PHYSICS
- G01—MEASURING; TESTING
- G01N—INVESTIGATING OR ANALYSING MATERIALS BY DETERMINING THEIR CHEMICAL OR PHYSICAL PROPERTIES
- G01N21/00—Investigating or analysing materials by the use of optical means, i.e. using sub-millimetre waves, infrared, visible or ultraviolet light
- G01N21/17—Systems in which incident light is modified in accordance with the properties of the material investigated
- G01N21/25—Colour; Spectral properties, i.e. comparison of effect of material on the light at two or more different wavelengths or wavelength bands
- G01N21/31—Investigating relative effect of material at wavelengths characteristic of specific elements or molecules, e.g. atomic absorption spectrometry
- G01N21/35—Investigating relative effect of material at wavelengths characteristic of specific elements or molecules, e.g. atomic absorption spectrometry using infrared light
- G01N21/3577—Investigating relative effect of material at wavelengths characteristic of specific elements or molecules, e.g. atomic absorption spectrometry using infrared light for analysing liquids, e.g. polluted water
-
- G—PHYSICS
- G01—MEASURING; TESTING
- G01N—INVESTIGATING OR ANALYSING MATERIALS BY DETERMINING THEIR CHEMICAL OR PHYSICAL PROPERTIES
- G01N33/00—Investigating or analysing materials by specific methods not covered by groups G01N1/00 - G01N31/00
- G01N33/26—Oils; Viscous liquids; Paints; Inks
- G01N33/28—Oils, i.e. hydrocarbon liquids
- G01N33/2823—Raw oil, drilling fluid or polyphasic mixtures
Landscapes
- Physics & Mathematics (AREA)
- Life Sciences & Earth Sciences (AREA)
- Chemical & Material Sciences (AREA)
- Engineering & Computer Science (AREA)
- Spectroscopy & Molecular Physics (AREA)
- Health & Medical Sciences (AREA)
- General Health & Medical Sciences (AREA)
- Pathology (AREA)
- Immunology (AREA)
- General Physics & Mathematics (AREA)
- Analytical Chemistry (AREA)
- Biochemistry (AREA)
- Geology (AREA)
- Mining & Mineral Resources (AREA)
- Environmental & Geological Engineering (AREA)
- Geophysics (AREA)
- Fluid Mechanics (AREA)
- General Life Sciences & Earth Sciences (AREA)
- Geochemistry & Mineralogy (AREA)
- Food Science & Technology (AREA)
- Chemical Kinetics & Catalysis (AREA)
- General Chemical & Material Sciences (AREA)
- Medicinal Chemistry (AREA)
- Oil, Petroleum & Natural Gas (AREA)
- Sampling And Sample Adjustment (AREA)
- Investigating Or Analysing Materials By Optical Means (AREA)
Abstract
一种确定地质层流体特性的方法包括:多次获得流体样本的与甲烷峰值光密度和油峰值光密度相关的数据,基于数据每一次用多次获得的流体样本的甲烷峰值光密度对油峰值光密度计算流体样本的视在气—油—比率,选择能使气—油—比率增加的取样参数的幂函数,基于数据计算幂函数的指数常量,和确定从包含无污染气—油—比率和污染度的一组数据中选择的至少一个。
A method of determining a fluid characteristic of a geological formation comprising: obtaining data related to peak methane optical density and peak oil density of a fluid sample multiple times, based on the correlation between the peak methane optical density of the fluid sample obtained multiple times and the peak oil density based on each of the data. Calculates the apparent gas-oil-ratio of a fluid sample by optical density, selects a power function for sampling parameters that increase the gas-oil-ratio, calculates the exponential constant of the power function based on the data, and determines the and at least one selected from a set of data of pollution degree.
Description
本申请是申请号为2004100352609,申请日为2004年3月27号,发明名称为“用流体分析仪确定流体特性”的分案申请。This application is a divisional application with the application number 2004100352609, the filing date being March 27, 2004, and the title of the invention being "determining fluid properties with a fluid analyzer".
技术领域technical field
背景技术Background technique
人们通常将井钻到地下以获得碳氢化合物的自然沉淀物和其他埋藏在地壳的地质层里的有用物质,他们从地面的钻探设备直接钻一个井到地下的目标地质位置。People usually drill wells into the ground to obtain natural deposits of hydrocarbons and other useful materials buried in geological layers of the earth's crust. They drill a well directly from the surface drilling equipment to the target geological location underground.
在钻井钻到一个感兴趣的地层时,钻井者经常通过从地层中提取用于分析的流体样本来对地质层流体进行研究。对流体样本的分析可以提供关于流体体积、密度、粘性、沸点和其他重要特性的信息。这些重要信息可用于油田计划的确定,和上游、下游生产设备的优化。When a well is drilled into a formation of interest, the driller often studies the formation fluids by extracting fluid samples from the formation for analysis. Analysis of fluid samples can provide information about fluid volume, density, viscosity, boiling point, and other important properties. These important information can be used to determine the oil field plan, and optimize the upstream and downstream production equipment.
一个特别重要的流体特性是气—油—比率(“GOR”)。GOR是在标准条件下(标准条件是60℉和1atm)天然地质层流体中气相的体积与液体碳氢化合物的体积之比。GOR的标准单位是在标准条件下(scf/bbl)每桶油所含气体的标准立方尺,即标准条件下每桶油的气体立方尺。在设计上游和下游的生产设备时GOR是很重要的。例如,如果GOR高,地面设备必须被设计成能处理来自井内的大量气体。One particularly important fluid property is the gas-oil-ratio ("GOR"). GOR is the ratio of the volume of the gaseous phase to the volume of liquid hydrocarbons in natural geological formation fluids at standard conditions (standard conditions are 60°F and 1 atm). The standard unit of GOR is standard cubic feet of gas per barrel of oil under standard conditions (scf/bbl), that is, gas cubic feet per barrel of oil under standard conditions. GOR is important when designing upstream and downstream production facilities. For example, if the GOR is high, surface equipment must be designed to handle the large volume of gas coming from the well.
通常地,一个流体样本是通过将流体取样工具放入到井里并从一个地层提取流体样本而获得的。有一种取样工具是Modular Formation DynamicsTester(MDT)(标准地质层动力学试验仪),它是Schlumberger TechnologyCorporation(技术公司)注册的商标,这个公司是本发明的受让人。地质层试验工具已在Zimmerman等人的美国专利Nos.4860581和4936139中公开,这些专利已转让给本发明的受让人。Typically, a fluid sample is obtained by placing a fluid sampling tool into a well and extracting a fluid sample from a formation. One such sampling tool is the Modular Formation Dynamics Tester (MDT), which is a registered trademark of Schlumberger Technology Corporation, the assignee of the present invention. Geological formation testing tools are disclosed in US Patent Nos. 4,860,581 and 4,936,139 to Zimmerman et al., assigned to the assignee of the present invention.
图1示出了一种设计用来从地质层114提取流体样本的地质层试验工具101。工具101悬挂在钻孔110里的运输器具115,例如绕在地面卷轴上的电线或多心电缆上。在地面,电线115通常与监测和控制工具101的电控制系统118连接。FIG. 1 shows a geological
一旦到达预定深度,工具101用来获得地质层的流体样本。工具101具有一个探头120,或一个从工具101选择性伸展的流体容纳装置,和一个位于工具101相反侧上的、同样也选择性伸展的固定部件121。探头120从工具101上伸展并与钻孔壁112密封接触,这样探头120就可以与地质层114之间进行流体传送。典型的工具101还包括一个泵(未示出)。泵用于从地质层把地质层流体泵入工具101。泵还可用于从工具101把地质层流体泵入钻孔110。Once a predetermined depth is reached,
这样就有一个与流体取样有关的问题,就是地质层流体通常会被泥浆滤液污染。泥浆滤液是钻井过程中渗漏到地质层里的钻探泥浆的流体成分。泥浆滤液侵入地质层并污染天然地质层流体。当流体样本从地质层取出时,样本从一开始就包括泥浆滤液。Thus there is a problem associated with fluid sampling in that formation fluids are often contaminated with mud filtrate. Mud filtrate is the fluid component of drilling mud that seeps into geological formations during drilling. Mud filtrate invades formations and contaminates natural formation fluids. When a fluid sample is taken from a geological formation, the sample includes mud filtrate from the start.
为解决这一问题,流体样本通常从地质层中取出并且泵入钻孔或者泵入工具里一个大的、没用的腔室,直至取出的流体已被“净化”。“净化”样本是这样一种物质,即在样品流体中泥浆滤液的百分比低至这种流体可以代表天然地质层流体的容许程度为止。此刻,可收集样本用作随后的分析。To solve this problem, a fluid sample is usually withdrawn from the geological formation and pumped into a borehole or into a large, unused chamber in the tool until the withdrawn fluid has been "cleaned". A "cleaned" sample is one in which the percentage of mud filtrate in the sample fluid is as low as is acceptable for the fluid to be representative of natural geological formation fluids. At this point, samples can be collected for subsequent analysis.
再参照图1,用探头120从地质层114中把地质层流体取出,并且在用泵装置(未示出)将流体泵出工具101注入钻孔之前,流体流经一个流体分析仪125。流体分析仪125分析样本流体并确定泥浆滤液污染的程度。一旦由探头抽取的地质层流体是干净的,样本就可以通过将流体样本泵入样本腔室122、123中的一个来获得。Referring again to FIG. 1, formation fluid is withdrawn from
一种用于地质层试验工具的流体分析仪是光学传感器,它可以在几个不同波长上测量样本流体的光密度(“OD”)。用于油基泥浆(“OBM”)的油通常是浅颜色的,这样,随着样本流体的净化,色通道上的OD会逐渐增加到较深色的天然地质层流体的OD。One type of fluid analyzer used in geological formation testing tools is an optical sensor that measures the optical density ("OD") of a sample fluid at several different wavelengths. The oils used in oil-based muds ("OBMs") are generally light in color so that, as the sample fluid purifies, the OD on the color channel gradually increases to that of the darker natural formation fluid.
两种吸收机构用于测量流体样本的OD:电子激励和分子振动模式激励。当传送入射光的能量把移位pi电子激励至反束缚状态时,将产生电子激励吸收。这个能量等级通常相当于可视的近红外线范围,结果会产生一个颜色阴影。此后,我们在本文中简单地称这种吸收方式为颜色。石油可以呈现出不同的颜色,因为它们具有不同数量的芳香族环烃、树脂和沥青烯,其中每一种物质吸收可见光和近红外光(NIR)范围内的光。重油具有比较高的芳香族环烃、树脂和沥青烯含量百分比,这使它们呈现为黑色。另一方面,轻油和凝聚物具有比较浅的淡黄色,这是因为它们具有比较低的芳香族环烃、树脂和沥青烯含量百分比。Two absorption mechanisms are used to measure the OD of fluid samples: electronic excitation and molecular vibrational mode excitation. Electronically stimulated absorption occurs when the energy of the transmitted incident light excites the displaced pi electrons to the antibound state. This energy level is usually equivalent to the visible near-infrared range, resulting in a shade of color. Henceforth, we simply refer to this mode of absorption as color in this paper. Oils can take on different colors because they have varying amounts of aromatic ring hydrocarbons, resins and asphaltene, each of which absorbs light in the visible and near-infrared (NIR) range. Heavy oils have relatively high percentages of aromatic cyclic hydrocarbons, resins, and asphaltenes, which give them their black color. On the other hand, light oils and coagulates have a lighter yellowish color because they have lower percentages of aromatic cyclic hydrocarbons, resins, and asphaltenes.
由于分子的化学键共振,分子振动吸收是对特定频率光的吸收。当颜色吸收覆盖可见光和NIR范围时,只有对特定物质的特定波长才会产生分子振动吸收。对于任何给定分子,产生分子振动吸收的波长与化学键和分子结构的种类有关。例如,油的分子振动吸收峰值在波长1200nm、1400nm、和1700nm附近。分子振动吸收是某种特定物质百分含量的函数,并且不必受这种物质所处物态的影响。例如,不管甲烷是气态或是溶解在油里,甲烷的吸收共振峰值(大约1670nm)都是相同的。Molecular vibrational absorption is the absorption of light of a specific frequency due to the resonance of the chemical bonds of the molecules. While color absorption covers the visible and NIR range, molecular vibrational absorption occurs only for specific wavelengths of specific substances. For any given molecule, the wavelength at which molecular vibrational absorption occurs is related to the type of chemical bond and molecular structure. For example, oil has molecular vibration absorption peaks around wavelengths of 1200 nm, 1400 nm, and 1700 nm. Molecular vibrational absorption is a function of the percentage of a particular substance and is not necessarily affected by the state of the substance. For example, the absorption resonance peak (around 1670 nm) of methane is the same regardless of whether methane is gaseous or dissolved in oil.
一种光学传感器是光学流体分析仪(OFA)(Optical Fluid Analyzer),商标为Schlumberger。OFA在近红外光(NRI)和可见光范围内以10个不同的波长测量样本流体的OD。当流体第一次从地质层中取出时,样本流体主要包括浅颜色的OBM滤液。随着样本流体的净化,样本流体将包含更多的较深颜色的天然地质层流体。随着流体的净化,色通道上的流体样本的OD将变化。例如,由于地质层流体的颜色比OBM滤液的颜色深,随着流体样本的提取,在色通道上的流体样本的OD将增加,色通道上的OD将逐渐接近地质层流体的OD。One type of optical sensor is the Optical Fluid Analyzer (OFA) (Optical Fluid Analyzer), trademarked by Schlumberger. OFA measures the OD of a sample fluid at 10 different wavelengths in the near-infrared (NRI) and visible range. When the fluid was first withdrawn from the geological formation, the sample fluid consisted mainly of light colored OBM filtrate. As the sample fluid purifies, the sample fluid will contain more of the darker colored natural formation fluid. As the fluid purifies, the OD of the fluid sample on the color channel will change. For example, since the color of the geological layer fluid is darker than that of the OBM filtrate, as the fluid sample is extracted, the OD of the fluid sample on the color channel will increase, and the OD on the color channel will gradually approach the OD of the geological layer fluid.
通过多次获得OD数据,利用数学方法计算所测OD的趋近值确定天然地质层流体的OD,称为“无污染”OD。这里所说的“无污染”表示天然地质层流体特性,基本上没有泥浆滤液的的污染。这样,“无污染GOR”表示没有或几乎没有泥浆滤液污染的地质层流体的GOR。尽管实际上获得没有泥浆滤液污染的流体样本是困难的,但是目的是确定地质层流体的特性。“视在”这个词用来指样本处理过程中所取得的测量值。那么,“视在GOR”是从地质层中提取的流体样本的GOR测量值。视在GOR可以受到泥浆滤液或其他污染物的影响。The OD of the natural geological layer fluid is determined by calculating the approximate value of the measured OD by mathematical methods, which is called "pollution-free" OD. The "pollution-free" mentioned here refers to the fluid characteristics of natural geological formations, basically without the pollution of mud filtrate. Thus, "contamination-free GOR" means the GOR of geological formation fluids with little or no mud filtrate contamination. Although it is practically difficult to obtain fluid samples free from mud filtrate contamination, the goal is to determine the properties of the geological formation fluids. The term "apparent" is used to refer to measurements taken during sample processing. "Apparent GOR", then, is the GOR measurement of a fluid sample taken from a geological formation. Apparent GOR can be affected by mud filtrate or other contaminants.
一旦无污染OD预先确定,就可以基于所测的OD和无污染的OD确定样本流体中的OBM滤液污染量。确定流体样本中OBM污染的方法已经公开,例如Mullins的美国专利No.5266800,该专利已转让给本发明的受让人。Once the contamination-free OD is predetermined, the amount of OBM filtrate contamination in the sample fluid can be determined based on the measured OD and the contamination-free OD. Methods for determining OBM contamination in fluid samples are disclosed, for example, in US Patent No. 5,266,800 to Mullins, which is assigned to the assignee of the present invention.
另一种光学传感器叫现场流体分析仪(LFA)(Live Fluid Analyzer),商标为Schlumberger。LFA不同于OFA,因为LFA包括一个“甲烷峰值”波长的甲烷通道和一个“油峰值”波长的油通道,“甲烷峰值”是甲烷的分子振动吸收峰值,其波长相当于甲烷分子C—H键的共振波长。一种甲烷分子振动吸收峰值的波长大约为1670nm。分子振动吸收的发生不受流体颜色的影响,也不管甲烷是处在气态还是溶解在地质层流体里。相似地,“油峰值”是油的分子振动吸收峰值,它的波长相当于油分子中的—CH2—和—CH3基化合物的共振波长。一种油峰值波长大约为1720nm。Another optical sensor is called live fluid analyzer (LFA) (Live Fluid Analyzer), the trademark is Schlumberger. LFA is different from OFA because LFA includes a methane channel at the wavelength of "methane peak" and an oil channel at the wavelength of "oil peak". The "methane peak" is the molecular vibration absorption peak of methane, and its wavelength is equivalent to the C—H bond of methane molecules the resonant wavelength. A methane molecular vibration absorption peak wavelength is about 1670nm. Molecular vibrational absorption occurs independently of fluid color, and regardless of whether methane is in the gaseous state or dissolved in geological formation fluids. Similarly, the "oil peak" is the molecular vibrational absorption peak of oil, and its wavelength corresponds to the resonance wavelength of -CH 2 - and -CH 3 -based compounds in oil molecules. One oil peak wavelength is about 1720nm.
通常,OBM不含甲烷,因此随着从地质层中提取流体样本,甲烷峰值上的OD将增加。甲烷峰值的OD将逐渐接近地质层流体的甲烷峰值上的OD。根据地质层流体的组成不同,在油通道上的流体样本的OD可能增加或减小。不管怎样,它将逐渐接近地质层流体油通道上的OD。Typically, OBMs do not contain methane, so as fluid samples are drawn from geological formations, the OD on the methane peak will increase. The OD of the methane peak will gradually approach the OD on the methane peak of the geological formation fluid. Depending on the composition of the formation fluid, the OD of the fluid sample in the oil channel may increase or decrease. Either way, it will gradually approach the OD on the fluid oil channel of the geological formation.
另一种传感器叫凝聚物和气体分析仪(CGA),其商标为Schlumberger。CGA利用特定频率上的光通道得到对存在于流体样本中的气体范围的更好评价。例如,典型的CGA具有一个与二氧化碳的分子振动吸收共振峰值相对应的通道。典型的CGA能确定甲烷、非甲烷气体碳氢化合物、二氧化碳和液体碳氢化合物的质量百分比。Another sensor is called Condensate and Gas Analyzer (CGA), which is trademarked by Schlumberger. CGA utilizes optical channels at specific frequencies to obtain a better estimate of the range of gases present in a fluid sample. For example, a typical CGA has a channel corresponding to the resonance peak of the molecular vibrational absorption of carbon dioxide. A typical CGA can determine the mass percent of methane, non-methane gaseous hydrocarbons, carbon dioxide, and liquid hydrocarbons.
然而这些分析仪提供的都是用来监测地质层流体中的各种成分以及地质层流体中泥浆滤液污染度的传统方法,所以,希望为这种监测提供更加灵敏并且受泵速影响更小的方法。However, these analyzers provide traditional methods for monitoring the various components in formation fluids and mud filtrate contamination in formation fluids, so it is desirable to provide such monitoring with a more sensitive and less affected by pump speed. method.
发明内容Contents of the invention
在本发明的一个或多个实施例中,本发明涉及一种确定地质层流体特性的方法,其包括多次获得流体样本的与甲烷峰值上的光密度和油峰值上的光密度相关的数据,和每一次由多次获得的流体样本的甲烷峰值上的光密度和油峰值上的光密度计算视在气—油—比率。这种方法还包括选择气—油—比率成长的取样参数的幂函数,根据所测的数据计算幂函数的指数常量,和确定从包含无污染气—油—比率和污染度的一组数据中选择的至少一个。在某些实施例中,取样参数可以从历经时间、泵出时间和泵出体积中选择。In one or more embodiments of the invention, the invention relates to a method of determining a fluid characteristic of a geological formation comprising obtaining data relating to the optical density at the methane peak and the optical density at the oil peak of a fluid sample multiple times , and each time the apparent gas-oil-ratio was calculated from the optical density at the methane peak and the optical density at the oil peak for multiple acquisitions of the fluid sample. This method also includes selecting the power function of the sampling parameters of the gas-oil-ratio growth, calculating the exponential constant of the power function from the measured data, and determining the gas-oil-ratio from a set of data containing pollution-free gas-oil-ratio and pollution degree. Choose at least one. In some embodiments, sampling parameters can be selected from elapsed time, pump-out time, and pump-out volume.
在本发明的一个或多个实施例中,本发明涉及一种确定地质层流体特性的方法,其包括多次获得流体样本的与甲烷峰值上的光密度和油峰值上的光密度相关的数据,基于数据多次计算样本流体的视在气—油—比率,和选择能使视在气—油—比率增加的取样参数的指数函数。本方法还包括线性外推气—油—比曲线至一个点,在这个点指数函数对于取样参数的导数为零。在某些实施例中,取样参数可以从历经时间、泵出时间和泵出体积中选择。In one or more embodiments of the invention, the invention relates to a method of determining a fluid characteristic of a geological formation comprising obtaining data relating to the optical density at the methane peak and the optical density at the oil peak of a fluid sample multiple times , multiple calculations of the apparent gas-oil-ratio of the sample fluid based on the data, and an exponential function for selecting sampling parameters that increase the apparent gas-oil-ratio. The method also includes linearly extrapolating the gas-oil-ratio curve to a point where the derivative of the exponential function with respect to the sampled parameter is zero. In some embodiments, sampling parameters can be selected from elapsed time, pump-out time, and pump-out volume.
在本发明的一个或多个实施例中,本发明涉及一种确定流体样本的气—油—比率的方法,其包括多次获得与甲烷质量成分、非甲烷气态碳氢化合物质量成分、液态碳氢化合物质量成分和二氧化碳质量成分有关的数据。这种方法还包括用甲烷质量成分、非甲烷气态碳氢化合物质量成分和二氧化碳质量成分与液态碳氢化合物质量成分的比率来确定气—油—比率。在某些实施例中,利用甲烷质量成分、非甲烷气态碳氢化合物质量成分、液态碳氢化合物质量成分和二氧化碳质量成分的函数确定气—油—比率。在至少一个实施例中,该函数是基于对地质层流体组成成分的假设。In one or more embodiments of the present invention, the present invention relates to a method of determining the gas-oil-ratio of a fluid sample, which comprises obtaining multiple times the mass fraction of methane, the mass fraction of non-methane gaseous hydrocarbons, the mass fraction of liquid carbon Data relating to mass composition of hydrogen compounds and mass composition of carbon dioxide. The method also includes using ratios of methane mass fraction, non-methane gaseous hydrocarbon mass fraction, and carbon dioxide mass fraction to liquid hydrocarbon mass fraction to determine the gas-oil-ratio. In certain embodiments, the gas-oil-ratio is determined using a function of methane mass fraction, non-methane gaseous hydrocarbon mass fraction, liquid hydrocarbon mass fraction, and carbon dioxide mass fraction. In at least one embodiment, the function is based on assumptions about the fluid composition of the geological formation.
在本发明的一个或多个实施例中,本发明涉及一种确定地质层流体特性的方法,其包括多次获得流体样本的与甲烷质量百分比和液态碳氢化合物质量百分比相关的数据;和每一次由多次获得的数据计算流体样本的视在甲烷质量百分比和视在液态碳氢化合物质量百分比。这种方法还包括选择一个能使视在甲烷质量百分比增加的取样参数的甲烷幂函数,选择一个能使视在液态碳氢化合物质量百分比增加或降低的取样参数的液体幂函数,基于数据确定甲烷幂函数的指数常量,基于数据确定液体幂函数的指数常量,和确定污染物体积百分比。在某些实施例中,取样参数可以从历经时间、泵出时间和泵出体积中选择。In one or more embodiments of the invention, the invention is directed to a method of determining fluid properties of a geological formation comprising obtaining data related to mass percent methane and liquid hydrocarbons for a fluid sample multiple times; and each Apparent methane mass percent and apparent liquid hydrocarbon mass percent of a fluid sample are calculated from multiple data acquisitions at one time. The method also includes selecting a methane power function of sampling parameters that increases or decreases the apparent mass percent of liquid hydrocarbons, selecting a liquid power function of sampling parameters that increases or decreases the apparent mass percent of liquid hydrocarbons, and determining methane based on the data. Exponent constant for the power function, determining the exponent constant for the liquid power function based on the data, and determining the volume percent contamination. In some embodiments, sampling parameters can be selected from elapsed time, pump-out time, and pump-out volume.
在本发明的一个或多个实施例中,本发明涉及一种确定地质层流体特性的方法,其包括多次获得流体样本的与甲烷质量百分比和液态碳氢化合物质量百分比相关的数据,和每一次由多次获得的数据计算流体样本的视在甲烷质量百分比和视在液态碳氢化合物质量百分比。这种方法还包括选择一个能使视在甲烷质量百分比增加的取样参数的甲烷指数函数,选择一个能使视在液态碳氢化合物质量百分比增加或降低的取样参数的液体指数函数,和用数据确定污染物百分比。在某些实施例中,取样参数可以从历经时间、泵出时间和泵出体积中选择。In one or more embodiments of the present invention, the present invention relates to a method of determining fluid properties of a geological formation comprising obtaining data related to mass percent methane and liquid hydrocarbons for a fluid sample multiple times, and each Apparent methane mass percent and apparent liquid hydrocarbon mass percent of a fluid sample are calculated from multiple data acquisitions at one time. The method also includes selecting a methane index function for sampling parameters that increases the apparent methane mass percent, selecting a liquid index function for sampling parameters that increase or decrease the apparent liquid hydrocarbon mass percent, and using the data to determine Pollutant percentage. In some embodiments, sampling parameters can be selected from elapsed time, pump-out time, and pump-out volume.
附图说明Description of drawings
图1所示的是先前技术的地质层试验工具的截面图。Figure 1 shows a cross-sectional view of a prior art geological formation testing tool.
图2A所示的是流体样本的色通道的数据曲线图。Figure 2A shows a data graph of a color channel of a fluid sample.
图2B所示的是流体样本的甲烷通道的数据曲线图。Figure 2B shows a graph of data from the methane channel of a fluid sample.
图2C所示的是流体样本的GOR曲线图。Figure 2C shows the GOR curve of the fluid sample.
图2D所示的是流体样本的色通道的数据曲线图。Figure 2D shows a data graph of the color channel of the fluid sample.
图2E所示的是流体样本的甲烷通道的数据曲线图。Figure 2E shows a graph of data from the methane channel of a fluid sample.
图2F所示的是流体样本的GOR曲线图。Figure 2F shows the GOR curve of the fluid sample.
图2G所示的是流体样本的色通道的数据曲线图。Figure 2G shows a data graph of the color channel of the fluid sample.
图2H所示的是流体样本的甲烷通道的数据曲线图。Figure 2H is a graph of data for the methane channel of a fluid sample.
图2I所示的是流体样本的GOR曲线图。Figure 2I shows the GOR curve of the fluid sample.
图3所示的是GOR对于取样参数自然对数的自然对数与经过一合适间隔的取样参数的自然对数的关系曲线。Fig. 3 shows the relationship curve of GOR to the natural logarithm of the natural logarithm of the sampling parameter and the natural logarithm of the sampling parameter after a suitable interval.
图4所示的是GOR与取样参数的指数常量幂的关系曲线图和分析。Figure 4 shows the graph and analysis of the relationship between GOR and the exponential constant power of the sampling parameter.
图5所示的是GOR对于取样参数的导数与经过一合适间隔的GOR的关系曲线图。Fig. 5 is a graph showing the derivative of GOR with respect to sampling parameters versus GOR over a suitable interval.
图6A所示的是甲烷的质量百分比与取样参数的关系曲线图。Figure 6A shows the relationship curve between the mass percentage of methane and the sampling parameters.
图6B所示的是液态碳氢化合物的质量百分比与取样参数的关系曲线图。FIG. 6B is a graph showing the relationship between the mass percentage of liquid hydrocarbons and sampling parameters.
图7A所示的是甲烷的质量百分比对于取样参数自然对数的自然对数与经过一合适间隔的取样参数的自然对数的关系曲线图。FIG. 7A is a graph showing the relationship between the mass percentage of methane versus the natural logarithm of the natural logarithm of the sampling parameter and the natural logarithm of the sampling parameter over a suitable interval.
图7B所示的是液态碳氢化合物的质量百分比对于取样参数自然对数的自然对数与经过一合适间隔的取样参数的自然对数的关系曲线图。FIG. 7B is a graph showing the relationship between the mass percentage of liquid hydrocarbons versus the natural logarithm of the natural logarithm of the sampling parameter versus the natural logarithm of the sampling parameter over a suitable interval.
图8A所示的是甲烷的质量百分比与取样参数的指数常量幂的关系曲线图。Fig. 8A is a graph showing the relationship between the mass percentage of methane and the exponent constant power of the sampling parameter.
图8B所示的是液态碳氢化合物的质量百分比与取样参数的指数常量幂的关系曲线图。FIG. 8B is a graph showing the relationship between the mass percentage of liquid hydrocarbons and the exponent constant power of the sampling parameter.
图9A所示的是甲烷的质量百分比对于取样参数的导数与甲烷的质量百分比的关系曲线图。FIG. 9A is a graph showing the relationship between the mass percentage of methane and the derivative of the sampling parameter versus the mass percentage of methane.
图9B所示的是液态碳氢化合物的质量百分比对于取样参数的导数与液态碳氢化合物的质量百分比的关系曲线图。FIG. 9B is a graph showing the relationship between the mass percentage of liquid hydrocarbons and the derivative of the sampling parameter versus the mass percentage of liquid hydrocarbons.
图10A所示的是本发明的一个方法实施例。Figure 10A shows a method embodiment of the present invention.
图10B所示的是本发明的另一个方法实施例。Figure 10B shows another method embodiment of the present invention.
图10C所示的是本发明的另一个方法实施例。Figure 10C shows another method embodiment of the present invention.
图10D所示的是本发明的另一个方法实施例。Figure 10D shows another method embodiment of the present invention.
图10E所示的是本发明的另一个方法实施例。Figure 10E shows another method embodiment of the present invention.
具体实施方式Detailed ways
在某些实施例中,本发明涉及确定无污染流体样本特性以及监测流体样本的污染程度的方法。视在流体样本的气—油—比率(GOR)可用于确定地质层流体的无污染GOR并可监测流体样本的污染。另外,在某些实施例中,本发明涉及用凝聚物和气体分析仪(CGA)来确定视在流体样本的GOR的方法。CGA也可用于监测流体样本的污染。In certain embodiments, the present invention relates to methods of determining the characteristics of a non-contaminated fluid sample and monitoring the degree of contamination of the fluid sample. The gas-oil-ratio (GOR) of an apparent fluid sample can be used to determine the contamination-free GOR of a geological formation fluid and can monitor contamination of a fluid sample. Additionally, in certain embodiments, the present invention relates to methods of determining the GOR of an apparent fluid sample using a condensate and gas analyzer (CGA). CGA can also be used to monitor contamination of fluid samples.
本发明不但对在此所述的由注入油基泥浆(OBM)的井中提取的流体样本特别有用,而且具有本领域普通技术的人员还可以意识到本发明的实施例能够应用于由注入其他种类泥浆例如水基泥浆(WBM)的井中提取的流体样本。本发明也可用于钻孔勘探测井和生产测井。为简明启见,说明书直接对使用OBM钻探的钻孔勘探测井进行说明。但将本发明应用到其他情况中也是可以理解的。Not only is the present invention particularly useful for fluid samples extracted from wells injected with oil-based mud (OBM) as described herein, but those of ordinary skill in the art will also appreciate that embodiments of the present invention are applicable to fluid samples injected from wells injected with other types of A fluid sample extracted from a well in a mud such as a water-based mud (WBM). The invention can also be used for borehole survey logging and production logging. For the sake of brevity, the specification directly addresses borehole survey logging using OBM drilling. However, it is also conceivable to apply the invention to other situations.
无污染GORPollution-free GOR
本发明的一些实施例可用来确定流体样本的无污染GOR。在一个或多个实施例中,本发明涉及利用视在GOR和无污染的GOR来监测流体样本的污染。Some embodiments of the present invention can be used to determine the contamination-free GOR of a fluid sample. In one or more embodiments, the present invention relates to monitoring contamination of a fluid sample using an apparent GOR and a contamination-free GOR.
通常,OBM中的油实际上不包含甲烷或其他溶解气体。因此,OBM的GOR基本为零。另一方面,地质层油可具有的GOR范围是小于20scf/bb1,对深黑油来说,大于30000scf/bbl,对凝聚物来说。在取样过程刚开始时,第一次从地质层中提取的流体样本主要包括泥浆滤液,所测的GOR基本上为零。随着取样过程的继续,视在GOR逐渐增加至地质层流体的GOR。Typically, the oil in OBM contains virtually no methane or other dissolved gases. Therefore, the GOR of OBM is basically zero. Geological formation oils, on the other hand, may have a GOR in the range of less than 20 scf/bbl for deep black oils and greater than 30000 scf/bbl for condensates. At the beginning of the sampling process, the first fluid samples taken from the geological formation consisted mainly of mud filtrate, and the measured GOR was essentially zero. As the sampling process continues, the apparent GOR gradually increases to the GOR of the formation fluid.
图2A-B所示的是在LFA工具的几个通道的OD与取样处理过程的泵出时间的关系曲线图。可以理解的是,当监测流体样本的OD是不同通道时,泵出时间是惟一可使用的变量。Figures 2A-B show graphs of OD versus pump-out time during sample processing for several channels of the LFA tool. It will be appreciated that pump-out time is the only variable that can be used when the OD of the monitored fluid sample is different channels.
图2A所示的是色通道的曲线图205。色通道曲线图205示出了随着流体样本从地质层中取出,由于流体样本颜色的原因OD会增加。相似地,图2B所示的是甲烷通道的曲线图207。曲线图207示出了随着流体样本从地质层中取出,由于甲烷分子振动吸收的原因OD也会增加。色通道和甲烷通道曲线205、207都逐步增加到它们的无污染值。几种先前技术的方法都对从颜色和甲烷通道来确定污染水平进行了改进。Shown in FIG. 2A is a
用具有甲烷通道和油通道的流体分析仪可以确定GOR。用甲烷峰值与油峰值的比值来计算GOR。一种方法是用公式GOR=8930[mm/(m0-0.193mm)]来确定GOR;其中mm是甲烷的质量分率,m0是油的质量分率,单位是scf/bbl。确定GOR的方法在SPE77899“In-Situ Contamination Monitoring and GORMeasurement of Formation Fluid Samples”中公开,由Dong等人发表在2002年10月8—10日于澳大利亚Melbourne召开的SPE技术讨论会上。GOR can be determined with a fluid analyzer having a methane channel and an oil channel. The GOR was calculated as the ratio of peak methane to peak oil. One method is to use the formula GOR=8930[m m /(m 0 -0.193m m )] to determine GOR; where m m is the mass fraction of methane, m 0 is the mass fraction of oil, and the unit is scf/bbl . The method for determining GOR is disclosed in SPE77899 "In-Situ Contamination Monitoring and GOR Measurement of Formation Fluid Samples", published by Dong et al. at the SPE Technical Symposium held in Melbourne, Australia on October 8-10, 2002.
视在或所测的GOR在图2C的GOR曲线209中示出。视在GOR由甲烷通道(图2B的曲线207)和油通道(未示出)计算出。所以,视在GOR的增加要比颜色通道或甲烷通道快很多,正如图2C中的曲线209所示。The apparent or measured GOR is shown in
视在GOR的增加速度能使GOR测量对污染的微小变化更加敏感。图2D—2F所示的是采集的LFA数据(相对于,例如泵出时间),其中流体样本的污染很小。图2D所示的颜色通道曲线214几乎没有增加,图2E中的甲烷通道曲线216对于低污染度甚至还呈现了微小的下降。然而,视在GOR(在图2F的GOR曲线218中示出)比颜色通道和甲烷通道中的任何一个都要更敏感,视在GOR曲线218示出了随着流体样本的取出而不断增加。The increasing speed of the apparent GOR can make the GOR measurement more sensitive to small changes in pollution. Figures 2D-2F show LFA data acquired (relative to, eg, pump-out time) where contamination of the fluid sample was minimal. The color channel curve 214 shown in FIG. 2D shows little increase, and the
流体样本的泵速在样本处理过程中会发生变化。例如,如果压力接近流体样本的沸点,泵速会降低以使流体样本压力保持在其沸点以上。图2G—2I所示的是当流体泵速变化时所采集的LFA数据曲线图(相对于,例如泵出时间)。图2G中的颜色通道曲线224和图2H中的甲烷通道曲线226都示出了在泵速低到大约4000时的水平或值的下降。然而,图2I中的视在GOR曲线228示出了在整个泵送过程中的不断增加。Pump speeds for fluid samples vary during sample processing. For example, if the pressure is close to the boiling point of the fluid sample, the pump speed is reduced to keep the fluid sample pressure above its boiling point. Figures 2G-2I are graphs of LFA data collected (vs., eg, pumping time) as the fluid pump rate is varied. The
GOR的增加能作为取样过程参数的函数模型。一个这样的取样参数是泵出时间。泵出时间是泵打开并从地质层中泵出流体的总时间。这样,如果泵因为某种原因停止,那么泵停止时间将不计算在泵出时间内。这样的函数公式可以具有如下形式GOR=f(t),其中t是取样参数。在一个或更多个的实施例中,GOR时间函数模型化为幂函数,如公式1所示:The increase in GOR can be modeled as a function of the sampling process parameters. One such sampling parameter is pump-out time. Pumping time is the total time the pump is on and pumping fluid from the formation. This way, if the pump stops for some reason, the pump stop time will not count towards the pump out time. Such a functional formulation may have the form GOR=f(t), where t is a sampling parameter. In one or more embodiments, the GOR time function is modeled as a power function, as shown in Equation 1:
GOR=X-Yt-a Eqn.1GOR=X-Yt -a Eqn.1
其中X是无污染GOR,Y是与GOR增加有关的常量,t是泵出时间,α是指数常量。where X is the pollution-free GOR, Y is a constant related to the increase of GOR, t is the pumping time, and α is an exponential constant.
要注意的是,在所公开的实施例中,t被用来表示泵出时间,但是其他取样参数也可代替它的位置。例如,当泵一直以基本相同的速度运转时,t可以用来表示所经过的时间。在另一实施例中,t可用来表示泵出体积。本领域的普通技术人员可以意识到在不脱离本发明范围的情况下,可以将其他取样参数用作t。例如,取样参数可以是历经时间、泵出时间、泵出体积或其他能代表取样过程的任何取样参数。Note that in the disclosed embodiments, t is used to represent pump-out time, but other sampling parameters could take its place. For example, t can be used to represent the elapsed time when the pump has been running at substantially the same speed. In another embodiment, t can be used to represent the pumped volume. One of ordinary skill in the art will recognize that other sampling parameters may be used as t without departing from the scope of the present invention. For example, the sampling parameter can be elapsed time, pump-out time, pump-out volume, or any other sampling parameter that is representative of the sampling process.
对公式1做对于t域的微分,得到:Differentiate Equation 1 for the t-domain, and get:
在公式2两边同时乘以t,并令t/dt=l/dln(t)重新设置公式为:Multiply t on both sides of formula 2, and set t/dt=l/dln(t) to reset the formula as:
最后,在两边取自然对数:Finally, take the natural logarithm on both sides:
公式4示出ln(d(GOR)/dln(t))与ln(t)呈线性关系。指数常量α可以用这个关系来确定。图3示出了随着流体样本的提取,利用所选择的视在GOR数据,公式4左边ln(d(GOR)/dln(t))相对于ln(t)的曲线图。指数常量α可以用图3中的曲线302在所选择的一合适间隔内的斜率来确定。公式4中,除了自然对数之外,其他类型的对数如logn(n可以是任意正数)也可用于确定指数常量α。Equation 4 shows that ln(d(GOR)/dln(t)) has a linear relationship with ln(t). The exponential constant α can be determined using this relationship. Figure 3 shows a plot of ln(d(GOR)/dln(t)) on the left side of Equation 4 versus ln(t) with selected apparent GOR data as fluid samples are taken. The exponential constant a can be determined from the slope of the
合适间隔306可以自动地选择,以使合适间隔内的数据点趋近一条直线。例如,合适间隔306可以是一自动测出的合适间隔,在这个间隔内数据点基本在一条直线上,Y轴上的截距可以由图4推出。可替换地,合适间隔306可以人工选择,例如,在曲线上选择一段基本上为直线的区域。一个本领域的普通技术人员可以理解的是,可以使用不同的数学算法来选择合适间隔。The
一旦指数常量α被确定,无污染GOR可以由图4所示的、在图3中所使用的相同间隔306内视在GOR与t-a的关系曲线来确定。线性曲线匹配分析404可用来导出曲线402以确定公式1中的X和Y值。随着历经时间t的无穷增大,项Yt-a趋近于零,这样X就是无污染GOR。在图4所示的特定实施例中,无污染GOR的计算值为803scf/bbl。Once the exponential constant α is determined, the pollution-free GOR can be determined from the plot of apparent GOR versus t − a over the
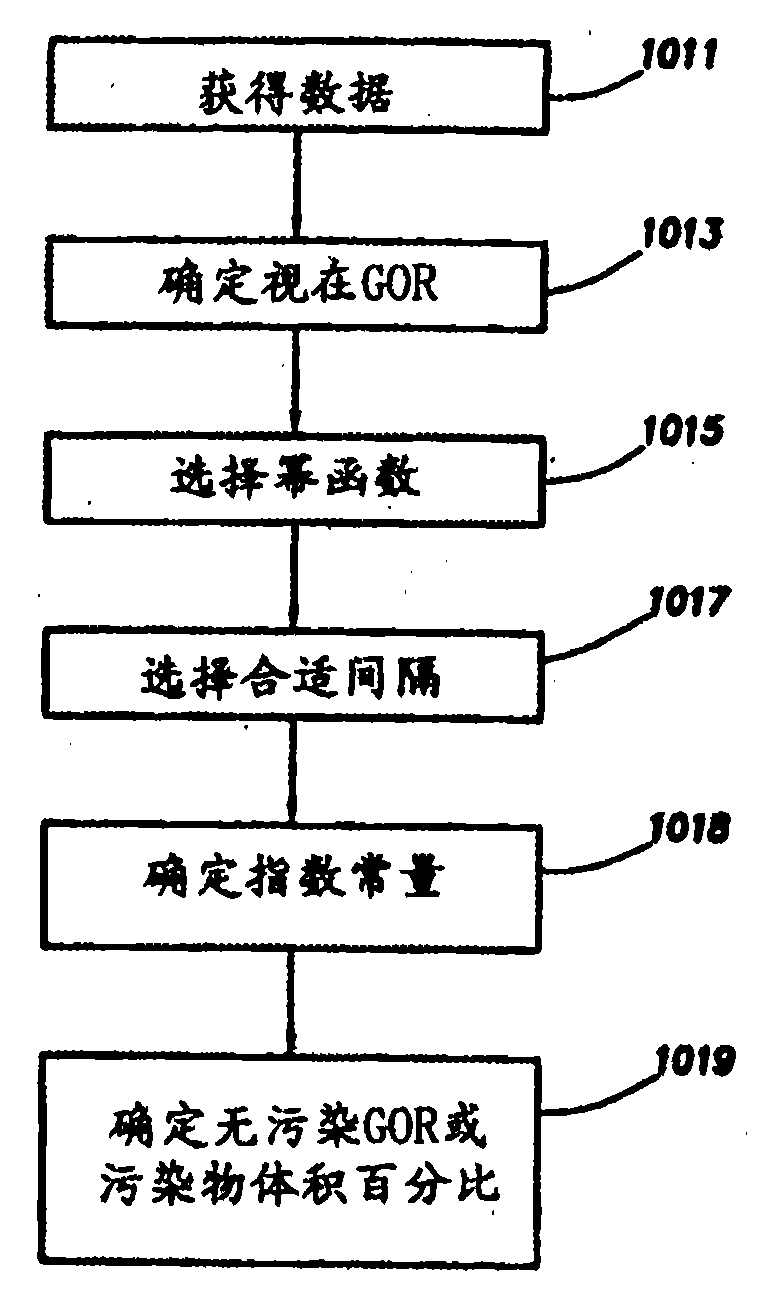
图10A示出了本发明的一种方法实施例。这种方法包括在流体样本的甲烷峰值和油峰值点多次获得与光密度有关的数据(步骤1011所示)。随着流体的取出,数据可以通过测量流体样本的OD来获得。下一步,这种方法包括多次用获得的数据来计算流体样本的视在GOR(步骤1013所示),或者也可以通过分析这些数据来获得视在GOR。方法还包括选择一个取样参数的幂函数来增加视在气—油—比率(步骤1015所示)。这个不必按所示的顺序执行。取样参数可以是历经时间、泵出时间、泵出体积、或其他能代表取样过程的取样参数。Figure 10A illustrates a method embodiment of the present invention. The method includes multiple acquisitions of optical density related data at the methane peak and oil peak points of the fluid sample (shown in step 1011). As the fluid is withdrawn, data can be obtained by measuring the OD of the fluid sample. Next, the method includes multiple times using the obtained data to calculate the apparent GOR of the fluid sample (shown in step 1013 ), or the apparent GOR can also be obtained by analyzing the data. The method also includes selecting a power function of the sampling parameters to increase the apparent gas-oil-ratio (shown at step 1015). This does not have to be done in the order shown. The sampling parameter may be elapsed time, pump-out time, pump-out volume, or other sampling parameter representative of the sampling process.
该方法还包括基于数据计算幂函数的指数常量(步骤1018所示)。在一些实施例中,这里可以首先选择一合适间隔(步骤1017所示),绘制公式4左边与ln(t)的关系曲线,确定在选择的合适间隔内的曲线的斜率。The method also includes calculating an exponential constant of the power function based on the data (shown at step 1018). In some embodiments, an appropriate interval can be selected first (shown in step 1017), and the relationship curve between the left side of formula 4 and ln(t) can be drawn to determine the slope of the curve within the selected appropriate interval.
最后,该方法包括确定无污染GOR和/或流体样本的污染度(步骤1019所示)。在一些实施例中,幂函数可以用来计算无污染GOR。在至少一个实施例中,无污染GOR用于确定流体样本的污染度。在其它实施例中,污染度可以直接被确定,而不需要特意确定无污染GOR。视在GOR可以被提供用于其他测量仪器例如NMR(核磁共振)的分析。Finally, the method includes determining the degree of contamination of the non-contaminated GOR and/or fluid sample (shown in step 1019). In some embodiments, a power function may be used to compute the pollution-free GOR. In at least one embodiment, a contamination-free GOR is used to determine the contamination level of a fluid sample. In other embodiments, the degree of contamination may be directly determined without specifically determining the pollution-free GOR. The apparent GOR can be provided for analysis by other measuring instruments such as NMR (Nuclear Magnetic Resonance).
本发明并不局限于公式1中所示用于GOR的幂函数。例如,也可为GOR采用一个指数函数:The present invention is not limited to the power function shown in Equation 1 for GOR. For example, an exponential function can also be used for GOR:
GOR=A-Be-nt Eqn.5GOR=A-Be -nt Eqn.5
其中A是无污染GOR,B是与视在GOR增加有关的常量,t是泵出时间,n是一个常量。此外,t可以是历经时间、泵出体积或其他有用的取样参数。对公式5进行时间微分:where A is the pollution-free GOR, B is a constant related to the apparent GOR increase, t is the pumping time, and n is a constant. Additionally, t can be elapsed time, pumped volume, or other useful sampling parameters. Time Differentiate Equation 5:
对公式6右边重新设置得出:Resetting the right-hand side of Equation 6 yields:
将公式5代入公式7得出:Substituting Equation 5 into Equation 7 yields:
公式6示出在历经时间无穷大,视在GOR为无污染GOR时,GOR的时间微分等于零。公式8示出视在GOR对时间的微分与视在GOR具有线性关系。这样,通过绘制视在GOR的时间微分与视在GOR的关系曲线,外推出线性部分至微分为零的地方,可以获得无污染GOR。Equation 6 shows that the time differential of GOR is equal to zero when the apparent GOR is a clean GOR with an elapsed time of infinity. Equation 8 shows that the differential of apparent GOR with respect to time has a linear relationship with apparent GOR. In this way, pollution-free GOR can be obtained by drawing the relationship curve between the time differential of apparent GOR and apparent GOR, and extrapolating the linear part to the place where the differential is zero.
图5示出了d(GOR)/dt与GOR的关系曲线。曲线502是根据取出流体样本时所记录的视在GOR数据绘制的。所示的合适间隔508是从曲线502中选择的一部分,这部分曲线基本上为线性。参照图3,本领域的普通技术人员可以利用不同的方法来选择一合适间隔。曲线502在合适间隔508内的这一部分可以外推至点506,这点的微分值为零。点506的值即是无污染GOR。Figure 5 shows the relationship between d(GOR)/dt and GOR.
流体样本中的重油污染物的体积百分比可以用视在GOR和无污染GOR来确定。在取样过程中,污染可以被监测,以确定何时流体样本具有可以接受的低污染量。当污染程度处于可接受的低水平时,流体样品可直接进入样本腔室用于以后的分析。污染物的体积百分比可以用公式9来确定:The volume percent of heavy oil contamination in a fluid sample can be determined using the apparent GOR and the uncontaminated GOR. During sampling, contamination can be monitored to determine when a fluid sample has an acceptably low amount of contamination. When the level of contamination is acceptably low, the fluid sample can be directed into the sample chamber for later analysis. The volume percent of pollutants can be determined using Equation 9:
这里GOR0是无污染GOR,GOR为视在GOR。需要注意的是,一旦无污染GOR利用时间的幂函数、指数函数或其他用来确定无污染GOR的函数确定后,污染物就可以被确定。Here GOR 0 is the pollution-free GOR, and GOR is the apparent GOR. It should be noted that once the power function, exponential function, or other functions used to determine the pollution-free GOR of the utilization time of the pollution-free GOR are determined, the pollutants can be determined.
图10B示出了本发明的一种方法实施例。这种方法包括在流体样本的甲烷峰值和油峰值点多次获得与光密度有关的数据(步骤1021所示)。随着流体的取出,数据可以通过测量流体样本的OD来获得。下一步,这种方法包括多次用获得的数据来计算流体样品的视在GOR(步骤1023所示),或者也可以通过分析这些数据来获得视在GOR。该方法还包括选择一个取样参数的指数函数来增加气—油—比(步骤1025所示)。这个不必按所示的顺序执行。取样参数可以是历经时间、泵出时间、泵出体积、或其他能代表取样过程的取样参数。Figure 10B illustrates a method embodiment of the present invention. The method includes obtaining optical density-related data multiple times at the methane peak and oil peak points of the fluid sample (shown in step 1021). As the fluid is withdrawn, data can be obtained by measuring the OD of the fluid sample. Next, the method includes multiple times using the obtained data to calculate the apparent GOR of the fluid sample (shown in step 1023 ), or the apparent GOR can also be obtained by analyzing the data. The method also includes selecting an exponential function of sampling parameters to increase the gas-oil-ratio (shown at step 1025). This does not have to be done in the order shown. The sampling parameter may be elapsed time, pump-out time, pump-out volume, or other sampling parameter representative of the sampling process.
最后,方法包括确定无污染GOR和/或流体样本的污染度(步骤1027所示)。在一些实施例中,指数函数可以用来计算无污染GOR。在至少一个实施例中,无污染GOR用于确定流体样本的污染度。在其它实施例中,污染度可以直接被确定,而不需要特意确定无污染GOR。Finally, the method includes determining the degree of contamination of the non-contaminated GOR and/or fluid sample (shown in step 1027). In some embodiments, an exponential function may be used to calculate the pollution-free GOR. In at least one embodiment, a contamination-free GOR is used to determine the contamination level of a fluid sample. In other embodiments, the degree of contamination may be directly determined without specifically determining the pollution-free GOR.
用CGA确定GORDetermining GOR with CGA
本发明的一个或多个实施例涉及利用凝聚物和气体分析仪(CGA)(Condensate and Gas Analyzer)来确定原油的GOR。工具CGA利用电磁辐射的特定波长,最好是能使待分析要素的分子振动吸收产生特定共振峰值的特定波长,来确定流体样本成分的质量百分比。通常,CGA被用来分析甲烷(“C1”)、非—甲烷气态碳氢化合物(即:乙烷、丁烷、丙烷和戊烷)(“C2-5”)、液态碳氢化合物(正乙烷和较重碳氢化合物分子)(“C6+”)、和二氧化碳(“CO2”)的量。One or more embodiments of the invention relate to determining the GOR of crude oil using a Condensate and Gas Analyzer (CGA). The tool CGA uses a specific wavelength of electromagnetic radiation, preferably a specific wavelength that can cause the molecular vibration absorption of the element to be analyzed to produce a specific resonance peak, to determine the mass percentage of the fluid sample components. Typically, CGA is used to analyze methane (“C 1 ”), non-methane gaseous hydrocarbons (i.e., ethane, butane, propane, and pentane) (“C 2-5 ”), liquid hydrocarbons ( ethane and heavier hydrocarbon molecules) (“C 6+ ”), and carbon dioxide (“CO 2 ”).
本发明的一个或多个实施例利用流体样本成分C1、C2-5、C6+和CO2的质量百分比,来预测在标准条件下气态和液态物质所占的体积。气态和液态物质所占的体积能确定流体样本的GOR。One or more embodiments of the invention utilize the mass percentages of the fluid sample components C 1 , C 2-5 , C 6+ , and CO 2 to predict the volumes occupied by gaseous and liquid species under standard conditions. The volumes occupied by gaseous and liquid species determine the GOR of a fluid sample.
GOR是甲烷(“m1”)、非—甲烷气态碳氢化合物(“m2-5”)、液态碳氢化合物(m6+)、和二氧化碳(“mCO2”)的质量百分比的函数。利用成分百分比来估算GOR通常可用质量百分比函数来表示:GOR=f(m1,m2-5,m6+,mCO2)。实际公式可以有无限多种形式,这要根据对流体的一组假设和用于计算的特定公式状态来确定。GOR is a function of the mass percentages of methane ("m 1 "), non-methane gaseous hydrocarbons ("m 2-5 "), liquid hydrocarbons (m 6+ ), and carbon dioxide ("m CO2 "). Estimated GOR by composition percentage can usually be expressed by mass percentage function: GOR=f(m 1 , m 2-5 , m 6+ , m CO2 ). The actual formula can take an infinite number of forms, depending on the set of assumptions about the fluid and the particular formula state used for the calculation.
在本发明的一个或多个实施例中,GOR函数用下列假设来确定:In one or more embodiments of the invention, the GOR function is determined with the following assumptions:
1.储藏流体大致是由下列4组分子组成的:C1、C2-5、C6+和CO2。1. The storage fluid is roughly composed of the following four groups of molecules: C 1 , C 2-5 , C 6+ and CO 2 .
2.4组分子的成分质量百分比用CGA测量。2.4 The composition mass percentage of group molecules is measured by CGA.
3.标准条件下C1、C2-5和CO2分子全部处于气态。3. Under standard conditions, C 1 , C 2-5 and CO 2 molecules are all in the gaseous state.
4.标准条件下C6+分子全部处于液态。4. Under standard conditions, all C 6+ molecules are in liquid state.
5.C2-5分子组内的质量分布为:m2:m3:m4:m5=4:3:2:1(摩尔量比为133:68:34:14)5. The mass distribution within the C 2-5 molecular group is: m 2 : m 3 : m 4 : m 5 = 4:3:2:1 (the molar ratio is 133:68:34:14)
6.液相的密度为0.75g/cm3。6. The density of the liquid phase is 0.75 g/cm 3 .
7.气相遵守真实气体定律:PV=znRT。7. The gas phase obeys the real gas law: PV=znRT.
通过用1代替常量z,真实气体定律可以转变为理想气体定律。可替换地,常量z也可以是确定的任何值,以能提供更好的气体估计。在下面的实施例中,z为1,尽管在不脱离本发明的范围内,本领域的普通技术人员可以意识到z可以采用其它值。By substituting 1 for the constant z, the real gas law can be transformed into the ideal gas law. Alternatively, the constant z can be any value determined to provide a better gas estimate. In the following embodiments, z is 1, although those skilled in the art can realize that z can take other values without departing from the scope of the present invention.
利用假设7,真实气体定律可应用于气相的组成成分上以得到公式10—15,其中摩尔数n等于成分质量除以分子量:Using Assumption 7, the true gas laws can be applied to the constituents of the gas phase to obtain Equations 10-15, where the number of moles n is equal to the mass of the constituent divided by the molecular weight:
P1Vg=(m2/16)RTP 1 V g =(m 2 /16)RT
P2Vg=(m2/30)RTP 2 V g =(m 2 /30)RT
P3Vg=(m3/44)RTP 3 V g =(m 3 /44)RT
P4Vg=(m4/58)RT Eqn.10P 4 V g =(m 4 /58)RT Eqn.10
P5Vg=(m5/72)RTP 5 V g =(m 5 /72)RT
Pco2Vg=(mco2/44)RTP co2 V g =(m co2 /44)RT
其中P1,P2,P3,P4,P5,和PCO2是气相各组成成分的部分压力,Vg是标准条件下气相的体积。气相的部分压力的和等于一个大气压(即标准条件下的压力):Among them, P 1 , P 2 , P 3 , P 4 , P 5 , and P CO2 are the partial pressures of the components of the gas phase, and V g is the volume of the gas phase under standard conditions. The sum of the partial pressures of the gaseous phase is equal to one atmosphere (that is, the pressure under standard conditions):
P1+P2+P3+P4+P5+Pco2=1[atm] Eqn.11P 1 +P 2 +P 3 +P 4 +P 5 +P co2 =1[atm] Eqn.11
假设5提供了气相各组成成分的质量比:Assumption 5 provides the mass ratio of each component in the gas phase:
m2=0.4m2-5;m3=0.3m2-5;m4=0.2m2-5;m5=0.1m2-5 Eqn.12m 2 =0.4m 2-5 ; m 3 =0.3m 2-5 ; m 4 =0.2m 2-5 ; m 5 =0.1m 2-5 Eqn.12
GOR可以作为气体体积(Vg)与液体体积(V1)之比计算。气体体积(Vg)可以通过求解公式10和11(7个未知数和7个等式)来求得Vg。液体体积(V1)等于其质量(m6+)除以密度。Vg/V1的比为:GOR can be calculated as the ratio of gas volume (V g ) to liquid volume (V 1 ). The gas volume (V g ) can be found for V g by solving Equations 10 and 11 (7 unknowns and 7 equations). The volume of a liquid (V 1 ) is equal to its mass (m 6+ ) divided by the density. The ratio of V g /V 1 is:
其中κ是基于上述假设的一个常量。用英制单位[scf/bbl]时,κ=9971;用公制单位[m3(gas)/m3(liquid)],κ=1776。CGA测量提供m1,m2-5,m6+,mCO2。这些值可以在公式13中使用以提供一个GOR估计值。where κ is a constant based on the above assumptions. When using imperial units [scf/bbl], κ=9971; using metric units [m3(gas)/m3(liquid)], κ=1776. CGA measurements provide m 1 , m 2-5 , m 6+ , m CO2 . These values can be used in Equation 13 to provide an estimate of GOR.
这些假设用来形成上面的多个公式。需要注意的是,如果这些假设中的一个或多个被修改,那么导出的公式也会不同。例如,如果假设5中的比率被改变(如m2:m3:m4:m5=2.5:1.7:1.5:1.0),公式12将表现新的假设:These assumptions are used to form many of the formulas above. It is important to note that if one or more of these assumptions were modified, then the derived formula would be different. For example, if the ratios in Assumption 5 are changed (eg m 2 :m 3 :m 4 :m 5 = 2.5:1.7:1.5:1.0), Equation 12 will represent the new assumption:
m2=0.37m2-5;m3=0.25m2-5;m4=0.23m2-5;m5=0.15m2-5 Eqn.q12am 2 =0.37m 2-5 ; m 3 =0.25m 2-5 ; m 4 =0.23m 2-5 ; m 5 =0.15m 2-5 Eqn.q12a
利用公式12a,公式13将变成:Using Equation 12a, Equation 13 becomes:
其中常量κ对于单位scf/bbl为9972。本领域的普通技术人员能够理解的是,假设可以改变,对GOR的导出公式将会相应不同。where the constant κ is 9972 for the unit scf/bbl. Those of ordinary skill in the art can understand that the assumptions can be changed, and the derivation formula for GOR will be different accordingly.
在一个或多个实施例中,本发明能够通过计算标准条件下气化的已烷(C6)、庚烷(C7)、辛烷(C8)、和任烷(C9)部分来确定GOR。当这些组成部分处于气态时,液体的体积将会减少,GOR将会增加。In one or more embodiments, the present invention can calculate the fraction of hexane (C 6 ), heptane (C 7 ), octane (C 8 ), and orane (C 9 ) that vaporize under standard conditions Determine the GOR. When these components are in the gaseous state, the volume of the liquid will decrease and the GOR will increase.
当C6至C9部分处于气态时,GOR的表达公式作为CGA测量函数可以从一些假设中推导出,除上面的那些假设外还有:When the C6 to C9 moieties are in the gaseous state, the expression for GOR as a function of the CGA measurement can be deduced from some assumptions, in addition to those above:
1.标准条件下流体闪蒸后,C1、C2-5、和CO2完全处于气态。1. After the fluid flashes under standard conditions, C 1 , C 2-5 , and CO 2 are completely in the gaseous state.
2.流体闪蒸后,液体包含4mol%C6,5mol%C7,7mol%C8,和8mol%C9。2. After the fluid is flashed, the liquid contains 4 mol% C 6 , 5 mol% C 7 , 7 mol% C 8 , and 8 mol% C 9 .
3.在气态时,C6,C7,C8,和C9的蒸气与液相平衡。3. In the gaseous state, the vapors of C 6 , C 7 , C 8 , and C 9 are in equilibrium with the liquid phase.
4.液相的密度为0.8g/cm3。4. The density of the liquid phase is 0.8 g/cm 3 .
5.气相遵守真实气体定律(PV=znRT)。5. The gas phase obeys the real gas law (PV=znRT).
利用这些假设,可推导出GOR的表达公式作为CGA的测量函数:Using these assumptions, the expression formula of GOR can be deduced as the measurement function of CGA:
其中κ是基于特定假设和期望单位的常量。当用上面的假设1—5和单位scf/bbl时,κ=107285。用公制单位m3(gas)/m3(liquid),κ=19107。CGA测量提供m1,m2-5,m6+,mCO2。在某些实施例中,这些值可以用于公式14以提供流体样本的一个GOR估计值。where κ is a constant based on certain assumptions and desired units. When using the above assumptions 1-5 and the unit scf/bbl, κ = 107285. In metric units m 3 (gas)/m 3 (liquid), κ=19107. CGA measurements provide m1, m 2-5 , m 6+ , m CO2 . In some embodiments, these values can be used in Equation 14 to provide an estimate of the GOR for the fluid sample.
应当理解的是,应用除公式14所示的函数以外的函数也是不脱离本发明范围的。具体的函数形式根据设定的特定假设得出。例如,除了假设2中的摩尔分量以外,其他摩尔分量也可用来推导出与公式14相似或相同的公式。另外,比C9重的成分可以气化或气态存在。例如,C11和C12可以被气化,包括在假设2中。还有,密度的估计值可能不同于0.8g/cm3。本领域的普通技术人员可以在不脱离本发明范围的情况下,作出其他假设和其他函数。It should be understood that the application of functions other than that shown in Equation 14 does not depart from the scope of the present invention. The specific functional form is derived from certain assumptions set. For example, in addition to the molar fraction in Assumption 2, other molar fractions can be used to derive a similar or identical formula to Equation 14. In addition, components heavier than C9 can be vaporized or exist in a gaseous state. For example, C 11 and C 12 could be gasified, included in Assumption 2. Also, the density estimate may differ from 0.8 g/cm 3 . Other assumptions and other functions can be made by one of ordinary skill in the art without departing from the scope of the invention.
用CGA确定GOR的方法可以与确定无污染GOR的方法和用GOR监测流体样本污染的方法相结合。然而,可以发现确定无污染GOR的方法和用GOR监测流体样本污染的方法可以与任何确定GOR的方法一起使用,并且不局限于用CGA确定GOR的方法。视在GOR可用于来自任意设备的分析,例如NMR工具。The method of determining GOR with CGA can be combined with the method of determining contamination-free GOR and the method of monitoring contamination of fluid samples with GOR. However, it can be found that the method of determining contamination-free GOR and the method of monitoring contamination of a fluid sample using GOR can be used with any method of determining GOR and is not limited to the method of determining GOR using CGA. Apparent GOR can be used for analysis from arbitrary devices, such as NMR tools.
图10C示出了本发明方法的一个实施例。这种方法首先包括多次获得与流体样本的甲烷质量成分、非—甲烷气态碳氢化合物质量成分、液态碳氢化合物质量成分、和二氧化碳质量成分有关的数据(步骤1031所示)。Figure 10C illustrates one embodiment of the method of the present invention. The method first includes multiple acquisitions of data relating to the methane mass composition, non-methane gaseous hydrocarbon mass composition, liquid hydrocarbon mass composition, and carbon dioxide mass composition of a fluid sample (shown in step 1031).
在一些实施例中,这种方法下一步包括做出关于地质层流体组成成分的假设(步骤1033所示),和确定一个计算GOR的公式,这个公式是甲烷质量成分、非—甲烷气态碳氢化合物质量成分、液态碳氢化合物质量成分、和二氧化碳质量成分的函数(步骤1035所示)。需要注意的是,做出假设和确定计算GOR的公式可以在获得数据之前或之后执行。In some embodiments, the next step of the method includes making assumptions about the composition of the geological formation fluid (shown in step 1033), and determining a formula for calculating the GOR, which is the methane mass composition, non-methane gaseous hydrocarbons A function of compound mass composition, liquid hydrocarbon mass composition, and carbon dioxide mass composition (shown in step 1035). It is important to note that making assumptions and determining the formula for calculating GOR can be performed before or after the data are obtained.
最后,这种方法包括基于甲烷质量成分、非—甲烷气态碳氢化合物质量成分、和二氧化碳质量成分与液态碳氢化合物质量成分的比来计算GOR(步骤1037所示)。Finally, the method includes calculating the GOR based on the methane mass fraction, the non-methane gaseous hydrocarbon mass fraction, and the ratio of the carbon dioxide mass fraction to the liquid hydrocarbon mass fraction (shown in step 1037).
用CGA监测污染Monitoring Pollution with CGA
在本发明的一个或多个实施例中,CGA测量可以用于对OBM井中气体凝聚物取样污染的监测。井下气体的主要成分是甲烷,几乎没有井下气体包含大量的液体成分。另一方面,OBM通常不包含甲烷,并且完全由液态碳氢化合物组成。这样,取样过程中的倾向是C1逐渐增加而C6+逐渐减小。CGA测量甲烷m1的质量百分比和液态碳氢化合物m6+的质量百分比。In one or more embodiments of the invention, CGA measurements may be used to monitor contamination of gas condensate samples in OBM wells. The main component of downhole gas is methane, and almost no downhole gas contains a large amount of liquid components. OBMs, on the other hand, generally do not contain methane and are composed entirely of liquid hydrocarbons. Thus, the tendency during sampling is that C 1 gradually increases and C 6+ gradually decreases. CGA measures the mass percent of methane m 1 and the mass percent of liquid hydrocarbons m 6+ .
图6A示出了在取样过程中m1(m1曲线602所示)随着历经时间的增加而增加。m1逐渐接近无污染m1(如虚线604所示)。相似地,图6B示出了m6+(m6+曲线612所示)在取样过程中随着历经时间的增加而减小。m6+逐渐接近无污染m6+(如虚线614所示)。FIG. 6A shows that m 1 (shown by m 1 curve 602 ) increases with elapsed time during the sampling process. m1 gradually approaches uncontaminated m1 (shown by dashed line 604). Similarly, FIG. 6B shows that m 6+ (shown by m 6+ curve 612 ) decreases with increasing elapsed time during the sampling process. The m 6+ gradually approaches the uncontaminated m 6+ (shown by the dotted line 614).
在一些实施例中,m1的增加和m6+的减小可以作为幂函数的模型。例如公式15和16,类似于上述GOR的公式1:In some embodiments, an increase in m 1 and a decrease in m 6+ can be modeled as a power function. Equations 15 and 16, for example, are similar to Equation 1 for GOR above:
m1=A-Bt-α Eqn.15m 1 =A-Bt -α Eqn.15
m6+=X+Yt-β Eqn.16m 6+ =X+Yt -β Eqn.16
对于公式15,m1是测得的甲烷百分比,A是无污染m1,B是与m1的增加有关的常量,α是指数常量。对于公式16,m6+是测得的液体的百分比,X是无污染液体,Y是与m6+的减小有关的常量,β是指数常量。如上所述,需要指出的是,t是取样参数,并且它可以代表历经时间、泵出时间、泵出体积、或其他能代表泵出过程的任意取样参数。本领域的普通技术人员可以在不脱离本发明范围的情况下,设定其它取样参数。For Equation 15, m 1 is the measured percent methane, A is the unpolluted m 1 , B is the constant related to the increase in m 1 , and α is the exponential constant. For Equation 16, m 6+ is the measured percentage of liquid, X is the uncontaminated liquid, Y is the constant related to the reduction in m 6+ , and β is the exponential constant. As noted above, it should be noted that t is a sampling parameter, and it can represent elapsed time, pumping time, pumped volume, or any other sampling parameter that can represent the pumping process. Those of ordinary skill in the art can set other sampling parameters without departing from the scope of the present invention.
在一些实施例中,指数常量α、β的选择是基于对泥浆滤液侵入深度的估计。在一此实施例中,指数常量α、β可以在0.1和2.0之间。在至少一个实施例中,指数常量α、β中的一个或者两个大约为0.5。对于浅的侵入,希望是较低的指数常量,如α=1/3或β=1/3。对于深的侵入,希望是较高的指数常量,如α=2/3或β=2/3。一旦选择好指数常量,公式15和16中的常量值可以由样本数据计算出。In some embodiments, the selection of the exponential constants α, β is based on an estimate of the mud filtrate invasion depth. In one such embodiment, the exponential constants α, β may be between 0.1 and 2.0. In at least one embodiment, one or both of the exponential constants α, β are approximately 0.5. For shallow intrusions, lower exponential constants are desired, such as α = 1/3 or β = 1/3. For deep intrusions, higher exponential constants are desired, such as α=2/3 or β=2/3. Once the exponent constants are chosen, the constant values in Equations 15 and 16 can be calculated from the sample data.
一种确定无污染m1和无污染m6+值的方法在图8A和图8B中示出。图8A示出了m1与t-α的关系曲线。从公式15和图8A可以看出,这种关系为线性关系。m1数据曲线812可以用m1和t-α的数据点的连线来产生。m1数据曲线812可以线性外推至t-α=0,这里t为无限大。随着t接近无限大,m1接近无污染m1(如点814所示)。相似地,如图8B中的曲线所示,m6+数据曲线822可以用m6+和t-β的数据点的连线来产生。m6+数据曲线822可线性外推至t-β=0,这里t为无限大。随着t接近无限大,m6+接近无污染m6+(如点824所示)。One method for determining uncontaminated m 1 and uncontaminated m 6+ values is shown in Figures 8A and 8B. Figure 8A shows the relationship between m 1 and t -α . It can be seen from Equation 15 and Figure 8A that this relationship is linear. The m 1 data curve 812 can be generated using a line joining the data points for m 1 and t - α . The m 1 data curve 812 can be extrapolated linearly to t −α =0, where t is infinite. As t approaches infinity, m 1 approaches clean m 1 (as shown by point 814). Similarly, the m6 + data curve 822 can be generated by joining the m6+ and t -β data points, as shown in the graph in FIG. 8B. The m 6+ data curve 822 can be linearly extrapolated to t −β =0, where t is infinite. As t approaches infinity, m 6+ approaches uncontaminated m 6+ (as shown by point 824).
在可替换的实施例中,可以测量指数常量α、β中的一个或两个。与公式1变换成公式4的操作一样,公式15和16可以变换成公式17和18:In alternative embodiments, one or both of the exponential constants α, β may be measured. In the same way that Equation 1 is transformed into Equation 4, Equations 15 and 16 can be transformed into Equations 17 and 18:
公式17示出了ln(d(m1)/dln(t))与ln(t)之间的线性关系。图7A示出了ln(d(m1)/dln(t))与ln(t)之间的关系曲线。数据曲线712在曲线的某一段内具有线性关系,并且把这一段线性曲线的斜率作为指数常量α。曲线712的斜率可以在一合适间隔内确定,如714所示。本领域的普通技术人员能够设定选择合适间隔的方法。一旦指数常量α被确定,无污染m1可以通过绘制相同合适间隔714内的m1与t-α的关系曲线(图8A中的812)确定。Formula 17 shows the linear relationship between ln(d(m 1 )/dln(t)) and ln(t). FIG. 7A shows a relationship curve between ln(d(m 1 )/dln(t)) and ln(t). The data curve 712 has a linear relationship within a certain section of the curve, and the slope of this section of the linear curve is taken as the exponential constant α. The slope of
相似地,公式18示出了ln(-d(m6+)/dln(t))与ln(t)之间的线性关系。图7B示出了ln(-d(m6+)/dln(t))与ln(t)之间的关系曲线。数据曲线722在曲线的某一段内具有线性关系,并且把曲线722的这一段线性曲线的斜率作为指数常量β。曲线722的斜率可以在一合适间隔724内确定。一旦指数常量β被确定,无污染m6+可以通过绘制相同合适间隔724内的m6+与t-β的关系曲线(图8B中的822)确定。Similarly, Equation 18 shows a linear relationship between ln(-d(m 6+ )/dln(t)) and ln(t). FIG. 7B shows the relationship curve between ln(-d(m 6+ )/dln(t)) and ln(t). The data curve 722 has a linear relationship in a certain segment of the curve, and the slope of the linear curve of the
图10D示出了本发明方法的一个实施例。这种方法包括多次获得与流体样本甲烷的质量百分比和液态碳氢化合物质量百分比有关的数据(步骤1041所示)。在流体取出时,可以通过监测流体样本来获得数据,或者通过分析这些数据获得。下一步,这种方法包括为甲烷质量百分比选择样本参数的甲烷幂函数(步骤1042所示)和为液体碳氢化合物质量百分比选择样本参数的液体幂函数(步骤1043所示)。这些不需按所示顺序进行。取样参数可以是历经时间、泵出时间、泵出体积、或其他代表取样过程的取样参数。Figure 10D illustrates one embodiment of the method of the present invention. The method includes multiple acquisitions of data related to the mass percent methane and liquid hydrocarbons of the fluid sample (shown in step 1041 ). Data may be obtained by monitoring fluid samples as the fluid is withdrawn, or by analyzing the data. Next, the method includes selecting a methane power function with sample parameters for methane mass percent (shown at step 1042 ) and a liquid power function with sample parameters for liquid hydrocarbon mass percent (shown at step 1043 ). These need not be done in the order shown. The sampling parameter may be elapsed time, pump-out time, pump-out volume, or other sampling parameter representative of the sampling process.
这种方法下一步包括确定甲烷幂函数的指数常量(步骤1045所示)和确定液体幂函数的指数常量(步骤1046所示)。在一些实施例中,这里可以首先选择一个合适间隔(步骤1044所示),绘出公式17和18左边与ln(t)的关系曲线,并确定所选择合适间隔内的曲线的斜率。The next steps in the method include determining the exponential constant of the methane power function (shown at step 1045) and determining the exponential constant of the liquid power function (shown at step 1046). In some embodiments, an appropriate interval can be selected first (shown in step 1044), the relationship curves between the left side of formulas 17 and 18 and ln(t) can be drawn, and the slope of the curve within the selected appropriate interval can be determined.
最后,这种方法包括确定流体样本的污染度(步骤1047所示)。Finally, the method includes determining the degree of contamination of the fluid sample (shown in step 1047).
在一个或多个实施例中,m1和m6+的百分比可以作为指数函数的模型,如公式19和20所示;In one or more embodiments, the percentages of m and m can be modeled as exponential functions, as shown in Equations 19 and 20;
m1=A-Be-αt Eqn.19m 1 =A-Be -αt Eqn.19
m6+=X+Ye-βt Eqn.20m 6+ =X+Ye -βt Eqn.20
与公式5变换成公式8的操作一样,公式19和20可以变换成公式21和22:In the same way that Equation 5 is transformed into Equation 8, Equations 19 and 20 can be transformed into Equations 21 and 22:
公式21示出了m1关于t的微分(d m1/dt)与m1之间的线性关系。图9A示出了d m1/dt与m1的关系曲线。m1数据曲线912在曲线的一部分上是线性的。合适间隔915是从曲线912中选择的,这一段曲线基本上是线性的。m1时间微分为零时的m1值是可以通过线性延伸916来确定。这就是914所示的无污染m1。Equation 21 shows the linear relationship between the differential of m 1 with respect to t (d m 1 /dt) and m 1 . FIG. 9A shows a plot of d m 1 /dt versus m 1 . The m 1 data curve 912 is linear over a portion of the curve. A
公式22示出了m6+关于t的微分(即d m6+/dt)与m6+之间的线性关系。图9B示出了d m6+/dt与m6+的关系曲线。合适间隔925是从m6+数据曲线922中选择的,这一段曲线基本上是线性的。m6+时间微分为零时的m6+值是可以通过从合适间隔925的曲线线性延伸926来确定。这就是924所示的无污染m6+。Equation 22 shows the linear relationship between the differential of m 6+ with respect to t (ie, d m 6+ /dt) and m 6+ . Figure 9B shows the relationship between d m 6+ /dt and m 6+ . A
流体样本的污染可以利用m1和m6+数据来监测。在一些实施例中,加权污染程度可以表示为一个C1或C6+和无污染值的函数:Contamination of fluid samples can be monitored using m 1 and m 6+ data. In some embodiments, the weighted pollution degree can be expressed as a function of C 1 or C 6+ and non-pollution values:
其中m10是无污染m1,m1是视在m1。Where m 10 is pollution-free m 1 and m 1 is apparent m 1 .
其中m6+0是无污染m6+,m6+是视在m6+。Among them, m 6+0 is pollution-free m 6+ , and m 6 + is apparent m 6+ .
在公式15和16中,m1和m6+可以用下式确定的颜色比率Rcolor代替,:In Equations 15 and 16, m 1 and m 6+ can be replaced by the color ratio R color determined by:
Eqn.25Eqn.25
其中ODcolor1和ODclor2是两个不同的颜色通道,ODbase是颜色基道。用颜色比率Rcolor代替m1,污染可表示为:Among them, OD color1 and OD clor2 are two different color channels, and OD base is the color base channel. Substituting the color ratio R color for m 1 , pollution can be expressed as:
其中Rcolor_0是无污染颜色比率,其与m1的推导方式是相同的。where R color_0 is the pollution-free color ratio, which is derived in the same way as m1 .
图10E示出了本发明方法的一个实施例。这种方法包括多次获得与流体样本甲烷的质量百分比和液态碳氢化合物质量百分比有关的数据(步骤1051所示)。在流体取出时,可以通过监测流体样本来获得数据,或者通过分析这些数据获得。下一步,这种方法包括为甲烷质量百分比选择样本参数的甲烷指数函数(步骤1053所示)和为液体碳氢化合物质量百分比选择样本参数的液体指数函数(步骤1055所示)。这些不需按所示顺序进行。取样参数可以是历经时间、泵出时间、泵出体积、或其他代表取样过程的取样参数。Figure 10E illustrates one embodiment of the method of the present invention. The method includes obtaining data related to the mass percent methane and liquid hydrocarbons of the fluid sample multiple times (shown in step 1051 ). Data may be obtained by monitoring fluid samples as the fluid is withdrawn, or by analyzing the data. Next, the method includes selecting a methane index function with sample parameters for methane mass percent (shown at step 1053 ) and a liquid index function with sample parameters for liquid hydrocarbon mass percent (shown at step 1055 ). These need not be done in the order shown. The sampling parameter may be elapsed time, pump-out time, pump-out volume, or other sampling parameter representative of the sampling process.
最后,这种方法包括确定流体样本的污染度(步骤1057所示)。Finally, the method includes determining the degree of contamination of the fluid sample (shown at step 1057).
本发明的某些实施例具有下述优点中的一个或几个。一些实施例能确定无污染GOR。无污染GOR是地质层流体的一个特性,并且可以不用在样本腔室内收集样本就能被确定。通过这样做,可以储存地质层试验工具里收集到的有限的样品量,从而可以增加在一次工具操作中的数据量。Certain embodiments of the invention have one or more of the following advantages. Some embodiments are able to determine pollution-free GOR. Contamination-free GOR is a property of geological formation fluids and can be determined without collecting samples in the sample chamber. By doing so, the limited amount of samples collected in the geological formation test tool can be stored, thereby increasing the amount of data in one tool operation.
有利的是,本发明的某些实施例能利用视在GOR监测污染。GOR比颜色或甲烷分析更加敏感。视在GOR会在低污染流体中不断增加,这样可以得出更精确的污染水平。还有,视在GOR对流体样本泵出速度的变化不敏感。即使泵出速度降低,GOR也可以持续增加。Advantageously, certain embodiments of the present invention can utilize apparent GOR to monitor pollution. GOR is more sensitive than color or methane analysis. Apparent GOR increases in low contamination fluids, allowing for more accurate contamination levels. Also, the apparent GOR is insensitive to changes in the pumping velocity of the fluid sample. GOR can continue to increase even when the pumping rate is reduced.
有利的是,本发明的某些实施例能确定一个接近GOR的时间函数。在这些实施例中,这些函数可以用来确定将流体样本净化到可以接受的污染水平所需要的时间。Advantageously, some embodiments of the present invention are capable of determining a time function that approximates the GOR. In these embodiments, these functions can be used to determine the time required to decontaminate a fluid sample to an acceptable level of contamination.
有利的是,本发明的某些实施例能用组成成分的质量百分比来确定视在GOR。视在GOR的函数可以基于关于地质层流体组成成分的假设。利用通常获得的地质层流体数据,GOR函数能很快确定GOR。Advantageously, certain embodiments of the present invention are capable of determining apparent GOR using mass percentages of constituents. The function of apparent GOR may be based on assumptions about the composition of the geological formation fluids. Using commonly obtained fluid data for geological formations, the GOR function can quickly determine the GOR.
有利的是,本发明的某些实施例能用甲烷和液态碳氢化合物的质量百分比来监测污染。在不需要收集额外数据的情况下,就能达到监测流体样本污染的目的。Advantageously, certain embodiments of the present invention can monitor pollution in terms of mass percentages of methane and liquid hydrocarbons. The purpose of monitoring contamination of fluid samples can be achieved without collecting additional data.
然而本发明只能描述有限的实施例,在本发明所公开的基础上,本领域的技术人员可以意识到,在不脱离本发明范围的情况下,可以设定其他实施例。所以,本发明的保护范围仅限定在附加的权利要求书中。However, the present invention can only describe limited embodiments. Based on the disclosure of the present invention, those skilled in the art will realize that other embodiments can be devised without departing from the scope of the present invention. Therefore, the protection scope of the present invention is limited only by the appended claims.
Claims (3)
Applications Claiming Priority (2)
| Application Number | Priority Date | Filing Date | Title |
|---|---|---|---|
| US10/249274 | 2003-03-27 | ||
| US10/249,274 US6956204B2 (en) | 2003-03-27 | 2003-03-27 | Determining fluid properties from fluid analyzer |
Related Parent Applications (1)
| Application Number | Title | Priority Date | Filing Date |
|---|---|---|---|
| CNB2004100352609A Division CN100487427C (en) | 2003-03-27 | 2004-03-27 | Determining fluid properties with a fluid analyzer |
Publications (2)
| Publication Number | Publication Date |
|---|---|
| CN101446552A CN101446552A (en) | 2009-06-03 |
| CN101446552B true CN101446552B (en) | 2011-04-06 |
Family
ID=32174490
Family Applications (2)
| Application Number | Title | Priority Date | Filing Date |
|---|---|---|---|
| CNB2004100352609A Expired - Lifetime CN100487427C (en) | 2003-03-27 | 2004-03-27 | Determining fluid properties with a fluid analyzer |
| CN2008101817029A Expired - Lifetime CN101446552B (en) | 2003-03-27 | 2004-03-27 | Determining fluid properties from fluid analyzer |
Family Applications Before (1)
| Application Number | Title | Priority Date | Filing Date |
|---|---|---|---|
| CNB2004100352609A Expired - Lifetime CN100487427C (en) | 2003-03-27 | 2004-03-27 | Determining fluid properties with a fluid analyzer |
Country Status (5)
| Country | Link |
|---|---|
| US (1) | US6956204B2 (en) |
| CN (2) | CN100487427C (en) |
| CA (1) | CA2461933C (en) |
| FR (1) | FR2853076A1 (en) |
| GB (2) | GB2400910B (en) |
Families Citing this family (56)
| Publication number | Priority date | Publication date | Assignee | Title |
|---|---|---|---|---|
| PL365462A1 (en) * | 2000-04-11 | 2005-01-10 | Welldog, Inc. | In-situ detection and analysis of methane in coal bed methane formations with spectrometers |
| US7095012B2 (en) * | 2000-12-19 | 2006-08-22 | Schlumberger Technology Corporation | Methods and apparatus for determining chemical composition of reservoir fluids |
| US8210260B2 (en) | 2002-06-28 | 2012-07-03 | Schlumberger Technology Corporation | Single pump focused sampling |
| US8555968B2 (en) | 2002-06-28 | 2013-10-15 | Schlumberger Technology Corporation | Formation evaluation system and method |
| US7178591B2 (en) * | 2004-08-31 | 2007-02-20 | Schlumberger Technology Corporation | Apparatus and method for formation evaluation |
| US8899323B2 (en) | 2002-06-28 | 2014-12-02 | Schlumberger Technology Corporation | Modular pumpouts and flowline architecture |
| US7216702B2 (en) * | 2003-02-28 | 2007-05-15 | Yates Petroleum Corporation | Methods of evaluating undersaturated coalbed methane reservoirs |
| US7398159B2 (en) * | 2005-01-11 | 2008-07-08 | Schlumberger Technology Corporation | System and methods of deriving differential fluid properties of downhole fluids |
| US7305306B2 (en) | 2005-01-11 | 2007-12-04 | Schlumberger Technology Corporation | System and methods of deriving fluid properties of downhole fluids and uncertainty thereof |
| US20060241866A1 (en) * | 2005-04-22 | 2006-10-26 | Baker Hughes Incorporated | Method and apparatus for estimating of fluid contamination downhole |
| WO2006116088A1 (en) * | 2005-04-22 | 2006-11-02 | Baker Hughes Incorporated | A method and apparatus for estimating of fluid contamination downhole |
| US7458258B2 (en) * | 2005-12-16 | 2008-12-02 | Schlumberger Technology Corporation | Methods and apparatus for oil composition determination |
| US7511813B2 (en) * | 2006-01-26 | 2009-03-31 | Schlumberger Technology Corporation | Downhole spectral analysis tool |
| US7711488B2 (en) * | 2006-12-28 | 2010-05-04 | Schlumberger Technology Corporation | Methods and apparatus to monitor contamination levels in a formation fluid |
| US7586087B2 (en) * | 2007-01-24 | 2009-09-08 | Schlumberger Technology Corporation | Methods and apparatus to characterize stock-tank oil during fluid composition analysis |
| US8986253B2 (en) | 2008-01-25 | 2015-03-24 | Tandem Diabetes Care, Inc. | Two chamber pumps and related methods |
| CN101532385B (en) * | 2008-03-11 | 2015-12-02 | 普拉德研究及开发股份有限公司 | For method and the device of extracting high-viscosity formation fluid sample |
| US8408421B2 (en) | 2008-09-16 | 2013-04-02 | Tandem Diabetes Care, Inc. | Flow regulating stopcocks and related methods |
| CA2737461A1 (en) | 2008-09-19 | 2010-03-25 | Tandem Diabetes Care, Inc. | Solute concentration measurement device and related methods |
| US8926561B2 (en) | 2009-07-30 | 2015-01-06 | Tandem Diabetes Care, Inc. | Infusion pump system with disposable cartridge having pressure venting and pressure feedback |
| US9091151B2 (en) | 2009-11-19 | 2015-07-28 | Halliburton Energy Services, Inc. | Downhole optical radiometry tool |
| AU2009356978B2 (en) | 2009-12-23 | 2013-08-01 | Halliburton Energy Services, Inc. | Interferometry-based downhole analysis tool |
| BR112012027653A2 (en) | 2010-06-01 | 2016-08-16 | Halliburton Energy Services Inc | method and system for measuring formation properties |
| AU2010355321B2 (en) | 2010-06-16 | 2014-02-27 | Halliburtion Energy Services, Inc. | Downhole sources having enhanced IR emission |
| US8632625B2 (en) | 2010-06-17 | 2014-01-21 | Pason Systems Corporation | Method and apparatus for liberating gases from drilling fluid |
| EP3875994B1 (en) * | 2010-12-08 | 2025-04-09 | Halliburton Energy Services, Inc. | Fluid properties including equation of state modeling with optical constraints |
| US9180242B2 (en) | 2012-05-17 | 2015-11-10 | Tandem Diabetes Care, Inc. | Methods and devices for multiple fluid transfer |
| US9555186B2 (en) | 2012-06-05 | 2017-01-31 | Tandem Diabetes Care, Inc. | Infusion pump system with disposable cartridge having pressure venting and pressure feedback |
| US9074460B2 (en) * | 2013-01-18 | 2015-07-07 | Schlumberger Technology Corporation | Method of analyzing a petroleum reservoir |
| US9173998B2 (en) | 2013-03-14 | 2015-11-03 | Tandem Diabetes Care, Inc. | System and method for detecting occlusions in an infusion pump |
| US9606260B2 (en) | 2013-04-18 | 2017-03-28 | Schlumberger Technology Corporation | Oil based drilling mud filtrate contamination monitoring using gas to oil ratio |
| US10316655B2 (en) * | 2013-11-20 | 2019-06-11 | Schlumberger Technology Corporation | Method and apparatus for consistent and robust fitting in oil based mud filtrate contamination monitoring from multiple downhole sensors |
| US9542511B2 (en) | 2013-12-27 | 2017-01-10 | Halliburton Energy Services, Inc. | Synthetic gas-oil-ratio determination for gas dominant fluids |
| US10858935B2 (en) * | 2014-01-27 | 2020-12-08 | Schlumberger Technology Corporation | Flow regime identification with filtrate contamination monitoring |
| US10352160B2 (en) | 2014-01-27 | 2019-07-16 | Schlumberger Technology Corporation | Method of estimating uncontaminated fluid properties during sampling |
| US10577928B2 (en) | 2014-01-27 | 2020-03-03 | Schlumberger Technology Corporation | Flow regime identification with filtrate contamination monitoring |
| US9557312B2 (en) | 2014-02-11 | 2017-01-31 | Schlumberger Technology Corporation | Determining properties of OBM filtrates |
| US10605797B2 (en) * | 2014-02-12 | 2020-03-31 | Schlumberger Technology Corporation | Fluid analysis methods and apparatus for determining gas-oil ratio |
| US11802480B2 (en) * | 2014-04-15 | 2023-10-31 | Halliburton Energy Services, Inc. | Determination of downhole conditions using circulated non-formation gasses |
| US10731460B2 (en) | 2014-04-28 | 2020-08-04 | Schlumberger Technology Corporation | Determining formation fluid variation with pressure |
| US10316656B2 (en) | 2014-04-28 | 2019-06-11 | Schlumberger Technology Corporation | Downhole real-time filtrate contamination monitoring |
| US20160042100A1 (en) * | 2014-08-05 | 2016-02-11 | Baker Hughes Incorporated | Unphysical phase split detection |
| US10073042B2 (en) | 2014-08-29 | 2018-09-11 | Schlumberger Technology Corporation | Method and apparatus for in-situ fluid evaluation |
| US11768191B2 (en) * | 2014-11-06 | 2023-09-26 | Schlumberger Technology Corporation | Methods and systems for estimation of oil formation volume factor |
| US10371690B2 (en) | 2014-11-06 | 2019-08-06 | Schlumberger Technology Corporation | Methods and systems for correction of oil-based mud filtrate contamination on saturation pressure |
| US10184334B2 (en) | 2014-12-11 | 2019-01-22 | Schlumberger Technology Corporation | Analyzing reservoir using fluid analysis |
| US10294785B2 (en) * | 2014-12-30 | 2019-05-21 | Schlumberger Technology Corporation | Data extraction for OBM contamination monitoring |
| BR112017023320A2 (en) | 2015-04-27 | 2018-08-14 | Virtual Fluid Monitoring Services LLC | fluid analysis and monitoring systems, apparatus and methods |
| US10591388B2 (en) | 2015-04-27 | 2020-03-17 | Virtual Fluid Monitoring Services LLC | Fluid analysis and monitoring using optical spectroscopy |
| CN105675501B (en) * | 2016-03-30 | 2018-05-25 | 清华大学 | A kind of fluid composition analysis instrument and its detection channels method for arranging |
| WO2019221758A1 (en) * | 2018-05-18 | 2019-11-21 | Halliburton Energy Services, Inc. | Determination of downhole formation fluid contamination and certain component concentrations |
| US11442019B2 (en) | 2018-06-19 | 2022-09-13 | Virtual Fluid Monitoring Services, Llc | Fluid analysis and monitoring using optical spectroscopy |
| US12392241B2 (en) | 2018-12-21 | 2025-08-19 | Schlumberger Technology Corporation | Determining reservoir fluid properties from downhole fluid analysis data using machine learning |
| CN109989743B (en) * | 2019-05-06 | 2022-09-06 | 中海油田服务股份有限公司 | Method and system for determining invasion depth of mud filtrate |
| CN111580784B (en) * | 2020-04-10 | 2023-07-25 | 科大讯飞股份有限公司 | Power function calculation device and power function calculation method |
| US20230323773A1 (en) * | 2022-04-06 | 2023-10-12 | Schlumberger Technology Corporation | Methods, devices, and systems for diagnosing contaminants in drilling fluid |
Citations (3)
| Publication number | Priority date | Publication date | Assignee | Title |
|---|---|---|---|---|
| US5612493A (en) * | 1995-04-26 | 1997-03-18 | Alexander; Lloyd G. | Method of determining gas-oil ratios from producing oil wells |
| US6274865B1 (en) * | 1999-02-23 | 2001-08-14 | Schlumberger Technology Corporation | Analysis of downhole OBM-contaminated formation fluid |
| CN1333459A (en) * | 2001-06-07 | 2002-01-30 | 西安石油学院 | Whole reservior sampling tester |
Family Cites Families (22)
| Publication number | Priority date | Publication date | Assignee | Title |
|---|---|---|---|---|
| US4492862A (en) * | 1981-08-07 | 1985-01-08 | Mathematical Sciences Northwest, Inc. | Method and apparatus for analyzing components of hydrocarbon gases recovered from oil, natural gas and coal drilling operations |
| CA1257712A (en) * | 1985-11-27 | 1989-07-18 | Toshimasa Tomoda | Metering choke |
| US4961343A (en) * | 1986-01-13 | 1990-10-09 | Idl, Inc. | Method for determining permeability in hydrocarbon wells |
| US4936139A (en) * | 1988-09-23 | 1990-06-26 | Schlumberger Technology Corporation | Down hole method for determination of formation properties |
| US4860581A (en) * | 1988-09-23 | 1989-08-29 | Schlumberger Technology Corporation | Down hole tool for determination of formation properties |
| US5166747A (en) * | 1990-06-01 | 1992-11-24 | Schlumberger Technology Corporation | Apparatus and method for analyzing the composition of formation fluids |
| US5266800A (en) * | 1992-10-01 | 1993-11-30 | Schlumberger Technology Corporation | Method of distinguishing between crude oils |
| US5331156A (en) * | 1992-10-01 | 1994-07-19 | Schlumberger Technology Corporation | Method of analyzing oil and water fractions in a flow stream |
| EP0859236A1 (en) | 1997-02-14 | 1998-08-19 | Bp Chemicals S.N.C. | Determination of properties of oil |
| US5859430A (en) * | 1997-04-10 | 1999-01-12 | Schlumberger Technology Corporation | Method and apparatus for the downhole compositional analysis of formation gases |
| US5939717A (en) * | 1998-01-29 | 1999-08-17 | Schlumberger Technology Corporation | Methods and apparatus for determining gas-oil ratio in a geological formation through the use of spectroscopy |
| US6627873B2 (en) * | 1998-04-23 | 2003-09-30 | Baker Hughes Incorporated | Down hole gas analyzer method and apparatus |
| US6218662B1 (en) * | 1998-04-23 | 2001-04-17 | Western Atlas International, Inc. | Downhole carbon dioxide gas analyzer |
| US6178815B1 (en) * | 1998-07-30 | 2001-01-30 | Schlumberger Technology Corporation | Method to improve the quality of a formation fluid sample |
| US6350986B1 (en) | 1999-02-23 | 2002-02-26 | Schlumberger Technology Corporation | Analysis of downhole OBM-contaminated formation fluid |
| US6507401B1 (en) * | 1999-12-02 | 2003-01-14 | Aps Technology, Inc. | Apparatus and method for analyzing fluids |
| US6672163B2 (en) * | 2000-03-14 | 2004-01-06 | Halliburton Energy Services, Inc. | Acoustic sensor for fluid characterization |
| US6437326B1 (en) * | 2000-06-27 | 2002-08-20 | Schlumberger Technology Corporation | Permanent optical sensor downhole fluid analysis systems |
| US6476384B1 (en) * | 2000-10-10 | 2002-11-05 | Schlumberger Technology Corporation | Methods and apparatus for downhole fluids analysis |
| US6474152B1 (en) * | 2000-11-02 | 2002-11-05 | Schlumberger Technology Corporation | Methods and apparatus for optically measuring fluid compressibility downhole |
| US6737864B2 (en) * | 2001-03-28 | 2004-05-18 | Halliburton Energy Services, Inc. | Magnetic resonance fluid analysis apparatus and method |
| US7173239B2 (en) * | 2003-03-14 | 2007-02-06 | Baker Hughes Incorporated | Method and apparatus for downhole quantification of methane using near infrared spectroscopy |
-
2003
- 2003-03-27 US US10/249,274 patent/US6956204B2/en not_active Expired - Lifetime
-
2004
- 2004-03-17 GB GB0405934A patent/GB2400910B/en not_active Expired - Lifetime
- 2004-03-17 GB GB0520798A patent/GB2422429B/en not_active Expired - Lifetime
- 2004-03-23 CA CA002461933A patent/CA2461933C/en not_active Expired - Lifetime
- 2004-03-26 FR FR0450604A patent/FR2853076A1/en active Pending
- 2004-03-27 CN CNB2004100352609A patent/CN100487427C/en not_active Expired - Lifetime
- 2004-03-27 CN CN2008101817029A patent/CN101446552B/en not_active Expired - Lifetime
Patent Citations (3)
| Publication number | Priority date | Publication date | Assignee | Title |
|---|---|---|---|---|
| US5612493A (en) * | 1995-04-26 | 1997-03-18 | Alexander; Lloyd G. | Method of determining gas-oil ratios from producing oil wells |
| US6274865B1 (en) * | 1999-02-23 | 2001-08-14 | Schlumberger Technology Corporation | Analysis of downhole OBM-contaminated formation fluid |
| CN1333459A (en) * | 2001-06-07 | 2002-01-30 | 西安石油学院 | Whole reservior sampling tester |
Also Published As
| Publication number | Publication date |
|---|---|
| US6956204B2 (en) | 2005-10-18 |
| FR2853076A1 (en) | 2004-10-01 |
| GB2400910B (en) | 2006-06-07 |
| CA2461933C (en) | 2008-02-12 |
| CN100487427C (en) | 2009-05-13 |
| CA2461933A1 (en) | 2004-09-27 |
| CN1540317A (en) | 2004-10-27 |
| GB0520798D0 (en) | 2005-11-23 |
| GB2422429A (en) | 2006-07-26 |
| CN101446552A (en) | 2009-06-03 |
| GB2422429B (en) | 2007-09-26 |
| GB2400910A (en) | 2004-10-27 |
| GB0405934D0 (en) | 2004-04-21 |
| US20040193375A1 (en) | 2004-09-30 |
Similar Documents
| Publication | Publication Date | Title |
|---|---|---|
| CN101446552B (en) | Determining fluid properties from fluid analyzer | |
| US9442217B2 (en) | Methods for characterization of petroleum reservoirs employing property gradient analysis of reservoir fluids | |
| US9416656B2 (en) | Assessing reservoir connectivity in hydrocarbon reservoirs | |
| US8805617B2 (en) | Methods and apparatus for characterization of petroleum fluids contaminated with drilling mud | |
| US8271248B2 (en) | Methods and apparatus for characterization of petroleum fluids and applications thereof | |
| US9410936B2 (en) | Methods and apparatus for characterization of petroleum fluid employing analysis of high molecular weight components | |
| US7526953B2 (en) | Methods and apparatus for the downhole characterization of formation fluids | |
| US9255475B2 (en) | Methods for characterizing asphaltene instability in reservoir fluids | |
| US9416647B2 (en) | Methods and apparatus for characterization of hydrocarbon reservoirs | |
| CN101230780B (en) | Methods and apparatus to characterize stock-tank oil during fluid composition analysis | |
| US8996346B2 (en) | Methods for characterization of petroleum fluid and application thereof | |
| US8434357B2 (en) | Clean fluid sample for downhole measurements | |
| US9322268B2 (en) | Methods for reservoir evaluation employing non-equilibrium compositional gradients | |
| US10989835B2 (en) | Methods and systems for calculating and evaluating value of information for reservoir fluid models derived from DFA tool data | |
| US20040233446A1 (en) | [optical fluid analysis signal refinement] | |
| US10345481B2 (en) | Asphaltene gradient modeling methods | |
| CN1280523C (en) | Determining the viscosity of a hydrocarbon reservoir fluid | |
| US12487202B2 (en) | Estimation of dielectric properties of a downhole fluid | |
| WO2025010301A1 (en) | Fluid property estimation based on electromagnetic measurements | |
| AU2005204311B2 (en) | Optical fluid analysis signal refinement |
Legal Events
| Date | Code | Title | Description |
|---|---|---|---|
| C06 | Publication | ||
| PB01 | Publication | ||
| C10 | Entry into substantive examination | ||
| SE01 | Entry into force of request for substantive examination | ||
| C14 | Grant of patent or utility model | ||
| GR01 | Patent grant | ||
| CX01 | Expiry of patent term |
Granted publication date: 20110406 |
|
| CX01 | Expiry of patent term |