CN100353326C - Appts. and method for recovery of data in lossy transmission environment - Google Patents
Appts. and method for recovery of data in lossy transmission environment Download PDFInfo
- Publication number
- CN100353326C CN100353326C CNB988125862A CN98812586A CN100353326C CN 100353326 C CN100353326 C CN 100353326C CN B988125862 A CNB988125862 A CN B988125862A CN 98812586 A CN98812586 A CN 98812586A CN 100353326 C CN100353326 C CN 100353326C
- Authority
- CN
- China
- Prior art keywords
- set forth
- candidate
- measure
- motion
- evaluation
- Prior art date
- Legal status (The legal status is an assumption and is not a legal conclusion. Google has not performed a legal analysis and makes no representation as to the accuracy of the status listed.)
- Expired - Fee Related
Links
- 238000000034 method Methods 0.000 title claims abstract description 177
- 230000005540 biological transmission Effects 0.000 title abstract description 75
- 238000011084 recovery Methods 0.000 title description 104
- 230000033001 locomotion Effects 0.000 claims description 170
- 238000011156 evaluation Methods 0.000 claims description 58
- 238000012545 processing Methods 0.000 claims description 47
- 238000005259 measurement Methods 0.000 claims description 36
- 230000002123 temporal effect Effects 0.000 claims description 24
- 238000010606 normalization Methods 0.000 claims description 6
- 238000012935 Averaging Methods 0.000 claims description 4
- 238000004364 calculation method Methods 0.000 claims description 3
- 238000004891 communication Methods 0.000 abstract description 3
- 230000006378 damage Effects 0.000 abstract description 2
- 101710163391 ADP-ribosyl cyclase/cyclic ADP-ribose hydrolase Proteins 0.000 description 110
- 230000008569 process Effects 0.000 description 102
- 239000000872 buffer Substances 0.000 description 87
- 238000013507 mapping Methods 0.000 description 30
- 230000006870 function Effects 0.000 description 22
- 238000013139 quantization Methods 0.000 description 20
- 230000000875 corresponding effect Effects 0.000 description 18
- 230000006835 compression Effects 0.000 description 12
- 238000007906 compression Methods 0.000 description 12
- 238000005192 partition Methods 0.000 description 12
- 230000003044 adaptive effect Effects 0.000 description 10
- 230000003139 buffering effect Effects 0.000 description 10
- 230000008859 change Effects 0.000 description 10
- 230000036961 partial effect Effects 0.000 description 10
- 230000000295 complement effect Effects 0.000 description 8
- 230000000737 periodic effect Effects 0.000 description 6
- 230000015556 catabolic process Effects 0.000 description 5
- 238000006731 degradation reaction Methods 0.000 description 5
- 238000010586 diagram Methods 0.000 description 5
- 230000002829 reductive effect Effects 0.000 description 5
- 238000000926 separation method Methods 0.000 description 5
- 230000000694 effects Effects 0.000 description 4
- 239000000203 mixture Substances 0.000 description 4
- 230000008901 benefit Effects 0.000 description 3
- 238000001514 detection method Methods 0.000 description 3
- 239000006185 dispersion Substances 0.000 description 3
- 230000000873 masking effect Effects 0.000 description 3
- 230000011218 segmentation Effects 0.000 description 3
- 230000003068 static effect Effects 0.000 description 3
- 238000006243 chemical reaction Methods 0.000 description 2
- 230000001186 cumulative effect Effects 0.000 description 2
- 230000003247 decreasing effect Effects 0.000 description 2
- 230000001419 dependent effect Effects 0.000 description 2
- 238000013461 design Methods 0.000 description 2
- 230000006872 improvement Effects 0.000 description 2
- 230000000670 limiting effect Effects 0.000 description 2
- 238000012986 modification Methods 0.000 description 2
- 230000004048 modification Effects 0.000 description 2
- 230000008520 organization Effects 0.000 description 2
- 230000008054 signal transmission Effects 0.000 description 2
- 102000020897 Formins Human genes 0.000 description 1
- 108091022623 Formins Proteins 0.000 description 1
- 238000004458 analytical method Methods 0.000 description 1
- 238000013459 approach Methods 0.000 description 1
- 239000000470 constituent Substances 0.000 description 1
- 238000007796 conventional method Methods 0.000 description 1
- 230000002596 correlated effect Effects 0.000 description 1
- 238000013500 data storage Methods 0.000 description 1
- 230000006735 deficit Effects 0.000 description 1
- 238000012854 evaluation process Methods 0.000 description 1
- 230000008570 general process Effects 0.000 description 1
- 238000009499 grossing Methods 0.000 description 1
- 230000001788 irregular Effects 0.000 description 1
- 239000011159 matrix material Substances 0.000 description 1
- 238000010295 mobile communication Methods 0.000 description 1
- 238000003672 processing method Methods 0.000 description 1
- 239000002096 quantum dot Substances 0.000 description 1
- 230000008521 reorganization Effects 0.000 description 1
- 238000005070 sampling Methods 0.000 description 1
- 238000000638 solvent extraction Methods 0.000 description 1
- 230000005236 sound signal Effects 0.000 description 1
- 230000007480 spreading Effects 0.000 description 1
- 238000006467 substitution reaction Methods 0.000 description 1
- 238000012546 transfer Methods 0.000 description 1
- 230000000007 visual effect Effects 0.000 description 1
Images


Classifications
-
- H—ELECTRICITY
- H04—ELECTRIC COMMUNICATION TECHNIQUE
- H04N—PICTORIAL COMMUNICATION, e.g. TELEVISION
- H04N19/00—Methods or arrangements for coding, decoding, compressing or decompressing digital video signals
- H04N19/50—Methods or arrangements for coding, decoding, compressing or decompressing digital video signals using predictive coding
- H04N19/59—Methods or arrangements for coding, decoding, compressing or decompressing digital video signals using predictive coding involving spatial sub-sampling or interpolation, e.g. alteration of picture size or resolution
-
- H—ELECTRICITY
- H04—ELECTRIC COMMUNICATION TECHNIQUE
- H04N—PICTORIAL COMMUNICATION, e.g. TELEVISION
- H04N19/00—Methods or arrangements for coding, decoding, compressing or decompressing digital video signals
- H04N19/85—Methods or arrangements for coding, decoding, compressing or decompressing digital video signals using pre-processing or post-processing specially adapted for video compression
- H04N19/88—Methods or arrangements for coding, decoding, compressing or decompressing digital video signals using pre-processing or post-processing specially adapted for video compression involving rearrangement of data among different coding units, e.g. shuffling, interleaving, scrambling or permutation of pixel data or permutation of transform coefficient data among different blocks
-
- H—ELECTRICITY
- H04—ELECTRIC COMMUNICATION TECHNIQUE
- H04N—PICTORIAL COMMUNICATION, e.g. TELEVISION
- H04N19/00—Methods or arrangements for coding, decoding, compressing or decompressing digital video signals
- H04N19/85—Methods or arrangements for coding, decoding, compressing or decompressing digital video signals using pre-processing or post-processing specially adapted for video compression
- H04N19/89—Methods or arrangements for coding, decoding, compressing or decompressing digital video signals using pre-processing or post-processing specially adapted for video compression involving methods or arrangements for detection of transmission errors at the decoder
- H04N19/895—Methods or arrangements for coding, decoding, compressing or decompressing digital video signals using pre-processing or post-processing specially adapted for video compression involving methods or arrangements for detection of transmission errors at the decoder in combination with error concealment
-
- H—ELECTRICITY
- H04—ELECTRIC COMMUNICATION TECHNIQUE
- H04N—PICTORIAL COMMUNICATION, e.g. TELEVISION
- H04N19/00—Methods or arrangements for coding, decoding, compressing or decompressing digital video signals
- H04N19/90—Methods or arrangements for coding, decoding, compressing or decompressing digital video signals using coding techniques not provided for in groups H04N19/10-H04N19/85, e.g. fractals
- H04N19/98—Adaptive-dynamic-range coding [ADRC]
-
- H—ELECTRICITY
- H04—ELECTRIC COMMUNICATION TECHNIQUE
- H04N—PICTORIAL COMMUNICATION, e.g. TELEVISION
- H04N21/00—Selective content distribution, e.g. interactive television or video on demand [VOD]
- H04N21/40—Client devices specifically adapted for the reception of or interaction with content, e.g. set-top-box [STB]; Operations thereof
- H04N21/41—Structure of client; Structure of client peripherals
- H04N21/426—Internal components of the client ; Characteristics thereof
-
- H—ELECTRICITY
- H04—ELECTRIC COMMUNICATION TECHNIQUE
- H04N—PICTORIAL COMMUNICATION, e.g. TELEVISION
- H04N5/00—Details of television systems
- H04N5/14—Picture signal circuitry for video frequency region
- H04N5/21—Circuitry for suppressing or minimising disturbance, e.g. moiré or halo
Landscapes
- Engineering & Computer Science (AREA)
- Multimedia (AREA)
- Signal Processing (AREA)
- Compression Or Coding Systems Of Tv Signals (AREA)
- Error Detection And Correction (AREA)
- Detection And Prevention Of Errors In Transmission (AREA)
Abstract
A system and method for receiving damage data in a bitstream of encoded data (1705) is disclosed. In one embodiment, a plurality of candidate decodings (1710) for a plurality of encoded data are generated. A measure is generated for each block based upon the candidate decodings (1715). A candidate decoding (1720) is selected based upon the measure. In one embodiment, this is used in the transmission of video signals over a potentially lossy communications channel.
Description
Background
1. Related application
This application is a continuation of U.S. patent application serial No.09/016,083 entitled "Source Coding to Provide enhanced Error Recovery at Transmission loss" filed on 30.1.1998, whereas it is a continuation of U.S. patent application serial No.09/002,547 entitled "Image-to-Block Mapping to Provide enhanced Error Recovery at Transmission loss" filed on 2.1.1998, an application serial No.09/002,547 entitled "Source Coding to Provide enhanced Error Recovery at Transmission loss" filed on 2.1.1998, an application serial No. for "Source Coding to Provide enhanced Error Recovery for Transmission loss" filed on 2.1.1998, and an application serial No. 1998 Transmission serial No.09/002,470 entitled "Source Coding to Provide enhanced Error Recovery at Transmission loss" filed on 1.38.1998, and a Transmission Method for providing enhanced Error Recovery at Transmission loss "filed on 3.38.2. In the multi-block recovery method) ", application serial No.09/002,553; they are application serial No.08/965,632 entitled "Image-to-Block Mapping to Provide enhanced Error Recovery at Transmission loss" filed on 23/10 1997, application serial No.08/957,555 entitled "Source Coding to Provide enhanced Error Recovery at Transmission loss" filed on 23/10 1997, and application serial No.08/956,870 entitled "Multiple Block Based Recovery method for Robust Recovery at Transmission loss" filed on 23/10 1997. Application Serial No.09/016,083 filed on 30/1/1998, application Serial No.09/002,547 filed on 2/1/1998, application Serial No.09/002,470 filed on 2/1/1998, application Serial No.09/002,553 filed on 2/1/1998, application Serial No.08/956,632 filed on 23/10/1997, application Serial No.08/957,555 filed on 23/10/1997, and application Serial No.08/956,870 filed on 23/10/1997 are all incorporated herein by reference.
2. Field of the invention
The present invention relates to providing enhanced recovery from errors due to data loss occurring during signal transmission.
3. Background of the invention
There are many techniques for reconstructing lost data due to random errors occurring during signal transmission. However, these techniques cannot handle the loss of consecutive data packets. The continuous loss of data packets is described in the art as a burst error. Burst errors result in a very noticeable degradation of the reconstructed signal to the end user. In addition, the compression method for facilitating high-speed communication makes signal degradation caused by burst errors more severe, and thus makes reconstructed signals worse. Examples of burst error losses affecting transmitted and/or stored signals are seen in high definition television ("HDTV") signals and mobile telecommunications applications where compression methods play an important role.
The advent of HDTV has introduced television systems with higher resolution than the standard currently proposed by the National television systems Committee ("NTSC" National television systems Committee). The proposed HDTV signal is mainly digital. Therefore, when converting color television signals to digital use, it is common for luminance and chrominance signals to be digitized using eight bits. Digital transmission for color television requires a nominal bit rate of 216 megabits per second. The transmission rate of HDTV is higher and nominally requires approximately 1200 megabits per second. This high transmission rate greatly exceeds the bandwidth supported by current wireless standards. Therefore, an efficient compression method is required.
Compression methods also play an important role in mobile telecommunications applications. Typically, data packets are communicated between remote terminals of a mobile telecommunications application. The limited number of transmission channels in mobile communications requires efficient compression methods prior to packet transmission. Various compression methods are used to facilitate high transmission rates.
Adaptive dynamic range coding ("ADRC") and discrete cosine transform ("DCT") coding provide image compression techniques known in the art. Both techniques exploit local correlation within the image to achieve high compression ratios. However, efficient compression algorithms result in more severe error propagation because errors in the encoded signal are more pronounced when subsequently decoded. This erroneous reproduction results in a video image quality degradation that is very noticeable to the user.
Summary of The Invention
The invention describes a method of source coding a signal. Specifically, a signal including a plurality of signal units is processed. Each signal unit is encoded to form a bit stream. The bits within a given bitstream are dispersed into different bitstreams. Thus, the parameters describing the composition of the segmentation units are spread out into different bit streams. The scatter step results in the scattering of errors into multiple levels. Therefore, when the scattering step is performed reversely by the decoder, the burst transmission errors become scattered local loss groups.
Another method for a multiple level shuffling (shuffling) process is also described. A signal is defined as being multi-level, where each level includes a plurality of frames, a plurality of pixels, and a plurality of bits. In one embodiment, shuffling occurs from stage to stage. The multiple level shuffling causes burst error loss to be distributed among multiple levels, thereby facilitating image reconstruction of image regions where loss occurs.
Brief description of the drawings
The objects, features and advantages of the present invention will become apparent to those skilled in the art from the following detailed description, in which:
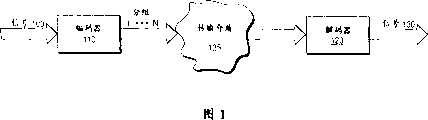
fig. 1 generally illustrates a signal encoding, transmission, and decoding process.
Fig. 2 illustrates one embodiment of a packet structure.
Fig. 3 is a flow chart illustrating one embodiment of an encoding process according to the inventive concept.
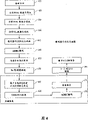
Fig. 4 is a flow chart illustrating one embodiment of a decoding process according to the inventive concept.
Fig. 5 illustrates one embodiment of an image-to-block mapping in accordance with the concepts of the present invention.
FIG. 5a illustrates one embodiment of a shuffle pattern used in the image-to-block mapping.
Fig. 6 illustrates an exemplary complementary and interlocking block structure.
Figures 7a, 7b, 7c and 7d illustrate one embodiment of a shuffle pattern for Y blocks within a frame combination.
FIG. 8 illustrates one embodiment of the cumulative DR distribution of buffer 0.
Figure 8a illustrates one embodiment of a partial shuffle process in accordance with the concepts of the present invention.
Fig. 9 illustrates one embodiment of a YUV block shuffling process within a buffer in accordance with the concepts of the present invention.
FIG. 10 illustrates one embodiment of an intra-group VL data shuffling process in accordance with the concepts of the present invention.
Fig. 11 illustrates one embodiment of Q-code concatenation within a 3-block combination in accordance with the present inventive concept.
Fig. 11a illustrates one embodiment of Q-code concatenation for a frame pair including a motion block in accordance with the present inventive concept.
FIG. 12 illustrates 1/6 one embodiment of a pixel data error caused by a burst error loss.
Figure 12a illustrates one embodiment of shuffling Q-codes and distributing Q-code bits in accordance with the concepts of the present invention.
Figure 12b illustrates one embodiment of pixel data errors caused by a burst error loss of 1/6 of the redistributed Q code.
Figure 12c illustrates one embodiment of pixel data errors caused by a burst error loss of 1/6 reassigning the Q code.
Figure 13 illustrates one embodiment of MIN shuffling in accordance with the concepts of the present invention.
Figure 13a illustrates one embodiment of motion flag shuffling and fixed length data loss in one frame pair.
FIG. 14 illustrates one embodiment of a modular shuffle.
Figure 14a illustrates one embodiment of a modulo shuffle result and a fixed length data loss associated with the modulo shuffle.
Figure 14b illustrates another embodiment of the modulo shuffle result and fixed length data loss associated with the modulo shuffle.
Figure 14c illustrates yet another embodiment of the modulo shuffle result and fixed length data loss associated with the modulo shuffle.
Fig. 15 illustrates one embodiment of variable length data buffering in frame assembly.
FIG. 16 illustrates one embodiment of an inter-segment VL-data shuffle in accordance with the concepts of the present invention.
FIG. 17 is a flow diagram generally illustrating one embodiment of the data recovery process of the present invention.
Fig. 18 is a flow diagram of one embodiment of the qbit and motion flag recovery process of the present invention.
Fig. 19 is a table illustrating one embodiment of candidate decoding.
Fig. 20a, 20b, 20c, 20d illustrate embodiments of measurements used in the qbit and motion flag recovery process of fig. 18.
Fig. 21 illustrates one embodiment of a table for determining the squared error probability function for the qbit and motion flag recovery process of fig. 18.
Fig. 22 illustrates one embodiment of a qbit, motion flag, and side information recovery process in accordance with the concepts of the present invention.
Fig. 23 illustrates the use of a post-synchronization signal in one embodiment of a bi-directional qbit and motion flag recovery process.
Fig. 24a, 24b and 24c illustrate another embodiment of evaluating candidate decodes.
FIG. 25 conceptually illustrates the use of smoothing measures, according to one embodiment of the present invention.
Fig. 26a, 26b, 26c, 26d and 26e illustrate another embodiment of evaluating candidate decoding processes.
FIG. 27a illustrates another process of evaluating candidate decodes and FIG. 27b illustrates one embodiment of determining weight values.
Detailed Description
The present invention provides a method of encoding and arranging a signal stream to provide enhanced error recovery. In the following description, for purposes of explanation, numerous details are set forth in order to provide a thorough understanding of the present invention. However, it will be apparent to one skilled in the art that these specific details are not required in order to practice the present invention. In other instances, well-known electrical structures and circuits are shown in block diagram form in order not to unnecessarily obscure the present invention.
The signal processing method and structure are described from the perspective of one embodiment in which the signal is a video signal. However, the methods and apparatus described herein are intended to be applicable to various types of signals, including sound signals or other digital data bit streams, where each signal is made up of a plurality of signal elements. In addition, the processing embodiments described herein use an adaptive dynamic range coding ("ADRC") process to compress data; various encoding techniques and algorithms may be used. For a more detailed discussion of ADRC, see "adaptive Dynamic ranging coding Scheme for Future HDTV Digital VTR", Kondo, Fujimmori and Nakaya, Fourth International Workshop HDTV and Beyond, 1991, Duling, Italy, 9, 4, 6.
In the above article, three different types of ADRCs are explained. They are all realized according to the following formula:
non-edge matching ADRC:
DR=MAX-MIN+ 1
edge matching ADRC:
DR=MAX-MIN
multistage ADRC:
DR=MAX-MIN+ 1
where MAX' is defined as q-2Q-average value of x' in case 1; MIN 'is the average of x' in the case where q ═ 0; and also
DR=MAX-MIN
Where MAX represents the highest level of a block, MIN represents the lowest level of a block, x represents the signal level of each sample, Q represents the number of quantization bits, Q represents the quantization code (encoded data), x' represents the decoding level of each sample, and brackets [ ] represent truncation operations performed on the values within brackets.
The signal decoding, transmission and subsequent decoding processes are generally illustrated in fig. 1. Signal 100 is a data stream input to encoder 110. Encoder 110 follows an adaptive dynamic range coding ("ADRC") compression algorithm and produces packets 1. Decoder 120 receives packets 1.. -, N from transmission medium 135 and generates signal 130. Signal 130 is a reconstruction of signal 100.
The encoder 110 and decoder 120 may be implemented in various ways to perform the functions described herein. In one embodiment, the encoder 110 and/or decoder 120 are implemented as software stored on a medium and executed by a general-purpose or specially-configured computer system, which typically includes a central processing unit, memory, and one or more input/output devices and co-processors. Alternatively, encoder 110 and/or decoder 120 may be implemented as logic that performs the functions described herein. Further, the encoder 110 and/or decoder 120 may be implemented as a combination of hardware, software, or firmware.
In this embodiment, signal 100 is a color video image comprised of a sequence of video frames, each frame including information representative of an image in an interlaced video system. Each frame consists of two fields, one field containing data for the even lines of the picture and the other field containing data for the odd lines of the picture. The data includes pixel values describing color components of corresponding locations in the image. For example, in the present invention, the color component is composed of a luminance signal Y and color difference signals U and V. It is obvious that the process of the invention can be used for other signals than interlaced video signals. Furthermore, it is clear that the invention is not limited to implementations in Y, U, V color space, but can be used for images represented in other color spaces.
Referring back to fig. 1, the encoder 110 separates the Y, U and V signals and independently processes each set of signals according to the ADRC algorithm, respectively. For simplicity of discussion, the following description describes the processing of the Y signal, but the encoding steps are repeated for the U and V signals.
In this embodiment, encoder 110 groups the Y signal of signal 100 across two consecutive frames into three-dimensional ("3D") blocks, referred to herein as a frame pair. For one embodiment, a 3D block is generated from the combination of two 2D blocks from the same local area on a given pair of frames, where a two-dimensional 2D block is generated by local pixel combination within a frame or field. It is contemplated that the processes described herein may be used with different block structures. The signal combination will be further described in the image-to-block mapping section below.
Continuing with the present embodiment, for a given 3D block, the encoder 110 calculates whether there is a change in pixel values between 2D blocks that make up the 3D block. If there is a substantial change in the value, a motion flag is set. As is known in the art, the use of motion flags allows the encoder 110 to reduce the number of quantization codes when there are local image repetitions within each frame pair. The encoder 110 also detects a maximum pixel intensity value ("MAX") and a minimum pixel intensity value ("MIN") within the 3D block. Using the values MAX and MIN, the encoder 110 calculates the dynamic range ("DR") for a given 3D data block. For one embodiment, DR MAX-MIN +1 in the case of non-edge matching ADRC. For edge matching ADRC, DR — MIN. In another embodiment, the encoder 110 encodes a stream of frames signal representing a series of video frames on a frame-by-frame basis. In another embodiment, the encoder 110 encodes a field stream signal representing a series of video domains on a field-by-field basis. Thus, instead of using motion markers, the 2D blocks are used to calculate MIN, MAX and DR values.
In this embodiment, the encoder 110 references the calculated DR against a threshold table (not shown) to determine the number of quantization bits ("Qbits") used to encode the pixels within the block to which the DR corresponds. Encoding the pixels produces a quantized code ("Q code"). The Q code is relatively compressed image data for storage or transmission.
In one embodiment, the qbit selection is derived from the DR of the 3D block. Thus, all pixels within a given 3D block are encoded using the same qbit to obtain a 3D encoded block. The set of Q-code, MIN, motion flag, and DR of the 3D encoded block is referred to as the 3D ADRC block. Alternatively, the 2D block is encoded and the 2D ADRC block is generated given a set of Q code, MIN, and DR of the 2D block.
Multiple threshold tables may be implemented. In one embodiment, the threshold table consists of a row of DR threshold values. The Q bits correspond to the number of quantization bits used to encode a set of DR values between two adjacent DRs in a row of the threshold table. In another embodiment, the threshold table comprises a plurality of rows, the selection of the rows being based on a desired transmission rate. Each row in the threshold table is identified by a threshold index. A detailed description of one embodiment of threshold selection is described below when discussing partial caching. Further description of ADRC encoding and buffering is disclosed in U.S. Pat. No.4,722,003 entitled "High Efficiency Coding Apparatus" and U.S. Pat. No.4,845,560 entitled "High Efficiency Coding Apparatus" both assigned to the assignee of the present invention.
The Q code is thus referred to as variable length data ("VL-data"). In addition, DR, MIN, and the motion flag are referred to as block attributes. The block attributes and the threshold index constitute fixed length data ("FL-data"). Further, in view of the above discussion, the term block attribute describes a parameter related to a component of a signal element, where the signal element includes a plurality of components. In another embodiment, the FL-data packet includes a Q-bit code. The benefit is that the Q-bit information does not have to be derived from the DR during decoding. Therefore, if the DR information is lost or damaged, the Q-bit information can also be determined from the Q-bit code. In addition, if the qbit code is lost or corrupted, the qbit information can be derived from the DR. Thus, the requirement to recover the DR and Q bits is reduced.
The disadvantage of requiring Q-bit codes to be included is that each ADRC block has additional bits to transmit. However, in one embodiment, the Q-bit codes used to combine the ADRC blocks are combined according to a function such as addition or concatenation. For example, if the ADRC blocks are grouped into three groups, and if the Q-bit value of each ADRC block is 3, and 4, respectively, the sum value encoded as FL-data is 11. Thus, the number of bits required to represent the sum is less than the number of bits required to represent each individual value, and the uncorrupted Q-bit values in the group can be used to determine the Q-bit values without having to perform a Q-bit recovery process of the type described below.
Other embodiments are also contemplated. For example, motion flag data may also be encoded. A flag with qbit and motion flag data can be generated and used to look up the code table. The configuration and function of the code may vary depending on the application.
The frame, block attributes, and VL-data describe various components within the video signal. The boundaries, location and number of these components depend on the transmission and compression characteristics of the video signal. In this embodiment, these components are variable and shuffled in the video signal bitstream to ensure enhanced error recovery at transmission losses.
For purposes of illustration, the following description specifies 1/6 a continuous packet transmission loss tolerance, following ADRC encoding and shuffling of video signals. Thus, the following component definitions and divisions are used in one embodiment. Other embodiments are also contemplated. A data set comprises a portion of video data or other type of data signal. Thus, in one embodiment, a frame set is a type of data set that includes one or more consecutive frames. A segment includes a memory capable of storing 1/6 portions of the Q code along with block attributes included in the frame set. In addition, the buffer includes a memory capable of storing 1/60 portions of the Q code along with block attributes included in the frame set. The data shuffling is performed by exchanging components within the segments and/or within the buffers. Thereafter, the data stored in the segment is used to generate a data packet for transmission. Therefore, in the following description, if a segment is lost, all packets generated from the segment are lost in transmission. Similarly, if a portion of a segment is lost, then a corresponding number of packets resulting from the segment are lost in transmission.
Although the following description refers to data encoded with ADRC having 1/6 consecutive packet losses, it is contemplated that the methods and apparatus described herein may be used in the design of 1/n consecutive packet loss margins that are employed in various encoding/decoding schemes.
Fig. 2 illustrates one embodiment of a packet structure 200 for transmitting data in a point-to-point connection as well as a network. Packet structure 200 is generated by encoder 110 and transmitted over transmission medium 135. For one embodiment, packet structure 200 includes 5 bytes of header information, 8 DR bits, 8 MIN bits, one motion flag bit, 5 threshold index bits, and a 354 bit Q code. The packet structure described herein is illustrative and can be used for transmission in an asynchronous transfer mode ("ATM") network. However, the present invention is not limited to the described packet structure, and various packet structures used in various networks may be used.
As noted previously, the transmission medium (e.g., media) 135 is not considered capable of providing error-free transmission, and thus packets may be lost or corrupted. As noted previously, conventional methods exist to detect such loss or corruption, but in practice image degradation typically occurs. The system and method of the present invention thus teaches source coding that enhances recovery from such losses or impairments. Throughout the following discussion it is assumed that burst loss (i.e., loss of several consecutive packets) is the most likely form of error, but some random packet loss may also occur.
To ensure enhanced recovery from loss of one or more consecutive data packets, the system and method of the present invention provides a multi-level shuffle. Specifically, the FL-data and VL-data included in the transmitted packets contain data at spatially and temporally separated data locations. Shuffling the data ensures that any burst errors are spread out and facilitates error recovery. As described below, shuffling enables block attributes and Q-bit values to be recovered.
Data encoding/decoding
Fig. 3 is a flow diagram illustrating one embodiment of an encoding process performed by the encoder 110. Figure 3 also depicts an overview of the shuffling process for preventing image degradation and facilitating enhanced error recovery.
In step 1 of fig. 3, an input frame set, also referred to as a display composition, is decimated to reduce transmission requirements. The Y signal is decimated horizontally to 3/4 for its original width, and the U and V signals are decimated to 1/2 for its original height and 1/2 for its original width. This results in a 3:1:0 video format with 3960Y blocks, 660U blocks, and 660V blocks in each frame pair. As noted previously, the discussion will describe the processing of the Y signal; but the process can be used for U and V signals. In step 2, two Y frame images are mapped to a 3D block. In step 3, the 3D blocks are shuffled. At step 4, ADRC buffering and encoding is used. At step 5, the encoded Y, U and V blocks are shuffled in a buffer.
At step 6, a set of VL-data encoding the 3D blocks and their corresponding block attributes are shuffled. At step 7, the FL-data is shuffled across different segments. In step 8, a post-sync signal filling is performed, wherein the variable space at the end of the buffer is filled with a predetermined bit stream. In step 9 the VL-data is shuffled across different segments.
For purposes of illustration, the following shuffle description provides a method of processing pixel data before and after encoding. For another embodiment, the independent data values are shuffled/deshuffled by hardware. In particular, the hardware maps block value addresses to different addresses in order to implement a shuffle/deshuffle process. However, address mapping is not possible for values associated with the data because the shuffle must respect the processing of the data. The intra-group VL-data shuffles described below include values associated with the data. Further, for purposes of illustration, the following shuffling descriptions appear on non-contiguous data sets. However, for another embodiment, the signal is defined based on a variety of data levels, from bit to pixel to frame. Shuffling is possible for each level defined in the signal and spans different signal data levels.
Fig. 4 is a flow diagram illustrating one embodiment of the decoding process performed by the decoder 120. Preferably, the conversion and deshuffling process is the inverse process represented in figure 3. Fig. 4 also depicts the inventive error recovery process in different combinations of qbits, motion flags, DR, MIN, and pixel data. The error recovery process is described below in different combinations of different Q-bits, motion flags, DR, MIN, and pixel recovery for different embodiments.
Mapping from image to block
In this embodiment, a single frame typically includes 5280 2D blocks, each 2D block including 64 pixels. Thus, one frame pair includes 5280 3D blocks because one 2D block from the first frame and a 2D block from the subsequent frame together constitute one 3D block.
In order to divide a frame or set of data frames into 2D blocks or 3D blocks, respectively, an image-to-block mapping is performed. In addition, image-to-block mapping involves dividing pixels in a frame using complementary and/or interlocking patterns to facilitate enhanced error recovery during transmission losses. However, to increase the probability that a given DR value is not too large, each 2D block is constructed from pixels in a local area.
FIG. 5 illustrates one embodiment of an exemplary 16 pixel segmented image-to-block mapping process for an image. Image 500 includes 16 pixels that form a local area of a single frame. Each pixel in the image 500 is represented by an intensity value. For example, the pixels on the top left of the image have intensity values equal to 100, while the pixels on the lower right of the image have intensity values of 10.
In one embodiment, pixels from different regions of image 500 are used to generate 2D blocks 510, 520, 530, and 540. The 2D blocks 510, 520, 530, and 540 are encoded, shuffled (as described below), and transmitted. After transmission, the 2D blocks 510, 520, 530, and 540 are recombined and used to construct the image 550. Image 550 is a reconstruction of image 500.
To ensure that image 500 is accurately represented at possible transmission losses, FIG. 5 is an interlocking complementary block structure for reconstructing image 550, one embodiment of which is shown in FIG. 5. In particular, the selection of pixels used to generate the 2D blocks 510, 520, 530, and 540 may ensure that: the complementary and/or interlocking patterns are used to re-merge blocks when reconstructing the image 550. Thus, when certain 2D block attributes are lost in transmission, successive segments of the image 550 are not distorted during reconstruction. For example, as shown in fig. 5, the DR of the 2D block 540 is lost during data transmission. However, during reconstruction of image 550, the decoder may recover the lost DR of 2D block 540 using multiple neighboring pixels of the neighboring block. Furthermore, as will be described later, the combination of complementary patterns with shuffling increases the number of neighboring pixels, preferably maximizing the number of neighboring pixels originating from other blocks, significantly improving DR and MIN recovery.
FIG. 5a illustrates one embodiment of a shuffle pattern for forming 2D blocks in one embodiment of an image-to-block mapping process. The image is divided into two sub-images, sub-image 560 and sub-image 570, on a pixel-by-pixel basis. A rectangle is formed in the sub-image 560 to describe the boundary of the 2D block. For purposes of discussion, the 2D blocks are numbered 0, 2,4, 7, 9, 11, 12, 14, 16, 19, 21, and 23. Tile (tile)565 illustrates the pixel distribution of a 2D block within sub-image 560.
In sub-image 570, the 2D block assignments are shifted horizontally by 8 pixels and vertically by 4 pixels. This results in a wrap around 2D block assignment and overlap when the sub-images 560 and 570 are combined during reconstruction. The 2D blocks are numbered 1, 3, 5,6, 8, 10, 13, 15, 17, 18, 20, and 22. Tiling 575 illustrates the pixel distribution of the 2D blocks within the sub-image 570. The pad 575 is a complementary structure to the pad 565. Thus, when a particular block attribute is lost during transmission, the block attribute can be recovered from neighboring pixels because the lost 2D block still exists. Furthermore, there are overlapping 2D pixel blocks with similar sets of block attributes. Thus, during reconstruction of the image, the decoder has a number of neighboring pixels from neighboring 2D blocks from which the missing block attributes can be recovered.
Fig. 6 illustrates other complementary and interlocking 2D block structures. Other configurations may also be used. Similar to fig. 5, these 2D block structures illustrated in fig. 6 ensure that surrounding 2D blocks are provided regardless of whether a given 2D block is lost for transmission. However, the patterns 610a, 610b, and 610D use horizontal and/or vertical movement during the pixel-to-subsequent 2D block mapping process. The horizontal movement describes: the tiling structure is moved a predetermined number of pixels in the horizontal direction before starting a new 2D block boundary. The vertical movement describes: the tile structure is moved a predetermined number of pixels in the vertical direction before starting a new 2D block boundary. In an application, only horizontal movement may be used, only vertical movement may be used, or a combination of horizontal and vertical movement may be used.
Fig. 5, 5a and 6 depict image-to-block mapping for generating 2D blocks. Obviously, this process can be used for 3D blocks. As described above, the generation of the 3D block follows the same boundary definition as the 2D block, but the boundary division extends onto the subsequent frames, thereby generating the 3D block. Specifically, the 3D block is generated by collecting pixels defining a 2D block in a first frame and pixels from a 2D block in a subsequent frame. In one embodiment, the pixels in the 2D block from the first frame and the 2D block from the subsequent frame are from the exact same location.
Intra-frame set block shuffling
The pixel values of a given image are closely related in local regions. However, in another region of the same image, the pixel values may have very different values. Thus, after encoding, the DR and MIN values of spatially close 2D or 3D blocks in one portion of the image have similar values, while the DR and MIN values of blocks in another portion of the image may be very different. Thus, when the buffer is sequentially filled with encoded data from spatially close 2D or 3D blocks in the image, a disproportionate buffer space utilization occurs. The intra-frame set block shuffling occurs prior to ADRC encoding and includes shuffling of 2D or 3D blocks generated during the image-to-block mapping process. This shuffling process ensures balanced buffer usage during subsequent ADRC encoding.
Figures 7a-7d illustrate one embodiment of shuffling 3D Y blocks. The 3D Y block in fig. 7a-7d was generated by applying the image-to-block mapping process described above to pairs of frames containing only the Y signal. The shuffling of 3D Y blocks ensures that the buffer used to store the encoded frame pairs contains 3D Y blocks from different parts of the frame pair. This results in similar DR scatter during ADRC encoding. Similar DR scatter within each buffer results in consistent buffer utilization.
Figures 7a-7D also illustrate the use of physically disjointed 3D blocks for 3D block shuffling to ensure that corrupted block attributes resulting from transmission loss of consecutive packets are spread out over the image, rather than in local areas of the image.
The block shuffle design can widely spread block attributes in the presence of small, medium, or large burst packet losses. In the present embodiment, a small amount of burst loss is considered to be several packet losses; medium loss is the loss of the amount of data that can be stored in one buffer; whereas a large loss is a loss of the amount of data that can be stored in a segment. In the 3D block shuffling process, each group of three adjacent blocks is selected from a relatively distant portion of the image. Thus, in a subsequent intra-group VL-data shuffling process (described in detail later), each group is composed of 3D blocks having different statistical properties. By spreading the block property loss, enhanced error recovery may be obtained, since the undamaged 3D blocks surround the damaged 3D block, and the undamaged 3D blocks may be used to recover the lost data.
Fig. 7a illustrates a frame pair comprising 66 3D Y blocks in the horizontal direction and 60 3D Y blocks in the vertical direction. The 3D Y block is assigned to segments 0-5. As illustrated, the designation of 3D Y blocks is segmented by 2 by 3 columns, such that one 3D Y block from each segment is associated with one segment. Thus, if no further shuffling occurs and a burst loss of the first 880 packet occurs, all block attributes associated with segment 0 are lost. Nonetheless, performing the FL-data shuffling further disperses the block attribute loss, as described later.
Fig. 7b illustrates the scanning order of the 3D Y block numbered "0" for entering segment 0. Each "0" 3D Y block of fig. 7a is numbered 0, 1, 2, 3,. and 659, representing their position in the stream that is input into segment 0. The segment designations are assigned using block numbers, with the remaining 3DY blocks input to segments 1-5, thus resulting in one frame pair being shuffled across multiple segments.
Fig. 7c illustrates 660 3D Y blocks comprising one segment. The 3D Y blocks numbered 0-65 are input to buffer 0. Similarly, a 3D Y block adjacent to the numbered 3D Y block is input to buffer 1. This process is repeated until buffers 2-9 are filled. Thus, the corruption of one buffer during data transmission results in the loss of 3D Y blocks from different parts of the image.
FIG. 7d illustrates the final order of the "0" 3D Y block in a buffer. 3D Y blocks 0, 1 and 2 occupy the first three locations of the buffer. The process repeats for the rest of the buffer. Thus, the loss of three 3D Y blocks during data transmission results in the loss of 3D Y blocks that are far apart within the picture.
Fig. 7a-D illustrate one embodiment of 3D block dispersion for 3D Y blocks of a frame set. However, in another embodiment, 3D tile properties for 3D U tiles and 3D V tiles are provided. The 3D U block is generated by applying the image-to-block mapping process described above to a set of frames that contain only the U signal. Similarly, the 3D V block is generated by applying an image-to-block mapping process to a set of frames that contain only the V signal. The 3D U and 3D V patches followed the 3D Y patch distribution described above. However, as previously described, the number of 3D U blocks and 3D V blocks each had a 1: 6 ratio to 3D Y blocks.
Figures 7a-d illustrate an embodiment of block shuffling within a frame set of Y signals, by which burst errors up to packet loss during 1/6 transmission can be tolerated and further balanced buffer utilization is ensured. Those skilled in the art will appreciate that the segmentation, buffer, and ADRC block designations may be varied to ensure that 1/n of the burst error loss is accounted for and buffer utilization is modified.
Partial caching
As shown in fig. 3, the ADRC encoding and buffering process occurs at step 4. According to the encoding technique, 2D or 3D blocks generated during the image-to-block mapping process are encoded, thereby generating 2D or 3D ADRC blocks. A 3D ADRC block contains the Q code, MIN value, motion flag, and DR. Similarly, a 2D ADRC block contains the Q code, MIN and DR. But the 2D ADRC block does not include a motion flag because the encoding is performed on a single frame or a single field.
Various buffering techniques can be found in the prior art (see, for example, High Efficiency Coding Apparatus, U.S. Pat. No.4,845,560, Kondo et al, and High Efficiency Coding Apparatus, U.S. Pat. No.4,722,003, Kondo). Both of these high efficiency coding device patents are incorporated herein by reference.
The partial buffering process mentioned below describes the inventive method of determining the code bits for ADRC coding. In particular, partial caching describes a method of selecting a threshold value from a threshold table designed to provide a constant transmission rate between remote terminals while limiting error propagation. In another embodiment, the threshold table is further designed to provide maximum buffer utilization. In one embodiment, the buffer is a memory that stores 1/60 portions of encoded data from a given set of frames. The threshold value is used to determine the number of Q bits used for pixel encoding in a 2D or 3D block generated by the image-to-block mapping process described above.
The threshold table includes a plurality of rows of threshold values, also referred to as a threshold set, each row in the threshold table being indexed by a threshold index. In one embodiment, the threshold table is organized as follows: the set of thresholds that yields the larger number of Q code bits is in the upper row of the threshold table. Thus, for a given buffer having a predetermined number of bits available, the encoder 110 moves down the threshold table until a set of thresholds is encountered that results in less than the predetermined number of bits. This appropriate threshold is used to encode the pixel data in the buffer.
In one embodiment, a transmission rate of no more than 30Mbps is desired. The desired transmission rate results in 31,152 bits for VL-data storage in any given buffer. Thus, for each buffer, the accumulated DR distribution is calculated and a set of thresholds is selected from a table of thresholds to encode pixels in a 3D or 2D block as VL-data.
Fig. 8 illustrates one embodiment of the selected threshold values and DR distribution in buffer 0. The vertical axis of fig. 8 includes the cumulative DR distribution. For example, a value "b" equal to its DR greater than or equal to L 33D or 2D block number. The horizontal axis includes possible DR values. In one embodiment, the DR values range from 0 to 255. Threshold value L4、L3、L2And L1A set of thresholds for determining buffer coding is described.
In one embodiment, all blocks stored in buffer 0 use a threshold value L4、L3、L2And L1To perform encoding. Thus, the DR value is greater than L4The pixel values of the block of (1) are encoded using 4 bits. Similarly, values belonging to those DR at L3And L4All pixels of the block in between are encoded with 3 bits. Those having a DR value at L2And L3All pixels of the block in between are coded with 2 bits. Those having a DR value at L1And L2All pixels of the block in between are coded with 1 bit. Finally, those belonging to the group of values for DR less than L1All pixels of the block of (a) are encoded with 0 bits. L is4、L3、L2And L1Is chosen such that the total number of bits used to encode all blocks in buffer 0 is as close as possible to the limit of 31,152 bits without exceeding the 31,152 limit.
FIG. 8a illustrates the use of partial caching in one embodiment. Frame 800 is encoded and stored in buffers 0-59. Assuming that transmission errors prevent error recovery, the decoding process for frame 800 may stop until the lost data is error recovered. However, partial buffering limits error propagation within the buffer, thus allowing decoding of the remaining buffers. In one embodiment, transmission errors prevent the qbit and motion flag recovery of block 80 in buffer 0. Partial buffering limits error propagation to the rest of the blocks in buffer 0. Since the end of buffer 0 and the beginning of buffer 1 are known due to the fixed buffer length, error propagation is limited to buffer 0. Therefore, the decoder 120 can start the block processing within the buffer 1 without delay. In addition, different sets of thresholds are used to encode different buffers, allowing the encoder 110 to maximize/control the number of Q code bits contained in a given buffer, thereby allowing higher compression ratios. In addition, the partial buffering process provides a constant transmission rate because buffers 0-59 are comprised of fixed lengths.
In one embodiment, the variable space of the buffer is not completely filled with Q-code bits, because there is a limited number of threshold sets. Thus, the remaining bits in the fixed-length buffer are filled with a predetermined bit stream pattern called the postamble. As will be described later, the postamble allows for bi-directional data recovery, since the postamble describes the end of VL-data before the end of the buffer.
YUV block shuffling in buffer
Y, U and the V signal each have unique statistical properties. To improve the qbit and motion flag recovery process (described below), the Y, U and V signals are multiplexed within the buffer. Therefore, the transmission loss has substantially no influence on a specific signal.
Fig. 9 illustrates one embodiment of the YUV block shuffling process within the buffer, where the yuvadarc block is derived from the Y, U and V signals, respectively. Buffer 900 illustrates ADRC block designation after block shuffling within a frame set. Buffer 900 includes 66Y-ADRC blocks followed by 11U-ADRC blocks followed by 11V-ADRC blocks. Buffer 910 represents the organization of YUV ADRC blocks within the buffer after the YUV blocks have been shuffled. As shown, three Y-ADRC blocks are followed by one U-ADRC block or three Y-ADRC blocks, which are followed by one V-ADRC block. The in-buffer YUV block shuffling reduces the similarity between adjacent block bitstreams in the buffer. Another embodiment of a YUV block shuffle in a buffer with different signals (i.e., YUV ratio or other chrominance space) is also possible in accordance with the original image format.
Intra-group VL-data shuffling
The intra-group VL-data shuffle comprises three processing steps. The three processing steps include Q-code concatenation, Q-code reassignment, and randomization of the concatenated Q-code. FIG. 10 illustrates an embodiment of intra-group VL-data shuffling in which three processing steps are applied sequentially to the Q codes stored in the buffer. In another embodiment, a subset of the processing steps are applied to the intra-group VL-data shuffling. Each processing step independently assists in error recovery of data loss during transmission. Therefore, each process step is described independently. A detailed description of error recovery is provided below in the discussion of data recovery.
Cascade of Q codes
The Q-code concatenation guarantees that the ADRC blocks decode together. Group decoding facilitates error recovery because additional information can be provided from neighboring blocks during the data recovery process detailed below. For one embodiment, Q-code concatenation is applied independently for each set of three ADRC blocks stored in the buffer. In another embodiment, the group includes ADRC blocks from different buffers. The concatenation of Q codes over three ADRC blocks is described as producing one concatenated ADRC tile. Figures 11 and 11a illustrate one embodiment of generating cascaded ADRC tiles.
Figure 11 illustrates one embodiment of generating cascaded ADRC tiles from a 2D ADRC block. Specifically, for each Q code (Q code) included in 2D ADRC blocks 0, 1 and 20-q63) Concatenation is performed, resulting in 64Q codes for concatenated ADRC tile a. For example, the first Q-code Q0, 0 (0 th quantization value) of the 2D ADRC block 0 is concatenated to the first Q-code Q0, 1 of the 2D ADRC block 1. The two concatenated Q codes are re-concatenated to the first Q code Q0, 2 of the 2D ADRC block 2, thus producing Q for the concatenated ADRC tile a0. The process is repeated until Q is produced63. Alternatively, the Qi generated in the cascaded ADRC tile A is described by
Qi=[qi,qi,1,qi,2] i=0,1,2,...63。
Furthermore, associated with each Qi in the cascaded ADRC tiles A, there is a corresponding number of N bits representative to produce a single QiTotal number of concatenated bits.
Figure 11a illustrates one embodiment of generating cascaded ADRC tiles from pairs of frames that include motion blocks. The motion block is a 3D ADRC block with a set motion flag. The motion flag is set when a predetermined number of pixels within the two 2D block structures generated by the image-to-block mapping process described above change their values between the first frame and the subsequent frame. In another embodiment, the motion flag is set when the maximum value of each pixel change between the 2D blocks of the first frame and the subsequent frame exceeds a predetermined value. In contrast, a non-moving (i.e., stationary) block includes a 3D ADRC block without a motion flag. When the values of the predetermined number of pixels within the two 2D blocks of the first frame and the subsequent frame do not change, the motion flag remains unset. In another embodiment, the motion flag remains unset when the maximum value of each pixel change between the first frame and the subsequent frame does not exceed a predetermined value.
The motion block includes Q-codes from the 2D block encoded in the first frame and the 2D block encoded in the subsequent frame. The set of Q codes corresponding to a single coded 2D block is called an ADRC tile. Thus, one motion block produces two ADRC tiles. But since there is no motion, a static block only needs to include half the number of Q codes of the motion block, thus only one ADRC tile is generated. In this embodiment, the Q-code for the static block is generated by averaging the corresponding pixel values between the 2D block in the first frame and the corresponding 2D block in the subsequent frame. Each averaged pixel value is then encoded, resulting in a set of Q codes that constitute a single ADRC tile. Thus, motion blocks 1110 and 1130 produce ADRC tiles 0, 1, 3 and 4. The stationary block 1120 generates ADRC tile 2.
Generation of cascaded ADRC tiles in fig. 11a may cascade the Q-codes of ADRC tiles 0-4 to cascaded ADRC tile B. Specifically, each Q code (Q0-Q63) included in ADRC tiles 0, 1, 2, 3, and 4 is concatenated, resulting in 64Q codes for concatenated ADRC tile B. Alternatively, the generation of each Q code (Qi) in the cascaded ADRC tile B is described by the following mathematical formula:
Qi=[qi,0,qi,1,qi,2,qi,3,qi,4] i=0,1,2,...63
q code reassignment
Q code reassignment ensures that bit errors caused by transmission loss are localized in spatially separated pixels. Specifically, in the Q-code reassignment process, the Q-codes are redistributed, and the redistributed Q-code bits are shuffled. Thus, Q-code reassignment facilitates error recovery because undamaged pixels surround each damaged pixel. Furthermore, because pixel corruption is evenly distributed across the ADRC block, DR and MIN recovery is facilitated, which is detailed in the data recovery discussion below.
Fig. 12 illustrates one embodiment of pixel destruction during transmission loss of 1/6 burst error loss. Specifically, each of the 2D ADRC blocks 1210, 1220 and 1230 includes 64 pixels encoded using 3 bits. Thus, each pixel (p) of the 2D ADRC block0To P63) Represented by 3 bits. The 2D ADRC block 1210 represents a bit loss pattern when a first bit of every 6 bits is lost, represented by the darkened square, and similarly, the bit loss pattern when a second bit or a fourth bit of every 6 bits is lost is represented in the 2D ADRC blocks 1220 and 1230, respectively. FIG. 12 illustrates: without Q code re-assignment, half of all pixels of 2D ADRC blocks 1210, 1220 and 1230 are corrupted for 1/6 burst error loss.
For one embodiment, the Q code reassignment is applied independently to each cascaded ADRC tile stored in the buffer, thus ensuring that bit errors are localized within spatially separated pixels when deshuffling. In another embodiment, a Q code reassignment is applied to each ADRC block stored in the buffer.
Figure 12a illustrates one embodiment of a Q code re-assignment to produce a shuffled Q-code bitstream from concatenated ADRC tiles. Table 122 and table 132 illustrate Q-code redistribution. Bit streams 130 and 140 illustrate the shuffling process of the Q code bits.
Table 122 represents the concatenated Q-code for concatenated ADRC tile a. Q0Is the first concatenated Q code, Q63Is the most importantThe latter concatenated Q code. Table 132 illustrates the redistribution of the Q-codes. For one embodiment, Q0,Q6,Q12,Q18,Q24,Q30,Q36,Q42,Q48,Q54And Q60Is included in the first set, partition 0. The next 11 concatenated Q codes are included in partition 1, per table 132. These steps are repeated for partitions 2-5. The boundaries of a partition are depicted by vertical lines in the table 132. This spatial separation assignment of the concatenated Q code to 6 partitions ensures that 1/6 burst error loss will result in a bit loss pattern that is spread out over a set of consecutive pixels.
Fig. 12b illustrates one embodiment of the bit pattern loss resulting from 1/6 burst error loss of the redistributed Q code. Specifically, each of the 2D ADRC blocks 1215, 1225, and 1235 includes 64 pixels encoded with 3 bits. Thus, each pixel (p) of each 2D ADRC block0To P63) Represented by 3 bits. The bit loss pattern, represented by the darkened squares in 2D ADRC blocks 1215, 1225 and 1235, is confined to a set of contiguous pixels. Thus, for a given segmentation loss, only 11 consecutive pixels within each 2D ADRC block 1215, 1225 and 1235 are corrupted. In another embodiment, the assignment of Q codes to partitions includes Q codes from different motion blocks, thus providing a spatially and temporally separated assignment of Q codes to 6 segments. This results in additional uncorrupted spatio-temporal pixels at 1/6 burst error loss and further promotes more enhanced error recovery.
Referring to fig. 12a, the redistributed Q-code bits in table 132 are shuffled across the resulting bitstream such that adjacent bits in the bitstream are from adjacent partitions. The Q code bits for all partitions in table 132 are concatenated into bitstream 130. For a given partition, adjacent bits in the bitstream 130 are scattered to every 6 th position in the resulting bitstream 140. Thus, the bits numbered 0 through 5 in the bitstream 140 include the first bit from the first Q code in each partition. Similarly, bits number 6 through 11 in bitstream 140 include the second bit from the first Q code in each partition. This process is repeated for all Q-code bits. Therefore, the 1/6 burst error loss will produce spatially separated pixel losses.
Figure 12c illustrates one embodiment of the bit pattern loss caused by 1/6 burst error loss of the reassigned (i.e., redistributed and shuffled) Q-codes. Specifically, 2D ADRC blocks 1217, 1227 and 1237 each include 64 pixels encoded with three bits. Thus, each pixel P of each 2D ADRC block0To P63And may be represented by three bits. In 2D ADRC blocks 1217, 1227 and 1237, the bit loss pattern, represented by the black squares, is distributed over spatially separated pixels, thus facilitating pixel error recovery.
Randomization of Q-code bits
The Q-code bits are randomized using a masking key to help the decoder recover lost and corrupted data. Specifically, during the encoding process, a KEY (marked with KEY) is used to mask the Q-code bit stream. Therefore, the decoder must recognize the correct value of KEY in order to unmask the Q-code bit stream.
In one embodiment, KEY is used to mask the Q code of the three ADRC blocks to specify the resulting Q code bit stream. As described previously, the ADRC block includes FL-data and Q-code. Each key element ("d") of the masked keyi") quantization bits (" q ") associated with the FL-data value and the corresponding ADRC blocki") a combination of numbers. In one embodiment, the motion flag and the qubit are used to define a key. Thus, in this embodiment, the key element value is generated from the following mathematical formula:
di=5·mi+qiwhere i is 0, 1, 2 and qi=0,1,2,3,4
Variable miEqual to the motion flag. Thus, when the corresponding ADRC block is a static block, miEqual to 0, m when the corresponding ADRC block is a motion blockiEqual to 1. In addition, variable qiRepresenting the quantization bits used to encode the corresponding ADRC block. Thus, pairIn the four-bit ADRC coding technique, qiHave a value of 0, 1, 2, 3 or 4. In one embodiment, the KEY for a set of three ADRC blocks uses three KEY elements ("d") according toi") defines:
KEY=d0+10·d1+100·d2
thus, during the recovery of the motion flag or qbit data, the possible key values are regenerated from the values used to generate the masking key. The regenerated key value is used to unmask the received Q-code bit stream that resulted in the candidate decoding. A detailed description of the re-generation of key values and selection of particular candidate decoding techniques is provided below in the discussion of data recovery.
In another embodiment, the blinding key is generated from various elements. Thus, the decoder is provided with specific information about an element without having to transmit the element over the transmission medium. In one embodiment, the DR or MIN value corresponding to the ADRC block is used to generate a masking key to mask the bit stream representing the ADRC block.
Figures 10-12 illustrate VL-data shuffling within groups with tolerance of 1/6 packet data loss during transmission. Those skilled in the art will appreciate that the total number of partitions, as well as the bit partitioning, may be varied to ensure that 1/n burst error loss is accounted for.
Intra-segment FL-data shuffling
Intra-segment FL-data shuffling describes rearranging block attributes across different segments. The re-ordering block attribute provides a scatter in data loss. Specifically, when FL-data from one segment is lost during transmission, the loss of DR value, MIN value, and motion flag value do not belong to the same block. FIGS. 13 and 14 illustrate one embodiment of FL-data shuffling within a segment.
Fig. 13 illustrates the contents of segments 0 through 5. For one embodiment, each segment includes 880 DR, 880 MIN, 880 motion markers, and VL-data corresponding to 660Y blocks, 110U blocks, and 110V blocks. As shown in the MIN shuffle 1300, the MIN value for segment 0 is moved to segment 2, the MIN value for segment 2 is moved to segment 4, and the MIN value for segment 4 is moved to segment 0. Further, the MIN value of segment 1 is moved to segment 3, the MIN value of segment 3 is moved to segment 5, and the motion index value of segment 5 is moved to segment 1.
Figure 13a illustrates motion flag shuffling. As shown, in the map motion flag shuffle 1305, the motion flag value for segment 0 is moved to segment 4, the motion flag value for segment 2 is moved to segment 0, and the motion flag value for segment 4 is moved to segment 2. In addition, the motion flag value of segment 1 is moved to segment 5, the motion flag value of segment 3 is moved to segment 1, and the motion flag value of segment 5 is moved to segment 3. Loss pattern 1310 illustrates FL-data loss after segment 0 is lost in transmission.
For a particular block attribute, FIGS. 13 and 13a illustrate shuffling of all cases of a particular block attribute between segments. For example, in fig. 13, the 880 MIN values from segment 0 are collectively interchanged with the 880 MIN values of segment 2. Similarly, in fig. 13a, the 880 motion markers of segment 0 are collectively interchanged with the 880 motion markers in segment 4. During transmission loss of consecutive packets, this global block attribute shuffling causes uneven loss of certain block attributes of a block group. In one embodiment, a block group includes three ADRC blocks.
Figure 14 illustrates one embodiment of a modulo triple shuffle process for DR, MIN, and motion flags. A modulo triple shuffle describes a shuffle pattern that is shared across three blocks (i.e., a group of blocks) in three different segments. The shuffle pattern repeats for all groups of blocks within three different segments. However, different shuffle patterns are used for different block attributes. Thus, the modulo three shuffle process disperses the block attributes into all three segments. In particular, for a given group of blocks, the modular trishuffling ensures that a particular block attribute is lost only once during a loss of a segment transmission. Thus, in the data recovery process described below, a reduced number of candidate decodings are generated that recover the loss of data within the block.
One segment stores 880 DR values as shown by DR modulo shuffle 1410. Thus, the DR values are numbered 0-879, depending on the block from which a given DR value is taken. In modulo triple shuffling, the FL-data content of three segments is shuffled. A count of 0-2 is used to identify each DR value in the three segments identified for the modular shuffle. Thus, the DR belonging to the number 0, 3, 6, 9. Similarly, the DR belonging to the number 1, 4,7, 10. Thus, for a given count, the DR values associated with the count are shuffled across segments 0, 2, and 4. Similarly, the DR values associated with the same count are shuffled across segments 1, 3, and 5.
In the DR modulo shuffle 1410, DR values belonging to a count of 0 are not shuffled. The DR values belonging to count 1 are shuffled. Specifically, the count 1DR value in segment A is moved to segment B, the count 1DR value in segment B is moved to segment C, and the count 1DR value in segment C is moved to segment A.
The DR values belonging to count 2 are also shuffled. Specifically, the count 2DR value in segment a is moved to segment C, the count 2DR value in segment B is moved to segment a, and the count 2DR value in segment C is moved to segment B.
MIN modulo shuffle 1420 illustrates one embodiment of a modulo three block attribute shuffle process for MIN values. One segment includes 880 MIN values. In MIN modulo shuffle 1420, the shuffle pattern for count 1 and count 2 in DR modulo shuffle 1410 is moved to count 0 and count 1. Specifically, the shuffle pattern for count 1 in the DR modulo shuffle 1410 is applied to count 0. The shuffle pattern for count 2 in the DR modulo shuffle 1410 is applied to count 1, and MIN values belonging to count 2 are not shuffled.
Motion flag modulo shuffle 1430 illustrates one embodiment of a modulo three block attribute shuffle process for motion flag values. One segment includes 880 motion flag values. In the motion flag modulo shuffle 1430, the shuffle pattern for count 1 and count 2 in the DR modulo shuffle 1410 is moved to count 2 and count 0, respectively. Specifically, the shuffle pattern for count 2 in the DR modulo shuffle 1410 is applied to count 0. The shuffle pattern for count 1 in the DR modulo shuffle 1410 is applied to count 2, and the motion flag values belonging to count 1 are not shuffled.
FIG. 14a illustrates the results of the modular shuffles 1410, 1420 and 1430. The modulo shuffle result 1416 represents the target of each attribute of the block belonging to segment 0. In this example, segment 0 corresponds to segment a of fig. 14. This target is specified in accordance with the modular shuffles 1410, 1420 and 1430 of figure 14. Fig. 14a also illustrates the dispersion of block attribute loss after segment 0 loss during transmission. In particular, the loss pattern 1415 represents the loss of DR, motion flag, and MIN values over 6 segments after a subsequent deshuffling is applied to the received data that was originally shuffled with the modulo shuffles 1410, 1420, and 1430. As shown in fig. 14a, the block attribute loss is periodically spread over segments 0, 2, and 4, while segments 1, 3, and 5 have no block attribute loss. In addition, the spatial loss pattern 1417 illustrates the deshuffled spatial distribution of the corrupted FL-data after segment 0 is lost during transmission. The spatial loss pattern 1417 represents the loss of DR, motion flag, and MIN values after a subsequent deshuffling is applied to the received data. In the spatial depletion mode 1417, the corrupted block is surrounded by uncorrupted blocks, and corrupted block properties can be recovered with surrounding uncorrupted blocks.
Figures 14 and 14a illustrate the modulo triple shuffle mode and the dispersion of block attribute loss after segment loss during transmission. In another embodiment, the count variable or segment number is variable to change the distribution of the missing block attributes. Figure 14b illustrates the modulo shuffle result 1421 and the loss pattern 1420. Similarly, fig. 14c illustrates a modulo shuffle result 1426 and a loss pattern 1425. The wear pattern 1420 and wear pattern 1425 illustrate the distribution of block attribute loss over 6 segments, as opposed to the three segments described previously.
It is contemplated that in alternative embodiments, various block attribute combinations will be dispersed for shuffling.
Intra-segment VL-data shuffling
In the intra-segment VL-data shuffling process, bits between a predetermined number of segments (e.g., 6 segments) are designed to: spatial separation and periodic VL-data loss can be ensured up to 1/6 packet transmission loss. FIGS. 15 and 16 illustrate one embodiment of an intra-segment VL-data shuffling process.
In the present embodiment, a transmission rate close to 30Mbps is required. Thus, the required transmission rate results in 31,152 bits of VL-data in each of the 60 buffers. The remaining space is used by the FL-data of 88 blocks included in the buffer. Fig. 15 includes an organization of VL-data buffers within a frame set at a transmission rate of approximately 30 Mbps. As previously described, partial buffering is used to maximize the use of available VL-data space in each buffer, and unused VL-data space is filled with postambles.
Figure 16 illustrates one embodiment of a shuffling process to ensure spatial separation and periodic VL-data loss. The first line illustrates the reorganization of VL-data from the 60 buffers of fig. 15 into a 1,869,120 bit cascade stream. The second row illustrates that every 6 th bit constitutes a new bit stream. Thus, when the decoder later reverses the process, a burst loss of up to 1/6 transmitted data is converted into a periodic loss with at least 5 uncorrupted bits separating each set of two corrupted bits.
The third line illustrates that each 10 bits of stream 2 are grouped into a new bit stream, stream 3. The boundaries of the groups are also defined by the number of bits in the segment. Stream 2 packets of 10 bits each guarantee 1/60 data loss results in 59 uncorrupted bits between each set of 2 corrupted bits. This provides spatial separation and periodic VL-data loss when 88 consecutive data packets are lost.
The fourth row illustrates the composition of each 11 bits of stream 3 into stream 4. The boundaries of the groups are also defined by the number of bits in the segment. Stream 3 packets of 11 bits each guarantee 1/660 data loss results in 659 uncorrupted bits between corrupted bits, resulting in spatially separated and periodic VL-data loss when 8 consecutive packet transmissions are lost.
Each 31,152 bit group within stream 4 is sequentially re-stored in buffers 0-59, with the first bit group being stored in buffer 0 and the last bit group being stored in buffer 59.
Those skilled in the art will appreciate that the packet requirements of fig. 16 are variable to ensure spatial separation and periodic VL-data loss tolerance up to 1/n transmission loss.
Transmission of
The shuffling process described above produces a buffer with mixed FL-data and VL-data. For one embodiment, packets are generated from each buffer and transmitted over transmission medium 135 in accordance with packet structure 200.
Data recovery
As noted previously, the inventive method for encoding a data bit stream enables enhanced data recovery that typically occurs due to data packet loss. An overview of the decoding process has been shown in fig. 4.
Referring to fig. 4, data received in a packet is processed through a multi-level deshuffling process ( steps 425, 430, 435, and 440) in which different levels or portions of a bitstream received through the packet are deshuffled to recover the data. ADRC decoding is applied to the data at step 445 according to concepts known in the art (e.g., Kondo, Fujiori, Nakaya, "Adaptive Dynamic Coding Scheme for future HDTV Digital VTR," Fourth International works Workshop on HDTV and Beyond, 9.4-6.1991, Italy, Dublin).
Block deshuffling within the frame set is then performed followed by block-to-image mapping, steps 450, 455. Steps 425, 430, 435, 440, 445, 450 and 455 are the inverse of the processing steps previously performed to encode the data and will not be discussed in detail here. It should be noted, however, that in one embodiment, the deshuffling levels represented by steps 425, 430 and 440 are data independent. The deshuffling process performed is predetermined or specified by, for example, an address mapping or a table lookup. Since the deshuffling steps 425, 430 and 440 are independent of the data content, data loss due to, for example, packet loss does not prevent the deshuffling step from being performed. Similarly, steps 450 and 455 are data independent. But the intra-group VL-data deshuffling process is data content dependent. More specifically, the intra-group VL-data deshuffling process is used to determine the quantization codes for the blocks in the group. Thus, if a packet is lost, the affected group cannot be processed, step 435.
After deshuffling, decoding and mapping have been performed ( steps 425, 430, 435, 440, 445, 450 and 455), a recovery process is performed to recover the qbits and motion flag values in the lost packet. The Q bit value is typically lost due to DR loss (caused by lost packets). When the qbit or motion flag value is unknown, the qbit bit for the pixel cannot be determined from the data bit stream. If the determination of the qbit or motion flag value is not appropriate, then this error will propagate as the start of the subsequent block, since the data in the buffer will be incorrectly identified.
Fig. 17 depicts a general process for recovering the qbit and motion flag values. This particular embodiment describes a process for recovering the qbit and motion flag values using multiple data blocks; however, it is contemplated that the particular number of blocks is not limited by the discussion herein, but may be one or more blocks. Referring to fig. 17, based on error detection of the bitstream in step 1705, candidate decodings based on prescribed parameters are generated for the detected three blocks. Each candidate decode is scored on the probability that it is an accurate decoding process, step 1715, and the candidate decode with the best score is used, step 1720, to identify the Q bits and motion flag values that enable subsequent pixel decoding of the affected block.
Referring back to the decoding process of fig. 4, once the best decoding is selected, any DR or MIN values that were lost due to lost packets are recovered at step 465. Various recovery processes known to those skilled in the art may be used to recover DR and MIN, including least squares or averages of adjacent block values. See, as an example, "adaptive dynamic Coding Scheme for Future HDTV Digital VTR" by Kondo, Fujiori, Nakaya, Fouth International works shop on HDTV and Beyond, 9.4-6.1991, Italy, Douling. In this embodiment, the image-to-block mapping process of the present invention and the resulting data structure increases the number of adjacent blocks, thus providing additional data and facilitating more accurate DR or MIN recovery. Specifically, in one embodiment, DR and MIN are restored as follows:
where DR' corresponds to recovered DR, qiIs the i-th value of the ADRC block, and q isi∈(0,1,...,2Q-1); for edge matching ADRC, m is 2Q-1, for non-edge matching ADRC, m ═ 2Q;yiIs the decoded value of the pixel of the neighboring block, Q is the Q bit value; and also
Where MIN' corresponds to the recovered MIN and N is the number of terms used for summation (e.g., N32 when i is 0-31). In another embodiment, if both DR and MIN of the same block are corrupted, both DR and MIN are recovered according to:
ADRC decoding is applied to those blocks that were not decoded prior to the recovery of the qbits and motion flags at step 470 and a pixel recovery process is performed at step 475 to recover any erroneous pixel data that may have occurred due to lost packets or random errors. In addition, a return conversion of 3:1:0- >4:2:2 is performed at step 480 to place the image into the selected display format.
Fig. 18 illustrates a particular embodiment of the qbit and motion flag recovery process in the decoding process of the present invention. In this particular embodiment, the inputs to the processing are neighboring block information, block attributes of the three blocks to be processed, and pixel data. An error flag indicating the location of the missing data is also entered. The error flag may be generated in various ways known to those skilled in the art and will not be discussed further herein, but merely to illustrate which bits the flag indicates are transmitted for a corrupted or lost packet.
At step 1805, candidate decodes are generated. The candidate decoding may be generated in various ways. For example, although the processing burden may be substantial, the candidate decoding may include all possible decoding. Alternatively, the candidate decodes may be generated based on predetermined parameters in order to reduce the number of candidate decodes to be evaluated.
In the present embodiment, the candidate decoding is determined based on possible key values used for randomizing the bit stream of the intra-group VL-data shuffling process described above. Furthermore, it should be noted that the candidate decoding is also limited by the length of bits waiting to be decoded and the knowledge of how many blocks remain. For example, if the last block is processed, the decoded length of that block is typically known, as will be discussed.
Continuing with the example, fig. 19 illustrates a possible scenario of the present invention, where value x represents an unknown value (possibly due to packet loss). This will be explained by way of further example. m isiMotion flag defined as i-th block, qiIs the number of quantization bits of the ith block, niIs the possible candidate number of the ith block, diIs the key element value of the ith block previously described in the intra-group VL-data shuffle. The ith block is defined within each group. In this example, the number of blocks within each group is three. Three block group key press0+10·d1+100·d2And is produced. Assuming that the motion flag is unknown in the first block and the number of quantization bits is 2, m0Is equal to x, q0Equal to 2. Generating a key element, d, according to the above-described formulai=5·mi+qi,d0Consists of 2 and 7. Therefore, possible values (n)0) The number is 2. Assuming that the second block has a motion flag value of 1 and one quantization bit, d1Has a value of 5 · 1+1 ═ 6 and n 11. The third block has a motion flag value of 1 and an unknown number of quantization bits. Thus, the number d2Comprising a set of 6, 7, 8, 9 and n 24. Thus, the number of possible candidates M for this group is 2 · 1 · 4 ═ 8, and the keys used to generate the candidate decodes vary among 662, 667, 762, 767, 862, 867, 962, 967. This process is preferably used for each group affected by data loss.
Referring back to FIG. 17, once the data has been decoded from the key data, the resulting candidate decode is evaluated or scored for the chance that it is the correct data decode, step 1715. At step 1720, the candidate decoding with the best score is selected for use.
Various techniques may be used to score candidate decodes. For example, the score number may be derived from an analysis of how well the pixels of the block match other pixels of the image in a particular candidate decode. Preferably, the score number is derived based on criteria indicative of error (e.g., sum of squared error and correlation). For example, for correlation, it is fairly well-established to assume that neighboring pixels are somewhat closely correlated. Thus, a large or small correlation indicates whether the candidate decoding is a correct decoding.
As shown in fig. 18, four different criteria are analyzed to select the best candidate decoding. However, it is contemplated that one, two, three, or more different criteria may be analyzed in order to select the best candidate decoding.
Referring to FIG. 18, the present embodiment utilizes four sub-scoring criteria that are eventually merged into a postscore. Specifically, a squared error measure is generated at step 1815, a horizontal correlation is determined at step 1820, a vertical correlation is determined at step 1825, and temporal activity is measured at step 1830 (based on M candidates, N blocks, and 2 frames/data blocks, each an M by 2N matrix). Although horizontal and vertical correlations are used, it should be recognized that various correlation measurements, including diagonal correlations, may be examined. Confidence measures are generated for each criterion at steps 1835, 1840, 1845, 1850 to normalize the generated measures and a probability function is generated for each different criterion at steps 1855, 1860, 1865, and 1870. These probability functions are then combined by, for example, multiplying the probability values to produce a score, such as the likelihood function in step 1875 shown in fig. 18. The score for the candidate decoding is then compared to all candidate decoding scores to determine the most likely candidate.
It should be appreciated that various techniques may be used to evaluate candidate decodes and generate a "scoring" for each candidate. For example, confidence measures are one way to normalize criteria. Furthermore, various confidence measures may be used in addition to those described below. Similarly, multiplying the probability values based on each criterion to produce the overall likelihood function is just one way to merge the various criteria examined.
The encoding process is advantageous for determining the best candidate decoding because candidate decodings that are not the most likely candidates typically have a relatively poor score, while decoding of the most likely candidates will have a relatively good score. In particular, the Q-code randomization process described previously in the intra-group VL-data shuffling process is helpful in this regard.
20a, 20b, 20c, and 20d provide an illustration of performing different measurements at steps 1815, 1820, 1825, and 1830 of FIG. 18 to generate scores and total scores for a particular candidate decode. FIG. 20a illustrates evaluating candidate decoded pixel xiAdjacent to its decoding yi,jSquared errors are compared, where the subscript "i, j" corresponds to the adjacent address of "i". It is preferable to remove some of the largest terms in order to eliminate any effect due to peaks (which are terms that occur due to reasonable edges of the image). Preferably, three (x)i-yi,j)2The maximum term is discarded in order to remove the peaks that may occur. Fig. 20b illustrates the temporal activity criterion. This is only useful if it is or is assumed to be a motion block. The temporal activity criterion assumes that the better the candidate decoding is, the smaller the inter-block difference is. So the worse the candidate decoding, the larger the inter-block difference. The assumption of spatial correlation: the more likely candidate decoding results in heavy correlation because the real image tends to change in a very slow consistent manner. The horizontal correlation process shown in fig. 20c and the vertical correlation process described in fig. 20d make use of this assumption.
The confidence measures of steps 1835, 1840, 1845, and 1850 in FIG. 18 provide a process to normalize the criteria determined by the previous steps ( steps 1815, 1820, 1825, and 1830). For example, in one embodiment, the confidence measure of the squared error takes values at the interval [0, 1], and the confidence equals 0 if the errors are equal and 1 if one error is 0. Other normalization measurements or methods are also contemplated.
Similarly, the confidence measure of spatial correlation is:
maximum (Y, 0) -minimum (X, 0)
Where Y is the best correlation value and X is the correlation of the current candidate decode. The temporal activity confidence measure is determined according to the following equation:
confidence (a-b)/(a + b)
Where a is max (X, M _ TH), b is max (Y, M _ TH), where M _ TH is the motion threshold of the candidate block, Y is the best measure, i.e. the minimum temporal activity, and X is equal to the current candidate measure of temporal activity.
In steps 1855, 1860, 1865, and 1870 in FIG. 18, a probability function is generated for each of the different criteria. Various methods may be used to generate the probability measures. For example, a scoring value for a confidence measure may be specified. If the confidence measure is greater than a predetermined value, e.g., 0.8, the base score is decreased by 10; if it is between 0.5 and 0.8, the base is decreased by 5. In the embodiment shown in fig. 21, there is a table for generating the probability function of the square measure of error criterion. The table includes any stored data determined empirically, including confidence and square error measures, as well as known candidate decodings. More specifically, the table may be generated by using uncorrupted data and assuming that the DR is corrupted or lost. Keys for correct and incorrect decoding are then generated, along with confidence measures. The table reflects the probability ratio of correct to incorrect decoding. Using this table, the probability can be determined for a particular error squared value (row) and confidence value (column). For example, it can thus be seen that for various squared error measures with a confidence measure of 0, there is a probability of about 40% to 50% of the candidates being correct. If the confidence is not 0, but is small, the probability drops significantly. Similar probability tables may be generated for correlation and time measurements based on corresponding empirically determined criterion measures and confidence measures.
The resulting probabilities are considered data that yields a "score" in this embodiment, and as noted previously, other techniques for scoring candidate decodes may be used. In step 1875, the different probabilities are combined into a likelihood function Li=j·Pi,jWhere j is the probability function Pi,jA multiple function of Pi,jIs the probability function of block j, candidate i. Thus selecting the enabling function LiThe largest candidate.
Referring back to fig. 18, it may be necessary to recover some of the block attributes sent in the lost packet. Thus, at step 1810, the DR and MIN values are restored if necessary. Various techniques can be used, from default, average, squared error functions to more complex techniques, including those discussed in the following documents: kondo, a,And Nakaya, "adaptive dynamic Range Coding Scheme for Future HDTV Digital VTR", and Kondo, Fujimmo, Nakaya, and Uchida, "A New concept Method for Digital VCR", IEEE ViSual Singal processing and Communications, 9.20-22.1993, Australia, Melbourne. The recovered values are used to generate candidate decodes, as described above.
Alternatively, the DR and MIN values are determined in a qbit determination process. This is illustrated in fig. 22. In particular, as noted above, the motion flag and the number of quantization bits are used in the present embodiment for the encoding process and then for the recovery process to reduce the number of possible candidate decodings. As noted previously, other information may also be used to encode the data. Thus, DR values and/or MIN values may also be used to encode data. Or a portion of the bits of DR are used for encoding (e.g., the two least significant bits of DR). Although the DR data is encoded, the number of possible candidate decodings increases greatly as the variable increases. Referring to FIG. 22, K M candidate decodes are thus generated, where K is the number of candidates for unknown data, e.g., if DR1、DR2And DR3Two bits of the sum are encoded (DR)1、DR2And DR3Representing the DR value of the block in the group), then K = 4. DR and MIN are thus recovered using the provided ancillary information, e.g. encoded DR1、DR2And DR3Two bits of the sum. This improves the candidate selection process of checking a larger number of candidate decodings at the cost of additional overhead.
It should be noted that in general, the closer the decoded blocks are, the better the recovery process of the qbits and motion flags. Further, in some embodiments, the processing is provided to each subsequent block within the buffer; the number of candidate decodings is reduced if all or some FL-data is available, and the number of candidate decodings may be reduced to 1, assuming that all FL-data is available for the block. However, it is desirable that the qbit and motion flag recovery processes be avoided altogether, as this process is relatively time consuming. In addition, it is desirable to use as much information as possible for qbit and motion flag recovery. In one embodiment, blocks are processed from the beginning of the buffer until a block with missing qbit/motion flag information is reached. This is defined as forward qbit and motion flag recovery. In another embodiment, the end of the buffer is referenced to determine the end position of the last block of the buffer and data is recovered from the end of the buffer until a block with missing qbit/motion flag data is reached. This is defined as backward qbit and motion flag recovery.
As noted previously, blocks may vary in length due to the length of the VL-data; it is therefore necessary to determine the number of bits of VL-data constituting a block in order to correctly locate the position of the subsequent block in the buffer. During the encoding process, a predetermined and preferably easily recognizable pattern of postambles is placed in the buffer to fill in unused bit positions. During decoding, the postamble will be between the block and the end of the buffer. Since this pattern is an easily identifiable one, checking the bit pattern enables the system to locate the start of the post-amble and thus the end of the last block in the buffer. This information can be used in two ways. If the last block contains corrupted qbit/motion flag data and the start of the last block is known (e.g., the previous block has been successfully decoded), then the difference between the end of the immediately previous block and the start of the post-amble corresponds to the length of the block. This information may be used to calculate the qbit and/or motion flag for the block. The start position of the postamble can also be used to perform qbit and motion flag recovery starting from the last block and proceeding to the beginning of the buffer. Thus, the qbit and motion flag recovery process can be implemented bi-directionally.
Fig. 23 illustrates the use of a post-amble in the bi-directional qbit and motion flag recovery process. Referring to FIG. 23, buffer 2300 includes FL-data 2303 for N sets of VL-data blocks. Each group consists of a plurality of blocks (e.g., 3 blocks). In this example, the first two sets 2305, 2310 are decoded and the third set 215 cannot be decoded immediately because the DR/motion flag data is corrupted. Here, a qbit/motion flag recovery process is required in order to recover the corrupted data. Rather than continuing to process the groups in the forward direction, the process references the end of the buffer determined by looking for the post-amble pattern 220. The start of the postamble is determined and the end of the last block group is known. Since the DR/motion flag data indicates the length of VL-data, the start of VL-data of the last block (and thus also the end of the immediately preceding block) can be determined. Thus, these blocks, e.g., blocks 225, 230, 235, may be decoded until block 240 of corrupt data is reached. The corrupted 215, 240 and blocked block 250 are then recovered using the qbit/motion flag recovery process described above.
It should be noted that bi-directional processing is not limited to a series of forward and backward processing; processing may be in either direction or both directions. Furthermore, in some embodiments, it may be desirable to perform such processing in parallel with improving efficiency. Finally, note that uncorrupted blocked blocks may be recovered by directly accessing the qbit/motion flag information without performing the qbit/motion flag recovery process described above.
As noted previously, various scoring techniques may be used to determine the best candidate decoding to choose from for decoding. In another embodiment, the image smoothness using each candidate decode is evaluated. In one embodiment, a laplace measurement is performed. The Laplace measurement measures second order image surface properties, such as surface curvature. For a linear image surface, i.e. a smooth surface, the laplacian measurement yields values close to 0.
This process will be explained with reference to fig. 24a, 24b and 24 c. FIG. 24a illustrates one embodiment of a Laplace kernel. Note that other embodiments may also be used. The kernel "L" represents a 3 × 3 region. To measure the smoothness of an image region, a 3 x 3 sub-region of the image (fig. 24b) is convolved with the kernel, and the convolution values are averaged. The size of the regions and sub-regions (and the associated kernel sizes) may vary depending on the application.
One embodiment of this process is described with reference to FIG. 24 c. This embodiment uses one kernel and a sub-region size of 3 x 3 and a region size of 8 x 8, where the individual elements are identified by i, j. In step 2460, the candidate decoded values x [ i ] [ j ] are normalized. For example, these values may be normalized according to:
here, ,
at step 2465, the normalized value is used to calculate the laplacian value Lx for the block representing smoothness according to the following equation:
the closer the block laplacian value is to 0, the smoother the image portion. Thus, the score number may be measured based on the block laplacian value, the decoding with the smallest laplacian value being the correct decoding.
Laplace evaluation may also be implemented using candidate code values q [ i ] [ j ]. The basic process is the same as for the candidate decoded value case of fig. 24 c. This embodiment uses a kernel and 3 x 3 sub-region sizes and 8 x 8 region sizes, with the elements identified by indices i, j. In step 2460, the candidate decoded values q [ i ] [ j ] are normalized. For example, these values may be normalized according to:
here, ,
at step 2465, the normalized value is used to calculate the laplacian value Lq for the block representing smoothness according to:
the closer the block laplacian value is to 0, the smoother the image portion. Thus, the score may be measured based on the block laplacian value, the decoding with the smallest laplacian value being the correct decoding.
Other variations are also noted. In other embodiments, higher order image surface properties may be used as smoothness measurements. In those cases, a higher order kernel is used. For example, a fourth order block laplacian measurement may be performed using a fourth order kernel. The cascade may implement a fourth order kernel using a second order laplacian computation.
It is also noted that the evaluation process depends on whether the image has greater activity or motion than a predetermined level. If the image portion being evaluated has a motion greater than a predetermined level, the measurement is preferably made on a field basis rather than on a frame basis. This is explained with reference to fig. 25. FIG. 25 illustrates a process using smoothness measurement; note that this process can be implemented using various types of measurements.
Motion may be detected/measured in various ways. In one embodiment, the degree of change between fields is evaluated and motion is detected if it exceeds a predetermined threshold.
The motion detection and the use of frame information and field information to generate recovery values, typically instead of missing or corrupted values, may be provided to any part of the processing required to generate recovery values. For example, motion detection and selective use of frame information and field information to generate recovery values may be provided for DR/MIN recovery, pixel recovery, and Qbit and motion flag recovery processes. Thus, based on the detected motion level, the recovery process will utilize the existing information either field-based or frame-based. Further, this process may be combined with the use of weighting values that are selected based on the relative level in a particular direction (e.g., horizontal or vertical).
In another embodiment of the qbit and motion flag recovery process, the candidate decodes are evaluated based on intra-block and inter-block measurements. In the following discussion, the term "block" refers to a portion of a frame or field. The intra-block measurement may evaluate candidate decoded image portions, e.g., smoothness of the image portions. The inter-block measurement may determine how well the candidate decoding corresponds to the neighboring image portion. Fig. 26a and 26b illustrate combined inter and intra block evaluation. In particular, fig. 26a shows an acceptable candidate decoding because both inter and intra block measurements are good, whereas in fig. 26b the inter block measurements are poor, even if the intra block measurements are reasonably good.
Examples of intra-block measurements include the smoothness measurements described above. Examples of inter-block measurements include the squared error measurements described previously. Another inter-block measurement is the ratio of the consistent boundary pixels to the total number of boundary pixels on the candidate ADRC block.
An example of inter and intra block evaluation of ADRC encoded 8 x 8 blocks is explained with respect to fig. 26c, 26d and 26 e. Fig. 26d illustrates an image portion (block) of data of the encoded value 2650 consisting of q values resulting in candidate decoded values x, and the adjacent decoded data 2655 consisting of y values. As suggested by the flow chart of fig. 26c, intra-block measurements are computed at step 2605 to produce a measure, such as block laplacian Lx. At step 2610, an inter-block measure Sx is computed to produce a measure of correspondence between neighboring blocks. At step 2615, a combined measure Mx is generated. The combined measure provides information for selecting a candidate decoding.
In the present embodiment, Sx is calculated as the number of adjacent data within each boundary pixel valid range of candidate decoding (see fig. 26 e). FIG. 26e, for one embodiment, is a graph illustrating the effective range, representing each observed quantized value qiThe effective range of (1). Thus LQ≤DR<UQHere LQ、UQRespectively representing the lower and upper bounds of DR corresponding to the quantization bit number Q. Preferably Sx is normalized according to: sx is Sx/number of boundary pixels.
In this embodiment, the combined measure Mx is calculated according to the following equation: mx ═ Sx + (1-Lx). Alternatively, the combined measure may be weighted, from which the following equation is used: mx ═ w · Sx + (1-w) · (1-Lx), where w is a weighted value, typically an empirically determined weighted value.
Other embodiments for determining DR and MIN values that have been lost/corrupted are also contemplated. For example, the formulas described above may be modified to recover the DR and MIN values with greater accuracy. In another embodiment, a median technique is used. In one embodiment of the median technique, MIN values are all MINsiMedian recovery of values, calculated as follows:
MINi=yi-qi·s
where q isiRepresenting the encoded pixel value, yiRepresents adjacent qiThe decoded pixel. For edge matching ADRC, s ═ DR/(2)Q-1). For non-edge matching ADRC, s ═ DR/2QWhere Q represents the number of quantization bits per pixel (Q bit value).
The values used may be temporally adjacent or spatially adjacent. y isiThe values may be decoded values of adjacent pixels in adjacent frames/fields or in the same field. y isiThe values may be in adjacent frames/fields or in the same field with qiThe decoded values of the pixels at the same position.
In addition, any DR and/or MIN recovery technique may be combined with the slicing process to improve recovery accuracy and prevent data overflow during recovery. The slicing process limits the restored data to a predetermined value range; and thus those values outside the range are limited to be closest to the range edge. In one embodiment, the clipping process limits the value to the range LQ,UQ]Where L isQ,UQRepresenting the upper and lower bounds, respectively, of the range of pixel values represented by the quantization bits, Q, and further limiting the values to: MIN + DR ≦ Num, where Num represents the maximum pixel value; num is 225 in this embodiment. In this embodiment, where applicable, UQ+1=LQ+1。
The criteria may be combined into a single equation, resulting in an unrestricted recovery value (val') for DR, and the final clipped recovery value (val) is derived from:
val=max(min(val,min(UQ,255-MIN)),LQ)
here min and max represent the minimum and maximum functions, respectively.
In another embodiment, boundary pixels y for generating recovered DR and/or MINiCan be filtered to use only those in which the best correlation is presentedThus better recovering DR and MIN. Those boundary pixels that do not meet the criteria are not used. In one embodiment, L is asserted if there is a DR valueQ≤DR<UQAnd the original pixel yiMay have been encoded as qiBoundary pixel yiIs considered to be effective for DR calculation. Therefore, a pixel is valid if the following equation is satisfied:
where m represents the maximum quantization level of 2Q-1. The DR recovery value (val') may be calculated according to the following equation:
the value may then be clipped to a valid range. This process therefore forces the DR recovery value inside the valid region defined by the threshold table, reducing the accuracy of the point where its true DR is near the threshold table boundary.
It has been noted that the DR of a stationary ADRC block varies slightly from frame to frame due to quantization noise. If this change crosses the ADRC coding boundary, and if DR is restored over several consecutive frames, the DR restored value with valid pixel selection tends to exceed the target at each intersection, resulting in a flicker phenomenon perceptible in the display. In an effort to reduce the occurrence of this phenomenon, one embodiment modifies the active pixel selection process to widen the upper and lower bounds, thereby allowing border pixels in adjacent active areas to be crossed. By including points only outside the boundary, the recovered value will more easily assume a value close to the upper or lower bound. Relaxed boundary L'QAnd U'QCalculated by the relaxation constant r. In one embodiment, r is set to a value of 0.5. Other values may also be used:
L’Q=rLQ-1+(1-r)LQ
U’Q=(1-r)UQ+rUQ+1
the above discussion presents a number of ways to recover DR and MIN when these values have been corrupted or lost. Further improvements can be achieved by examining the temporal and/or spatial correlation between data and thus weighting the corresponding computed recovery values. More specifically, if there is a large correlation, e.g., a horizontal correlation, in a particular direction or time, then it is likely that the image characteristics will continue smoothly in the direction with the strong correlation, and therefore the recovery value using the high correlation data will generally yield a better estimate. To take advantage of this, the boundary data is decomposed into the corresponding directions (e.g., vertical, horizontal, field-to-field) and weighted according to the correlation measurements to produce the final recovery values.
One embodiment of this process is described with reference to fig. 27 a. At step 2710, a recovered value of the DR or MIN value to be recovered is generated in one direction, and at step 2715, a recovered value is generated in the other direction. For example, if the process is spatially adaptive, boundary pixels along a horizontal boundary are used to generate a first restored value, "host", and boundary pixels along a vertical boundary are used to generate a second restored value, "vest". Alternatively, if the process is time adaptive, then boundary pixels between adjacent fields are used to generate the first restored value and boundary pixels between adjacent frames are used to generate the second restored value.
At step 2720, the recovery values are weighted according to a correlation calculation representing the degree of correlation in each direction. At step 2725, the weighted first and second recovered values are combined to produce a combined recovered value. It should be noted that the process is not limited to producing weighted recovery values in only two directions; it will be apparent that the number of recovery values that are weighted and combined may vary depending on the application. Various known techniques may be used to generate a correlation value that represents the degree of correlation in a particular direction. Furthermore, various criteria may be used to select the weighting factors, taking into account the degree of correlation. In general, if one correlation is stronger than the other, the combined recovery values should be based primarily on the corresponding recovery values. In one embodiment, the combined recovery value is calculated as follows:
where hc denotes a horizontal correlation, vc denotes a vertical correlation, hest denotes a DR recovery value based only on left and right boundary information, vest denotes a DR recovery value based only on upper and lower boundary information, and α denotes a weight value. The weighting values may be determined in various ways. FIG. 27b illustrates one embodiment of determining the weighting value as a function of the difference between the horizontal correlation and the vertical correlation. More specifically, α is selected as:
as noted above, adaptive correlation processing is used for DR and MIN recovery. But preferably MIN recovery is clipped to ensure MIN + DR ≦ 255, so the function val ≦ max (MIN (val', 255-MIN), 0) may be used. Furthermore, as noted above, the temporal correlation may be evaluated and used to weight the recovery values. Furthermore, a combination of temporal and spatial correlation may be performed. For example, a recovery value may be generated between fields as a time recovery value. Another recovery value is generated as a spatial recovery value within one field. The final recovery value is computed as a combined value that is both time and space dependent. The correlation combining may be replaced by the amount of motion. Other variables are also contemplated. The method can also be used for voice data.
In another embodiment, a low complexity modification to the least squares technique is used. With this embodiment, flicker due to restoration of the DR value is reduced. For purposes of the following discussion, QV represents a string from which DR is restored with a set of points qiY is a series of decoded values taken from vertically or horizontally adjacent points of each point in the QV, where Y isiRepresents qiVertically or horizontally adjacent points. Since each point qiThere may be up to 4 decoded neighbor points, and one pixel or point may result in up to four (q)i,yi) And (6) pairing. Hence an unconstrained least squares estimation of DR (DR)uls) The method comprises the following steps:
where Q is the number of quantized bits and MIN is the minimum value transmitted as a block attribute. The above equation assumes non-edge matching ADRC; for edge matching ADRC, 2QQuilt 2Q-1 substitution, (0.5+ q)i) Is q byiInstead.
The unconstrained least squares estimate is preferably clipped to ensure consistency with the table and equation MI N + DR ≦ 255 implemented in the encoding process (typically, for non-edge matching ADRC, the allowable DR value is in the range of 1-256). The least squares estimate is therefore clipped (DR)lsc) Comprises the following steps:
(DR)lsc=max(min(UB,DRuls),LB)
where UB represents the upper bound, LB represents the lower bound, and min and max represent the minimum and maximum functions, respectively.
In another embodiment, the estimation may be enhanced by selecting the pixels best suited for DR estimation to compute the DR estimation. For example, flat areas of the image provide pixels better suited for DR estimation than those areas where high activity occurs. In particular, sharp edges in the edges may reduce the accuracy of the estimation. The following embodiments provide a computationally inexpensive method for selecting pixels for calculating a DR estimate.
In one embodiment, a least squares estimate (DR) is calculatedlse) E.g. DrulsOr DRlsc. Using this estimate, the list of encoded values QV is converted into candidate decoded values X, where XiIs from qiThe resulting member of X. x is the number ofiThe value is the first estimate using DRThe constituent recovered decoded values are counted. x is the number ofiThe values are defined according to the following formula:
edge matching ADRC:
non-edge matching ADRC:
suppose DRlseIs a reasonable estimate of true DR, then xiFrom yiAnywhere in relatively close proximity may be decided as a low activity zone and therefore a desirable match. The new X and Y lists may then be generated by considering only XiAnd yIMatches in close proximity are constructed and the least squares estimate is recalculated to produce an updated estimate.
The criteria for determining "proximity" may be determined in various ways. In one embodiment, ADRC encoding of the error function is used. This approach is desirable because it is computationally inexpensive. For this process, a point e is definedi=|yi-xiList E of l. Definitions emin and emax is the minimum and maximum in the list, respectively, and eDR is emax-emin. The coding error value may then be defined as:
gi=(ei-emin)nl/eDR
where nl denotes re-quantizing e in a manner similar to the ADRC process described aboveiThe average number of quantization levels of (a).
Thus, the new lists X and Y are created by selecting only those giA match less than some threshold. If the new lists are long enough, these lists can be used to generate an accurate least squares estimate DRrls。giIs determined preferably empirically and the number of matches required before the least squares estimate is accurately determined. For example, in one embodiment, for a process that includes 8 × 8 × 2 blocks of horizontal subsampling and nl of 10, only the and g is usedi0, and the estimate is determined accurately only if the new list contains at least 30 matches.
In another embodiment, the DR estimate may be improved by clipping the potential DR values and recalculating the DR estimate. Specifically, in one embodiment list D is composed of member DiComposition of the member diComprising bringing xiIs equal to yiDR value of (a). More precisely:
di=2Q(yi-MIN)/(0.5+qi)
the improvement can be achieved by applying to each diAs seen by clipping. That is to say that the first and second electrodes,
di’=max(min(UB,di),LB)
wherein DR is reducedclsIs calculated as di' average value. Slicing method (DR)cls) Can be estimated with other DR (e.g. DR in weighted average)lse) And combined to produce the final DR value. For example, the weighted average DR is determined according toest:
DRest=w1(DRcls)+w2(DRlse)
The weights w1 and w2 are preferably determined empirically by examining the resulting estimates and the images resulting from the particular weighting. In one embodiment, w 1-0.22513 and w 2-0.80739.
The invention has been described in connection with the preferred embodiments. Many alternatives, modifications, variations and uses will be apparent to those skilled in the art in light of the foregoing description.
Claims (72)
1. A method of recovering corrupted data in an encoded data bitstream, comprising the steps of:
generating a plurality of candidate decodings based on a particular parameter, the particular parameter being an estimate of at least one block property of the encoded data;
calculating for each of said plurality of candidate decodings at least one evaluation measure according to a certain parameter, each of said evaluation measures being determined according to a degree of conformity of a corresponding candidate decoding with other decoded data in the bitstream of encoded data and according to a certain parameter;
selecting one of a plurality of candidate decodes;
determining at least one particular parameter for the candidate decoding; and
decoding the bitstream according to the at least one specific parameter.
2. The method as set forth in claim 1, wherein the calculation of said evaluation measure further comprises the steps of:
measuring motion of the plurality of candidate decodes;
determining a plurality of motion groups by evaluating the motions of the plurality of candidate decodes; and
computing an evaluation measure for the plurality of candidate decodes based on the plurality of motion groups.
3. The method as set forth in claim 2 wherein said encoded data is generated from a video signal, said video signal comprising a plurality of video frames, said determining of said plurality of motion groups further comprising the steps of:
measuring spatial and temporal correlations of the plurality of candidate decodes of the video frame; and
the plurality of motion groups are determined by comparing a threshold to the spatial and temporal correlations.
4. The method as set forth in claim 2 wherein said encoded data is generated from a video signal, said video signal including a plurality of interlaced fields, said determining of said plurality of motion groups further comprising the steps of:
measuring spatial and temporal correlations of the plurality of candidate decodes of the interlaced field; and
the plurality of motion groups are determined by comparing a threshold to the spatial and temporal correlations.
5. The method as set forth in claim 2 wherein said encoded data is generated from a video signal, said video signal comprising a plurality of video frames, said determining of said plurality of motion groups further comprising the steps of:
measuring a sum of changed samples of the plurality of candidate decodes of the video frame; and
the plurality of motion groups are determined by comparing a threshold to the modified sample sum.
6. The method as set forth in claim 2 wherein said encoded data is generated from a video signal, said video signal including a plurality of interlaced fields, said determining of said plurality of motion groups further comprising the steps of:
measuring a sum of modified samples of the plurality of candidate decodes of the interlaced field; and
determining the plurality of motion groups by comparing a threshold to the modified sample sum.
7. The method as set forth in claim 2 wherein said encoded data is generated from a video signal, said video signal comprising a plurality of video frames, said determining of said plurality of motion groups further comprising the steps of:
measuring a maximum absolute value of the plurality of candidate decoded changed samples of the video frame; and
determining the plurality of motion groups by comparing a threshold to the maximum absolute value of the changed samples.
8. The method as set forth in claim 2 wherein said encoded data is generated from a video signal, said video signal including a plurality of interlaced fields, said determining of said plurality of motion groups further comprising the steps of:
measuring a maximum absolute value of the plurality of candidate decoded changed samples of the interlaced field; and
determining the plurality of motion groups by comparing a threshold to the maximum absolute value of the changed samples.
9. The method as set forth in claim 1, wherein calculating said evaluation measure further comprises the steps of:
normalizing the candidate decoded values of the plurality of candidate decodes; and
calculating the evaluation measures for the plurality of candidate decodings.
10. The method as set forth in claim 1, wherein said evaluation measure is a smoothness measure.
11. The method as set forth in claim 10, wherein calculating said evaluation measure further comprises the steps of:
normalization Here, the
 Is a position [ i, j ] in a region of the candidate decoded image]The candidate decoded value of (a); and
using normalization determined according to Laplace kernel L [ m ]][n]And block laplacian Lx to compute smoothness:
12. the method as set forth in claim 11, wherein the normalizing step is calculated according to the formula:
wherein,
13. the method as set forth in claim 12 wherein K is equal to 8.
14. The method as set forth in claim 10, wherein the smoothness measure comprises second order image surface characteristics.
15. The method as set forth in claim 10 wherein the smoothness measure comprises an N-order image surface property, where N > 1.
16. The method as set forth in claim 10 wherein the image portion comprises a portion of a frame of data, said frame portion comprising first and second interlaced field portions of data, the step of calculating said evaluation measure further comprising the steps of:
determining whether the image portion includes motion;
if the image portion includes motion;
calculating a smoothness measure for a first field portion of the image portion and a second field portion of the image portion; and
averaging the smoothness measures together to produce a smoothness measure; and is
If the image portion does not include motion, a smoothness measure is generated for a frame portion of the image portion.
17. The method as set forth in claim 1, wherein said evaluation measure is a laplacian measure.
18. The method as set forth in claim 1, wherein said evaluation measure is a square error measure.
19. The method as set forth in claim 1, wherein said evaluation measure is a spatial correlation measure.
20. The method as set forth in claim 1, wherein said evaluation measure is a horizontal correlation measure.
21. The method as set forth in claim 1, wherein said evaluation measurement is a vertical correlation measurement.
22. The method as set forth in claim 1, wherein said evaluation measure is a diagonal correlation measure.
23. The method as set forth in claim 1, wherein said evaluation measure is a temporal activity measure.
24. The method as set forth in claim 1, wherein the particular parameter is selected from the group consisting of a motion flag value and a quantized bit value.
25. A digital processing system comprising a processor configured to recover corrupted data in an encoded data bit stream, the processor configured to:
generating a plurality of candidate decodings based on a particular parameter, the particular parameter being an estimate of at least one block property of the encoded data;
calculating for each of said plurality of candidate decodings at least one evaluation measure according to a certain parameter, each of said evaluation measures being determined according to a degree of conformity of a corresponding candidate decoding with other decoded data in the bitstream of encoded data and according to a certain parameter;
selecting one of a plurality of candidate decodes;
determining at least one particular parameter for the candidate decoding; and
the bitstream is decoded according to at least one specific parameter.
26. The digital processing system as set forth in claim 25, said processor further configured to compute an evaluation measure for each of said plurality of candidate decodes by: measuring motion of the plurality of candidate decodes, determining a plurality of motion groups by evaluating the motion of the plurality of candidate decodes, and calculating evaluation measures of the plurality of candidate decodes from the plurality of motion groups.
27. The digital processing system as set forth in claim 26, wherein said encoded data is generated from a video signal, said video signal comprising a plurality of video frames, said processor being further configured to determine said plurality of motion groups by: measuring spatial and temporal correlations of the plurality of candidate decodes of the video frame; and determining the plurality of motion groups by comparing a threshold to the spatial and temporal correlations.
28. The digital processing system as set forth in claim 26, wherein said encoded data is generated from a video signal, said video signal including a plurality of interlaced fields, said processor being further configured to determine said plurality of motion groups by: measuring spatial and temporal correlations of the plurality of candidate decodes of the interlaced field; and determining the plurality of motion groups by comparing a threshold to the spatial and temporal correlations.
29. The digital processing system as set forth in claim 26, wherein said encoded data is generated from a video signal, said video signal comprising a plurality of video frames, said processor being further configured to determine said plurality of motion groups by: measuring a sum of changed samples of the plurality of candidate decodes of the video frame; and determining the plurality of motion groups by comparing a threshold to the modified sample sum.
30. The digital processing system as set forth in claim 26, wherein said encoded data is generated from a video signal, said video signal including a plurality of interlaced fields, said processor being further configured to determine said plurality of motion groups by: measuring a sum of modified samples of the plurality of candidate decodes of the interlaced field; and determining the plurality of motion groups by comparing a threshold to the modified sample sum.
31. The digital processing system as set forth in claim 26, wherein said encoded data is generated from a video signal, said video signal comprising a plurality of video frames, said processor being further configured to determine said plurality of motion groups by: measuring a maximum absolute value of the plurality of candidate decoded changed samples of the video frame; and determining the plurality of motion groups by comparing a threshold to the maximum absolute value of the changed samples.
32. The digital processing system as set forth in claim 26, wherein said encoded data is generated from a video signal, said video signal including a plurality of interlaced fields, said processor being further configured to determine said plurality of motion groups by: measuring a maximum absolute value of the plurality of candidate decoded changed samples of the interlaced field: and determining the plurality of motion groups by comparing a threshold to the maximum absolute value of the changed samples.
33. The digital processing system as set forth in claim 25, said processor further configured to compute an evaluation measure for said plurality of candidate decodes by: normalizing the candidate decoded values of the plurality of candidate decodes; and calculating the evaluation measures for the plurality of candidate decodes.
34. The digital processing system as set forth in claim 25, said processor further configured to compute an evaluation measure for said plurality of candidate decodes, wherein said evaluation measure is a smoothness measure.
35. The digital processing system as set forth in claim 34, wherein said processor is configured to compute said evaluation measure by:
normalization Here, the
 Is a position [ i, j ] in a region of the candidate decoded image]The candidate decoded value of (a); and
using a determination according to Laplace kernel L [ m ]][n]And block laplacian Lx to compute smoothness:
36. the digital processing system as set forth in claim 35, wherein the processor is configured to normalize according to:
wherein,
37. the digital processing system as set forth in claim 36, wherein K equals 8.
38. The digital processing system as set forth in claim 37, wherein the smoothness measure comprises second order image surface characteristics.
39. The digital processing system as set forth in claim 34, wherein the smoothness measure comprises an N-order image surface property, where N > 1.
40. The digital processing system as set forth in claim 34, wherein the image portion comprises a portion of a frame of data, said frame portion comprising first and second interlaced field portions of data, the processor measuring the smoothness by:
determining whether the image portion includes motion;
if the image portion includes motion;
calculating a smoothness measure for a first field portion of the image portion and a second field portion of the image portion; and
averaging the smoothness measures together to produce a smoothness measure; and is
If the image portion does not include motion, a smoothness measure is generated for a frame portion of the image portion.
41. The digital processing system as set forth in claim 25, said processor further configured to compute said evaluation measure for said plurality of candidate decodes, wherein said evaluation measure is a laplacian measure.
42. The digital processing system as set forth in claim 25, said processor further configured to compute said evaluation measure for said plurality of candidate decodes, wherein said evaluation measure is a square error measure.
43. The digital processing system as set forth in claim 25, said processor further configured to compute said evaluation measure for said plurality of candidate decodes, wherein said evaluation measure is a spatial correlation measure.
44. The digital processing system as set forth in claim 25, said processor further configured to compute said evaluation measure for said plurality of candidate decodes, wherein said evaluation measure is a horizontal correlation measure.
45. The digital processing system as set forth in claim 25, said processor further configured to compute said evaluation measure for said plurality of candidate decodes, wherein said evaluation measure is a vertical correlation measure.
46. The digital processing system as set forth in claim 25, said processor further configured to compute said evaluation measure for said plurality of candidate decodes, wherein said evaluation measure is a diagonal correlation measure.
47. The digital processing system as set forth in claim 25, said processor further configured to compute said evaluation measure for said plurality of candidate decodes, wherein said evaluation measure is a temporal activity measure.
48. The digital processing system as set forth in claim 25, wherein the particular parameter is selected from the group consisting of a motion flag value and a quantized bit value.
49. An apparatus for recovering corrupted data in a bitstream of encoded data, comprising:
means for generating a plurality of candidate decodings based on a particular parameter that is an estimate of at least one block property of the encoded data;
means for calculating at least one evaluation measure for each of said plurality of candidate decodings in accordance with a particular parameter, each of said evaluation measures being determined in accordance with a degree of conformity of a corresponding candidate decoding with other decoded data in the bitstream of encoded data and in accordance with the particular parameter;
means for selecting one of a plurality of candidate decodes;
means for determining at least one particular parameter for the candidate decode; and
means for decoding the bitstream according to at least one particular parameter.
50. The apparatus set forth in claim 49, wherein said means for calculating said evaluation measure further comprises:
means for measuring motion of the plurality of candidate decodes;
means for determining a plurality of motion groups by evaluating the motions of the plurality of candidate decodes; and
means for calculating evaluation measures for the plurality of candidate decodes from the plurality of motion groups.
51. The apparatus set forth in claim 50, wherein said encoded data is generated from a video signal, said video signal comprising a plurality of video frames, said means for determining said plurality of motion groups further comprising:
means for measuring spatial and temporal correlations of the plurality of candidate decodes of the video frame; and
means for determining said plurality of motion groups by comparing a threshold to said spatial and temporal correlations.
52. The apparatus set forth in claim 50 wherein said encoded data is generated from a video signal, said video signal comprising a plurality of interlaced fields, said means for determining said plurality of motion groups further comprising:
means for measuring spatial and temporal correlations of said plurality of candidate decodes of said interlaced field; and
means for determining said plurality of motion groups by comparing a threshold to said spatial and temporal correlations.
53. The apparatus set forth in claim 50, wherein said encoded data is generated from a video signal, said video signal comprising a plurality of video frames, said means for determining said plurality of motion groups further comprising:
means for measuring a sample sum of changes of the plurality of candidate decodes of the video frame; and
means for determining said plurality of motion groups by comparing a threshold to said modified sample sum.
54. The apparatus set forth in claim 50 wherein said encoded data is generated from a video signal, said video signal comprising a plurality of interlaced fields, said means for determining said plurality of motion groups further comprising:
means for measuring a modified sample sum of said plurality of candidate decodes of said interlaced field; and
means for determining said plurality of motion groups by comparing a threshold to said modified sample sum.
55. The apparatus set forth in claim 50, wherein said encoded data is generated from a video signal, said video signal comprising a plurality of video frames, said means for determining said plurality of motion groups further comprising:
means for measuring a maximum absolute value of the plurality of candidate decoded changed samples of the video frame; and
means for determining said plurality of motion groups by comparing a threshold to said maximum absolute value of changed samples.
56. The apparatus set forth in claim 50 wherein said encoded data is generated from a video signal, said video signal comprising a plurality of interlaced fields, said means for determining said plurality of motion groups further comprising:
means for measuring a maximum absolute value of said plurality of candidate decoded changed samples of said interlaced field; and
means for determining said plurality of motion groups by comparing a threshold to said maximum absolute value of changed samples.
57. The apparatus as set forth in claim 49, wherein the means for calculating the evaluation measure further comprises:
means for normalizing the candidate decoded values of the plurality of candidate decodes; and
means for calculating the evaluation measures for the plurality of candidate decodes.
58. The apparatus as set forth in claim 49, wherein said evaluation measurement is a smoothness measurement.
59. The apparatus as set forth in claim 55, wherein said means for calculating said evaluation measure further comprises:
for normalization Herein, the device of
 Is a position [ i, j ] in a region of the candidate decoded image]The candidate decoded value of (a); and
using normalization determined according to Laplace kernel L [ m ]][n]And means for calculating the smoothness by the block laplacian Lx:
60. the apparatus as set forth in claim 59, wherein the normalizing means is calculated according to:
wherein,
61. the apparatus set forth in claim 60, wherein K is equal to 8.
62. The apparatus set forth in claim 58 wherein the smoothness comprises second order image surface characteristics.
63. The apparatus set forth in claim 58 wherein the smoothness comprises an N-order image surface characteristic, where N > 1.
64. The apparatus as set forth in claim 58 wherein the image portion comprises a portion of a frame of data, said frame portion comprising first and second interlaced field portions of data, the means for calculating said evaluation measure further comprising:
means for determining whether the image portion includes motion;
if the image portion includes motion;
means for calculating a smoothness measure for a first field portion of the image portion and a second field portion of the image portion; and
means for averaging the smoothness measures together to produce a smoothness measure; and is
Means for generating a smoothness measure for a frame portion of the image portion if the image portion does not include motion.
65. The apparatus as set forth in claim 49, wherein said evaluation measure is a Laplace measure.
66. The apparatus as set forth in claim 49, wherein said evaluation measure is a square error measure.
67. The apparatus as set forth in claim 49, wherein said evaluation measurement is a spatial correlation measurement.
68. The apparatus as set forth in claim 49, wherein said evaluation measure is a horizontal correlation measure.
69. The apparatus as set forth in claim 49, wherein said evaluation measurement is a vertical correlation measurement.
70. The apparatus as set forth in claim 49, wherein said evaluation measure is a diagonal correlation measure.
71. The apparatus as set forth in claim 49, wherein said evaluation measure is a temporal activity measure.
72. The apparatus of claim 49 wherein the particular parameter is selected from the group consisting of a motion flag value and a quantized bit value.
Applications Claiming Priority (24)
| Application Number | Priority Date | Filing Date | Title |
|---|---|---|---|
| US95663297A | 1997-10-23 | 1997-10-23 | |
| US95687097A | 1997-10-23 | 1997-10-23 | |
| US95755597A | 1997-10-23 | 1997-10-23 | |
| US08/956870 | 1997-10-23 | ||
| US08/957555 | 1997-10-23 | ||
| US08/956632 | 1997-10-23 | ||
| US255398A | 1998-01-02 | 1998-01-02 | |
| US247098A | 1998-01-02 | 1998-01-02 | |
| US254798A | 1998-01-02 | 1998-01-02 | |
| US09/002553 | 1998-01-02 | ||
| US09/002547 | 1998-01-02 | ||
| US09/002470 | 1998-01-02 | ||
| US09/016,083 US6581170B1 (en) | 1997-10-23 | 1998-01-30 | Source coding to provide for robust error recovery during transmission losses |
| US09/016083 | 1998-01-30 | ||
| US09/111,270 | 1998-07-06 | ||
| US09/002,547 | 1998-07-06 | ||
| US09/111270 | 1998-07-06 | ||
| US09/002,553 | 1998-07-06 | ||
| US08/957,555 | 1998-07-06 | ||
| US09/111,270 US6282684B1 (en) | 1997-10-23 | 1998-07-06 | Apparatus and method for recovery of data in a lossy transmission environment |
| US08/956,632 | 1998-07-06 | ||
| US08/956,870 | 1998-07-06 | ||
| US09/016,083 | 1998-07-06 | ||
| US09/002,470 | 1998-07-06 |
Publications (2)
| Publication Number | Publication Date |
|---|---|
| CN1306648A CN1306648A (en) | 2001-08-01 |
| CN100353326C true CN100353326C (en) | 2007-12-05 |
Family
ID=27573873
Family Applications (1)
| Application Number | Title | Priority Date | Filing Date |
|---|---|---|---|
| CNB988125862A Expired - Fee Related CN100353326C (en) | 1997-10-23 | 1998-10-23 | Appts. and method for recovery of data in lossy transmission environment |
Country Status (5)
| Country | Link |
|---|---|
| EP (1) | EP1025538B1 (en) |
| JP (1) | JP4558191B2 (en) |
| CN (1) | CN100353326C (en) |
| AU (1) | AU1362999A (en) |
| WO (1) | WO1999021124A1 (en) |
Families Citing this family (5)
| Publication number | Priority date | Publication date | Assignee | Title |
|---|---|---|---|---|
| JP4558193B2 (en) * | 1997-10-23 | 2010-10-06 | ソニー エレクトロニクス インク | Data receiving method and apparatus, received data recovery processing apparatus and recording medium |
| US6493842B1 (en) * | 1999-06-29 | 2002-12-10 | Sony Corporation | Time-varying randomization for data synchronization and implicit information transmission |
| US6549672B1 (en) * | 1999-06-29 | 2003-04-15 | Sony Corporation | Method and apparatus for recovery of encoded data using central value |
| US6539517B1 (en) * | 1999-11-09 | 2003-03-25 | Sony Corporation | Data transformation for explicit transmission of control information |
| US7817869B2 (en) * | 2004-05-07 | 2010-10-19 | Sony Corporation | Variable support robust transform for multiple description coding |
Citations (2)
| Publication number | Priority date | Publication date | Assignee | Title |
|---|---|---|---|---|
| US5428403A (en) * | 1991-09-30 | 1995-06-27 | U.S. Philips Corporation | Motion vector estimation, motion picture encoding and storage |
| US5625715A (en) * | 1990-09-07 | 1997-04-29 | U.S. Philips Corporation | Method and apparatus for encoding pictures including a moving object |
Family Cites Families (6)
| Publication number | Priority date | Publication date | Assignee | Title |
|---|---|---|---|---|
| JP2518229B2 (en) * | 1986-10-09 | 1996-07-24 | ソニー株式会社 | Digital image signal coding device |
| JP3406312B2 (en) * | 1990-07-24 | 2003-05-12 | ソニー株式会社 | Digital signal recording device, digital signal reproducing device, and digital signal recording / reproducing device |
| JP3304431B2 (en) * | 1992-08-31 | 2002-07-22 | ソニー株式会社 | Transmission device for block transform coded data |
| KR960012931B1 (en) * | 1993-08-31 | 1996-09-25 | 대우전자 주식회사 | Channel error concealing method for classified vector quantized video |
| US5724369A (en) * | 1995-10-26 | 1998-03-03 | Motorola Inc. | Method and device for concealment and containment of errors in a macroblock-based video codec |
| JP4558193B2 (en) * | 1997-10-23 | 2010-10-06 | ソニー エレクトロニクス インク | Data receiving method and apparatus, received data recovery processing apparatus and recording medium |
-
1998
- 1998-10-23 JP JP2000517372A patent/JP4558191B2/en not_active Expired - Fee Related
- 1998-10-23 AU AU13629/99A patent/AU1362999A/en not_active Abandoned
- 1998-10-23 WO PCT/US1998/022409 patent/WO1999021124A1/en active IP Right Grant
- 1998-10-23 EP EP98957352A patent/EP1025538B1/en not_active Expired - Lifetime
- 1998-10-23 CN CNB988125862A patent/CN100353326C/en not_active Expired - Fee Related
Patent Citations (2)
| Publication number | Priority date | Publication date | Assignee | Title |
|---|---|---|---|---|
| US5625715A (en) * | 1990-09-07 | 1997-04-29 | U.S. Philips Corporation | Method and apparatus for encoding pictures including a moving object |
| US5428403A (en) * | 1991-09-30 | 1995-06-27 | U.S. Philips Corporation | Motion vector estimation, motion picture encoding and storage |
Also Published As
| Publication number | Publication date |
|---|---|
| EP1025538B1 (en) | 2012-07-11 |
| JP2001521304A (en) | 2001-11-06 |
| CN1306648A (en) | 2001-08-01 |
| EP1025538A1 (en) | 2000-08-09 |
| WO1999021124A9 (en) | 1999-07-08 |
| AU1362999A (en) | 1999-05-10 |
| WO1999021124A1 (en) | 1999-04-29 |
| EP1025538A4 (en) | 2009-08-12 |
| JP4558191B2 (en) | 2010-10-06 |
Similar Documents
| Publication | Publication Date | Title |
|---|---|---|
| US6298085B1 (en) | Source encoding using shuffling of data to provide robust error recovery in a burst error-environment | |
| JP4558190B2 (en) | Data recovery method and apparatus, and recording medium | |
| EP1025647B1 (en) | Apparatus and method for recovery of lost/damaged data in a bitstream of data based on compatibility | |
| CN100353326C (en) | Appts. and method for recovery of data in lossy transmission environment | |
| US6282684B1 (en) | Apparatus and method for recovery of data in a lossy transmission environment | |
| KR100594407B1 (en) | Computer-readable media comprising methods, apparatus and processing systems and executable instructions for receiving lost / corrupted data in a bitstream of encoded data | |
| JP2001521346A (en) | Image-to-block mapping apparatus and method for providing strong error recovery in a transmission environment where data loss is likely to occur | |
| EP1025648B1 (en) | Apparatus and method for localizing transmission errors to provide robust error recovery in a lossy transmission environment | |
| EP1025705B1 (en) | Apparatus and method for partial buffering transmitted data to provide robust error recovery in a lossy transmission environment | |
| JP2001521305A (en) | Apparatus and method for recovering quantization code in transmission environment where data loss is likely to occur |
Legal Events
| Date | Code | Title | Description |
|---|---|---|---|
| C06 | Publication | ||
| PB01 | Publication | ||
| C10 | Entry into substantive examination | ||
| SE01 | Entry into force of request for substantive examination | ||
| C14 | Grant of patent or utility model | ||
| GR01 | Patent grant | ||
| REG | Reference to a national code |
Ref country code: HK Ref legal event code: GR Ref document number: 1039195 Country of ref document: HK |
|
| C17 | Cessation of patent right | ||
| CF01 | Termination of patent right due to non-payment of annual fee |
Granted publication date: 20071205 Termination date: 20131023 |