WO2019069955A1 - Differentiation device, differentiation method for depression symptoms, determination method for level of depression symptoms, stratification method for depression patients, determination method for effects of treatment of depression symptoms, and brain activity training device - Google Patents
Differentiation device, differentiation method for depression symptoms, determination method for level of depression symptoms, stratification method for depression patients, determination method for effects of treatment of depression symptoms, and brain activity training device Download PDFInfo
- Publication number
- WO2019069955A1 WO2019069955A1 PCT/JP2018/036952 JP2018036952W WO2019069955A1 WO 2019069955 A1 WO2019069955 A1 WO 2019069955A1 JP 2018036952 W JP2018036952 W JP 2018036952W WO 2019069955 A1 WO2019069955 A1 WO 2019069955A1
- Authority
- WO
- WIPO (PCT)
- Prior art keywords
- functional
- classifier
- subject
- correlation
- brain activity
- Prior art date
Links
Images


Classifications
-
- A—HUMAN NECESSITIES
- A61—MEDICAL OR VETERINARY SCIENCE; HYGIENE
- A61B—DIAGNOSIS; SURGERY; IDENTIFICATION
- A61B5/00—Measuring for diagnostic purposes; Identification of persons
- A61B5/05—Detecting, measuring or recording for diagnosis by means of electric currents or magnetic fields; Measuring using microwaves or radio waves
- A61B5/055—Detecting, measuring or recording for diagnosis by means of electric currents or magnetic fields; Measuring using microwaves or radio waves involving electronic [EMR] or nuclear [NMR] magnetic resonance, e.g. magnetic resonance imaging
Definitions
- the present invention relates to a discriminating apparatus, a method of discriminating depressive symptoms, a method of discriminating levels of depressive symptoms, a method of stratification of depressive patients, a method of discriminating therapeutic effects of depressive symptoms, and a brain activity training apparatus.
- Biomarker An indicator that quantifies and quantifies biological information in order to quantitatively grasp biological changes in a living body is called a “biomarker”.
- biomarker As “an item that can be objectively measured and evaluated as an indicator of normal processes, pathological processes, or pharmacological responses to treatment.”
- biomarkers that characterize the disease state, changes, and degree of cure are used as surrogate markers (alternative markers) to confirm the efficacy of new drugs in clinical trials.
- Blood glucose level and cholesterol level are representative biomarkers as indicators of lifestyle-related diseases. Not only substances of biological origin contained in urine and blood but also electrocardiogram, blood pressure, PET images, bone density, lung function etc. are included.
- advances in genome analysis and proteome analysis have led to the discovery of various biomarkers related to DNA, RNA, biological proteins and the like.
- Biomarkers are not only the measurement of the treatment effect after having a disease, but also as a routine index for preventing the disease, individualized medicine that selects an effective treatment that prevents the disease and avoids side effects. Its application to the future is expected.
- Biomarkers are used not only in routine medical care but also in drug development.
- pharmacodynamic markers will be used in the exploratory research stage, and toxicity markers that show the toxicity of candidate compounds will also be used in the non-clinical stage.
- markers are used as endpoints, and various markers such as diagnostic markers, prognostic markers, predictive markers, monitoring markers and safety markers are used.
- Alternate marker refers to a marker whose scientific relationship to the true endpoint has been demonstrated.
- diagnostic markers There are two types of “diagnostic markers”: a diagnostic marker that identifies the presence or absence of a disease and the type of disease, and a diagnostic marker that determines the severity and progression of a disease.
- a “prognostic marker” is a biomarker that distinguishes populations susceptible to a particular drug.
- a “prognostic marker” is a biomarker that predicts the progression or recovery of the disease regardless of the particular treatment.
- the “monitoring marker” is also called a “drug effect marker”, and is a marker for examining the efficacy of a drug and the therapeutic effect. By monitoring this marker for a long time, it can be a hint for elucidating the cause of drug resistance.
- the target molecule when the target molecule is clear, etc., for example, the target molecule may be available as a patient stratification marker in clinical trials to identify and select a population of patients susceptible to a particular drug.
- a diagnostic reagent for measuring the patient stratification marker when a drug using a patient stratification marker is approved, a diagnostic reagent for measuring the patient stratification marker may be called a "companion diagnostic drug".
- a diagnosis performed to select a treatment method for a patient by such a patient stratification marker may be referred to as a "companion diagnosis”.
- the trait marker that reflects behavioral or biological processes related to the cause of the disease, and the clinical status image in the patient It is called state marker that reflects.
- the trait marker is also called a genetic regularity index, and the state marker is also called a state dependency index.
- OCD obsessive-compulsive disorder
- drug therapy and behavioral therapy are known as the treatment methods.
- a drug therapy for example, a selective serotonin reuptake inhibitor is used, and as a behavioral therapy, an exposure response interference method combining an exposure method and a response interference method is known.
- Patent Document 6 a real-time neurofeedback method has been studied as a therapeutic possibility in the case of neuropsychiatric disease.
- Functional Magnetic Resonance Imaging a method of visualizing hemodynamic responses related to human brain activity using Magnetic Resonance Imaging (MRI)
- Functional brain function imaging methods including brain activity detection areas corresponding to components of brain functions of interest by detecting differences in brain activity due to sensory stimulation or cognitive task execution and brain activity due to rest or control task execution. It has been used to identify the brain, that is, to clarify the functional localization of the brain.
- Non-Patent Document 1 a report on a real-time neurofeedback technique using brain function imaging such as functional magnetic resonance imaging (fMRI) (Non-Patent Document 1).
- fMRI functional magnetic resonance imaging
- Neurofeedback is a type of biofeedback, in which a subject learns how to manipulate brain activity by receiving feedback on his or her brain activity.
- the resting brain is also active. That is, there are nerve cells in the brain that are sedated during active activity and actively excited at rest.
- the main site is the medial aspect where the left and right cerebrum meet, such as the medial aspect of the frontal lobe, posterior cingulate gyrus, anterior wing, posterior half of parietal joint area, medial temporal gyrus, etc.
- a region indicating a baseline of resting brain activity is named Default Mode Network (DMN), and operates in synchronization as one network (see Non-Patent Document 3).
- brain activity in a default mode network may be mentioned as an example in which brain activity is different between healthy and mental patients.
- the default mode network refers to a site where brain activity is more active in resting state than when performing goal-directed tasks. It has been reported that patients with diseases such as schizophrenia and Alzheimer's disease show abnormalities in this default mode network when compared with healthy people. For example, in the resting state, there is a report that, in the resting state, the activity of the posterior cingulate cortex belonging to the default mode network and the activity of the lateral parietal region, the medial prefrontal cortex, and the cerebellar cortex is lowered.
- rs-fcMRI resting-state functional connectivity MRI
- clinical research for various neurological and psychiatric disorders is also conducted. It's getting better.
- the conventional rs-fcMRI method is to observe the activity of a global neural network such as the default mode network as described above, and it is considered that a more detailed functional connection is sufficiently studied. It can not be said the situation.
- Nuclear Magnetic Resonance Imaging A brief description of such a nuclear magnetic resonance imaging method is as follows.
- nuclear magnetic resonance imaging When applied to the human body, nuclear magnetic resonance imaging has, for example, the following features, as compared to “X-ray CT” which is a similar in-body tomographic imaging method.
- Such nuclear magnetic resonance imaging utilizes the magnetic properties of hydrogen nuclei (protons), which are most abundant in each cell of the human body and have the greatest magnetism.
- the motion in the magnetic field of the spin angular momentum responsible for the magnetism of hydrogen nuclei is classically compared to the precession of coma.
- the direction of the spin angular momentum of the hydrogen nucleus (direction of the rotation axis of the coma) as described above is randomly directed in an environment without a magnetic field, but is directed in the direction of magnetic lines when a static magnetic field is applied.
- Such a resonance frequency f 0 is 42.6 ⁇ B 0 (MHz) in a hydrogen atom when the intensity of the static magnetic field is B 0 (T).
- nuclear magnetic resonance imaging it is also possible to visualize the active site of the brain in response to an external stimulus or the like by using the appearance of a change in the detected signal in response to a change in blood flow.
- Such nuclear magnetic resonance imaging is particularly referred to as functional magnetic resonance imaging.
- fMRI In fMRI, an apparatus is used which is equipped with a normal MRI apparatus and further with hardware and software necessary for fMRI measurement.
- the reason that the change in blood flow causes a change in the NMR signal intensity is that oxygenated and deoxygenated hemoglobin in blood has different magnetic properties. While oxygenated hemoglobin is diamagnetic in nature and does not affect the relaxation time of the hydrogen atoms of the water present around it, deoxygenated hemoglobin is a paramagnetic material and changes the surrounding magnetic field. Therefore, when the brain is stimulated to increase local blood flow and oxygenated hemoglobin is increased, the change can be detected as an MRI signal.
- For the stimulation of the subject for example, visual stimulation or auditory stimulation or execution of a predetermined task (task) is used (for example, Patent Document 2).
- the increase of the nuclear magnetic resonance signal (MRI signal) of the hydrogen atom corresponding to the phenomenon (BOLD effect) in which the concentration of deoxygenated hemoglobin in the red blood cell in the microveins and capillaries is decreased The measurement of brain activity is done by doing.
- Non-Patent Document 4 fMRI analyzes brain activity on a voxel basis (volumetric pixel: voxel) in the brain, making it possible to estimate a stimulus input and a recognition state from a spatial pattern of brain activity.
- Patent Document 3 discloses a brain activity analysis method for realizing a biomarker by brain function imaging for neurological and psychiatric disorders.
- the correlation matrix of activity between predetermined brain regions is derived for each subject from the data of resting functional combined MRI measured in the healthy group and the patient group.
- Feature extraction is performed by regularization canonical correlation analysis on the subject's attributes including the subject's disease / healthy label and the correlation matrix.
- a classifier that functions as a biomarker is generated by discriminant analysis by sparse logistic regression (SLR).
- biotypes neurophysiological subtypes
- Non-Patent Document 5 classification of the above-mentioned subtypes is performed by functional connection in the brain based on BOLD signals from 258 regions in the brain.
- biomarker generated by machine learning for brain activity measured in one facility It is necessary to improve the prediction accuracy of It is also necessary that the biomarkers generated in this way can be generalized to brain activity measured in other institutions.
- the first issue is the small sample size issue.
- Classifier parameters are easily over-fit to training data ("over-adapted” or “over-learning") as the amount of data N, the number of participants, is much smaller than the dimension M of the measured brain activity measurement data Will be called).
- the constructed classifier will perform very poorly on newly sampled test data. This is because these test data are not used to train the classifier.
- Non-Patent Document 5 it can not be said that such regularization is sufficiently considered.
- the second issue is that the classifier is clinically useful only if the constructed classifier maintains good performance even for MRI data scanned at an imaging site different from the site from which the training data was collected. It is useful and scientifically reliable.
- the present invention has been made to solve the above-mentioned problems, and one object of the present invention is to realize objective discrimination of disease labels of depressive symptoms with respect to brain activity. It is. Another object of the present invention is to realize discrimination of information indicating the degree of therapeutic effect on depressive symptoms. Another object of the present invention is to provide a classifier that outputs an index value as a biomarker for objectively determining the state of depressive symptoms. Another object of the invention is to realize the determination of the level of depressive symptoms. Another object of the invention is to achieve stratification of depressed patients.
- One embodiment of the present invention relates to a determination apparatus for assisting determination of the presence or absence of depressive symptoms in a subject.
- the discrimination device of the present embodiment when resting, uses signals representing brain activity in a plurality of predetermined regions in the brain of each of a plurality of participants including a healthy person and a depressed patient in advance in time series by the brain activity detection device
- a storage device is provided to store information for identifying a classifier generated by the classifier generation process from the measured signal.
- the classifier is based on a weighted sum of a plurality of functional combinations selected by feature selection as related to a disease label of depressive symptoms by machine learning out of functional connections among the plurality of predetermined areas. It is generated to determine the disease label of depressive symptoms.
- the selected plurality of functional connections are a first functional connection between the left dorsolateral prefrontal cortex and the anterior left and posterior cingulate cortex, and the lower left forehead valvular and the right back At least one selected from the second functional connection between the medial prefrontal cortex and the right supplemental motor area.
- the discrimination device of the present embodiment further includes an arithmetic device, and the arithmetic device executes discrimination processing for generating a classification result for depressive symptoms of a subject by the classifier.
- One embodiment of the present invention relates to a device for determining the level of depressive symptoms.
- the discrimination device of the present embodiment when resting, uses signals representing brain activity in a plurality of predetermined regions in the brain of each of a plurality of participants including a healthy person and a depressed patient in advance in time series by the brain activity detection device
- a storage device is provided for storing information identifying the classifier generated by the classifier generation process from the measured signal.
- the classifier is based on a weighted sum of a plurality of functional combinations selected by feature selection as related to a disease label of depressive symptoms by machine learning out of functional connections among the plurality of predetermined areas. It is generated to determine the disease label of depressive symptoms.
- the selected plurality of functional connections are a first functional connection between the left dorsolateral prefrontal cortex and the anterior left and posterior cingulate cortex, and the lower left forehead valvular and the right back At least one selected from the second functional connection between the medial prefrontal cortex and the right supplemental motor area.
- the discrimination apparatus of the present embodiment further includes an arithmetic unit, and the arithmetic unit is used to evaluate depression symptoms of the elements of the correlation matrix of the functional connection measured in the subject at rest by the classifier. Generate index values for The computing device compares the index value to a reference range of index values set in advance according to the level of depression symptoms for each functional connection. The arithmetic device determines that the subject is the level of depression symptoms corresponding to a reference range in which the index value is included.
- One embodiment of the present invention relates to a determination apparatus for determining a therapeutic effect in a subject.
- the discrimination device of the present embodiment when resting, uses signals representing brain activity in a plurality of predetermined regions in the brain of each of a plurality of participants including a healthy person and a depressed patient in advance in time series by the brain activity detection device
- a storage device is provided for storing information identifying the classifier generated by the classifier generation process from the measured signal.
- the classifier is based on a weighted sum of a plurality of functional combinations selected by feature selection as related to a disease label of depressive symptoms by machine learning out of functional connections among the plurality of predetermined areas. It is generated to determine the disease label of depressive symptoms.
- the selected plurality of functional connections are a first functional connection between the left dorsolateral prefrontal cortex and the anterior left and posterior cingulate cortex, and the lower left forehead valvular and the right back At least one selected from the second functional connection between the medial prefrontal cortex and the right supplemental motor area.
- the determination apparatus of the present embodiment further includes an arithmetic unit, and the arithmetic unit is configured to calculate an element of the functional combination correlation matrix measured at rest in the subject at the first time point by the classifier. Generate a first value to assess the symptoms.
- the arithmetic device is configured to cause the classifier to perform the functional connection in the resting brain of the same subject as the subject at a second time point after the start of the treatment and after the first time point.
- the arithmetic device compares the first value with the second value.
- the determination apparatus determines that the treatment is effective for the improvement of the depressive symptoms of the subject when the second value is improved compared to the first value, and / or If the second value does not improve more than the first value, it is determined that the treatment is not effective for the improvement of the depressive symptoms of the subject.
- One embodiment of the present invention relates to a discrimination apparatus for stratification of depressed patients when depressive symptoms are stratified into a plurality of preset subclasses.
- the determination apparatus of the present embodiment includes an arithmetic unit, and the arithmetic unit generates an index value for evaluating depression symptoms for an element of a correlation matrix of functional connections measured in a subject at rest. .
- the arithmetic device compares the index value with a reference range of index values set in advance according to the subclass for each functional connection.
- the arithmetic device determines that the subject is the subclass corresponding to a reference range in which the index value is included.
- One embodiment of the present invention relates to a computer program for causing the determination device to execute the above process.
- the determination method of the present embodiment includes the step of generating an index value for evaluating depressive symptoms for an element of the functional connection correlation matrix measured in the subject at rest.
- the functional connection is the first functional connection between the left dorsal lateral prefrontal cortex and the left anterior and left posterior cingulate cortex, and the lower left frontal valvular portion, the right dorsal medial prefrontal cortex and At least one selected from the second functional connection between the right supplementary motor area.
- the determination method of the present embodiment includes the step of determining that the subject has a depressive symptom when the index value exceeds a reference value.
- One embodiment of the present invention relates to a determination method to assist in determining the level of depressive symptoms in a subject.
- the determination method of the present embodiment includes the step of generating an index value for evaluating depressive symptoms for the elements of the correlation matrix of the functional connection measured in the subject at rest.
- the functional connection is the first functional connection between the left dorsal lateral prefrontal cortex and the left anterior and left posterior cingulate cortex, and the lower left frontal valvular portion, the right dorsal medial prefrontal cortex and At least one selected from the second functional connection between the right supplementary motor area.
- One embodiment of the present invention relates to a determination method for assisting determination of a treatment effect in a subject.
- the determination method of the present embodiment includes the step of generating a first value for evaluating depressive symptoms for an element of the functional connection correlation matrix measured at rest in the subject at a first time point.
- the functional connection is the first functional connection between the left dorsal lateral prefrontal cortex and the left anterior and left posterior cingulate cortex, and the lower left frontal valvular portion, the right dorsal medial prefrontal cortex and At least one selected from the second functional connection between the right supplementary motor area.
- the functional coupling in the brain of the same subject as the subject at the second time point after the start of the treatment and after the first time point is at rest Generating a second value for evaluating depressive symptoms for an element of the same functional connection correlation matrix.
- the treatment in the step of comparing the first value with the second value, and when the second value is better than the first value, the treatment is not Determining that it is effective to improve the depressive symptoms of the examiner.
- One embodiment of the present invention relates to a determination method for assisting determination of a treatment effect in a subject.
- the determination method of the present embodiment includes the step of generating a first value for evaluating depressive symptoms for an element of the functional connection correlation matrix measured at rest in the subject at a first time point.
- the functional connection is the first functional connection between the left dorsal lateral prefrontal cortex and the left anterior and left posterior cingulate cortex, and the lower left frontal valvular portion, the right dorsal medial prefrontal cortex and At least one selected from the second functional connection between the right supplementary motor area.
- the discrimination method of this embodiment is the same as the functional coupling in the resting brain of the same subject as the subject at the second time point after the start of the treatment and after the first time point.
- Generating a second value for assessing depressive symptoms for an element of the correlation matrix of functional connections of In the determination method of the present embodiment, in the step of comparing the first value and the second value, and in the case where the second value is not better than the first value, the treatment is not performed. Determining that it is not effective in improving the depressive symptoms of the examiner.
- One embodiment of the present invention relates to a discrimination method for assisting the stratification of depressed patients.
- the determination method of the present embodiment when depression is stratified into a plurality of preset subclasses, depression symptoms of an element of a correlation matrix of functional connections measured in a subject at rest Generating an index value for evaluating.
- the functional connection is the first functional connection between the left dorsal lateral prefrontal cortex and the left anterior and left posterior cingulate cortex, and the lower left frontal valvular portion, the right dorsal medial prefrontal cortex and At least one selected from the second functional connection between the right supplementary motor area.
- the determination method of the present embodiment includes the step of comparing the index value with a reference range of the index value set in advance according to the subclass for each functional connection, and the subject includes the index value. Determining the subclass corresponding to the reference range to be determined.
- One embodiment of the present invention relates to a discriminator for assisting the stratification of depressed patients.
- the discrimination device of the present embodiment when resting, uses signals representing brain activity in a plurality of predetermined regions in the brain of each of a plurality of participants including a healthy person and a depressed patient in advance in time series by the brain activity detection device
- a storage device for storing information for identifying a classifier generated by a classifier generation process from the measured signal, and an arithmetic device for executing a stratification process.
- the classifier when the depressive symptoms are stratified into a plurality of preset subclasses, the classifier performs machine learning from among functional connections among the plurality of predetermined areas.
- the selected plurality of functional connections are a first functional connection between the left dorsolateral prefrontal cortex and the anterior left and posterior cingulate cortex, and the lower left forehead valvular and the right back At least one selected from the second functional connection between the medial prefrontal cortex and the right supplemental motor area.
- the arithmetic unit executes processing for determining the subclass from the weighted sum and the element of the correlation matrix to be determined.
- One embodiment of the present invention relates to a discriminating apparatus for assisting in the determination of the therapeutic effect in a depressed patient.
- the determination apparatus of the present embodiment includes an arithmetic unit, and the arithmetic unit is the first of a plurality of functional combinations selected from functional combination identification numbers 1 to 12 shown in Table 1 below for a plurality of subjects.
- a classifier generation process is performed to generate in advance a classifier that identifies a group in which the therapeutic effect is observed and a group in which the therapeutic effect is not observed in the plurality of subjects.
- the computing device measures a first correlation of the plurality of functional connections in the resting brain of a subject at a first time, and the same subject as the subject at a second time. Measuring a second correlation of the plurality of functional connections in the resting brain of the person.
- the arithmetic device determines the treatment effect on the subject by the classifier based on a difference between the second correlation and the first correlation of the plurality of functional combinations of the subject.
- One embodiment of the present invention relates to a determination method for assisting determination of treatment effect in depressed patients.
- the discrimination method of the present embodiment is the correlation between the first time point of the plurality of functional combinations selected from the functional combination identification numbers 1 to 12 shown in the following Table 1 and the start of the treatment for a plurality of subjects.
- the method may further include the step of generating in advance a classifier that identifies a group in which the therapeutic effect is observed and a group in which the therapeutic effect is not observed in the plurality of subjects.
- the determination method of the present embodiment includes the steps of: measuring a first correlation of the plurality of functional connections in the brain at rest of the subject at a first time; and the subject at a second time Measuring a second correlation of the plurality of functional connections in the resting brain of the same subject.
- the classifier performs the treatment effect on the subject based on the difference between the second correlation and the first correlation of the plurality of functional combinations of the subject. And a determining step.
- a signal indicating brain activity in a plurality of predetermined regions in a brain of each of a plurality of participants including a healthy person and a depressed patient is time-series by a brain activity detection device
- the present invention relates to a method of using a classifier generated by classifier generation processing from a signal measured in advance to determine the presence or absence of depressive symptoms or to determine the level of depressive symptoms in a subject.
- the method of using is based on a weighted sum of a plurality of functional combinations selected by feature selection as being related to a disease label of depressive symptoms by machine learning out of functional connections among the plurality of predetermined areas. Generating the classifier for determining the disease label of the depressive condition.
- the selected plurality of functional connections are a first functional connection between the left dorsolateral prefrontal cortex and the anterior left and posterior cingulate cortex, and the lower left forehead valvular and the right back At least one selected from the second functional connection between the medial prefrontal cortex and the right supplemental motor area.
- the use method may further comprise the step of inputting into the classifier an index value generated from an element of the correlation matrix of the plurality of functional combinations of the subject.
- a signal indicating brain activity in a plurality of predetermined regions in a brain of each of a plurality of participants including a healthy person and a depressed patient is time-series by a brain activity detection device
- the present invention relates to a method of using a classifier generated by a classifier generation process from previously measured signals to assist in the determination of the effect of treatment of depressive symptoms.
- the method of using is based on a weighted sum of a plurality of functional combinations selected by feature selection as being related to a disease label of depressive symptoms by machine learning out of functional connections among the plurality of predetermined areas. Generating the classifier for determining the disease label of the depressive condition.
- the selected plurality of functional connections are a first functional connection between the left dorsolateral prefrontal cortex and the anterior left and posterior cingulate cortex, and the lower left forehead valvular and the right back At least one selected from the second functional connection between the medial prefrontal cortex and the right supplemental motor area.
- the use method may further comprise the step of inputting into the classifier an index value generated from an element of the correlation matrix of the plurality of functional combinations of the subject.
- the brains of each of a plurality of participants including a healthy person and a depressed patient.
- the classifier is based on a weighted sum of a plurality of functional combinations selected by feature selection as related to a disease label of depressive symptoms by machine learning out of functional connections among the plurality of predetermined areas. It is generated to determine the disease label of depressive symptoms.
- the selected plurality of functional connections are a first functional connection between the left dorsolateral prefrontal cortex and the anterior left and posterior cingulate cortex, and the lower left forehead valvular and the right back At least one selected from the second functional connection between the medial prefrontal cortex and the right supplemental motor area.
- the method of use comprises the step of inputting into the classifier index values generated from elements of the correlation matrix of the plurality of functional combinations of the subject.
- the discrimination device is a signal obtained by measuring in advance a signal indicating brain activity in a plurality of predetermined regions in the brain of each of a plurality of participants including a healthy person and a depressed patient at rest at a time series.
- a classifier generating device including a first computing device for generating a first classifier.
- the first classifier is based on a weighted sum of a plurality of functional combinations selected by feature selection as related to a disease label of depressive symptoms by machine learning out of functional connections among the plurality of predetermined areas. Are generated to determine the disease label of the depressive symptoms.
- the selected plurality of functional connections are a first functional connection between the left dorsolateral prefrontal cortex and the anterior left and posterior cingulate cortex, and the lower left forehead valvular and the right back At least one selected from the second functional connection between the medial prefrontal cortex and the right supplemental motor area.
- the first arithmetic unit is for the plurality of subjects, after correlation of the first time point of the plurality of functional combinations selected from the functional combination identification numbers 1 to 12 shown in Table 5 below and after the start of the treatment In the correlation state space spanned by each of the differences in the correlation between the first and second time points of the plurality of functional connections, respectively measuring the correlation at the second time point after the first time point Generating a second classifier that identifies a group with therapeutic effects and a group without therapeutic effects in the plurality of subjects.
- the determining device further comprises a stratification device including a second computing device and a storage device.
- the storage device stores information of the first and second classifiers and information for stratification of depressive symptoms into a plurality of preset subclasses.
- the second arithmetic unit performs a stratification process on the subject into the subclasses using the first classifier.
- the second arithmetic unit measures a first correlation of the plurality of functional connections at rest at a first time point, for the subject stratified into a specific subclass by the stratification process.
- Execute processing for The second arithmetic unit executes a process for measuring a second correlation of the plurality of functional connections at rest of the same subject as the subject at a second time point.
- the second computing device is configured to send the subject to the subject by the second classifier based on a difference between the first correlation and the second correlation of the plurality of functional combinations of the subject. Determine the treatment effect.
- One embodiment of the present invention relates to a determination method for assisting determination of a treatment effect in a subject.
- the determination method of the present embodiment in the case where depression symptoms are stratified into a plurality of preset subclasses, at rest, in the brain of each of a plurality of participants including a healthy person and a depressed patient.
- the subject is detected using a first classifier generated by a first classifier generation process from signals measured beforehand in time series by the brain activity detection device as signals indicating brain activity in a plurality of predetermined regions. Includes stratification steps to stratify into subclasses.
- the first classifier is selected from a plurality of functional connections among the plurality of predetermined regions by machine learning as being related to a disease label of depressive symptoms by a plurality of feature selections. Based on the weighted sum of functional binding, it is generated to determine the disease label of the depressive symptoms.
- the selected plurality of functional connections are a first functional connection between the left dorsolateral prefrontal cortex and the left anterior and left posterior cingulate cortex, and the lower left frontal fornix and the right dorsomedia And at least one selected from a second functional connection between the prefrontal cortex and the right supplementary motor area.
- the determination method of the present embodiment measures, for a subject stratified into a specific subclass by the stratification step, a first method of measuring a first correlation of the plurality of functional connections at rest before administration. And a second correlation measurement step of measuring a second correlation of the plurality of functional connections at rest of the same subject as the subject after a predetermined period has elapsed from the start of dosing. .
- the determination method of the present embodiment is a determination step of determining the efficacy of the subject classified into a specific subclass using a second classifier, wherein the second classifier includes a plurality of subjects.
- the correlation between the first time point of the plurality of functional bindings selected from the functional binding identification numbers 1 to 12 shown in Table 1 below and the second time point after administration and after the first time point Measure each correlation. Then, in the correlation state space spanned by each of the differences in the correlation at the first time point and the second time point of the plurality of functional connections, the group and the treatment effect in which the treatment effect is observed in the plurality of subjects.
- the object based on the difference between the second correlation and the first correlation of the plurality of functional combinations of the subject generated in advance by a second classifier generation process for identifying an unidentified group. And a discrimination step of discriminating a medicinal effect on an examiner.
- One embodiment of the present invention relates to a first classifier generation device including an arithmetic device and a storage device.
- the arithmetic device is a signal obtained by measuring in advance a signal indicating brain activity in a plurality of predetermined regions in the brain of each of a plurality of participants including a healthy person and a depressed patient at rest at a time series.
- the classifier is based on a weighted sum of a plurality of functional combinations selected by feature selection as related to a disease label of depressive symptoms by machine learning out of functional connections among the plurality of predetermined areas. It is generated to determine the disease label of depressive symptoms.
- the selected plurality of functional connections are a first functional connection between the left dorsolateral prefrontal cortex and the anterior left and posterior cingulate cortex, and the lower left forehead valvular and the right back At least one selected from the second functional connection between the medial prefrontal cortex and the right supplemental motor area.
- the storage device stores information identifying the first classifier generated by the arithmetic device.
- One embodiment of the present invention relates to a method of generating a first classifier.
- signals indicating brain activity in a plurality of predetermined regions in the brain of each of a plurality of participants including a healthy person and a depressed patient are measured in advance by a brain activity detection device in time series.
- the first classifier is based on a weighted sum of a plurality of functional combinations selected by feature selection as related to a disease label of depressive symptoms by machine learning out of functional connections among the plurality of predetermined areas. Are generated to determine the disease label of the depressive symptoms.
- the functional connection is the first functional connection between the left dorsal lateral prefrontal cortex and the left anterior and left posterior cingulate cortex, and the lower left frontal valvular portion, the right dorsal medial prefrontal cortex and At least one selected from the second functional connection between the right supplementary motor area.
- One embodiment of the present invention relates to a second classifier generation device including an arithmetic device and a storage device.
- the computing device is configured to compare the correlation between the first points of time of the plurality of functional combinations selected from the functional combination identification numbers 1 to 12 shown in the following Table 3 and the start of the treatment for the plurality of subjects. The correlations at the second point in time after the point in time are respectively measured.
- the present embodiment is a group in which a plurality of subjects show therapeutic effects in a correlation state space spanned by each of the differences in the correlation between the first time point and the second time point of the plurality of functional connections.
- a second classifier is generated that distinguishes the group from which no therapeutic effect is seen.
- the storage device stores information for identifying the second classifier generated by the arithmetic device.
- One embodiment of the present invention relates to a second classifier generation method.
- the correlation between the first point of time of the plurality of functional bindings selected from the functional binding identification numbers 1 to 12 shown in the following Table 4 and the start of the treatment for the plurality of subjects is a first
- the correlations at the second point in time after the point in time are respectively measured.
- the present embodiment is a group in which a plurality of subjects show therapeutic effects in a correlation state space spanned by each of the differences in the correlation between the first time point and the second time point of the plurality of functional connections.
- One embodiment of the present invention relates to a brain activity training device provided with a brain activity detection device, a presentation device, a computing device, and a storage device.
- the brain activity detection device detects signals indicating brain activity in a plurality of predetermined regions in the brain of the trainee of the neuro feedback training in time series
- the storage device is healthy at rest From the functional connection between the plurality of predetermined areas, based on the signal indicating the brain activity in a plurality of predetermined areas in the brain of each of the plurality of participants including the person and the depressed patient in advance in time series
- Information identifying the functional connection of the training object among the plurality of functional connections selected by feature selection to distinguish the disease label of depressive symptoms by machine learning, and the functional connection of the training object in neurofeedback training Storing the target pattern of the target object, and the arithmetic unit generates temporal correlation of the functional combination of the training object for a predetermined period from the signal detected by the brain activity detector.
- the functional connection of the training object includes a first functional connection between the left dorsolateral prefrontal cortex and the anterior left and posterior caudal cortex, and in the brain of the trainee
- Each of the plurality of predetermined regions corresponds to a plurality of predetermined regions in the brain of the plurality of participants.
- One embodiment of the present invention relates to a control method of a brain activity training device including a brain activity detection device, a presentation device, an arithmetic device, and a storage device.
- the brain activity detection device detects signals indicating brain activity in a plurality of predetermined regions in the brain of the trainee of the neuro feedback training in time series
- the storage device is healthy at rest From the functional connection between the plurality of predetermined areas, based on the signal indicating the brain activity in a plurality of predetermined areas in the brain of each of the plurality of participants including the person and the depressed patient in advance in time series Information identifying the functional connection of the training object among the plurality of functional connections selected by feature selection to distinguish the disease label of depressive symptoms by machine learning, and the functional connection of the training object in neurofeedback training And storing the target pattern of the target and the brain activity detecting device to indicate brain activity in a plurality of predetermined regions in the brain of the trainee of the neuro feedback training.
- the functional connection of the training object includes a first functional connection between the left dorsolateral prefrontal cortex and the anterior left and posterior caudal cortex, and in the brain of the trainee
- Each of the plurality of predetermined regions corresponds to a plurality of predetermined regions in the brain of the plurality of participants.
- the present invention it is possible to provide a discrimination apparatus and discrimination method for objectively discriminating an index for the state of depression symptoms with respect to the brain activity state. According to the present invention, it is possible to objectively determine information representing the degree of therapeutic effect on depressive symptoms. According to the present invention, it is possible to provide a classifier that outputs an index value as a biomarker for objectively determining depressive symptoms. According to this invention, the level of depressive symptoms can be determined. According to the present invention, a depressed patient can be objectively stratified. According to the present invention, neuro feedback training can be performed.
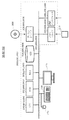
- FIG. 1 is a schematic view showing an entire configuration of an MRI apparatus 10;
- FIG. 2 is a hardware block diagram of a data processing unit 32. It is a conceptual diagram which shows the procedure which extracts the correlation matrix which shows the correlation of the functional connection at rest about a region of interest. It is a conceptual diagram explaining the process of producing
- FIG. 5 is a functional block diagram for performing a generation process of the first classifier as described in FIG. 4 and a determination process by the generated first classifier. It is a flowchart for demonstrating the process which the data processing part 32 performs in order to produce
- FIG. 20 is a functional block diagram showing an example of processing data collection, estimation processing and brain activity measurement of a subject in a distributed manner shown in FIG. 19; 5 is a flow chart for generating a second classifier.
- FIG. 20 is a functional block diagram showing an example of processing data collection, estimation processing and brain activity measurement of a subject in a distributed manner shown in FIG. 19; 5 is a flow chart for generating a second classifier.
- FIG. 7 is a flow chart for determining drug efficacy using a second classifier.
- FIG. It is a functional block diagram for performing the treatment effect determination process by the production
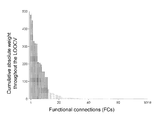
- d shows the smoothed histogram of related weighted sums of melancholic MDDs.
- e shows the smoothed histogram of the associated weighted sum of non-Melancholy MDDs.
- f shows the smoothed histogram of the associated weighted sum of treatment resistant MDDs.
- g denotes the smoothed histogram of the associated weighted sum of ASDs.
- h shows the smoothed histogram of the related weighted sum of SSDs.
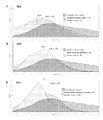
- a shows a histogram of LOOCV rearrangement test (1000 iterations) of training data.
- b shows the accuracy of the out-of-sample test data set, showing the binomial distribution as a curve.
- the accuracy of the melancholic MDD classifier trained and verified without reordering is shown as a vertical line.
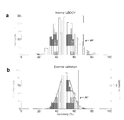
- a shows the correlation between the BDI score and the discrimination result using the first classifier (all MDD and whole healthy subject).
- b shows the correlation (the whole MDD whole) of the discrimination
- c shows the smoothed histogram of the related weighted sum before and after treatment.
- d shows the correlation between the change in BDI score after administration and the change in discrimination result using the first classifier.
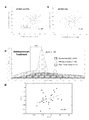
- a shows the difference in correlation between the healthy control group and the MDD group in each functional binding and the difference in correlation before and after dosing.
- b shows the difference between pre-dose and post-dose correlations in FC1 and FC2 for the Hiroshima cohort.
- c shows the difference between pre-dose and post-dose correlations in FC1 and FC2 for the Chiba cohort.
- d shows the difference in correlation between pre-dose and post-dose in FC1 and FC2 for a cohort of healthy individuals.
- e shows the difference in correlation before and after dosing in FC1 and FC2 of the post-dosing remission group and the non-post-dosing group.
- f shows the distribution of signed ⁇ FC1 and ⁇ FC2 in the dose group.
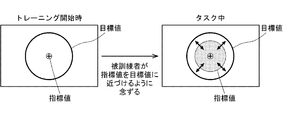
- It is a figure which shows the concept of a structure of a brain activity training apparatus. It is an example of the monitor display for showing the closeness of an index value and a target value.
- a shows neurofeedback scores during training of MDD participants.
- b shows the HDRS score before and after training of the MDD participant.
- c shows neurofeedback scores during training of participants of subclinical depression.
- d shows the correlation between BDI score after training and rs-fcMRI variation.
- Fig. 6 shows a flowchart of neurofeed
- depressive symptoms include: depressive mood; decreased interest or concern; decreased vigor; frustration; inhibition; diminished thinking ability, concentration ability or determination ability; sense of worthlessness or guilt; , Suicidal ideation or suicide planning; morbid thinking content; delusions; physical symptoms (such as general fatigue, headache, headache, back pain, etc. pain in the body, palpitations, shortness of breath, loss of appetite, weight loss etc.), sleep At least one type selected from faults is included.
- the depressive symptoms include symptoms associated with Major Depressive Disorder (MDD) in the Diagnostic and Statistical Manual of Mental Disorders (DSM) -IV criteria.
- MDD Major Depressive Disorder
- DSM Diagnostic and Statistical Manual of Mental Disorders
- depression is not limited as long as it has the above-mentioned depressive symptoms, but is preferably MDD.
- MDDs include melancholic MDD, non-melancholic MDD and refractory MDD. In the present specification, MDD may be referred to simply as depression.
- HAM-D For the evaluation of the degree of depression, for example, an evaluation by the self-reported Beck Depression Inventory (Beck Depression Survey Table) is conventionally used as a supplementary material at screening and interviewing at the time of medical examination.
- the Hamilton Depression Rating Scale (HDRS) which is used as a rating scale for physicians, is a multi-item questionnaire that provides an index of depression, and serves as an index for evaluating recovery.
- the abbreviation is HAM-D.
- the subject is preferably, but not limited to, a person having the depressive symptoms. Age and gender are not limited. The subject may be one who has not received treatment for improving the depressive symptoms or one who has received the treatment.
- Treatment to ameliorate depressive symptoms includes at least one selected from medication, neurofeedback therapy, modified electroconvulsive therapy and repetitive transcranial magnetic stimulation therapy.
- Drugs to be administered include tricyclic antidepressants (imipramine, trimipramine, clomipramine, amitriptyline, nortriptyline, amoxapine, lofepramine, and doslepin), tetracyclic antidepressants (maprotiline, aminserine, cetiptiline, and the like), trazodone Selective serotonin reuptake inhibitors (such as escitalopram, fluvoxamine, paroxetine, and sertrilarin), serotonin-norepinephrine reuptake inhibitors (such as milnacipran and duloxetine), noradrenaline / serotonergic antidepressants (such as mirtazapine), And at least one selected from benzamide drugs (such as sulpiride).
- the improvement of depressive symptoms means that the symptom is better than the previous state, as seen from clinical findings such as BDI, or It means that it will be in the state that can be said to be "remitted” from the viewpoint of
- the determination of the level of depressive symptoms in the subject is assisted, the determination of the presence or absence of depressive symptoms in the subject is assisted, and the determination of the treatment effect in the subject Assisting and aiding in subject stratification into disease subclasses are included.
- drug reprofiling is a drug that has already been shown to have an effect on humans against other diseases or conditions, or that it is weak against humans but has no significant effect. It is intended to detect drug effects on depressive symptoms for drugs that are known and whose effects on depressive symptoms are unknown.
- the imaging device of resting fMRI is not limited.
- the imaging conditions are also not limited as long as the fMRI image can be acquired.
- magnetic filed is about 3.0 T
- field of view is about 192 mm to 256 mm
- matrix is about 64 ⁇ 64
- number of slices is about 30 to 40
- number of volumes is about 112 to 244
- slice thickness is 3 .0 mm to about 4.0 mm
- slice gap about 0 mm to about 0.8 mm
- TR about 2,000 ms to about 2,700 ms
- TE about 25 ms to about 31 ms
- total imaging time about 5 minutes to about 10 minutes
- flip angle about about 75 deg to 90 deg
- slice acquisition order is Ascending (Interleaved).
- Imaging is preferably performed under dark illumination. Further, it is preferable that the subject thinks nothing during imaging and does not sleep. Furthermore, it is preferable that the subject keep looking at the cross mark in the center of the monitor screen during imaging.
- the imaged fMRI image can be processed by the method described in Yahata et al. (NATURE COMMUNICATIONS
- the imaged fMRI image data is not particularly limited, for example, T1 weighted structure image and resting state function using SPM 8 (Wellcome Trust Center for Neuroimaging, University College London, UK) of Matlab R 2014a (Mathworks inc., USA) Standard pre-processing on the image can be applied.
- SPM 8 Wellcome Trust Center for Neuroimaging, University College London, UK
- an image determined to have moved by 0.5 mm or more from the previous image may be excluded from the analysis.
- FC functional connectivity
- ROI regions of interest
- FC functional connectivity
- the functional connection is a feature value (element of correlation matrix) generally used in resting brain activity analysis, and is defined by Pearson's correlation coefficient between time-series signals of different regions of interest.
- the binding strength can be represented by an average value of Pearson's correlation coefficients from values measured over a predetermined time.
- the coupling strength may be represented by another statistic about Pearson's correlation coefficient within a predetermined time.
- Extraction of the elements of the correlation matrix is not particularly limited, but can be performed, for example, in the following procedure.
- a time series of average signals of all voxels (Voxel) included in each region of interest is extracted.
- a band pass filter (0.008 to 0.1 Hz) is applied to remove noise from the signal value.
- regression is performed with nine explanatory variables (average signal of whole brain, white matter, cerebrospinal fluid and six motion correction parameters).
- the correlation coefficient is a value representing the coupling strength of the functional coupling, and the coupling strength corresponding to each pair is determined.
- an index value for determining the disease label of depressive symptoms for functional binding is calculated.
- association weighted sums for a plurality of functional combinations are calculated as index values for determining a disease label of depressive symptoms.
- the “relevant weighted sum” refers to the sum of multiple functional combinations multiplied by the corresponding weights.
- the index value is not simply data obtained by measuring the brain activity of the subject, but is a value artificially calculated in consideration of the weight of each functional connection.
- the index value is used to determine the label of depressive symptoms, to determine the level of depressive symptoms, to determine the therapeutic effect, or for stratification of depressed patients.
- the highest contribution to depressive symptoms is the functional connection indicated by the functional connection identification number 1.
- the next highest degree of contribution is the functional binding indicated by the functional binding identification number 2. Therefore, in each of the embodiments described below, at least one or both of the functional binding identification number 1 and the functional binding identification number 2 may be selected and used.
- the 12 pairs of functional connections are particularly suitable for discriminating between melancholic MDD patient groups and healthy control groups.
- the first classifier at rest, displays signals indicative of brain activity in a plurality of predetermined regions in the brain of each of a plurality of participants including normal persons and depressed patients. It is generated by a classifier generation process from signals measured beforehand in time series by the brain activity detection device.
- a depressed patient means a participant who has been diagnosed with depression in advance by diagnosis by a doctor and associated with the "disease label" of depression.
- the classifier is based on weights of functional combinations selected by feature selection as related to a disease label of depressive symptoms by machine learning out of functional connections between the plurality of predetermined areas. It is generated to determine the disease label.
- the sparse logistic Feature selection by regression selects the functional binding used to determine the disease label for depression. Then, from the functional combination selected in this manner, the above-mentioned associated weighted sum is calculated.
- Discrimination device 1 For example, the first classifier is generated from fMRI image data acquired from the MRI apparatus 10 shown in FIG.
- FIG. 1 is a schematic view showing an entire configuration of an MRI apparatus 10 as a discrimination apparatus 1 according to a first embodiment of the present invention.
- the MRI apparatus 10 comprises an MRI imaging unit 25 for imaging MRI, and a data processing unit 32 for setting control sequences of the MRI imaging unit 25 and processing various data signals to generate an image.
- the MRI imaging unit 25 applies a controlled magnetic field to the region of interest of the subject 2 to apply a controlled magnetic field and applies an RF wave, and a response wave (NMR) from the subject (or the subject)
- a drive unit 21 that controls the magnetic field applied to the subject 2 and controls transmission and reception of the RF wave.
- the central axis of the cylindrical bore on which the subject 2 is placed is taken as the Z axis
- the X axis is defined in the horizontal direction perpendicular to the Z axis and the Y axis in the vertical direction.
- the nuclear spins of the nuclei constituting the subject 2 are oriented in the magnetic field direction (Z-axis) by the static magnetic field applied by the magnetic field applying mechanism 11, and It performs precession motion around this magnetic field direction at the Larmor frequency specific to the nucleus.
- the atom when the same RF pulse as the Larmor frequency is irradiated, the atom resonates, absorbs energy and is excited, and a nuclear magnetic resonance phenomenon (NMR phenomenon; Nuclear Magnetic Resonance) occurs. After this resonance, when the RF pulse irradiation is stopped, the atom emits energy and in the relaxation process returns to the original steady state, it outputs an electromagnetic wave (NMR signal) of the same frequency as the Larmor frequency.
- NMR phenomenon Nuclear Magnetic Resonance
- the output NMR signal is received by the receiving coil 20 as a response wave from the subject 2, and the data processing unit 32 images the region of interest of the subject 2.
- the magnetic field application mechanism 11 includes a static magnetic field generating coil 12, a gradient magnetic field generating coil 14, an RF irradiation unit 16, and a bed 18 on which the subject 2 is placed in the bore.
- the subject 2 lies, for example, on the bed 18.
- the prism glasses 4 can view a screen displayed on the presentation device 6 (for example, a display) installed perpendicularly to the Z axis.
- a visual stimulus is given to the subject 2 by the image of the presentation device 6.
- the visual stimulus to the subject 2 may be configured such that an image is projected by the projector in front of the subject 2.
- Such visual stimulation corresponds to presentation of feedback information in the above-described neurofeedback.
- the drive unit 21 includes a static magnetic field power supply 22, a gradient magnetic field power supply 24, a signal transmission unit 26, a signal reception unit 28, and a bed drive unit 30 for moving the bed 18 to an arbitrary position in the Z-axis direction.
- the data processing unit 32 includes an input unit 40 for receiving various operations and information input from an operator (not shown), a display unit 38 for displaying various images and information on the region of interest of the subject 2 and various processes.
- a control unit that controls the operation of each function unit such as a storage unit 36 that stores programs, control parameters, image data (structured images, etc.) to be executed and other electronic data, and generates a control sequence that drives the drive unit 21 42, an interface unit 44 for executing transmission and reception of various signals between the drive unit 21, a data collection unit 46 for collecting data consisting of a group of NMR signals derived from a region of interest, and data of the NMR signals.
- an image processing unit 48 for forming an image
- a network interface unit 50 for performing communication with the network.
- the data processing unit 32 is a general-purpose computer that executes functions to operate the respective functional units in addition to the dedicated computer, and the operation and data specified based on the program installed in the storage unit 36 It also includes cases where processing or control sequences are generated.
- the data processing unit 32 will be described as being a general purpose computer.
- the static magnetic field generating coil 12 generates an induction magnetic field by supplying a current supplied from the static magnetic field power supply 22 to a helical coil wound around the Z axis to generate a static magnetic field in the Z axis direction in the bore. .
- the region of interest of the subject 2 is set in the region of high uniformity of the static magnetic field formed in the bore.
- the static magnetic field coil 12 is more specifically composed of, for example, four air core coils, and by combining them, a uniform magnetic field is generated inside, and predetermined nuclei in the body of the subject 2 are more specific. Gives orientation to the spins of hydrogen nuclei.
- the gradient magnetic field generating coil 14 is composed of an X coil, a Y coil, and a Z coil (not shown), and is provided on the inner circumferential surface of the static magnetic field generating coil 12 having a cylindrical shape.
- These X coil, Y coil and Z coil superimpose a gradient magnetic field on the uniform magnetic field in the bore while switching the X-axis direction, Y-axis direction and Z-axis direction in order to give an intensity gradient to the static magnetic field .
- the Z coil inclines the magnetic field strength in the Z direction to define the resonance surface
- the Y coil applies a short time inclination immediately after the application of the magnetic field in the Z direction to modulate the phase proportional to the Y coordinate to the detection signal Is added (phase encoding)
- the X coil is subsequently inclined at the time of data acquisition to give the detection signal a frequency modulation proportional to the X coordinate (frequency encoding).
- the switching of the superimposed gradient magnetic field is realized by outputting different pulse signals from the transmitting unit 24 to the X coil, the Y coil, and the Z coil in accordance with the control sequence.
- the position of the subject 2 at which the NMR phenomenon occurs can be specified, and positional information on three-dimensional coordinates necessary to form an image of the subject 2 can be given.
- imaging can be performed from various angles by assigning slice directions, phase encoding directions, and frequency encoding directions to three sets of orthogonal gradient magnetic fields, respectively, and combining them.
- the sagittal slice or coronal slice orthogonal thereto and further, the direction perpendicular to the plane is parallel to the axis of three orthogonal gradient magnetic field It is possible to image not an oblique slice or the like.
- the RF irradiation unit 16 irradiates an RF (Radio Frequency) pulse to a region of interest of the subject 2 based on the high frequency signal transmitted from the signal transmission unit 33 according to the control sequence.
- RF Radio Frequency
- the RF irradiation unit 16 is built in the magnetic field application mechanism 11 in FIG. 1, it may be provided on the bed 18 or may be integrated with the receiving coil 20.
- the receiving coil 20 detects a response wave (NMR signal) from the subject 2 and is disposed close to the subject 2 in order to detect the NMR signal with high sensitivity.
- NMR signal response wave
- a weak current is generated in the receiving coil 20 based on electromagnetic induction.
- the weak current is amplified by the signal receiving unit 28, and further converted from an analog signal into a digital signal and sent to the data processing unit 32.
- a given nucleus for example a hydrogen nucleus
- a predetermined nucleus in a portion matching the resonance condition for example, a slice of a predetermined thickness of the subject 2
- spins rotate at a time.
- an electromagnetic wave emitted by rotating spins induces a signal in the receiving coil 20, and this signal is detected for a while.
- a tissue containing a predetermined atom in the body of the subject 2 is observed.
- the X and Y gradient magnetic fields are applied to detect the signal.
- the image processing unit 48 measures the detection signal while repeatedly giving the excitation signal based on the data constructed in the storage unit 36, reduces the frequency of the resonance to the X coordinate by the first Fourier transform calculation, and the second time The Y coordinate is restored by the Fourier transform of to obtain an image, and the image corresponding to the display unit 38 is displayed.
- the above-described BOLD signal is imaged in real time by such an MRI system, and the control unit 42 performs an analysis process as described later on images captured in time series, thereby achieving resting functional coupling It becomes possible to perform imaging of MRI (rs-fcMRI).
- FIG. 2 is a hardware block diagram of the data processing unit 32. As shown in FIG.
- the hardware of the data processing unit 32 is not particularly limited as described above, but a general-purpose computer can be used.
- a computer main body 2010 of the data processing unit 32 is connected to a processing unit (central processing unit: CPU; also referred to as processor) 2040, a disk drive 2030 and a memory drive 2020 in addition to a memory drive 2020 and a disk drive 2030.
- CPU central processing unit
- disk drive 2030 and a memory drive 2020 in addition to a memory drive 2020 and a disk drive 2030.
- RAM random access memory
- RAM random access memory
- the communication interface 2090 corresponds to an interface unit 44 for exchanging signals with the drive unit 21 and the like, and a network interface 50 for communicating with another computer via a network (not shown).
- a hard disk (HDD), a solid state drive (SSD: Solid State Drive), or the like can be used as the nonvolatile storage device 2080.
- the non-volatile storage device 2080 corresponds to the storage unit 36.
- the computer main body 2010 of the data processing unit 32 also functions as a first classifier generation device and / or a second classifier generation device.
- Each function of the data processing unit 32 for example, each function of the control unit 42, the data collection unit 46, and the image processing unit 48 is realized by arithmetic processing that the CPU 2040 executes based on a program.
- a program that causes the data processing unit 32 to execute the functions of the above-described embodiment is stored in the CD-ROM 2200 or the memory medium 2210, inserted into the disk drive 2030 or the memory drive 2020, and further stored in the non-volatile storage device 2080. It may be forwarded. The program is loaded into the RAM 2070 upon execution.
- the data processing unit 32 further includes a keyboard 2100 and a mouse 2110 as an input device, and a display 2120 as an output device.
- the keyboard 2100 and the mouse 2110 correspond to the input unit 40
- the display 2120 corresponds to the display unit 38.
- the program for functioning as the data processing unit 32 as described above may not necessarily include the operating system (OS) that causes the computer main body 2010 to execute the function of the information processing apparatus or the like.
- the program needs to call only an appropriate function (module) in a controlled manner, and include only a part of an instruction that makes it possible to obtain a desired result. It is well known how the data processing unit 32 operates, and the detailed description will be omitted.
- the computer that executes the program may be singular or plural. That is, centralized processing may be performed, or distributed processing may be performed.
- FIG. 3 is a conceptual diagram showing a procedure for extracting a correlation matrix indicating correlation of functional connection at rest associated with a disease label of depressive symptoms.
- the average “activity” of each region of interest is calculated from the fMRI data for n (n: natural number) times of resting fMRI measured in real time, and the brain regions are Calculate the correlation value of the degree of activity).
- the correlation shows only 34 ⁇ 34 on the diagram.
- the calculation of the elements of such a correlation matrix is not particularly limited, but can be performed, for example, as follows.
- Functional connection is a feature that is generally used in resting brain activity analysis, and is defined by Pearson's correlation coefficient between time-series signals of different regions of interest.
- a band pass filter is applied, and then regression is performed using nine explanatory variables (average signals of whole brain, white matter, brain back, cerebrospinal fluid and six motion correction parameters).
- 137 regions of interest included in Brain Sulci Atlas are used as the region of interest.
- a functional connection FC between these 137 regions of interest is used as a feature.
- FIG. 4 is a conceptual diagram for explaining the process of generating a first classifier serving as a biomarker from the correlation matrix as described in FIG.
- the first classifier functions as, for example, an index as a diagnostic marker for "depression", and is used for assisting a doctor in diagnosing the severity or progression of the disease. be able to.
- the device that performs the operations of the first classifier and the output of the results can also be called a diagnostic aid device.
- the data processing unit 32 derives the elements of the correlation matrix of the degree of activity between the brain regions (between the regions of interest).
- the data processing unit 32 performs feature extraction by regularization canonical correlation analysis on the attributes of the participant including the participant's disease / healthy label and the correlation matrix.
- regular learning in machine learning and statistics, a regularization term weighted by a hyperparameter is added to an error function to add suppression to the complexity and freedom of the model to prevent over-learning. It is a method.
- regularization canonical correlation analysis in the case where sparsification is also realized for the explanatory variables, it is particularly referred to as sparse canonical correlation analysis (SCCA). Below, as a specific example, it demonstrates as what performs sparse canonical correlation analysis.
- SCCA sparse canonical correlation analysis
- the union of functional combinations FC extracted as explanatory variables is called the “second union” over all cross validations.
- LOCV one-out-one-out cross validation
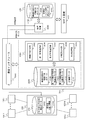
- FIG. 5 is a functional block diagram for performing the generation process of the first classifier as described in FIG. 4 and the determination process by the generated first classifier.
- a signal indicating brain activity in a plurality of predetermined regions in the brain of each of a plurality of participants including a healthy person and a depressed patient is measured in advance in time series by an MRI device.
- a participant rs-fc MRI measurement data 3102 which is information and a plurality of human attribute information 3104 associated with each participant who measured the MRI measurement data are stored.
- the “person attribute information” includes “person characteristic information” for identifying an individual participant and “measurement condition information” for identifying a measurement condition for each participant.
- Human characteristic information means information such as disease label, age, gender, and medication history for participants.
- Measurement condition information refers to measurement site information (including information for specifying a measured facility and / or a measured device) that measured a participant, and whether it was measured by eye open / closed eye during measurement, or It is a condition for specifying measurement conditions such as magnetic field strength.
- the computing device 2040 performs processing to generate a classifier for the disease label based on the participant rs-fc MRI measurement data 3102 and the corresponding human attribute information 3104.
- the correlation matrix calculation unit 3002 calculates, from the participant rs-fc MRI measurement data 3102, a correlation matrix of functional connections of brain activity among a plurality of predetermined regions for each participant.
- the functional matrix correlation matrix data thus calculated is stored in the non-volatile storage device 2080 as functional matrix correlation matrix data 3106 for each participant.
- the first feature selection unit 3004 sequentially selects one subset for K different subsets (K: a natural number of 2 or more) extracted from a plurality of participants, and removes the selected subset. Sparse canonical correlation analysis on a plurality of attribute information and an element of a correlation row example for (K-1) subsets, and specific attribute information of a plurality of human attribute information, for example, only a disease label Extract elements of the correlation row example connected to the canonical variable corresponding to. Furthermore, the first feature selection unit 3004 acquires a first union, which is a union of elements of the extracted correlation row example, over the subsets selected sequentially, and causes the non-volatile storage device 2080 to execute the first function. It stores as the dynamic combination union data 3108.
- the “first functional combination union data set” may be an index for specifying an element corresponding to the first union among the data 3106 of the functional connection correlation matrix.
- the second feature selection unit 3006 selects N participants from the plurality of participants when the remaining participants excluding the subset of the K among the plurality of participants are set as the test set and the test set is divided into N different groups.
- Sparse logistic test classifier for estimating the specific attribute information (for example, disease label) based on the first union, targeting a set of participants excluding one of the selected groups It calculates by regression and extracts the element of the correlation line example which becomes an explanatory variable of a test classifier with sparsification.
- the second feature selection unit 3006 further repeats feature extraction while sequentially selecting one group out of N groups, and is a union set of elements of correlated row examples extracted as an explanatory variable of the test classifier.
- a certain second union is acquired and stored in the non-volatile storage device 2080 as second functional combined union data 3110.
- the “second functional combination sum set data” may also be an index for specifying an element corresponding to the second sum set among the data 3106 of the functional connection correlation matrix.
- the number of elements in each of the N groups may be one.
- the classifier generation unit 3008 calculates a first classifier for estimating specific attribute information (for example, a disease label) by sparse logistic regression, using the second union as an explanatory variable.
- the classifier generation unit 3008 stores the generated information for identifying the first classifier in the non-volatile storage device 2080 as classifier data 3112.
- the discrimination processing unit 3010 performs discrimination processing on input data based on the classifier specified by the classifier data 3112.
- the classifier generation unit 3008 is described as generating a classifier using the second union as an explanatory variable, but, for example, the classifier generation unit 3008 directly transmits the first union.
- a first classifier may be generated as an explanatory variable.
- regularized logistic regression that is logistic regression using regularization (for example, L1 regularization or L2 regularization) can be used, and more specifically, for example, , "Sparse Logistic Regression" described above can also be used.
- a support vector machine, LDA (Linear discriminant analysis), or the like may be used to generate the first classifier.
- LDA Linear discriminant analysis
- the test calculated by the second feature selection unit 3006 while sequentially selecting one group to be removed from N groups.
- the cross validation may be performed by the classifier to calculate the discrimination result with the excluded groups as test samples.
- test set in the processing of the second feature selection unit 3006 is independent of the data set used to reduce the number of dimensions.
- FIG. 6 is a flowchart for explaining the processing performed by the data processing unit 32 to generate a classifier to be a biomarker.
- feature selection a process performed to explain observation data with a smaller number of explanatory variables.
- a first classifier for predicting a target disease label a process performed to explain observation data with a smaller number of explanatory variables.
- feature selection feature extraction
- regularization is used as a feature extraction method.
- canonical correlation analysis such processing is called “sparse canonical correlation analysis” in the sense that processing is carried out along with regularization and processing is performed so as to leave something more important as an explanatory variable.
- a penalty is imposed on the magnitude of the absolute value of the parameter of canonical correlation analysis called “L1 regularization” as described below. It is possible to use the imposing method.
- the data processing unit 32 when the data processing unit 32 starts the processing of classifier generation by the input of the processing start from the input unit 40 or the like (S100), the data processing unit 32 receives the information about each participant
- the MRI measurement data is read (S102), and the first feature extraction process is performed by sparse canonical correlation analysis (SCCA) (S104).
- SCCA sparse canonical correlation analysis
- step S104 the process of step S104 is referred to as “inner loop feature selection”.
- each variable x 1 and x 2 is standardized so as to have an average of 0 and a standard deviation of 1. Be done.
- CCA canonical correlation analysis
- CCA canonical correlation analysis
- L1-SCCA can be formulated as the following formula (1).
- hyperparameters ⁇ 1 and ⁇ 2 are the degree of sparsity of weighting parameters w 1 and w 2 (referred to as “sparse projection vector” because corresponding variables are sparseized by w 1 and w 2 ) It shows each.
- two data matrices corresponding to the above variables are constructed in order to identify the latent relationship between human attribute information and functional connection FC. .
- the next three columns show the measured institutions (locations) of brain activity, in this case corresponding to having been measured at three different sites [100] (site A), [010] (Site B) or [001] (Site C) is included.
- the fifth column contains the participant's age value
- the sixth column is the participant's gender information, including either 1 (male) or 0 (female) values
- the seventh column indicates, of the measurement conditions, whether the participant had opened or closed his eyes during measurement, and includes a value of 1 (open eye) or 0 (closed eye).
- the last three columns contain status information about the medication history of the three drugs, and each column contains a value of 1 (with drug treatment) or 0 (without drug treatment history).
- the human characteristic information and the measurement condition information are not limited to those described above, for example, other characteristics such as information on the medication history of other agents of the participant, and other measurement conditions, for example, an MRI apparatus
- the information of conditions, such as the magnitude of the applied magnetic field, may be included.
- Second data matrix X 2 is assumed to be a representation of the elements of the lower triangular portion of the non-diagonal of the correlation matrix representing a correlation of the functional binding of the participants (FC) in a row vector format.
- the sparse projection vector w 2 is used to specify the index (element) for identifying the correlation matrix element of the functional combination associated only with the disease label in the corresponding second data matrix X 2 Do.
- hyperparameters ⁇ 1 and ⁇ 2 of L 1 -SCCA are independently modified between 0.1 and 0.9, for example in steps of size 0.1.
- the size of the step of ranges and varying hyperparameters lambda 1 and lambda 2 and the variable is not intended to be limited to such an example.
- variable i k to indicate the index of the element is not a k-th zero of the projection vector w 2.
- 1 ⁇ k ⁇ m, and m indicates the number of non-zero elements.
- correlation matrix elements that correspond to canonical variables that are only relevant to the diagnostic label correlation matrix elements that are essential for classification are selected.
- FIG. 7 is a conceptual diagram for explaining inner loop feature selection.
- the set of participants is divided into K (K: two or more natural numbers), and (K-1) subsets Among the remaining subsets excluding one set, performing L1-SCCA described above is repeated (K-1) times.
- L 1 -SCCA is executed by changing ⁇ 2 by a predetermined step at a predetermined range.
- a functional combination element FC related to a canonical variable related only to the “diagnosis” label is extracted as a feature value.
- This procedure constructs the first classifier, which is generated based on, for example, MRI measurement data from a plurality of imaging sites in Japan, as described later, robustly generalizes to foreign countries, for example, the United States It will help.
- the data processing unit 32 executes the second feature extraction process using sparse logistic regression based on the result of the inner loop feature selection (S106).
- step S106 the process of step S106 is referred to as “outer loop feature selection”.
- Sparse logistic regression is a method in which logistic regression analysis is extended to the framework of Bayesian estimation, and dimension compression of feature vectors is performed simultaneously with weight estimation for discrimination. It is useful when the number of dimensions of feature vectors of data is very high and a large number of unnecessary feature quantities are included. For unnecessary feature quantities, weight parameters in linear discriminant analysis are made zero (ie, feature selection is performed), and only a very small number of feature quantities related to discrimination are extracted (sparseness).
- the probability p belonging to the class to be classified is obtained for each class with respect to the obtained feature data, and the maximum value is assigned to the output class.
- p is output by logistic regression.
- Weight estimation is performed by ARD (Automatic Relevance Determination), and feature quantities that contribute little to class discrimination are excluded from calculation as the weight approaches zero.
- the disease label is predicted using the first classifier based on the next hierarchical Bayesian estimation with the first union of the feature values extracted using the L1 regularization CCA described above as an input.
- z-hat (a letter with a ⁇ attached to it is called a "hat") is a feature vector with an expanded input.
- the feature vector z is extracted from the joint correlation matrix of resting MRI samples of one participant according to equation (2).
- ⁇ is a parameter vector of the logistic function.
- the distribution of the parameter ⁇ at this time is set to the following normal distribution.
- the distribution of each parameter is estimated by performing hierarchical Bayesian estimation by setting the distribution of the hyper parameter ⁇ of the distribution of the parameter w as follows.
- a 0 , b 0 are parameters for determining the hyperparameter gamma distribution.
- ⁇ is a parameter vector that represents the variance of the normal distribution of the vector ⁇ , and the ith element of the vector is ⁇ i .
- FIG. 11 is a conceptual diagram for explaining outer loop feature selection.
- the set of participants is divided into K (K: a natural number of 2 or more) during the inner loop feature selection as described in FIG. 11.
- K a natural number of 2 or more
- the remaining one subset excluding (K-1) subsets used for loop feature selection is used as a "test pool" containing test data to be trained.
- this test pool is divided into L groups, and one group (indicated by hatching in a dotted square in FIG. 11) is sequentially selected from the L groups, A set of participants For the participants other than the selected group, a first classifier that predicts a disease label is sparse logistic regression, with the element FC of the functional union correlation matrix that is the first union set as an explanatory variable. Generate by At this time, “element FC of correlation matrix of functional connection” is further selected by sparse logistic regression. This is called "the element FC of the correlation matrix of the functional connection selected in the outer loop".
- test set used in outer loop feature extraction is always independent of the data set used to reduce the dimensionality in inner loop feature extraction.
- each of the L groups includes one participant.
- prediction processing is performed with the first classifier generated for one excluded participant, and the disease label and the prediction result for the excluded one participant
- Cumulative processing of the error of is equivalent to performing so-called one-out cross validation (LOOCV). Therefore, in the process of FIG. 11, the above-mentioned error is calculated in each iterative process, and this is accumulated and averaged for L times to perform cross validation of the first classifier generated, in other words, generalization It is also possible to evaluate the ability.
- the data processing unit 32 performs a classifier generation process by sparse logistic regression based on the result (second union) of outer loop feature selection (S108).
- FIG. 13 is a diagram showing the concept of the classifier generation process in step S108.
- step S108 a classifier is generated by sparse logistic regression for all the participants, using the second union set extracted from the first union set by outer loop feature selection as an explanatory variable. Be done.
- Classifier data (data relating to function types and parameters) 3112 for identifying the generated classifier is stored in the non-volatile storage device 2080 and is different from the MRI measurement used for the training as described above. When data (test data) is input, it is used for discrimination processing when performing estimation of a disease label on test data.
- a classifier generated to determine whether test data for new participants different from these correspond to depression symptoms or health functions as a biomarker for depression symptoms.
- the “disease label” which is the output of the biomarker may include the probability of being a disease (or the probability of being healthy) since the classifier is generated by logistic regression. For example, it is output as a display such as “probability of disease is ⁇ %”. Such a probability can be used as a "disease marker”.
- a discrete determination result may be output as to which attribute the attribute belongs, or continuous values belonging to a certain class, for example, a probability may be output.
- feature extraction is performed by the above-mentioned inner loop feature selection and outer loop feature selection using rs-fcMRI data as an input, and the extracted features Depressive symptoms / healthy label discrimination is performed by a classifier generated using the amount as an explanatory variable.
- FIG. 8 is a diagram for explaining the concept of inner loop feature selection processing.
- FIG. 9 is a diagram showing the results for specific hyperparameters ⁇ 1 and ⁇ 2 in the iterative process when inner loop feature selection is performed as an example.
- the symbol c j on the dotted line connecting the canonical variable w 1 T x 1 and the canonical variable w 2 T x 2 represents the correlation coefficient between the respective canonical variables.
- FIG. 9 shows, by way of example, the smallest combination of hyperparameters that generates at least one canonical correlation for each person attribute information in the first outer loop.
- Circles in the left column indicate canonical variables w 1 T x 1 derived from human characteristic information and measurement conditions.
- the circles in the right column show the canonical variable w 2 T x 2 derived from the functional binding (FC).
- the numbers above the dotted line connecting the canonical variables represent the correlation coefficient between the canonical variables w 1 T x 1 and w 2 T x 2 .
- connection between the label of human attribute information and the canonical variable w 2 T x 2 is represented by a solid line or a dotted line.
- FIG. 10 is a flowchart for explaining in more detail the process of inner loop feature selection.
- the set of participants is divided into K subsets as shown in FIG. 7 (a), and one specific subset of them is excluded (K-1) Subsets are used.
- the inner loop training is performed. Perform sparse regular correlation analysis based on the participant's human attribute information 3104 and functional combination correlation matrix data 3106 stored in the non-volatile storage device 2080 except the i-th data block among the data (S206).
- the CPU 2040 When there is a canonical variable that binds only to the disease label for the current value of ( ⁇ 1 , ⁇ 2 ) (Y in S208), the CPU 2040 has a function corresponding to the canonical variable that binds only to the disease label
- the elements (FC) of the correlation matrix of the dynamic coupling are extracted and stored in the non-volatile storage device 2080 (S210). After the process of step S210, or when there is no canonical variable binding only to the disease label for the current ( ⁇ 1 , ⁇ 2 ) value pair (N in S208), only the value of i is 1 After incrementing, the process returns to step S204.
- the CPU 2040 repeats the processing of steps S206 to S212 (K-1) times.
- step S204 when the value of i exceeds the number of iterations of inner loop feature selection (K-1) (Y in S204), the CPU 2040 can not make the predetermined rule for ( ⁇ 1 , ⁇ 2 ) , ⁇ 1 and ⁇ 2 are changed by a predetermined step amount (S 214).
- step S216 when the value of ( ⁇ 1 , ⁇ 2 ) is within the variable range (Y in S216), the CPU 2040 returns the process to step S202.
- the CPU 2040 sums the elements (FC) of the correlation matrix of the functional combination extracted in the previous processing.
- the process is ended by obtaining a set and storing it as the first functional combined sum set data 3108 in the non-volatile storage device 2080.
- FIG. 12 is a flowchart for explaining the process of outer loop feature selection in more detail.
- the set of participants is divided into K subsets as shown in FIG. 11, and one subset not used in inner loop feature selection is a test pool. Used as The number of participants included in this test pool is NT.
- arithmetic processing unit (CPU) 2040 sets the value of variable i to 1 (S300), and CPU 2040 determines that the value of i is outside. If the number of iterations NT of loop feature selection is not exceeded (N in S302), the participant's personal attribute information 3104 and function stored in the non-volatile storage device 2080 except the i-th data in the test pool Sparse logistic regression (SLR) is performed based on the correlation matrix data 3106 of the specific connection to generate a test classifier (S304).
- SLR Sparse logistic regression
- the CPU 2040 uses the generated test classifier to calculate an SLR predicted value for the excluded i-th data (S306).
- the CPU 2040 stores the functional combination FC extracted by sparsification at the time of generating the test classifier in the non-volatile storage device 2080 as the selected feature amount, and increments the value of the variable i by 1 ( S310).
- the CPU 2040 obtains the union (the second union) of the extracted functional combinations FC by NT repetitive processing, and the non-volatile storage device 2080 is obtained as the second functional union-sum data 3110. Is stored in, and the process ends.
- FIG. 13 is a conceptual diagram for explaining the procedure of finally generating the first classifier.
- the second functional combination sum set data 3110 finally extracted by the inner loop feature selection process and the outer loop feature selection process is used as an explanatory variable, and all the participants are , Generate a first classifier by sparse logistic regression.
- Information (a parameter vector ⁇ of the logistic function, etc.) for identifying the generated first classifier is stored in the non-volatile storage device 2080.
- FIG. 14 is a flowchart for explaining the process performed by the data processing unit 32 in order to determine the disease label from the data of the subject's rs-fc MRI using the generated first classifier.
- the CPU 2040 acquires the subject rs-fc MRI measurement data 3113 at rest from the MRI imaging unit 25 via the interface unit 44 in step S401.
- the CPU 2040 executes steps S402 to S403 to execute the above-described 2. And extract the elements of the correlation matrix for all or part of the functional combinations described in Table 1.
- step S404 the CPU 2040 obtains a Pearson correlation coefficient with respect to the elements of the extracted correlation matrix.
- steps S405 to S406 the CPU 2040 inputs the correlation coefficient into the classifier, and generates an index value for determining a disease label of depressive symptoms for at least one functional combination.
- the CPU 2040 inputs the correlation coefficient into a classifier, and generates an association weighting sum for a plurality of functional combinations as an index value for determining a disease label of depressive symptoms.
- the CPU 2040 compares the index value with the reference value in step S407.
- the threshold value of the disease label of the depressive condition and the label of the healthy person is set to 0, so the reference value is 0.
- the reference value may be set to a value different from 0 in order to adjust the sensitivity and specificity of the first classifier. For example, if the reference value is smaller than 0, the sensitivity that is determined to be the disease level of "depression" is improved, but the specificity is decreased. If it is intended to use the discrimination result of the classifier described above as reference information (support information) for diagnosis by a doctor based on other subsequent information, setting may be made to give priority to improvement in sensitivity.
- step S408 when the index value is higher than 0 ("YES: Y"), the CPU 2040 can determine that the subject is a label of depression symptoms (S409). In addition, when the index value is lower than 0 ("NO: N"), it can be determined that the subject corresponds to a label of depressive symptoms (S410).
- the brain activity measurement device measures brain activity data measured at one measurement location, and based on the brain activity data, generates a classifier and a disease label by the classifier.
- estimation prediction
- the data of the healthy group and the depressed patient group is not limited to the case where it is measured by the MRI apparatus 10 itself, and the data generated by other MRI apparatuses may be integrated to generate a classifier.
- the data processing unit 32 does not necessarily have to be a computer for executing control of the MRI apparatus, and receives measurement data from one or more MRI apparatuses to generate a classifier and The generated classifier may be a computer specialized for performing discrimination processing.
- FIG. 15 is a functional block diagram showing an example of processing data collection, estimation processing and brain activity measurement of a subject in a distributed manner, which is another embodiment of the first embodiment of the present invention.
- sites 100.1 to 100. N is a facility that measures data of participants including a depressed patient group and a healthy person group using a brain activity measurement apparatus, and the management server 200 includes sites 100.1 to 100.N. Manage measurement data from N.
- the computer 300 corresponding to the determination device 2 generates a classifier from the data stored in the management server 200.
- the MRI apparatus 410 is provided at another site using the result of the classifier on the computer 300, and measures brain activity data for a specific subject.
- the computer 400 is installed at another site where the MRI apparatus 410 is provided, calculates correlation data of the functional connection of the brain of a specific subject from measurement data of the MRI apparatus 410, and transmits correlation data of the functional connection to the computer 300. It transmits and uses the judgment result by the returned classifier.
- the server 200 has sites 100.1 to 100. Participant FMRI measurement data 3102 of depression patient group and healthy people group transmitted from N, and human attribute information 3104 of participant associated with participant FMRI measurement data 3102 are stored, and access from computer 300 These data are transmitted to the computer 300 according to
- the computer 300 receives the participant FMRI measurement data 3102 and the human attribute information 3104 of the subject from the server 200 via the communication interface 2090.
- server 200 The hardware configuration of server 200, computer 300, and computer 400 is basically the same as the configuration of "data processing unit 32" described with reference to FIG. 2, and thus the description thereof will not be repeated.
- the correlation matrix calculation unit 3002, the first feature selection unit 3004, the second feature selection unit 3006, the classifier generation unit 3008 and the discrimination processing unit 3010, and data 3106 of the functional connection correlation matrix The one functional combination sum set data 3108, the second functional combination sum set data 3110 and the classifier data 3112 are the same as those described in the first embodiment, and therefore the description thereof will not be repeated.
- the MRI apparatus 410 measures brain activity data of a subject whose diagnostic label is to be estimated, and the processing device 4040 of the computer 400 stores the measured MRI measurement data 4102 in the non-volatile storage device 4100.
- the processing device 4040 of the computer 400 performs functional coupling correlation matrix data in the same manner as the correlation matrix calculation unit 3002. 4106 is calculated and stored in the non-volatile storage device 4100.
- the disease to be diagnosed is specified by the user of the computer 400, and the computer 400 transmits the functional connection correlation matrix data 4106 to the computer 300 according to the user's instruction of transmission.
- the determination processing unit 3010 calculates the determination result for the designated diagnostic label, and the computer 300 transmits the determination result to the computer 400 via the communication interface 2090.
- the computer 400 notifies the user of the determination result via a display device (not shown) or the like.
- the server 200 and the computer 300 may be managed by different administrators, in which case the security of the information on the subject stored in the server 200 can be obtained by restricting the computer that can access the server 200. It is also possible to improve
- the discrimination devices 1 and 2 discriminate the disease label for depressive symptoms and, in addition, generate information in which the degree of effect of the treatment of depressive symptoms is discriminated in order to discriminate the level of depressive symptoms. Or when depression symptoms are stratified into a plurality of preset subclasses, or can be used to generate support information when stratifiing a subject into said subclasses . Each usage will be described later.
- the first classifier can be used as a diagnostic biomarker to determine depressive symptoms. Also, the first classifier can be used as a diagnostic biomarker to determine the level of depressive symptoms. The first classifier can be used as a medicinal marker for determining the effect of treatment for depressive symptoms. The first classifier can be used as a biomarker to stratify a subject into subclasses of depression.
- steps S100 to S108 includes steps S100 to S108 (specifically, including S200 to S218 and S300 to S314). Including a program for causing the computer to execute the processing of the classifier generation processing and a program for causing the computer to execute the processing of steps S401 to S410 and performing the processing of steps S401 to S410. . Further, in another mode of the first embodiment, the processing as steps S100 to S108 (specifically, including S200 to S218 and S300 to S314) and steps S401 to S410 are executed to function as a determination apparatus.
- a program that causes a computer to execute may be stored in a storage medium such as a hard disk, a semiconductor memory device such as a flash memory, or an optical disk.
- the storage format of the program on the storage medium is not limited as long as the CPU 2040 can read the program.
- Storage in the storage medium is preferably non-volatile.
- Embodiment 2 of the present invention relates to a method of discriminating depression symptoms.
- the determination method includes the steps of: generating an index value for evaluating depressive symptoms with respect to an element of a correlation matrix of functional connections measured in a subject at rest; and when the index value exceeds a reference value And determining that the subject is depressive.
- a specific process conforms to the above-described S401 to S410, but in the process, the human may perform all or a part of the process excluding the process of generating the index value.
- the discrimination device 1 and the discrimination device 2 can be used to discriminate the level of depressive symptoms. That is, the apparatus for determining the level of depression symptoms, which is another mode of the first embodiment, includes an arithmetic unit and a storage unit. This computing device is for evaluating the depressive symptoms for the elements of the correlation matrix of the functional connection measured in the subject at rest by the first classifier based on the program stored in the storage device. And the subject is compared with a reference range of an index value set in advance according to the level of depressive symptoms for each functional connection, and the subject includes the index value. The process of determining that it is the level of depression symptoms corresponding to the range is performed.
- the discrimination processing unit 3010 performs discrimination processing on input data based on the classifier specified by the classifier data 3112 and discriminates the level of depression symptoms of the subject.
- the possible values of the “association weighting sum”, which is an index value may be classified in advance into a plurality of reference ranges. It is possible to output the discrimination result corresponding to the "depressive symptom level”.
- the machine learning of the classifier may be performed by using “disease labels” used to generate the classifier as a plurality of “level disease labels” according to the level of depression in advance.
- the third embodiment relates to a determination method of the level of depressive symptoms.
- the discrimination method comprises the steps of: generating an index value for evaluating depressive symptoms with respect to elements of a correlation matrix of functional connectivity measured in a subject at rest;
- the method includes the steps of comparing with a reference range of index values set according to the level, and determining that the subject is the level of depressive symptoms corresponding to the reference range in which the index value is included.
- FIG. 16 is a flowchart for explaining the process performed by the data processing unit 32 in order to determine the level of depression symptoms from the data of rs-fc MRI of the subject using the generated classifier.
- the CPU 2040 generates an index value by performing steps S401 to S406 described in FIG. 15 by an input of process start from the input unit 40 or the like.
- step S501 shown in FIG. 16 the CPU 2040 compares the index value with a reference range of index values set in advance according to the depression symptom level. Since the 12 pairs of functional connections are correlated with, for example, the severity of depression symptoms of BDI, the reference range of the index value for determining the level of depression symptoms is from the correlation with the severity of depression symptoms of BDI It can be determined in advance.
- step S502 the CPU 2040 determines which level of depression symptoms the index value generated in step S406 of FIG. 15 corresponds to (S502).
- step S503 the CPU 2040 determines that the subject is the level of the depressive symptom determined in step S502.
- a human may perform all or part of the steps excluding the step of generating the index value.
- Another aspect of the third embodiment includes a program that causes the computer to execute the function as the determination device by executing the process including steps S401 to S406 and steps S501 to S503.
- These programs may be stored in a storage medium such as a hard disk, a semiconductor memory device such as a flash memory, or an optical disk.
- the storage format of the program on the storage medium is not limited as long as the CPU 2040 can read the program. Storage in the storage medium is preferably non-volatile.
- the discrimination device 1 and the discrimination device 2 can be used to generate information for discriminating the therapeutic effect. That is, the determination apparatus for determining the treatment effect in the subject, which is another form of the first embodiment, includes the arithmetic device and the storage device. The arithmetic unit is configured to, based on the program stored in the storage unit, depress the symptom of the functional connection correlation matrix measured at rest in the subject at the first time point by the first classifier.
- a first value for evaluating the subject and the classifier causes the subject to rest at the same time as the subject at a second time point after the start of the treatment and after the first time point
- the treatment is effective for ameliorating the depressive symptoms of the subject when not improving more than the first value.
- the configurations of the determination device 1 and the determination device 2 are the same as those described in 3.
- the discrimination processing unit 3010 performs discrimination processing on input data based on the classifier specified by the classifier data 3112 and generates information for discriminating the therapeutic effect of the subject.
- Another aspect of this embodiment involves using the discriminator for drug reprofiling.
- Discrimination method Embodiment 4 relates to the correlation matrix for functional combination described in Table 1 obtained from the resting fMRI data of the subject imaged at at least two time points in the first classifier. Input elements and generate information to determine the treatment effect. Specifically, for the elements of the functional connection correlation matrix measured at rest in the subject at the first time point, generating a first value for evaluating depressive symptoms; Generating a second value for evaluating depressive symptoms with respect to an element of a correlation matrix of the same functional connection as the functional connection in the resting brain of the same subject as the subject at the time point; The step of comparing the first value and the second value, and in the case where the second value is improved than the first value, the treatment is effective for the improvement of the depressive symptoms of the subject And generating information indicating the possibility of being valid.
- the first time point may be before treatment or a predetermined time may have elapsed from the start of treatment, but is preferably before the start of treatment. In addition, even if the treatment is started again after the treatment is ended, it may be "before treatment” from the end of the treatment to the time before the resumption of the treatment.
- the second time point is not limited as long as it is after initiation of treatment and after the first time point.
- FIG. 17 is a flowchart for explaining the process for determining the therapeutic effect from the fMRI data of the subject using the first classifier.
- the CPU 2040 is a subject's fMRI measurement data at rest captured by the MRI imaging unit 25 at the first time point in step S601 described in FIG. 17 by the input of start of processing from the input unit 40 or the like. 3113 is acquired via the interface unit 44.
- steps S602 to S603 the above 2.
- the pre-processing described in is performed to extract the elements of the correlation matrix at the first time point for all or some of the functional combinations selected from the 12 pairs of functional combinations described in Table 1.
- step S604 the CPU 2040 calculates a Pearson correlation coefficient with respect to the elements of the correlation matrix at the first time point extracted in step S603.
- the CPU 2040 inputs the correlation coefficient calculated in step S604 to the first classifier, and generates a first value for the selected functional combination.
- the first value is, for example, the value of 2. above.
- the index values mentioned in and are calculated.
- the CPU 2040 acquires, via the interface unit 44, the subject fMRI measurement data 3113 at rest which is imaged from the subject by the MRI imaging unit 25 shown in step S607.
- steps S608 to S609 the above 2. And perform the pre-processing described in Table 1 to extract the elements of the correlation matrix at the second time point for all or some of the functional combinations selected from the 12 pairs of functional combinations described in Table 1.
- step S610 the CPU 2040 calculates a Pearson correlation coefficient with respect to the elements of the correlation matrix at the first time point extracted in step S609.
- the CPU 2040 inputs the correlation coefficient calculated in step S610 to the first classifier to generate a first value for the selected functional combination.
- the second value is, for example, the value of 2. above. It is generated as the index value described in.
- the CPU 2040 compares the first value generated in step S606 with the second value generated in step S612 (S613).
- step S614 determines in step S614 that the second value is improved more than the first value (“YES: Y”), the CPU 2040 performs the treatment for the improvement of the depressive symptoms of the subject.
- Information indicating the state is generated (S615).
- the CPU 2040 may then proceed to step S616 and present information indicating the possibility of continuing the treatment. The doctor determines whether to continue the treatment based on the information indicating the possibility of the continuation of the treatment.
- information about the region set in advance as the effectiveness of the treatment is distinguishably displayed, and the “information indicating the state of the treatment” is a classifier
- the "presentation of information indicating the possibility of continuing the treatment” may be to display this index value together with the above-mentioned region being displayed.
- step S614 When the CPU 2040 determines in step S614 that the second value is not improved more than the first value (“NO: N”), the CPU 2040 performs the above-mentioned for the improvement of the depressive symptoms of the subject. Information indicating the state of treatment is generated (S617). In this case, the CPU 2040 may then proceed to step S618 and present information indicating the possibility of the end of the treatment.
- the doctor determines whether to end the treatment based on the information indicating the possibility of the end of the treatment.
- information about a preset area is displayed in a distinguishable manner if there is no effectiveness of the treatment, and the “information indicating the state of the treatment” is a classifier
- the "presentation of information indicating the possibility of the end of the treatment” may be to display this index value together with the above-mentioned area being displayed.
- the CPU 2040 may proceed to step S619 and present information indicating the possibility of changing to another treatment method.
- the possibility of more specific treatment may be presented.
- the doctor can determine the treatment method to be changed from the current treatment method among the possibilities of the displayed treatment method.
- the threshold value of the disease label of the depressive condition and the label of the healthy person is set to 0, so the reference value is 0.
- step S614 in step S614, as the depressive symptoms become heavier, the index value increases in the positive direction. Therefore, when the second value is smaller than the first value, the CPU 2040 can determine that the second value is improved more than the first value. In addition, when the second value is larger than the first value, or when no significant difference is recognized between the first value and the second value, the CPU 2040 is more than the first value. Also, it can be determined that the second value has not improved.
- the first value and the second value may be index values, but the correlation coefficients calculated in steps S604 and S610 may be first values and second values, respectively.
- step S601 needs to be performed before step S607, but steps S602 to S606 do not need to be performed before step S607. Steps S602 to S606 may be performed at least somewhere before step S613 after step S601.
- the human may carry out all or part of steps S601 to S619.
- Embodiment 3 can also be used to determine the effect of medication treatment.
- the first classifier is used to determine the dose effect, it is preferable to use at least the functional combination identification numbers 1 and 2 as an index.
- Another aspect of the embodiment 4 includes using the said determination method for drug re-profiling.
- a program which causes the computer to execute the function as the determination device by executing the process including steps S601 to S619.
- the program may be stored in a storage medium such as a hard disk, a semiconductor memory device such as a flash memory, or an optical disk.
- the storage format of the program on the storage medium is not limited as long as the CPU 2040 can read the program. Storage in the storage medium is preferably non-volatile.
- Embodiment 1 Stratification device and stratification method of depression patients 6-1.
- Stratification Device Another form of Embodiment 1 relates to a stratification device for depressed patients.
- the discrimination device 1 and the discrimination device 2 respectively perform the stratification device 1 for assisting the doctor to stratify a depressed patient And the stratification device 2 (hereinafter collectively referred to as a "stratification device").
- the stratification apparatus includes an arithmetic unit and a storage unit.
- the arithmetic device of the discrimination device for stratification of depressed patients is based on the program stored in the storage device, An index value for evaluating depressive symptoms is generated for an element of the correlation matrix of the functional connection measured in the subject at rest, and the index value is previously determined according to the subclass for each functional connection.
- a process is performed to determine that the subject is the subclass corresponding to the reference range in which the index value is included, in comparison with the set reference range of the index value.
- the configurations of the stratification device 1 and the stratification device 2 are the same as those described in 3. above.
- the configuration is the same as that of the discrimination device 1 and the discrimination device 2 described in the above, and thus the description will be omitted.
- FIG. 19 and FIG. 20 the functional block diagram of the stratification apparatus 1 and the stratification apparatus 2 is shown. 19 and FIG. 20 are the same as FIG. 5 and FIG. 15 except that the discrimination processing unit 3010 is a stratification processing unit 3020.
- the stratification processing unit 3020 performs stratification processing on input data based on the classifier specified by the classifier data 3112, performs discrimination for stratification of depression patients, and outputs the result Do.
- the doctor performs stratification of the patient by using the determination result for stratification of the depressed patient output from the stratification device 1 or the stratification device 2 as support information.
- a stratification support device such a device can also be called a stratification support device.
- Stratification Method Embodiment 5 relates to a stratification method for stratification of depression patients.
- the discrimination method evaluates depressive symptoms with respect to elements of a correlation matrix of functional connections measured in a subject at rest when depression is stratified into a plurality of preset subclasses. Generating an index value for the purpose, comparing with a reference range of the index value set in advance according to the subclass for each functional connection, and a reference range in which the subject includes the index value Determining that it is the subclass corresponding to.
- FIG. 18 is a flowchart for explaining processing performed by the data processing unit 32 that generates information for determining a subclass of depressive symptoms from fMRI data of a subject using the generated classifier.
- the CPU 2040 generates an index value by performing steps S401 to S406 described in FIG. 14 by an input of process start from the input unit 40 or the like.
- step S701 shown in FIG. 18 the CPU 2040 compares the index value with a reference range of index values set in advance according to the subclass of depression.
- Subclasses of depression are classified into melancholic MDD, non-melancholic MDD, and refractory MDD based on clinical findings. Therefore, for example, by using a classifier in which melancholic MDD is generated as a "disease label", it is determined whether measurement data from a subject who has measured brain activity corresponds to a disease label of melancholic MDD. it can.
- non-melancholic MDD or treatment-resistant MDD is generated as a "disease label"
- measurement data from a subject who measures brain activity is non-melancholy MDD or treatment-resistant MDD. It can be determined whether it corresponds to the disease label of
- step S702 the CPU 2040 determines which subclass the index value generated in step S406 in FIG. 15 corresponds to. Then, in step S703, the CPU 2040 determines that the subject belongs to the subclass of depression determined in step S702.
- the doctor performs stratification of the patient as the support information for the stratification of the depressed patient as the information of the subclass output in this way. In this sense, such a method can also be called a stratification support method.
- Each step performed by the CPU 2040 may be performed entirely or partially by a human except for the step of generating the index value.
- a program that causes the computer to execute the function as the stratification apparatus by executing the processing including the above steps S701 to S703 is included.
- Another aspect of the fifth embodiment includes a program that causes the computer to execute the function as a stratification apparatus by executing the processing including the above steps S401 to S406 and steps S701 to S703.
- These programs may be stored in a storage medium such as a hard disk, a semiconductor memory device such as a flash memory, or an optical disk.
- the storage format of the program on the storage medium is not limited as long as the CPU 2040 can read the program. Storage in the storage medium is preferably non-volatile.
- the sixth embodiment is a classifier generation process for generating a second classifier for determining, for a plurality of subjects, a group in which the therapeutic effect administered for treatment can be seen and a group in which the therapeutic effect is not observed.
- the present invention relates to a therapeutic effect determination device or a therapeutic support device, which executes S. and generates information serving as an index for assisting a doctor in judging a therapeutic effect.
- the configuration of the therapeutic effect discriminating apparatus is basically the same as that of FIG. 1, but the data processor 32 in FIG. 1 is replaced with the data processor 62 in the sixth embodiment.
- the configuration of the data processing unit 62 is basically the same as in FIGS. 1 and 2, but in the sixth embodiment, the storage unit 36 in FIG. 42, a control unit 62, an input unit 40, an input unit 70, an interface unit 44, an interface unit 74, a data collection unit 46, a data collection unit 76, an image processing unit 48, an image processing unit 78, and a display unit 38.
- the display control unit 34 as the display control unit 64. Further, in FIG.
- a computer main body 2010 of the data processing unit 32 is a computer main body 6010
- a memory drive 2020 is a memory drive 6020
- a disk drive 2030 is a disk drive 6030
- an arithmetic unit (CPU) 2040 is an arithmetic unit (CPU) 6040.
- the communication interface 2090 is replaced with the communication interface 6090.
- the hardware of the data processing unit 62 is not particularly limited as described above, but a general-purpose computer can be used.
- FIG. 23 is a functional block diagram for performing generation processing of a second classifier and discrimination processing using the generated second classifier.
- Non-volatile storage device 6080 is a signal, which indicates brain activity in a plurality of predetermined areas in the brain of a plurality of subjects including a healthy person and a depressed patient who has been treated, measured in advance in time series by an MRI apparatus Rs-fc MRI measurement data 6102 of the subject measured at the first time point, rs-fc MRI measurement data 6104 of the subject measured at the second time point, and the rs-fc MRI measurement data A plurality of treatment data 6105 associated with each subject is stored.
- the treatment data 6105 includes information on the subject's disease label and treatment history (treatment method, medicine name, dosage, administration period, etc.).
- the CPU 6040 Process to generate a classifier to distinguish between the group with therapeutic effect ("remitted") and the group without therapeutic effect (“non-remitted") .
- the disease label in this case includes the "remission label” and the "non-remission label”.
- the first correlation measurement unit 6002 calculates, for each subject, a correlation matrix of functional coupling of brain activity between a plurality of predetermined areas from the rs-fc MRI measurement data 6102 of the subject at the first time point.
- the calculated data of the functional connection correlation matrix is stored in the non-volatile storage device 6080 for each subject as first correlation measurement data 6106 of the functional connection correlation matrix.
- the second correlation measurement unit 6004 calculates, for each subject, a correlation matrix of functional coupling of brain activity between a plurality of predetermined areas from the rs-fc MRI measurement data 6104 of the subject at the second time point.
- the calculated data of the functional connection correlation matrix is stored in the non-volatile storage device 6080 as the second correlation measurement data 6108 of the functional connection correlation matrix for each subject.
- the second classifier generation unit 6008 obtains a regression equation based on the difference between the first and second time points of the plurality of functional combinations.
- the regression equation is stored in the non-volatile storage device 6080 as second classifier data 6020 for identifying a second classifier.
- the therapeutic effect determination processing unit 6100 performs a therapeutic effect determination process on the input data based on the second classifier specified by the second classifier data 6020.
- FIG. 21 shows a flowchart for explaining the process performed by the data processing unit 62 to generate the second classifier.
- the data processing unit 62 reads the rs-fc MRI measurement data 6104 of each subject at the second time point from the storage unit 66, and for each of the plurality of functional combinations shown in Table 1 for each subject, the second The correlation of time points is measured (S803). The measurement of this correlation is performed by calculating the Pearson correlation coefficient of each functional combination.
- the data processing unit 62 determines, for example, each of the first functional connection and the second functional connection among the plurality of functional connections shown in Table 1 of each subject, at the first time point.
- the difference between the correlation and the correlation at the second time point is calculated (S804).
- the difference is calculated, for example, based on the following equation (4).
- FC1 shows the 1st bond strength in Table 1
- FC2 shows the 2nd bond strength in Table 1. That is, as a result of the calculation of the related weighted sum, the combination with the largest absolute value of the weight is FC1, and the second largest combination is FC2.
- the superscript "post” indicates a second point in time
- pre indicates a first point in time.
- the first time point is a time point before treatment (pre-dosing)
- the second time point is a predetermined time point after the start of treatment (after the start of dosing).
- sign (w 1 ) indicates the sign of the weight of FC 1
- sign (w 2 ) indicates the sign of the weight of FC 2.
- this classifier created in FIG. 33f as described below, has an accuracy of 0.75, AUC: 0.79, a specificity of 0.88, and a sensitivity of 0.43.
- the data processing unit 62 determines the relationship between the difference between the two correlations in each functional connection of each subject and the explanatory variable (labeled as “remitting group” or “non-remitting group”) included in the treatment data 6105. Find a regression equation to explain The regression equation is not particularly limited, but can be determined by linear regression analysis. Based on this regression equation, it is possible to generate a classifier that identifies the group with therapeutic effect and the group without therapeutic effect in the correlated state space (S804).
- correlated state space means the difference in intensity between the first and second points in time of the plurality of functional connections (the difference between the difference in intensity and the sign of weight if necessary) in this way.
- Each refers to a space that is stretched as an axis of space. In the above example, it is a two-dimensional space.
- the difference between the first time point and the second time point in the functional connection identification number 1 shown in Table 1 of each subject (referred to as ⁇ sign (W) FC1); If the correlation state of the said difference (it is set as (DELTA) sign (W) FC2) of the 1st time of a functional connection identification number 2 and a 2nd time is set, it will become like FIG. 33 f.
- ⁇ sign (W) FC1 and ⁇ sign (W) FC2 From the relationship between the correlation between ⁇ sign (W) FC1 and ⁇ sign (W) FC2 and the presence or absence of the therapeutic effect in each subject, a linear regression equation having a negative slope can be determined. Then, based on the regression line based on this linear regression equation, a group having no therapeutic effect on subjects distributed above the regression line and a group having therapeutic effects on subjects distributed below the regression line Can be identified as
- the doctor uses the information on the therapeutic effect outputted in this way as support information to judge the therapeutic effect on the depressed patient.
- FIG. 22 is a flowchart for explaining a process performed by the data processing unit 62 for determining the therapeutic effect from the data of rs-fc MRI of the subject using the second classifier generated in the seventh embodiment.
- the CPU 6040 acquires the subject rs-fc MRI measurement data 6113 at rest at the first time point from the MRI imaging unit 25 via the interface unit 64 in step S 901 by the input of process start from the input unit 70 or the like. .
- the CPU 6040 executes steps S902 to S903 to execute the above-described 2.
- the elements of the correlation matrix are extracted for all or part of the functional combinations listed in Table 1, and the correlation of each functional combination at the first time point is measured.
- step S 904 the CPU 6040 acquires the subject rs-fc MRI measurement data 6113 at rest at the second time point from the MRI imaging unit 25 via the interface unit 64.
- the CPU 6040 executes steps S905 to S906 to execute the above-described 2.
- the elements of the correlation matrix are extracted for all or part of the functional combinations listed in Table 1 and the correlation of each functional combination at the second time point is measured.
- step S 907 the CPU 6040 correlates each functional connection at the first point of time measured in step S 903 and each of the second point in time measured in step S 906 for each of the plurality of functional connections. Calculate the functional association correlation difference.
- the CPU 6040 inputs the difference calculated in step S 907 to the second classifier (S 908), and determines whether the therapeutic effect is recognized or not recognized in the subject by the second classifier. (S908).
- the method of measuring each correlation, the method of calculating the difference between the correlations, and the method of determining the therapeutic effect are the same as the contents described in the method of generating the second classifier.
- the first time point may be before the start of the treatment or a predetermined time may have elapsed from the start of the treatment, but is preferably before the start of the treatment. In addition, even after the treatment is restarted, it may be “before the start of treatment” from the end of treatment to the time before the resumption of treatment after the treatment is ended once.
- the second time point is not limited as long as it is after initiation of treatment and after the first time point.
- step S901 needs to be performed before step S606, but steps S902 to S903 do not have to be performed before step S904. Steps S902 to S903 may be performed at least somewhere before step S907 after step S901.
- Embodiment 6 includes using the said 2nd classifier, a therapeutic effect determination apparatus, or a treatment assistance apparatus for drug re-profiling.
- Embodiment 7 relates to a method of discriminating a therapeutic effect using a second classifier.
- the determination method is identical to the subject at the second time point with the step of measuring the first correlation of the plurality of functional connections in the brain at rest of the subject at the first time point.
- Measuring a second correlation of the plurality of functional connections in the resting brain of the subject, the second correlation of the plurality of functional connections of the subject, and the first correlation Determining the therapeutic effect on the subject by the classifier based on the difference between
- the specific steps conform to the above-described S901 to S909, but all or part of the steps may be performed by human.
- the determination information on the therapeutic effect outputted in this manner is used as the support information to judge the therapeutic effect on the depressed patient.
- Embodiment 7 includes using the said therapeutic effect determination method for drug re-profiling.
- a program that causes the computer to execute the function as the second classifier by executing the processing including the above steps S801 to S804 is included.
- Another aspect of the seventh embodiment includes a program that causes the computer to execute the function as a therapeutic effect determination device by executing the process including steps S801 to S804 and steps S901 to S909.
- Another aspect of the seventh embodiment includes a program that causes the computer to execute the function as the therapeutic effect determination device by executing the process including steps S901 to S909.
- These programs may be stored in a storage medium such as a hard disk, a semiconductor memory device such as a flash memory, or an optical disk.
- the storage format of the program on the storage medium is not limited as long as the CPU 6040 can read the program. Storage in the storage medium is preferably non-volatile.
- the eighth embodiment relates to the stratification device for depression patients according to the fourth embodiment, which uses rs-fc MRI data from stratified depression patients according to the sixth embodiment.
- the therapeutic effect determination device is a device that determines the therapeutic effect.
- the eighth aspect of the embodiment is the same as the third aspect above.
- Embodiment 8 includes using the therapeutic effect determining apparatus for drug reprofiling.
- Embodiment 9 relates to a method of determining therapeutic effect using a second classifier in a stratified depression patient.
- FIG. 24 shows a flowchart for determining the treatment effect using the second classifier in stratified depression patients.
- Steps S701 to S703 in FIG. 24 are the same as in FIG. Therefore, the above 6-2.
- the description of is incorporated herein by reference.
- the CPU 6040 performs steps S921 to S929 for the subject whose subclass is determined in step S703 shown in FIG.
- Each step of steps S921 to S929 is the same as the above 7-2. And correspond to each step of steps S901 to S909 described in FIG. Therefore, the above 7-2. Is incorporated herein by reference.
- the doctor determines that the treatment method (medication of a specific drug, etc.) is not effective, with the support of the treatment effect determination device,
- the doctor may use another treatment method (administration of another specific drug, neurofeedback, modified electroconvulsive therapy, repeated transcranial magnetic stimulation treatment, etc.) in combination with the treatment method, or to another treatment method. It is possible to make a decision to change the treatment method.
- Embodiment 9 includes using the said therapeutic effect determination method for drug re-profiling.
- a program which causes the computer to execute the function as the second classifier by executing the processing including the above steps S921 to S929 is included.
- These programs may be stored in a storage medium such as a hard disk, a semiconductor memory device such as a flash memory, or an optical disk.
- a storage medium such as a hard disk, a semiconductor memory device such as a flash memory, or an optical disk.
- the storage format of the program on the storage medium is not limited as long as the CPU 6040 can read the program.
- Storage in the storage medium is preferably non-volatile.
- Brain Activity Training Device Embodiment 10 provides brain activity training for giving feedback to the brain activity of a trainee and bringing it close to the correlated (combined) state of a healthy person (also referred to as neurofeedback training or simply training). It relates to the device. More generally, such a brain activity training apparatus relates to the functional connection state of the brain activity of the trainee with the functional activity of the brain activity of the healthy person in relation to the brain activity of the healthy group and the patient group. It is also possible to use for training in the sense of bringing the functional connection state of the current brain activity of the trainee closer to the functional connection state of the target brain activity as well as the training for bringing the state closer.
- the functional connection state of the brain activity of a healthy person and the connection state of the target brain activity are called "target pattern" as described later.
- the target pattern is stored in the storage device 10080 or the memory drive 10020.
- a subject labeled “depressive symptoms” by the depression symptom determination device 1 described above, the depression symptom determination device 2 or the depression symptom determination method preferably MDD, more preferably a melancholic-type MDD subject
- a subject whose level of depressive symptoms has been determined by the apparatus and method for discriminating the level of depressive symptoms described in (a subject of MDD, more preferably a subject of melancholy type MDD);
- a stratified subject preferably a subject stratified into MDD, more preferably a melancholy type MDD) according to the stratification apparatus and stratification method for depression patients described in It is preferable that it is a subject). Therefore, the above 3.
- FIG. 34 is a diagram showing the concept of the configuration of such a brain activity training apparatus.
- the configuration of the MRI apparatus 10 shown in FIG. 1 described above can be used.
- the hardware configuration of the brain activity training apparatus is basically the same as that of FIG. 1, but the data processor 32 in FIG. 1 is replaced with the data processor 102 in the tenth embodiment.
- the configuration of the data processing unit 102 is basically the same as in FIGS. 1 and 2, but in the tenth embodiment, the storage unit 36 in FIG. 42, a control unit 112, an input unit 40, an input unit 110, an interface unit 44, an interface unit 114, a data collection unit 46, a data collection unit 116, an image processing unit 48, an image processing unit 118, and a display unit 38.
- a computer main body 2010 of the data processing unit 32 is a computer main body 10010
- a memory drive 2020 is a memory drive 10020
- a disk drive 2030 is a disk drive 10030
- an arithmetic unit (CPU) 2040 is an arithmetic unit (CPU) 10040.
- the communication interface 2090 is replaced with the communication interface 10090.
- the hardware of the data processing unit 62 is not particularly limited as described above, but a general-purpose computer can be used.
- the driving method of the brain activity training device described below by way of example will be described as using a real time fMRI as a brain activity detecting device for measuring signals indicating brain activity in time series by brain function imaging.
- brain activity of the trainee is detected by the MRI apparatus 10 in time series for a predetermined time as a signal indicating brain activity in a plurality of predetermined regions in the brain (FIG. 38, step S1001). During this time, it is preferable that the trainee make an effort to increase a reward value described later.
- Echo-planar imaging (EPI) imaging is performed to image as fMRI.
- the CPU 10040 of the data processing unit 102 reconstructs the captured image in real time.
- the functional connection between the regions of interest 1 to 12 shown in Table 1 is for determining the label of "depressive symptom" Was selected by feature selection.
- At least one specific functional connection of the 12 functional connections is further selected and extracted as “functional connection of training object”.
- functional connection of training object although not particularly limited, for example, among such functional connections shown in Table 1, the “left dorsolateral frontal lobe that contributes the most to the discrimination of the depression label among such functional connections shown in Table 1 is not particularly limited.
- We select the "functional connection between the anterior cortex and the anterior left and posterior cingulate cortex” (the ID 1 connection in Table 1).
- “the degree of contribution” means “the absolute value of the weight in the related weighted sum”.
- this binding is the binding having the largest contribution among the binding that changes in the opposite direction to the healthy person by the administration of the “antidepressant” as described above.
- the data processing unit 102 performs a process of calculating temporal correlation within a predetermined time of functional combination with respect to the region of interest corresponding to “functional combination of training object” (FIG. 38, step S1002).
- the data processing unit 102 first determines the activity of each region of interest from the fMRI data (signal) for n consecutive (n: natural number, n.gtoreq.1) measurement times of the fMRI at rest measured in real time Calculate the degree.
- This activity degree can be, for example, an average value of measurement values of n consecutive measurement times.
- a period consisting of n continuous measurement times will be referred to as a "sample step".
- the data processing unit 102 determines the correlation (hereinafter referred to as “time correlation”) of the activity on the time axis by the following formula for the measurement window of a predetermined period. calculate.
- the measurement window is a period that includes the activity (for example, m (m: natural number, m ⁇ 2)) of a plurality of continuous sample steps on the time axis.
- x means the "activity" of one region of interest of "functional combination of training objects"
- y is "of the other region of interest of” functional connection of training objects
- x (bar) (hereinafter, a symbol representing "average” by adding-(bar) to the head of the letter x is called “x (bar)”. The same applies to other letters.) Represents the average of activity x within the measurement window as described above. The same applies to "y (bar)".
- ⁇ means, for example, summing up the activity of m sample steps in the measurement window.
- the measurement window is not particularly limited, but can be set to, for example, about 10 seconds to 20 seconds.
- the temporal correlation of the functional combination can take positive or negative values as a code.
- the sign of the time correlation of the functional combination is, for example, negative in the case of “healthy person”, but positive in the subject determined to have “depression symptom”. It is possible. Of course, the opposite is also possible, or both may have the same code.
- pattern of temporal correlation The sign of the temporal correlation of the functional combination and the magnitude of the absolute value will be collectively referred to as “pattern of temporal correlation”.
- the time correlation of the functional combination of the training object of the trainee can be calculated as the following function F1. i) If the sign of the time correlation of the functional combination of the trainee to be trained is positive, the constant value V1 is taken, and if the sign is negative, the value becomes V2 (> V1 ⁇ 0), and the time correlation A function F1 such that the value V2 increases with the increase of the absolute value of.
- the time correlation of functional subject of training object of trainee is The "degree of approximation" to the time correlation of a healthy subject can be calculated as the following function F2. ii) If the sign of the time correlation of the functional combination of the trainee's training is negative, take a constant value V1; if the sign is positive, the value becomes V2 (> V1 ⁇ 0), and the time correlation A function F2 such that the value V2 increases with the increase of the absolute value of.
- the “degree of approximation” is not limited to the above-described example, and it may be a function that the degree of “approximation” becomes higher as the pattern approximates the time correlation of the functional connection of a healthy person including the code. , Other functions may be used.
- a value obtained by averaging the respective degrees of approximation may be used as “degree of approximation”, or each degree of approximation may be selected.
- a value obtained by weighting and averaging the degree of contribution of coupling may be used as the “degree of approximation”.
- the data processing unit 102 calculates a reward value according to the degree of approximation calculated as described above (FIG. 38, step S1003).
- the reward value is a higher score, the higher the degree of approximation, according to the degree of approximation to the joint strength of the target brain activity.
- the data processing unit 102 provides feedback to the trainee 2 by displaying the calculated score SC on the presentation device 6 (FIG. 38, step S1004).
- the information to be fed back may be the numerical value of the score itself, or a graphic whose size changes according to the value of the numerical value, as shown in FIG. 35, for example. Other configurations may be used as long as the trainee can recognize the size of the score.
- processing of score feedback is repeated in real time from EPI imaging for a predetermined period.
- FIG. 36 is a diagram showing an example of a neuro feedback training sequence.
- the trainee measures brain activity at rest in advance.
- neurofeedback training will be conducted on the second and third days.
- the number of days spent on training may be at least or more than this.
- measurement of brain activity at rest is performed, for example, two months after the elapse of a predetermined period.
- the therapeutic effect of neurofeedback training is described above in 5.
- the computer program includes a computer program for driving the brain activity training device by executing the processes from step S1001 to S1004.
- These programs may be stored in a storage medium such as a hard disk, a semiconductor memory device such as a flash memory, or an optical disk.
- the storage format of the program on the storage medium is not limited as long as the CPU 10040 can read the program.
- Storage in the storage medium is preferably non-volatile.
- Example II Data collection and evaluation method Data collection target For the screening of patients with major depressive disorder (MDD) based on the Diagnosis and Statistics Manual for Mental Disorders-IV for 105 patients recruited at Hiroshima University Hospital and clinics in Hiroshima city, MINI Screening was performed using (the mental illness simplified structured interview method). Depression criteria, psychiatric symptoms, alcoholism or abuse, substance addiction or abuse, antisocial personality disorder were used as the exclusion criteria for current and past. And finally, 93 patients with self-reported depressive symptoms were selected as training datasets for the MDD classifier. Patients obtained fMRI data under the conditions described below before starting dosing or within 0 to 2 weeks after starting dosing.
- MDD major depressive disorder
- the MDD includes three subtypes of melancholic MDD, non-melancholic MDD, and treatment-resistant MDD.
- the group including all MDD patients is all MDD group
- the group including melancholic MDD patients is melancholic MDD group
- the group including non-melancholic depression patients is non-melancholic MDD group
- treatment resistant type A group including MDD patients is a treatment-resistant MDD group
- a group of healthy persons is a healthy control group.
- the training data set for generating the melancholic MDD classifier was based on the Beck Depression Inventory (BDI), in which the age and gender were matched with the healthy control group, for depression with moderate depressive symptoms (MINI Based) to be a subtype.
- BDI Beck Depression Inventory
- MINI moderate depressive symptoms
- Table 2b shows the breakdown of test data used in this example.
- the independent validation cohort (Chiba cohort) was created at the Japan Radiological Institute. Participants were assessed for lifelong history of mental illness based on the MINI.
- MDD patients had no psychiatric disorder of co-morbidity, healthy controls had no physical, neurological or psychiatric disorders, and had no history of current or past drug abuse.
- Written informed consent was given to all participants prior to the experiment. The experiment was approved by the Radiological Drug Safety Committee and the Institutional Review Committee of the Institute of Radiological Sciences in accordance with the ethical standards set forth in the Helsinki Declaration of 1964 and subsequent amendments.
- BDI Beck Depression Inventory
- HAMD Hamilton Rating Scale for Depression
- Non-melancholic MDD and treatment resistant MDD The non-melancholic MDD group includes all MDDs with a BDI score of 17 or more.
- Treatment-resistant MDD is a person who has been diagnosed with MDD and does not improve depressive symptoms even if two or more antidepressant drugs are administered.
- the fMRI data was then normalized and resampled at 2 ⁇ 2 ⁇ 2 mm 3 voxels, using normalization parameters obtained by segmentation of the structural image tuned by the average functional image. Finally, the functional image was smoothed with an isotropic 6 mm full width half value Gaussian kernel. After these pre-processing steps, based on the relative change between frames of time series data, a scrubbing procedure was performed to exclude any volume with excess head motion (ie functional images). (See Table 4 for a summary of head movements).
- fMRI data was extracted over time for each of the 137 regions of interest (ROI) covering the entire cerebral cortex as anatomically defined in Brainvisa Sulci Atlas (BSA; http: // brainvisa).
- ROI regions of interest
- BSA Brainvisa Sulci Atlas
- L1-SCCA L1 normalized sparse canonical correlation analysis
- SLR sparse logistic regression
- L1-SCCA L1 normalized sparse canonical correlation analysis
- SLR sparse logistic regression
- N is the number of LOOCVs (i.e., the number of subjects), and w i k is a weight associated with the k-th functional connection FC of the i-th LOOCV.
- the larger value of the cumulative weight c i k means that the kth functional combination FC makes a more important contribution to the classification to MDD and HC throughout the LOOCV.
- L and R of Lat Indicate the distinction between the left brain and the right brain.
- BSA indicates a Brodmann region
- BA indicates a Brodmann region number.
- rControl shows the correlation coefficient with respect to the normal control group.
- rMDD indicates the correlation coefficient for melancholic MDDs.
- Weight indicates the weight of the associated weighted sum.
- FIG. 25 shows selected 12 functional combinations and their weights.
- DLPFC left dorsalfrontal cortex
- PCC posterior cingulate cortex
- IFG ocular Precuneus
- FOG ocular Precuneus
- FOG ocular Precuneus
- FOG ocular Precuneus
- FOG ocular Precuneus
- FOG ocular Precuneus
- FOG ocular Precuneus
- FOG ocular Precuneus
- FOG ocular left inferior frontal gyrus
- SMA supplementary motor area
- a regression equation, or a classifier for classifying melancholic MDD patients and healthy subjects was created. Furthermore, the associated weighted sum (WLS) was calculated as an index for determining whether each subject is melancholic MDD or healthy.
- the distribution of WLS in the melancholic MDD group and the healthy control group is shown in FIG. 27a.
- Black bars represent melancholic MDD groups and white bars represent healthy controls.
- the first classifier according to the present invention can distinguish melancholic MDD from healthy persons. .
- the cohort collected in Chiba was also examined using the classifier obtained by the above method. The results are shown in FIG. 27b.
- the classifier of the present invention was able to classify melancholic MDD and healthy subjects even on a cohort independent of training data.
- the classifier of the present invention was considered to be able to classify melancholy type MDD and to be generalized.
- FIG. 27 c shows training data (longitudinal direction) for each group of all MDD group, melancholic MDD group, and non-melancholy MDD group.
- Inventive classifiers are created, and each group is used as test data (horizontal direction) to show data whose accuracy has been examined.
- the classifier generated in the melancholic MDD group had an accuracy of 54% (sensitivity 42%, specificity 67%, AUC 0.65) in non-melancholic MDD.
- the accuracy in LOOCV was 66% (sensitivity 58%, specificity 74%, AUC 0.74).
- the classifier that uses the entire MDD group as training data is inferior in classification accuracy to the classifier using the melancholy type MDD group as training data and the classifier using the melancholy type MDD group as training data. It shows. And it was considered that the whole MDD group contained more diverse MDD subtypes.
- Example 3 Evaluation of the severity of depression and treatment using the WLS score
- the correlation between the BD score and the WLS score was examined.
- Example 5 Changes before and after treatment of 12 pairs of functional bindings
- SSRI escitalopram
- N represents the number of patients receiving treatment.
- W i represents the weight of the classifier.
- the same contribution score is also expressed between the MDD and the healthy control group:
- s i indicates the difference between the average combined strength of the healthy control group and the MDD group weighted by the weight of the classifier.
- MD is always positive (positive score) and normal is negative (negative score), so si is always negative (negative score).
- I the decrement (negative sign in subtraction).
- the large negative values of c i and s i indicate that the contribution of FC i is large in the post-treatment-pre-treatment healthy person-MDD.
- the c i is negative indicating that the FC i after treatment approaches by the corresponding FC healthy individuals.
- the fact that c i becomes positive indicates that FC i after treatment has become MDD. Because the numbers of healthy control and MDD groups differ, the significant difference between c i and s i for each FC i was evaluated by Welch's t-test. Welch's t-test is:
- FC # (Left DLPFC-Left Precuneus / PCC FC) is the functional combination with the highest degree of contribution among the 12 pairs.
- the significant difference in change before and after treatment with FC # 1 in the classification of the melancholic MDD group and the healthy control group was p 0.009 in a pairwise comparison (FIG. 32a).
- the transition in the positive direction indicates that the direction is toward the melancholy MDD
- the transition in the negative direction indicates that the direction is toward the healthy person. This is because the sign of the weight of the Melancholy MDD classifier is multiplied by the difference of FC or FC.
- FC # 1 we were positively directed at FC # 1 after escitalopram treatment, so we examined whether the results would be the same in a completely independent cohort.
- SNRI serotonin-norepinephrine reuptake inhibitor
- FC # 1 and FC # 2 were obtained by the following formula.
- FC1 post indicates after FC1 administration
- FC1 pre indicates before FC1 administration
- FC2 post indicates after FC2 administration
- FC2 pre indicates before FC2 administration
- sign indicates each functional binding Indicates the sign of the weight of. The accuracy of this equation was: Accuracy: 0.75, AUC: 0.79, Specificity: 0.88, Sensitivity: 0.43.
- FC # 1 changes and FC # 2 changes appear to contribute to remission.
- Example 4 Neurofeedback V-1. FC Selection of Target Functional Binding Used for Neurofeedback Training The first functional binding shown in Table 5 above was selected as a target of neuro feedback according to the following steps.
- biomarker for rs-fcMRI a biomarker for predicting the severity of depressive symptoms based on the classifier of the present invention and BDI score (Yamashita A, Hayasaka S, Lisi G, Ichikawa N, Takamura M, Okada G Common functional connectivity between depression and depressed mood. The 37th annual meeting of the Japanese society of biological psychiatry; 24-26 September; Tokyo, Japan.), And Morimoto J, Yahata N, Okamoto Y, Kawato M, Imamizu H (2015) Common functional connectivity. did.
- Target functional binding included the biomarkers described above.
- the training included a total of 10 people, three with MDD and seven with subclinical depression. Prior to neurofeedback training, participants with subclinical depression at two different time points conducted had a mean BDI-II value of> 10.
- the neuro feedback training is to have the participant face up on the fMRI device, show the monitor in the device through the prism glasses, and image the connection index of the functional connection shown in FIG. 35 to move in the negative direction. Went by.
- Neurofeedback scores were calculated according to known methods.
- FIG. 37a shows a summary of neurofeedback scores for each training day of three MDD participants.
- the score tended to increase over the 4 days of training.
- a multiple regression model including two explanatory variables (each training day and one training item) and one response variable (neuro feedback score)
- CI confidence interval
- the functional connections shown in Table 5 were used to improve the neuropathy to improve depressive symptoms. It has been shown that it can be used as a target functional connection for feedback training. Furthermore, it was shown that the functional binding shown in Table 5 of the present invention can be used as a therapeutic method biomarker for developing a neurofeedback training method for ameliorating depressive symptoms.
- test subject 6 display, 10 MRI apparatus, 11 magnetic field application mechanism, 12 static magnetic field generating coil, 14 gradient magnetic field generating coil, 16 RF irradiation unit, 18 bed, 20 receiving coil, 21 drive unit, 22 static magnetic field power supply, 24 tilt Magnetic field power supply, 26 signal transmitting unit, 28 signal receiving unit, 30 bed driving unit, 32 data processing unit, 36 storage unit, 38 display unit, 40 input unit, 42 control unit, 44 interface unit, 46 data collecting unit, 48 images Processing unit, 50 network interface.
Abstract
The present invention differentiates objective disease labels for depression symptoms relative to brain activity states. As one means to address the problem to be addressed thereby, the present invention provides a differentiation device that is for helping to determine whether a subject has depression symptoms. The differentiation device comprises a storage device that is for storing information that specifies a classifier that has been generated by classifier generation processing from signals obtained by using a brain activity detection device to chronologically premeasure signals that indicate brain activity in a plurality of prescribed regions of the resting brains of each of a plurality of participants that include healthy and depressive patients. The classifier: is generated on the basis of a weighted sum of a plurality of functional connectivities that, from among functional connectivities between the plurality of prescribed regions, have, by means of machine learning, been selected by feature selection as being related to disease labels for depression symptoms; and is generated to differentiate the disease labels for depression symptoms. The differentiation device also comprises a computing device. Using the classifier, the computing device executes differentiation processing that generates classification results for the depression symptoms of the subject.
Description
本発明は、判別装置、うつ症状の判別方法、うつ症状のレベルの判定方法、うつ病患者の層別化方法、うつ症状の治療効果の判定方法及び脳活動訓練装置に関する。
The present invention relates to a discriminating apparatus, a method of discriminating depressive symptoms, a method of discriminating levels of depressive symptoms, a method of stratification of depressive patients, a method of discriminating therapeutic effects of depressive symptoms, and a brain activity training apparatus.
(バイオマーカー)
生体内の生物学的変化を定量的に把握するため、生体情報を数値化・定量化した指標のことを「バイオマーカー」と呼ぶ。 (Biomarker)
An indicator that quantifies and quantifies biological information in order to quantitatively grasp biological changes in a living body is called a "biomarker".
生体内の生物学的変化を定量的に把握するため、生体情報を数値化・定量化した指標のことを「バイオマーカー」と呼ぶ。 (Biomarker)
An indicator that quantifies and quantifies biological information in order to quantitatively grasp biological changes in a living body is called a "biomarker".
FDA(米国食品医薬品局)はバイオマーカーの位置づけを、「正常なプロセスや病的プロセス、あるいは治療に対する薬理学的な反応の指標として客観的に測定・評価される項目」としている。また疾患の状態や変化、治癒の程度を特徴づけるバイオマーカーは、新薬の臨床試験での有効性を確認するためのサロゲートマーカー(代替マーカー)として使われる。血糖値やコレステロール値などは、生活習慣病の指標として代表的なバイオマーカーである。尿や血液中に含まれる生体由来の物質だけでなく、心電図、血圧、PET画像、骨密度、肺機能なども含まれる。またゲノム解析やプロテオーム解析が進んできたことによって、DNAやRNA、生体蛋白等に関連したさまざまなバイオマーカーが見出されている。
The FDA (US Food and Drug Administration) positions the biomarker as "an item that can be objectively measured and evaluated as an indicator of normal processes, pathological processes, or pharmacological responses to treatment." In addition, biomarkers that characterize the disease state, changes, and degree of cure are used as surrogate markers (alternative markers) to confirm the efficacy of new drugs in clinical trials. Blood glucose level and cholesterol level are representative biomarkers as indicators of lifestyle-related diseases. Not only substances of biological origin contained in urine and blood but also electrocardiogram, blood pressure, PET images, bone density, lung function etc. are included. In addition, advances in genome analysis and proteome analysis have led to the discovery of various biomarkers related to DNA, RNA, biological proteins and the like.
バイオマーカーは、疾患にかかった後の治療効果の測定だけでなく、疾患を未然に防ぐための日常的な指標として疾患の予防に、さらに副作用を回避した有効な治療法を選択する個別化医療への応用が期待されている。
Biomarkers are not only the measurement of the treatment effect after having a disease, but also as a routine index for preventing the disease, individualized medicine that selects an effective treatment that prevents the disease and avoids side effects. Its application to the future is expected.
ただし、神経・精神疾患の場合、生化学的もしくは分子遺伝学的観点から客観的な指標として利用可能な分子マーカーなども研究されているものの、検討段階というべき状況である。
However, in the case of neurological and psychiatric disorders, although molecular markers etc. that can be used as an objective index are studied from the biochemical or molecular genetic point of view, this is a situation that should be considered at the examination stage.
一方で、NIRS(Near-infraRed Spectroscopy)技術を用いて、生体光計測により計測されたヘモグロビン信号から特徴量に応じて、統合失調症、うつ病などの精神疾患について分類を行う疾患判定システムなども報告がある(特許文献1)。
On the other hand, there is also a disease determination system that classifies mental disorders such as schizophrenia and depression according to feature amounts from hemoglobin signals measured by living body light measurement using NIRS (Near-infraRed Spectroscopy) technology. There is a report (patent document 1).
バイオマーカーは、通常の診療だけでなく、医薬品開発でも利用されている。
Biomarkers are used not only in routine medical care but also in drug development.
一般的な創薬の場合、探索研究の段階では薬力学マーカーが用いられ、非臨床段階になると候補化合物の毒性をみる毒性マーカーも利用されるようになる。
In the case of general drug discovery, pharmacodynamic markers will be used in the exploratory research stage, and toxicity markers that show the toxicity of candidate compounds will also be used in the non-clinical stage.
臨床試験の段階になると、評価項目として代替マーカーが利用されたり、診断マーカー、予後マーカー、予測マーカー、モニタリングマーカー、安全性マーカーなど、多様なマーカーが利用される。
At the stage of clinical trials, alternative markers are used as endpoints, and various markers such as diagnostic markers, prognostic markers, predictive markers, monitoring markers and safety markers are used.
「代替マーカー」とは、真のエンドポイントとの科学的な関係が証明されているマーカーのことをいう。
"Alternate marker" refers to a marker whose scientific relationship to the true endpoint has been demonstrated.
「診断マーカー」とは、疾患の有無や疾患の種類を特定する診断マーカーと,疾患の重症度や進行度を判定する診断マーカーの2種類がある。「予測マーカー」とは、特定の薬剤が効きやすい集団を見分けるバイオマーカーである。「予後マーカー」とは、特定の治療に関係なく疾患の進行や回復を予想するバイオマーカーである。「モニタリングマーカー」とは、「薬効マーカー」とも呼ばれ、薬剤の効き具合,治療効果を診るマーカーである。このマーカーを長期間モニタリングすることで薬剤耐性の原因解明のヒントにもなりうる、とされる。
There are two types of "diagnostic markers": a diagnostic marker that identifies the presence or absence of a disease and the type of disease, and a diagnostic marker that determines the severity and progression of a disease. A "prognostic marker" is a biomarker that distinguishes populations susceptible to a particular drug. A "prognostic marker" is a biomarker that predicts the progression or recovery of the disease regardless of the particular treatment. The “monitoring marker” is also called a “drug effect marker”, and is a marker for examining the efficacy of a drug and the therapeutic effect. By monitoring this marker for a long time, it can be a hint for elucidating the cause of drug resistance.
たとえば、標的分子が明確である場合などは、たとえば、標的分子などを、特定の薬剤が効きやすい患者の集団を見分けて選択するために、臨床試験で患者層別マーカーとして利用できる場合がある。このような場合、患者層別マーカーを利用する医薬品が承認されると、その患者層別マーカーを測定するための診断薬は「コンパニオン診断薬」と呼ばれる場合がある。あるいは、このような患者層別マーカーにより、患者に対する治療方法を選択するために行われる診断は、「コンパニオン診断」と呼ばれる場合もある。
For example, when the target molecule is clear, etc., for example, the target molecule may be available as a patient stratification marker in clinical trials to identify and select a population of patients susceptible to a particular drug. In such a case, when a drug using a patient stratification marker is approved, a diagnostic reagent for measuring the patient stratification marker may be called a "companion diagnostic drug". Alternatively, a diagnosis performed to select a treatment method for a patient by such a patient stratification marker may be referred to as a "companion diagnosis".
臨床試験において、後期試験にかかるコストが非常に高いことから、後期試験に適したバイオマーカーの開発が臨床試験の効率を向上させるために必要と考えられる。しかし、このようなバイオマーカーの開発は、一般には容易ではない。
In clinical trials, the cost of late-stage trials is so high that development of biomarkers suitable for late-stage trials may be necessary to improve the efficiency of clinical trials. However, development of such biomarkers is not generally easy.
また、たとえば、生物学的指標 (バイオマーカー)を考える際、疾患病態生理において、疾患原因に関連する行動学あるいは生物学的プロセスを反映しているものはtrait markerであり、患者における臨床状態像を反映しているのがstate markerと呼ばれる。trait markerは、遺伝規定性指標とも呼ばれ、state markerは、状態依存性指標とも呼ばれる。
Also, for example, when considering biological indicators (biomarkers), in disease pathophysiology, it is the trait marker that reflects behavioral or biological processes related to the cause of the disease, and the clinical status image in the patient It is called state marker that reflects. The trait marker is also called a genetic regularity index, and the state marker is also called a state dependency index.
(リアルタイムニューロフィードバック)
たとえば、従来、神経症の一型である強迫性障害 (Obsessive-Compulsive Disorder: OCD)に対しては、その治療法として、薬物療法や行動療法が知られている。薬物療法としては、たとえば、選択的セロトニン再取り込阻害薬が用いられ、行動療法としては、曝露法と反応妨害法を組み合わせた曝露反応妨害法などが知られている。 (Real-time neurofeedback)
For example, for obsessive-compulsive disorder (OCD), which is a type of neuropathy, drug therapy and behavioral therapy are known as the treatment methods. As a drug therapy, for example, a selective serotonin reuptake inhibitor is used, and as a behavioral therapy, an exposure response interference method combining an exposure method and a response interference method is known.
一方で、神経・精神疾患の場合の治療法の可能性として、リアルタイムニューロフィードバック法が検討されている(特許文献6)。
On the other hand, a real-time neurofeedback method has been studied as a therapeutic possibility in the case of neuropsychiatric disease (Patent Document 6).
核磁気共鳴画像法(MRI:Magnetic Resonance Imaging)を利用して、ヒトの脳の活動に関連した血流動態反応を視覚化する方法である機能的磁気共鳴画像法(fMRI:functional Magnetic Resonance Imaging)を始めとする脳機能画像法は、感覚刺激や認知課題遂行による脳活動と安静時や対照課題遂行による脳活動の違いを検出して、関心のある脳機能の構成要素に対応する脳賦活領域を特定すること、すなわち脳の機能局在を明らかにすることにもちいられてきた。
Functional Magnetic Resonance Imaging (fMRI), a method of visualizing hemodynamic responses related to human brain activity using Magnetic Resonance Imaging (MRI) Functional brain function imaging methods including brain activity detection areas corresponding to components of brain functions of interest by detecting differences in brain activity due to sensory stimulation or cognitive task execution and brain activity due to rest or control task execution. It has been used to identify the brain, that is, to clarify the functional localization of the brain.
近年、機能的磁気共鳴画像法(fMRI)などの脳機能画像法を用いたリアルタイムニューロフィードバック技術についての報告がある(非特許文献1)。リアルタイムニューロフィードバック技術は、神経疾患、精神疾患の治療方法として注目され始めている。
In recent years, there has been a report on a real-time neurofeedback technique using brain function imaging such as functional magnetic resonance imaging (fMRI) (Non-Patent Document 1). Real-time neurofeedback technology is beginning to attract attention as a therapeutic method for neurological and psychiatric disorders.
ニューロフィードバックとは、バイオフィードバックの一種であり、被検者が自身の脳活動に関するフィードバックを受けることで、脳活動を操作する方法を学ぶというものである。
Neurofeedback is a type of biofeedback, in which a subject learns how to manipulate brain activity by receiving feedback on his or her brain activity.
たとえば、前部帯状回の活動をfMRIで計測し、それをリアルタイムで炎の大きさとして、患者にフィードバックして、炎を小さくするように努力させると、中枢性の慢性疼痛が実時間でも、また、長期的にも改善したとの報告がある(非特許文献2を参照)。
For example, if the activity of the anterior cingulate is measured by fMRI and it is fed back to the patient as the size of the flame in real time to make the flame smaller, central chronic pain will be even in real time, In addition, there is a report that it has improved in the long run (see non-patent document 2).
(安静時fMRI)
また、最近の研究では、安静時の脳も活発に活動していることがわかってきた。つまり、アクティブな活動中には鎮静化しており、休息時には活発に興奮する神経細胞群が脳内に存在する。解剖学的には左右の大脳が合わさった内側面が主な部位で、前頭葉内側面、後部帯状回、楔前部、頭頂連合野の後半部、中側頭回などである。この安静時の脳活動のベースラインを示す領域はデフォルトモードネットワーク(Default Mode Network;DMN)と名付けられ、ひとつのネットワークとして同期しながら活動する(非特許文献3を参照)。 (Resting fMRI)
Also, recent research has shown that the resting brain is also active. That is, there are nerve cells in the brain that are sedated during active activity and actively excited at rest. Anatomically, the main site is the medial aspect where the left and right cerebrum meet, such as the medial aspect of the frontal lobe, posterior cingulate gyrus, anterior wing, posterior half of parietal joint area, medial temporal gyrus, etc. A region indicating a baseline of resting brain activity is named Default Mode Network (DMN), and operates in synchronization as one network (see Non-Patent Document 3).
たとえば、健常者と精神疾患の患者で脳活動が異なるという例として、デフォルトモードネットワークにおける脳活動が挙げられる。デフォルトモードネットワークとは、安静状態において、目標指向的な課題を実行中よりも活発な脳活動がみられる部位のことを指す。統合失調症、アルツハイマー病などの疾患の患者は、健常者と比較したときに、このデフォルトモードネットワークに異常がみられることが報告されている。たとえば、統合失調症の患者は、安静状態において、デフォルトモードネットワークに属する後帯状皮質と、頭頂外側部、前頭前野内側部、小脳皮質の活動の相関が下がっているなどの報告がある。
For example, brain activity in a default mode network may be mentioned as an example in which brain activity is different between healthy and mental patients. The default mode network refers to a site where brain activity is more active in resting state than when performing goal-directed tasks. It has been reported that patients with diseases such as schizophrenia and Alzheimer's disease show abnormalities in this default mode network when compared with healthy people. For example, in the resting state, there is a report that, in the resting state, the activity of the posterior cingulate cortex belonging to the default mode network and the activity of the lateral parietal region, the medial prefrontal cortex, and the cerebellar cortex is lowered.
ただし、このようなデフォルトモードネットワークが、認知機能とどのようにかかわっているのかや、このような脳領域間の機能的結合の相関と上述したニューロフィードバックとの関連などは、必ずしも明らかとはなっていない状況である。
However, how such a default mode network is related to cognitive function, correlation of functional connection between such brain regions, and the relationship between the above-mentioned neurofeedback etc. are necessarily clear. It is not a situation.
一方で、複数の脳領域間において課題などの違いによる活動の相関関係の変化をみることにより、それら脳領域間の機能的結合(functional connectivity)が評価されている。とくに、安静時のfMRIによる機能的結合の評価は安静時機能的結合MRI(rs-fcMRI : resting-state functional connectivity MRI)とも呼ばれ、様々な神経・精神疾患を対象とした臨床研究も行われるようになりつつある。ただし、従来のrs-fcMRI法は、上述したようなデフォルトモードネットワークといったような大域的神経ネットワークの活動をみるものであって、より詳細な機能的結合について、十分な検討がされているとはいえない状況である。
On the other hand, functional connectivity between brain regions has been evaluated by observing changes in the correlation of activities due to differences in tasks among a plurality of brain regions. In particular, evaluation of functional connectivity by resting-state fMRI is also called resting-state functional connectivity MRI (rs-fcMRI), and clinical research for various neurological and psychiatric disorders is also conducted. It's getting better. However, the conventional rs-fcMRI method is to observe the activity of a global neural network such as the default mode network as described above, and it is considered that a more detailed functional connection is sufficiently studied. It can not be said the situation.
(核磁気共鳴画像法)
このような核磁気共鳴画像法について、簡単に説明すると、以下のとおりである。 Nuclear Magnetic Resonance Imaging
A brief description of such a nuclear magnetic resonance imaging method is as follows.
このような核磁気共鳴画像法について、簡単に説明すると、以下のとおりである。 Nuclear Magnetic Resonance Imaging
A brief description of such a nuclear magnetic resonance imaging method is as follows.
すなわち、従来から、生体の脳や全身の断面を画像する方法として、生体中の原子、特に、水素原子の原子核に対する核磁気共鳴現象を利用した核磁気共鳴映像法が、人間の臨床画像診断等に使用されている。
That is, conventionally, as a method of imaging the cross section of the brain or whole body of a living body, nuclear magnetic resonance imaging using nuclear magnetic resonance phenomenon for atoms of living body, in particular, hydrogen atoms in living body, Is used for
核磁気共鳴映像法は、それを人体に適用する場合、同様の人体内断層画像法である「X線CT」に比較して、たとえば、以下のような特徴がある。
When applied to the human body, nuclear magnetic resonance imaging has, for example, the following features, as compared to “X-ray CT” which is a similar in-body tomographic imaging method.
(1)水素原子の分布と、その信号緩和時間(原子の結合の強さを反映)に対応した濃度の画像が得られる。このため、組織の性質の差異に応じた濃淡を呈し、組織の違いを観察しやすい。
(1) A distribution image of hydrogen atoms and an image of a concentration corresponding to the signal relaxation time (reflecting the bond strength of atoms) are obtained. For this reason, the light and shade according to the difference in the nature of the tissue is exhibited, and it is easy to observe the difference in the tissue.
(2)磁場は、骨による吸収がない。このため、骨に囲まれた部位(頭蓋内、脊髄など)を観察しやすい。
(2) The magnetic field is not absorbed by bone. Therefore, it is easy to observe a site surrounded by bone (intracranial, spinal cord, etc.).
(3)X線のように人体に害になるということがないので、広範囲に活用できる。
(3) It can be widely used because it does not cause harm to the human body like X-rays.
このような核磁気共鳴影像法は、人体の各細胞に最も多く含まれ、かつ最も大きな磁性を有している水素原子核(陽子)の磁気性を利用する。水素原子核の磁性を担うスピン角運動量の磁場内での運動は、古典的には、コマの歳差運動にたとえられる。
Such nuclear magnetic resonance imaging utilizes the magnetic properties of hydrogen nuclei (protons), which are most abundant in each cell of the human body and have the greatest magnetism. The motion in the magnetic field of the spin angular momentum responsible for the magnetism of hydrogen nuclei is classically compared to the precession of coma.
以下、本発明の背景の説明のために、この直感的な古典的モデルで、簡単に核磁気共鳴の原理をまとめておく。
The principle of nuclear magnetic resonance is briefly summarized below with this intuitive classical model for the purpose of explaining the background of the present invention.
上述したような水素原子核のスピン角運動量の方向(コマの自転軸の方向)は、磁場のない環境では、ランダムな方向を向いているものの、静磁場を印加すると、磁力線の方向を向く。
The direction of the spin angular momentum of the hydrogen nucleus (direction of the rotation axis of the coma) as described above is randomly directed in an environment without a magnetic field, but is directed in the direction of magnetic lines when a static magnetic field is applied.
この状態で、さらに振動磁界を重畳すると、この振動磁界の周波数が、静磁界の強さで決まる共鳴周波数f0=γB0/2π(γ:物質に固有の係数)であると、共鳴により原子核側にエネルギーが移動し、磁化ベクトルの方向が変わる(歳差運動が大きくなる)。この状態で、振動磁界を切ると、歳差運動は、傾き角度を戻しながら、静磁界における方向に復帰していく。この過程を外部からアンテナコイルにより検知することで、NMR信号を得ることができる。
In this state, when an oscillating magnetic field is further superimposed, the frequency of this oscillating magnetic field is set to the nucleus side by resonance as the resonance frequency f0 = γB0 / 2π (γ: a coefficient inherent to the substance) determined by the strength of the static magnetic field. The energy moves and the direction of the magnetization vector changes (the precession increases). In this state, when the oscillating magnetic field is cut, the precession movement returns to the direction of the static magnetic field while returning the inclination angle. An NMR signal can be obtained by externally detecting this process using an antenna coil.
このような共鳴周波数f0は、静磁界の強度がB0(T)であるとき、水素原子では、42.6×B0(MHz)となる。
Such a resonance frequency f 0 is 42.6 × B 0 (MHz) in a hydrogen atom when the intensity of the static magnetic field is B 0 (T).
さらに、核磁気共鳴映像法では、血流量の変化に応じて、検出される信号に変化が現れることを用いて、外部刺激等に対する脳の活動部位を視覚化することも可能である。このような核磁気共鳴映像法を、特に、機能的磁気共鳴画像法と呼ぶ。
Furthermore, in nuclear magnetic resonance imaging, it is also possible to visualize the active site of the brain in response to an external stimulus or the like by using the appearance of a change in the detected signal in response to a change in blood flow. Such nuclear magnetic resonance imaging is particularly referred to as functional magnetic resonance imaging.
fMRIでは、装置としては通常のMRI装置に、さらに、fMRI計測に必要なハードおよびソフトを装備したものが使用される。
In fMRI, an apparatus is used which is equipped with a normal MRI apparatus and further with hardware and software necessary for fMRI measurement.
ここで、血流量の変化がNMR信号強度に変化をもたらすのは、血液中の酸素化および脱酸素化ヘモグロビンは磁気的な性質が異なることを利用している。酸素化ヘモグロビンは反磁性体の性質があり、周りに存在する水の水素原子の緩和時間に影響を与えないのに対し、脱酸素化ヘモグロビンは常磁性体であり、周囲の磁場を変化させる。したがって、脳が刺激を受け、局部血流が増大し、酸素化ヘモグロビンが増加すると、その変化分をMRI信号として検出する事ができる。被検者への刺激は、たとえば、視覚による刺激や聴覚による刺激、あるいは所定の課題(タスク)の実行等が用いられる(たとえば、特許文献2)。
Here, the reason that the change in blood flow causes a change in the NMR signal intensity is that oxygenated and deoxygenated hemoglobin in blood has different magnetic properties. While oxygenated hemoglobin is diamagnetic in nature and does not affect the relaxation time of the hydrogen atoms of the water present around it, deoxygenated hemoglobin is a paramagnetic material and changes the surrounding magnetic field. Therefore, when the brain is stimulated to increase local blood flow and oxygenated hemoglobin is increased, the change can be detected as an MRI signal. For the stimulation of the subject, for example, visual stimulation or auditory stimulation or execution of a predetermined task (task) is used (for example, Patent Document 2).
ここで、脳機能研究においては、微小静脈や毛細血管における赤血球中の脱酸素化ヘモグロビンの濃度が減少する現象(BOLD効果)に対応した水素原子の核磁気共鳴信号(MRI信号)の上昇を測定することによって脳の活動の測定が行われている。
Here, in the brain function study, the increase of the nuclear magnetic resonance signal (MRI signal) of the hydrogen atom corresponding to the phenomenon (BOLD effect) in which the concentration of deoxygenated hemoglobin in the red blood cell in the microveins and capillaries is decreased The measurement of brain activity is done by doing.
特に、人の運動機能に関する研究では、被検者に何らかの運動を行わせつつ、上記MRI装置によって脳の活動を測定することが行われている。
In particular, in research on human motor function, it is performed to measure brain activity with the MRI apparatus while causing the subject to perform some exercise.
ところで、ヒトの場合、非侵襲的な脳活動の計測が必要であり、この場合、fMRIデータから、より詳細な情報を抽出できるデコーディング技術が発達してきている(たとえば、非特許文献4)。特に、fMRIが脳におけるボクセル単位(volumetric pixel : voxel)で脳活動を解析することで、脳活動の空間的パターンから、刺激入力や認識状態を推定することが可能となっている。
By the way, in the case of humans, noninvasive measurement of brain activity is necessary, and in this case, decoding technology capable of extracting more detailed information from fMRI data has been developed (for example, Non-Patent Document 4). In particular, fMRI analyzes brain activity on a voxel basis (volumetric pixel: voxel) in the brain, making it possible to estimate a stimulus input and a recognition state from a spatial pattern of brain activity.
さらに、このようなデコーディング技術を発展させた技術として、特許文献3には、神経・精神疾患に対して、脳機能画像法によるバイオマーカーを実現するための脳活動解析方法が開示されている。この方法では、健常群、患者群において測定された安静時機能的結合MRIのデータから、それぞれの被験者について、所定の脳領域間の活動度の相関行列を導出する。被験者の疾患/健常ラベルを含む被験者の属性と相関行列とについて正則化正準相関解析により特徴抽出が行われる。正則化正準相関解析(スパース正準相関解析)の結果に基づいて、スパースロジスティック回帰(Sparse Logistic Regression: SLR)による判別分析によりバイオマーカーとして機能する分類器が生成される。このような機械学習の技術により、安静時のfMRI データから導き出される脳領野間の結合(機能的結合)にもとづいて自閉症の診断結果を予測可能であることが示された(特許文献4、特許文献5)。しかも、その予測性能の検証は一つの施設において計測された脳活動のみではなく、他の施設で計測された脳活動に対しても、ある程度の汎化が可能であることが示された。
Furthermore, as a technology that has developed such a decoding technology, Patent Document 3 discloses a brain activity analysis method for realizing a biomarker by brain function imaging for neurological and psychiatric disorders. . In this method, the correlation matrix of activity between predetermined brain regions is derived for each subject from the data of resting functional combined MRI measured in the healthy group and the patient group. Feature extraction is performed by regularization canonical correlation analysis on the subject's attributes including the subject's disease / healthy label and the correlation matrix. Based on the result of regularization canonical correlation analysis (sparse canonical correlation analysis), a classifier that functions as a biomarker is generated by discriminant analysis by sparse logistic regression (SLR). It has been shown that such a machine learning technique can predict the diagnosis result of autism based on the connection (functional connection) between brain areas derived from the fMRI data at rest (Patent Document 4) , Patent Document 5). Moreover, it was shown that generalization of the prediction performance is possible not only to brain activity measured in one center but also to brain activity measured in another center.
さらに、近年では、多数の研究施設から得られた大規模なマルチサイトサンプル群(n=1188)でfMRIを用いて、うつ病患者は4つの神経生理学的サブタイプ(バイオタイプ)に分類できること、こうしたバイオタイプは辺縁系および前頭葉-線条体ネットワークにおける結合性機能不全を示すそれぞれ別のパターンによって明確に示されることが指摘されている(非特許文献5を参照)。非特許文献5においては、これらのバイオタイプは、臨床的特徴を基盤とするだけでは弁別できないが、異なる臨床症状プロファイルと結び付いており、また経頭蓋磁気刺激治療に対する応答性を予測する(n=154)、とされている。
Furthermore, in recent years, with fMRI in large multi-site sample groups (n = 1188) obtained from a number of research institutes, depressed patients can be classified into four neurophysiological subtypes (biotypes), It has been pointed out that such biotypes are clearly indicated by distinct patterns indicative of connective dysfunction in the limbic system and the frontal-striatal network (see non-patent document 5). In Non-Patent Document 5, these biotypes can not be distinguished only on the basis of clinical features, but are linked to different clinical symptom profiles, and also predict responsiveness to transcranial magnetic stimulation therapy (n = 154).
非特許文献5においては、脳内の258の領域からのBOLD信号に基づき、脳内の機能的な結合により、上記のサブタイプの分類を行っている。
In Non-Patent Document 5, classification of the above-mentioned subtypes is performed by functional connection in the brain based on BOLD signals from 258 regions in the brain.
以上のように、機能的磁気共鳴画像法などの脳機能画像法による脳活動の解析の神経・精神疾患の治療への応用を考えた場合、たとえば、上述したようなバイオマーカーとして、脳機能画像法による脳活動の解析は、非侵襲的な機能マーカーとして、診断法の開発、根本治療を実現するための創薬に向けた標的分子の探索・同定などへの応用も期待される。
As described above, when application of analysis of brain activity by functional brain imaging such as functional magnetic resonance imaging to treatment of neurological and psychiatric disorders is considered, for example, functional brain imaging as a biomarker as described above The analysis of brain activity by the method is expected to be applied as a non-invasive functional marker to the development of a diagnostic method and the search / identification of a target molecule for drug discovery for realizing basic treatment.
たとえば、これまで、うつ病に対しては、遺伝子を用いた実用的なバイオマーカーの完成には至っておらず、それゆえに、客観的な薬物の効果判定を行うことが容易ではなく、治療薬の開発も困難であった。
For example, until now, for depression, it has not been possible to complete a practical biomarker using a gene, and it is therefore not easy to objectively determine the effect of a drug, and it is difficult to Development was also difficult.
脳活動の計測データに基づいて、機械学習により分類器を生成し、これをバイオマーカーとして実用化させるためには、一つの施設において計測された脳活動に対して機械学習により生成されたバイオマーカーの予測精度の向上が必要である。また、このようにして生成されたバイオマーカーが、他の施設において計測された脳活動に対しても、汎化可能であることが必要である。
In order to generate a classifier by machine learning based on measurement data of brain activity and put it into practical use as a biomarker, a biomarker generated by machine learning for brain activity measured in one facility It is necessary to improve the prediction accuracy of It is also necessary that the biomarkers generated in this way can be generalized to brain activity measured in other institutions.
すなわち、脳活動の計測データに基づく、機械学習により分類器を構築する際には、主な2つの課題が存在する。
That is, when constructing a classifier by machine learning based on measurement data of brain activity, there are two main problems.
第1の課題は、小標本サイズの問題である。
The first issue is the small sample size issue.
参加者の人数であるデータ量Nが、計測された脳活動計測データの次元Mよりはるかに小さいので、分類器のパラメータは、容易に訓練データに過剰適合(「過適応」または「過学習」と呼ばれる)することになる。
Classifier parameters are easily over-fit to training data ("over-adapted" or "over-learning") as the amount of data N, the number of participants, is much smaller than the dimension M of the measured brain activity measurement data Will be called).
この過剰適合のために、構築された分類器は、新しくサンプリングされたテストデータについては、非常に貧弱なパフォーマンスを示すことになる。これは、これらのテストデータは分類器を訓練するのに使用されていないものだからである。
Due to this over-fitting, the constructed classifier will perform very poorly on newly sampled test data. This is because these test data are not used to train the classifier.
したがって、分類器の望ましい汎化に対して本質的な特徴量だけを識別し利用するために正則化を適切に導入する必要がある。
Therefore, it is necessary to properly introduce regularization in order to identify and use only the features that are essential to the desired generalization of the classifier.
たとえば、上述した非特許文献5においては、必ずしも、このような正則化について十分な考慮がされているとはいえない。
For example, in Non-Patent Document 5 mentioned above, it can not be said that such regularization is sufficiently considered.
第2の課題は、構築された分類器が、訓練データが集められたサイトとは異なる撮像サイトで走査されたMRIデータに対しても、よいパフォーマンスを維持する場合のみ、分類器が臨床的に有用で、科学的に信頼できるということである。
The second issue is that the classifier is clinically useful only if the constructed classifier maintains good performance even for MRI data scanned at an imaging site different from the site from which the training data was collected. It is useful and scientifically reliable.
これは撮像サイトにわたる、いわゆる汎化能力である。
This is a so-called generalization ability across imaging sites.
しかしながら、臨床応用では、異なるサイトで走査されたデータに、特定のサイトで取得したデータを使用して訓練された分類器を汎化することができないことはしばしば観測されている。
However, in clinical applications, it has often been observed that data scanned at different sites can not be generalized to trained classifiers using data acquired at a particular site.
この発明は、上記のような問題点を解決するためになされたものであって、その1つの目的は、脳の活動状態に対して、うつ症状の客観的な疾患ラベルの判別を実現することである。また、この発明の他の目的は、うつ症状に対する治療効果の程度を表す情報の判別を実現することである。この発明の他の目的は、うつ症状の状態を客観的に判別するためのバイオマーカーとしての指標値を出力する分類器を提供することである。この発明の他の目的は、うつ症状のレベルの判別を実現することである。この発明の他の目的は、うつ病患者の層別化を実現することである。
The present invention has been made to solve the above-mentioned problems, and one object of the present invention is to realize objective discrimination of disease labels of depressive symptoms with respect to brain activity. It is. Another object of the present invention is to realize discrimination of information indicating the degree of therapeutic effect on depressive symptoms. Another object of the present invention is to provide a classifier that outputs an index value as a biomarker for objectively determining the state of depressive symptoms. Another object of the invention is to realize the determination of the level of depressive symptoms. Another object of the invention is to achieve stratification of depressed patients.
本発明のある実施形態は、被検者におけるうつ症状の有無の判定を補助するための判別装置に関する。本実施形態の判別装置は、安静時において、健常者とうつ病患者を含む複数の参加者の各々の脳内の複数の所定領域における脳活動を示す信号を脳活動検知装置により時系列で予め測定した信号から分類器生成処理により生成された分類器を特定する情報を記憶するための記憶装置を備る。前記分類器は、前記複数の所定領域間の機能的結合のうちから機械学習により、うつ症状の疾患ラベルに関連するとして特徴選択により選択された複数の機能的結合の重み付け和に基づいて、前記うつ症状の疾患ラベルを判別するように生成される。前記選択された複数の機能的結合は、左背外側前頭前皮質と、左楔前部および左後部帯状皮質との間の第1の機能的結合、および左下前頭回弁蓋部と、右背内側前頭前皮質および右補足運動野との間の第2の機能的結合から選択される少なくとも1つを含む。本実施形態の判別装置は、演算装置をさらに備え、前記演算装置は、前記分類器により、被検者のうつ症状に対する分類結果を生成する判別処理を実行する。
One embodiment of the present invention relates to a determination apparatus for assisting determination of the presence or absence of depressive symptoms in a subject. The discrimination device of the present embodiment, when resting, uses signals representing brain activity in a plurality of predetermined regions in the brain of each of a plurality of participants including a healthy person and a depressed patient in advance in time series by the brain activity detection device A storage device is provided to store information for identifying a classifier generated by the classifier generation process from the measured signal. The classifier is based on a weighted sum of a plurality of functional combinations selected by feature selection as related to a disease label of depressive symptoms by machine learning out of functional connections among the plurality of predetermined areas. It is generated to determine the disease label of depressive symptoms. The selected plurality of functional connections are a first functional connection between the left dorsolateral prefrontal cortex and the anterior left and posterior cingulate cortex, and the lower left forehead valvular and the right back At least one selected from the second functional connection between the medial prefrontal cortex and the right supplemental motor area. The discrimination device of the present embodiment further includes an arithmetic device, and the arithmetic device executes discrimination processing for generating a classification result for depressive symptoms of a subject by the classifier.
本発明のある実施形態は、うつ症状のレベルの判別装置に関する。本実施形態の判別装置は、安静時において、健常者とうつ病患者を含む複数の参加者の各々の脳内の複数の所定領域における脳活動を示す信号を脳活動検知装置により時系列で予め測定した信号から分類器生成処理により生成された分類器を特定する情報を記憶するための記憶装置を備える。前記分類器は、前記複数の所定領域間の機能的結合のうちから機械学習により、うつ症状の疾患ラベルに関連するとして特徴選択により選択された複数の機能的結合の重み付け和に基づいて、前記うつ症状の疾患ラベルを判別するように生成する。前記選択された複数の機能的結合は、左背外側前頭前皮質と、左楔前部および左後部帯状皮質との間の第1の機能的結合、および左下前頭回弁蓋部と、右背内側前頭前皮質および右補足運動野との間の第2の機能的結合から選択される少なくとも1つを含む。本実施形態の判別装置は、演算装置をさらに備え、前記演算装置は、前記分類器により、安静時の被検者において計測された機能的結合の相関行列の要素について、うつ症状を評価するための指標値を生成する。前記演算装置は、前記指標値をあらかじめ前記機能的結合ごとにうつ症状のレベルに応じて設定された指標値の基準範囲と比較する。前記演算装置は、前記被検者が、前記指標値が含まれる基準範囲に対応するうつ症状のレベルであると決定する。
One embodiment of the present invention relates to a device for determining the level of depressive symptoms. The discrimination device of the present embodiment, when resting, uses signals representing brain activity in a plurality of predetermined regions in the brain of each of a plurality of participants including a healthy person and a depressed patient in advance in time series by the brain activity detection device A storage device is provided for storing information identifying the classifier generated by the classifier generation process from the measured signal. The classifier is based on a weighted sum of a plurality of functional combinations selected by feature selection as related to a disease label of depressive symptoms by machine learning out of functional connections among the plurality of predetermined areas. It is generated to determine the disease label of depressive symptoms. The selected plurality of functional connections are a first functional connection between the left dorsolateral prefrontal cortex and the anterior left and posterior cingulate cortex, and the lower left forehead valvular and the right back At least one selected from the second functional connection between the medial prefrontal cortex and the right supplemental motor area. The discrimination apparatus of the present embodiment further includes an arithmetic unit, and the arithmetic unit is used to evaluate depression symptoms of the elements of the correlation matrix of the functional connection measured in the subject at rest by the classifier. Generate index values for The computing device compares the index value to a reference range of index values set in advance according to the level of depression symptoms for each functional connection. The arithmetic device determines that the subject is the level of depression symptoms corresponding to a reference range in which the index value is included.
本発明のある実施形態は、被検者における治療効果の判定するための判別装置に関する。本実施形態の判別装置は、安静時において、健常者とうつ病患者を含む複数の参加者の各々の脳内の複数の所定領域における脳活動を示す信号を脳活動検知装置により時系列で予め測定した信号から分類器生成処理により生成された分類器を特定する情報を記憶するための記憶装置を備える。前記分類器は、前記複数の所定領域間の機能的結合のうちから機械学習により、うつ症状の疾患ラベルに関連するとして特徴選択により選択された複数の機能的結合の重み付け和に基づいて、前記うつ症状の疾患ラベルを判別するように生成される。前記選択された複数の機能的結合は、左背外側前頭前皮質と、左楔前部および左後部帯状皮質との間の第1の機能的結合、および左下前頭回弁蓋部と、右背内側前頭前皮質および右補足運動野との間の第2の機能的結合から選択される少なくとも1つを含む。本実施形態の判別装置は、演算装置をさらに備え、前記演算装置は、前記分類器により、第1の時点の被検者において安静時に計測された、機能的結合の相関行列の要素について、うつ症状を評価するための第1の値を生成する。前記演算装置は、前記分類器により、治療開始後であって第1の時点より後の第2の時点の前記被検者と同一の被検者の安静時の脳内における、前記機能的結合と同一の機能的結合の相関行列の要素についてうつ症状を評価する第2の値を生成する。前記演算装置は、前記第1の値と前記第2の値とを比較する。本実施形態の判別装置は、前記第2の値が前記第1の値よりも改善している場合に、前記治療が被検者のうつ症状の改善に有効であると決定する、及び/又は前記第2の値が前記第1の値よりも改善していない場合に、前記治療が被検者のうつ症状の改善に有効でないと決定する。
One embodiment of the present invention relates to a determination apparatus for determining a therapeutic effect in a subject. The discrimination device of the present embodiment, when resting, uses signals representing brain activity in a plurality of predetermined regions in the brain of each of a plurality of participants including a healthy person and a depressed patient in advance in time series by the brain activity detection device A storage device is provided for storing information identifying the classifier generated by the classifier generation process from the measured signal. The classifier is based on a weighted sum of a plurality of functional combinations selected by feature selection as related to a disease label of depressive symptoms by machine learning out of functional connections among the plurality of predetermined areas. It is generated to determine the disease label of depressive symptoms. The selected plurality of functional connections are a first functional connection between the left dorsolateral prefrontal cortex and the anterior left and posterior cingulate cortex, and the lower left forehead valvular and the right back At least one selected from the second functional connection between the medial prefrontal cortex and the right supplemental motor area. The determination apparatus of the present embodiment further includes an arithmetic unit, and the arithmetic unit is configured to calculate an element of the functional combination correlation matrix measured at rest in the subject at the first time point by the classifier. Generate a first value to assess the symptoms. The arithmetic device is configured to cause the classifier to perform the functional connection in the resting brain of the same subject as the subject at a second time point after the start of the treatment and after the first time point. And generate a second value that evaluates depressive symptoms for elements of the correlation matrix of the same functional connection. The arithmetic device compares the first value with the second value. The determination apparatus according to the present embodiment determines that the treatment is effective for the improvement of the depressive symptoms of the subject when the second value is improved compared to the first value, and / or If the second value does not improve more than the first value, it is determined that the treatment is not effective for the improvement of the depressive symptoms of the subject.
本発明のある実施形態は、うつ症状が予め設定された複数のサブクラスに層別化されている場合に、うつ病患者の層別化するための判別装置に関する。本実施形態の判定装置は、演算装置を備え、前記演算装置は、安静時の被検者において計測された機能的結合の相関行列の要素について、うつ症状を評価するための指標値を生成する。前記演算装置は、前記指標値を、あらかじめ前記機能的結合ごとに前記サブクラスに応じて設定された指標値の基準範囲と比較する。前記演算装置は、前記被検者が、前記指標値が含まれる基準範囲に対応する前記サブクラスであると決定する。
One embodiment of the present invention relates to a discrimination apparatus for stratification of depressed patients when depressive symptoms are stratified into a plurality of preset subclasses. The determination apparatus of the present embodiment includes an arithmetic unit, and the arithmetic unit generates an index value for evaluating depression symptoms for an element of a correlation matrix of functional connections measured in a subject at rest. . The arithmetic device compares the index value with a reference range of index values set in advance according to the subclass for each functional connection. The arithmetic device determines that the subject is the subclass corresponding to a reference range in which the index value is included.
本発明のある実施形態は、前記判別装置に上記処理を実行させるためのコンピュータプログラムに関する。
One embodiment of the present invention relates to a computer program for causing the determination device to execute the above process.
本発明のある実施形態は、うつ症状を有する被検者を判定することを補助する判別方法に関する。本実施形態の判別方法は、安静時の被検者において計測された機能的結合の相関行列の要素について、うつ症状を評価するための指標値を生成する工程を含む。前記機能的結合は、左背外側前頭前皮質と、左楔前部および左後部帯状皮質との間の第1の機能的結合、および左下前頭回弁蓋部と、右背内側前頭前皮質および右補足運動野との間の第2の機能的結合から選択される少なくとも一つを含む。本実施形態の判別方法は、前記指標値が基準値を超えた場合に、前記被検者がうつ症状を有すると決定する工程を含む。
One embodiment of the present invention relates to a determination method that assists in determining a subject having depressive symptoms. The determination method of the present embodiment includes the step of generating an index value for evaluating depressive symptoms for an element of the functional connection correlation matrix measured in the subject at rest. The functional connection is the first functional connection between the left dorsal lateral prefrontal cortex and the left anterior and left posterior cingulate cortex, and the lower left frontal valvular portion, the right dorsal medial prefrontal cortex and At least one selected from the second functional connection between the right supplementary motor area. The determination method of the present embodiment includes the step of determining that the subject has a depressive symptom when the index value exceeds a reference value.
本発明のある実施形態は、被検者においてうつ症状のレベルを判定することを補助するため判別方法に関する。本実施形態の判別方法は、安静時の被検者において計測された機能的結合の相関行列の要素について、うつ症状を評価するための指標値を生成する工程を備える。前記機能的結合は、左背外側前頭前皮質と、左楔前部および左後部帯状皮質との間の第1の機能的結合、および左下前頭回弁蓋部と、右背内側前頭前皮質および右補足運動野との間の第2の機能的結合から選択される少なくとも一つを含む。本実施形態の判別方法は、前記指標値を、あらかじめ前記機能的結合ごとにうつ症状のレベルに応じて設定された指標値の基準範囲と比較する工程と、前記被検者が、前記指標値が含まれる基準範囲に対応するうつ症状のレベルであると決定する工程とを含む。
One embodiment of the present invention relates to a determination method to assist in determining the level of depressive symptoms in a subject. The determination method of the present embodiment includes the step of generating an index value for evaluating depressive symptoms for the elements of the correlation matrix of the functional connection measured in the subject at rest. The functional connection is the first functional connection between the left dorsal lateral prefrontal cortex and the left anterior and left posterior cingulate cortex, and the lower left frontal valvular portion, the right dorsal medial prefrontal cortex and At least one selected from the second functional connection between the right supplementary motor area. In the determination method of the present embodiment, a step of comparing the index value with a reference range of the index value set in advance according to the level of depressive symptoms for each functional connection, and the subject's index value Determining that the level of depression symptoms corresponds to the reference range included.
本発明のある実施の形態は、被検者における治療効果の判定を補助するための判別方法に関する。本実施形態の判別方法は、第1の時点の被検者において安静時に計測された、機能的結合の相関行列の要素について、うつ症状を評価するための第1の値を生成する工程を備える。前記機能的結合は、左背外側前頭前皮質と、左楔前部および左後部帯状皮質との間の第1の機能的結合、および左下前頭回弁蓋部と、右背内側前頭前皮質および右補足運動野との間の第2の機能的結合から選択される少なくとも一つを含む。また、本実施形態の判別方法は、治療開始後であって第1の時点より後の第2の時点の前記被検者と同一の被検者の安静時の脳内における、前記機能的結合と同一の機能的結合の相関行列の要素ついてうつ症状を評価する第2の値を生成する工程を含む。本実施形態の判別方法は、前記第1の値と前記第2の値とを比較する工程と、前記第2の値が前記第1の値よりも改善している場合に、前記治療が被検者のうつ症状の改善に有効であると決定する工程と、を含む。
One embodiment of the present invention relates to a determination method for assisting determination of a treatment effect in a subject. The determination method of the present embodiment includes the step of generating a first value for evaluating depressive symptoms for an element of the functional connection correlation matrix measured at rest in the subject at a first time point. . The functional connection is the first functional connection between the left dorsal lateral prefrontal cortex and the left anterior and left posterior cingulate cortex, and the lower left frontal valvular portion, the right dorsal medial prefrontal cortex and At least one selected from the second functional connection between the right supplementary motor area. Further, according to the determination method of the present embodiment, the functional coupling in the brain of the same subject as the subject at the second time point after the start of the treatment and after the first time point is at rest Generating a second value for evaluating depressive symptoms for an element of the same functional connection correlation matrix. In the determination method of the present embodiment, in the step of comparing the first value with the second value, and when the second value is better than the first value, the treatment is not Determining that it is effective to improve the depressive symptoms of the examiner.
本発明のある実施の形態は、被検者における治療効果の判定を補助するための判別方法に関する。本実施形態の判別方法は、第1の時点の被検者において安静時に計測された、機能的結合の相関行列の要素について、うつ症状を評価するための第1の値を生成する工程を備える。前記機能的結合は、左背外側前頭前皮質と、左楔前部および左後部帯状皮質との間の第1の機能的結合、および左下前頭回弁蓋部と、右背内側前頭前皮質および右補足運動野との間の第2の機能的結合から選択される少なくとも一つを含む。本実施形態の判別方法は、治療開始後であって第1の時点より後の第2の時点の前記被検者と同一の被検者の安静時の脳内における、前記機能的結合と同一の機能的結合の相関行列の要素ついてうつ症状を評価する第2の値を生成する工程を含む。本実施形態の判別方法は、前記第1の値と前記第2の値とを比較する工程と、前記第2の値が前記第1の値よりも改善していない場合に、前記治療が被検者のうつ症状の改善に有効でないと決定する工程と、を含む。
One embodiment of the present invention relates to a determination method for assisting determination of a treatment effect in a subject. The determination method of the present embodiment includes the step of generating a first value for evaluating depressive symptoms for an element of the functional connection correlation matrix measured at rest in the subject at a first time point. . The functional connection is the first functional connection between the left dorsal lateral prefrontal cortex and the left anterior and left posterior cingulate cortex, and the lower left frontal valvular portion, the right dorsal medial prefrontal cortex and At least one selected from the second functional connection between the right supplementary motor area. The discrimination method of this embodiment is the same as the functional coupling in the resting brain of the same subject as the subject at the second time point after the start of the treatment and after the first time point. Generating a second value for assessing depressive symptoms for an element of the correlation matrix of functional connections of In the determination method of the present embodiment, in the step of comparing the first value and the second value, and in the case where the second value is not better than the first value, the treatment is not performed. Determining that it is not effective in improving the depressive symptoms of the examiner.
本発明のある実施の形態は、うつ病患者の層別化を補助するための判別方法に関する。本実施形態の判別方法は、うつ病が予め設定された複数のサブクラスに層別化されている場合に、安静時の被検者において計測された機能的結合の相関行列の要素について、うつ症状を評価するための指標値を生成する工程を備える。前記機能的結合は、左背外側前頭前皮質と、左楔前部および左後部帯状皮質との間の第1の機能的結合、および左下前頭回弁蓋部と、右背内側前頭前皮質および右補足運動野との間の第2の機能的結合から選択される少なくとも一つを含む。本実施形態の判別方法は、前記指標値を、あらかじめ前記機能的結合ごとに前記サブクラスに応じて設定された指標値の基準範囲と比較する工程と、前記被検者が、前記指標値が含まれる基準範囲に対応する前記サブクラスであると決定する工程と、を含む。
One embodiment of the present invention relates to a discrimination method for assisting the stratification of depressed patients. In the determination method of the present embodiment, when depression is stratified into a plurality of preset subclasses, depression symptoms of an element of a correlation matrix of functional connections measured in a subject at rest Generating an index value for evaluating. The functional connection is the first functional connection between the left dorsal lateral prefrontal cortex and the left anterior and left posterior cingulate cortex, and the lower left frontal valvular portion, the right dorsal medial prefrontal cortex and At least one selected from the second functional connection between the right supplementary motor area. The determination method of the present embodiment includes the step of comparing the index value with a reference range of the index value set in advance according to the subclass for each functional connection, and the subject includes the index value. Determining the subclass corresponding to the reference range to be determined.
本発明のある実施の形態は、うつ病患者の層別化を補助するための判別装置に関する。本実施形態の判別装置は、安静時において、健常者とうつ病患者を含む複数の参加者の各々の脳内の複数の所定領域における脳活動を示す信号を脳活動検知装置により時系列で予め測定した信号から分類器生成処理により生成された分類器を特定する情報を記憶するための記憶装置と、層別化処理を実行する演算装置とを備える。本実施形態の判別装置において、うつ症状が予め設定された複数のサブクラスに層別化されている場合に、前記分類器は、前記複数の所定領域間の機能的結合のうちから機械学習により、うつ病のサブクラスのラベルに関連するとして特徴選択により選択された複数の機能的結合の重み付け和に基づいて、前記選択された機能的結合に対応する判別対象の相関行列の要素に対して前記うつ病のサブクラスのラベルを判別するように生成される。前記選択された複数の機能的結合は、左背外側前頭前皮質と、左楔前部および左後部帯状皮質との間の第1の機能的結合、および左下前頭回弁蓋部と、右背内側前頭前皮質および右補足運動野との間の第2の機能的結合から選択される少なくとも1つを含む。前記演算装置は、前記重み付け和と前記判別対象の相関行列の要素から前記サブクラスを判別するための処理を実行する。
One embodiment of the present invention relates to a discriminator for assisting the stratification of depressed patients. The discrimination device of the present embodiment, when resting, uses signals representing brain activity in a plurality of predetermined regions in the brain of each of a plurality of participants including a healthy person and a depressed patient in advance in time series by the brain activity detection device A storage device for storing information for identifying a classifier generated by a classifier generation process from the measured signal, and an arithmetic device for executing a stratification process. In the discrimination device of the present embodiment, when the depressive symptoms are stratified into a plurality of preset subclasses, the classifier performs machine learning from among functional connections among the plurality of predetermined areas. The depression relative to the element of the correlation matrix to be discriminated corresponding to the selected functional combination based on the weighted sum of a plurality of functional combinations selected by feature selection as related to the label of the subclass of depression It is generated to determine the label of the disease subclass. The selected plurality of functional connections are a first functional connection between the left dorsolateral prefrontal cortex and the anterior left and posterior cingulate cortex, and the lower left forehead valvular and the right back At least one selected from the second functional connection between the medial prefrontal cortex and the right supplemental motor area. The arithmetic unit executes processing for determining the subclass from the weighted sum and the element of the correlation matrix to be determined.
本発明のある実施の形態は、うつ病患者における治療効果の判定を補助するための判別装置に関する。本実施形態の判別装置は、演算装置を備え、前記演算装置は、複数の対象者について、下記表1に示す機能的結合識別番号1~12から選択される複数の機能的結合の第1の時点の相関と治療開始後であって第1の時点よりも後の第2の時点の相関をそれぞれ計測して、前記複数の機能的結合の第1の時点と第2の時点の前記相関の差の各々で張られる相関状態空間において、前記複数の対象者において治療効果がみられた群と治療効果がみられない群とを識別する分類器を予め生成する分類器生成処理を実行する。前記演算装置は、第1の時点の被検者の安静時の脳内における、前記複数の機能的結合の第1の相関を計測し、第2の時点の前記被検者と同一の被検者の安静時の脳内における、前記複数の機能的結合の第2相関を計測する。前記演算装置は、前記被検者の前記複数の機能的結合の前記第2の相関と前記第1の相関との差に基づき、前記分類器により、前記被検者に対する治療効果を判別する。
One embodiment of the present invention relates to a discriminating apparatus for assisting in the determination of the therapeutic effect in a depressed patient. The determination apparatus of the present embodiment includes an arithmetic unit, and the arithmetic unit is the first of a plurality of functional combinations selected from functional combination identification numbers 1 to 12 shown in Table 1 below for a plurality of subjects. The correlation of the time point and the correlation of the second time point after the start of the treatment and later than the first time point are respectively measured, and the correlation of the first time point and the second time point of the plurality of functional combinations In the correlation state space spanned by each of the differences, a classifier generation process is performed to generate in advance a classifier that identifies a group in which the therapeutic effect is observed and a group in which the therapeutic effect is not observed in the plurality of subjects. The computing device measures a first correlation of the plurality of functional connections in the resting brain of a subject at a first time, and the same subject as the subject at a second time. Measuring a second correlation of the plurality of functional connections in the resting brain of the person. The arithmetic device determines the treatment effect on the subject by the classifier based on a difference between the second correlation and the first correlation of the plurality of functional combinations of the subject.
本発明のある実施の形態は、うつ病患者における治療効果の判定を補助するための判別方法に関する。本実施形態の判別方法は、複数の対象者について、下記表1に示す機能的結合識別番号1~12から選択される複数の機能的結合の第1の時点の相関と治療開始後であって第1の時点よりも後の第2の時点の相関をそれぞれ計測して、前記複数の機能的結合の第1の時点と第2の時点の前記相関の差の各々で張られる相関状態空間において、前記複数の対象者において治療効果がみられた群と治療効果がみられない群とを識別する分類器を予め生成する工程を備える。本実施形態の判別方法は、第1の時点の被検者の安静時の脳内における、前記複数の機能的結合の第1の相関を計測する工程と、第2の時点の前記被検者と同一の被検者の安静時の脳内における、前記複数の機能的結合の第2相関を計測する工程を備える。本実施形態の判別方法は、前記被検者の前記複数の機能的結合の前記第2の相関と前記第1の相関との差に基づき、前記分類器により、前記被検者に対する治療効果を判別する工程と、を含む。
One embodiment of the present invention relates to a determination method for assisting determination of treatment effect in depressed patients. The discrimination method of the present embodiment is the correlation between the first time point of the plurality of functional combinations selected from the functional combination identification numbers 1 to 12 shown in the following Table 1 and the start of the treatment for a plurality of subjects. In the correlation state space spanned by each of the differences in the correlation between the first and second time points of the plurality of functional connections, respectively measuring the correlation at the second time point after the first time point The method may further include the step of generating in advance a classifier that identifies a group in which the therapeutic effect is observed and a group in which the therapeutic effect is not observed in the plurality of subjects. The determination method of the present embodiment includes the steps of: measuring a first correlation of the plurality of functional connections in the brain at rest of the subject at a first time; and the subject at a second time Measuring a second correlation of the plurality of functional connections in the resting brain of the same subject. In the determination method of the present embodiment, the classifier performs the treatment effect on the subject based on the difference between the second correlation and the first correlation of the plurality of functional combinations of the subject. And a determining step.
本発明のある実施の形態は、安静時において、健常者とうつ病患者を含む複数の参加者の各々の脳内の複数の所定領域における脳活動を示す信号を脳活動検知装置により時系列で予め測定した信号から分類器生成処理により生成された分類器を、被検者におけるうつ症状の有無の判定またはうつ症状のレベルの判定を補助するために使用する方法に関する。前記使用方法は、前記複数の所定領域間の機能的結合のうちから機械学習により、うつ症状の疾患ラベルに関連するとして特徴選択により選択された複数の機能的結合の重み付け和に基づいて、前記うつ症状の疾患ラベルを判別する前記分類器を生成する工程を備える。前記選択された複数の機能的結合は、左背外側前頭前皮質と、左楔前部および左後部帯状皮質との間の第1の機能的結合、および左下前頭回弁蓋部と、右背内側前頭前皮質および右補足運動野との間の第2の機能的結合から選択される少なくとも1つを含む。前記使用方法は、前記分類器に被検者の前記複数の機能的結合の相関行列の要素から生成された指標値を入力する工程をさらに備える。
According to an embodiment of the present invention, at rest, a signal indicating brain activity in a plurality of predetermined regions in a brain of each of a plurality of participants including a healthy person and a depressed patient is time-series by a brain activity detection device The present invention relates to a method of using a classifier generated by classifier generation processing from a signal measured in advance to determine the presence or absence of depressive symptoms or to determine the level of depressive symptoms in a subject. The method of using is based on a weighted sum of a plurality of functional combinations selected by feature selection as being related to a disease label of depressive symptoms by machine learning out of functional connections among the plurality of predetermined areas. Generating the classifier for determining the disease label of the depressive condition. The selected plurality of functional connections are a first functional connection between the left dorsolateral prefrontal cortex and the anterior left and posterior cingulate cortex, and the lower left forehead valvular and the right back At least one selected from the second functional connection between the medial prefrontal cortex and the right supplemental motor area. The use method may further comprise the step of inputting into the classifier an index value generated from an element of the correlation matrix of the plurality of functional combinations of the subject.
本発明のある実施の形態は、安静時において、健常者とうつ病患者を含む複数の参加者の各々の脳内の複数の所定領域における脳活動を示す信号を脳活動検知装置により時系列で予め測定した信号から分類器生成処理により生成された分類器を、うつ症状の治療の効果の判定を補助するために使用する方法に関する。前記使用方法は、前記複数の所定領域間の機能的結合のうちから機械学習により、うつ症状の疾患ラベルに関連するとして特徴選択により選択された複数の機能的結合の重み付け和に基づいて、前記うつ症状の疾患ラベルを判別する前記分類器を生成する工程を備える。前記選択された複数の機能的結合は、左背外側前頭前皮質と、左楔前部および左後部帯状皮質との間の第1の機能的結合、および左下前頭回弁蓋部と、右背内側前頭前皮質および右補足運動野との間の第2の機能的結合から選択される少なくとも1つを含む。前記使用方法は、前記分類器に被検者の前記複数の機能的結合の相関行列の要素から生成された指標値を入力する工程をさらに備える。
According to an embodiment of the present invention, at rest, a signal indicating brain activity in a plurality of predetermined regions in a brain of each of a plurality of participants including a healthy person and a depressed patient is time-series by a brain activity detection device The present invention relates to a method of using a classifier generated by a classifier generation process from previously measured signals to assist in the determination of the effect of treatment of depressive symptoms. The method of using is based on a weighted sum of a plurality of functional combinations selected by feature selection as being related to a disease label of depressive symptoms by machine learning out of functional connections among the plurality of predetermined areas. Generating the classifier for determining the disease label of the depressive condition. The selected plurality of functional connections are a first functional connection between the left dorsolateral prefrontal cortex and the anterior left and posterior cingulate cortex, and the lower left forehead valvular and the right back At least one selected from the second functional connection between the medial prefrontal cortex and the right supplemental motor area. The use method may further comprise the step of inputting into the classifier an index value generated from an element of the correlation matrix of the plurality of functional combinations of the subject.
本発明のある実施の形態は、うつ症状が予め設定された複数のサブクラスに層別化されている場合に、安静時において、健常者とうつ病患者を含む複数の参加者の各々の脳内の複数の所定領域における脳活動を示す信号を脳活動検知装置により時系列で予め測定した信号から分類器生成処理により生成された分類器を、被検者を前記サブクラスに層別化することを補助するために使用する方法に関する。前記分類器は、前記複数の所定領域間の機能的結合のうちから機械学習により、うつ症状の疾患ラベルに関連するとして特徴選択により選択された複数の機能的結合の重み付け和に基づいて、前記うつ症状の疾患ラベルを判別するように生成される。前記選択された複数の機能的結合は、左背外側前頭前皮質と、左楔前部および左後部帯状皮質との間の第1の機能的結合、および左下前頭回弁蓋部と、右背内側前頭前皮質および右補足運動野との間の第2の機能的結合から選択される少なくとも1つを含む。前記使用方法は、前記分類器に被検者の前記複数の機能的結合の相関行列の要素から生成された指標値を入力する工程を含む。
In one embodiment of the present invention, when depression symptoms are stratified into a plurality of preset subclasses, at rest, the brains of each of a plurality of participants including a healthy person and a depressed patient. To classify the classifier generated by the classifier generation process from the signal indicating the brain activity in a plurality of predetermined regions in advance in time series by the brain activity detection device, and stratifiing the subject into the subclass It relates to the method used to assist. The classifier is based on a weighted sum of a plurality of functional combinations selected by feature selection as related to a disease label of depressive symptoms by machine learning out of functional connections among the plurality of predetermined areas. It is generated to determine the disease label of depressive symptoms. The selected plurality of functional connections are a first functional connection between the left dorsolateral prefrontal cortex and the anterior left and posterior cingulate cortex, and the lower left forehead valvular and the right back At least one selected from the second functional connection between the medial prefrontal cortex and the right supplemental motor area. The method of use comprises the step of inputting into the classifier index values generated from elements of the correlation matrix of the plurality of functional combinations of the subject.
本発明のある実施の形態は、被検者における治療効果の判定を補助するための判別装置に関する。前記判別装置は、安静時において、健常者とうつ病患者を含む複数の参加者の各々の脳内の複数の所定領域における脳活動を示す信号を脳活動検知装置により時系列で予め測定した信号から第1の分類器を生成する第1の演算装置を含む分類器生成装置を備る。前記第1の分類器は、前記複数の所定領域間の機能的結合のうちから機械学習により、うつ症状の疾患ラベルに関連するとして特徴選択により選択された複数の機能的結合の重み付け和に基づいて、前記うつ症状の疾患ラベルを判別するように生成される。前記選択された複数の機能的結合は、左背外側前頭前皮質と、左楔前部および左後部帯状皮質との間の第1の機能的結合、および左下前頭回弁蓋部と、右背内側前頭前皮質および右補足運動野との間の第2の機能的結合から選択される少なくとも1つを含む。前記第1の演算装置は、複数の対象者について、下記表5に示す機能的結合識別番号1~12から選択される複数の機能的結合の第1の時点の相関と治療開始後であって第1の時点よりも後の第2の時点の相関をそれぞれ計測して、前記複数の機能的結合の第1の時点と第2の時点の前記相関の差の各々で張られる相関状態空間において、前記複数の対象者において治療効果がみられた群と治療効果がみられない群とを識別する第2の分類器を生成する。前記判別装置は、第2の演算装置と記憶装置を含む層別化装置をさらに備る。前記記憶装置は、前記第1および第2の分類器の情報と、うつ症状が予め設定された複数のサブクラスに層別化するための情報とを記憶する。前記第2の演算装置は、前記第1の分類器を用いて、被検者を前記サブクラスに層別化処理を実行する。前記第2の演算装置は、前記層別化処理によって特定のサブクラスに層別化された被検者について、第1の時点の安静時の前記複数の機能的結合の第1の相関を計測するための処理を実行する。前記第2の演算装置は、第2の時点の前記被検者と同一の被検者の安静時の前記複数の機能的結合の第2相関を計測するための処理を実行する。前記第2の演算装置は、前記被検者の前記複数の機能的結合の前記第2の相関と前記第1の相関との差に基づき、前記第2の分類器により、前記被検者に対する治療効果を判別する。
One embodiment of the present invention relates to a determination apparatus for assisting determination of a treatment effect in a subject. The discrimination device is a signal obtained by measuring in advance a signal indicating brain activity in a plurality of predetermined regions in the brain of each of a plurality of participants including a healthy person and a depressed patient at rest at a time series. , And a classifier generating device including a first computing device for generating a first classifier. The first classifier is based on a weighted sum of a plurality of functional combinations selected by feature selection as related to a disease label of depressive symptoms by machine learning out of functional connections among the plurality of predetermined areas. Are generated to determine the disease label of the depressive symptoms. The selected plurality of functional connections are a first functional connection between the left dorsolateral prefrontal cortex and the anterior left and posterior cingulate cortex, and the lower left forehead valvular and the right back At least one selected from the second functional connection between the medial prefrontal cortex and the right supplemental motor area. The first arithmetic unit is for the plurality of subjects, after correlation of the first time point of the plurality of functional combinations selected from the functional combination identification numbers 1 to 12 shown in Table 5 below and after the start of the treatment In the correlation state space spanned by each of the differences in the correlation between the first and second time points of the plurality of functional connections, respectively measuring the correlation at the second time point after the first time point Generating a second classifier that identifies a group with therapeutic effects and a group without therapeutic effects in the plurality of subjects. The determining device further comprises a stratification device including a second computing device and a storage device. The storage device stores information of the first and second classifiers and information for stratification of depressive symptoms into a plurality of preset subclasses. The second arithmetic unit performs a stratification process on the subject into the subclasses using the first classifier. The second arithmetic unit measures a first correlation of the plurality of functional connections at rest at a first time point, for the subject stratified into a specific subclass by the stratification process. Execute processing for The second arithmetic unit executes a process for measuring a second correlation of the plurality of functional connections at rest of the same subject as the subject at a second time point. The second computing device is configured to send the subject to the subject by the second classifier based on a difference between the first correlation and the second correlation of the plurality of functional combinations of the subject. Determine the treatment effect.
本発明のある実施の形態は、被検者における治療効果の判定を補助するための判別方法に関する。本実施形態の判別方法は、うつ症状が予め設定された複数のサブクラスに層別化されている場合に、安静時において、健常者とうつ病患者を含む複数の参加者の各々の脳内の複数の所定領域における脳活動を示す信号を脳活動検知装置により時系列で予め測定した信号から第1の分類器生成処理によって生成された第1の分類器を使用して、被検者を前記サブクラスに層別化する層別化工程を含む。本実施形態の判別方法は、前記第1の分類器は、前記複数の所定領域間の機能的結合のうちから機械学習により、うつ症状の疾患ラベルに関連するとして特徴選択により選択された複数の機能的結合の重み付け和に基づいて、前記うつ症状の疾患ラベルを判別するように生成される。前記選択された複数の機能的結合は左背外側前頭前皮質と、左楔前部および左後部帯状皮質との間の第1の機能的結合、および左下前頭回弁蓋部と、右背内側前頭前皮質および右補足運動野との間の第2の機能的結合から選択される少なくとも1つを含む。本実施形態の判別方法は、前記層別化工程によって特定のサブクラスに層別化された被検者について、投薬前の安静時の前記複数の機能的結合の第1の相関を計測する第1の相関計測工程と、投薬開始から所定期間経過後の前記被検者と同一の被検者の安静時の前記複数の機能的結合の第2相関を計測する第2の相関計測工程とを含む。本実施形態の判別方法は、特定のサブクラスに分類された前記被検者に対する薬効を第2の分類器を用いて判別する判別工程であって、前記第2の分類器は、複数の対象者について、下記表1に示す機能的結合識別番号1~12から選択される複数の機能的結合の第1の時点の相関と投薬後であって第1の時点よりも後の第2の時点の相関をそれぞれ計測する。そして、前記複数の機能的結合の第1の時点と第2の時点の前記相関の差の各々で張られる相関状態空間において、前記複数の対象者において治療効果がみられた群と治療効果がみられない群とを識別する第2の分類器生成処理によって予め生成され前記被検者の前記複数の機能的結合の前記第2の相関と前記第1の相関との差に基づき、前記被検者に対する薬効を判別する、判別工程と、を備える。
One embodiment of the present invention relates to a determination method for assisting determination of a treatment effect in a subject. According to the determination method of the present embodiment, in the case where depression symptoms are stratified into a plurality of preset subclasses, at rest, in the brain of each of a plurality of participants including a healthy person and a depressed patient. The subject is detected using a first classifier generated by a first classifier generation process from signals measured beforehand in time series by the brain activity detection device as signals indicating brain activity in a plurality of predetermined regions. Includes stratification steps to stratify into subclasses. In the determination method of the present embodiment, the first classifier is selected from a plurality of functional connections among the plurality of predetermined regions by machine learning as being related to a disease label of depressive symptoms by a plurality of feature selections. Based on the weighted sum of functional binding, it is generated to determine the disease label of the depressive symptoms. The selected plurality of functional connections are a first functional connection between the left dorsolateral prefrontal cortex and the left anterior and left posterior cingulate cortex, and the lower left frontal fornix and the right dorsomedia And at least one selected from a second functional connection between the prefrontal cortex and the right supplementary motor area. The determination method of the present embodiment measures, for a subject stratified into a specific subclass by the stratification step, a first method of measuring a first correlation of the plurality of functional connections at rest before administration. And a second correlation measurement step of measuring a second correlation of the plurality of functional connections at rest of the same subject as the subject after a predetermined period has elapsed from the start of dosing. . The determination method of the present embodiment is a determination step of determining the efficacy of the subject classified into a specific subclass using a second classifier, wherein the second classifier includes a plurality of subjects. The correlation between the first time point of the plurality of functional bindings selected from the functional binding identification numbers 1 to 12 shown in Table 1 below and the second time point after administration and after the first time point Measure each correlation. Then, in the correlation state space spanned by each of the differences in the correlation at the first time point and the second time point of the plurality of functional connections, the group and the treatment effect in which the treatment effect is observed in the plurality of subjects The object based on the difference between the second correlation and the first correlation of the plurality of functional combinations of the subject generated in advance by a second classifier generation process for identifying an unidentified group. And a discrimination step of discriminating a medicinal effect on an examiner.
本発明のある実施の形態は、演算装置と、記憶装置とを備えた第1の分類器生成装置に関する。前記演算装置は、安静時において、健常者とうつ病患者を含む複数の参加者の各々の脳内の複数の所定領域における脳活動を示す信号を脳活動検知装置により時系列で予め測定した信号から分類器を特定する情報を生成する。前記分類器は、前記複数の所定領域間の機能的結合のうちから機械学習により、うつ症状の疾患ラベルに関連するとして特徴選択により選択された複数の機能的結合の重み付け和に基づいて、前記うつ症状の疾患ラベルを判別するように生成される。前記選択された複数の機能的結合は、左背外側前頭前皮質と、左楔前部および左後部帯状皮質との間の第1の機能的結合、および左下前頭回弁蓋部と、右背内側前頭前皮質および右補足運動野との間の第2の機能的結合から選択される少なくとも1つを含む。前記記憶装置は、前記演算装置によって生成された前記第1の分類器を特定する情報を記憶する。
One embodiment of the present invention relates to a first classifier generation device including an arithmetic device and a storage device. The arithmetic device is a signal obtained by measuring in advance a signal indicating brain activity in a plurality of predetermined regions in the brain of each of a plurality of participants including a healthy person and a depressed patient at rest at a time series. To generate information identifying the classifier. The classifier is based on a weighted sum of a plurality of functional combinations selected by feature selection as related to a disease label of depressive symptoms by machine learning out of functional connections among the plurality of predetermined areas. It is generated to determine the disease label of depressive symptoms. The selected plurality of functional connections are a first functional connection between the left dorsolateral prefrontal cortex and the anterior left and posterior cingulate cortex, and the lower left forehead valvular and the right back At least one selected from the second functional connection between the medial prefrontal cortex and the right supplemental motor area. The storage device stores information identifying the first classifier generated by the arithmetic device.
本発明のある実施の形態は、第1の分類器の生成方法に関する。本実施形態では、安静時において、健常者とうつ病患者を含む複数の参加者の各々の脳内の複数の所定領域における脳活動を示す信号を脳活動検知装置により時系列で予め測定した信号から分類器生成処理により第1の分類器を生成する。前記第1の分類器は、前記複数の所定領域間の機能的結合のうちから機械学習により、うつ症状の疾患ラベルに関連するとして特徴選択により選択された複数の機能的結合の重み付け和に基づいて、前記うつ症状の疾患ラベルを判別するように生成される。前記機能的結合は、左背外側前頭前皮質と、左楔前部および左後部帯状皮質との間の第1の機能的結合、および左下前頭回弁蓋部と、右背内側前頭前皮質および右補足運動野との間の第2の機能的結合から選択される少なくとも一つを含む。
One embodiment of the present invention relates to a method of generating a first classifier. In the present embodiment, at rest, signals indicating brain activity in a plurality of predetermined regions in the brain of each of a plurality of participants including a healthy person and a depressed patient are measured in advance by a brain activity detection device in time series. To generate a first classifier by a classifier generation process. The first classifier is based on a weighted sum of a plurality of functional combinations selected by feature selection as related to a disease label of depressive symptoms by machine learning out of functional connections among the plurality of predetermined areas. Are generated to determine the disease label of the depressive symptoms. The functional connection is the first functional connection between the left dorsal lateral prefrontal cortex and the left anterior and left posterior cingulate cortex, and the lower left frontal valvular portion, the right dorsal medial prefrontal cortex and At least one selected from the second functional connection between the right supplementary motor area.
本発明のある実施の形態は、演算装置と、記憶装置とを備えた第2の分類器生成装置に関する。前記演算装置は、複数の対象者について、下記表3に示す機能的結合識別番号1~12から選択される複数の機能的結合の第1の時点の相関と治療開始後であって第1の時点よりも後の第2の時点の相関をそれぞれ計測する。本実施形態は、前記複数の機能的結合の第1の時点と第2の時点の前記相関の差の各々で張られる相関状態空間において、前記複数の対象者において治療効果がみられた群と治療効果がみられない群とを識別する第2の分類器を生成する。前記記憶装置は、前記演算装置によって生成された前記第2の分類器を特定するための情報を記憶する。
One embodiment of the present invention relates to a second classifier generation device including an arithmetic device and a storage device. The computing device is configured to compare the correlation between the first points of time of the plurality of functional combinations selected from the functional combination identification numbers 1 to 12 shown in the following Table 3 and the start of the treatment for the plurality of subjects. The correlations at the second point in time after the point in time are respectively measured. The present embodiment is a group in which a plurality of subjects show therapeutic effects in a correlation state space spanned by each of the differences in the correlation between the first time point and the second time point of the plurality of functional connections. A second classifier is generated that distinguishes the group from which no therapeutic effect is seen. The storage device stores information for identifying the second classifier generated by the arithmetic device.
本発明のある実施の形態は、第2の分類器生成方法に関する。本実施形態では、複数の対象者について、下記表4に示す機能的結合識別番号1~12から選択される複数の機能的結合の第1の時点の相関と治療開始後であって第1の時点よりも後の第2の時点の相関をそれぞれ計測する。本実施形態は、前記複数の機能的結合の第1の時点と第2の時点の前記相関の差の各々で張られる相関状態空間において、前記複数の対象者において治療効果がみられた群と治療効果がみられない群とを識別する分類器を予め生成する工程を備える。
One embodiment of the present invention relates to a second classifier generation method. In this embodiment, the correlation between the first point of time of the plurality of functional bindings selected from the functional binding identification numbers 1 to 12 shown in the following Table 4 and the start of the treatment for the plurality of subjects is a first The correlations at the second point in time after the point in time are respectively measured. The present embodiment is a group in which a plurality of subjects show therapeutic effects in a correlation state space spanned by each of the differences in the correlation between the first time point and the second time point of the plurality of functional connections. There is a step of generating in advance a classifier that identifies a group in which no therapeutic effect is observed.
本発明のある実施の形態は、脳活動検知装置と、提示装置と、演算装置と、記憶装置とを備えた脳活動訓練装置に関する。本実施形態において、前記脳活動検知装置は、ニューロフィードバック訓練の被訓練者の脳内の複数の所定領域における脳活動を示す信号を時系列で検知し、前記記憶装置は、安静時において、健常者とうつ病患者を含む複数の参加者の各々の脳内の複数の所定領域における脳活動を示す信号を時系列で予め測定した信号に基づいて、前記複数の所定領域間の機能的結合から機械学習により、うつ症状の疾患ラベルを判別するために特徴選択により選択された複数の機能的結合のうち訓練対象の機能的結合を特定する情報と、ニューロフィードバック訓練における前記訓練対象の機能的結合の目標パターンと、を格納し、前記演算装置は、前記脳活動検知装置により検知された信号から、前記訓練対象の機能的結合の時間相関を所定期間について算出し、算出された前記時間相関に基づいて、前記目標パターンとの近似度に応じて、報酬値を算出し、前記報酬値の大きさを示す情報を前記被訓練者に対して前記提示装置を介して提示する、ニューロフィードバック訓練の処理を実行する、ように構成される。ここで、前記訓練対象の機能的結合は、左背外側前頭前皮質と、左楔前部および左後部帯状皮質との間の第1の機能的結合を含み、前記被訓練者の脳内の複数の所定領域のそれぞれは、前記複数の参加者における脳内の複数の所定領域にそれぞれ対応する。
One embodiment of the present invention relates to a brain activity training device provided with a brain activity detection device, a presentation device, a computing device, and a storage device. In the present embodiment, the brain activity detection device detects signals indicating brain activity in a plurality of predetermined regions in the brain of the trainee of the neuro feedback training in time series, and the storage device is healthy at rest From the functional connection between the plurality of predetermined areas, based on the signal indicating the brain activity in a plurality of predetermined areas in the brain of each of the plurality of participants including the person and the depressed patient in advance in time series Information identifying the functional connection of the training object among the plurality of functional connections selected by feature selection to distinguish the disease label of depressive symptoms by machine learning, and the functional connection of the training object in neurofeedback training Storing the target pattern of the target object, and the arithmetic unit generates temporal correlation of the functional combination of the training object for a predetermined period from the signal detected by the brain activity detector. Calculation and calculating a reward value according to the degree of approximation with the target pattern based on the calculated time correlation, and presenting the information indicating the magnitude of the reward value to the trainee It is configured to perform a process of neuro feedback training presented via the device. Here, the functional connection of the training object includes a first functional connection between the left dorsolateral prefrontal cortex and the anterior left and posterior caudal cortex, and in the brain of the trainee Each of the plurality of predetermined regions corresponds to a plurality of predetermined regions in the brain of the plurality of participants.
本発明のある実施の形態は、脳活動検知装置と、提示装置と、演算装置と、記憶装置と、を備える脳活動訓練装置の制御方法に関する。本実施懈怠において、前記脳活動検知装置は、ニューロフィードバック訓練の被訓練者の脳内の複数の所定領域における脳活動を示す信号を時系列で検知し、前記記憶装置は、安静時において、健常者とうつ病患者を含む複数の参加者の各々の脳内の複数の所定領域における脳活動を示す信号を時系列で予め測定した信号に基づいて、前記複数の所定領域間の機能的結合から機械学習により、うつ症状の疾患ラベルを判別するために特徴選択により選択された複数の機能的結合のうち訓練対象の機能的結合を特定する情報と、ニューロフィードバック訓練における前記訓練対象の機能的結合の目標パターンとを格納し、前記脳活動検知装置により、前記ニューロフィードバック訓練の被訓練者の脳内の複数の所定領域における脳活動を示す信号を時系列で検知する工程と、前記演算装置が、前記脳活動検知装置により検知された信号から、前記訓練対象の機能的結合の時間相関を所定期間について算出する工程と、前記演算装置が、算出された前記時間相関に基づいて、前記目標パターンとの近似度に応じて、報酬値を算出する工程と、前記演算装置が、前記報酬値の大きさを示す情報を前記提示装置により前記被訓練者に対して提示する工程と、を備える。ここで、前記訓練対象の機能的結合は、左背外側前頭前皮質と、左楔前部および左後部帯状皮質との間の第1の機能的結合を含み、前記被訓練者の脳内の複数の所定領域のそれぞれは、前記複数の参加者における脳内の複数の所定領域にそれぞれ対応する。
One embodiment of the present invention relates to a control method of a brain activity training device including a brain activity detection device, a presentation device, an arithmetic device, and a storage device. In the present embodiment, the brain activity detection device detects signals indicating brain activity in a plurality of predetermined regions in the brain of the trainee of the neuro feedback training in time series, and the storage device is healthy at rest From the functional connection between the plurality of predetermined areas, based on the signal indicating the brain activity in a plurality of predetermined areas in the brain of each of the plurality of participants including the person and the depressed patient in advance in time series Information identifying the functional connection of the training object among the plurality of functional connections selected by feature selection to distinguish the disease label of depressive symptoms by machine learning, and the functional connection of the training object in neurofeedback training And storing the target pattern of the target and the brain activity detecting device to indicate brain activity in a plurality of predetermined regions in the brain of the trainee of the neuro feedback training. Detecting in chronological order, calculating the time correlation of the functional combination of the training object for a predetermined period from the signal detected by the brain activity detecting device, and the calculating device. Calculating a reward value according to the degree of similarity with the target pattern based on the calculated time correlation; and the computing device using the presentation device to display information indicating the magnitude of the reward value. Presenting to the trainee. Here, the functional connection of the training object includes a first functional connection between the left dorsolateral prefrontal cortex and the anterior left and posterior caudal cortex, and in the brain of the trainee Each of the plurality of predetermined regions corresponds to a plurality of predetermined regions in the brain of the plurality of participants.
この発明によれば、脳の活動状態に対してうつ症状の状態に対する指標を客観的に判別する判別装置及び判別方法を提供することができる。この発明によれば、うつ症状に対する治療効果の程度を表す情報を客観的に判別することができる。この発明によれば、うつ症状を客観的に判別するためのバイオマーカーとしての指標値を出力する分類器を提供することができる。この発明によれば、うつ症状のレベルを判別することができる。この発明によれば、うつ病患者を客観的に層別化することができる。
この発明によれば、ニューロフィードバック訓練を行うことができる。 According to the present invention, it is possible to provide a discrimination apparatus and discrimination method for objectively discriminating an index for the state of depression symptoms with respect to the brain activity state. According to the present invention, it is possible to objectively determine information representing the degree of therapeutic effect on depressive symptoms. According to the present invention, it is possible to provide a classifier that outputs an index value as a biomarker for objectively determining depressive symptoms. According to this invention, the level of depressive symptoms can be determined. According to the present invention, a depressed patient can be objectively stratified.
According to the present invention, neuro feedback training can be performed.
以下、本発明の実施の形態について、図に従って説明する。なお、以下の実施の形態において、同じ符号を付した構成要素および処理工程は、同一または相当するものであり、必要でない場合は、その説明は繰り返さない。
Hereinafter, embodiments of the present invention will be described with reference to the drawings. In the following embodiments, components and processing steps denoted by the same reference numerals are the same or equivalent, and the description thereof will not be repeated if not required.
1.用語の説明
本発明において、うつ症状には、抑うつ気分;興味や関心の低下;気力の低下;焦燥;制止;思考力、集中力、又は決断力の減退;無価値感、又は罪責感;自殺、自殺念慮、又は自殺企画;病的思考内容;妄想;身体症状(全身倦怠感、頭痛、頭重、又は腰痛等の身体諸所の痛み、動悸、息切れ、食欲減退、又は体重減少等)、睡眠障害から選択される少なくとも一種が含まれる。好ましくは、前記うつ症状には、精神障害の診断と統計マニュアル(DSM)-IVの基準の大うつ病性障害(MDD)に伴う症状が含まれる。 1. Explanation of terms In the present invention, depressive symptoms include: depressive mood; decreased interest or concern; decreased vigor; frustration; inhibition; diminished thinking ability, concentration ability or determination ability; sense of worthlessness or guilt; , Suicidal ideation or suicide planning; morbid thinking content; delusions; physical symptoms (such as general fatigue, headache, headache, back pain, etc. pain in the body, palpitations, shortness of breath, loss of appetite, weight loss etc.), sleep At least one type selected from faults is included. Preferably, the depressive symptoms include symptoms associated with Major Depressive Disorder (MDD) in the Diagnostic and Statistical Manual of Mental Disorders (DSM) -IV criteria.
本発明において、うつ症状には、抑うつ気分;興味や関心の低下;気力の低下;焦燥;制止;思考力、集中力、又は決断力の減退;無価値感、又は罪責感;自殺、自殺念慮、又は自殺企画;病的思考内容;妄想;身体症状(全身倦怠感、頭痛、頭重、又は腰痛等の身体諸所の痛み、動悸、息切れ、食欲減退、又は体重減少等)、睡眠障害から選択される少なくとも一種が含まれる。好ましくは、前記うつ症状には、精神障害の診断と統計マニュアル(DSM)-IVの基準の大うつ病性障害(MDD)に伴う症状が含まれる。 1. Explanation of terms In the present invention, depressive symptoms include: depressive mood; decreased interest or concern; decreased vigor; frustration; inhibition; diminished thinking ability, concentration ability or determination ability; sense of worthlessness or guilt; , Suicidal ideation or suicide planning; morbid thinking content; delusions; physical symptoms (such as general fatigue, headache, headache, back pain, etc. pain in the body, palpitations, shortness of breath, loss of appetite, weight loss etc.), sleep At least one type selected from faults is included. Preferably, the depressive symptoms include symptoms associated with Major Depressive Disorder (MDD) in the Diagnostic and Statistical Manual of Mental Disorders (DSM) -IV criteria.
本発明において、うつ病は、前記うつ症状を伴う限り制限されないが、好ましくはMDDである。MDDには、メランコリー型MDD、非メランコリー型MDD及び治療抵抗性MDDが含まれる。本明細書においては、MDDを単にうつ病と呼ぶことがある。
In the present invention, depression is not limited as long as it has the above-mentioned depressive symptoms, but is preferably MDD. MDDs include melancholic MDD, non-melancholic MDD and refractory MDD. In the present specification, MDD may be referred to simply as depression.
抑うつの程度の評価には、たとえば、従来から、自己申告によるBeck Depression Inventory(ベックうつ病調査表)による評価が、診察時のスクリーニングや面接時の補助資料として利用されている。また、医師用の評価尺度として使用されるハミルトンうつ病評価尺度(HDRS:Hamilton Depression Rating Scale)は、うつ病の指標を提供する多重項目質問票であり、回復を評価する指標となる。略称は、HAM-Dである。
For the evaluation of the degree of depression, for example, an evaluation by the self-reported Beck Depression Inventory (Beck Depression Survey Table) is conventionally used as a supplementary material at screening and interviewing at the time of medical examination. In addition, the Hamilton Depression Rating Scale (HDRS), which is used as a rating scale for physicians, is a multi-item questionnaire that provides an index of depression, and serves as an index for evaluating recovery. The abbreviation is HAM-D.
本発明において、被検者は、制限されないが、前記うつ症状を有する者であることが好ましい。年齢及び性別は制限されない。前記被検者は、前記うつ症状を改善するための治療を受けていない者であっても、前記治療を受けている者であってもよい。
In the present invention, the subject is preferably, but not limited to, a person having the depressive symptoms. Age and gender are not limited. The subject may be one who has not received treatment for improving the depressive symptoms or one who has received the treatment.
うつ症状を改善するための治療には、投薬療法、ニューロフィードバック療法、修正型電気けいれん療法および反復経頭蓋磁気刺激療法から選択される少なくとも一種が含まれる。投薬される薬剤としては、三環系抗うつ薬(イミプラミン、トリミプラミン、クロミプラミン、アミトリプチリン、ノルトリプチリン、アモキサピン、ロフェプラミン、及びドスレピン等)、四環系抗うつ薬(マプロチリン、アミンセリン、及びセチプチリン等)、トラゾドン、選択的セロトニン再取り込み阻害薬(エスシタロプラム、フルボキサミン、パロキセチン、及びセルトリラリン等)、セロトニン-ノルエピネフリン再取り込み阻害剤(ミルナシプラン、及びデュロキセチン等)、ノルアドレナリン・セロトニン作動性抗うつ剤(ミルタザピン等)、及びベンザミド系薬剤(スルピリド等)から選択される少なくとも一種を挙げることができる。
Treatment to ameliorate depressive symptoms includes at least one selected from medication, neurofeedback therapy, modified electroconvulsive therapy and repetitive transcranial magnetic stimulation therapy. Drugs to be administered include tricyclic antidepressants (imipramine, trimipramine, clomipramine, amitriptyline, nortriptyline, amoxapine, lofepramine, and doslepin), tetracyclic antidepressants (maprotiline, aminserine, cetiptiline, and the like), trazodone Selective serotonin reuptake inhibitors (such as escitalopram, fluvoxamine, paroxetine, and sertrilarin), serotonin-norepinephrine reuptake inhibitors (such as milnacipran and duloxetine), noradrenaline / serotonergic antidepressants (such as mirtazapine), And at least one selected from benzamide drugs (such as sulpiride).
うつ症状の治療には、「治癒」と言う概念がないため、うつ症状が改善するとは、BDI等の臨床所見から見て、以前の状態よりもうつ症状が改善している状態、または臨床所見から見て「寛解(remitted)」といえる状態になることを意味する。
Since there is no concept of "curing" in the treatment of depressive symptoms, the improvement of depressive symptoms means that the symptom is better than the previous state, as seen from clinical findings such as BDI, or It means that it will be in the state that can be said to be "remitted" from the viewpoint of
本発明の実施の形態には、被検者においてうつ症状のレベルを判定することを補助すること、被検者におけるうつ症状の有無の判定を補助すること、被検者における治療効果の判定を補助すること、及び被検者を疾患のサブクラスに層別化することを補助することが含まれる。
In the embodiment of the present invention, there are provided that the determination of the level of depressive symptoms in the subject is assisted, the determination of the presence or absence of depressive symptoms in the subject is assisted, and the determination of the treatment effect in the subject Assisting and aiding in subject stratification into disease subclasses are included.
本発明において、ドラッグリプロファイリングとは、既にヒトに対して別の疾患または症状に対する薬効が明らかとなっている薬剤、またはヒトに対して毒性も弱いが有意な薬効も認められないことが明らかになっている薬剤であって、うつ症状に対する影響が未知である薬剤について、うつ症状に対する薬効を検出することを意図する。
In the present invention, drug reprofiling is a drug that has already been shown to have an effect on humans against other diseases or conditions, or that it is weak against humans but has no significant effect. It is intended to detect drug effects on depressive symptoms for drugs that are known and whose effects on depressive symptoms are unknown.
2.安静時fMRIの撮像条件と相関行列の抽出
安静時fMRIの撮像装置は、制限されない。撮像条件もfMRI画像を取得できる限り制限されない。例えば、magnetic filedは3.0T程度、field of viewは192mm~256mm程度、matrixは64×64程度、number of slicesは30枚~40枚程度、number of volumesは112~244程度、slice thicknessは3.0mm~4.0mm程度、slice gapは0mm~0.8mm程度、TRは2,000ms~2,700ms程度、TEは25ms~31ms程度、総撮像時間は5分~10分程度、Flip angleは、75deg~90deg程度、slice acquisition orderは、Ascending (Interleaved)である。撮像は、暗い照明下で行うことが好ましい。また被検者には、撮像中何も考えず、眠らずにいてもらうことが好ましい。さらに、被検者には、撮像中モニター画面中央の十字マークを見続けてもらうことが好ましい。 2. Extraction of imaging condition and correlation matrix of resting fMRI The imaging device of resting fMRI is not limited. The imaging conditions are also not limited as long as the fMRI image can be acquired. For example, magnetic filed is about 3.0 T, field of view is about 192 mm to 256 mm, matrix is about 64 × 64, number of slices is about 30 to 40, number of volumes is about 112 to 244, and slice thickness is 3 .0 mm to about 4.0 mm, slice gap about 0 mm to about 0.8 mm, TR about 2,000 ms to about 2,700 ms, TE about 25 ms to about 31 ms, total imaging time about 5 minutes to about 10 minutes, flip angle about , About 75 deg to 90 deg, and slice acquisition order is Ascending (Interleaved). Imaging is preferably performed under dark illumination. Further, it is preferable that the subject thinks nothing during imaging and does not sleep. Furthermore, it is preferable that the subject keep looking at the cross mark in the center of the monitor screen during imaging.
安静時fMRIの撮像装置は、制限されない。撮像条件もfMRI画像を取得できる限り制限されない。例えば、magnetic filedは3.0T程度、field of viewは192mm~256mm程度、matrixは64×64程度、number of slicesは30枚~40枚程度、number of volumesは112~244程度、slice thicknessは3.0mm~4.0mm程度、slice gapは0mm~0.8mm程度、TRは2,000ms~2,700ms程度、TEは25ms~31ms程度、総撮像時間は5分~10分程度、Flip angleは、75deg~90deg程度、slice acquisition orderは、Ascending (Interleaved)である。撮像は、暗い照明下で行うことが好ましい。また被検者には、撮像中何も考えず、眠らずにいてもらうことが好ましい。さらに、被検者には、撮像中モニター画面中央の十字マークを見続けてもらうことが好ましい。 2. Extraction of imaging condition and correlation matrix of resting fMRI The imaging device of resting fMRI is not limited. The imaging conditions are also not limited as long as the fMRI image can be acquired. For example, magnetic filed is about 3.0 T, field of view is about 192 mm to 256 mm, matrix is about 64 × 64, number of slices is about 30 to 40, number of volumes is about 112 to 244, and slice thickness is 3 .0 mm to about 4.0 mm, slice gap about 0 mm to about 0.8 mm, TR about 2,000 ms to about 2,700 ms, TE about 25 ms to about 31 ms, total imaging time about 5 minutes to about 10 minutes, flip angle about , About 75 deg to 90 deg, and slice acquisition order is Ascending (Interleaved). Imaging is preferably performed under dark illumination. Further, it is preferable that the subject thinks nothing during imaging and does not sleep. Furthermore, it is preferable that the subject keep looking at the cross mark in the center of the monitor screen during imaging.
撮像されたfMRI画像は、Yahataらの文献(NATURE COMMUNICATIONS | 7:11254 | DOI: 10.1038/ncomms11254)に記載の方法で処理することができる。
The imaged fMRI image can be processed by the method described in Yahata et al. (NATURE COMMUNICATIONS | 7: 11254 | DOI: 10.1038 / ncomms11254).
撮像されたfMRI画像データについて、特に限定されないが、たとえば、Matlab R2014a(Mathworks inc., USA)のSPM8(Wellcome Trust Center for Neuroimaging、University College London、UK)を用いてT1強調構造画像及び安静状態機能画像における標準的な前処理を施すことができる。例えば、撮像画像に対して、Realign、Slice-timing correction、Coregistering、Normalization及びSmoothing(FWHM=8mm)を行うことができる。さらに、各被検者の全画像データについて,直前の画像から0.5mm以上動いたと判断される画像を解析から除外してもよい。
The imaged fMRI image data is not particularly limited, for example, T1 weighted structure image and resting state function using SPM 8 (Wellcome Trust Center for Neuroimaging, University College London, UK) of Matlab R 2014a (Mathworks inc., USA) Standard pre-processing on the image can be applied. For example, Realign, Slice-timing correction, Coregistering, Normalization, and Smoothing (FWHM = 8 mm) can be performed on a captured image. Furthermore, for all image data of each subject, an image determined to have moved by 0.5 mm or more from the previous image may be excluded from the analysis.
前処理を行った画像データから、脳内の所定の複数の関心領域(Region of interest, ROI)間について、機能的結合(Functional connectivity, FC)(すなわち、結合強度)を算出する。機能的結合は、安静時脳活動解析において一般的に利用される特徴量(相関行列の要素)であり、異なる関心領域の時系列信号間のピアソンの相関係数により定義される。特に限定されないが、たとえば、所定の時間にわたって計測された値からのピアソンの相関係数の平均値により、結合強度を表すことができる。ただし、所定の時間内のピアソンの相関係数についての他の統計量により結合強度を表してもよい。
From the preprocessed image data, functional connectivity (FC) (i.e., coupling strength) is calculated between a plurality of predetermined regions of interest (ROI) in the brain. The functional connection is a feature value (element of correlation matrix) generally used in resting brain activity analysis, and is defined by Pearson's correlation coefficient between time-series signals of different regions of interest. Although not particularly limited, for example, the binding strength can be represented by an average value of Pearson's correlation coefficients from values measured over a predetermined time. However, the coupling strength may be represented by another statistic about Pearson's correlation coefficient within a predetermined time.
なお、後述するように、本実施の形態では、うつ症状の状態を判別するためには、たとえば、下記表1に示す機能的結合識別番号(表1でID)1~12の関心領域間について、その全て、または、一部について機能的結合(結合強度)を算出する。
As described later, in the present embodiment, in order to determine the state of depressive symptoms, for example, among the regions of interest of functional combination identification numbers (ID in Table 1) shown in Table 1 below. Functional binding (binding strength) is calculated for all or part thereof.

表1で、Lat.の“L”と“R”は、左脳と右脳の区別を示す。BSAは、ブロードマン領野を示し、BAは、ブロードマンの領野の番号を示す。Weightは、後述する関連重み付け和(単に「重み付け和」と称することもある)の重みを示す。
In Table 1, Lat. The "L" and "R" in the figure indicate the distinction between left and right brain. BSA indicates a Brodmann region, and BA indicates a Brodmann region number. Weight indicates the weight of an associated weighted sum (sometimes referred to simply as “weighted sum”) described later.
相関行列の要素の抽出は、特に限定されないが、たとえば、以下のような手順で実行することができる。
Extraction of the elements of the correlation matrix is not particularly limited, but can be performed, for example, in the following procedure.
はじめに各関心領域に含まれる全ボクセル(Voxel)の平均信号の時系列を抽出する。次に信号値からのノイズ除去のため、バンドパスフィルタ(0.008~0.1Hz)をかける。その後、9つの説明変数(全脳、白質、脳脊髄液の平均信号及び6つの体動補正パラメータ)による回帰を行う。回帰後の残差系列を機能的結合と関連する時系列信号値と考え、前記時系列信号値を各関心領域の要素とし、関心領域の各対の関心領域の各相関行列の要素について、時系列間でピアソンの相関係数を計算する。前記相関係数が機能的結合の結合強度を表す値であり、各対それぞれに対応する結合強度が求められる。
First, a time series of average signals of all voxels (Voxel) included in each region of interest is extracted. Next, a band pass filter (0.008 to 0.1 Hz) is applied to remove noise from the signal value. After that, regression is performed with nine explanatory variables (average signal of whole brain, white matter, cerebrospinal fluid and six motion correction parameters). Consider the post-regression residual sequence as the time-series signal value associated with the functional combination, and let the time-series signal value be an element of each region of interest, and for each element of each correlation matrix of the region of interest of each pair of regions of interest Calculate Pearson's correlation coefficient between sequences. The correlation coefficient is a value representing the coupling strength of the functional coupling, and the coupling strength corresponding to each pair is determined.
後述する分類器に入力データとして前記各機能的結合の相関係数を入力することにより、前記相関係数と、分類器の分類処理を実行するための各機能的結合について予め算出された重み(寄与度)を示す係数とに基づいて、機能的結合についてうつ症状の疾患ラベルを判別するための指標値が算出される。あるいは前記相関係数と前記係数とに基づいて、複数の機能的結合についての関連重み付け和がうつ症状の疾患ラベルを判別するための指標値として算出される。ここで、「関連重み付け和」とは、複数の機能的結合にそれぞれ対応する重みを乗算して和をとったものをいう。
By inputting the correlation coefficient of each functional combination as input data to a classifier to be described later, the correlation coefficient and a weight calculated in advance for each functional combination for performing classification processing of the classifier ( Based on the factor indicating the degree of contribution), an index value for determining the disease label of depressive symptoms for functional binding is calculated. Alternatively, based on the correlation coefficient and the coefficient, association weighted sums for a plurality of functional combinations are calculated as index values for determining a disease label of depressive symptoms. Here, the “relevant weighted sum” refers to the sum of multiple functional combinations multiplied by the corresponding weights.
このため、前記指標値は、単に被検者の脳活動を測定したデータではなく、各機能的結合の重みを考慮して人為的に算出された値である。前記指標値は、うつ症状のラベルの判別のために、うつ症状のレベルの判別のために、治療効果の判別のために、または、うつ病患者の層別化のために使用される。
Therefore, the index value is not simply data obtained by measuring the brain activity of the subject, but is a value artificially calculated in consideration of the weight of each functional connection. The index value is used to determine the label of depressive symptoms, to determine the level of depressive symptoms, to determine the therapeutic effect, or for stratification of depressed patients.
前記12対の機能的結合のうち、最もうつ症状への寄与度が高いのは、機能的結合識別番号1で示される機能的結合である。次に寄与度が高いのは、機能的結合識別番号2で示される機能的結合である。したがって、以下に説明する各実施の形態においては、少なくとも機能的結合識別番号1及び機能的結合識別番号2の一方、あるいは両方を選択して使用してもよい。
Among the 12 pairs of functional connections, the highest contribution to depressive symptoms is the functional connection indicated by the functional connection identification number 1. The next highest degree of contribution is the functional binding indicated by the functional binding identification number 2. Therefore, in each of the embodiments described below, at least one or both of the functional binding identification number 1 and the functional binding identification number 2 may be selected and used.
前記12対の機能的結合は、特にメランコリー型MDD患者群と健常対照群を判別することに適している。
The 12 pairs of functional connections are particularly suitable for discriminating between melancholic MDD patient groups and healthy control groups.
3.第1の分類器の生成と判別装置
第1の分類器は、安静時において、健常者とうつ病患者を含む複数の参加者の各々の脳内の複数の所定領域における脳活動を示す信号を脳活動検知装置により時系列で予め測定した信号から分類器生成処理によって生成される。ここで、うつ病患者とは、予め医師の診断により、うつ病と診断され、うつ病の「疾患ラベル」と関連づけられた参加者を意味する。前記分類器は、前記複数の所定領域間の機能的結合のうちから機械学習により、うつ症状の疾患ラベルに関連するとして特徴選択により選択された機能的結合の重みに基づいて、前記うつ症状の疾患ラベルを判別するように生成される。 3. First Classifier Generation and Discrimination Unit The first classifier, at rest, displays signals indicative of brain activity in a plurality of predetermined regions in the brain of each of a plurality of participants including normal persons and depressed patients. It is generated by a classifier generation process from signals measured beforehand in time series by the brain activity detection device. Here, a depressed patient means a participant who has been diagnosed with depression in advance by diagnosis by a doctor and associated with the "disease label" of depression. The classifier is based on weights of functional combinations selected by feature selection as related to a disease label of depressive symptoms by machine learning out of functional connections between the plurality of predetermined areas. It is generated to determine the disease label.
第1の分類器は、安静時において、健常者とうつ病患者を含む複数の参加者の各々の脳内の複数の所定領域における脳活動を示す信号を脳活動検知装置により時系列で予め測定した信号から分類器生成処理によって生成される。ここで、うつ病患者とは、予め医師の診断により、うつ病と診断され、うつ病の「疾患ラベル」と関連づけられた参加者を意味する。前記分類器は、前記複数の所定領域間の機能的結合のうちから機械学習により、うつ症状の疾患ラベルに関連するとして特徴選択により選択された機能的結合の重みに基づいて、前記うつ症状の疾患ラベルを判別するように生成される。 3. First Classifier Generation and Discrimination Unit The first classifier, at rest, displays signals indicative of brain activity in a plurality of predetermined regions in the brain of each of a plurality of participants including normal persons and depressed patients. It is generated by a classifier generation process from signals measured beforehand in time series by the brain activity detection device. Here, a depressed patient means a participant who has been diagnosed with depression in advance by diagnosis by a doctor and associated with the "disease label" of depression. The classifier is based on weights of functional combinations selected by feature selection as related to a disease label of depressive symptoms by machine learning out of functional connections between the plurality of predetermined areas. It is generated to determine the disease label.
すなわち、後述するように、予め設定された複数の関心領域に対する機能的結合のうち、うつ症状の疾患ラベルに特異的に関連するとしてスパース正準相関分析により抽出された機能的結合から、スパースロジスティック回帰による特徴選択により、うつ病の疾患ラベルの判別に使用される機能的結合が選択される。そして、このようにして選択された機能的結合から、上述した関連重み付け和が算出される。
That is, as described later, among the functional binding to a plurality of predetermined regions of interest, the functional binding extracted by the sparse canonical correlation analysis as being specifically related to the disease label of depressive symptoms, the sparse logistic Feature selection by regression selects the functional binding used to determine the disease label for depression. Then, from the functional combination selected in this manner, the above-mentioned associated weighted sum is calculated.
3-1.判別装置1
例えば、第1の分類器は、図1に示すMRI装置10から取得されるfMRIの画像データから生成される。 3-1.Discrimination device 1
For example, the first classifier is generated from fMRI image data acquired from theMRI apparatus 10 shown in FIG.
例えば、第1の分類器は、図1に示すMRI装置10から取得されるfMRIの画像データから生成される。 3-1.
For example, the first classifier is generated from fMRI image data acquired from the
図1は、本発明の実施の形態1にかかる、判別装置1であるMRI装置10の全体構成を示す模式図である。
FIG. 1 is a schematic view showing an entire configuration of an MRI apparatus 10 as a discrimination apparatus 1 according to a first embodiment of the present invention.
図1に示すように、MRI装置10は、MRIを撮像するMRI撮像部25とMRI撮像部25の制御シーケンスを設定するとともに各種データ信号を処理して画像を生成するデータ処理部32とを備える。MRI撮像部25は、被検者2の関心領域に制御された磁場を付与してRF波を照射する磁場印加機構11と、この被検者(又は被訓練者)2からの応答波(NMR信号)を受信してアナログ信号を出力する受信コイル20と、この被検者2に付与される磁場を制御するとともにRF波の送受信を制御する駆動部21とを備える。
As shown in FIG. 1, the MRI apparatus 10 comprises an MRI imaging unit 25 for imaging MRI, and a data processing unit 32 for setting control sequences of the MRI imaging unit 25 and processing various data signals to generate an image. . The MRI imaging unit 25 applies a controlled magnetic field to the region of interest of the subject 2 to apply a controlled magnetic field and applies an RF wave, and a response wave (NMR) from the subject (or the subject) And a drive unit 21 that controls the magnetic field applied to the subject 2 and controls transmission and reception of the RF wave.
なお、ここで、被検者2が載置される円筒形状のボアの中心軸をZ軸にとりZ軸と直交する水平方向にX軸及び鉛直方向にY軸を定義する。
Here, the central axis of the cylindrical bore on which the subject 2 is placed is taken as the Z axis, and the X axis is defined in the horizontal direction perpendicular to the Z axis and the Y axis in the vertical direction.
MRI装置10は、このような構成であるので、磁場印加機構11により印加される静磁場により、被検者2を構成する原子核の核スピンは、磁場方向(Z軸)に配向するとともに、この原子核に固有のラーモア周波数でこの磁場方向を軸とする歳差運動を行う。
Since the MRI apparatus 10 has such a configuration, the nuclear spins of the nuclei constituting the subject 2 are oriented in the magnetic field direction (Z-axis) by the static magnetic field applied by the magnetic field applying mechanism 11, and It performs precession motion around this magnetic field direction at the Larmor frequency specific to the nucleus.
そして、このラーモア周波数と同じRFパルスを照射すると、原子は共鳴しエネルギーを吸収して励起され、核磁気共鳴現象(NMR現象;Nuclear Magnetic Resonance)が生じる。この共鳴の後に、RFパルス照射を停止すると、原子はエネルギーを放出して元の定常状態に戻る緩和過程で、ラーモア周波数と同じ周波数の電磁波(NMR信号)を出力する。
Then, when the same RF pulse as the Larmor frequency is irradiated, the atom resonates, absorbs energy and is excited, and a nuclear magnetic resonance phenomenon (NMR phenomenon; Nuclear Magnetic Resonance) occurs. After this resonance, when the RF pulse irradiation is stopped, the atom emits energy and in the relaxation process returns to the original steady state, it outputs an electromagnetic wave (NMR signal) of the same frequency as the Larmor frequency.
この出力されたNMR信号を被検者2からの応答波として受信コイル20で受信し、データ処理部32において、被検者2の関心領域が画像化される。
The output NMR signal is received by the receiving coil 20 as a response wave from the subject 2, and the data processing unit 32 images the region of interest of the subject 2.
磁場印加機構11は、静磁場発生コイル12と、傾斜磁場発生コイル14と、RF照射部16と、被検者2をボア中に載置する寝台18とを備える。
The magnetic field application mechanism 11 includes a static magnetic field generating coil 12, a gradient magnetic field generating coil 14, an RF irradiation unit 16, and a bed 18 on which the subject 2 is placed in the bore.
被検者2は、寝台18に、たとえば、仰臥する。被検者2は、特に限定されないが、たとえば、プリズムメガネ4により、Z軸に対して垂直に設置された提示装置6(例えばディスプレイ)に表示される画面を見ることができる。この提示装置6の画像により、被検者2に視覚刺激が与えられる。なお、被検者2への視覚刺激は、被検者2の目前にプロジェクタにより画像が投影される構成であってもよい。
The subject 2 lies, for example, on the bed 18. Although the subject 2 is not particularly limited, for example, the prism glasses 4 can view a screen displayed on the presentation device 6 (for example, a display) installed perpendicularly to the Z axis. A visual stimulus is given to the subject 2 by the image of the presentation device 6. The visual stimulus to the subject 2 may be configured such that an image is projected by the projector in front of the subject 2.
このような視覚刺激は、上述したニューロフィードバックでは、フィードバック情報の提示に相当する。
Such visual stimulation corresponds to presentation of feedback information in the above-described neurofeedback.
駆動部21は、静磁場電源22と、傾斜磁場電源24と、信号送信部26と、信号受信部28と、寝台18をZ軸方向の任意位置に移動させる寝台駆動部30とを備える。
The drive unit 21 includes a static magnetic field power supply 22, a gradient magnetic field power supply 24, a signal transmission unit 26, a signal reception unit 28, and a bed drive unit 30 for moving the bed 18 to an arbitrary position in the Z-axis direction.
データ処理部32は、操作者(図示略)から各種操作や情報入力を受け付ける入力部40と、被検者2の関心領域に関する各種画像及び各種情報を画面表示する表示部38と、各種処理を実行させるプログラム・制御パラメータ・画像データ(構造画像等)及びその他の電子データを記憶する記憶部36と、駆動部21を駆動させる制御シーケンスを発生させるなどの各機能部の動作を制御する制御部42と、駆動部21との間で各種信号の送受信を実行するインタフェース部44と、関心領域に由来する一群のNMR信号からなるデータを収集するデータ収集部46と、このNMR信号のデータに基づいて画像を形成する画像処理部48と、ネットワークとの間で通信を実行するためのネットワークインタフェース部50を備える。
The data processing unit 32 includes an input unit 40 for receiving various operations and information input from an operator (not shown), a display unit 38 for displaying various images and information on the region of interest of the subject 2 and various processes. A control unit that controls the operation of each function unit, such as a storage unit 36 that stores programs, control parameters, image data (structured images, etc.) to be executed and other electronic data, and generates a control sequence that drives the drive unit 21 42, an interface unit 44 for executing transmission and reception of various signals between the drive unit 21, a data collection unit 46 for collecting data consisting of a group of NMR signals derived from a region of interest, and data of the NMR signals. And an image processing unit 48 for forming an image, and a network interface unit 50 for performing communication with the network.
また、データ処理部32は、専用コンピュータである場合の他、各機能部を動作させる機能を実行する汎用コンピュータであって、記憶部36にインストールされたプログラムに基づいて、指定された演算やデータ処理や制御シーケンスの発生をさせるものである場合も含まれる。以下では、データ処理部32は、汎用コンピュータであるものとして説明する。
Further, the data processing unit 32 is a general-purpose computer that executes functions to operate the respective functional units in addition to the dedicated computer, and the operation and data specified based on the program installed in the storage unit 36 It also includes cases where processing or control sequences are generated. Hereinafter, the data processing unit 32 will be described as being a general purpose computer.
静磁場発生コイル12は、Z軸周りに巻回される螺旋コイルに静磁場電源22から供給される電流を流して誘導磁場を発生させ、ボアにZ軸方向の静磁場を発生させるものである。このボアに形成される静磁場の均一性の高い領域に被検者2の関心領域を設定することになる。ここで、静磁場コイル12は、より詳しくは、たとえば、4個の空芯コイルから構成され、その組み合わせで内部に均一な磁界を作り、被検者2の体内の所定の原子核、より特定的には水素原子核のスピンに配向性を与える。
The static magnetic field generating coil 12 generates an induction magnetic field by supplying a current supplied from the static magnetic field power supply 22 to a helical coil wound around the Z axis to generate a static magnetic field in the Z axis direction in the bore. . The region of interest of the subject 2 is set in the region of high uniformity of the static magnetic field formed in the bore. Here, the static magnetic field coil 12 is more specifically composed of, for example, four air core coils, and by combining them, a uniform magnetic field is generated inside, and predetermined nuclei in the body of the subject 2 are more specific. Gives orientation to the spins of hydrogen nuclei.
傾斜磁場発生コイル14は、Xコイル、Yコイル及びZコイル(図示省略)から構成され、円筒形状を示す静磁場発生コイル12の内周面に設けられる。
The gradient magnetic field generating coil 14 is composed of an X coil, a Y coil, and a Z coil (not shown), and is provided on the inner circumferential surface of the static magnetic field generating coil 12 having a cylindrical shape.
これらXコイル、Yコイル及びZコイルは、それぞれX軸方向、Y軸方向及びZ軸方向を順番に切り替えながら、ボア内の均一磁場に対し傾斜磁場を重畳させ、静磁場に強度勾配を付与する。Zコイルは励起時に、磁界強度をZ方向に傾斜させて共鳴面を限定し、Yコイルは、Z方向の磁界印加の直後に短時間の傾斜を加えて検出信号にY座標に比例した位相変調を加え(位相エンコーディング)、Xコイルは、続いてデータ採取時に傾斜を加えて、検出信号にX座標に比例した周波数変調を与える(周波数エンコーディング)。
These X coil, Y coil and Z coil superimpose a gradient magnetic field on the uniform magnetic field in the bore while switching the X-axis direction, Y-axis direction and Z-axis direction in order to give an intensity gradient to the static magnetic field . When exciting, the Z coil inclines the magnetic field strength in the Z direction to define the resonance surface, and the Y coil applies a short time inclination immediately after the application of the magnetic field in the Z direction to modulate the phase proportional to the Y coordinate to the detection signal Is added (phase encoding), and the X coil is subsequently inclined at the time of data acquisition to give the detection signal a frequency modulation proportional to the X coordinate (frequency encoding).
この重畳される傾斜磁場の切り替えは、制御シーケンスに従って、Xコイル、Yコイル及びZコイルにそれぞれ異なるパルス信号が送信部24から出力されることにより実現される。これにより、NMR現象が発現する被検者2の位置を特定することができ、被検者2の画像を形成するのに必要な三次元座標上の位置情報が与えられる。
The switching of the superimposed gradient magnetic field is realized by outputting different pulse signals from the transmitting unit 24 to the X coil, the Y coil, and the Z coil in accordance with the control sequence. As a result, the position of the subject 2 at which the NMR phenomenon occurs can be specified, and positional information on three-dimensional coordinates necessary to form an image of the subject 2 can be given.
ここで、上述のように、3組の直交する傾斜磁場を用いて、それぞれにスライス方向、位相エンコード方向、および周波数エンコード方向を割り当ててその組み合わせにより様々な角度から撮影を行える。たとえば、X線CT装置で撮像されるものと同じ方向のトランスバーススライスに加えて、それと直交するサジタルスライスやコロナルスライス、更には面と垂直な方向が3組の直交する傾斜磁場の軸と平行でないオブリークスライス等について撮像することができる。
Here, as described above, imaging can be performed from various angles by assigning slice directions, phase encoding directions, and frequency encoding directions to three sets of orthogonal gradient magnetic fields, respectively, and combining them. For example, in addition to the transverse slice in the same direction as that imaged by the X-ray CT apparatus, the sagittal slice or coronal slice orthogonal thereto, and further, the direction perpendicular to the plane is parallel to the axis of three orthogonal gradient magnetic field It is possible to image not an oblique slice or the like.
RF照射部16は、制御シーケンスに従って信号送信部33から送信される高周波信号に基づいて、被検者2の関心領域にRF(Radio Frequency)パルスを照射するものである。
The RF irradiation unit 16 irradiates an RF (Radio Frequency) pulse to a region of interest of the subject 2 based on the high frequency signal transmitted from the signal transmission unit 33 according to the control sequence.
なお、RF照射部16は、図1において、磁場印加機構11に内蔵されているが、寝台18に設けられたり、あるいは、受信コイル20と一体化されていてもよい。
Although the RF irradiation unit 16 is built in the magnetic field application mechanism 11 in FIG. 1, it may be provided on the bed 18 or may be integrated with the receiving coil 20.
受信コイル20は、被検者2からの応答波(NMR信号)を検出するものであって、このNMR信号を高感度で検出するために、被検者2に近接して配置されている。
The receiving coil 20 detects a response wave (NMR signal) from the subject 2 and is disposed close to the subject 2 in order to detect the NMR signal with high sensitivity.
ここで、受信コイル20には、NMR信号の電磁波がそのコイル素線を切ると電磁誘導に基づき微弱電流が生じる。この微弱電流は、信号受信部28において増幅され、さらにアナログ信号からデジタル信号に変換されデータ処理部32に送られる。
Here, when the electromagnetic wave of the NMR signal cuts the coil wire, a weak current is generated in the receiving coil 20 based on electromagnetic induction. The weak current is amplified by the signal receiving unit 28, and further converted from an analog signal into a digital signal and sent to the data processing unit 32.
すなわち、静磁界にZ軸傾斜磁界を加えた状態にある被検者2に、共鳴周波数の高周波電磁界を、RF照射部16を通じて印加すると、磁界の強さが共鳴条件になっている部分の所定の原子核、たとえば、水素原子核が、選択的に励起されて共鳴し始める。共鳴条件に合致した部分(たとえば、被検者2の所定の厚さの断層)にある所定の原子核が励起され、スピンがいっせいに回転する。励起パルスを止めると、受信コイル20には、今度は、回転しているスピンが放射する電磁波が信号を誘起し、しばらくの間、この信号が検出される。この信号によって、被検者2の体内の、所定の原子を含んだ組織を観察する。そして、信号の発信位置を知るために、XとYの傾斜磁界を加えて信号を検知する、という構成になっている。
That is, when a high frequency electromagnetic field of the resonance frequency is applied through the RF irradiation unit 16 to the subject 2 in a state in which the Z-axis gradient magnetic field is added to the static magnetic field, the strength of the magnetic field becomes the resonance condition A given nucleus, for example a hydrogen nucleus, is selectively excited to begin to resonate. A predetermined nucleus in a portion matching the resonance condition (for example, a slice of a predetermined thickness of the subject 2) is excited, and spins rotate at a time. When the excitation pulse is stopped, an electromagnetic wave emitted by rotating spins induces a signal in the receiving coil 20, and this signal is detected for a while. By this signal, a tissue containing a predetermined atom in the body of the subject 2 is observed. Then, in order to know the transmission position of the signal, the X and Y gradient magnetic fields are applied to detect the signal.
画像処理部48は、記憶部36に構築されているデータに基づき、励起信号を繰り返し与えつつ検出信号を測定し、1回目のフーリエ変換計算により、共鳴の周波数をX座標に還元し、2回目のフーリエ変換でY座標を復元して画像を得て、表示部38に対応する画像を表示する。
The image processing unit 48 measures the detection signal while repeatedly giving the excitation signal based on the data constructed in the storage unit 36, reduces the frequency of the resonance to the X coordinate by the first Fourier transform calculation, and the second time The Y coordinate is restored by the Fourier transform of to obtain an image, and the image corresponding to the display unit 38 is displayed.
たとえば、このようなMRIシステムにより、上述したBOLD信号をリアルタイムで撮像し、制御部42により、時系列に撮像される画像について、後に説明するような解析処理を行うことで、安静時機能的結合MRI(rs-fcMRI)の撮像を行うことが可能となる。
For example, the above-described BOLD signal is imaged in real time by such an MRI system, and the control unit 42 performs an analysis process as described later on images captured in time series, thereby achieving resting functional coupling It becomes possible to perform imaging of MRI (rs-fcMRI).
図2は、データ処理部32のハードウェアブロック図である。
FIG. 2 is a hardware block diagram of the data processing unit 32. As shown in FIG.
データ処理部32のハードウェアとしては、上述のとおり、特に限定されないが、汎用コンピュータを使用することが可能である。
The hardware of the data processing unit 32 is not particularly limited as described above, but a general-purpose computer can be used.
図2において、データ処理部32のコンピュータ本体2010は、メモリドライブ2020、ディスクドライブ2030に加えて、演算装置(central processing unit:CPU;プロセッサともいう)2040と、ディスクドライブ2030及びメモリドライブ2020に接続されたバス(インタフェースともいう)2050と、ブートアッププログラム等のプログラムを記憶するためのROM(read‐only memory)2060とに接続され、アプリケーションプログラムの命令を一時的に記憶するとともに一時記憶空間を提供するためのRAM(random access memory)2070と、アプリケーションプログラム、システムプログラム、およびデータを記憶するための不揮発性記憶装置2080と、通信インタフェース2090とを含む。通信インタフェース2090は、駆動部21等と信号の授受を行うためのインタフェース部44および図示しないネットワークを介して他のコンピュータと通信するためのネットワークインタフェース50に相当する。なお、不揮発性記憶装置2080としては、ハードディスク(HDD)やソリッドステートドライブ(SSD:Solid State Drive)などを使用することが可能である。不揮発性記憶装置2080が、記憶部36に相当する。データ処理部32のコンピュータ本体2010は、第1の分類器生成装置、及び/又は第2の分類器生成装置としても機能する。
In FIG. 2, a computer main body 2010 of the data processing unit 32 is connected to a processing unit (central processing unit: CPU; also referred to as processor) 2040, a disk drive 2030 and a memory drive 2020 in addition to a memory drive 2020 and a disk drive 2030. Is connected to a bus (also referred to as an interface) 2050 and a ROM (read-only memory) 2060 for storing a program such as a boot-up program, and temporarily stores instructions of an application program and temporarily stores a temporary storage space. RAM (random access memory) 2070 for providing, application program, system program, and nonvolatile memory for storing data And sexual storage device 2080, and a communication interface 2090. The communication interface 2090 corresponds to an interface unit 44 for exchanging signals with the drive unit 21 and the like, and a network interface 50 for communicating with another computer via a network (not shown). As the nonvolatile storage device 2080, a hard disk (HDD), a solid state drive (SSD: Solid State Drive), or the like can be used. The non-volatile storage device 2080 corresponds to the storage unit 36. The computer main body 2010 of the data processing unit 32 also functions as a first classifier generation device and / or a second classifier generation device.
CPU2040が、プログラムに基づいて実行する演算処理により、データ処理部32の各機能、たとえば、制御部42、データ収集部46、画像処理部48の各機能が実現される。
Each function of the data processing unit 32, for example, each function of the control unit 42, the data collection unit 46, and the image processing unit 48 is realized by arithmetic processing that the CPU 2040 executes based on a program.
データ処理部32に、上述した実施の形態の機能を実行させるプログラムは、CD-ROM2200、またはメモリ媒体2210に記憶されて、ディスクドライブ2030またはメモリドライブ2020に挿入され、さらに不揮発性記憶装置2080に転送されても良い。プログラムは実行の際にRAM2070にロードされる。
A program that causes the data processing unit 32 to execute the functions of the above-described embodiment is stored in the CD-ROM 2200 or the memory medium 2210, inserted into the disk drive 2030 or the memory drive 2020, and further stored in the non-volatile storage device 2080. It may be forwarded. The program is loaded into the RAM 2070 upon execution.
データ処理部32は、さらに、入力装置としてのキーボード2100およびマウス2110と、出力装置としてのディスプレイ2120とを備える。キーボード2100およびマウス2110が入力部40に相当し、ディスプレイ2120が表示部38に相当する。
The data processing unit 32 further includes a keyboard 2100 and a mouse 2110 as an input device, and a display 2120 as an output device. The keyboard 2100 and the mouse 2110 correspond to the input unit 40, and the display 2120 corresponds to the display unit 38.
上述したようなデータ処理部32として機能するためのプログラムは、コンピュータ本体2010に、情報処理装置等の機能を実行させるオペレーティングシステム(OS)は、必ずしも含まなくても良い。プログラムは、制御された態様で適切な機能(モジュール)を呼び出し、所望の結果が得られるようにする命令の部分のみを含んでいれば良い。データ処理部32がどのように動作するかは周知であり、詳細な説明は省略する。
The program for functioning as the data processing unit 32 as described above may not necessarily include the operating system (OS) that causes the computer main body 2010 to execute the function of the information processing apparatus or the like. The program needs to call only an appropriate function (module) in a controlled manner, and include only a part of an instruction that makes it possible to obtain a desired result. It is well known how the data processing unit 32 operates, and the detailed description will be omitted.
また、上記プログラムを実行するコンピュータは、単数であってもよく、複数であってもよい。すなわち、集中処理を行ってもよく、あるいは分散処理を行ってもよい。
Moreover, the computer that executes the program may be singular or plural. That is, centralized processing may be performed, or distributed processing may be performed.
図3は、うつ症状の疾患ラベルに関連する安静時の機能的結合の相関を示す相関行列を抽出する手続きを示す概念図である。
FIG. 3 is a conceptual diagram showing a procedure for extracting a correlation matrix indicating correlation of functional connection at rest associated with a disease label of depressive symptoms.
図3に示すように、リアルタイムで測定した安静時のfMRIのn個(n:自然数)の時刻分のfMRIデータから、各関心領域の平均的な「活動度」を算出し、脳領域間(関心領域間)の活動度の相関値を算出する。
As shown in FIG. 3, the average “activity” of each region of interest is calculated from the fMRI data for n (n: natural number) times of resting fMRI measured in real time, and the brain regions are Calculate the correlation value of the degree of activity).
ここで、関心領域としては、小脳領域を除く137領域を考えているので、相関行列における独立な非対角成分は、対称性を考慮すると、
(137×137-137)/2=9316(個)
ということになる。なお、図3では、図の上では、相関は34×34のみを示している。 Here, since the 137 regions excluding the cerebellum region are considered as the regions of interest, the independent non-diagonal components in the correlation matrix take into account the symmetry,
(137 x 137-137) / 2 = 9316 (pieces)
It turns out that. In FIG. 3, the correlation shows only 34 × 34 on the diagram.
このような相関行列の要素の算出については、特に限定されないが、たとえば、以下のように実行することが可能である。
The calculation of the elements of such a correlation matrix is not particularly limited, but can be performed, for example, as follows.
安静時脳活動データから、各参加者について、異なる関心領域間の機能的結合を計算する。機能的結合は安静時脳活動解析において一般的に利用される特徴量であり、異なる関心領域の時系列信号間のピアソンの相関係数により定義される。
From resting brain activity data, functional connections between different regions of interest are calculated for each participant. Functional connection is a feature that is generally used in resting brain activity analysis, and is defined by Pearson's correlation coefficient between time-series signals of different regions of interest.
まず、各関心領域に含まれる全ボクセルの平均信号の時系列を抽出する。
First, a time series of average signals of all voxels included in each region of interest is extracted.
次に信号値からのノイズ除去のため、バンドパスフィルタをかけ、その後、9つの説明変数(全脳,白質,脳脊,髄液の平均信号及び6つの体動補正パラメータ)による回帰を行う。
Next, in order to remove noise from the signal values, a band pass filter is applied, and then regression is performed using nine explanatory variables (average signals of whole brain, white matter, brain back, cerebrospinal fluid and six motion correction parameters).
回帰後の残差系列を機能的結合と関連する時系列信号値と考え、異なるROIの時系列間でピアソンの相関係数を計算する。
Think of the post-regression residual sequence as the time series signal value associated with the functional combination, and calculate Pearson's correlation coefficient between time series of different ROIs.
関心領域については、Brain Sulci Atlas (BAL)に含まれる137の関心領域を用いる。これら137の関心領域間の機能的結合FCを特徴量として用いる。
As the region of interest, 137 regions of interest included in Brain Sulci Atlas (BAL) are used. A functional connection FC between these 137 regions of interest is used as a feature.
ここで、Brain Sulci Atlas (BAL)については、以下に開示がある。
文献:Perrot et al., Med Image Anal, 15(4), 2011、文献:Tzourio-Mazoyer et al., Neuroimage, 15(1), 2002 Here, Brain Sulci Atlas (BAL) is disclosed below.
Literature: Perrot et al., Med Image Anal, 15 (4), 2011, Literature: Tzurio-Mazoyer et al., Neuroimage, 15 (1), 2002
文献:Perrot et al., Med Image Anal, 15(4), 2011、文献:Tzourio-Mazoyer et al., Neuroimage, 15(1), 2002 Here, Brain Sulci Atlas (BAL) is disclosed below.
Literature: Perrot et al., Med Image Anal, 15 (4), 2011, Literature: Tzurio-Mazoyer et al., Neuroimage, 15 (1), 2002
図4は、図3で説明したような相関行列から、バイオマーカーとなる第1の分類器を生成する過程を説明する概念図である。
FIG. 4 is a conceptual diagram for explaining the process of generating a first classifier serving as a biomarker from the correlation matrix as described in FIG.
以下、説明するように、第1の分類器は、たとえば、「うつ病」に対する診断マーカーとしての指標として機能し、疾患の重症度や進行度を医師が診断する際の支援のために使用することができる。したがって、第1の分類器の演算と結果の出力を実行する装置は、診断支援装置と呼ぶこともできる。
As described below, the first classifier functions as, for example, an index as a diagnostic marker for "depression", and is used for assisting a doctor in diagnosing the severity or progression of the disease. be able to. Thus, the device that performs the operations of the first classifier and the output of the results can also be called a diagnostic aid device.
図4に示すように、MRI撮像部25で撮像された、健常群、及びうつ病患者群を含む参加者において測定されたfMRIのデータから、それぞれの参加者について後に説明するような手続により、データ処理部32が、脳領域間(関心領域間)の活動度の相関行列の要素を導出する。
As shown in FIG. 4, from the fMRI data measured by the participants including the healthy group and the depressed patient group imaged by the MRI imaging unit 25, according to the procedure as described later for each participant, The data processing unit 32 derives the elements of the correlation matrix of the degree of activity between the brain regions (between the regions of interest).
続いて、データ処理部32により、参加者の疾患/健常ラベルを含む参加者の属性と相関行列とについて正則化正準相関解析により特徴抽出が行われる。「正則化」とは、一般に、機械学習や統計学において、誤差関数に、ハイパーパラメータにより重み付けされた正則化項を追加して、モデルの複雑度・自由度に抑制を加え、過学習を防ぐ方法である。なお、正則化正準相関解析の結果、説明変数についてスパース化も併せて実現される場合は、特に、スパース正準相関解析(Sparse Canonical Correlation Analysis : SCCA)と呼ぶ。以下では、具体例としては、スパース正準相関解析を行うものとして説明する。
Subsequently, the data processing unit 32 performs feature extraction by regularization canonical correlation analysis on the attributes of the participant including the participant's disease / healthy label and the correlation matrix. Generally, in regular learning, in machine learning and statistics, a regularization term weighted by a hyperparameter is added to an error function to add suppression to the complexity and freedom of the model to prevent over-learning. It is a method. In addition, as a result of regularization canonical correlation analysis, in the case where sparsification is also realized for the explanatory variables, it is particularly referred to as sparse canonical correlation analysis (SCCA). Below, as a specific example, it demonstrates as what performs sparse canonical correlation analysis.
そして、このようなスパース正準相関解析において、後述するように、ハイパーパラメータの値の調節により「疾患ラベル」とのみ結合する正準変数が存在するようにしたときに、これに対応する正準変数に接続する機能的結合FCを抽出する。所定範囲でハイパーパラメータを変化させるとき、このような条件を満たす正準変数が存在する範囲で抽出される機能的結合FCの和集合を「第1和集合」と呼ぶ。
Then, in such sparse canonical correlation analysis, as described later, when there is a canonical variable that is coupled only with the “disease label” by adjusting the value of the hyperparameter, the corresponding canonical Extract functional connections FC connected to variables. When changing hyper parameters in a predetermined range, a union of functional connections FC extracted in a range in which a canonical variable satisfying such conditions exists is referred to as a “first union”.
さらに、データ処理部32により、スパース正則化正準相関解析の結果得られた「第1和集合」を説明変数とし、たとえば、1個抜き交差検証(Leave-One-Out Cross Validation:LOOCV)を行いながら、各交差検証のステップでスパースロジスティック回帰による判別分析を行い、すべての交差検証にわたって、説明変数として抽出された機能的結合FCの和集合を「第2和集合」と呼ぶ。
Furthermore, with the “first union” obtained as a result of the sparse regularization canonical correlation analysis by the data processing unit 32 as an explanatory variable, for example, one-out-one-out cross validation (LOOCV) While performing the discriminant analysis by sparse logistic regression in each cross validation step, the union of functional combinations FC extracted as explanatory variables is called the “second union” over all cross validations.
最後に、全ての参加者のデータに対して、「第2和集合」を説明変数として、目的変数である「疾患ラベル」に対して、スパースロジスティック回帰による判別分析を行って、第1の分類器が生成される。
Finally, with respect to the data of all the participants, the “second union” is used as an explanatory variable, and the discriminant analysis by sparse logistic regression is performed on the objective variable “disease label” to obtain the first classification Is generated.
図5は、図4で説明したような第1の分類器の生成処理および生成された第1の分類器による判別処理を行うための機能ブロック図である。
FIG. 5 is a functional block diagram for performing the generation process of the first classifier as described in FIG. 4 and the determination process by the generated first classifier.
まず、不揮発性記憶装置2080には、健常者とうつ病患者を含む複数の参加者の各々の脳内の複数の所定領域における脳活動を示す信号をMRI装置により時系列で予め測定した信号の情報である参加者rs-fcMRI測定データ3102と、MRI測定データを計測した各参加者に関連づけられた、複数の人属性情報3104とが格納されている。
First, in nonvolatile memory device 2080, a signal indicating brain activity in a plurality of predetermined regions in the brain of each of a plurality of participants including a healthy person and a depressed patient is measured in advance in time series by an MRI device. A participant rs-fc MRI measurement data 3102 which is information and a plurality of human attribute information 3104 associated with each participant who measured the MRI measurement data are stored.
ここで、「人属性情報」とは、参加者個人を特定するための「人特性情報」と、各参加者に対する測定条件を特定するための「測定条件情報」とを含む。
Here, the “person attribute information” includes “person characteristic information” for identifying an individual participant and “measurement condition information” for identifying a measurement condition for each participant.
「人特性情報」とは、参加者に対する疾患ラベル、年齢、性別、投薬履歴などの情報を意味する。
"Human characteristic information" means information such as disease label, age, gender, and medication history for participants.
「測定条件情報」とは、参加者を測定した測定サイト情報(測定した施設および/または測定した装置を特定する情報を含む)や、測定中に、開眼/閉眼のいずれで計測したか、測定磁場強度などの測定条件を特定する条件である。
“Measurement condition information” refers to measurement site information (including information for specifying a measured facility and / or a measured device) that measured a participant, and whether it was measured by eye open / closed eye during measurement, or It is a condition for specifying measurement conditions such as magnetic field strength.
演算装置2040は、参加者rs-fcMRI測定データ3102および対応する人属性情報3104とに基づいて、疾患ラベルに対する分類器を生成する処理を行う。
The computing device 2040 performs processing to generate a classifier for the disease label based on the participant rs-fc MRI measurement data 3102 and the corresponding human attribute information 3104.
相関行列算出部3002は、参加者rs-fcMRI測定データ3102から複数の所定領域間の脳活動の機能的結合の相関行列を参加者ごとに算出する。算出された機能的結合の相関行列のデータは、参加者ごとに、不揮発性記憶装置2080に、機能的結合の相関行列のデータ3106として格納される。
The correlation matrix calculation unit 3002 calculates, from the participant rs-fc MRI measurement data 3102, a correlation matrix of functional connections of brain activity among a plurality of predetermined regions for each participant. The functional matrix correlation matrix data thus calculated is stored in the non-volatile storage device 2080 as functional matrix correlation matrix data 3106 for each participant.
第1特徴選択部3004は、複数の参加者から抽出されたK個(K:2以上の自然数)の異なる部分集合に対して、順次1つの部分集合を選択し、選択された部分集合を除く(K-1)個の部分集合に対して、複数の属性情報と相関行例の要素とに対するスパース正準相関分析により、複数の人属性情報のうちの特定の属性情報、たとえば、疾患ラベルのみに対応する正準変数と接続する相関行例の要素を抽出する。さらに、第1特徴選択部3004は、順次選択される部分集合にわたって、抽出された相関行例の要素の和集合である第1和集合を取得し、不揮発性記憶装置2080に、第1の機能的結合和集合データ3108として格納する。なお、「第1の機能的結合和集合データ」は、機能的結合の相関行列のデータ3106のうち、第1の和集合に対応する要素を特定するためのインデックスであってもよい。
The first feature selection unit 3004 sequentially selects one subset for K different subsets (K: a natural number of 2 or more) extracted from a plurality of participants, and removes the selected subset. Sparse canonical correlation analysis on a plurality of attribute information and an element of a correlation row example for (K-1) subsets, and specific attribute information of a plurality of human attribute information, for example, only a disease label Extract elements of the correlation row example connected to the canonical variable corresponding to. Furthermore, the first feature selection unit 3004 acquires a first union, which is a union of elements of the extracted correlation row example, over the subsets selected sequentially, and causes the non-volatile storage device 2080 to execute the first function. It stores as the dynamic combination union data 3108. The “first functional combination union data set” may be an index for specifying an element corresponding to the first union among the data 3106 of the functional connection correlation matrix.
第2特徴選択部3006は、複数の参加者のうち上記K個の部分集合を除く残りの参加者をテスト集合とし、テスト集合を異なるN個のグループに分けるとき、複数の参加者からN個のグループうちの選択された1つのグループを除く参加者の集合を対象として、第1和集合に基づいて、上記特定の属性情報(たとえば、疾患ラベル)を推定するためのテスト分類器をスパースロジスティック回帰により算出し、スパース化に伴いテスト分類器の説明変数となる相関行例の要素を抽出する。第2特徴選択部3006は、さらに、N個のグループうちから1つのグループを順次選択しつつ、特徴抽出を繰り返して、テスト分類器の説明変数として抽出された相関行例の要素の和集合である第2和集合を取得して、不揮発性記憶装置2080に、第2の機能的結合和集合データ3110として格納する。なお、「第2の機能的結合和集合データ」も、機能的結合の相関行列のデータ3106のうち、第2の和集合に対応する要素を特定するためのインデックスであってもよい。
The second feature selection unit 3006 selects N participants from the plurality of participants when the remaining participants excluding the subset of the K among the plurality of participants are set as the test set and the test set is divided into N different groups. Sparse logistic test classifier for estimating the specific attribute information (for example, disease label) based on the first union, targeting a set of participants excluding one of the selected groups It calculates by regression and extracts the element of the correlation line example which becomes an explanatory variable of a test classifier with sparsification. The second feature selection unit 3006 further repeats feature extraction while sequentially selecting one group out of N groups, and is a union set of elements of correlated row examples extracted as an explanatory variable of the test classifier. A certain second union is acquired and stored in the non-volatile storage device 2080 as second functional combined union data 3110. The “second functional combination sum set data” may also be an index for specifying an element corresponding to the second sum set among the data 3106 of the functional connection correlation matrix.
なお、N個グループの各々の要素の個数は1個であってもよい。
The number of elements in each of the N groups may be one.
分類器生成部3008は、第2和集合を説明変数として、特定の属性情報(たとえば、疾患ラベル)を推定するための第1の分類器をスパースロジスティック回帰により算出する。分類器生成部3008は、生成された第1の分類器を特定するための情報を、不揮発性記憶装置2080に、分類器データ3112として格納する。
The classifier generation unit 3008 calculates a first classifier for estimating specific attribute information (for example, a disease label) by sparse logistic regression, using the second union as an explanatory variable. The classifier generation unit 3008 stores the generated information for identifying the first classifier in the non-volatile storage device 2080 as classifier data 3112.
判別処理部3010は、分類器データ3112により特定される分類器に基づいて、入力データに対して判別処理を行う。
The discrimination processing unit 3010 performs discrimination processing on input data based on the classifier specified by the classifier data 3112.
なお、上記の説明では、分類器生成部3008は、第2和集合を説明変数として、分類器を生成するものとして説明したが、たとえば、分類器生成部3008は、直接、第1和集合を説明変数として、第1の分類器を生成してもよい。ただし、後に説明するように、次元の低減や、汎化性能の観点からは、第2和集合を説明変数とすることが、望ましい。
In the above description, the classifier generation unit 3008 is described as generating a classifier using the second union as an explanatory variable, but, for example, the classifier generation unit 3008 directly transmits the first union. A first classifier may be generated as an explanatory variable. However, as described later, it is desirable to use the second union as an explanatory variable from the viewpoint of dimensional reduction and generalization performance.
なお、第1の分類器の生成にあたっては、正則化法(たとえば、L1正則化やL2正則化)を用いたロジスティック回帰である正則化ロジスティック回帰を用いることができ、より具体的には、たとえば、上述した「スパースロジスティック回帰」を使用することもできる。また、第1の分類器の生成には、サポートベクトルマシンや、LDA(Linear discriminant analysis)などを使用してもよい。以下では、スパースロジスティック回帰を例にとって説明することにする。
Note that, in generating the first classifier, regularized logistic regression that is logistic regression using regularization (for example, L1 regularization or L2 regularization) can be used, and more specifically, for example, , "Sparse Logistic Regression" described above can also be used. In addition, a support vector machine, LDA (Linear discriminant analysis), or the like may be used to generate the first classifier. In the following, sparse logistic regression will be described as an example.
後に説明するように、第2特徴選択部3006による特徴選択処理と並行して、N個のグループうちから除かれる1つのグループを順次選択しつつ、第2特徴量選択部3006により算出されたテスト分類器により、除かれたグループをテストサンプルとして判別結果を算出することにより交差検証を行ってもよい。
As will be described later, in parallel with the feature selection processing by the second feature selection unit 3006, the test calculated by the second feature selection unit 3006 while sequentially selecting one group to be removed from N groups. The cross validation may be performed by the classifier to calculate the discrimination result with the excluded groups as test samples.
このように説明変数の次元の縮小を、入れ子構造となった特徴選択手続きにより行うことにより、第2特徴選択部3006の行う処理において、ほとんどの参加者のデータを使用する一方、時間的に効率的な次元の数の縮小を実行できる。
By thus reducing the dimensions of the explanatory variables in accordance with the nested feature selection procedure, in the processing performed by the second feature selection unit 3006, while data of most participants is used, time efficiency is achieved. Can be performed to reduce the number of critical dimensions.
さらに、第2特徴選択部3006の処理におけるテスト集合を、次元の数を縮小するために使用されるデータセットとは、独立となるようにしておくことにより、極端に楽観的な結果が得られることを回避することができる。
Further, by setting the test set in the processing of the second feature selection unit 3006 to be independent of the data set used to reduce the number of dimensions, extremely optimistic results can be obtained. Can be avoided.
図6は、バイオマーカーとなる分類器を生成するためにデータ処理部32が行う処理を説明するためのフローチャートである。
FIG. 6 is a flowchart for explaining the processing performed by the data processing unit 32 to generate a classifier to be a biomarker.
以下、図4で説明した処理を、図6を参照しながら、より詳しく説明する。
Hereinafter, the process described in FIG. 4 will be described in more detail with reference to FIG.
安静時のfMRIデータから導き出される脳領野間の結合と参加者の疾患の判別ラベル(疾患ラベル)にもとづいてバイオマーカーを作成する場合の最大の問題点は、データ数にくらべてデータの次元が圧倒的に多いことである。そのため、正則化を行うことなしに、疾患ラベル(ここでは、参加者が疾患であるか健常であるかを示すラベルを「疾患ラベル」と呼ぶ)の予測のための分類器の学習をデータセットを用いておこなうと、オーバーフィット(過剰適合)することで未知のデータに対する予測性能が著しく低下する。
The biggest problem in creating biomarkers based on the inter-brain area coupling derived from resting fMRI data and the participant's disease discrimination label (disease label) is that the dimension of the data is smaller than the number of data It is overwhelmingly numerous. Therefore, without regularization, the data set learning classifiers for prediction of disease labels (herein the label indicating whether the participant is diseased or healthy is called "disease label") Overfitting (overfitting) significantly reduces the prediction performance for unknown data.
ここで、一般に、機械学習において、観測データをより少ない数の説明変数で説明するように行われる処理のことを「特徴選択(または特徴抽出)」と呼ぶ。本実施の形態では、「脳領域間(関心領域間)の活動度の複数個の相関値(複数個の結合)」のうち、対象となる疾患ラベルの予測のための第1の分類器の機械学習において、より少ない相関値により第1の分類器を構成できるように特徴選択(特徴抽出)をすること、すなわち、説明変数として、より重要な相関係数を選択することを「縮約表現を抽出する」と呼ぶこともある。
Here, in general, in machine learning, a process performed to explain observation data with a smaller number of explanatory variables is called “feature selection (or feature extraction)”. In the present embodiment, among “a plurality of correlation values (a plurality of combinations) of degrees of activity between brain regions (between regions of interest)”, a first classifier for predicting a target disease label In machine learning, feature selection (feature extraction) so that the first classifier can be configured with fewer correlation values, ie, selection of a more significant correlation coefficient as an explanatory variable, Sometimes referred to as
そして、本実施の形態では、特徴抽出法として、正則化法を用いる。このように、正準相関分析において、正則化とともにスパース化を実行し、説明変数としてより重要なものを残すように処理するという意味で、このような処理を「スパース正準相関分析」と呼ぶ。より具体的には、たとえば、スパース化を併せて実現するための正則化法としては、以下に説明するような「L1正則化」という正準相関分析のパラメータの絶対値の大きさにペナルティーを課す手法を用いることが可能である。
And in this embodiment, regularization is used as a feature extraction method. Thus, in canonical correlation analysis, such processing is called "sparse canonical correlation analysis" in the sense that processing is carried out along with regularization and processing is performed so as to leave something more important as an explanatory variable. . More specifically, for example, as a regularization method for realizing sparsification together, a penalty is imposed on the magnitude of the absolute value of the parameter of canonical correlation analysis called “L1 regularization” as described below. It is possible to use the imposing method.
すなわち、図6を参照して、データ処理部32は、入力部40からの処理開始の入力等により、分類器生成の処理が開始されると(S100)、記憶部36から各参加者についてのMRI測定データを読み出し(S102)、スパース正準相関分析(SCCA)により第1の特徴抽出の処理を行う(S104)。
That is, referring to FIG. 6, when the data processing unit 32 starts the processing of classifier generation by the input of the processing start from the input unit 40 or the like (S100), the data processing unit 32 receives the information about each participant The MRI measurement data is read (S102), and the first feature extraction process is performed by sparse canonical correlation analysis (SCCA) (S104).
以下では、ステップS104の処理を「内ループ特徴選択」と呼ぶ。
Hereinafter, the process of step S104 is referred to as “inner loop feature selection”.
ここで、ステップS104での内ループ特徴選択の処理を説明するために、「スパース正準相関分析」と、「内ループ特徴選択」について、以下、それぞれ説明する。
Here, in order to explain the process of inner loop feature selection in step S104, “sparse canonical correlation analysis” and “inner loop feature selection” will be respectively described below.
(スパース正準相関分析)
以下では、スパース正準相関分析として、L1正則化正準相関分析について説明する。このL1正則化正準相関分析については、以下の文献に開示がある。 (Sparse canonical correlation analysis)
In the following, L1 regularized canonical correlation analysis will be described as sparse canonical correlation analysis. The L1 regularization canonical correlation analysis is disclosed in the following document.
文献:Witten DM, Tibshirani R, and T Hastie. A penalized matrix decomposition, with applications to sparse principal components and canonical correlation analysis. Biostatistics, Vol. 10, No. 3, pp. 515-534, 2009.
Literature: Witten DM, Tibshirani R, and T Hastie. A penalized matrix decomposition, with applications to sparse principal components and canonical correlation analysis. Biostatistics, Vol. 10, No. 3, pp. 515-534, 2009.
まず、一般の正準相関分析(Canonical Correlation Analysis: CCA)では、データ対x1およびx2を考える際に、それぞれの変数x1およびx2は、平均0、標準偏差1を持つように標準化される。
First, in general canonical correlation analysis (CCA), when considering data pairs x 1 and x 2 , each variable x 1 and x 2 is standardized so as to have an average of 0 and a standard deviation of 1. Be done.
一般的に言えば、正準相関分析(CCA)の使用によって、ペアになった観測量の間の潜在している関係を識別することができる。
Generally speaking, the use of canonical correlation analysis (CCA) can identify potential relationships between paired observables.
具体的には、正準相関分析(CCA)では、対となる射影された変数(正準変数)に最大の相関があるように、投影ベクトルを見つけ出す。
Specifically, in canonical correlation analysis (CCA), a projection vector is found so that there is maximum correlation between paired projected variables (canonical variables).
これに対して、正準相関分析にL1正則化を導入した場合、すなわち、L1ノルム正規化によるスパースCCA、すなわち、L1-SCCAを使用する場合は、以下のような最適化問題を解くことになる。
On the other hand, when L1 regularization is introduced to canonical correlation analysis, that is, sparse CCA by L1 norm normalization, that is, L1 SCCA is used, the following optimization problem is solved: Become.
以下のような変数の組を考える。
Consider the following set of variables:

ここでも、行列X1およびX2を構成する列については、それぞれ平均が0で分散が1となるように正規化されているものとする。
Here, it is assumed that the columns constituting the matrices X 1 and X 2 are normalized such that the average is 0 and the variance is 1.
そうすると、L1-SCCAは、以下の式(1)のように定式化することができる。
Then, L1-SCCA can be formulated as the following formula (1).
ここで、ハイパーパラメータλ1およびλ2が、重みパラメータw1およびw2の(w1およびw2により対応する変数がスパース化されることから「スパース投影ベクトル」と呼ぶ)スパース化の度合いをそれぞれ示す。
Here, hyperparameters λ 1 and λ 2 are the degree of sparsity of weighting parameters w 1 and w 2 (referred to as “sparse projection vector” because corresponding variables are sparseized by w 1 and w 2 ) It shows each.
具体的に、本実施の形態の例としては、人属性情報および機能的な結合FCの潜在している関係を識別するために、上記の変数に相当する2つのデータ行列を構築するものとする。
Specifically, as an example of the present embodiment, two data matrices corresponding to the above variables are constructed in order to identify the latent relationship between human attribute information and functional connection FC. .
以下では、参加者には、うつ病の患者群(疾患ラベルを「MDD(Major depressive disorder)」で表す)と健常者対照群(疾患ラベルを「HC(Healthy control)」で表す)第1のデータ行列X1の行は、1人の参加者の人属性情報(人特性情報および測定条件情報)を表しており、たとえば、この特性情報や測定条件情報は、以下のものを含む:
i)疾患ラベル(MDDあるいはHC),
ii)サイト情報(参加者の脳活動がどこで計測されたか、サイトA,B,C)
iii)年齢
iv)性別
v)撮像条件(開眼あるいは閉眼)
vi)薬剤投与の状態1(抗精神病薬)
vii)薬剤投与の状態2(抗うつ薬)
viii)薬剤投与の状態3(精神安定剤)
具体的には、人属性情報データ行列X1の列数は、10であり、つまりp1=10である。 In the following, participants have a first group of patients with depression (the disease label is represented by "Major depressive disorder") and a normal control group (the disease label is represented by "HC (Healthy control)"). The rows of the data matrix X 1 represent human attribute information (human characteristic information and measurement condition information) of one participant, and, for example, the characteristic information and the measurement condition information include the following:
i) Disease label (MDD or HC),
ii) Site information (Where the participant's brain activity was measured, site A, B, C)
iii) Age iv) Sex v) Imaging conditions (open or closed eyes)
vi)State 1 of drug administration (antipsychotic drug)
vii)State 2 of drug administration (antidepressant)
viii)State 3 of drug administration (mental stabilizer)
Specifically, the number of columns of the human attribute information data matrix X 1 is 10, that is, p 1 = 10.
i)疾患ラベル(MDDあるいはHC),
ii)サイト情報(参加者の脳活動がどこで計測されたか、サイトA,B,C)
iii)年齢
iv)性別
v)撮像条件(開眼あるいは閉眼)
vi)薬剤投与の状態1(抗精神病薬)
vii)薬剤投与の状態2(抗うつ薬)
viii)薬剤投与の状態3(精神安定剤)
具体的には、人属性情報データ行列X1の列数は、10であり、つまりp1=10である。 In the following, participants have a first group of patients with depression (the disease label is represented by "Major depressive disorder") and a normal control group (the disease label is represented by "HC (Healthy control)"). The rows of the data matrix X 1 represent human attribute information (human characteristic information and measurement condition information) of one participant, and, for example, the characteristic information and the measurement condition information include the following:
i) Disease label (MDD or HC),
ii) Site information (Where the participant's brain activity was measured, site A, B, C)
iii) Age iv) Sex v) Imaging conditions (open or closed eyes)
vi)
vii)
viii)
Specifically, the number of columns of the human attribute information data matrix X 1 is 10, that is, p 1 = 10.
最初の列は、1(=MDD)あるいは0(=HC)を含んでいる。
The first column contains 1 (= MDD) or 0 (= HC).
次の3つの列は、脳活動の計測された施設(場所)を示しており、この場合は、3つの異なるサイトで計測が行われたことに相当して、[100](サイトA)、[010](サイトB)あるいは[001](サイトC)のいずれかを含んでいる。
The next three columns show the measured institutions (locations) of brain activity, in this case corresponding to having been measured at three different sites [100] (site A), [010] (Site B) or [001] (Site C) is included.
第5列は、参加者の年齢の値を含んでおり、第6列は、参加者の性別の情報であって、1(男性)あるいは0(女性)のいずれかの値を含んでおり、第7列は、測定条件のうち、測定中に参加者が、目を開いていたか、あるいは、目を閉じていたかを示し、1(開眼)あるいは0(閉眼)の値を含んでいる。また、最後の3つの列は、3つの薬剤の投薬履歴に関するステータス情報を含んでおり、それぞれの列は、1(薬物治療あり)あるい0(薬物治療履歴無し)の値を含んでいる。
The fifth column contains the participant's age value, and the sixth column is the participant's gender information, including either 1 (male) or 0 (female) values, The seventh column indicates, of the measurement conditions, whether the participant had opened or closed his eyes during measurement, and includes a value of 1 (open eye) or 0 (closed eye). Also, the last three columns contain status information about the medication history of the three drugs, and each column contains a value of 1 (with drug treatment) or 0 (without drug treatment history).
なお、人特性情報および測定条件情報は、上記のようなものに限定されず、たとえば、参加者の他の薬剤の投薬履歴の情報などの他の特性や、他の測定条件、たとえば、MRI装置の印加磁場の大きさなどの条件の情報を含んでいてもよい。
The human characteristic information and the measurement condition information are not limited to those described above, for example, other characteristics such as information on the medication history of other agents of the participant, and other measurement conditions, for example, an MRI apparatus The information of conditions, such as the magnitude of the applied magnetic field, may be included.
第2のデータ行列X2は、参加者の機能的結合の相関(FC)を表わす相関行列の非対角の下三角の部分の要素を行ベクトル形式で表現したものであるとする。
Second data matrix X 2 is assumed to be a representation of the elements of the lower triangular portion of the non-diagonal of the correlation matrix representing a correlation of the functional binding of the participants (FC) in a row vector format.
そして、L1-SCCSが、行列のペアX1およびX2に適用され、それから、スパース投影ベクトルw1およびw2が導き出される。
Then, L1-SCCS is applied to the pair X 1 and X 2 matrix, then, a sparse projection vectors w 1 and w 2 are derived.
そして、上述のとおり、ハイパーパラメータλ1およびλ2を所定の値に設定したときに、スパース化により第1のデータ行列X1が、スパース投影ベクトルw1により、特定の人属性情報、この場合は、「疾患ラベル」のみとなる正準変数に投影される条件が満たされるようにする。この場合に、対応する第2のデータ行列X2において、疾患ラベルにのみ関連する機能的結合の相関行列要素を特定するためのインデックス(要素)を特定するために、スパース投影ベクトルw2を使用する。
Then, as described above, when the hyper parameters λ 1 and λ 2 are set to predetermined values, the first data matrix X 1 is sparsed and the specific projection of human attribute information is performed by the sparse projection vector w 1 by sparging. The condition to be projected on the canonical variable that is only the "disease label" is satisfied. In this case, the sparse projection vector w 2 is used to specify the index (element) for identifying the correlation matrix element of the functional combination associated only with the disease label in the corresponding second data matrix X 2 Do.
すなわち、内ループ特徴選択では、L1-SCCAのハイパーパラメータλ1およびλ2は、たとえば、0.1の大きさのステップで、0.1と0.9の間で独立して変更される。
That is, in inner loop feature selection, hyperparameters λ 1 and λ 2 of L 1 -SCCA are independently modified between 0.1 and 0.9, for example in steps of size 0.1.
ただし、ハイパーパラメータλ1およびλ2を可変とする範囲および変化させるステップの大きさは、このような例に限定されるものではない。
However, the size of the step of ranges and varying hyperparameters lambda 1 and lambda 2 and the variable is not intended to be limited to such an example.
L1-SCCAの処理に対して、「疾患」ラベルにのみ接続した正準変数が存在するようなハイパーパラメータλ1およびλ2の範囲を見つけ出す。
For the treatment of L1-SCCA, find the range of hyperparameters λ 1 and λ 2 such that there is a canonical variable connected only to the “disease” label.
導出されたスパース投影ベクトルw2のゼロでない要素によって規定される部分空間へ元の相関行列要素を投影することを以下のようにして表現する。
The projection of the original correlation matrix element onto the subspace defined by the non-zero elements of the derived sparse projection vector w 2 is expressed as follows.
ここで、投影ベクトルw2のk番目のゼロでない要素のインデックスを示すために変数ikを定義する。ここで、1≦k≦mであり、mはゼロでないエレメントの数を示す。
We define the variable i k to indicate the index of the element is not a k-th zero of the projection vector w 2. Here, 1 ≦ k ≦ m, and m indicates the number of non-zero elements.
そして、以下のような部分空間への投影マトリックスEを考える。
Then, consider a projection matrix E to a subspace as follows.

最後に、元の相関行列要素ベクトルx2を以下のように投影することにより部分空間z∈Rmへのベクトルが導かれる。
Finally, the vector to the subspace zεR m is derived by projecting the original correlation matrix element vector x 2 as follows:
結果として、疾患ラベル(MDD/HC)に関連する特定の数だけの特徴量(相関行列の要素)を選択することができる。
As a result, it is possible to select only a specific number of feature quantities (elements of the correlation matrix) related to the disease label (MDD / HC).
診断のラベルとのみ関係のある正準変数に相当する相関行列要素を選ぶことによって、分類に本質的な相関行列要素が選択される。
By choosing correlation matrix elements that correspond to canonical variables that are only relevant to the diagnostic label, correlation matrix elements that are essential for classification are selected.
(内ループ特徴抽出)
図7は、内ループ特徴選択を説明するための概念図である。 (Inside loop feature extraction)
FIG. 7 is a conceptual diagram for explaining inner loop feature selection.
図7は、内ループ特徴選択を説明するための概念図である。 (Inside loop feature extraction)
FIG. 7 is a conceptual diagram for explaining inner loop feature selection.
図6のステップS104の内ループ特徴選択では、図7に説明するようにして、参加者の集合をK個(K:2以上の自然数)に分割して、(K-1)個の部分集合のうち、1つの集合を除いた残りの部分集合について、上述したL1-SCCAを実行することを、(K-1)回繰り返す。
In the inner loop feature selection in step S104 in FIG. 6, as described in FIG. 7, the set of participants is divided into K (K: two or more natural numbers), and (K-1) subsets Among the remaining subsets excluding one set, performing L1-SCCA described above is repeated (K-1) times.
すなわち、図7(a)に示すように、参加者の集合のうちの(K-1)/K(たとえば、K=9であれば8/9)に相当する部分集合(これを、以下「内ループ訓練データ」と呼ぶ)が、このような内ループ特徴選択に使用される。K個の部分集合のうちの残りの1つは、後に説明する外ループ特徴選択において、訓練対象となるテストデータを含む「テストプール」として使用されるため、内ループ特徴選択では使用されない。
That is, as shown in FIG. 7A, a subset corresponding to (K-1) / K (for example, 8/9 if K = 9) of the set of participants Inner loop training data (referred to as') is used for such inner loop feature selection. The remaining one of the K subsets is not used in inner loop feature selection because it is used as a "test pool" containing test data to be trained in outer loop feature selection described later.
図7(b)に示すように、(K-1)個の部分集合のうち、1つの集合(図7(b)で斜線で示す)を除いた残りの部分集合について、ハイパーパラメータλ1およびλ2を所定の範囲で、所定ステップずつ変化させ、L1-SCCAを実行する。特定のハイパーパラメータλ1およびλ2の範囲で、「診断」ラベルとのみ関連がある正準変数に関係している機能的結合要素FCを特徴量として抽出する。
As shown in FIG. 7 (b), hyperparameter λ 1 and hyperparameters λ 1 and (K-1) of the remaining subsets excluding one set (indicated by hatching in FIG. 7 (b)) among the (K−1) subsets. L 1 -SCCA is executed by changing λ 2 by a predetermined step at a predetermined range. In the range of specific hyperparameters λ 1 and λ 2 , a functional combination element FC related to a canonical variable related only to the “diagnosis” label is extracted as a feature value.
このような抽出処理を、(K-1)個の部分集合のうち、除くことになる1つの集合を順次変えた部分集合について、反復する。
Such extraction processing is repeated for subsets in which one set to be excluded is sequentially changed among (K−1) subsets.
各反復において、抽出された機能的結合の相関行列の要素FCの和集合を「内ループで選択された機能的結合要素FCの和集合」(第1の和集合)とする。
In each iteration, let the union of the elements FC of the extracted functional connection correlation matrix be “the union of the functional connection elements FC selected in the inner loop” (first union).
このような処理を行うことで、攪乱変数NVに相当する、異なる撮像サイトでの人属性情報や異なる撮像サイトでの撮像条件の相違によって引き起こされた不適当な影響は縮小されることになる。
By performing such processing, an inappropriate influence caused by human attribute information at different imaging sites corresponding to the disturbance variable NV or an imaging condition difference at different imaging sites is reduced.
この手続きは、後に説明するように、たとえば、日本国内の複数の撮像サイトからのMRI計測データに基づいて生成した第1の分類器を、外国、たとえば、米国にまで汎化するロバストに構築するのに役立つことになる。
This procedure constructs the first classifier, which is generated based on, for example, MRI measurement data from a plurality of imaging sites in Japan, as described later, robustly generalizes to foreign countries, for example, the United States It will help.
再び、図6に戻って、続いて、データ処理部32は、内ループ特徴選択の結果に基づいて、スパースロジスティック回帰を用いて、第2の特徴抽出の処理を実行する(S106)。
Referring back to FIG. 6 again, the data processing unit 32 executes the second feature extraction process using sparse logistic regression based on the result of the inner loop feature selection (S106).
以下では、ステップS106の処理を「外ループ特徴選択」と呼ぶ。
Hereinafter, the process of step S106 is referred to as “outer loop feature selection”.
ここで、ステップS106での外ループ特徴選択の処理を説明するために、「スパースロジスティック回帰」と、「外ループ特徴選択」について、以下、それぞれ説明する。
Here, “sparse logistic regression” and “outer loop feature selection” will be respectively described below in order to explain the process of outer loop feature selection in step S106.
(スパースロジスティック回帰)
スパースロジスティック回帰は、ロジスティック回帰分析をベイズ推定の枠組みに拡張した手法であり、特徴ベクトルの次元圧縮を判別のための重み推定と同時に行う手法である。データの特徴ベクトルの次元数が非常に高く、不要な特徴量が多く含まれている場合に有用である。不要な特徴量に対しては線形判別分析における重みパラメータをゼロにし(すなわち、特徴選択を行い)、判別に関連するごく少数の特徴量だけを取り出す(スパース性)。 (Sparse logistic regression)
Sparse logistic regression is a method in which logistic regression analysis is extended to the framework of Bayesian estimation, and dimension compression of feature vectors is performed simultaneously with weight estimation for discrimination. It is useful when the number of dimensions of feature vectors of data is very high and a large number of unnecessary feature quantities are included. For unnecessary feature quantities, weight parameters in linear discriminant analysis are made zero (ie, feature selection is performed), and only a very small number of feature quantities related to discrimination are extracted (sparseness).
スパースロジスティック回帰では得られた特徴データに対して、分類するクラスへの所属する確率pをクラス毎に求め、最大値を出力したクラスに割り当てる。pはロジスティック回帰式によって出力される。重みの推定はARD(Automatic Relevance determination)によって行われ、クラス判別への貢献が少ない特徴量は、重みが0に近づくことで計算から除外される。
In sparse logistic regression, the probability p belonging to the class to be classified is obtained for each class with respect to the obtained feature data, and the maximum value is assigned to the output class. p is output by logistic regression. Weight estimation is performed by ARD (Automatic Relevance Determination), and feature quantities that contribute little to class discrimination are excluded from calculation as the weight approaches zero.
すなわち、上述のL1正則化CCAを用いて抽出された特徴量の第1の和集合を入力として、次の階層ベイズ推定にもとづく第1の分類器を用いて、疾患ラベルの予測を行う。
That is, the disease label is predicted using the first classifier based on the next hierarchical Bayesian estimation with the first union of the feature values extracted using the L1 regularization CCA described above as an input.
ここで、上述した式(2)で抽出された特徴入力z(選択されたFC)から診断のラベルが疾患(ここでは、自閉症との診断)となる確率を予測するために、分類器としてロジスティック回帰を使用する。
Here, in order to predict the probability that the diagnostic label will be a disease (here, a diagnosis of autism) from the feature input z (selected FC) extracted by the above-mentioned equation (2), a classifier Use logistic regression as

ここで、yは、診断クラス・ラベルを表わし、つまり、y=1はMDDクラスを、y=0はHCクラスをそれぞれ示す。
Here, y represents a diagnostic class label, that is, y = 1 represents an MDD class and y = 0 represents an HC class.
また、以下のzハット(文字の頭部に^が付けられたものを、「ハット」と呼ぶ)は、拡張入力を備えた特徴ベクトルである。
Also, the following z-hat (a letter with a ^ attached to it is called a "hat") is a feature vector with an expanded input.
ここで、特徴ベクトルzは、1人の参加者の安静時MRIサンプルの結合相関行列から式(2)に従って、抽出される。
Here, the feature vector z is extracted from the joint correlation matrix of resting MRI samples of one participant according to equation (2).
拡張入力“1”を使用することは、第1の分類器に対する一定の(バイアス)入力を導入するための、標準的なアプローチである。
Using the expanded input "1" is a standard approach to introduce a constant (bias) input to the first classifier.
以下のようなθは、ロジスティック関数のパラメータベクトルである。
The following θ is a parameter vector of the logistic function.
この際のパラメータθの分布を以下のような正規分布に設定する。
The distribution of the parameter θ at this time is set to the following normal distribution.
さらに、パラメータwの分布のハイパーパラメータαの分布を以下のように設定することにより、階層ベイズ推定を行うことによりそれぞれのパラメータの分布を推定する。
Furthermore, the distribution of each parameter is estimated by performing hierarchical Bayesian estimation by setting the distribution of the hyper parameter α of the distribution of the parameter w as follows.

ここで、a0, b0はハイパーパラメータのガンマ分布を決定するパラメータである。αはベクトルθの正規分布の分散を表現するパラメータベクトルで、そのベクトルのi番目の要素がαiである。
Here, a 0 , b 0 are parameters for determining the hyperparameter gamma distribution. α is a parameter vector that represents the variance of the normal distribution of the vector θ, and the ith element of the vector is α i .
なお、このようなスパースロジスティック回帰については、以下の文献に開示がある。
Such sparse logistic regression is disclosed in the following documents.
文献:Okito Yamashita, Masa aki Sato, Taku Yoshioka, Frank Tong, and Yukiyasu Kamitani. “Sparse Estimation automatically selects voxels relevant for the decoding of fMRI activity patterns.” NeuroImage, Vol. 42, No. 4, pp. 1414-1429, 2008.
Reference: Okito Yamashita, Masa aki Sato, Taku Yoshioka, Frank Tong, and Yukiyasu Kamitani. "Sparse Estimation automatically selects voxels relevant for the decoding of fMRI activity patterns." NeuroImage, Vol. 42, No. 4, pp. 1414-1429 , 2008.
(外ループ特徴選択)
図11は、外ループ特徴選択を説明するための概念図である。 (Outer loop feature selection)
FIG. 11 is a conceptual diagram for explaining outer loop feature selection.
図11は、外ループ特徴選択を説明するための概念図である。 (Outer loop feature selection)
FIG. 11 is a conceptual diagram for explaining outer loop feature selection.
図6のステップS106の外ループ特徴選択では、図11に説明するようにして、内ループ特徴選択の際に、参加者の集合をK個(K:2以上の自然数)に分割したうち、内ループ特徴選択に使用した(K-1)個の部分集合を除く残りの1つの部分集合を、訓練対象となるテストデータを含む「テストプール」として使用する。
In the outer loop feature selection in step S106 in FIG. 6, the set of participants is divided into K (K: a natural number of 2 or more) during the inner loop feature selection as described in FIG. 11. The remaining one subset excluding (K-1) subsets used for loop feature selection is used as a "test pool" containing test data to be trained.
すなわち、図11に示すように、たとえば、このテストプールをL個のグループに分割し、このL個のグループから順次1つのグループ(図11の点線四角内で、斜線で示す)を選択し、参加者の集合この選択されたグループを除く参加者について、第1の和集合である機能的結合の相関行列の要素FCを説明変数として、疾患ラベルを予測する第1の分類器をスパースロジスティック回帰により生成する。このときに、スパースロジスティック回帰により「機能的結合の相関行列の要素FC」が、さらに選択される。これを「外ループで選択された機能的結合の相関行列の要素FC」と呼ぶ。
That is, as shown in FIG. 11, for example, this test pool is divided into L groups, and one group (indicated by hatching in a dotted square in FIG. 11) is sequentially selected from the L groups, A set of participants For the participants other than the selected group, a first classifier that predicts a disease label is sparse logistic regression, with the element FC of the functional union correlation matrix that is the first union set as an explanatory variable. Generate by At this time, “element FC of correlation matrix of functional connection” is further selected by sparse logistic regression. This is called "the element FC of the correlation matrix of the functional connection selected in the outer loop".
このようにして、L個のグループから順次1つのグループを選択して、このような処理をL回反復することで、抽出された機能的結合の相関行列の要素FCの和集合を「外ループで選択された機能的結合要素FCの和集合」(第2の和集合)とする。
In this manner, by selecting one group in order from L groups and repeating such processing L times, the union set of the elements FC of the correlation matrix of the extracted functional combinations is “outer loop. And the union of the functional connection elements FC selected in (the second union).
このように、外ループ特徴抽出において使用されるテスト集合は、内ループ特徴抽出において次元数を縮小するために使用されたデータセットから常に独立している。
Thus, the test set used in outer loop feature extraction is always independent of the data set used to reduce the dimensionality in inner loop feature extraction.
なお、ここでは、一例として、特に、L個のグループの各々は、1人の参加者を含むものとする。この場合は、上記反復処理において、除かれた1人の参加者について、生成された第1の分類器で予測処理を行い、その除かれた1人の参加者についての疾患ラベルと予測結果との誤差を累積処理することは、いわゆる1個抜き交差検証(Leave-One-Out Cross Validation:LOOCV)を行うことに相当する。したがって、図11の処理において、各反復処理で、上述の誤差を算出し、これを累積してL回について平均することで、生成された第1の分類器の交差検証、言い換えると、汎化能力の評価を行うことも可能である。
Here, as an example, in particular, each of the L groups includes one participant. In this case, in the above-described iterative processing, prediction processing is performed with the first classifier generated for one excluded participant, and the disease label and the prediction result for the excluded one participant Cumulative processing of the error of is equivalent to performing so-called one-out cross validation (LOOCV). Therefore, in the process of FIG. 11, the above-mentioned error is calculated in each iterative process, and this is accumulated and averaged for L times to perform cross validation of the first classifier generated, in other words, generalization It is also possible to evaluate the ability.
(第1の分類器の生成)
再び図6に戻って、続いて、データ処理部32は、外ループ特徴選択の結果(第2の和集合)に基づいて、スパースロジスティック回帰により、分類器の生成処理を実行する(S108)。 (Generation of the first classifier)
Returning again to FIG. 6, subsequently, the data processing unit 32 performs a classifier generation process by sparse logistic regression based on the result (second union) of outer loop feature selection (S108).
図13は、ステップS108での分類器の生成処理の概念を示す図である。
FIG. 13 is a diagram showing the concept of the classifier generation process in step S108.
図13に示すように、ステップS108では、第1の和集合から外ループ特徴選択により抽出された第2の和集合を説明変数として、全ての参加者についてのスパースロジスティック回帰により、分類器が生成される。
As shown in FIG. 13, in step S108, a classifier is generated by sparse logistic regression for all the participants, using the second union set extracted from the first union set by outer loop feature selection as an explanatory variable. Be done.
生成された分類器を特定するための分類器データ(関数形およびパラメータに関するデータ)3112は、不揮発性記憶装置2080に格納され、後に、以上のような訓練に使用されたのとは異なるMRI測定データ(テストデータ)が入力された際に、テストデータに対する疾患ラベルの推定を実行する際の判別処理に使用される。
Classifier data (data relating to function types and parameters) 3112 for identifying the generated classifier is stored in the non-volatile storage device 2080 and is different from the MRI measurement used for the training as described above. When data (test data) is input, it is used for discrimination processing when performing estimation of a disease label on test data.
すなわち、事前の医師の診断に基づいて、健常群、うつ病患者群に分けられた参加者の脳領域間(関心領域間)の活動度の相関(結合)を測定し、測定結果に対する機械学習により、これらとは異なる新たな参加者についてのテストデータがうつ症状または健常のいずれに相当するかを判別するように生成された分類器が、うつ症状のバイオマーカーとして機能する。
That is, based on the previous diagnosis of a doctor, the correlation (coupling) of the activity (between regions of interest) between brain regions of participants divided into the healthy group and the depression patient group is measured, and machine learning for the measurement result Thus, a classifier generated to determine whether test data for new participants different from these correspond to depression symptoms or health functions as a biomarker for depression symptoms.
このとき、バイオマーカーの出力である「疾患ラベル」としては、分類器がロジスティック回帰により生成されることから、疾患である確率(または健常である確率)を含んでもよい。たとえば、「疾患である確率は、○○%」といような表示として出力する。このような確率を、「疾患マーカー」として使用することが可能である。
At this time, the “disease label” which is the output of the biomarker may include the probability of being a disease (or the probability of being healthy) since the classifier is generated by logistic regression. For example, it is output as a display such as “probability of disease is ○%”. Such a probability can be used as a "disease marker".
また、分類器の出力となる属性については、必ずしも、疾患の判別に限られず、他の属性についての出力であってもよい。この場合も、その属性について、いずれのクラスに属するかという離散的な判別結果を出力してもよいし、その属性について、あるクラスに属する連続的な値、たとえば確率を出力してもよい。
Moreover, about the attribute used as the output of a classifier, it is not necessarily limited to discrimination | determination of disease, and the output about another attribute may be sufficient. Also in this case, a discrete determination result may be output as to which attribute the attribute belongs, or continuous values belonging to a certain class, for example, a probability may be output.
すなわち、分類器の学習(作成)においては、うつ症状のバイオマーカー作成のため,rs-fcMRIデータを入力として,上述の内ループ特徴選択および外ループ特徴選択により特徴抽出を行い、抽出された特徴量を説明変数として生成された分類器によりうつ症状・健常ラベル判別を行う。
That is, in the learning (creation) of the classifier, in order to create a biomarker for depressive symptoms, feature extraction is performed by the above-mentioned inner loop feature selection and outer loop feature selection using rs-fcMRI data as an input, and the extracted features Depressive symptoms / healthy label discrimination is performed by a classifier generated using the amount as an explanatory variable.
(内ループ特徴選択での処理)
図8は、内ループ特徴選択処理の概念を説明するための図である。 (Processing in inner loop feature selection)
FIG. 8 is a diagram for explaining the concept of inner loop feature selection processing.
図8は、内ループ特徴選択処理の概念を説明するための図である。 (Processing in inner loop feature selection)
FIG. 8 is a diagram for explaining the concept of inner loop feature selection processing.
図9は、一例として、内ループ特徴選択を行った際の反復処理のうち、特定のハイパーパラメータλ1およびλ2に対する結果を示す図である。
FIG. 9 is a diagram showing the results for specific hyperparameters λ 1 and λ 2 in the iterative process when inner loop feature selection is performed as an example.
図8を参照して、入れ子構造になっている特徴選択において、L1-SCCAの反復のうちの1つを表わし、ここでは、正準変数が「疾患ラベル」にのみ接続されている。
Referring to FIG. 8, in nested feature selection, it represents one of the L1-SCCA iterations, where the canonical variable is connected only to the "disease label".
図8では、正準変数が「疾患ラベル」にのみ接続されていることを、疾患ラベルがただ1つの正準変数w1
Tx1と、実線で接続されることで表している。
In FIG. 8, the fact that the canonical variable is connected only to the “disease label” is indicated by the solid state that the disease label is connected to only one canonical variable w 1 T x 1 .
また、正準変数w1
Tx1と正準変数w2
Tx2とを接続する点線の上の記号cjは、それぞれの正準変数間の相関係数を表す。
Also, the symbol c j on the dotted line connecting the canonical variable w 1 T x 1 and the canonical variable w 2 T x 2 represents the correlation coefficient between the respective canonical variables.
正準変数w1
Tx1が「疾患ラベル」にのみ接続されているときに、対応する正準変数w2
Tx2と接続する機能的結合の相関行列の非対角の下三角行列の要素が、特徴量として選択される。
When the canonical variable w 1 T x 1 is connected only to the “disease label”, the off-diagonal lower triangular matrix of the correlation matrix of the functional connection to connect with the corresponding canonical variable w 2 T x 2 An element is selected as a feature quantity.
図9では、例として、最初の外ループの中で、各人属性情報につき少なくとも1つの正準相関を生成する最も小さなハイパーパラメータの組合せを示す。
FIG. 9 shows, by way of example, the smallest combination of hyperparameters that generates at least one canonical correlation for each person attribute information in the first outer loop.
正準変数は、丸によって表わされる。
Canonical variables are represented by circles.
左の列の丸は人特性情報と測定条件に由来する、正準変数w1
Tx1を示す。一方で、右の列の丸は、機能的結合(FC)に由来する正準変数w2
Tx2を示す。
Circles in the left column indicate canonical variables w 1 T x 1 derived from human characteristic information and measurement conditions. On the other hand, the circles in the right column show the canonical variable w 2 T x 2 derived from the functional binding (FC).
上述のとおり、正準変数を接続する点線の上の数字は、正準変数w1
Tx1とw2
Tx2の間の相関係数を表わす。
As mentioned above, the numbers above the dotted line connecting the canonical variables represent the correlation coefficient between the canonical variables w 1 T x 1 and w 2 T x 2 .
人属性情報のラベルおよび正準変数w2
Tx2の間の接続は実線または点線で表わされる。
The connection between the label of human attribute information and the canonical variable w 2 T x 2 is represented by a solid line or a dotted line.
(内ループ特徴選択での処理)
図10は、内ループ特徴選択の処理を、より詳しく説明するためのフローチャートである。 (Processing in inner loop feature selection)
FIG. 10 is a flowchart for explaining in more detail the process of inner loop feature selection.
図10は、内ループ特徴選択の処理を、より詳しく説明するためのフローチャートである。 (Processing in inner loop feature selection)
FIG. 10 is a flowchart for explaining in more detail the process of inner loop feature selection.
内ループ特徴選択にあたっては、参加者の集合は、図7(a)に示したように、K個の部分集合に分けられ、このうちの特定の1個の部分集合を除く(K-1)個の部分集合が、使用される。
In inner loop feature selection, the set of participants is divided into K subsets as shown in FIG. 7 (a), and one specific subset of them is excluded (K-1) Subsets are used.
図10を参照して、内ループ特徴選択の処理が開始されると、演算処理装置(CPU)2040は、ハイパーパラメータλ1およびλ2を初期値である(λ1,λ2)=(0.1,0.1)に設定する(S200)。
Referring to FIG. 10, when the process of inner loop feature selection is started, arithmetic processing unit (CPU) 2040 sets hyper parameters λ 1 and λ 2 as initial values (λ 1 , λ 2 ) = (0). .1, 0.1) (S200).
続いて、変数iの値が1に設定され(S202)、CPU2040は、iの値が、内ループ特徴選択の反復回数(K-1)を超えない場合(S204でN)は、内ループ訓練データのうち、i番目のデータブロックを除き、不揮発性記憶装置2080中に格納された、参加者の人属性情報3104および機能的結合の相関行列データ3106に基づいて、スパース正準相関分析を実行する(S206)。
Subsequently, when the value of the variable i is set to 1 (S202) and the value of i does not exceed the number of iterations of inner loop feature selection (K-1) (N in S204), the inner loop training is performed. Perform sparse regular correlation analysis based on the participant's human attribute information 3104 and functional combination correlation matrix data 3106 stored in the non-volatile storage device 2080 except the i-th data block among the data (S206).
現在の(λ1,λ2)の値に組について、疾患ラベルとのみ結合する正準変数が存在する場合(S208でY)、CPU2040は、疾患ラベルとのみ結合する正準変数に対応する機能的結合の相関行列の要素(FC)を抽出し、不揮発性記憶装置2080に、記憶する(S210)。ステップS210の処理の後、または、現在の(λ1,λ2)の値に組について、疾患ラベルとのみ結合する正準変数が存在しない場合(S208でN)は、iの値を1だけインクリメントして、処理は、ステップS204に復帰する。
When there is a canonical variable that binds only to the disease label for the current value of (λ 1 , λ 2 ) (Y in S208), the CPU 2040 has a function corresponding to the canonical variable that binds only to the disease label The elements (FC) of the correlation matrix of the dynamic coupling are extracted and stored in the non-volatile storage device 2080 (S210). After the process of step S210, or when there is no canonical variable binding only to the disease label for the current (λ 1 , λ 2 ) value pair (N in S208), only the value of i is 1 After incrementing, the process returns to step S204.
したがって、CPU2040は、(K-1)回にわたって、ステップS206~S212の処理を繰り返す。
Therefore, the CPU 2040 repeats the processing of steps S206 to S212 (K-1) times.
ステップS204において、iの値が、内ループ特徴選択の反復回数(K-1)を超えた場合(S204でY)は、CPU2040は、(λ1,λ2)について、所定のルールにしがたい、λ1およびλ2のいずれか一方を所定のステップ量だけ変化させる(S214)。ステップS216において、(λ1,λ2)の値が可変範囲内であるときは(S216でY)、CPU2040は、処理をステップS202に復帰させる。
In step S204, when the value of i exceeds the number of iterations of inner loop feature selection (K-1) (Y in S204), the CPU 2040 can not make the predetermined rule for (λ 1 , λ 2 ) , Λ 1 and λ 2 are changed by a predetermined step amount (S 214). In step S216, when the value of (λ 1 , λ 2 ) is within the variable range (Y in S216), the CPU 2040 returns the process to step S202.
(λ1,λ2)の可能な全ての値の組について処理が終了すると(S216でN)、CPU2040は、これまでの処理で抽出された機能的結合の相関行列の要素(FC)の和集合を求め、不揮発性記憶装置2080に、第1の機能的結合和集合データ3108として格納することで処理が終了する。
When the processing is completed for all possible sets of values of (λ 1 , λ 2 ) (N in S216), the CPU 2040 sums the elements (FC) of the correlation matrix of the functional combination extracted in the previous processing. The process is ended by obtaining a set and storing it as the first functional combined sum set data 3108 in the non-volatile storage device 2080.
(外ループ特徴選択での処理)
図12は、外ループ特徴選択の処理を、より詳しく説明するためのフローチャートである。 (Processing with outer loop feature selection)
FIG. 12 is a flowchart for explaining the process of outer loop feature selection in more detail.
図12は、外ループ特徴選択の処理を、より詳しく説明するためのフローチャートである。 (Processing with outer loop feature selection)
FIG. 12 is a flowchart for explaining the process of outer loop feature selection in more detail.
外ループ特徴選択にあたっては、参加者の集合は、図11で示したように、K個の部分集合に分けられ、このうちの内ループ特徴選択では使用されなかった1個の部分集合がテストプールとして使用される。このテストプールに含まれる参加者の人数をNT人とする。
In outer loop feature selection, the set of participants is divided into K subsets as shown in FIG. 11, and one subset not used in inner loop feature selection is a test pool. Used as The number of participants included in this test pool is NT.
また、以下では、一例として、1個抜き交差検証(LOOCV)処理を行うものとして説明する。
Moreover, below, as an example, it demonstrates as what performs 1 piece omission crossing verification (LOOCV) process.
図12を参照して、外ループ特徴選択の処理が開始されると、演算処理装置(CPU)2040は、変数iの値を1に設定し(S300)、CPU2040は、iの値が、外ループ特徴選択の反復回数NTを超えない場合(S302でN)は、テストプールのうち、i番目のデータを除き、不揮発性記憶装置2080中に格納された、参加者の人属性情報3104および機能的結合の相関行列データ3106に基づいて、スパースロジスティック回帰(SLR)を実行して、テスト分類器を生成する(S304)。
Referring to FIG. 12, when the process of outer loop feature selection is started, arithmetic processing unit (CPU) 2040 sets the value of variable i to 1 (S300), and CPU 2040 determines that the value of i is outside. If the number of iterations NT of loop feature selection is not exceeded (N in S302), the participant's personal attribute information 3104 and function stored in the non-volatile storage device 2080 except the i-th data in the test pool Sparse logistic regression (SLR) is performed based on the correlation matrix data 3106 of the specific connection to generate a test classifier (S304).
続いて、CPU2040は、生成されたテスト分類器により、除かれたi番目のデータに対するSLRによる予測値を算出する(S306)。
Subsequently, the CPU 2040 uses the generated test classifier to calculate an SLR predicted value for the excluded i-th data (S306).
さらに、CPU2040は、テスト分類器を生成する際のスパース化により抽出された機能的結合FCを、選択された特徴量として不揮発性記憶装置2080に格納し、変数iの値を1だけインクリメントする(S310)。
Furthermore, the CPU 2040 stores the functional combination FC extracted by sparsification at the time of generating the test classifier in the non-volatile storage device 2080 as the selected feature amount, and increments the value of the variable i by 1 ( S310).
S304~S308の処理がNT回繰り返された後、変数iの値がNTを超えると(S302でY)、CPU2040は、LOOCVとしての2乗誤差見積の算出する(S312)。
After the processing of S304 to S308 is repeated NT times, when the value of the variable i exceeds NT (Y in S302), the CPU 2040 calculates a squared error estimate as the LOOCV (S312).
続いて、CPU2040は、NT回の繰り返し処理により、抽出された機能的結合FCの和集合(第2の和集合)を求め、第2の機能的結合和集合データ3110として、不揮発性記憶装置2080に格納して処理が終了する。
Subsequently, the CPU 2040 obtains the union (the second union) of the extracted functional combinations FC by NT repetitive processing, and the non-volatile storage device 2080 is obtained as the second functional union-sum data 3110. Is stored in, and the process ends.
(分類器の生成処理)
図13は、最終的に第1の分類器を生成する手続きを説明するための概念図である。 (Classifier generation process)
FIG. 13 is a conceptual diagram for explaining the procedure of finally generating the first classifier.
図13は、最終的に第1の分類器を生成する手続きを説明するための概念図である。 (Classifier generation process)
FIG. 13 is a conceptual diagram for explaining the procedure of finally generating the first classifier.
図13に示すように、分類器生成処理では、内ループ特徴選択処理および外ループ特徴選択処理により、最終的に抽出された第2の機能的結合和集合データ3110を説明変数とし、参加者全員について、スパースロジスティック回帰によって、第1の分類器を生成する。生成された第1の分類器を特定するための情報(ロジスティック関数のパラメータベクトルθ等)は、不揮発性記憶装置2080に記憶される。
As shown in FIG. 13, in the classifier generation process, the second functional combination sum set data 3110 finally extracted by the inner loop feature selection process and the outer loop feature selection process is used as an explanatory variable, and all the participants are , Generate a first classifier by sparse logistic regression. Information (a parameter vector θ of the logistic function, etc.) for identifying the generated first classifier is stored in the non-volatile storage device 2080.
上述したように、ここまで説明した手続きでは、「うつ病」を疾患ラベルとした場合は、表1に記載の12個の機能的結合が、最終的に抽出された第2の機能的結合和集合データ3110の説明変数として使用され、第1の分類器が生成される。
As described above, in the procedure described above, when “depression” is used as a disease label, 12 functional combinations described in Table 1 are the second functional combination sum finally extracted. Used as an explanatory variable of aggregate data 3110, a first classifier is generated.
ただし、ロジスティック回帰式で表現される分類器の生成には表1に記載の全ての機能的結合を使用してもよいが、少なくとも機能的結合識別番号1及び機能的結合識別番号2の一方、あるいは両方を選択して使用してもよい。また、寄与度が高い複数の機能的結合を選択してもよい。このような12個の機能的結合からの分類器に使用する前記機能的結合の選択は、データ処理部32または後述するコンピュータ300のCPUが行ってもよいが、ヒトが行ってもよい。
However, although all functional combinations described in Table 1 may be used to generate a classifier represented by logistic regression, at least one of functional combination identification number 1 and functional combination identification number 2; Alternatively, both may be selected and used. Also, multiple functional combinations with high degree of contribution may be selected. The selection of the functional combination to be used for the classifier from such 12 functional combinations may be performed by the data processing unit 32 or the CPU of the computer 300 described later, but may be performed by a human.
(判別処理)
図14は、生成した第1の分類器を用いて被検者のrs-fcMRIのデータから疾患ラベルを判別するためにデータ処理部32が行う処理を説明するためのフローチャート図である。 (Discrimination processing)
FIG. 14 is a flowchart for explaining the process performed by the data processing unit 32 in order to determine the disease label from the data of the subject's rs-fc MRI using the generated first classifier.
CPU2040は、ステップS401において、MRI撮像部25から安静時の被検者rs-fcMRI測定データ3113をインタフェース部44を介して取得する。
The CPU 2040 acquires the subject rs-fc MRI measurement data 3113 at rest from the MRI imaging unit 25 via the interface unit 44 in step S401.
CPU2040は、ステップS402~S403おいて上記2.に記載の前処理を行い、表1に記載の機能的結合の全て、あるいは一部について相関行列の要素を抽出する。
The CPU 2040 executes steps S402 to S403 to execute the above-described 2. And extract the elements of the correlation matrix for all or part of the functional combinations described in Table 1.
ステップS404おいて、CPU2040は、抽出した相関行列の要素に対してピアソン相関係数を求める。ステップS405~S406おいて、CPU2040は、前記相関係数を分類器に入力し、少なくとも1つの機能的結合についてうつ症状の疾患ラベルを判別するための指標値を生成する。あるいは、望ましくはCPU2040は、前記相関係数を分類器に入力し、複数の機能的結合についての関連重み付け和をうつ症状の疾患ラベルを判別するための指標値として生成する。
In step S404, the CPU 2040 obtains a Pearson correlation coefficient with respect to the elements of the extracted correlation matrix. In steps S405 to S406, the CPU 2040 inputs the correlation coefficient into the classifier, and generates an index value for determining a disease label of depressive symptoms for at least one functional combination. Alternatively, preferably, the CPU 2040 inputs the correlation coefficient into a classifier, and generates an association weighting sum for a plurality of functional combinations as an index value for determining a disease label of depressive symptoms.
次にCPU2040は、ステップS407において指標値を基準値と比較する。例えば数6で表されるような数5によるロジスティック回帰の式では、うつ症状の疾患ラベルと健常者のラベルの閾値は0となるように設定されているため、基準値は0となる。たとえば、「関連重み付け和」をバイオマーカーの指標値として使用する場合は、第1の分類器の感度や特異度を調整するために、基準値を0とは異なる値に設定してもよい。たとえば、基準値を0よりも小さくすれば、「うつ病」の疾患レベルと判別される感度は向上するが、特異度は低下する。上述した分類器の判別結果を、後続する他の情報に基づく医師による診断のための参考情報(支援情報)として使用することを意図する場合は、感度の向上を優先させるという設定もあり得る。
Next, the CPU 2040 compares the index value with the reference value in step S407. For example, in the equation of the logistic regression according to the equation 5 represented by the equation 6, the threshold value of the disease label of the depressive condition and the label of the healthy person is set to 0, so the reference value is 0. For example, in the case where “relevant weighted sum” is used as a biomarker index value, the reference value may be set to a value different from 0 in order to adjust the sensitivity and specificity of the first classifier. For example, if the reference value is smaller than 0, the sensitivity that is determined to be the disease level of "depression" is improved, but the specificity is decreased. If it is intended to use the discrimination result of the classifier described above as reference information (support information) for diagnosis by a doctor based on other subsequent information, setting may be made to give priority to improvement in sensitivity.
ステップS408においてCPU2040は、前記指標値が0よりも高い場合(「YES:Y」)には、前記被検者がうつ症状のラベルであると判別することができる(S409)。また、前記指標値が0よりも低い場合(「NO:N」)には、前記被検者がうつ症状のラベルに相当すると判別することができる(S410)。
In step S408, when the index value is higher than 0 ("YES: Y"), the CPU 2040 can determine that the subject is a label of depression symptoms (S409). In addition, when the index value is lower than 0 ("NO: N"), it can be determined that the subject corresponds to a label of depressive symptoms (S410).
3-2.判別装置2
実施の形態1では、脳活動計測装置(fMRI装置)で、1つの測定場所で計測された脳活動データを計測し、この脳活動データに基づいて、分類器の生成および分類器による疾患ラベルの推定(予測)を、同一のコンピュータによる処理または分散処理により行う構成を説明した。 3-2.Discrimination device 2
In the first embodiment, the brain activity measurement device (fMRI device) measures brain activity data measured at one measurement location, and based on the brain activity data, generates a classifier and a disease label by the classifier. The configuration in which estimation (prediction) is performed by the same computer processing or distributed processing has been described.
実施の形態1では、脳活動計測装置(fMRI装置)で、1つの測定場所で計測された脳活動データを計測し、この脳活動データに基づいて、分類器の生成および分類器による疾患ラベルの推定(予測)を、同一のコンピュータによる処理または分散処理により行う構成を説明した。 3-2.
In the first embodiment, the brain activity measurement device (fMRI device) measures brain activity data measured at one measurement location, and based on the brain activity data, generates a classifier and a disease label by the classifier. The configuration in which estimation (prediction) is performed by the same computer processing or distributed processing has been described.
ただし、i)分類器を機械学習により訓練するための脳活動データの計測(データ収集)、ii)分類器の機械学習による生成処理および特定の被験者についての分類器による疾患ラベルの推定(予測)の処理(推定処理)、iii)上記特定の参加者についての脳活動データの計測(対象者の脳活動計測)を、それぞれ、異なる施設で分散して実行する構成とすることも可能である。
However, i) Measurement of brain activity data for training classifiers by machine learning (data collection), ii) Machine learning processing of classifiers and estimation of disease labels by classifiers for specific subjects (prediction) It is also possible to adopt a configuration in which the measurement of brain activity data (the measurement of brain activity of the subject) for the above specific participant (the estimation process), iii) is performed separately in different facilities.
すなわち、健常群およびうつ病患者群のデータは、MRI装置10自身で測定される場合に限られず、他のMRI装置において測定されたデータをも総合して、分類器の生成が行われてもよい。また、より一般には、データ処理部32は、MRI装置の制御を実行するためのコンピュータである必要は必ずしもなく、1つまたは複数のMRI装置からの測定データを受け取って、分類器の生成処理および生成された分類器により、判別処理を行うことに特化したコンピュータであってもよい。
That is, the data of the healthy group and the depressed patient group is not limited to the case where it is measured by the MRI apparatus 10 itself, and the data generated by other MRI apparatuses may be integrated to generate a classifier. Good. Also, more generally, the data processing unit 32 does not necessarily have to be a computer for executing control of the MRI apparatus, and receives measurement data from one or more MRI apparatuses to generate a classifier and The generated classifier may be a computer specialized for performing discrimination processing.
図15は、本発明の実施の形態1の別実施形態である、データ収集、推定処理および対象者の脳活動計測を、分散して処理する場合の一例を示す機能ブロック図である。
FIG. 15 is a functional block diagram showing an example of processing data collection, estimation processing and brain activity measurement of a subject in a distributed manner, which is another embodiment of the first embodiment of the present invention.
図15を参照して、サイト100.1~100.Nは、うつ病患者群、健常者群を含む参加者のデータを脳活動計測装置により計測する施設であり、管理サーバ200は、サイト100.1~100.Nからの計測データを管理する。
Referring to FIG. 15, sites 100.1 to 100. N is a facility that measures data of participants including a depressed patient group and a healthy person group using a brain activity measurement apparatus, and the management server 200 includes sites 100.1 to 100.N. Manage measurement data from N.
判別装置2に相当するコンピュータ300は、管理サーバ200に格納されたデータから分類器を生成する。
The computer 300 corresponding to the determination device 2 generates a classifier from the data stored in the management server 200.
MRI装置410は、コンピュータ300上の分類器の結果を利用する別サイトに設けられており、特定の被検者について脳活動のデータを計測する。
The MRI apparatus 410 is provided at another site using the result of the classifier on the computer 300, and measures brain activity data for a specific subject.
コンピュータ400は、MRI装置410が設けられる別サイトに設置され、MRI装置410の測定データから特定被検者の脳の機能的結合の相関データを算出し、機能的結合の相関データをコンピュータ300に送信して、返信されてくる分類器による判別結果を利用する。
The computer 400 is installed at another site where the MRI apparatus 410 is provided, calculates correlation data of the functional connection of the brain of a specific subject from measurement data of the MRI apparatus 410, and transmits correlation data of the functional connection to the computer 300. It transmits and uses the judgment result by the returned classifier.
サーバ200は、サイト100.1~100.Nから送信されてくるうつ病患者群および健常者群の参加者FMRI測定データ3102と、参加者FMRI測定データ3102に関連付けられた参加者の人属性情報3104とを格納し、コンピュータ300からのアクセスに従って、これらのデータをコンピュータ300に送信する。
The server 200 has sites 100.1 to 100. Participant FMRI measurement data 3102 of depression patient group and healthy people group transmitted from N, and human attribute information 3104 of participant associated with participant FMRI measurement data 3102 are stored, and access from computer 300 These data are transmitted to the computer 300 according to
コンピュータ300は、通信インタフェース2090を介して、サーバ200からの参加者FMRI測定データ3102および被験者の人属性情報3104を受信する。
The computer 300 receives the participant FMRI measurement data 3102 and the human attribute information 3104 of the subject from the server 200 via the communication interface 2090.
なお、サーバ200、コンピュータ300、コンピュータ400のハードウェアの構成は、基本的に、図2で説明した「データ処理部32」の構成と同様であるので、その説明は繰り返さない。
The hardware configuration of server 200, computer 300, and computer 400 is basically the same as the configuration of "data processing unit 32" described with reference to FIG. 2, and thus the description thereof will not be repeated.
図15に戻って、相関行列算出部3002、第1特徴選択部3004、第2特徴選択部3006、分類器生成部3008および判別処理部3010、ならびに、機能的結合の相関行列のデータ3106、第1の機能的結合和集合データ3108、第2の機能的結合和集合データ3110および分類器データ3112については、実施の形態1で説明したのと同様であるので、その説明は、繰り返さない。
Referring back to FIG. 15, the correlation matrix calculation unit 3002, the first feature selection unit 3004, the second feature selection unit 3006, the classifier generation unit 3008 and the discrimination processing unit 3010, and data 3106 of the functional connection correlation matrix, The one functional combination sum set data 3108, the second functional combination sum set data 3110 and the classifier data 3112 are the same as those described in the first embodiment, and therefore the description thereof will not be repeated.
MRI装置410は、診断ラベルの推定対象となる被検者の脳活動データを計測し、コンピュータ400の処理装置4040は、計測されたMRI測定データ4102を不揮発性記憶装置4100に格納する。
The MRI apparatus 410 measures brain activity data of a subject whose diagnostic label is to be estimated, and the processing device 4040 of the computer 400 stores the measured MRI measurement data 4102 in the non-volatile storage device 4100.
さらに、コンピュータ400の処理装置4040は、MRI測定データ4102とMRI装置410の計測対象の被験者の人属性情報とに基づいて、相関行列算出部3002と同様にして、機能的結合の相関行列のデータ4106を算出し、不揮発性記憶装置4100に格納する。
Furthermore, based on the MRI measurement data 4102 and the human attribute information of the subject to be measured by the MRI apparatus 410, the processing device 4040 of the computer 400 performs functional coupling correlation matrix data in the same manner as the correlation matrix calculation unit 3002. 4106 is calculated and stored in the non-volatile storage device 4100.
コンピュータ400のユーザから診断の対象となる疾患が指定され、当該ユーザの送信の指示に従い、コンピュータ400が、機能的結合の相関行列のデータ4106をコンピュータ300に送信する。これに応じて、判別処理部3010は、指定された診断ラベルについての判別結果を算出し、コンピュータ300は、通信インタフェース2090を介して、コンピュータ400に送信する。
The disease to be diagnosed is specified by the user of the computer 400, and the computer 400 transmits the functional connection correlation matrix data 4106 to the computer 300 according to the user's instruction of transmission. In response to this, the determination processing unit 3010 calculates the determination result for the designated diagnostic label, and the computer 300 transmits the determination result to the computer 400 via the communication interface 2090.
コンピュータ400では、図示しない表示装置などを介して、ユーザに対して、判別結果を知らせる。
The computer 400 notifies the user of the determination result via a display device (not shown) or the like.
このような構成とすることで、より多くの被験者について収集したデータに基づいて、より多くのユーザに対して、分類器による診断ラベルの推定結果を提供することが可能となる。
With such a configuration, it is possible to provide the estimation result of the diagnostic label by the classifier to more users based on the data collected for more subjects.
また、サーバ200とコンピュータ300とを別個の管理者が管理する形態とすることも可能で、その場合、サーバ200にアクセスできるコンピュータを制限することで、サーバ200に格納される被験者の情報のセキュリティを向上させることも可能となる。
Alternatively, the server 200 and the computer 300 may be managed by different administrators, in which case the security of the information on the subject stored in the server 200 can be obtained by restricting the computer that can access the server 200. It is also possible to improve
さらに、コンピュータ300の運営主体からみると、「分類器による判別のサービスを受ける側(コンピュータ400)」に対して、分類器についての情報は、一切提供しなくても、「判別結果を提供するサービス」を行うことが可能となる。
Furthermore, from the viewpoint of the operating entity of the computer 300, “provide the result of determination without providing any information about the classifier to“ the side receiving the service of determination by the classifier (computer 400) ”. It will be possible to provide services.
3-4.分類器及び判別装置の用途
前記判別装置1及び2は、うつ症状に対する疾患ラベルを判別する他、うつ症状のレベルを判別するために、うつ症状の治療の効果の程度を判別した情報を生成するために、又はうつ症状が予め設定された複数のサブクラスに層別化されている場合に、又は被検者を前記サブクラスに層別化する際の支援情報を生成するために使用することができる。それぞれの使用方法については、後述する。 3-4. Use of Classifier and Discrimination Device The discrimination devices 1 and 2 discriminate the disease label for depressive symptoms and, in addition, generate information in which the degree of effect of the treatment of depressive symptoms is discriminated in order to discriminate the level of depressive symptoms. Or when depression symptoms are stratified into a plurality of preset subclasses, or can be used to generate support information when stratifiing a subject into said subclasses . Each usage will be described later.
前記判別装置1及び2は、うつ症状に対する疾患ラベルを判別する他、うつ症状のレベルを判別するために、うつ症状の治療の効果の程度を判別した情報を生成するために、又はうつ症状が予め設定された複数のサブクラスに層別化されている場合に、又は被検者を前記サブクラスに層別化する際の支援情報を生成するために使用することができる。それぞれの使用方法については、後述する。 3-4. Use of Classifier and Discrimination Device The
第1の分類器は、うつ症状を判別するための診断バイオマーカーとして使用することができる。また、第1の分類器は、うつ症状のレベルを判別するための診断バイオマーカーとして使用することができる。第1の分類器は、うつ症状の治療の効果を判別するための薬効マーカーとして使用することができる。第1の分類器は、被検者をうつ病のサブクラスに層別化するためのバイオマーカーとして使用することができる。
The first classifier can be used as a diagnostic biomarker to determine depressive symptoms. Also, the first classifier can be used as a diagnostic biomarker to determine the level of depressive symptoms. The first classifier can be used as a medicinal marker for determining the effect of treatment for depressive symptoms. The first classifier can be used as a biomarker to stratify a subject into subclasses of depression.
3-5.分類器を生成するためのコンピュータプログラムとうつ症状を判別するためのコンピュータプログラム
実施の形態1の別形態には、ステップS100~S108(具体的には、S200~S218とS300~S314を含む)を含む処理を実行させて、分類器生成処理の機能をコンピュータに実行させるためのプログラムと、ステップS401~S410を含む処理を実行させて、判別処理の機能をコンピュータに実行させるためのプログラムとを含む。また実施の形態1の別形態には、ステップS100~S108(具体的には、S200~S218とS300~S314を含む)と、ステップS401~S410を含む処理を実行させて、判別装置としての機能をコンピュータに実行させるプログラムを含む。これらのプログラムは、ハードディスク、フラッシュメモリ等の半導体メモリ素子、光ディスク等の記憶媒体に記憶されていてもよい。前記記憶媒体へのプログラムの記憶形式は、CPU2040が前記プログラムを読み取り可能である限り制限されない。前記記憶媒体への記憶は、不揮発性であることが好ましい。 3-5. Computer Program for Generating a Classifier and Computer Program for Determining Depression Symptoms Another embodiment of the first embodiment includes steps S100 to S108 (specifically, including S200 to S218 and S300 to S314). Including a program for causing the computer to execute the processing of the classifier generation processing and a program for causing the computer to execute the processing of steps S401 to S410 and performing the processing of steps S401 to S410. . Further, in another mode of the first embodiment, the processing as steps S100 to S108 (specifically, including S200 to S218 and S300 to S314) and steps S401 to S410 are executed to function as a determination apparatus. Includes a program that causes a computer to execute These programs may be stored in a storage medium such as a hard disk, a semiconductor memory device such as a flash memory, or an optical disk. The storage format of the program on the storage medium is not limited as long as theCPU 2040 can read the program. Storage in the storage medium is preferably non-volatile.
実施の形態1の別形態には、ステップS100~S108(具体的には、S200~S218とS300~S314を含む)を含む処理を実行させて、分類器生成処理の機能をコンピュータに実行させるためのプログラムと、ステップS401~S410を含む処理を実行させて、判別処理の機能をコンピュータに実行させるためのプログラムとを含む。また実施の形態1の別形態には、ステップS100~S108(具体的には、S200~S218とS300~S314を含む)と、ステップS401~S410を含む処理を実行させて、判別装置としての機能をコンピュータに実行させるプログラムを含む。これらのプログラムは、ハードディスク、フラッシュメモリ等の半導体メモリ素子、光ディスク等の記憶媒体に記憶されていてもよい。前記記憶媒体へのプログラムの記憶形式は、CPU2040が前記プログラムを読み取り可能である限り制限されない。前記記憶媒体への記憶は、不揮発性であることが好ましい。 3-5. Computer Program for Generating a Classifier and Computer Program for Determining Depression Symptoms Another embodiment of the first embodiment includes steps S100 to S108 (specifically, including S200 to S218 and S300 to S314). Including a program for causing the computer to execute the processing of the classifier generation processing and a program for causing the computer to execute the processing of steps S401 to S410 and performing the processing of steps S401 to S410. . Further, in another mode of the first embodiment, the processing as steps S100 to S108 (specifically, including S200 to S218 and S300 to S314) and steps S401 to S410 are executed to function as a determination apparatus. Includes a program that causes a computer to execute These programs may be stored in a storage medium such as a hard disk, a semiconductor memory device such as a flash memory, or an optical disk. The storage format of the program on the storage medium is not limited as long as the
3-6.うつ症状の判別方法
実施の形態2は、うつ症状の判別方法に関する。前記判別方法は、安静時の被検者において計測された機能的結合の相関行列の要素について、うつ症状を評価するための指標値を生成する工程と、前記指標値が基準値を超えた場合に、前記被検者がうつ症状であると決定する工程を備える。具体的な工程は、上記S401~S410に準ずるが、前記工程は、指標値を生成する工程を除いた工程の全部または一部をヒトが行ってもよい。 3-6.Embodiment 2 of the present invention relates to a method of discriminating depression symptoms. The determination method includes the steps of: generating an index value for evaluating depressive symptoms with respect to an element of a correlation matrix of functional connections measured in a subject at rest; and when the index value exceeds a reference value And determining that the subject is depressive. A specific process conforms to the above-described S401 to S410, but in the process, the human may perform all or a part of the process excluding the process of generating the index value.
実施の形態2は、うつ症状の判別方法に関する。前記判別方法は、安静時の被検者において計測された機能的結合の相関行列の要素について、うつ症状を評価するための指標値を生成する工程と、前記指標値が基準値を超えた場合に、前記被検者がうつ症状であると決定する工程を備える。具体的な工程は、上記S401~S410に準ずるが、前記工程は、指標値を生成する工程を除いた工程の全部または一部をヒトが行ってもよい。 3-6.
4.うつ症状のレベルの判別装置及び判別方法
4-1.判別装置
判別装置1及び判別装置2は、うつ症状のレベルを判別するために使用することができる。すなわち、実施の形態1の別形態であるうつ症状のレベルの判別装置は、演算装置と記憶装置とを有する。この演算装置は、記憶装置に格納されたプログラムに基づいて、前記第1の分類器により、安静時の被検者において計測された機能的結合の相関行列の要素について、うつ症状を評価するための指標値を生成し、前記指標値をあらかじめ前記機能的結合ごとにうつ症状のレベルに応じて設定された指標値の基準範囲と比較し、前記被検者が、前記指標値が含まれる基準範囲に対応するうつ症状のレベルであると決定する、という処理を実行する。この場合、判別装置1及び判別装置2の構成は、上記3.に記載した構成と同様であるため、説明は省略する。判別処理部3010は、分類器データ3112により特定される分類器に基づいて、入力データに対して判別処理を行い、前記被検者のうつ症状のレベルを判別する。 4. Device and method for determining the level of depressive symptoms 4-1. Discrimination Device Thediscrimination device 1 and the discrimination device 2 can be used to discriminate the level of depressive symptoms. That is, the apparatus for determining the level of depression symptoms, which is another mode of the first embodiment, includes an arithmetic unit and a storage unit. This computing device is for evaluating the depressive symptoms for the elements of the correlation matrix of the functional connection measured in the subject at rest by the first classifier based on the program stored in the storage device. And the subject is compared with a reference range of an index value set in advance according to the level of depressive symptoms for each functional connection, and the subject includes the index value. The process of determining that it is the level of depression symptoms corresponding to the range is performed. In this case, the configurations of the determination device 1 and the determination device 2 are the same as those described in 3. above. Since it is the same as that of the structure described in, the description is omitted. The discrimination processing unit 3010 performs discrimination processing on input data based on the classifier specified by the classifier data 3112 and discriminates the level of depression symptoms of the subject.
4-1.判別装置
判別装置1及び判別装置2は、うつ症状のレベルを判別するために使用することができる。すなわち、実施の形態1の別形態であるうつ症状のレベルの判別装置は、演算装置と記憶装置とを有する。この演算装置は、記憶装置に格納されたプログラムに基づいて、前記第1の分類器により、安静時の被検者において計測された機能的結合の相関行列の要素について、うつ症状を評価するための指標値を生成し、前記指標値をあらかじめ前記機能的結合ごとにうつ症状のレベルに応じて設定された指標値の基準範囲と比較し、前記被検者が、前記指標値が含まれる基準範囲に対応するうつ症状のレベルであると決定する、という処理を実行する。この場合、判別装置1及び判別装置2の構成は、上記3.に記載した構成と同様であるため、説明は省略する。判別処理部3010は、分類器データ3112により特定される分類器に基づいて、入力データに対して判別処理を行い、前記被検者のうつ症状のレベルを判別する。 4. Device and method for determining the level of depressive symptoms 4-1. Discrimination Device The
この場合、「うつ症状のレベル」の判別には、たとえば、指標値である「関連重み付け和」の値が取り得る値を、予め、複数のレベルの基準範囲に分類しておくことで、「うつ症状のレベル」に対応した判別結果を出力することが可能となる。
In this case, in order to determine the “depression level”, for example, the possible values of the “association weighting sum”, which is an index value, may be classified in advance into a plurality of reference ranges. It is possible to output the discrimination result corresponding to the "depressive symptom level".
あるいは、この場合、分類器の生成に用いる「疾患ラベル」を予めうつ病のレベルに応じた複数の「レベル別疾患ラベル」として、分類器の機械学習を実行してもよい。
Alternatively, in this case, the machine learning of the classifier may be performed by using “disease labels” used to generate the classifier as a plurality of “level disease labels” according to the level of depression in advance.
4-2.判別方法
実施の形態3は、うつ症状のレベルの判別方法に関する。前記判別方法は、安静時の被検者において計測された機能的結合の相関行列の要素について、うつ症状を評価するための指標値を生成する工程と、あらかじめ前記機能的結合ごとにうつ症状のレベルに応じて設定された指標値の基準範囲と比較する工程と、前記被検者が、前記指標値が含まれる基準範囲に対応するうつ症状のレベルであると決定する工程とを備える。 4-2. Determination Method The third embodiment relates to a determination method of the level of depressive symptoms. The discrimination method comprises the steps of: generating an index value for evaluating depressive symptoms with respect to elements of a correlation matrix of functional connectivity measured in a subject at rest; The method includes the steps of comparing with a reference range of index values set according to the level, and determining that the subject is the level of depressive symptoms corresponding to the reference range in which the index value is included.
実施の形態3は、うつ症状のレベルの判別方法に関する。前記判別方法は、安静時の被検者において計測された機能的結合の相関行列の要素について、うつ症状を評価するための指標値を生成する工程と、あらかじめ前記機能的結合ごとにうつ症状のレベルに応じて設定された指標値の基準範囲と比較する工程と、前記被検者が、前記指標値が含まれる基準範囲に対応するうつ症状のレベルであると決定する工程とを備える。 4-2. Determination Method The third embodiment relates to a determination method of the level of depressive symptoms. The discrimination method comprises the steps of: generating an index value for evaluating depressive symptoms with respect to elements of a correlation matrix of functional connectivity measured in a subject at rest; The method includes the steps of comparing with a reference range of index values set according to the level, and determining that the subject is the level of depressive symptoms corresponding to the reference range in which the index value is included.
図16は、生成した分類器を用いて被検者のrs-fcMRIのデータからうつ症状のレベルを判別するためにデータ処理部32が行う処理を説明するためのフローチャート図である。
FIG. 16 is a flowchart for explaining the process performed by the data processing unit 32 in order to determine the level of depression symptoms from the data of rs-fc MRI of the subject using the generated classifier.
CPU2040は、入力部40からの処理開始の入力等により、図15に記載のステップS401~S406を行うことにより、指標値を生成する。次にCPU2040は、図16に示すステップS501において前記指標値を予めうつ症状のレベルに応じて設定された指標値の基準範囲と比較する。前記12対の機能的結合は、たとえば、BDIのうつ症状の重症度と相関するため、うつ症状のレベルを決定するための指標値の基準範囲は、BDIのうつ症状の重症度との相関から予め決定しておくことができる。ステップS502においてCPU2040は、図15のステップS406で生成された指標値が、どのレベルのうつ症状に対応しているかを決定する(S502)。そして、CPU2040は、ステップS503において、前記被検者がステップS502で決定されたうつ症状のレベルであると判別する。前記CPU2040が行う各ステップは、指標値を生成する工程を除いた工程の全部または一部をヒトが行ってもよい。
The CPU 2040 generates an index value by performing steps S401 to S406 described in FIG. 15 by an input of process start from the input unit 40 or the like. Next, in step S501 shown in FIG. 16, the CPU 2040 compares the index value with a reference range of index values set in advance according to the depression symptom level. Since the 12 pairs of functional connections are correlated with, for example, the severity of depression symptoms of BDI, the reference range of the index value for determining the level of depression symptoms is from the correlation with the severity of depression symptoms of BDI It can be determined in advance. In step S502, the CPU 2040 determines which level of depression symptoms the index value generated in step S406 of FIG. 15 corresponds to (S502). Then, in step S503, the CPU 2040 determines that the subject is the level of the depressive symptom determined in step S502. In each step performed by the CPU 2040, a human may perform all or part of the steps excluding the step of generating the index value.
また、実施の形態3の別態様として、上記ステップS501~S503を含む処理を実行させて、判別装置としての機能をコンピュータに実行させるプログラムを含む。実施の形態3の別態様として、上記ステップS401~S406およびステップS501~S503を含む処理を実行させて、判別装置としての機能をコンピュータに実行させるプログラムを含む。これらのプログラムは、ハードディスク、フラッシュメモリ等の半導体メモリ素子、光ディスク等の記憶媒体に記憶されていてもよい。前記記憶媒体へのプログラムの記憶形式は、前記CPU2040が前記プログラムを読み取り可能である限り制限されない。前記記憶媒体への記憶は、不揮発性であることが好ましい。
Further, as another aspect of the third embodiment, there is included a program which causes the computer to execute the function as the determination device by executing the processing including the steps S501 to S503. Another aspect of the third embodiment includes a program that causes the computer to execute the function as the determination device by executing the process including steps S401 to S406 and steps S501 to S503. These programs may be stored in a storage medium such as a hard disk, a semiconductor memory device such as a flash memory, or an optical disk. The storage format of the program on the storage medium is not limited as long as the CPU 2040 can read the program. Storage in the storage medium is preferably non-volatile.
5.第1の分類器を使用する治療効果の判別装置及び判別方法
5-1.判別装置
判別装置1及び判別装置2は、治療効果を判別するための情報の生成のために使用することができる。すなわち、実施の形態1の別形態である被検者における治療効果の判定するための判別装置は、演算装置と記憶装置とを有する。演算装置は、記憶装置に格納されたプログラムに基づいて、前記第1の分類器により、第1の時点の被検者において安静時に計測された、機能的結合の相関行列の要素について、うつ症状を評価するための第1の値を生成し、前記分類器により、治療開始後であって第1の時点より後の第2の時点の前記被検者と同一の被検者の安静時の脳内における、前記機能的結合と同一の機能的結合の相関行列の要素についてうつ症状を評価する第2の値を生成し、前記第1の値と前記第2の値とを比較し、i)前記第2の値が前記第1の値よりも改善している場合に、前記治療が被検者のうつ症状の改善に有効であると決定する処理、及び/又は前記第2の値が前記第1の値よりも改善していない場合に、前記治療が被検者のうつ症状の改善に有効でないと決定する処理を実行する。この場合、判別装置1及び判別装置2の構成は、上記3.に記載した構成と同様であるため、説明は省略する。判別処理部3010は、分類器データ3112により特定される分類器に基づいて、入力データに対して判別処理を行い、前記被検者における治療効果を判別する情報を生成する。 5. Device and method for discriminating therapeutic effect using first classifier 5-1. Discrimination Device Thediscrimination device 1 and the discrimination device 2 can be used to generate information for discriminating the therapeutic effect. That is, the determination apparatus for determining the treatment effect in the subject, which is another form of the first embodiment, includes the arithmetic device and the storage device. The arithmetic unit is configured to, based on the program stored in the storage unit, depress the symptom of the functional connection correlation matrix measured at rest in the subject at the first time point by the first classifier. A first value for evaluating the subject, and the classifier causes the subject to rest at the same time as the subject at a second time point after the start of the treatment and after the first time point Generating a second value for assessing depressive symptoms for an element of the correlation matrix of the functional connection identical to the functional connection in the brain, comparing the first value with the second value, i And / or a process of determining that the treatment is effective for ameliorating the depressive symptoms of the subject when the second value is improved over the first value, and / or the second value is The treatment is effective for ameliorating the depressive symptoms of the subject when not improving more than the first value. To execute a process of determining the Most. In this case, the configurations of the determination device 1 and the determination device 2 are the same as those described in 3. above. Since it is the same as that of the structure described in, the description is omitted. The discrimination processing unit 3010 performs discrimination processing on input data based on the classifier specified by the classifier data 3112 and generates information for discriminating the therapeutic effect of the subject.
5-1.判別装置
判別装置1及び判別装置2は、治療効果を判別するための情報の生成のために使用することができる。すなわち、実施の形態1の別形態である被検者における治療効果の判定するための判別装置は、演算装置と記憶装置とを有する。演算装置は、記憶装置に格納されたプログラムに基づいて、前記第1の分類器により、第1の時点の被検者において安静時に計測された、機能的結合の相関行列の要素について、うつ症状を評価するための第1の値を生成し、前記分類器により、治療開始後であって第1の時点より後の第2の時点の前記被検者と同一の被検者の安静時の脳内における、前記機能的結合と同一の機能的結合の相関行列の要素についてうつ症状を評価する第2の値を生成し、前記第1の値と前記第2の値とを比較し、i)前記第2の値が前記第1の値よりも改善している場合に、前記治療が被検者のうつ症状の改善に有効であると決定する処理、及び/又は前記第2の値が前記第1の値よりも改善していない場合に、前記治療が被検者のうつ症状の改善に有効でないと決定する処理を実行する。この場合、判別装置1及び判別装置2の構成は、上記3.に記載した構成と同様であるため、説明は省略する。判別処理部3010は、分類器データ3112により特定される分類器に基づいて、入力データに対して判別処理を行い、前記被検者における治療効果を判別する情報を生成する。 5. Device and method for discriminating therapeutic effect using first classifier 5-1. Discrimination Device The
本実施の態様の別の態様は、前記判別装置を、ドラッグリプロファイリングのために使用することを含む。
Another aspect of this embodiment involves using the discriminator for drug reprofiling.
5-2.判別方法
実施の形態4は、前記第1の分類器に、少なくとも2つの時点において撮像された被検者の安静時fMRIのデータから取得される表1に記載の機能的結合についての相関行列の要素を入力し、治療効果を判別する情報を生成する。具体的には、第1の時点の被検者において安静時に計測された、機能的結合の相関行列の要素について、うつ症状を評価するための第1の値を生成する工程と、第2の時点の前記被検者と同一の被検者の安静時の脳内における、前記機能的結合と同一の機能的結合の相関行列の要素ついてうつ症状を評価する第2の値を生成する工程と、第1の値と第2の値とを比較する工程と、第2の値が第1の値よりも改善している場合に、前記治療が被検者のうつ症状の改善に有効であると決定し、有効である可能性を示す情報を生成する工程とを備える。第1の時点は、治療前であっても、治療開始から所定の時間が経過していてもよいが、好ましくは、治療開始前である。また、一度治療を終了した後、治療が再度開始される場合も治療終了から治療再開前までの間は、「治療前」としてもよい。第2の時点は、治療開始後であって第1の時点よりも後である限り制限されない。 5-2.Discrimination method Embodiment 4 relates to the correlation matrix for functional combination described in Table 1 obtained from the resting fMRI data of the subject imaged at at least two time points in the first classifier. Input elements and generate information to determine the treatment effect. Specifically, for the elements of the functional connection correlation matrix measured at rest in the subject at the first time point, generating a first value for evaluating depressive symptoms; Generating a second value for evaluating depressive symptoms with respect to an element of a correlation matrix of the same functional connection as the functional connection in the resting brain of the same subject as the subject at the time point; The step of comparing the first value and the second value, and in the case where the second value is improved than the first value, the treatment is effective for the improvement of the depressive symptoms of the subject And generating information indicating the possibility of being valid. The first time point may be before treatment or a predetermined time may have elapsed from the start of treatment, but is preferably before the start of treatment. In addition, even if the treatment is started again after the treatment is ended, it may be "before treatment" from the end of the treatment to the time before the resumption of the treatment. The second time point is not limited as long as it is after initiation of treatment and after the first time point.
実施の形態4は、前記第1の分類器に、少なくとも2つの時点において撮像された被検者の安静時fMRIのデータから取得される表1に記載の機能的結合についての相関行列の要素を入力し、治療効果を判別する情報を生成する。具体的には、第1の時点の被検者において安静時に計測された、機能的結合の相関行列の要素について、うつ症状を評価するための第1の値を生成する工程と、第2の時点の前記被検者と同一の被検者の安静時の脳内における、前記機能的結合と同一の機能的結合の相関行列の要素ついてうつ症状を評価する第2の値を生成する工程と、第1の値と第2の値とを比較する工程と、第2の値が第1の値よりも改善している場合に、前記治療が被検者のうつ症状の改善に有効であると決定し、有効である可能性を示す情報を生成する工程とを備える。第1の時点は、治療前であっても、治療開始から所定の時間が経過していてもよいが、好ましくは、治療開始前である。また、一度治療を終了した後、治療が再度開始される場合も治療終了から治療再開前までの間は、「治療前」としてもよい。第2の時点は、治療開始後であって第1の時点よりも後である限り制限されない。 5-2.
図17は、第1の分類器を用いて被検者のfMRIのデータから治療効果を判別するための処理を説明するためのフローチャート図である。
FIG. 17 is a flowchart for explaining the process for determining the therapeutic effect from the fMRI data of the subject using the first classifier.
CPU2040は、入力部40からの処理開始の入力等により、図17に記載のステップS601において、第1の時点においてMRI撮像部25によって被検者から撮像された安静時の被検者fMRI測定データ3113をインタフェース部44を介して取得する。
The CPU 2040 is a subject's fMRI measurement data at rest captured by the MRI imaging unit 25 at the first time point in step S601 described in FIG. 17 by the input of start of processing from the input unit 40 or the like. 3113 is acquired via the interface unit 44.
ステップS602~S603おいて上記2.に記載の前処理を行い、表1に記載の12対の機能的結合から選択した全て、あるいは一部の機能的結合について第1の時点での相関行列の要素を抽出する。
In steps S602 to S603, the above 2. The pre-processing described in is performed to extract the elements of the correlation matrix at the first time point for all or some of the functional combinations selected from the 12 pairs of functional combinations described in Table 1.
ステップS604において、CPU2040は、ステップS603で抽出した第1の時点での相関行列の要素に対してピアソン相関係数を算出する。
In step S604, the CPU 2040 calculates a Pearson correlation coefficient with respect to the elements of the correlation matrix at the first time point extracted in step S603.
ステップS605~S606おいて、CPU2040は、ステップS604において算出された相関係数を第1の分類器に入力し、前記選択された機能的結合について第1の値を生成する。前記第1の値は、例えば、上記2.で述べた指標値そして算出される。
In steps S605 to S606, the CPU 2040 inputs the correlation coefficient calculated in step S604 to the first classifier, and generates a first value for the selected functional combination. The first value is, for example, the value of 2. above. The index values mentioned in and are calculated.
CPU2040は、第2の時点において、ステップS607に示すMRI撮像部25によって被検者から撮像された安静時の被検者fMRI測定データ3113をインタフェース部44を介して取得する。
At a second point in time, the CPU 2040 acquires, via the interface unit 44, the subject fMRI measurement data 3113 at rest which is imaged from the subject by the MRI imaging unit 25 shown in step S607.
ステップS608~S609おいて上記2.に記載の前処理を行い、表1に記載の12対の機能的結合から選択した全て、あるいは一部の機能的結合について第2の時点での相関行列の要素を抽出する。
In steps S608 to S609, the above 2. And perform the pre-processing described in Table 1 to extract the elements of the correlation matrix at the second time point for all or some of the functional combinations selected from the 12 pairs of functional combinations described in Table 1.
ステップS610において、CPU2040は、ステップS609で抽出した第1の時点での相関行列の要素に対してピアソン相関係数を算出する。
In step S610, the CPU 2040 calculates a Pearson correlation coefficient with respect to the elements of the correlation matrix at the first time point extracted in step S609.
ステップS611~S612おいて、CPU2040は、ステップS610において算出された相関係数を第1の分類器に入力し、前記選択された機能的結合について第1の値を生成する。前記第2の値は、例えば、上記2.で述べた指標値として生成される。
In steps S611 to S612, the CPU 2040 inputs the correlation coefficient calculated in step S610 to the first classifier to generate a first value for the selected functional combination. The second value is, for example, the value of 2. above. It is generated as the index value described in.
CPU2040は、ステップS606において生成された第1の値とステップS612おいて生成された第2の値を比較する(S613)。
The CPU 2040 compares the first value generated in step S606 with the second value generated in step S612 (S613).
CPU2040は、ステップS614において、第1の値よりも第2の値が改善していると判別した場合には(「YES:Y」)、前記被検者のうつ病症状の改善に対する前記治療の状態を示す情報を生成する(S615)。この場合、次にCPU2040は、ステップS616に進み、前記治療の継続の可能性を示す情報を提示してもよい。医師は、このような治療継続の可能性を示す情報を元に、治療継続をするか否かの判断を行う。特に限定されないが、たとえば、出力画面上には、治療の有効性があると予め設定された領域についての情報が区別可能に表示されており、「治療の状態を示す情報」とは、分類器の出力する指標値であり、「治療を継続の可能性を示す情報の提示」とは、上記領域を表示した状態で、併せて、この指標値を表示することであってもよい。
If the CPU 2040 determines in step S614 that the second value is improved more than the first value (“YES: Y”), the CPU 2040 performs the treatment for the improvement of the depressive symptoms of the subject. Information indicating the state is generated (S615). In this case, the CPU 2040 may then proceed to step S616 and present information indicating the possibility of continuing the treatment. The doctor determines whether to continue the treatment based on the information indicating the possibility of the continuation of the treatment. Although not particularly limited, for example, on the output screen, information about the region set in advance as the effectiveness of the treatment is distinguishably displayed, and the “information indicating the state of the treatment” is a classifier The "presentation of information indicating the possibility of continuing the treatment" may be to display this index value together with the above-mentioned region being displayed.
また、CPU2040は、ステップS614において、第1の値よりも第2の値が改善していないと判別した場合には(「NO:N」)、前記被検者のうつ病症状の改善に対する前記治療の状態を示す情報を生成する(S617)。この場合、次にCPU2040は、ステップS618に進み、前記治療の終了の可能性を示す情報を提示してもよい。
When the CPU 2040 determines in step S614 that the second value is not improved more than the first value (“NO: N”), the CPU 2040 performs the above-mentioned for the improvement of the depressive symptoms of the subject. Information indicating the state of treatment is generated (S617). In this case, the CPU 2040 may then proceed to step S618 and present information indicating the possibility of the end of the treatment.
医師は、このような治療終了の可能性を示す情報を元に、治療を終了するか否かの判断を行う。特に限定されないが、たとえば、出力画面上には、治療の有効性がないと予め設定された領域についての情報が区別可能に表示されており、「治療の状態を示す情報」とは、分類器の出力する指標値であり、「治療の終了の可能性を示す情報の提示」とは、上記領域を表示した状態で、併せて、この指標値を表示することであってもよい。
The doctor determines whether to end the treatment based on the information indicating the possibility of the end of the treatment. Although not particularly limited, for example, on the output screen, information about a preset area is displayed in a distinguishable manner if there is no effectiveness of the treatment, and the “information indicating the state of the treatment” is a classifier The "presentation of information indicating the possibility of the end of the treatment" may be to display this index value together with the above-mentioned area being displayed.
さらに、CPU2040は、ステップS619に進み、他の治療方法に変更可能性を示す情報を提示してもよい。この場合、さらに具体的な治療方法の可能性を提示してもよい。この場合、医師は、表示された治療方法の可能性のうちから、現在の治療方法から変更すべき治療方法を判断することができる。
Furthermore, the CPU 2040 may proceed to step S619 and present information indicating the possibility of changing to another treatment method. In this case, the possibility of more specific treatment may be presented. In this case, the doctor can determine the treatment method to be changed from the current treatment method among the possibilities of the displayed treatment method.
例えば数6で表される式では、うつ症状の疾患ラベルと健常者のラベルの閾値は0となるように設定されているため、基準値は0となる。
For example, in the equation expressed by Equation 6, the threshold value of the disease label of the depressive condition and the label of the healthy person is set to 0, so the reference value is 0.
たとえば、「関連重み付け和」をバイオマーカーの指標値として使用する場合は、ステップS614において、うつ症状が重くなるにつれ、前記指標値は、正方向に大きくなる。したがって、CPU2040は、前記第1の値よりも前記第2の値が小さくなっている場合に、第1の値よりも第2の値が改善していると判別することができる。また、CPU2040は、前記第1の値よりも前記第2の値が大きくなっている場合、または第1の値と第2の値に顕著な差が認められない場合に、第1の値よりも第2の値が改善していないと判別することができる。
For example, in the case where “relevant weighted sum” is used as a biomarker index value, in step S614, as the depressive symptoms become heavier, the index value increases in the positive direction. Therefore, when the second value is smaller than the first value, the CPU 2040 can determine that the second value is improved more than the first value. In addition, when the second value is larger than the first value, or when no significant difference is recognized between the first value and the second value, the CPU 2040 is more than the first value. Also, it can be determined that the second value has not improved.
前記第1の値及び第2の値は、指標値であってもよいが、ステップS604及びステップS610で算出される相関係数を、それぞれ第1の値及び第2の値としてもよい。
The first value and the second value may be index values, but the correlation coefficients calculated in steps S604 and S610 may be first values and second values, respectively.
また、実施の態様3では、ステップS601は、ステップS607よりも前に行われている必要があるが、ステップS602~S606は、ステップS607よりも前に行われている必要はない。ステップS602~S606は、ステップS601の後、少なくともステップS613よりも前のどこかで行われていればよい。
In the third embodiment, step S601 needs to be performed before step S607, but steps S602 to S606 do not need to be performed before step S607. Steps S602 to S606 may be performed at least somewhere before step S613 after step S601.
ステップS601~S619は、その全部あるいは一部をヒトが行ってもよい。
The human may carry out all or part of steps S601 to S619.
実施の形態3は、投薬治療の効果判定に使用することも可能である。第1の分類器を使って投薬効果を判定する場合には、少なくとも機能的結合識別番号1及び2の機能的結合を指標とすることが好ましい。
Embodiment 3 can also be used to determine the effect of medication treatment. When the first classifier is used to determine the dose effect, it is preferable to use at least the functional combination identification numbers 1 and 2 as an index.
実施の態様4の別の態様は、前記判定方法を、ドラッグリプロファイリングのために使用することを含む。
Another aspect of the embodiment 4 includes using the said determination method for drug re-profiling.
また、実施の形態4の別態様として、上記ステップS601~S619を含む処理を実行させて、判別装置としての機能をコンピュータに実行させるプログラムを含む。このプログラムは、ハードディスク、フラッシュメモリ等の半導体メモリ素子、光ディスク等の記憶媒体に記憶されていてもよい。前記記憶媒体へのプログラムの記憶形式は、前記CPU2040が前記プログラムを読み取り可能である限り制限されない。前記記憶媒体への記憶は、不揮発性であることが好ましい。
Further, as another aspect of the fourth embodiment, there is included a program which causes the computer to execute the function as the determination device by executing the process including steps S601 to S619. The program may be stored in a storage medium such as a hard disk, a semiconductor memory device such as a flash memory, or an optical disk. The storage format of the program on the storage medium is not limited as long as the CPU 2040 can read the program. Storage in the storage medium is preferably non-volatile.
6.うつ病患者の層別化装置及び層別化方法
6-1.層別化装置
実施の形態1の別形態は、うつ病患者の層別化装置に関する。うつ病が予め設定された複数のサブクラスに層別化されている場合に、判別装置1及び判別装置2は、それぞれうつ病患者を医師が層別化するための支援をする層別化装置1及び層別化装置2(以下、総称するときは、「層別化装置」という)として使用することができる。層別化装置は、演算装置と記憶装置とを含む。すなわち、うつ症状が予め設定された複数のサブクラスに層別化されている場合に、うつ病患者の層別化するための判別装置の演算装置は、記憶装置に格納されたプログラムに基づいて、安静時の被検者において計測された機能的結合の相関行列の要素について、うつ症状を評価するための指標値を生成し、前記指標値を、あらかじめ前記機能的結合ごとに前記サブクラスに応じて設定された指標値の基準範囲と比較し、前記被検者が、前記指標値が含まれる基準範囲に対応する前記サブクラスであると決定する、という処理を実行する。この場合、層別化装置1及び層別化装置2の構成は、上記3.に記載した判別装置1及び判別装置2の構成と同様であるため、説明は省略する。図19と図20には、層別化装置1及び層別化装置2の機能ブロック図を示す。図19と図20では、判別処理部3010が、層別化処理部3020となる点を除き、図5及び図15と同じである。層別化処理部3020は、分類器データ3112により特定される分類器に基づいて、入力データに対して層別化処理を行い、うつ病患者の層別化のための判別を行い結果を出力する。 6. Stratification device and stratification method of depression patients 6-1. Stratification Device Another form ofEmbodiment 1 relates to a stratification device for depressed patients. When the depression is stratified into a plurality of preset subclasses, the discrimination device 1 and the discrimination device 2 respectively perform the stratification device 1 for assisting the doctor to stratify a depressed patient And the stratification device 2 (hereinafter collectively referred to as a "stratification device"). The stratification apparatus includes an arithmetic unit and a storage unit. That is, when depression symptoms are stratified into a plurality of preset subclasses, the arithmetic device of the discrimination device for stratification of depressed patients is based on the program stored in the storage device, An index value for evaluating depressive symptoms is generated for an element of the correlation matrix of the functional connection measured in the subject at rest, and the index value is previously determined according to the subclass for each functional connection. A process is performed to determine that the subject is the subclass corresponding to the reference range in which the index value is included, in comparison with the set reference range of the index value. In this case, the configurations of the stratification device 1 and the stratification device 2 are the same as those described in 3. above. The configuration is the same as that of the discrimination device 1 and the discrimination device 2 described in the above, and thus the description will be omitted. In FIG. 19 and FIG. 20, the functional block diagram of the stratification apparatus 1 and the stratification apparatus 2 is shown. 19 and FIG. 20 are the same as FIG. 5 and FIG. 15 except that the discrimination processing unit 3010 is a stratification processing unit 3020. The stratification processing unit 3020 performs stratification processing on input data based on the classifier specified by the classifier data 3112, performs discrimination for stratification of depression patients, and outputs the result Do.
6-1.層別化装置
実施の形態1の別形態は、うつ病患者の層別化装置に関する。うつ病が予め設定された複数のサブクラスに層別化されている場合に、判別装置1及び判別装置2は、それぞれうつ病患者を医師が層別化するための支援をする層別化装置1及び層別化装置2(以下、総称するときは、「層別化装置」という)として使用することができる。層別化装置は、演算装置と記憶装置とを含む。すなわち、うつ症状が予め設定された複数のサブクラスに層別化されている場合に、うつ病患者の層別化するための判別装置の演算装置は、記憶装置に格納されたプログラムに基づいて、安静時の被検者において計測された機能的結合の相関行列の要素について、うつ症状を評価するための指標値を生成し、前記指標値を、あらかじめ前記機能的結合ごとに前記サブクラスに応じて設定された指標値の基準範囲と比較し、前記被検者が、前記指標値が含まれる基準範囲に対応する前記サブクラスであると決定する、という処理を実行する。この場合、層別化装置1及び層別化装置2の構成は、上記3.に記載した判別装置1及び判別装置2の構成と同様であるため、説明は省略する。図19と図20には、層別化装置1及び層別化装置2の機能ブロック図を示す。図19と図20では、判別処理部3010が、層別化処理部3020となる点を除き、図5及び図15と同じである。層別化処理部3020は、分類器データ3112により特定される分類器に基づいて、入力データに対して層別化処理を行い、うつ病患者の層別化のための判別を行い結果を出力する。 6. Stratification device and stratification method of depression patients 6-1. Stratification Device Another form of
医師は、層別化装置1または層別化装置2にから出力される、うつ病患者の層別化のための判別結果を支援情報として、患者の層別化を行う。この意味で、このような装置を、層別化支援装置と呼ぶこともできる。
The doctor performs stratification of the patient by using the determination result for stratification of the depressed patient output from the stratification device 1 or the stratification device 2 as support information. In this sense, such a device can also be called a stratification support device.
6-2.層別化方法
実施の形態5は、うつ病患者得層別化するための層別化する方法に関する。前記判別方法は、うつ病が予め設定された複数のサブクラスに層別化されている場合に、安静時の被検者において計測された機能的結合の相関行列の要素について、うつ症状を評価するための指標値を生成する工程と、あらかじめ前記機能的結合ごとに前記サブクラスに応じて設定された指標値の基準範囲と比較する工程と、前記被検者が、前記指標値が含まれる基準範囲に対応する前記サブクラスであると決定する工程を備える。 6-2.Stratification Method Embodiment 5 relates to a stratification method for stratification of depression patients. The discrimination method evaluates depressive symptoms with respect to elements of a correlation matrix of functional connections measured in a subject at rest when depression is stratified into a plurality of preset subclasses. Generating an index value for the purpose, comparing with a reference range of the index value set in advance according to the subclass for each functional connection, and a reference range in which the subject includes the index value Determining that it is the subclass corresponding to.
実施の形態5は、うつ病患者得層別化するための層別化する方法に関する。前記判別方法は、うつ病が予め設定された複数のサブクラスに層別化されている場合に、安静時の被検者において計測された機能的結合の相関行列の要素について、うつ症状を評価するための指標値を生成する工程と、あらかじめ前記機能的結合ごとに前記サブクラスに応じて設定された指標値の基準範囲と比較する工程と、前記被検者が、前記指標値が含まれる基準範囲に対応する前記サブクラスであると決定する工程を備える。 6-2.
図18は、生成した分類器を用いて被検者のfMRIのデータからうつ症状のサブクラスを判別するための情報を生成するデータ処理部32が行う処理を説明するためのフローチャート図である。
FIG. 18 is a flowchart for explaining processing performed by the data processing unit 32 that generates information for determining a subclass of depressive symptoms from fMRI data of a subject using the generated classifier.
CPU2040は、入力部40からの処理開始の入力等により、図14に記載のステップS401~S406を行うことにより、指標値を生成する。次にCPU2040は、図18に示すステップS701において前記指標値を、予めうつ病のサブクラスに応じて設定された指標値の基準範囲と比較する。うつ病のサブクラスは、臨床所見からメランコリー型MDD、非メランコリー型MDD及び治療抵抗性MDDのサブクラスに分類される。このため、たとえば、メランコリー型MDDを「疾患ラベル」として生成した分類器を用いることで、脳活動を計測した対象者からの計測データが、メランコリー型MDDの疾患ラベルに対応するか否かを判別できる。同様にして、非メランコリー型MDDまたは治療抵抗性MDDを「疾患ラベル」として生成した分類器を用いることで、脳活動を計測した対象者からの計測データが、非メランコリー型MDDまたは治療抵抗性MDDの疾患ラベルに対応するか否かを判別できる。
The CPU 2040 generates an index value by performing steps S401 to S406 described in FIG. 14 by an input of process start from the input unit 40 or the like. Next, in step S701 shown in FIG. 18, the CPU 2040 compares the index value with a reference range of index values set in advance according to the subclass of depression. Subclasses of depression are classified into melancholic MDD, non-melancholic MDD, and refractory MDD based on clinical findings. Therefore, for example, by using a classifier in which melancholic MDD is generated as a "disease label", it is determined whether measurement data from a subject who has measured brain activity corresponds to a disease label of melancholic MDD. it can. Similarly, by using a classifier in which non-melancholic MDD or treatment-resistant MDD is generated as a "disease label", measurement data from a subject who measures brain activity is non-melancholy MDD or treatment-resistant MDD. It can be determined whether it corresponds to the disease label of
ステップS702においてCPU2040は、図15のステップS406で生成された指標値が、どのサブクラスに対応しているかを決定する。そして、CPU2040は、ステップS703において、前記被検者がステップS702で決定されたうつ病のサブクラスに属すると判別する。医師は、このようにして出力されるサブクラスの情報を、うつ病患者の層別化のための支援情報として、患者の層別化を行う。この意味で、このような方法を、層別化支援方法と呼ぶこともできる。前記CPU2040が行う各ステップは、指標値を生成する工程を除いた全部または一部をヒトが行ってもよい。
In step S702, the CPU 2040 determines which subclass the index value generated in step S406 in FIG. 15 corresponds to. Then, in step S703, the CPU 2040 determines that the subject belongs to the subclass of depression determined in step S702. The doctor performs stratification of the patient as the support information for the stratification of the depressed patient as the information of the subclass output in this way. In this sense, such a method can also be called a stratification support method. Each step performed by the CPU 2040 may be performed entirely or partially by a human except for the step of generating the index value.
また、実施の形態5の別態様として、上記ステップS701~S703を含む処理を実行させて、層別化装置としての機能をコンピュータに実行させるプログラムを含む。実施の形態5の別態様として、上記ステップS401~S406およびステップS701~S703を含む処理を実行させて、層別化装置としての機能をコンピュータに実行させるプログラムを含む。これらのプログラムは、ハードディスク、フラッシュメモリ等の半導体メモリ素子、光ディスク等の記憶媒体に記憶されていてもよい。前記記憶媒体へのプログラムの記憶形式は、前記CPU2040が前記プログラムを読み取り可能である限り制限されない。前記記憶媒体への記憶は、不揮発性であることが好ましい。
Further, as another aspect of the fifth embodiment, a program that causes the computer to execute the function as the stratification apparatus by executing the processing including the above steps S701 to S703 is included. Another aspect of the fifth embodiment includes a program that causes the computer to execute the function as a stratification apparatus by executing the processing including the above steps S401 to S406 and steps S701 to S703. These programs may be stored in a storage medium such as a hard disk, a semiconductor memory device such as a flash memory, or an optical disk. The storage format of the program on the storage medium is not limited as long as the CPU 2040 can read the program. Storage in the storage medium is preferably non-volatile.
7.第2の分類器の生成と第2の分類器を使用する治療効果の判別
7-1.治療効果判別装置
実施の形態6は、複数の対象者について、治療のために投与した治療効果がみられる群とみられない群とを判別するための第2の分類器を生成する分類器生成処理を実行し、医師が治療効果の判断をする支援のための指標となる情報を生成するする、治療効果判別装置、あるいは、治療支援装置に関する。 7. Generation of second classifier and discrimination of treatment effect using second classifier 7-1. Therapeutic Effect Determining Device The sixth embodiment is a classifier generation process for generating a second classifier for determining, for a plurality of subjects, a group in which the therapeutic effect administered for treatment can be seen and a group in which the therapeutic effect is not observed. The present invention relates to a therapeutic effect determination device or a therapeutic support device, which executes S. and generates information serving as an index for assisting a doctor in judging a therapeutic effect.
治療効果判別装置の構成は、基本的に図1と同じであるが、図1におけるデータ処理部32を実施の形態6ではデータ処理部62と読み替える。また、治療効果判別装置において、データ処理部62の構成は、図1及び図2と基本的に同様であるが、実施の形態6では、図1において記憶部36を記憶部66と、制御部42を制御部62と、入力部40を入力部70と、インタフェース部44をインタフェース部74と、データ収集部46をデータ収集部76と、画像処理部48を画像処理部78と、表示部38を表示部68と、表示制御部34を表示制御部64と読み替える。また、図2において、データ処理部32のコンピュータ本体2010をコンピュータ本体6010と、メモリドライブ2020をメモリドライブ6020、ディスクドライブ2030をディスクドライブ6030と、演算装置(CPU)2040を演算装置(CPU)6040と、ディスクドライブ2030をディスクドライブ6030と、メモリドライブ2020をメモリドライブ6020と、バス2050をバス6050と、ROM2060をROM6060と、RAM2070をRAM6070と、不揮発性記憶装置2080を不揮発性記憶装置6080と、通信インタフェース2090を通信インタフェース6090と読み替える。データ処理部62のハードウェアとしては、上述のとおり、特に限定されないが、汎用コンピュータを使用することが可能である。
The configuration of the therapeutic effect discriminating apparatus is basically the same as that of FIG. 1, but the data processor 32 in FIG. 1 is replaced with the data processor 62 in the sixth embodiment. In the therapeutic effect discriminating apparatus, the configuration of the data processing unit 62 is basically the same as in FIGS. 1 and 2, but in the sixth embodiment, the storage unit 36 in FIG. 42, a control unit 62, an input unit 40, an input unit 70, an interface unit 44, an interface unit 74, a data collection unit 46, a data collection unit 76, an image processing unit 48, an image processing unit 78, and a display unit 38. And the display control unit 34 as the display control unit 64. Further, in FIG. 2, a computer main body 2010 of the data processing unit 32 is a computer main body 6010, a memory drive 2020 is a memory drive 6020, a disk drive 2030 is a disk drive 6030, and an arithmetic unit (CPU) 2040 is an arithmetic unit (CPU) 6040. Disk drive 2030, memory drive 2020, memory drive 6020, bus 2050, bus 6050, ROM 2060, ROM 6060, RAM 2070, RAM 6070, nonvolatile storage 2080, nonvolatile storage 6080, The communication interface 2090 is replaced with the communication interface 6090. The hardware of the data processing unit 62 is not particularly limited as described above, but a general-purpose computer can be used.
(分類器の生成)
図23は、第2の分類器の生成処理および生成された第2の分類器による判別処理を行うための機能ブロック図である。 (Generation of classifiers)
FIG. 23 is a functional block diagram for performing generation processing of a second classifier and discrimination processing using the generated second classifier.
図23は、第2の分類器の生成処理および生成された第2の分類器による判別処理を行うための機能ブロック図である。 (Generation of classifiers)
FIG. 23 is a functional block diagram for performing generation processing of a second classifier and discrimination processing using the generated second classifier.
不揮発性記憶装置6080には、健常者、治療を受けたうつ病患者を含む複数の対象者の脳内の複数の所定領域における脳活動を示す信号をMRI装置により時系列で予め測定した信号の情報であって、第1の時点で測定した対象者のrs-fcMRI測定データ6102と、第2の時点で測定した対象者のrs-fcMRI測定データ6104と、前記rs-fcMRI測定データを計測した各対象者に関連づけられた、複数の治療データ6105とが格納されている。
Non-volatile storage device 6080 is a signal, which indicates brain activity in a plurality of predetermined areas in the brain of a plurality of subjects including a healthy person and a depressed patient who has been treated, measured in advance in time series by an MRI apparatus Rs-fc MRI measurement data 6102 of the subject measured at the first time point, rs-fc MRI measurement data 6104 of the subject measured at the second time point, and the rs-fc MRI measurement data A plurality of treatment data 6105 associated with each subject is stored.
ここで、治療データ6105には、対象者の疾患ラベル、治療履歴(治療方法、投薬した薬剤名、用量、投与期間等)の情報が含まれる。CPU6040は、第1の時点の対象者のrs-fcMRI測定データ6102と、第2の時点の対象者のrs-fcMRI測定データ6104と、対象者の治療データ6105に基づいて、複数の対象者において治療効果がみられた群(「寛解群(remitted)」)と治療効果がみられない群(「非寛解群(non-remitted)」)とを識別するための分類器を生成する処理を行う。したがって、疾患ラベルには、この場合、「寛解ラベル」と「非寛解ラベル」とが含まれる。
Here, the treatment data 6105 includes information on the subject's disease label and treatment history (treatment method, medicine name, dosage, administration period, etc.). Based on the rs-fc MRI measurement data 6102 of the subject at the first time, the rs-fc MRI measurement data 6104 of the subject at the second time, and the treatment data 6105 of the subject, the CPU 6040 Process to generate a classifier to distinguish between the group with therapeutic effect ("remitted") and the group without therapeutic effect ("non-remitted") . Thus, the disease label in this case includes the "remission label" and the "non-remission label".
第1の相関計測部6002は、第1の時点の対象者のrs-fcMRI測定データ6102から、複数の所定領域間の脳活動の機能的結合の相関行列を対象者ごとに算出する。算出された機能的結合の相関行列のデータは、対象者ごとに、不揮発性記憶装置6080に、機能的結合の相関行列の第1の相関計測データ6106として格納される。
The first correlation measurement unit 6002 calculates, for each subject, a correlation matrix of functional coupling of brain activity between a plurality of predetermined areas from the rs-fc MRI measurement data 6102 of the subject at the first time point. The calculated data of the functional connection correlation matrix is stored in the non-volatile storage device 6080 for each subject as first correlation measurement data 6106 of the functional connection correlation matrix.
第2の相関計測部6004は、第2の時点の対象者のrs-fcMRI測定データ6104から、複数の所定領域間の脳活動の機能的結合の相関行列を対象者ごとに算出する。算出された機能的結合の相関行列のデータは、対象者ごとに、不揮発性記憶装置6080に、機能的結合の相関行列の第2の相関計測データ6108として格納される。
The second correlation measurement unit 6004 calculates, for each subject, a correlation matrix of functional coupling of brain activity between a plurality of predetermined areas from the rs-fc MRI measurement data 6104 of the subject at the second time point. The calculated data of the functional connection correlation matrix is stored in the non-volatile storage device 6080 as the second correlation measurement data 6108 of the functional connection correlation matrix for each subject.
第2の分類器生成部6008は、前記複数の機能的結合の第1の時点と第2の時点の前記相関の差に基づいて、回帰式を求める。前記回帰式は、第2の分類器を特定するための第2の分類器データ6020として、不揮発性記憶装置6080に格納する。治療効果判別処理部6100は、第2の分類器データ6020により特定される第2の分類器に基づいて、入力データに対して治療効果の判別処理を行う。
The second classifier generation unit 6008 obtains a regression equation based on the difference between the first and second time points of the plurality of functional combinations. The regression equation is stored in the non-volatile storage device 6080 as second classifier data 6020 for identifying a second classifier. The therapeutic effect determination processing unit 6100 performs a therapeutic effect determination process on the input data based on the second classifier specified by the second classifier data 6020.
図21は、第2の分類器を生成するためにデータ処理部62が行う処理を説明するためのフローチャートを示す。
FIG. 21 shows a flowchart for explaining the process performed by the data processing unit 62 to generate the second classifier.
以下、図23で説明した処理を図21を参照しながら、より詳しく説明する。
Hereinafter, the process described with reference to FIG. 23 will be described in more detail with reference to FIG.
図21において、データ処理部62は、入力部70からの処理開始の入力等により、分類器生成の処理が開始されると(スタート)、第1の時点の各対象者のrs-fcMRI測定データ6102を読み出し、各表1に示される複数の機能的結合それぞれについて、第1の時点の相関を計測する(S802)。この相関の計測は、各機能的結合のピアソン相関係数を算出することによって行われる。
In FIG. 21, when the data processing unit 62 starts processing of classifier generation by an input of processing start from the input unit 70 or the like (start), rs-fc MRI measurement data of each target person at the first time point 6102 is read out, and for each of the plurality of functional combinations shown in Table 1, the correlation at the first time point is measured (S802). The measurement of this correlation is performed by calculating the Pearson correlation coefficient of each functional combination.
次にデータ処理部62は、記憶部66から第2の時点の各対象者のrs-fcMRI測定データ6104を読み出し、各対象者について表1に示される複数の機能的結合それぞれについて、第2の時点の相関を計測する(S803)。この相関の計測は、各機能的結合のピアソン相関係数を算出することによって行われる。
Next, the data processing unit 62 reads the rs-fc MRI measurement data 6104 of each subject at the second time point from the storage unit 66, and for each of the plurality of functional combinations shown in Table 1 for each subject, the second The correlation of time points is measured (S803). The measurement of this correlation is performed by calculating the Pearson correlation coefficient of each functional combination.
次に、データ処理部62は、各対象者の表1に示される複数の機能的結合のうち、たとえば、第1の機能的結合および第2の機能的結合のそれぞれについて、第1の時点の相関と第2の時点の相関との差を算出する(S804)。前記差は、例えば、下式(4)に基づいて算出される。
Next, the data processing unit 62 determines, for example, each of the first functional connection and the second functional connection among the plurality of functional connections shown in Table 1 of each subject, at the first time point. The difference between the correlation and the correlation at the second time point is calculated (S804). The difference is calculated, for example, based on the following equation (4).

式(4)において、FC1は、表1における第1番目の結合強度を示し、FC2は、表1における第2番目の結合強度を示す。すなわち、関連重み付け和の計算の結果、重みの絶対値が最も大きな結合がFC1であり、2番目に大きな結合がFC2である。上付きの“post”は、第2の時点を示し、“pre”は、第1の時点を示す。典型的には、第1の時点は、治療前(投薬前)の時点であり、第2の時点は、治療開始後(投薬開始後)、所定の時点である。また、sign(w1)は、FC1の重みの符号を示し、sign(w2)は、FC2の重みの符号を示す。たとえば、後述するように図33fにおいて作成したこの分類器は、正確性:0.75, AUC:0.79, 特異度0.88、感度0.43を示す。
In Formula (4), FC1 shows the 1st bond strength in Table 1, and FC2 shows the 2nd bond strength in Table 1. That is, as a result of the calculation of the related weighted sum, the combination with the largest absolute value of the weight is FC1, and the second largest combination is FC2. The superscript "post" indicates a second point in time, and "pre" indicates a first point in time. Typically, the first time point is a time point before treatment (pre-dosing), and the second time point is a predetermined time point after the start of treatment (after the start of dosing). Further, sign (w 1 ) indicates the sign of the weight of FC 1, and sign (w 2 ) indicates the sign of the weight of FC 2. For example, this classifier, created in FIG. 33f as described below, has an accuracy of 0.75, AUC: 0.79, a specificity of 0.88, and a sensitivity of 0.43.
さらに、データ処理部62は、各対象者の各機能的結合における前記2つの相関の差と、治療データ6105に含まれる説明変数(「寛解群」または「非寛解群」のラベル)との関係を説明するための回帰式を求める。回帰式は、特に制限されないが、線形回帰分析によって求めることができる。この回帰式に基づいて、相関状態空間における治療効果あり群と、治療効果なし群を識別する分類器を生成することができる(S804)。
Furthermore, the data processing unit 62 determines the relationship between the difference between the two correlations in each functional connection of each subject and the explanatory variable (labeled as “remitting group” or “non-remitting group”) included in the treatment data 6105. Find a regression equation to explain The regression equation is not particularly limited, but can be determined by linear regression analysis. Based on this regression equation, it is possible to generate a classifier that identifies the group with therapeutic effect and the group without therapeutic effect in the correlated state space (S804).
ここで、「相関状態空間」とは、このようにして複数の機能的結合の第1および第2の時点の間の強度差(必要により、さらに強度差に重みの符号をかけたもの)をそれぞれ空間の軸として張られる空間のことをいう。上記の例では、2次元の空間となる。
Here, “correlated state space” means the difference in intensity between the first and second points in time of the plurality of functional connections (the difference between the difference in intensity and the sign of weight if necessary) in this way. Each refers to a space that is stretched as an axis of space. In the above example, it is a two-dimensional space.
上述のとおり、例えば、各対象者の表1に示す機能的結合識別番号1における第1の時点と第2の時点の前記相関の差(Δsign(W)FC1とする)と、表1に示す機能的結合識別番号2における第1の時点と第2の時点の前記相関の差(Δsign(W)FC2とする)の相関状態をプロットすると図33fのようになる。Δsign(W)FC1とΔsign(W)FC2の相関と、各対象者における治療効果の有無との関係をみると負の傾きをもつ線形回帰式を求めることができる。そして、この線形回帰式に基づく回帰直線を基準として、回帰直線よりも上に分布する対象者を治療効果が認められない群、回帰直線よりも下に分布する対象者を治療効果が認められる群として識別することができる。
As described above, for example, the difference between the first time point and the second time point in the functional connection identification number 1 shown in Table 1 of each subject (referred to as Δsign (W) FC1); If the correlation state of the said difference (it is set as (DELTA) sign (W) FC2) of the 1st time of a functional connection identification number 2 and a 2nd time is set, it will become like FIG. 33 f. From the relationship between the correlation between Δsign (W) FC1 and Δsign (W) FC2 and the presence or absence of the therapeutic effect in each subject, a linear regression equation having a negative slope can be determined. Then, based on the regression line based on this linear regression equation, a group having no therapeutic effect on subjects distributed above the regression line and a group having therapeutic effects on subjects distributed below the regression line Can be identified as
医師は、このようにして出力される治療効果に関する情報を、支援情報として、うつ病患者に対する治療効果の判断を行う。
The doctor uses the information on the therapeutic effect outputted in this way as support information to judge the therapeutic effect on the depressed patient.
(説明変数としてのΔsign(W)FC1とΔsign(W)FC2)
上記の例では、各結合強度の重みの符号sign(W)は、図として表示する際の便宜のためであり、本質的には、治療(投薬)前と治療(投薬開始後)後におけるFC1とFC2の強度変化が重要である。 (Δsign (W) FC1 and Δsign (W) FC2 as explanatory variables)
In the above example, the sign (W) of the weight of each bond strength is for convenience in displaying as a diagram, and in essence, FC1 before treatment (after dosing) and after treatment (after dosing start) And FC2 strength changes are important.
図33fのように、寛解と非寛解を区別せずに見れば、第1の機能的結合の強度変化Δsign(W)FC1と第2の機能的結合の強度変化Δsign(W)FC2との間には、治療開始前と治療開始後所定期間経過後の強度変化の間には相関が見られず、各々の変化に対する補償のような現象は見られない。言い換えれば、これらの結合強度の変化は、相互に独立であることになり、治療の効果を説明するための変数の選択としては適切であることを示している。
As shown in FIG. 33 f, if remission and non-remission are not distinguished, the change in strength of the first functional binding Δsign (W) FC1 and the change in strength of the second functional binding Δsign (W) FC2 There is no correlation between intensity changes before and after the start of treatment, and no phenomenon such as compensation for each change is seen. In other words, these changes in binding strength are mutually independent, indicating that they are appropriate as a choice of variables to explain the effect of the treatment.
したがって、上記のように、治療開始の前後における強度変化が相互に独立と見なせる機能的結合を用いて、上記のような第1および第2の機能的結合に限られず、他の機能的結合を用いることも可能である。また、治療効果を説明するための変数としては、より多くの機能的結合を、表1に示した機能的結合から選択してもよい。
Therefore, as described above, using functional linkages in which changes in intensity before and after treatment start can be regarded as mutually independent, it is not limited to the first and second functional linkages as described above, and other functional linkages It is also possible to use. Also, as a variable for explaining the therapeutic effect, more functional binding may be selected from the functional binding shown in Table 1.
(判別処理)
図22は、実施の形態7生成した第2の分類器を用いて被検者のrs-fcMRIのデータから治療効果を判別するデータ処理部62が行う処理を説明するためのフローチャート図である。 (Discrimination processing)
FIG. 22 is a flowchart for explaining a process performed by the data processing unit 62 for determining the therapeutic effect from the data of rs-fc MRI of the subject using the second classifier generated in the seventh embodiment.
CPU6040は、入力部70からの処理開始の入力等により、ステップS901において、MRI撮像部25から第1の時点における安静時の被検者rs-fcMRI測定データ6113をインタフェース部64を介して取得する。
The CPU 6040 acquires the subject rs-fc MRI measurement data 6113 at rest at the first time point from the MRI imaging unit 25 via the interface unit 64 in step S 901 by the input of process start from the input unit 70 or the like. .
CPU6040は、ステップS902~S903おいて上記2.に記載の前処理を行い、表1に記載の機能的結合の全て、あるいは一部について相関行列の要素を抽出し、第1の時点の各機能的結合の相関を計測する。
The CPU 6040 executes steps S902 to S903 to execute the above-described 2. The elements of the correlation matrix are extracted for all or part of the functional combinations listed in Table 1, and the correlation of each functional combination at the first time point is measured.
CPU6040は、ステップS904において、MRI撮像部25から第2の時点における安静時の被検者rs-fcMRI測定データ6113をインタフェース部64を介して取得する。
In step S 904, the CPU 6040 acquires the subject rs-fc MRI measurement data 6113 at rest at the second time point from the MRI imaging unit 25 via the interface unit 64.
CPU6040は、ステップS905~S906おいて上記2.に記載の前処理を行い、表1に記載の機能的結合の全て、あるいは一部について相関行列の要素を抽出し、第2の時点の各機能的結合の相関を計測する。
The CPU 6040 executes steps S905 to S906 to execute the above-described 2. The elements of the correlation matrix are extracted for all or part of the functional combinations listed in Table 1 and the correlation of each functional combination at the second time point is measured.
次に、CPU6040は、ステップS907おいて、前記複数の機能的結合それぞれについて、ステップS903で計測された第1の時点の各機能的結合の相関とステップS906で計測された第2の時点の各機能的結合の相関の差を算出する。
Next, in step S 907, the CPU 6040 correlates each functional connection at the first point of time measured in step S 903 and each of the second point in time measured in step S 906 for each of the plurality of functional connections. Calculate the functional association correlation difference.
CPU6040は、ステップS907で算出された差を第2の分類器に入力し(S908)、第2の分類器によって前記被検者において治療効果が認められているか、認められていないかを判別する(S908)。
The CPU 6040 inputs the difference calculated in step S 907 to the second classifier (S 908), and determines whether the therapeutic effect is recognized or not recognized in the subject by the second classifier. (S908).
各相関の計測方法、各相関の差の算出方法、及び治療効果の判別方法は、第2の分類器の生成方法で記載した内容と同様である。
The method of measuring each correlation, the method of calculating the difference between the correlations, and the method of determining the therapeutic effect are the same as the contents described in the method of generating the second classifier.
ここで、第1の時点は、治療開始前であっても、治療開始から所定の時間が経過していてもよいが、好ましくは、治療開始前である。また、一度治療を終了した後、治療が再度開始される場合も治療終了から治療再開前までの間は、「治療開始前」としてもよい。第2の時点は、治療開始後であって第1の時点よりも後である限り制限されない。
Here, the first time point may be before the start of the treatment or a predetermined time may have elapsed from the start of the treatment, but is preferably before the start of the treatment. In addition, even after the treatment is restarted, it may be “before the start of treatment” from the end of treatment to the time before the resumption of treatment after the treatment is ended once. The second time point is not limited as long as it is after initiation of treatment and after the first time point.
また、実施の形態7は、ステップS901は、ステップS606よりも前に行われている必要があるが、ステップS902~S903は、ステップS904よりも前に行われている必要はない。ステップS902~S903は、ステップS901の後、少なくともステップS907よりも前のどこかで行われていればよい。
In the seventh embodiment, step S901 needs to be performed before step S606, but steps S902 to S903 do not have to be performed before step S904. Steps S902 to S903 may be performed at least somewhere before step S907 after step S901.
また、実施の形態6の別形態は、前記第2の分類器、治療効果判別装置、あるいは、治療支援装置を、ドラッグリプロファイリングのために使用することを含む。
Moreover, another form of Embodiment 6 includes using the said 2nd classifier, a therapeutic effect determination apparatus, or a treatment assistance apparatus for drug re-profiling.
7-2.治療効果判別方法
実施の形態7は、第2の分類器を用いた治療効果の判別方法に関する。前記判別方法は、第1の時点の被検者の安静時の脳内における、前記複数の機能的結合の第1の相関を計測する工程と、第2の時点の前記被検者と同一の被検者の安静時の脳内における、前記複数の機能的結合の第2相関を計測する工程と、前記被検者の前記複数の機能的結合の前記第2の相関と前記第1の相関との差に基づき、前記分類器により、前記被検者に対する治療効果を判別する工程とを備える。具体的な工程は、上記S901~S909に準ずるが、前記工程は、全部または一部をヒトが行ってもよい。 7-2. Method of DeterminingTherapeutic Effect Embodiment 7 relates to a method of discriminating a therapeutic effect using a second classifier. The determination method is identical to the subject at the second time point with the step of measuring the first correlation of the plurality of functional connections in the brain at rest of the subject at the first time point. Measuring a second correlation of the plurality of functional connections in the resting brain of the subject, the second correlation of the plurality of functional connections of the subject, and the first correlation Determining the therapeutic effect on the subject by the classifier based on the difference between The specific steps conform to the above-described S901 to S909, but all or part of the steps may be performed by human.
実施の形態7は、第2の分類器を用いた治療効果の判別方法に関する。前記判別方法は、第1の時点の被検者の安静時の脳内における、前記複数の機能的結合の第1の相関を計測する工程と、第2の時点の前記被検者と同一の被検者の安静時の脳内における、前記複数の機能的結合の第2相関を計測する工程と、前記被検者の前記複数の機能的結合の前記第2の相関と前記第1の相関との差に基づき、前記分類器により、前記被検者に対する治療効果を判別する工程とを備える。具体的な工程は、上記S901~S909に準ずるが、前記工程は、全部または一部をヒトが行ってもよい。 7-2. Method of Determining
ここでも、このようにして出力される治療効果に関する判別情報を、支援情報として、うつ病患者に対する治療効果の判断を行う。
Also in this case, the determination information on the therapeutic effect outputted in this manner is used as the support information to judge the therapeutic effect on the depressed patient.
実施の形態7の別の形態は、前記治療効果判別方法を、ドラッグリプロファイリングのために使用することを含む。
Another form of Embodiment 7 includes using the said therapeutic effect determination method for drug re-profiling.
また、実施の形態7の別形態として、上記ステップS801~S804を含む処理を実行させて、第2の分類器としての機能をコンピュータに実行させるプログラムを含む。実施の形態7の別態様として、上記ステップS801~S804およびステップS901~S909を含む処理を実行させて、治療効果判別装置としての機能をコンピュータに実行させるプログラムを含む。実施の形態7の別態様として、上記ステップS901~S909を含む処理を実行させて、治療効果判別装置としての機能をコンピュータに実行させるプログラムを含む。これらのプログラムは、ハードディスク、フラッシュメモリ等の半導体メモリ素子、光ディスク等の記憶媒体に記憶されていてもよい。前記記憶媒体へのプログラムの記憶形式は、前記CPU6040が前記プログラムを読み取り可能である限り制限されない。前記記憶媒体への記憶は、不揮発性であることが好ましい。
Further, as another mode of the seventh embodiment, a program that causes the computer to execute the function as the second classifier by executing the processing including the above steps S801 to S804 is included. Another aspect of the seventh embodiment includes a program that causes the computer to execute the function as a therapeutic effect determination device by executing the process including steps S801 to S804 and steps S901 to S909. Another aspect of the seventh embodiment includes a program that causes the computer to execute the function as the therapeutic effect determination device by executing the process including steps S901 to S909. These programs may be stored in a storage medium such as a hard disk, a semiconductor memory device such as a flash memory, or an optical disk. The storage format of the program on the storage medium is not limited as long as the CPU 6040 can read the program. Storage in the storage medium is preferably non-volatile.
8.層別化されたうつ病患者における第2の分類器を使用した治療効果の判定
8-1.治療効果判別装置
実施の形態8は、実施の態様4に記載のうつ病患者の層別化装置において、層別化されたうつ病患者からのrs-fcMRIデータを使って、実施の形態6の治療効果判別装置において、治療効果を判別する装置である。 8. Determination of treatment effect using a second classifier in stratified depression patients 8-1. Therapeutic Efficacy Determining Device The eighth embodiment relates to the stratification device for depression patients according to the fourth embodiment, which uses rs-fc MRI data from stratified depression patients according to the sixth embodiment. The therapeutic effect determination device is a device that determines the therapeutic effect.
すなわち、実施の態様8は、上記3.で述べた第1の分類器生成処理と、上記6.で述べた層別化処理と上記7.で述べた第2の分類器生成処理と、第1の相関計測処理と、第2の相関計測処理と、前記第2の分類器により、前記被検者に対する治療効果を判別する判別処理とを実行する治療効果判別装置である。
That is, the eighth aspect of the embodiment is the same as the third aspect above. The first classifier generation process described in 6. above; The stratification process described in and above 7. The second classifier generation process described above, the first correlation measurement process, the second correlation measurement process, and the determination process for determining the treatment effect on the subject by the second classifier; It is a therapeutic effect determination device to be executed.
したがって、上記3.の記載、上記6-1.の記載と、上記7-1.記載は、ここに援用される。
Therefore, the above 3. , Above 6-1. And the above 7-1. The description is incorporated herein.
実施の形態8の別の形態は、前記治療効果判別装置を、ドラッグリプロファイリングのために使用することを含む。
Another form of Embodiment 8 includes using the therapeutic effect determining apparatus for drug reprofiling.
8-2.治療効果判別方法
実施の形態9は、層別化されたうつ病患者における第2の分類器を使用した治療効果の判別方法に関する。 8-2. Method of DeterminingTherapeutic Effect Embodiment 9 relates to a method of determining therapeutic effect using a second classifier in a stratified depression patient.
実施の形態9は、層別化されたうつ病患者における第2の分類器を使用した治療効果の判別方法に関する。 8-2. Method of Determining
図24に、層別化されたうつ病患者における第2の分類器を使用した治療効果を判別するためのフローチャートを示す。
FIG. 24 shows a flowchart for determining the treatment effect using the second classifier in stratified depression patients.
図24において、ステップS701~S703は、図18と同じである。したがって、上記6-2.の説明は、ここに援用される。
Steps S701 to S703 in FIG. 24 are the same as in FIG. Therefore, the above 6-2. The description of is incorporated herein by reference.
CPU6040は、図24に示すステップS703においてサブクラスが決定された被検者について、ステップS921~S929を行う。ステップS921~S929の各ステップは、上記7-2.及び図22に記載のステップS901~S909の各ステップに対応する。したがって、上記7-2.の記載は、ここに援用される。
The CPU 6040 performs steps S921 to S929 for the subject whose subclass is determined in step S703 shown in FIG. Each step of steps S921 to S929 is the same as the above 7-2. And correspond to each step of steps S901 to S909 described in FIG. Therefore, the above 7-2. Is incorporated herein by reference.
なお、特に限定されないが、以上の説明において、治療効果判別装置の支援により、医師が、現在継続中の治療方法(特定薬の投薬など)に効果が見られないと判断した場合は、それ以後に、医師は、別の治療方法(別の特定薬の投与、ニューロフィードバック法、修正型電気けいれん療法、反復経頭蓋磁気刺激治療法など)の治療方法を併用する、あるいは、別の治療方法へと治療方法を変更する、という判断をすることができる。
In addition, although it is not particularly limited, in the above description, when the doctor determines that the treatment method (medication of a specific drug, etc.) is not effective, with the support of the treatment effect determination device, In addition, the doctor may use another treatment method (administration of another specific drug, neurofeedback, modified electroconvulsive therapy, repeated transcranial magnetic stimulation treatment, etc.) in combination with the treatment method, or to another treatment method. It is possible to make a decision to change the treatment method.
実施の形態9の別の形態は、前記治療効果判別方法を、ドラッグリプロファイリングのために使用することを含む。
Another form of Embodiment 9 includes using the said therapeutic effect determination method for drug re-profiling.
また、実施の形態8の別形態として、上記ステップS921~S929を含む処理を実行させて、第2の分類器としての機能をコンピュータに実行させるプログラムを含む。実施の形態8の別形態として、上記ステップS701~S703およびステップS921~S929を含む処理を実行させて、治療効果判別装置としての機能をコンピュータに実行させるプログラムを含む。実施の形態7の別形態として、上記ステップS401~S406、ステップS701~S703およびステップS901~S909を含む処理を実行させて、治療効果判別装置としての機能をコンピュータに実行させるプログラムを含む。これらのプログラムは、ハードディスク、フラッシュメモリ等の半導体メモリ素子、光ディスク等の記憶媒体に記憶されていてもよい。前記記憶媒体へのプログラムの記憶形式は、前記CPU6040が前記プログラムを読み取り可能である限り制限されない。前記記憶媒体への記憶は、不揮発性であることが好ましい。
Further, as another mode of the eighth embodiment, a program which causes the computer to execute the function as the second classifier by executing the processing including the above steps S921 to S929 is included. As another mode of the eighth embodiment, there is included a program which causes the computer to execute the function as the therapeutic effect judging device by executing the processing including the above-mentioned steps S701 to S703 and steps S921 to S929. As another mode of the seventh embodiment, there is included a program which causes the computer to execute the function as the therapeutic effect judging device by executing the processing including the above steps S401 to S406, steps S701 to S703 and steps S901 to S909. These programs may be stored in a storage medium such as a hard disk, a semiconductor memory device such as a flash memory, or an optical disk. The storage format of the program on the storage medium is not limited as long as the CPU 6040 can read the program. Storage in the storage medium is preferably non-volatile.
9.ニューロフィードバック
9-1.脳活動訓練装置
実施の形態10は、被訓練者の脳活動に対してフィードバックを与え、健常者の相関(結合)状態に近づける訓練(ニューロフィードバック訓練、あるいは単に訓練ともいう)ための脳活動訓練装置に関する。
なお、より一般的には、このような脳活動訓練装置は、健常群と患者群の脳活動という関係において、被訓練者の脳活動の機能的結合状態を健常者の脳活動の機能的結合状態に近づける訓練に留まらず、目標とする脳活動の機能的結合状態に、被訓練者の現在の脳活動の機能的結合状態を近づけるという意味での訓練に使用することも可能である。健常者の脳活動の機能的結合状態及び目標とする脳活動の結合状態を、後述するように「目標パターン」と呼ぶ。目標パターンは、記憶装置10080、又はメモリドライブ10020に格納される。 9. Neuro feedback 9-1. Brain ActivityTraining Device Embodiment 10 provides brain activity training for giving feedback to the brain activity of a trainee and bringing it close to the correlated (combined) state of a healthy person (also referred to as neurofeedback training or simply training). It relates to the device.
More generally, such a brain activity training apparatus relates to the functional connection state of the brain activity of the trainee with the functional activity of the brain activity of the healthy person in relation to the brain activity of the healthy group and the patient group. It is also possible to use for training in the sense of bringing the functional connection state of the current brain activity of the trainee closer to the functional connection state of the target brain activity as well as the training for bringing the state closer. The functional connection state of the brain activity of a healthy person and the connection state of the target brain activity are called "target pattern" as described later. The target pattern is stored in the storage device 10080 or the memory drive 10020.
9-1.脳活動訓練装置
実施の形態10は、被訓練者の脳活動に対してフィードバックを与え、健常者の相関(結合)状態に近づける訓練(ニューロフィードバック訓練、あるいは単に訓練ともいう)ための脳活動訓練装置に関する。
なお、より一般的には、このような脳活動訓練装置は、健常群と患者群の脳活動という関係において、被訓練者の脳活動の機能的結合状態を健常者の脳活動の機能的結合状態に近づける訓練に留まらず、目標とする脳活動の機能的結合状態に、被訓練者の現在の脳活動の機能的結合状態を近づけるという意味での訓練に使用することも可能である。健常者の脳活動の機能的結合状態及び目標とする脳活動の結合状態を、後述するように「目標パターン」と呼ぶ。目標パターンは、記憶装置10080、又はメモリドライブ10020に格納される。 9. Neuro feedback 9-1. Brain Activity
More generally, such a brain activity training apparatus relates to the functional connection state of the brain activity of the trainee with the functional activity of the brain activity of the healthy person in relation to the brain activity of the healthy group and the patient group. It is also possible to use for training in the sense of bringing the functional connection state of the current brain activity of the trainee closer to the functional connection state of the target brain activity as well as the training for bringing the state closer. The functional connection state of the brain activity of a healthy person and the connection state of the target brain activity are called "target pattern" as described later. The target pattern is stored in the storage device 10080 or the memory drive 10020.
ここで、被訓練者は、上記3.記載のうつ症状の判別装置1、うつ症状の判別装置2又はうつ症状の判別方法により、「うつ症状」のラベルを付された被検体(好ましくはMDD、より好ましくはメランコリー型MDDの被検体)、上記4.に記載のうつ症状のレベルの判別装置及び判別方法により、うつ症状のレベルを判定された被検体(好ましくはMDD、より好ましくはメランコリー型MDDの被検体)、上記6.に記載のうつ病患者の層別化装置及び層別化方法により、層別化された被検体(好ましくはMDDに層別化された被検体、より好ましくはメランコリー型MDDに層別化された被検体)であることが好ましい。従って、上記記3.記載のうつ症状の判別装置1、うつ症状の判別装置2又はうつ症状の判別方法に関する説明、上記4.に記載のうつ症状のレベルの判別装置及び判別方法に関する説明及び上記6.に記載のうつ病患者の層別化装置及び層別化方法に関する説明は、ここに援用される。
Here, the trainee is said 3. above. A subject labeled “depressive symptoms” by the depression symptom determination device 1 described above, the depression symptom determination device 2 or the depression symptom determination method (preferably MDD, more preferably a melancholic-type MDD subject) , Above 4. A subject whose level of depressive symptoms has been determined by the apparatus and method for discriminating the level of depressive symptoms described in (a subject of MDD, more preferably a subject of melancholy type MDD); A stratified subject (preferably a subject stratified into MDD, more preferably a melancholy type MDD) according to the stratification apparatus and stratification method for depression patients described in It is preferable that it is a subject). Therefore, the above 3. Description of the discrimination device 1 for depression symptoms described, the discrimination device 2 for depression symptoms or the discrimination method for depression symptoms, the above 4. Description of the apparatus and method for determining the level of depressive symptoms described in 6. The description of the stratification apparatus and the stratification method for depression patients described in the above is incorporated herein.
図34は、このような脳活動訓練装置の構成の概念を示す図である。
FIG. 34 is a diagram showing the concept of the configuration of such a brain activity training apparatus.
脳活動訓練装置のハードウェア構成としては、たとえば、上述した図1に示されるMRI装置10の構成を用いることができる。脳活動訓練装置のハードウェア構成は、基本的に図1と同じであるが、図1におけるデータ処理部32を実施の態様10ではデータ処理部102と読み替える。また、脳活動訓練装置において、データ処理部102の構成は、図1及び図2と基本的に同様であるが、実施の形態10では、図1において記憶部36を記憶部106と、制御部42を制御部112と、入力部40を入力部110と、インタフェース部44をインタフェース部114と、データ収集部46をデータ収集部116と、画像処理部48を画像処理部118と、表示部38を表示部108と、表示制御部34を表示制御部104と読み替える。また、図2において、データ処理部32のコンピュータ本体2010をコンピュータ本体10010と、メモリドライブ2020をメモリドライブ10020、ディスクドライブ2030をディスクドライブ10030と、演算装置(CPU)2040を演算装置(CPU)10040と、ディスクドライブ2030をディスクドライブ6030と、メモリドライブ2020をメモリドライブ6020と、バス2050をバス10050と、ROM2060をROM10060と、RAM2070をRAM10070と、不揮発性記憶装置2080を不揮発性記憶装置10080と、通信インタフェース2090を通信インタフェース10090と読み替える。データ処理部62のハードウェアとしては、上述のとおり、特に限定されないが、汎用コンピュータを使用することが可能である。
As a hardware configuration of the brain activity training apparatus, for example, the configuration of the MRI apparatus 10 shown in FIG. 1 described above can be used. The hardware configuration of the brain activity training apparatus is basically the same as that of FIG. 1, but the data processor 32 in FIG. 1 is replaced with the data processor 102 in the tenth embodiment. In the brain activity training apparatus, the configuration of the data processing unit 102 is basically the same as in FIGS. 1 and 2, but in the tenth embodiment, the storage unit 36 in FIG. 42, a control unit 112, an input unit 40, an input unit 110, an interface unit 44, an interface unit 114, a data collection unit 46, a data collection unit 116, an image processing unit 48, an image processing unit 118, and a display unit 38. And the display control unit 34 as the display control unit 104. Further, in FIG. 2, a computer main body 2010 of the data processing unit 32 is a computer main body 10010, a memory drive 2020 is a memory drive 10020, a disk drive 2030 is a disk drive 10030, and an arithmetic unit (CPU) 2040 is an arithmetic unit (CPU) 10040. Disk drive 2030, memory drive 2020, memory drive 6020, bus 2050, bus 10050, ROM 2060, ROM 10060, RAM 2070, RAM 10070, non-volatile storage device 2080, non-volatile storage device 10080, The communication interface 2090 is replaced with the communication interface 10090. The hardware of the data processing unit 62 is not particularly limited as described above, but a general-purpose computer can be used.
以下に例示的に説明する脳活動訓練装置の駆動方法は、脳機能画像法により脳活動を示す信号を時系列に計測するための脳活動検出装置としては、リアルタイムfMRIを用いるものとして説明する。
The driving method of the brain activity training device described below by way of example will be described as using a real time fMRI as a brain activity detecting device for measuring signals indicating brain activity in time series by brain function imaging.
図34及び図38を参照してニューロフィードバックの流れを説明する。まず、MRI装置10により被訓練者の脳活動が、脳内の複数の所定領域における脳活動を示す信号として、所定時間の間について時系列で検知される(図38、ステップS1001)。この間、被訓練者は後述する報酬値が高くなるように努めることが好ましい。fMRIとして撮像するためにEPI(Echo-planar imaging)撮像が実行される。
The flow of neuro feedback will be described with reference to FIGS. 34 and 38. First, brain activity of the trainee is detected by the MRI apparatus 10 in time series for a predetermined time as a signal indicating brain activity in a plurality of predetermined regions in the brain (FIG. 38, step S1001). During this time, it is preferable that the trainee make an effort to increase a reward value described later. Echo-planar imaging (EPI) imaging is performed to image as fMRI.
続いて、データ処理部102のCPU10040により、撮像された画像がリアルタイムで再構成処理される。
Subsequently, the CPU 10040 of the data processing unit 102 reconstructs the captured image in real time.
ここで、実施の形態1で説明したとおり、表1に示す機能的結合識別番号(表1でID)1~12の関心領域間の機能的結合が、「うつ症状」のラベルの判別のために特徴選択により選択された。
Here, as described in the first embodiment, the functional connection between the regions of interest 1 to 12 shown in Table 1 (ID in Table 1) is for determining the label of "depressive symptom" Was selected by feature selection.
ここで、被訓練者においては、上記12個の機能的結合のうち、少なくとも1つの特定の機能結合を「訓練対象の機能的結合」として、さらに選択・抽出する。ここで、特に限定されないが、このような「訓練対象の機能的結合」としては、たとえば、表1で示した機能結合のうち、うつ病ラベルの判別に最も寄与度の大きい「左背外側前頭前皮質と、左楔前部および左後部帯状皮質との間の機能的結合」(表1のID=1の結合)を選択するものとする。ここで、「寄与度」とは、「関連重み付け和における重みの絶対値」を意味するものとする。
Here, in the trainee, at least one specific functional connection of the 12 functional connections is further selected and extracted as “functional connection of training object”. Here, although not particularly limited, for example, among such functional connections shown in Table 1, the “left dorsolateral frontal lobe that contributes the most to the discrimination of the depression label among such functional connections shown in Table 1 is not particularly limited. We select the "functional connection between the anterior cortex and the anterior left and posterior cingulate cortex" (the ID = 1 connection in Table 1). Here, "the degree of contribution" means "the absolute value of the weight in the related weighted sum".
図32において、説明したように、この結合は、上述したような「抗うつ薬」の投与によって、健常者側とは反対方向に変化する結合のうち、最大の寄与度を有する結合である。
In FIG. 32, as described above, this binding is the binding having the largest contribution among the binding that changes in the opposite direction to the healthy person by the administration of the “antidepressant” as described above.
なお、「訓練対象の機能的結合」としては、このID=1の結合のみを選択してもよいし、ID=1の結合に加えて、他の結合を対象として選択してもよい。このとき、ID=1の結合に加えて選択する機能的結合としては、2番目に寄与度の大きなID=2の結合というような選択をしてもよい。あるいは、ID=1の結合に加えて、「抗うつ薬」の投与によって、健常者側とは反対方向に変化する他の結合、たとえば、ID=3の結合を選択してもよい。ID=1の結合に加えて選択する他の機能結合の個数は、1つでもそれ以上でもよい。
Note that, as the “functional connection of training object”, only the connection of ID = 1 may be selected, and in addition to the connection of ID = 1, another connection may be selected as an object. At this time, as the functional combination to be selected in addition to the combination of ID = 1, selection may be made such as the combination of ID = 2, which has the second largest contribution. Alternatively, in addition to the binding of ID = 1, administration of the “antidepressant” may select other binding that changes in the opposite direction to the healthy person, for example, binding of ID = 3. The number of other functional couplings selected in addition to the coupling of ID = 1 may be one or more.
さらに、データ処理部102は、「訓練対象の機能的結合」に対応する関心領域について、機能的結合の所定時間内の時間的な相関を算出する処理を行う(図38、ステップS1002)。
Furthermore, the data processing unit 102 performs a process of calculating temporal correlation within a predetermined time of functional combination with respect to the region of interest corresponding to “functional combination of training object” (FIG. 38, step S1002).
すなわち、データ処理部102は、リアルタイムで測定した安静時のfMRIの連続するn個(n:自然数、n≧1)の計測時刻分のfMRIデータ(信号)から、まず、各関心領域の「活動度」を算出する。この活動度は、たとえば、連続するn個の計測時刻の計測値についての平均値とすることができる。ここで、連続するn個の計測時刻からなる期間を「サンプルステップ」と呼ぶことにする。
That is, the data processing unit 102 first determines the activity of each region of interest from the fMRI data (signal) for n consecutive (n: natural number, n.gtoreq.1) measurement times of the fMRI at rest measured in real time Calculate the degree. This activity degree can be, for example, an average value of measurement values of n consecutive measurement times. Here, a period consisting of n continuous measurement times will be referred to as a "sample step".
そして、このような各サンプルステップの活動度について、データ処理部102は、所定の期間の計測ウィンドウについて、以下の数式により、活動度の時間軸上の相関(以下、「時間相関」という)を算出する。なお、計測ウィンドウは、時間軸上で連続する複数のサンプルステップの活動度(たとえば、m個(m:自然数、m≧2))を含むような期間である。
Then, for the activity of each sample step, the data processing unit 102 determines the correlation (hereinafter referred to as “time correlation”) of the activity on the time axis by the following formula for the measurement window of a predetermined period. calculate. Note that the measurement window is a period that includes the activity (for example, m (m: natural number, m 、 2)) of a plurality of continuous sample steps on the time axis.

ここで、xは、「訓練対象の機能的結合」のうちの一方の関心領域の「活動度」を意味し、yは、「訓練対象の機能的結合」のうちの他方の関心領域の「活動度」を意味する。また、x(バー)(以下、文字xの頭部に-(バー)を付して「平均」を表す記号を、「x(バー)」と呼ぶ。他の文字についても同様である。)とは、上記のような計測ウィンドウ内での活動度xの平均を表す。「y(バー)」についても同様である。上記の式において、Σは、たとえば、計測ウィンドウ内のm個のサンプルステップの活動度について和を取ることを意味する。また、計測ウィンドウは、特に限定されないが、たとえば、10秒~20秒程度に設定することができる。
Here, x means the "activity" of one region of interest of "functional combination of training objects", y is "of the other region of interest of" functional connection of training objects " Means "activity". Further, x (bar) (hereinafter, a symbol representing "average" by adding-(bar) to the head of the letter x is called "x (bar)". The same applies to other letters.) Represents the average of activity x within the measurement window as described above. The same applies to "y (bar)". In the above equation, Σ means, for example, summing up the activity of m sample steps in the measurement window. The measurement window is not particularly limited, but can be set to, for example, about 10 seconds to 20 seconds.
ここで、機能結合の時間相関は、符号として、正または負の値を取りうる。
Here, the temporal correlation of the functional combination can take positive or negative values as a code.
そして、機能結合の時間相関の符号は、たとえば、「健常者」であれば、負であるのに対して、「うつ症状」有りと判別された被験者では、正である、というような状況がありうる。もちろん、その逆の場合もありうるし、あるいは、両者で同一の符号であることもありうる。機能結合の時間相関の符号およびその絶対値の大きさを併せて、「時間相関のパターン」と呼ぶことにする。
Then, the sign of the time correlation of the functional combination is, for example, negative in the case of “healthy person”, but positive in the subject determined to have “depression symptom”. It is possible. Of course, the opposite is also possible, or both may have the same code. The sign of the temporal correlation of the functional combination and the magnitude of the absolute value will be collectively referred to as “pattern of temporal correlation”.
そこで、たとえば、「健常者」において、時間相関の符号が負であるような機能的結合を「訓練対象の機能的結合」として選択した場合、被訓練者の訓練対象の機能的結合の時間相関の健常者の時間相関に対する「近似度」を以下の関数F1のようにして算出できる。
i)被訓練者の訓練対象の機能的結合の時間相関の符号が正であれば、一定値V1をとり、前記符号が負であれば、値がV2(>V1≧0)となり、時間相関の絶対値の増加にとともに、値V2が増加するような関数F1。 Therefore, for example, in the “healthy person”, when the functional combination such that the sign of the time correlation is negative is selected as the “functional combination of the training object”, the time correlation of the functional combination of the training object of the trainee The “degree of approximation” to the time correlation of the healthy subject can be calculated as the following function F1.
i) If the sign of the time correlation of the functional combination of the trainee to be trained is positive, the constant value V1 is taken, and if the sign is negative, the value becomes V2 (> V1 ≧ 0), and the time correlation A function F1 such that the value V2 increases with the increase of the absolute value of.
逆に、「健常者」において、時間相関の符号が正であるような機能的結合を「訓練対象の機能的結合」として選択した場合、被訓練者の訓練対象の機能的結合の時間相関の健常者の時間相関に対する「近似度」を以下の関数F2のようにして算出できる。
ii)被訓練者の訓練対象の機能的結合の時間相関の符号が負であれば、一定値V1をとり、前記符号が正であれば、値がV2(>V1≧0)となり、時間相関の絶対値の増加にとともに、値V2が増加するような関数F2。 On the contrary, when "functional subject" whose sign of time correlation is positive is selected as "functional subject of training object" in "healthy person", the time correlation of functional subject of training object of trainee is The "degree of approximation" to the time correlation of a healthy subject can be calculated as the following function F2.
ii) If the sign of the time correlation of the functional combination of the trainee's training is negative, take a constant value V1; if the sign is positive, the value becomes V2 (> V1 ≧ 0), and the time correlation A function F2 such that the value V2 increases with the increase of the absolute value of.
なお、「近似度」としては、上記のような例に限られず、符号を含めて、健常者の機能結合の時間相関に近似するパターンであるほど、「近似度」が高くなる関数であれば、他の関数でもよい。
The “degree of approximation” is not limited to the above-described example, and it may be a function that the degree of “approximation” becomes higher as the pattern approximates the time correlation of the functional connection of a healthy person including the code. , Other functions may be used.
また、特に限定されないが、「訓練対象の機能的結合」が2つ以上選択されている場合は、各々の近似度を平均した値を「近似度」としてもよいし、あるいは、近似度を各結合の寄与度で重み付け平均した値を「近似度」としてもよい。
Further, although not particularly limited, when two or more “functional combinations of training objects” are selected, a value obtained by averaging the respective degrees of approximation may be used as “degree of approximation”, or each degree of approximation may be selected. A value obtained by weighting and averaging the degree of contribution of coupling may be used as the “degree of approximation”.
さらに、データ処理部102は、上記のようにして算出した近似度に応じて、報酬値を算出する(図38、ステップS1003)。ここで、報酬値(スコアSC)は、目標の脳活動の結合強度に対する近似度に応じて、より近似度が高いほど、高い得点となる。
Furthermore, the data processing unit 102 calculates a reward value according to the degree of approximation calculated as described above (FIG. 38, step S1003). Here, the reward value (score SC) is a higher score, the higher the degree of approximation, according to the degree of approximation to the joint strength of the target brain activity.
データ処理部102は、提示装置6に算出されたスコアSCを表示することで、被訓練者2にフィードバックする(図38、ステップS1004)。なお、フィードバックされる情報としては、スコアの数値そのものでもよいし、あるいは、例えば図35に示すような、前記数値の大きさに応じて、大きさの変化する図形でもよい。その他、被訓練者が、スコアの大きさを認識可能な画像であれば、他の構成を用いてもよい。
The data processing unit 102 provides feedback to the trainee 2 by displaying the calculated score SC on the presentation device 6 (FIG. 38, step S1004). The information to be fed back may be the numerical value of the score itself, or a graphic whose size changes according to the value of the numerical value, as shown in FIG. 35, for example. Other configurations may be used as long as the trainee can recognize the size of the score.
以後は、所定の期間について、EPI撮像から、スコアのフィードバックの処理をリアルタイムで繰り返す。
Thereafter, processing of score feedback is repeated in real time from EPI imaging for a predetermined period.
図36は、ニューロフィードバック訓練シーケンスの一例を示す図である。
FIG. 36 is a diagram showing an example of a neuro feedback training sequence.
図36に示すように、まず、第1日において、被訓練者は、事前の安静時の脳活動が測定される。
As shown in FIG. 36, first, on the first day, the trainee measures brain activity at rest in advance.
その後、第1日において、ニューロフィードバックによる訓練を行う。
Then, on the first day, training by neurofeedback is performed.
以後、第2日、第3日についても、ニューロフィードバック訓練を行う。
After that, neurofeedback training will be conducted on the second and third days.
第4日(最終日)には、ニューロフィードバックによる訓練を行った後に、事後の安静時の脳活動の計測を実施する。訓練にかける日数は、これより少なくとも、あるいは、多くともよい。
On the fourth day (the final day), after performing neurofeedback training, measure the brain activity at rest after rest. The number of days spent on training may be at least or more than this.
さらに、被訓練者に対して、所定期間の経過後、たとえば、2か月後において、安静時の脳活動の計測を実施する。
Furthermore, for the trainee, measurement of brain activity at rest is performed, for example, two months after the elapse of a predetermined period.
ニューロフィードバック訓練の治療効果は、上記5.に記載の第1の分類器を使用する治療効果の判別装置及び判別方法、又は上記7.に記載の第2の分類器の生成と第2の分類器を使用する治療効果の判別方法によって、判定することができる。
The therapeutic effect of neurofeedback training is described above in 5. A device and method for determining a therapeutic effect using the first classifier described in 7. or 7. above. It can be determined by the generation of the second classifier described in and the discrimination method of the treatment effect using the second classifier.
従って、上記5.に記載の第1の分類器を使用する治療効果の判別装置及び判別方法、又は上記7.に記載の第2の分類器の生成と第2の分類器を使用する治療効果の判別方法の説明は、ここに援用される。
Therefore, the above 5. A device and method for determining a therapeutic effect using the first classifier described in 7. or 7. above. The description of the generation of the second classifier described in and the method of determining the therapeutic effect using the second classifier is incorporated herein.
9-2.脳活動訓練装置を制御するコンピュータプログラム
9-2. Computer program for controlling a brain activity training apparatus
実施の形態10の別形態として、上記ステップS1001からS1004までの処理を実行させて、脳活動訓練装置を駆動するコンピュータプログラムを含む。これらのプログラムは、ハードディスク、フラッシュメモリ等の半導体メモリ素子、光ディスク等の記憶媒体に記憶されていてもよい。前記記憶媒体へのプログラムの記憶形式は、前記CPU10040が前記プログラムを読み取り可能である限り制限されない。前記記憶媒体への記憶は、不揮発性であることが好ましい。
As another mode of the tenth embodiment, the computer program includes a computer program for driving the brain activity training device by executing the processes from step S1001 to S1004. These programs may be stored in a storage medium such as a hard disk, a semiconductor memory device such as a flash memory, or an optical disk. The storage format of the program on the storage medium is not limited as long as the CPU 10040 can read the program. Storage in the storage medium is preferably non-volatile.
(実施例)
I.データ収集及び評価方法
1.データ収集対象
広島大学病院及び広島市内のクリニックで募集した105名の患者について、精神障害の診断と統計マニュアル-IVの基準の大うつ病性障害(MDD)の患者を選別するために、M.I.N.I.(精神疾患簡易構造化面接法)を使用してスクリーニングした。現在及び過去に躁病症状、精神病症状、アルコール依存症又は乱用、薬物(substance)依存症又は乱用、反社会性人格障害を除外基準とした。そして、最終的には、自己申告でうつ症状を伴う93名の患者をMDD分類器の訓練データセットとして選択した。患者は、投薬を開始する前に、又は投薬開始から0~2週間以内に後述する条件でfMRIデータを取得した。145人の健常者は、地域から募集し、M.I.N.I.面接を行い、いかなる精神疾患の既往もない者を選択した。本実施例における実験は、広島大学の倫理委員会の承認を得て行った。また、実験を開始するに先立ち、全ての参加者に対して書面でインフォームドコンセントを行った。 (Example)
I. Data collection and evaluation method Data collection target For the screening of patients with major depressive disorder (MDD) based on the Diagnosis and Statistics Manual for Mental Disorders-IV for 105 patients recruited at Hiroshima University Hospital and clinics in Hiroshima city, MINI Screening was performed using (the mental illness simplified structured interview method). Depression criteria, psychiatric symptoms, alcoholism or abuse, substance addiction or abuse, antisocial personality disorder were used as the exclusion criteria for current and past. And finally, 93 patients with self-reported depressive symptoms were selected as training datasets for the MDD classifier. Patients obtained fMRI data under the conditions described below before starting dosing or within 0 to 2 weeks after starting dosing. One hundred and forty-five healthy people were recruited from the community, conducted a MINI interview, and selected those who had no history of any mental illness. The experiment in this example was conducted with the approval of the Ethics Committee of Hiroshima University. In addition, informed consent was given in writing to all participants prior to the start of the experiment.
また、完全に独立した4つ施設からもうつ病コホートを収集した。
We also collected depression cohorts from four completely independent centers.
前記MDDには、メランコリー型MDD、非メランコリー型MDD、治療抵抗型MDDの3つのサブタイプが含まれる。以下、実施例において、全てのMDD患者を含む群を全MDD群、メランコリー型MDD患者を含む群をメランコリー型MDD群、非メランコリー型うつ病患者を含む群を非メランコリー型MDD群、治療抵抗型MDD患者を含む群を治療抵抗型MDD群、健常者の群を健常対照群とする。
The MDD includes three subtypes of melancholic MDD, non-melancholic MDD, and treatment-resistant MDD. In the following examples, the group including all MDD patients is all MDD group, the group including melancholic MDD patients is melancholic MDD group, the group including non-melancholic depression patients is non-melancholic MDD group, treatment resistant type A group including MDD patients is a treatment-resistant MDD group, and a group of healthy persons is a healthy control group.
メランコリー型MDD分類器を生成するための訓練データセットは、Beck Depression Inventory(BDI)に基づいて、年齢及び性別が健常対照群と一致した、中程度のうつ病症状を伴ううつ病の(M.I.N.I.に基づく)サブタイプとなるよう限定した。各グループに偏りがないようにするために、患者数及び健常者(年齢及び性別が患者と一致し、かつBDI-IIスコアが10未満である)数を等しくした(表2a)。知能指標値(IQ)を評価するためのJapanese Adult Reading Test(JART)の得点については、訓練データセットに3つの欠失データ(メランコリー型MDD群に1つ、全MDD群及びメタンコリー型MDD群の両方に対する健常対照群うち2つ)と、テストデータセットの治療抵抗型MDD群に2つの欠失データがあった。BDIスコアでは、訓練データセットに、全MDD群のみに対する健常対照群に2つの欠失データと抗うつ剤治療後のデータに1つの欠失データがあった。
The training data set for generating the melancholic MDD classifier was based on the Beck Depression Inventory (BDI), in which the age and gender were matched with the healthy control group, for depression with moderate depressive symptoms (MINI Based) to be a subtype. The number of patients and the number of healthy persons (whose age and gender matched the patients and their BDI-II score is less than 10) were equal (Table 2a) to ensure that each group was unbiased. Regarding the scores of the Japanese Adult Reading Test (JART) to evaluate the intelligence index value (IQ), three deletion data (one in melancholic MDD group, all MDD group and methane collie MDD group) in the training data set There were two missing data in the two healthy controls for both, and the treatment-resistant MDD group of the test data set. For BDI scores, the training data set had 2 deletion data in the healthy control group for the whole MDD group only and 1 deletion data in the data after antidepressant treatment.
表2bには、本実施例で使用するテストデータの内訳を示す。
Table 2b shows the breakdown of test data used in this example.

2.独立外部バリデーションコホートに対する汎化
日本放射線医学研究所において独立した検証コホート(千葉のコホート)を作成した。参加者について、M.I.N.I.に基づいて精神疾患の生涯履歴を評価した。 2. Generalization for Independent External Validation Cohort The independent validation cohort (Chiba cohort) was created at the Japan Radiological Institute. Participants were assessed for lifelong history of mental illness based on the MINI.
日本放射線医学研究所において独立した検証コホート(千葉のコホート)を作成した。参加者について、M.I.N.I.に基づいて精神疾患の生涯履歴を評価した。 2. Generalization for Independent External Validation Cohort The independent validation cohort (Chiba cohort) was created at the Japan Radiological Institute. Participants were assessed for lifelong history of mental illness based on the MINI.
MDD患者には併存症の精神障害はなく、健常対照群には身体的、神経学的、精神医学的障害はなく、現在または過去の薬物乱用の病歴はなかった。すべての参加者に対して実験前に書面によるインフォームドコンセントを実施した。今回の実験は、1964年ヘルシンキ宣言及びその後の改正に規定された倫理基準に従って、放射性医薬品安全委員会および放射線医学研究所の機関レビュー委員会によって承認された。
MDD patients had no psychiatric disorder of co-morbidity, healthy controls had no physical, neurological or psychiatric disorders, and had no history of current or past drug abuse. Written informed consent was given to all participants prior to the experiment. The experiment was approved by the Radiological Drug Safety Committee and the Institutional Review Committee of the Institute of Radiological Sciences in accordance with the ethical standards set forth in the Helsinki Declaration of 1964 and subsequent amendments.
3.うつ病及びうつ症状の評価
うつ病及びうつ病の症状を評価するためにBeck Depression Inventory(BDI)を使用した。さらに、治療効果の評価には、Hamilton Rating Scale for Depression(HAMD)も使用した。 3. Assessment of Depression and Depressive Symptoms Beck Depression Inventory (BDI) was used to assess depression and symptoms of depression. In addition, the Hamilton Rating Scale for Depression (HAMD) was also used to evaluate the treatment effect.
うつ病及びうつ病の症状を評価するためにBeck Depression Inventory(BDI)を使用した。さらに、治療効果の評価には、Hamilton Rating Scale for Depression(HAMD)も使用した。 3. Assessment of Depression and Depressive Symptoms Beck Depression Inventory (BDI) was used to assess depression and symptoms of depression. In addition, the Hamilton Rating Scale for Depression (HAMD) was also used to evaluate the treatment effect.
4.非メランコリー型MDD及び治療抵抗型MDD
非メランコリー型MDD群は、BDIスコア17以上のすべてのMDDを含む。治療抵抗型MDDは、MDDと診断された中で、抗うつ薬を2種類以上投与しても抑うつ症状が改善しない者である。 4. Non-melancholic MDD and treatment resistant MDD
The non-melancholic MDD group includes all MDDs with a BDI score of 17 or more. Treatment-resistant MDD is a person who has been diagnosed with MDD and does not improve depressive symptoms even if two or more antidepressant drugs are administered.
5.他の精神疾患における分類器の評価
自閉症(ASD)患者および統合失調症(SSD)患者のfMRIデータは、Yahataらの文献(NATURE COMMUNICATIONS | 7:11254 | DOI: 10.1038/ncomms11254)に記載のデータを使用した。うつ病の合併症による影響を最小限に抑えるために、ASD群は、抗うつ薬が有効でなかった者に限定した。fMRIデータは、MDD患者健常者と同様に、目を開いた安静状態で取得した。 5. Evaluation of classifiers in other psychiatric disorders fMRI data of autism (ASD) and schizophrenia (SSD) patients are described in Yahata et al. (NATURE COMMUNICATIONS | 7: 11254 | DOI: 10.1038 / ncomms11254) I used the data. In order to minimize the effects of complications of depression, the ASD group was limited to those for whom antidepressants were not effective. The fMRI data was acquired in a resting state with open eyes, similar to healthy MDD patients.
自閉症(ASD)患者および統合失調症(SSD)患者のfMRIデータは、Yahataらの文献(NATURE COMMUNICATIONS | 7:11254 | DOI: 10.1038/ncomms11254)に記載のデータを使用した。うつ病の合併症による影響を最小限に抑えるために、ASD群は、抗うつ薬が有効でなかった者に限定した。fMRIデータは、MDD患者健常者と同様に、目を開いた安静状態で取得した。 5. Evaluation of classifiers in other psychiatric disorders fMRI data of autism (ASD) and schizophrenia (SSD) patients are described in Yahata et al. (NATURE COMMUNICATIONS | 7: 11254 | DOI: 10.1038 / ncomms11254) I used the data. In order to minimize the effects of complications of depression, the ASD group was limited to those for whom antidepressants were not effective. The fMRI data was acquired in a resting state with open eyes, similar to healthy MDD patients.
6.fMRIデータの取得
fMRIデータの取得の際、被験者に、暗い照明のあるスキャンルームでは、特に何も考えず、眠らずに、モニター画面中央の十字マークを見続けてもらうように依頼した。各施設におけるfMRIデータ取得条件の詳細は表3に示す。 6. Acquisition of fMRI data When acquiring fMRI data, the subject was asked to keep looking at the cross mark in the center of the monitor screen without sleep, without thinking particularly in the scan room with dark illumination. The details of fMRI data acquisition conditions at each facility are shown in Table 3.
fMRIデータの取得の際、被験者に、暗い照明のあるスキャンルームでは、特に何も考えず、眠らずに、モニター画面中央の十字マークを見続けてもらうように依頼した。各施設におけるfMRIデータ取得条件の詳細は表3に示す。 6. Acquisition of fMRI data When acquiring fMRI data, the subject was asked to keep looking at the cross mark in the center of the monitor screen without sleep, without thinking particularly in the scan room with dark illumination. The details of fMRI data acquisition conditions at each facility are shown in Table 3.

7.fMRIイメージングデータの前処理及び領域間相関
すべてのfMRIデータは、Yahataらの以下の文献に記載されている同一の手法を用いて前処理した。 7. Pre-processing and inter-regional correlation of fMRI imaging data All fMRI data were pre-processed using the same procedure described in Yahata et al.
すべてのfMRIデータは、Yahataらの以下の文献に記載されている同一の手法を用いて前処理した。 7. Pre-processing and inter-regional correlation of fMRI imaging data All fMRI data were pre-processed using the same procedure described in Yahata et al.
文献:Noriaki Yahata, Jun Morimoto, Ryuichiro Hashimoto, Giuseppe Lisi, Kazuhisa Shibata,Yuki Kawakubo, Hitoshi Kuwabara, Miho Kuroda, Takashi Yamada, Fukuda Megumi, Hiroshi Imamizu, Jose´ E. Na´n~ez Sr, Hidehiko Takahashi, Yasumasa Okamoto, Kiyoto Kasai, Nobumasa Kato, Yuka Sasaki, Takeo Watanabe & Mitsuo Kawato, “A small number of abnormal brain connections predicts adult autism spectrum disorder”, NATURE COMMUNICATIONS, DOI: 10.1038/ncomms11254 Matlab R2014a(Mathworks inc., USA)のSPM8(Wellcome Trust Center for Neuroimaging、University College London、UK)を用いてT1強調構造画像及び安静状態機能画像を前処理した。機能イメージは、スライスタイミング補正および平均イメージへのアライメントで前処理された。次に、平均機能画像により同調した構造画像のセグメント化によって得られた正規化パラメータを用いて、fMRIデータを正規化し、2×2×2mm3ボクセルで再サンプリングした。最後に、機能的画像を等方性6mm全幅半値ガウスカーネルで平滑化した。これらの前処理ステップの後、時系列データのフレーム間の相対的な変化に基づいて、スクラビング手順を実行して余分な頭部運動を伴う任意のボリューム(すなわち、機能的画像)を除外した。(頭部運動の要約については表4参照)。
Literature: Noriaki Yahata, Jun Morimoto, Ryuichiro Hashimoto, Giuseppe Lisi, Kazuhisa Shibata, Yuki Kawakubo, Hitoshi Kuwabara, Miho Kuroda, Takashi Yamada, Fukuda Megumi, Hiroshi Imamizu, Jose' E. Na'n ~ ez Sr, Hidehiko Takahashi, Yasumasa Okamoto, Kiyoto Kasai, Nobumasa Kato, Yuka Sasaki, Takeo Watanabe, & Mitsuo Kawato, “A small number of abnormal brain connections predicts adult autism spectrum disorder”, NATURE COMMUNICATIONS, DOI: 10.1038 / ncomms11254 Matlab R2014a (Matworks, USA T1-weighted structural images and resting state functional images were preprocessed using SPM 8 (Wellcome Trust Center for Neuroimaging, University College London, UK). Functional images were preprocessed with slice timing correction and alignment to the average image. The fMRI data was then normalized and resampled at 2 × 2 × 2 mm 3 voxels, using normalization parameters obtained by segmentation of the structural image tuned by the average functional image. Finally, the functional image was smoothed with an isotropic 6 mm full width half value Gaussian kernel. After these pre-processing steps, based on the relative change between frames of time series data, a scrubbing procedure was performed to exclude any volume with excess head motion (ie functional images). (See Table 4 for a summary of head movements).
各参加者について、Brainvisa Sulci Atlas(BSA; http:// brainvisa)に解剖学的に定義された大脳皮質全体を覆う137の関心領域(ROI)のそれぞれについて、fMRIデータを経時的に抽出した。本実施例において、施設1において、参加者の小脳の構造及び機能画像が含まれていなかったため、ROIには小脳は含まれていない。バンドパスフィルタ(0.008~0.1Hz)をかけた後、以下の9つのパラメータ(再配列からの6つの頭部運動パラメータ、白質の時間的ゆらぎ、脳脊髄液の時間的ゆらぎ、脳全体のゆらぎ)を直線的に回帰した。
For each participant, fMRI data was extracted over time for each of the 137 regions of interest (ROI) covering the entire cerebral cortex as anatomically defined in Brainvisa Sulci Atlas (BSA; http: // brainvisa). In this example, since the structure and functional image of the cerebellum of the participant were not included in the facility 1, the cerebellum was not included in the ROI. After applying a band pass filter (0.008 to 0.1 Hz), the following nine parameters (six head movement parameters from rearrangement, white matter temporal fluctuation, cerebrospinal fluid temporal fluctuation, whole brain fluctuation) Is a linear regression.
各参加者の9,316機能的結合(FC)それぞれの行列を得るため、137のROI間のペアワイズピアソン相関を算出した。
Pairwise Pearson correlations between the 137 ROIs were calculated to obtain 9,316 functional union (FC) respective matrices for each participant.

II.実施例1.メランコリー型MDD分類のための12対の機能的結合の選択
メランコリー型MDDを分類するための12対の機能的結合を選択するため、表1aに示す66名のメランコリー型MDD患者と66名の健常者のrs-fMRIのデータを使用した。メランコリー型MDD群を分類するための機能的結合の選択は、上述したYahataらの文献で報告した自閉症(ASD)を分類する分類器の作成方法に順じて、実施の形態において説明した手順で行った。 II. Example 1 Selection of 12 pairs of functional connections for melancholic MDD classification To select 12 pairs of functional connections for classifying melancholic MDD, 66 patients with melancholic MDD and 66 healthy as shown in Table 1a Data from the rs-fMRI of the elderly were used. The selection of functional connections for classifying melancholic MDDs was explained in the embodiment following the method of creating a classifier for classifying autism (ASD) reported in the above-mentioned Yahata et al. I went by the procedure.
メランコリー型MDDを分類するための12対の機能的結合を選択するため、表1aに示す66名のメランコリー型MDD患者と66名の健常者のrs-fMRIのデータを使用した。メランコリー型MDD群を分類するための機能的結合の選択は、上述したYahataらの文献で報告した自閉症(ASD)を分類する分類器の作成方法に順じて、実施の形態において説明した手順で行った。 II. Example 1 Selection of 12 pairs of functional connections for melancholic MDD classification To select 12 pairs of functional connections for classifying melancholic MDD, 66 patients with melancholic MDD and 66 healthy as shown in Table 1a Data from the rs-fMRI of the elderly were used. The selection of functional connections for classifying melancholic MDDs was explained in the embodiment following the method of creating a classifier for classifying autism (ASD) reported in the above-mentioned Yahata et al. I went by the procedure.
このシステムは、L1正規化されたスパース正準相関分析(L1-SCCA)とスパースロジスティック回帰(SLR)を使用している。SLRは、MDD分類の目的には有用ではないが、客観的に各機能的結合を枝切りしながら、ロジスティック回帰モデルを訓練する能力がある。SLRで訓練する前に、L1-SCCAにより、入力量をある程度減らし、同時に致命的な過適応(過学習)を引き起こす可能性のある攪乱変数(NV:nuisance variable))の影響を減らした。本実施例において、施設、性別、年齢は確率変数に含められているため、これらのうち不要な要素をL1-SCCAにより排除した。この方法では、後述するような内ループと外ループによる入れ子状の(nested)特徴選択とLOOCV(Leave-One-Out Cross Validation)の逐次工程を使用して、情報リークや楽観的すぎる結果を回避した。SLRにより出力されたのは54対の機能的結合であった(図26)。さらに、LOOCVを行い、最終的に12対の機能的結合を選択した(表5及び図26)。
This system uses L1 normalized sparse canonical correlation analysis (L1-SCCA) and sparse logistic regression (SLR). Although SLR is not useful for the purpose of MDD classification, it has the ability to train logistic regression models while objectively pruning each functional connection. Before training in SLR, L1-SCCA reduced the input volume to some extent and at the same time reduced the effects of disturbing variables (NV: nuisance variable) that can cause fatal over-adaptation (over-learning). In the present example, facilities, gender, and age are included in the random variables, so unnecessary elements among them are excluded by L1-SCCA. This method avoids information leaks and overly optimistic results by using nested feature selection and LOOCV (Leave-One-Out Cross Validation) sequential steps with inner and outer loops as described later. did. It was 54 pairs of functional combinations output by SLR (Figure 26). In addition, LOOCV was performed to finally select 12 pairs of functional binding (Table 5 and FIG. 26).
選択された12個の機能的結合FCは、はたして、外ループの手続きの全体にわたって、大きな重みで、頻繁に選択されたかものかどうかについて検討した。これは、最後に選択された12個の機能的結合FCの安定性およびロバスト性に関して重要である。
Twelve selected functional connections FC were examined whether they were frequently selected with great weight throughout the procedure of the outer loop. This is important with regard to the stability and robustness of the last 12 selected functionally linked FCs.
このような検討のために、以下の式
For such a study, the following equation

でk番目のFC(k=1,2,…,9316)のための累積的な絶対的な重みを定義する。
Define the cumulative absolute weights for the k th FC (k = 1, 2,..., 9316).
ここで、NがLOOCV回数(つまり被験者の数)であり、wi
kは、i番目のLOOCVのk番目の機能的結合FCに関連した重みである。
Here, N is the number of LOOCVs (i.e., the number of subjects), and w i k is a weight associated with the k-th functional connection FC of the i-th LOOCV.
累積的な重みci
kがより大きな値であることは、LOOCVの全体にわたって、MDDとHCへの分類に対してk番目の機能的結合FCが、より重要な貢献をすることを意味する。
The larger value of the cumulative weight c i k means that the kth functional combination FC makes a more important contribution to the classification to MDD and HC throughout the LOOCV.

表2で、Lat.の“L”と“R”は、左脳と右脳の区別を示す。BSAは、ブロードマン領野を示し、BAは、ブロードマンの領野の番号を示す。rControlは、健常者対照群に対する相関係数を示す。rMDDは、メランコリー型MDD群に対する相関係数を示す。Weightは、関連重み付け和の重みを示す。
In Table 2, "L" and "R" of Lat. Indicate the distinction between the left brain and the right brain. BSA indicates a Brodmann region, and BA indicates a Brodmann region number. rControl shows the correlation coefficient with respect to the normal control group. rMDD indicates the correlation coefficient for melancholic MDDs. Weight indicates the weight of the associated weighted sum.
図25に選択された12対の機能的結合とその重みを示す。
FIG. 25 shows selected 12 functional combinations and their weights.
特に重みが大きかった2つの機能的結合は、left dorsolateral prefrontal cortex (DLPFC, BA46) - left posterior cingulate cortex (PCC) / Precuneusと、left inferior frontal gyrus (IFG opecular, BA44) - right DLPFC (BA9) / frontal eye field (FEF, BA8) /supplementary motor area (SMA, BA6) であった。これらの機能的結合は、MDDの反復経頭蓋磁気刺激(rTMS)治療において標的とされるLeft DLPFC/IFGと重複していた。
Two functional combinations with particularly high weights are left dorsalfrontal cortex (DLPFC, BA46)-left posterior cingulate cortex (PCC) / Precuneus and left inferior frontal gyrus (IFG ocular, BA 44)-right DLPFC (BA9) / frontal eye field (FEF, BA8) / supplementary motor area (SMA, BA6). These functional connections were overlapping with Left DLPFC / IFG targeted in repetitive transcranial magnetic stimulation (rTMS) treatment of MDD.
このようにして、メランコリー型MDD患者と健常者を分類するための回帰式、すなわち分類器を作成した。さらに、各被験者がメランコリー型MDDか健常であるかを判断するための指標として関連重み付け和(the associated weighted linear sum:WLS)を算出した。
Thus, a regression equation, or a classifier, for classifying melancholic MDD patients and healthy subjects was created. Furthermore, the associated weighted sum (WLS) was calculated as an index for determining whether each subject is melancholic MDD or healthy.
メランコリー型MDD群と健常対照群のWLSの分布を図27aに示す。黒棒がメランコリー型MDD群であり、白棒が健常対照群である。正確性は70 %であった(感度64 %, 特異度77 % AUC 0.77; 並べ替え検定においてp=.049:図30a)。この結果は、選択された12対の機能的結合から構成される分類器(以下、「本発明の第1の分類器」とする)は、メランコリー型MDDを健常者と識別できることを示している。
The distribution of WLS in the melancholic MDD group and the healthy control group is shown in FIG. 27a. Black bars represent melancholic MDD groups and white bars represent healthy controls. The accuracy was 70% (sensitivity 64%, specificity 77% AUC 0.77; p = .049 in the permutation test: FIG. 30a). This result indicates that a classifier composed of selected 12 pairs of functional combinations (hereinafter referred to as "the first classifier according to the present invention") can distinguish melancholic MDD from healthy persons. .
また、千葉において集められたコホート(慶応大学病院にて収集した。11名のメランコリー型MDDと40名の健常者を含む)についても同様に上記方法で取得した分類器を使って検討した。その結果を図27bに示す。千葉から集めたコホートの正確性は65%(感度64 %,特異度65 %, 及びAUC 0.62; 並べ替え検定においてp=0.036(図30b))であった。本発明の分類器は、訓練データからは独立したコホートについてもメランコリー型MDDと健常者を分類可能であった。
In addition, the cohort collected in Chiba (collected at Keio University Hospital, including 11 melancholic MDDs and 40 healthy subjects) was also examined using the classifier obtained by the above method. The results are shown in FIG. 27b. The accuracy of the cohort collected from Chiba was 65% (sensitivity 64%, specificity 65%, and AUC 0.62; p = 0.036 (Fig. 30b) in the permutation test). The classifier of the present invention was able to classify melancholic MDD and healthy subjects even on a cohort independent of training data.
以上の結果から本発明の分類器は、メランコリー型MDDを分類可能であり、かつ汎化されていると考えられた。
From the above results, the classifier of the present invention was considered to be able to classify melancholy type MDD and to be generalized.
III.実施例2.本発明の分類器の非メランコリー型MDD群及び全MDD群への適用
図27cには、全MDD群、メランコリー型MDD群、及び非メランコリー型MDD群の各群を訓練データ(縦方向)として本発明の分類器を作成し、それぞれの群をテストデータ(横方向)として正確性を検討したデータを示す。LOOCVを行った結果、たとえば、メランコリー型MDD群で生成した分類器は、非メランコリー型MDDにおける正確性は、54%(感度42 %、特異度67 %、AUC 0.65)であった。全MDD群については、LOOCVにおける正確性は66 % (感度58 %、特異度74 %、AUC 0.74)であった。 III. Example 2. Application of the Classifier of the Present Invention to Non-Melancholy MDD Group and All MDD Group FIG. 27 c shows training data (longitudinal direction) for each group of all MDD group, melancholic MDD group, and non-melancholy MDD group. Inventive classifiers are created, and each group is used as test data (horizontal direction) to show data whose accuracy has been examined. As a result of performing LOOCV, for example, the classifier generated in the melancholic MDD group had an accuracy of 54% (sensitivity 42%, specificity 67%, AUC 0.65) in non-melancholic MDD. For the whole MDD group, the accuracy in LOOCV was 66% (sensitivity 58%, specificity 74%, AUC 0.74).
図27cには、全MDD群、メランコリー型MDD群、及び非メランコリー型MDD群の各群を訓練データ(縦方向)として本発明の分類器を作成し、それぞれの群をテストデータ(横方向)として正確性を検討したデータを示す。LOOCVを行った結果、たとえば、メランコリー型MDD群で生成した分類器は、非メランコリー型MDDにおける正確性は、54%(感度42 %、特異度67 %、AUC 0.65)であった。全MDD群については、LOOCVにおける正確性は66 % (感度58 %、特異度74 %、AUC 0.74)であった。 III. Example 2. Application of the Classifier of the Present Invention to Non-Melancholy MDD Group and All MDD Group FIG. 27 c shows training data (longitudinal direction) for each group of all MDD group, melancholic MDD group, and non-melancholy MDD group. Inventive classifiers are created, and each group is used as test data (horizontal direction) to show data whose accuracy has been examined. As a result of performing LOOCV, for example, the classifier generated in the melancholic MDD group had an accuracy of 54% (sensitivity 42%, specificity 67%, AUC 0.65) in non-melancholic MDD. For the whole MDD group, the accuracy in LOOCV was 66% (sensitivity 58%, specificity 74%, AUC 0.74).
この結果は、全MDD群を訓練データとする分類器は、メランコリー型MDD群を訓練データとした分類器やメランコリー型MDD群を訓練データとした分類器と比較して分類精度が悪くなることを示している。そして、全MDD群が、より多様なMDDのサブタイプを含んでいると考えられた。
As a result, the classifier that uses the entire MDD group as training data is inferior in classification accuracy to the classifier using the melancholy type MDD group as training data and the classifier using the melancholy type MDD group as training data. It shows. And it was considered that the whole MDD group contained more diverse MDD subtypes.
図28d、e及び図29f、g、hには、メランコリー型MDD群(d)、非メランコリー型MDD群(e)、治療抵抗型MDD群(f)、ASD群(g)、SSD群(h)の各被験者について求められたWLSの平滑化ヒストグラムとAUC値を示す。有意差は、Benjamini-Hochberg修正Kolmogorov-Smirnov検定により算出した。各群のWLSデータは、健常対照群の中央値と標準偏差が一致するように標準化した。なお、この標準化は定量分析には適用されない。メランコリー型MDD群-健常対照群(d)についてはAUC 0.77、p=1.5×10⁻⁵であった。非メランコリー型MDD群-健常対照群(e)では、AUC 0.65、p=.051であった。治療抵抗型MDD群-健常対照群(f)ではAUC 0.46、p=0.54であった。自閉症群-健常者対象群(g) では、AUC 0.51、p=0.74であった。統合失調症群-健常者群(h)ではAUC 0.43、p=0.038であった。
28d, e and 29f, g, h show the melancholic MDD group (d), the non-melancholic MDD group (e), the treatment resistant MDD group (f), the ASD group (g), and the SSD group (h) The smoothed histogram and AUC value of WLS calculated | required about each subject of 2.) are shown. Significant differences were calculated by the Benjamini-Hochberg modified Kolmogorov-Smirnov test. The WLS data for each group was normalized to match the median and standard deviation of the healthy control group. Note that this standardization is not applied to quantitative analysis. For the melancholic MDD group-healthy control group (d), the AUC was 0.77, p = 1.5 × 10 −5 . In the non-melancholic MDD group-healthy control group (e), the AUC was 0.65, p = .051. In the treatment resistant MDD group-healthy control group (f), AUC was 0.46 and p = 0.54. In the autism group-healthy subject control group (g), AUC 0.51, p = 0.74. In the schizophrenia group-healthy subject group (h), it was AUC 0.43, p = 0.038.
IV. 実施例3.WLSスコアを用いたうつ病の重症度の評価と治療効果の評価
WLSスコアがうつ病の重症度と相関するか否かを調べるため、BDスコアとWLSスコアの相関を検証した。図31aに示すように、全MDD群と健常対照群を合わせた群についてBDIスコアとWLSスコアの相関をとったところ、n=186 r = 0.655, 並び替え検定p = 0.001となり、両者は相関していることが示された。また、全MDD群のみをみても(図31b)、n=93でr=0.188、並び替え検定p =0.046となり、比較的相関していた。 IV. Example 3. Evaluation of the severity of depression and treatment using the WLS score In order to investigate whether the WLS score correlates with the severity of depression, the correlation between the BD score and the WLS score was examined. As shown in FIG. 31a, when the BDI score and the WLS score were correlated for the group combining the all MDD group and the healthy control group, n = 186 r = 0.655, and the permutation test p = 0.001, and both were correlated. Was shown. In addition, even if only the whole MDD group was observed (FIG. 31 b), n = 0.93, r = 0.188, and the rearrangement test was p = 0.046, which were relatively correlated.
WLSスコアがうつ病の重症度と相関するか否かを調べるため、BDスコアとWLSスコアの相関を検証した。図31aに示すように、全MDD群と健常対照群を合わせた群についてBDIスコアとWLSスコアの相関をとったところ、n=186 r = 0.655, 並び替え検定p = 0.001となり、両者は相関していることが示された。また、全MDD群のみをみても(図31b)、n=93でr=0.188、並び替え検定p =0.046となり、比較的相関していた。 IV. Example 3. Evaluation of the severity of depression and treatment using the WLS score In order to investigate whether the WLS score correlates with the severity of depression, the correlation between the BD score and the WLS score was examined. As shown in FIG. 31a, when the BDI score and the WLS score were correlated for the group combining the all MDD group and the healthy control group, n = 186 r = 0.655, and the permutation test p = 0.001, and both were correlated. Was shown. In addition, even if only the whole MDD group was observed (FIG. 31 b), n = 0.93, r = 0.188, and the rearrangement test was p = 0.046, which were relatively correlated.
次に、選択的セロトニン再取り込み阻害薬(SSRI)であるエスシタロプラムの効果をWLSスコアで評価できるか検討した。エスシタロプラムを6~8週間投与した、表1aに示す寛解した24名のメランコリー型MDD患者各々のWLSスコアの平滑化ヒストグラムを図31cに示す。抗うつ剤を投与するとWLSスコアの分布は健常対照群よりにシフトした。AUC 0.72、Benjamini-Hochberg修正Kolmogorov-Smirnov検定p=0.008であった。
Next, it was examined whether the effects of escitalopram, a selective serotonin reuptake inhibitor (SSRI), could be evaluated by WLS score. The smoothed histograms of the WLS scores for each of the 24 melancholic MDD patients in remission shown in Table 1a who received escitalopram for 6-8 weeks are shown in FIG. 31c. The antidepressant administration shifted the distribution of the WLS score to that of the healthy control group. AUC 0.72, Benjamini-Hochberg modified Kolmogorov-Smirnov test p = 0.008.
ただし、この結果は、集団についての結果であり、WLSと個人の改善との関係を示すものではない。そこで、ΔWLS(具体的には WLSpost - WLSpre)とΔBDI(具体的には BDIpost - BDIpre)の関係、ΔWLSとΔHAMD (具体的にはHAMDpost - HAMDpre)を検討した。有意差は並び替え検定で求めた。図31dに示すように、ΔBDIとΔWLSは有意に相関していた(r=0.373、p=0.040)が、ΔHAMDとΔWLSは相関していなかった(r=0.154、p=0.237)。BDIとHAMDが乖離することは既に報告されている。
However, this result is a result for a group and does not show the relationship between WLS and personal improvement. Therefore, the relationship between ΔWLS (specifically, WLS post -WLS pre ) and ΔBDI (specifically, BDI post -BDI pre ), ΔWLS and ΔHAMD (specifically, HAMD post -HAMD pre ) were examined. The significant difference was determined by the permutation test. As shown in FIG. 31 d, ΔBDI and ΔWLS were significantly correlated (r = 0.373, p = 0.040), but ΔHAMD and ΔWLS were not correlated (r = 0.154, p = 0.237). A divergence between BDI and HAMD has already been reported.
実施例5:12対の機能的結合それぞれの治療前後での変化
次に12対の機能的結合それぞれに対するSSRI(エスシタロプラム)の影響について検討するため、個々の機能的結合についてΔWLSに対する寄与を検討した。 Example 5: Changes before and after treatment of 12 pairs of functional bindings Next, in order to examine the influence of SSRI (escitalopram) on 12 pairs of functional binding, the contribution to individual ΔWLS was examined for each functional binding. .
次に12対の機能的結合それぞれに対するSSRI(エスシタロプラム)の影響について検討するため、個々の機能的結合についてΔWLSに対する寄与を検討した。 Example 5: Changes before and after treatment of 12 pairs of functional bindings Next, in order to examine the influence of SSRI (escitalopram) on 12 pairs of functional binding, the contribution to individual ΔWLS was examined for each functional binding. .
具体的には、投与前後解析において、式:
Specifically, in the analysis before and after administration, the formula:
(式中、Nは治療を受け患者数を示す。wiは、分類器の重みを示す。)
を用いて各機能的結合の寄与スコアを算出した。 (Wherein, N represents the number of patients receiving treatment. W i represents the weight of the classifier.)
The contribution score of each functional binding was calculated using.
を用いて各機能的結合の寄与スコアを算出した。 (Wherein, N represents the number of patients receiving treatment. W i represents the weight of the classifier.)
The contribution score of each functional binding was calculated using.
さらに、参考点を得るために、同様の寄与スコアをMDDと健常対照群の間でも式:
Furthermore, to obtain a reference point, the same contribution score is also expressed between the MDD and the healthy control group:
(式中、MはMDDの数を示し、Nは健常対照の数を示す。)
によって寄与スコアを算出した。 (Wherein, M represents the number of MDD and N represents the number of healthy controls).
The contribution score was calculated by
によって寄与スコアを算出した。 (Wherein, M represents the number of MDD and N represents the number of healthy controls).
The contribution score was calculated by
すなわち、siは分類器の重みで重み付けされた健常対照群とMDD群の平均結合強度の差を示す。分類器において、MDDは陽性(正のスコア)を示し、健常者は陰性(負のスコア)示すため、siは常に陰性(負のスコア)となる。また、式2において
 は減数 (減算において負の符号)となる。ciとsiが大きな負の値をとることは治療後-治療前健常者-MDDにおいてFCiの寄与が大きいことを示す。言い換えると、ciが負になることは 治療後のFCiが健常者の対応するFCにより近づいたことを示す。これに対して、ciが正になることは治療後のFCiがMDDとなったことを示す。健常対照群とMDD群で人数が異なるため、それぞれのFCiについてのciとsiの有意差は、ウェルチのt-検定で評価した。ウェルチのt-検定は、下式:
That is, s i indicates the difference between the average combined strength of the healthy control group and the MDD group weighted by the weight of the classifier. In the classifier, MD is always positive (positive score) and normal is negative (negative score), so si is always negative (negative score). Also, in
は減数 (減算において負の符号)となる。ciとsiが大きな負の値をとることは治療後-治療前健常者-MDDにおいてFCiの寄与が大きいことを示す。言い換えると、ciが負になることは 治療後のFCiが健常者の対応するFCにより近づいたことを示す。これに対して、ciが正になることは治療後のFCiがMDDとなったことを示す。健常対照群とMDD群で人数が異なるため、それぞれのFCiについてのciとsiの有意差は、ウェルチのt-検定で評価した。ウェルチのt-検定は、下式:
That is, s i indicates the difference between the average combined strength of the healthy control group and the MDD group weighted by the weight of the classifier. In the classifier, MD is always positive (positive score) and normal is negative (negative score), so si is always negative (negative score). Also, in equation 2,
Is the decrement (negative sign in subtraction). The large negative values of c i and s i indicate that the contribution of FC i is large in the post-treatment-pre-treatment healthy person-MDD. In other words, the c i is negative indicating that the FC i after treatment approaches by the corresponding FC healthy individuals. On the other hand, the fact that c i becomes positive indicates that FC i after treatment has become MDD. Because the numbers of healthy control and MDD groups differ, the significant difference between c i and s i for each FC i was evaluated by Welch's t-test. Welch's t-test is:

各検定のp値は、Benjamini-Hochberg法によって複数の比較に批准させた。図32aに示すように、FC1 (i.e. DLPFC-Precuneus/PCC)は、ci及びsiの差が最も大きく顕著であった。これは、抗うつ剤の投与後に FC1が健常対照群とは反対のMDD群の方に推移したことを示す。
The p-values of each test were ratified to multiple comparisons by the Benjamini-Hochberg method. As shown in FIG. 32a, the difference between c i and s i was the largest and noticeable in FC1 (ie DLPFC-Precuunes / PCC). This indicates that FC1 shifted to the opposite MDD group to the healthy control group after antidepressant administration.
メランコリー型MDD分類のための12対の機能的結合(表Cに記載のこの機能的結合識別番号を「FC♯」と標記することがある)の中で8つの機能的結合については、健常対照群の方向へ向かって推移し、いわゆる「正常化」した。しかし、FC# 1、3、9、12の4対の機能的結合については、健常対照群とは逆の方向に向かって推移した(図32a)。この中で、FC# 1(Left DLPFC - Left Precuneus / PCC FC)は、12対の中で最も寄与度が高い機能的結合である。メランコリー型MDD群と健常対照群の分類においてFC#1の治療前後の変化の有意差は、ペアワイズ比較でp=0.009であった(図32a)。
Of the 12 pairs of functional connections for melancholic MDD classification (this functional connection identification number in Table C may be labeled "FC #"), for the 8 functional connections, healthy control It moves in the direction of the group and so-called "normalization". However, four pairs of functional binding of FC # 1, 3, 9, 12 shifted in the opposite direction to the healthy control group (FIG. 32a). Among them, FC # 1 (Left DLPFC-Left Precuneus / PCC FC) is the functional combination with the highest degree of contribution among the 12 pairs. The significant difference in change before and after treatment with FC # 1 in the classification of the melancholic MDD group and the healthy control group was p = 0.009 in a pairwise comparison (FIG. 32a).
最も寄与度が高い、2つの主要な機能的結合(FC#1, FC#2)に着目した結果、治療後に有意な差が観察されたのに対して(対応のあるt検定, p = .002)、治療前での差異は観察されなかった(p= 0.96)。二要因分散分析による検定では、FC#1・FC#2の機能的結合と、治療前後の時間の交互作用が有意であり(FC #number x time, F(1,23)=6.70, p =0.016)、各主効果に関しては有意な差は見られなかった。しかし、治療後のFC# 1とFC#2との間でのペアワイズt-検定では、推移に有意差が認められた(p=0.002)。ここで、図32、33の全ての図において、正方向への推移はメランコリー型MDDの方向へ向かっていることを示し、負方向への推移は健常者方向へ向かっていることを示す。これは、メランコリー型MDD分類器の重みの符号に、FCまたはFCの差を乗じているためである。上述のように、エスシタロプラム治療後にFC# 1で正方向へ推移したため、完全に独立したコホートでも同じ結果となるか検証した。千葉において収集された11名のメランコリー型MDDの患者(セロトニン-ノルエピネフリン再取り込み阻害剤(SNRI)デュロキセチンを6~8週間投与)について検討した(図32c)。治療前には有意差がなかった(n.s.、p = 0.77)のに対して、治療後の対t-検定では、FC# 1とFC#2のトレンドレベルの差が認められた(p=0.10)。次に、健常対象者(19名)にSSRIを投与した際のFC# 1とFC#2の変化を観察した。パロキセチン投与の単回投与後にFC#1とFC#2との間に有意差が認められた(p=0.033 )。治療前には差はなく(p = 0.18)、有意な関連は認められなかった(図32d)。
As a result of focusing on the two major functional connections (FC # 1, FC # 2) with the highest degree of contribution, a significant difference was observed after treatment (a paired t-test, p =. 002), no difference before treatment was observed (p = 0.96). In the two-way analysis of variance, the functional connection between FC # 1 and FC # 2 and the interaction between the time before and after treatment are significant (FC #number x time, F (1,23) = 6.70, p = 0.016) There was no significant difference for each main effect. However, in the pairwise t-test between FC # 1 and FC # 2 after treatment, a significant difference was found in the transition (p = 0.002). Here, in all the drawings of FIGS. 32 and 33, the transition in the positive direction indicates that the direction is toward the melancholy MDD, and the transition in the negative direction indicates that the direction is toward the healthy person. This is because the sign of the weight of the Melancholy MDD classifier is multiplied by the difference of FC or FC. As noted above, we were positively directed at FC # 1 after escitalopram treatment, so we examined whether the results would be the same in a completely independent cohort. Eleven melancholic MDD patients collected in Chiba (serotonin-norepinephrine reuptake inhibitor (SNRI) administered duloxetine for 6-8 weeks) were studied (FIG. 32 c). There was no significant difference before treatment (ns, p = 0.77), while the paired t-test after treatment showed a difference in trend levels of FC # 1 and FC # 2 (p = 0.10 ). Next, changes in FC # 1 and FC # 2 when SSRI was administered to healthy subjects (19) were observed. There was a significant difference between FC # 1 and FC # 2 after a single dose of paroxetine administration (p = 0.033). There was no difference before treatment (p = 0.18) and no significant association was found (Figure 32d).
さらに、広島コホート内の、臨床医によって治療効果を判定された患者について、非寛解患者(n=7)と寛解患者(n=7)に分け、抗うつ治療の効果を調べた。その結果、この結果、寛解・非寛解の群間 x FC#1・FC#2の機能的結合間 x 治療前後の時間に有意な交互作用が見られ (Fig. 33e, F(1,22) = 8.86, p=.007)、FC#1とFC#2における治療反応のパターンに差があることが示された。具体的には、FC#2の値は、寛解群においてのみ、抗うつ剤の治療後に減少し(p=0.001)、これらの値には有意差が認められた(p=.019)。さらに、非寛解群では、治療前には差がないにも関わらず、抗うつ剤治療後にFC#1とFC#2に有意差が認められた(p=0.033)。
Furthermore, in the Hiroshima cohort, patients whose therapeutic effects were determined by clinicians were divided into non-remitting patients (n = 7) and remission patients (n = 7), and the effects of antidepressant treatment were examined. As a result, as a result, significant interaction was observed between the time before and after treatment between functional groups of FC # 1 and FC # 2 between remission / non-remission groups (Fig. 33e, F (1, 22)) = 8.86, p = .007), it was shown that there is a difference in the pattern of treatment response in FC # 1 and FC # 2. Specifically, the value of FC # 2 decreased after antidepressant treatment only in the remission group (p = 0.001), and these values were significantly different (p = .019). Furthermore, in the non-remitting group, there was a significant difference between FC # 1 and FC # 2 after antidepressant treatment, although there was no difference before treatment (p = 0.033).
寛解群と非寛解群でFC#1とFC#2がどのように変化するかを検討するため、24名の患者についてFC#1の変化とFC#2の変化を2次元プロットに表した(図33f)。
In order to examine how FC # 1 and FC # 2 change in the remission group and the non-remission group, changes in FC # 1 and changes in FC # 2 were expressed in a two-dimensional plot for 24 patients ( Figure 33f).
FC#1及びFC#2は、下式によりもとめた。
FC # 1 and FC # 2 were obtained by the following formula.

FC1postは、FC1の投与後を示し、FC1preは、FC1の投与前を示し、 FC2postは、FC2の投与後を示し、FC2preは、FC2の投与前を示し、signは各機能的結合の重みの符号を示す。この式の精度は、Accuracy:0.75, AUC:0.79, Specificity:0.88, Sensitivity:0.43であった。
FC1 post indicates after FC1 administration, FC1 pre indicates before FC1 administration, FC2 post indicates after FC2 administration, FC2 pre indicates before FC2 administration, and sign indicates each functional binding Indicates the sign of the weight of. The accuracy of this equation was: Accuracy: 0.75, AUC: 0.79, Specificity: 0.88, Sensitivity: 0.43.
その結果、FC#1の変化とFC#2の変化は、寛解に寄与しているように見える。一方で、FC#1の変化とFC#2の変化との間には、有意差や相関は認められなかった(p=0.57)。
As a result, FC # 1 changes and FC # 2 changes appear to contribute to remission. On the other hand, no significant difference or correlation was found between the change in FC # 1 and the change in FC # 2 (p = 0.57).
V. 実施例4.ニューロフィードバックV-1.FCニューロフィードバック訓練に使用する標的機能的結合の選択
以下の工程に従って、ニューロフィードバックの標的として、前記表5に示す第1の機能的結合を選択した。 V. Example 4 Neurofeedback V-1. FC Selection of Target Functional Binding Used for Neurofeedback Training The first functional binding shown in Table 5 above was selected as a target of neuro feedback according to the following steps.
以下の工程に従って、ニューロフィードバックの標的として、前記表5に示す第1の機能的結合を選択した。 V. Example 4 Neurofeedback V-1. FC Selection of Target Functional Binding Used for Neurofeedback Training The first functional binding shown in Table 5 above was selected as a target of neuro feedback according to the following steps.
はじめに、rs-fcMRIのバイオマーカーとして、本発明の分類器とBDIスコアに基づくうつ症状の重症度を予測するためのバイオマーカー(Yamashita A, Hayasaka S, Lisi G, Ichikawa N, Takamura M, Okada G, Morimoto J, Yahata N, Okamoto Y, Kawato M, Imamizu H(2015) Common functional connectivity between depression and depressed mood. The 37th annual meeting of theJapanese society of biological psychiatry; 24-26 September; Tokyo, Japan.)を構築した。
First, as a biomarker for rs-fcMRI, a biomarker for predicting the severity of depressive symptoms based on the classifier of the present invention and BDI score (Yamashita A, Hayasaka S, Lisi G, Ichikawa N, Takamura M, Okada G Common functional connectivity between depression and depressed mood. The 37th annual meeting of the Japanese society of biological psychiatry; 24-26 September; Tokyo, Japan.), And Morimoto J, Yahata N, Okamoto Y, Kawato M, Imamizu H (2015) Common functional connectivity. did.
標的機能的結合には、上記のバイオマーカーを含むものとした。
Target functional binding included the biomarkers described above.
ニューロフィードバック訓練の間、参加者は、標的FCの相関を減少させることを目的とした。
During neurofeedback training, participants aimed to reduce the correlation of target FC.
訓練には、MDDを患う3名と、亜臨床的うつ病の7名の計10名が参加した。ニューロフィードバック訓練に先立って、行われた2回の異なる時点における亜臨床的うつ病の参加者のBDI-IIの平均値は>10であった。
The training included a total of 10 people, three with MDD and seven with subclinical depression. Prior to neurofeedback training, participants with subclinical depression at two different time points conducted had a mean BDI-II value of> 10.
ニューロフィードバック訓練は、参加者にfMRI装置に仰向けになってもらい、プリズム眼鏡を介して装置内のモニターを見せ、図35に示す機能的結合の結合指標が負の方向に動くようにイメージさせることにより行った。
The neuro feedback training is to have the participant face up on the fMRI device, show the monitor in the device through the prism glasses, and image the connection index of the functional connection shown in FIG. 35 to move in the negative direction. Went by.
ニューロフィードバックスコアは、公知の方法に従って算出した。
Neurofeedback scores were calculated according to known methods.
図37aにMDD参加者3名の各訓練日のニューロフィードバックスコアの集計を示す。スコアは、訓練の4日間にわたって増加傾向を示した。結果の有意性を、2つの説明変数(訓練日それぞれと、訓練項目)と1つの応答変数(ニューロフィードバックスコア)を含む重回帰モデルを用いて確認したところ、訓練日において有意に良い効果を示した(95% 信頼区間(CI)計数 1.9-9.1)。事後比較として行ったt-検定では、MDD参加者3名全てにおいて、訓練の初日と比較して、最終日で有意に高いニューロフィードバックスコアが得られた。(t = 4.01, P < .001). これらの結果は、MDDの参加者全てが、訓練を通して標的FCの負の相関を誘導することを学んだこと示している。さらに、図37bに示す用に、MDD参加者3名全てにおいて、訓練後に、うつ症状の重症度を示すHamilton Rating Scale for Depression(HAMD)が減少した。
FIG. 37a shows a summary of neurofeedback scores for each training day of three MDD participants. The score tended to increase over the 4 days of training. When the significance of the results was confirmed using a multiple regression model including two explanatory variables (each training day and one training item) and one response variable (neuro feedback score), it showed a significantly better effect on the training day (95% confidence interval (CI) count 1.9-9.1). A post hoc t-test showed that all three MDD participants had significantly higher neurofeedback scores on the last day compared to the first day of training. (t = 4.01, P <.001). These results indicate that all MDD participants have learned to induce a negative correlation of the target FC through training. Furthermore, for all three MDD participants, the Hamilton Rating Scale for Depression (HAMD), which indicates the severity of depressive symptoms, decreased in all three MDD participants, as shown in FIG. 37b.
MDD参加者と同様に、亜臨床的うつ病の参加者7名においても、訓練期間中、ニューロフィードバックスコアが増加する傾向にあった(図37c)。この結果について有意性を解析したところ、一元配置分散分析(One-way ANOVA)で訓練日の主効果が有意であった(p = 0.0046)。事後比較ペアt検定では、訓練の最終日にニューロフィードバックスコアが訓練の初日より有意に高かった。訓練後のBDIスコアも減少傾向を示した(p = .07)。また、図37dに示すように、亜臨床的うつ病の参加者7名中5名については、正常方向に標的rs-fcMRIを変化させ、訓練前後間でのrs-fcMRI変化量は、BDIスコアと有意に相関した(r = 0.87, p = 0.011)。
Similar to the MDD participants, the 7 participants with subclinical depression also tended to increase the neurofeedback score during the training period (Figure 37c). When the significance was analyzed about this result, the main effect of the training day was significant by one-way analysis of variance (one-way ANOVA) (p = 0.0046). In the post hoc comparison pair t-test, the neurofeedback score was significantly higher than the first day of training on the last day of training. The post-training BDI score also showed a decreasing trend (p = .07). In addition, as shown in FIG. 37 d, for 5 out of 7 participants with subclinical depression, target rs-fcMRI is changed in the normal direction, and the rs-fcMRI change before and after training has a BDI score. Significantly correlated with (r = 0.87, p = 0.011).
上述のように、半数以上の参加者が、訓練を通じてBDIスコアと相関する表5に示す機能的結合を減少させたことから、表5に示す機能的結合は、うつ症状を改善するためのニューロフィードバック訓練の標的機能的結合として使用できることが示された。さら、本発明の表5に示す機能的結合は、うつ症状を改善するためのニューロフィードバック訓練法を開発するための治療方法バイオマーカーとして使用できることが示された。
As mentioned above, as more than half of the participants reduced the functional connections shown in Table 5 to correlate with the BDI score through training, the functional connections shown in Table 5 were used to improve the neuropathy to improve depressive symptoms. It has been shown that it can be used as a target functional connection for feedback training. Furthermore, it was shown that the functional binding shown in Table 5 of the present invention can be used as a therapeutic method biomarker for developing a neurofeedback training method for ameliorating depressive symptoms.
V-2.他の抗うつ治療との比較
ニューロフィードバック訓練法によるMDDの治療効果を、他の治療方法(抗うつ薬投与、反復経頭蓋磁気刺激療法:rTMS、修正型電気けいれん療法:ECT intervention)と比較した。ニューロフィードバック訓練法は、他のうつ治療よりも治療効果が改善していた。 V-2. Comparison with other antidepressant treatment The treatment effect of MDD by neurofeedback training method, other treatment method (antidepressant administration, repeated transcranial magnetic stimulation therapy: rTMS, modified electroconvulsive therapy: ECT intervention Compared with). The neurofeedback training method has improved the treatment effect than other depression treatment.
ニューロフィードバック訓練法によるMDDの治療効果を、他の治療方法(抗うつ薬投与、反復経頭蓋磁気刺激療法:rTMS、修正型電気けいれん療法:ECT intervention)と比較した。ニューロフィードバック訓練法は、他のうつ治療よりも治療効果が改善していた。 V-2. Comparison with other antidepressant treatment The treatment effect of MDD by neurofeedback training method, other treatment method (antidepressant administration, repeated transcranial magnetic stimulation therapy: rTMS, modified electroconvulsive therapy: ECT intervention Compared with). The neurofeedback training method has improved the treatment effect than other depression treatment.
2 被験者、6 ディスプレイ、10 MRI装置、11 磁場印加機構、12 静磁場発生コイル、14 傾斜磁場発生コイル、16 RF照射部、18 寝台、20 受信コイル、21 駆動部、22 静磁場電源、24 傾斜磁場電源、26 信号送信部、28 信号受信部、30寝台駆動部、32 データ処理部、36 記憶部、38 表示部、40 入力部、42 制御部、44 インタフェース部、46 データ収集部、48 画像処理部、50 ネットワークインタフェース。
2 test subject, 6 display, 10 MRI apparatus, 11 magnetic field application mechanism, 12 static magnetic field generating coil, 14 gradient magnetic field generating coil, 16 RF irradiation unit, 18 bed, 20 receiving coil, 21 drive unit, 22 static magnetic field power supply, 24 tilt Magnetic field power supply, 26 signal transmitting unit, 28 signal receiving unit, 30 bed driving unit, 32 data processing unit, 36 storage unit, 38 display unit, 40 input unit, 42 control unit, 44 interface unit, 46 data collecting unit, 48 images Processing unit, 50 network interface.
Claims (50)
- 判別装置であって、
記憶装置を備え、前記記憶装置は、
プログラムと、
安静時において、健常者とうつ病患者を含む複数の参加者の各々の脳内の複数の所定領域における脳活動を示す信号を脳活動検知装置により時系列で予め測定した信号から分類器生成処理により生成された分類器を特定する情報とを格納し、
前記分類器は、前記複数の所定領域間の機能的結合のうちから機械学習により、うつ症状の疾患ラベルに関連するとして特徴選択により選択された複数の機能的結合の重み付け和に基づいて、前記うつ症状の疾患ラベルを判別するように生成され、
演算装置と、
前記演算装置と前記記憶装置との間に設けられるインタフェースとをさらに備え、前記演算装置は、前記プログラムを実行している間に、
前記インタフェースを介して前記記憶装置から取得した前記分類器により、被検者のうつ症状に対する分類結果を生成する、前記被検者におけるうつ症状の有無の判定処理を実行する、ように構成され、
ここで、前記選択された複数の機能的結合は、
左背外側前頭前皮質と、左楔前部および左後部帯状皮質との間の第1の機能的結合、および
左下前頭回弁蓋部と、右背内側前頭前皮質および右補足運動野との間の第2の機能的結合から選択される少なくとも1つを含む、判別装置。 A discriminator,
A storage device, the storage device being
With programs
At rest, a signal indicating brain activity in a plurality of predetermined regions in the brain of each of a plurality of participants including a healthy person and a depressed patient is subjected to classifier generation processing from a signal previously measured in time series by a brain activity detection device Store information identifying the classifier generated by the
The classifier is based on a weighted sum of a plurality of functional combinations selected by feature selection as related to a disease label of depressive symptoms by machine learning out of functional connections among the plurality of predetermined areas. Generated to determine the disease label for depressive symptoms,
A computing device,
The computer system further includes an interface provided between the arithmetic device and the storage device, the arithmetic device executing the program.
The classifier obtained from the storage device via the interface is configured to execute a process of determining the presence or absence of a depressive symptom in the subject, generating a classification result for the depressive symptom of the subject.
Here, the plurality of selected functional connections are
The first functional connection between the left dorsolateral prefrontal cortex and the anterior left and posterior cingulate cortex, and the lower left forehead leaflet and the right dorsal medial prefrontal cortex and the right supplementary motor area A discriminator comprising at least one selected from a second functional connection between - 前記分類器生成処理において、前記機能的結合の重み付け和は、前記うつ症状の疾患ラベルに特異的に関連するとしてスパース正準相関分析により抽出された機能的結合から、スパースロジスティック回帰による特徴選択により算出される、請求項1に記載の判別装置。 In the classifier generation process, the weighted sum of the functional binding is derived from the functional binding extracted by the sparse canonical correlation analysis as being specifically related to the disease label of the depressive symptom, by the feature selection by the sparse logistic regression The determination apparatus according to claim 1, which is calculated.
- 前記選択された複数の機能的結合は、第1の機能的結合と第2の機能的結合の両方を含み、
前記分類器は、各機能的結合の相関行列の要素の重み付け和に基づいて、前記うつ症状の疾患ラベルを判別するように生成される、請求項1または2に記載の判別装置。 The plurality of selected functional connections include both a first functional connection and a second functional connection,
The apparatus according to claim 1, wherein the classifier is generated to determine a disease label of the depressive condition based on a weighted sum of elements of a correlation matrix of each functional combination. - 前記第1および第2の機能的結合が、下記表1に示す機能的結合識別番号1および2にそれぞれ対応するとき、
前記選択された複数の機能的結合は、下記表1に示す機能的結合識別番号3~12から選択される少なくとも一つの機能的結合をさらに含む、請求項3に記載の判別装置:

The discriminator according to claim 3, wherein the plurality of selected functional connections further include at least one functional connection selected from functional connection identification numbers 3 to 12 shown in Table 1 below:
- 前記うつ症状は、メランコリー型うつ病に伴う症状である、請求項1~4のいずれか一項に記載の判別装置。 The discrimination device according to any one of claims 1 to 4, wherein the depressive symptoms are symptoms associated with melancholic depression.
- 判別装置であって、
記憶装置を備え、前記記憶装置は、
プログラムと、
安静時において、健常者とうつ病患者を含む複数の参加者の各々の脳内の複数の所定領域における脳活動を示す信号を脳活動検知装置により時系列で予め測定した信号から分類器生成処理により生成された分類器を特定する情報を格納し、
前記分類器は、前記複数の所定領域間の機能的結合のうちから機械学習により、うつ症状の疾患ラベルに関連するとして特徴選択により選択された複数の機能的結合の重み付け和に基づいて、前記うつ症状の疾患ラベルを判別するように生成され、
演算装置と、
前記演算装置と前記記憶装置との間に設けられるインタフェースとをさらに備え、前記演算装置は、前記プログラムを実行している間に、
前記インタフェースを介して前記記憶装置から取得した前記分類器により、安静時の被検者において計測された機能的結合の相関行列の要素について、うつ症状を評価するための指標値を生成し、
前記指標値をあらかじめ前記機能的結合ごとにうつ症状のレベルに応じて設定された指標値の基準範囲と比較し、
前記被検者が、前記指標値が含まれる基準範囲に対応するうつ症状のレベルであると決定する、うつ症状のレベルの判定処理を実行する、ように構成され、
ここで、前記選択された複数の機能的結合は、
左背外側前頭前皮質と、左楔前部および左後部帯状皮質との間の第1の機能的結合、および
左下前頭回弁蓋部と、右背内側前頭前皮質および右補足運動野との間の第2の機能的結合から選択される少なくとも1つを含む、判別装置。 A discriminator,
A storage device, the storage device being
With programs
At rest, a signal indicating brain activity in a plurality of predetermined regions in the brain of each of a plurality of participants including a healthy person and a depressed patient is subjected to classifier generation processing from a signal previously measured in time series by a brain activity detection device Store information identifying the classifier generated by
The classifier is based on a weighted sum of a plurality of functional combinations selected by feature selection as related to a disease label of depressive symptoms by machine learning out of functional connections among the plurality of predetermined areas. Generated to determine the disease label for depressive symptoms,
A computing device,
The computer system further includes an interface provided between the arithmetic device and the storage device, the arithmetic device executing the program.
The classifier obtained from the storage device through the interface generates index values for evaluating depressive symptoms for elements of the functional connection correlation matrix measured in the subject at rest;
Comparing the index value with a reference range of index values set in advance according to the level of depression symptoms for each functional combination,
The subject is configured to execute a determination process of the level of depressive symptoms, which is determined to be the level of depressive symptoms corresponding to the reference range in which the index value is included,
Here, the plurality of selected functional connections are
The first functional connection between the left dorsolateral prefrontal cortex and the anterior left and posterior cingulate cortex, and the lower left forehead leaflet and the right dorsal medial prefrontal cortex and the right supplementary motor area A discriminator comprising at least one selected from a second functional connection between - 判別装置であって、
記憶装置を備え、前記記憶装置は、
プログラムと、
安静時において、健常者とうつ病患者を含む複数の参加者の各々の脳内の複数の所定領域における脳活動を示す信号を脳活動検知装置により時系列で予め測定した信号から分類器生成処理により生成された分類器を特定する情報を格納し、
前記分類器は、前記複数の所定領域間の機能的結合のうちから機械学習により、うつ症状の疾患ラベルに関連するとして特徴選択により選択された複数の機能的結合の重み付け和に基づいて、前記うつ症状の疾患ラベルを判別するように生成され、
演算装置と、
前記演算装置と前記記憶装置との間に設けられるインタフェースとをさらに備え、前記演算装置は、前記プログラムを実行している間に、
前記インタフェースを介して前記記憶装置から取得した前記分類器により、第1の時点の被検者において安静時に計測された、機能的結合の相関行列の要素について、うつ症状を評価するための第1の値を生成し、
前記分類器により、治療開始後であって第1の時点より後の第2の時点の前記被検者と同一の被検者の安静時の脳内における、前記機能的結合と同一の機能的結合の相関行列の要素についてうつ症状を評価する第2の値を生成し、
前記第1の値と前記第2の値とを比較し、下記i)及び/又は、ii)の基準に基づいて、被検者における治療効果の判定処理を実行する、ように構成され:
i)前記第2の値が前記第1の値よりも改善している場合に、前記治療が被検者のうつ症状の改善に有効であると決定する、
ii)前記第2の値が前記第1の値よりも改善していない場合に、前記治療が被検者のうつ症状の改善に有効でないと決定する;
ここで、前記選択された複数の機能的結合は、
左背外側前頭前皮質と、左楔前部および左後部帯状皮質との間の第1の機能的結合、および
左下前頭回弁蓋部と、右背内側前頭前皮質および右補足運動野との間の第2の機能的結合から選択される少なくとも1つを含む、判定装置。 A discriminator,
A storage device, the storage device being
With programs
At rest, a signal indicating brain activity in a plurality of predetermined regions in the brain of each of a plurality of participants including a healthy person and a depressed patient is subjected to classifier generation processing from a signal previously measured in time series by a brain activity detection device Store information identifying the classifier generated by
The classifier is based on a weighted sum of a plurality of functional combinations selected by feature selection as related to a disease label of depressive symptoms by machine learning out of functional connections among the plurality of predetermined areas. Generated to determine the disease label for depressive symptoms,
A computing device,
The computer system further includes an interface provided between the arithmetic device and the storage device, the arithmetic device executing the program.
A first method for evaluating depressive symptoms of an element of a functional connection correlation matrix measured at rest in a subject at a first point of time by the classifier obtained from the storage device through the interface. Generate the value of
According to the classifier, the same functional coupling as in the resting brain of the same subject as the subject at a second time point after the start of treatment and after the first time point Generate a second value to evaluate depression symptoms for elements of the joint correlation matrix,
The method is configured to compare the first value and the second value, and execute a process of determining a therapeutic effect on the subject based on the criteria of i) and / or ii) below:
i) determining that the treatment is effective for ameliorating the subject's depressive symptoms if the second value is improved over the first value;
ii) determining that the treatment is not effective for ameliorating the subject's depressive symptoms if the second value does not improve relative to the first value;
Here, the plurality of selected functional connections are
The first functional connection between the left dorsolateral prefrontal cortex and the anterior left and posterior cingulate cortex, and the lower left forehead leaflet and the right dorsal medial prefrontal cortex and the right supplementary motor area A determining device comprising at least one selected from a second functional combination between - 判別装置であって、
プログラムを格納する記憶装置と、
演算装置とを備え、前記演算装置は、前記プログラムを実行している間に、
うつ症状が予め設定された複数のサブクラスに層別化されている場合において、
安静時の被検者において計測された機能的結合の相関行列の要素について、うつ症状を評価するための指標値を生成し、
前記指標値を、あらかじめ前記機能的結合ごとに前記サブクラスに応じて設定された指標値の基準範囲と比較し、
前記被検者が、前記指標値が含まれる基準範囲に対応する前記サブクラスであると決定する、うつ病患者の層別化処理を実行する、ように構成され、
ここで、前記選択された複数の機能的結合は、
左背外側前頭前皮質と、左楔前部および左後部帯状皮質との間の第1の機能的結合、および
左下前頭回弁蓋部と、右背内側前頭前皮質および右補足運動野との間の第2の機能的結合から選択される少なくとも1つを含む、判別装置。 A discriminator,
A storage device for storing a program,
An arithmetic unit, the arithmetic unit executing the program,
In cases where depressive symptoms are stratified into a plurality of preset subclasses,
Generate index values for evaluating depressive symptoms for the elements of the functional connection correlation matrix measured in the subject at rest;
Comparing the index value with a reference range of index values set in advance according to the subclass for each functional connection;
Performing a stratification process on a depressed patient, wherein the subject determines that the subject corresponds to the subclass corresponding to a reference range in which the index value is included;
Here, the plurality of selected functional connections are
The first functional connection between the left dorsolateral prefrontal cortex and the anterior left and posterior cingulate cortex, and the lower left forehead leaflet and the right dorsal medial prefrontal cortex and the right supplementary motor area A discriminator comprising at least one selected from a second functional connection between - 請求項1~8のいずれか一項に記載の判別装置の機能をコンピュータに実行させるためのプログラム。 A program for causing a computer to execute the function of the determination apparatus according to any one of claims 1 to 8.
- 安静時の被検者において計測された機能的結合の相関行列の要素について、うつ症状を評価するための指標値を生成する工程を備え、前記機能的結合は、左背外側前頭前皮質と、左楔前部および左後部帯状皮質との間の第1の機能的結合、および左下前頭回弁蓋部と、右背内側前頭前皮質および右補足運動野との間の第2の機能的結合から選択される少なくとも一つを含み、
前記指標値が基準値を超えた場合に、前記被検者がうつ症状を有すると決定する工程を備える、うつ症状を有する被検者を判定することを補助する判別方法。 Generating an index value for evaluating depressive symptoms for an element of the correlation matrix of functional connectivity measured in the subject at rest, the functional connectivity comprising: left dorsal lateral prefrontal cortex; The first functional connection between the anterior left and the left posterior cingulate cortex, and the second functional connection between the lower left frontal forearm and the right back medial prefrontal cortex and the right supplementary motor area Including at least one selected from
A determination method for assisting in determining a subject having depressive symptoms, comprising the step of determining that the subject has depressive symptoms when the index value exceeds a reference value. - 前記指標値は、安静時において、健常者とうつ病患者を含む複数の参加者の各々の脳内の複数の所定領域における脳活動を示す信号を脳活動検知装置により時系列で予め測定した信号から分類器生成処理により算出された重み付け和に基づいて生成され、前記分類器生成処理においては、前記所定領域間の機能的結合の重み付け和は、機械学習によりうつ症状の疾患ラベルに関連する特徴を選択する際に算出される、請求項10に記載の判別方法。 The index value is a signal obtained by measuring in advance a signal indicating brain activity in a plurality of predetermined regions in the brain of each of a plurality of participants including a healthy person and a depressed patient at rest at a time series by a brain activity detection device Generated based on the weighted sum calculated by the classifier generation process, and in the classifier generation process, the weighted sum of the functional connection between the predetermined areas is a feature related to the disease label of the depressive condition by machine learning The determination method according to claim 10, which is calculated when selecting.
- 前記分類器生成処理においては、前記機能的結合の重み付け和は、前記うつ症状の疾患ラベルに特異的に関連するとしてスパース正準相関分析により抽出された機能的結合から、スパースロジスティック回帰による特徴選択により算出される、請求項11に記載の判別方法。 In the classifier generation process, the weighted sum of the functional binding is feature selection by sparse logistic regression from functional binding extracted by sparse canonical correlation analysis as being specifically related to the disease label of the depressive condition. The determination method according to claim 11, which is calculated by:
- 前記機能的結合は、第1の機能的結合と第2の機能的結合の両方を含み、
前記指標値は、各機能的結合の相関係数の重み付け和である、請求項10~12のいずれか一項に記載の判別方法。 The functional linkage includes both a first functional linkage and a second functional linkage,
The determination method according to any one of claims 10 to 12, wherein the index value is a weighted sum of correlation coefficients of each functional combination. - 前記第1及び第2の機能的結合が、下記表2に示す機能的結合識別番号1および2にそれぞれ対応するとき、前記機能的結合は、下記表2に示す機能的結合識別番号3~12から選択される少なくとも一つの機能的結合をさらに含む、請求項13に記載の判別方法:

- 前記うつ症状は、メランコリー型うつ病に伴う症状である、請求項10~14のいずれか一項に記載の判別方法。 The method according to any one of claims 10 to 14, wherein the depressive symptoms are symptoms associated with melancholic depression.
- 前記指標値は、
安静時において、健常者とうつ病患者を含む複数の参加者の各々の脳内の複数の所定領域における脳活動を示す信号を脳活動検知装置により時系列で予め測定した信号から分類器生成処理により生成された分類器であって、前記複数の所定領域間の機能的結合のうちから機械学習により、うつ症状の疾患ラベルに関連するとして特徴選択により選択された複数の機能的結合の重み付け和に基づいて、前記うつ症状の疾患ラベルを判別するように生成された分類器により生成される、請求項10~15のいずれか一項に記載の判別方法。 The index value is
At rest, a signal indicating brain activity in a plurality of predetermined regions in the brain of each of a plurality of participants including a healthy person and a depressed patient is subjected to classifier generation processing from a signal previously measured in time series by a brain activity detection device A classifier generated by the method, wherein a weighted sum of a plurality of functional combinations selected by feature selection as related to a disease label of depressive symptoms by machine learning out of functional connections among the plurality of predetermined regions The determination method according to any one of claims 10 to 15, wherein the determination method is generated by a classifier generated to determine the disease label of the depressive condition based on. - 安静時の被検者において計測された機能的結合の相関行列の要素について、うつ症状を評価するための指標値を生成する工程を備え、機能的結合は、左背外側前頭前皮質と、左楔前部および左後部帯状皮質との間の第1の機能的結合、および左下前頭回弁蓋部と、右背内側前頭前皮質および右補足運動野との間の第2の機能的結合から選択される少なくとも一つを含み、
前記指標値を、あらかじめ前記機能的結合ごとにうつ症状のレベルに応じて設定された指標値の基準範囲と比較する工程と、
前記被検者が、前記指標値が含まれる基準範囲に対応するうつ症状のレベルであると決定する工程と、を備える、被検者においてうつ症状のレベルを判定することを補助するため判別方法。 Generating an index value for evaluating depressive symptoms for an element of the correlation matrix of functional connectivity measured in the subject at rest, the functional connectivity comprising: left dorsolateral prefrontal cortex and left From a first functional connection between the anterior and posterior posterior cingulate cortex, and a second functional connection between the lower left frontal gyrus and the right back medial prefrontal cortex and the right supplementary motor area Including at least one selected,
Comparing the index value with a reference range of index values set in advance according to the level of depression symptoms for each functional connection;
Determining the subject to determine the level of depressive symptoms in the subject, determining the level of depressive symptoms corresponding to the reference range in which the index value is included. . - 第1の時点の被検者において安静時に計測された、機能的結合の相関行列の要素について、うつ症状を評価するための第1の値を生成する工程を備え、前記機能的結合は、左背外側前頭前皮質と、左楔前部および左後部帯状皮質との間の第1の機能的結合、および左下前頭回弁蓋部と、右背内側前頭前皮質および右補足運動野との間の第2の機能的結合から選択される少なくとも一つを含み、
治療開始後であって第1の時点より後の第2の時点の前記被検者と同一の被検者の安静時の脳内における、前記機能的結合と同一の機能的結合の相関行列の要素についてうつ症状を評価する第2の値を生成する工程と、
前記第1の値と前記第2の値とを比較する工程と、
前記第2の値が前記第1の値よりも改善している場合に、前記治療が被検者のうつ症状の改善に有効であると決定する工程と、
を含む、被検者における治療効果の判定を補助するための判別方法。 Generating a first value for evaluating depressive symptoms with respect to an element of the functional connection correlation matrix measured at rest in the first time point subject, the functional connection being The first functional connection between the dorsolateral prefrontal cortex and the anterior left and posterior cingulate cortex, and the lower left frontal fornix and the right dorsal medial prefrontal cortex and the right supplementary motor area At least one selected from the second functional linkages of
The correlation matrix of the same functional binding as the functional binding in the resting brain of the same subject as the subject at the second time point after the start of the treatment and after the first time point Generating a second value for evaluating depression symptoms for the element;
Comparing the first value with the second value;
Determining that the treatment is effective for ameliorating a subject's depressive symptoms if the second value is improved over the first value;
And a determination method for assisting determination of a therapeutic effect in a subject. - 前記決定工程の後に、前記治療を継続することを提示する工程をさらに含む、請求項18に記載の判別方法。 19. The method of claim 18, further comprising: presenting, after the determining step, continuing the treatment.
- 前記治療が、投薬療法、ニューロフィードバック療法、修正型電気けいれん療法および反復経頭蓋磁気刺激療法から選択される少なくとも一種である、請求項18または19に記載の判別方法。 The method according to claim 18 or 19, wherein the treatment is at least one selected from medication, neurofeedback therapy, modified electroconvulsive therapy and repetitive transcranial magnetic stimulation therapy.
- 前記治療方法が投薬療法であって、前記機能的結合は、左背外側前頭前皮質と、左楔前部および左後部帯状皮質との間の第1の機能的結合、および左下前頭回弁蓋部と、右背内側前頭前皮質および右補足運動野との間の第2の機能的結合を含む、請求項18及び19に記載の判別方法。 The method of treatment is a medication, wherein the functional connection is a first functional connection between the left dorsal lateral prefrontal cortex and the anterior left and posterior cingulate cortex, and the left inferior frontal gyrus 20. The method of claim 18 and 19, comprising a second functional connection between the part and the right back medial prefrontal cortex and the right supplementary motor area.
- 第1の時点の被検者において安静時に計測された、機能的結合の相関行列の要素について、うつ症状を評価するための第1の値を生成する工程を備え、前記機能的結合は、左背外側前頭前皮質と、左楔前部および左後部帯状皮質との間の第1の機能的結合、および左下前頭回弁蓋部と、右背内側前頭前皮質および右補足運動野との間の第2の機能的結合から選択される少なくとも一つを含み、
治療開始後であって第1の時点より後の第2の時点の前記被検者と同一の被検者の安静時の脳内における、前記機能的結合と同一の機能的結合の相関行列の要素ついてうつ症状を評価する第2の値を生成する工程と、
前記第1の値と前記第2の値とを比較する工程と、
前記第2の値が前記第1の値よりも改善していない場合に、前記治療が被検者のうつ症状の改善に有効でないと決定する工程と、
を含む、被検者における治療効果の判定を補助するための判別方法。 Generating a first value for evaluating depressive symptoms with respect to an element of the functional connection correlation matrix measured at rest in the first time point subject, the functional connection being The first functional connection between the dorsolateral prefrontal cortex and the anterior left and posterior cingulate cortex, and the lower left frontal fornix and the right dorsal medial prefrontal cortex and the right supplementary motor area At least one selected from the second functional linkages of
The correlation matrix of the same functional binding as the functional binding in the resting brain of the same subject as the subject at the second time point after the start of the treatment and after the first time point Generating a second value for evaluating depressive symptoms on an element;
Comparing the first value with the second value;
Determining that the treatment is not effective for ameliorating a subject's depressive symptoms if the second value does not improve relative to the first value;
And a determination method for assisting determination of a therapeutic effect in a subject. - 前記決定工程の後に、前記治療の終了を提示する工程を含む、請求項22に記載の判別方法。 23. The method of claim 22, further comprising: presenting an end of the treatment after the determining step.
- 前記決定工程の後に、前記治療を他の治療へ変更することを提示する工程を含む、請求項22に記載の判別方法。 The method according to claim 22, comprising presenting the change of the treatment to another treatment after the determining step.
- 前記治療が、投薬療法、ニューロフィードバック療法、修正型電気けいれん療法および反復経頭蓋磁気刺激療法から選択される少なくとも一種である、請求項22~24のいずれか一項に記載の判別方法。 The determination method according to any one of claims 22 to 24, wherein the treatment is at least one selected from medication, neurofeedback therapy, modified electroconvulsive therapy and repetitive transcranial magnetic stimulation therapy.
- 前記治療方法が投薬療法であって、前記機能的結合は、左背外側前頭前皮質と、左楔前部および左後部帯状皮質との間の第1の機能的結合、および左下前頭回弁蓋部と、右背内側前頭前皮質および右補足運動野との間の第2の機能的結合を含む、請求項22~24のいずれか一項に記載の判別方法。 The method of treatment is a medication, wherein the functional connection is a first functional connection between the left dorsal lateral prefrontal cortex and the anterior left and posterior cingulate cortex, and the left inferior frontal gyrus The method according to any one of claims 22-24, comprising a second functional connection between the part and the right back medial prefrontal cortex and the right supplementary motor area.
- うつ病が予め設定された複数のサブクラスに層別化されている場合に、
安静時の被検者において計測された機能的結合の相関行列の要素について、うつ症状を評価するための指標値を生成する工程を備え、前記機能的結合は、左背外側前頭前皮質と、左楔前部および左後部帯状皮質との間の第1の機能的結合、および左下前頭回弁蓋部と、右背内側前頭前皮質および右補足運動野との間の第2の機能的結合から選択される少なくとも一つを含み、
前記指標値を、あらかじめ前記機能的結合ごとに前記サブクラスに応じて設定された指標値の基準範囲と比較する工程と、
前記被検者が、前記指標値が含まれる基準範囲に対応する前記サブクラスであると決定する工程と、を含む、うつ病患者の層別化を補助するための判別方法。 If depression is stratified into multiple predefined subclasses,
Generating an index value for evaluating depressive symptoms for an element of the correlation matrix of functional connectivity measured in the subject at rest, the functional connectivity comprising: left dorsal lateral prefrontal cortex; The first functional connection between the anterior left and the left posterior cingulate cortex, and the second functional connection between the lower left frontal forearm and the right back medial prefrontal cortex and the right supplementary motor area Including at least one selected from
Comparing the index value with a reference range of index values set in advance according to the subclass for each functional connection;
Determining that the subject is the subclass corresponding to a reference range in which the index value is included, for determining stratification of a depressed patient. - 判別装置であって、
記憶装置を備え、前記記憶装置は、
プログラムと、
安静時において、健常者とうつ病患者を含む複数の参加者の各々の脳内の複数の所定領域における脳活動を示す信号を脳活動検知装置により時系列で予め測定した信号から分類器生成処理により生成された分類器を特定する情報を格納し、
前記分類器は、うつ症状が予め設定された複数のサブクラスに層別化されている場合に、前記複数の所定領域間の機能的結合のうちから機械学習により、うつ病のサブクラスのラベルに関連するとして特徴選択により選択された複数の機能的結合の重み付け和に基づいて、前記選択された機能的結合に対応する判別対象の相関行列の要素に対して前記うつ病のサブクラスのラベルを判別するように生成され、
演算装置をさらに備え、前記演算装置は、前記プログラムを実行している間に、
前記重み付け和と前記判別対象の相関行列の要素から前記サブクラスを判別する、うつ病患者の層別化処理を実行する、ように構成され、
ここで、前記選択された複数の機能的結合は、
左背外側前頭前皮質と、左楔前部および左後部帯状皮質との間の第1の機能的結合、および
左下前頭回弁蓋部と、右背内側前頭前皮質および右補足運動野との間の第2の機能的結合から選択される少なくとも1つを含む、判別装置。 A discriminator,
A storage device, the storage device being
With programs
At rest, a signal indicating brain activity in a plurality of predetermined regions in the brain of each of a plurality of participants including a healthy person and a depressed patient is subjected to classifier generation processing from a signal previously measured in time series by a brain activity detection device Store information identifying the classifier generated by
The classifier relates to a label of a subclass of depression by machine learning from among functional connections among the plurality of predetermined areas, when the depressive symptoms are stratified into a plurality of preset subclasses. Determine the label of the depression subclass with respect to the element of the correlation matrix to be determined corresponding to the selected functional combination based on the weighted sum of the plurality of functional combinations selected by the feature selection As generated
The computer system further comprises an arithmetic unit, the arithmetic unit executing the program,
Performing stratification processing of a depressed patient, wherein the subclass is determined from the weighted sum and an element of the correlation matrix to be determined;
Here, the plurality of selected functional connections are
The first functional connection between the left dorsolateral prefrontal cortex and the anterior left and posterior cingulate cortex, and the lower left forehead leaflet and the right dorsal medial prefrontal cortex and the right supplementary motor area A discriminator comprising at least one selected from a second functional connection between - 判別装置であって、
演算装置を備え、前記演算装置は、
複数の対象者について、下記表3に示す機能的結合識別番号1~12から選択される複数の機能的結合の第1の時点の相関と治療開始後であって第1の時点よりも後の第2の時点の相関とがそれぞれ計測されて得られる情報に基づき、前記複数の機能的結合の第1の時点と第2の時点の前記相関の差の各々で張られる相関状態空間において、前記複数の対象者において治療効果がみられた群と治療効果がみられない群とを識別する分類器を予め生成する分類器生成処理を実行し、
第1の時点の被検者の安静時の脳内における、前記複数の機能的結合の第1の相関を算出し、
第2の時点の前記被検者と同一の被検者の安静時の脳内における、前記複数の機能的結合の第2相関を算出し、
前記被検者の前記複数の機能的結合の前記第2の相関と前記第1の相関との差に基づき、前記分類器により、前記被検者に対する治療効果を判別する、うつ病患者における治療効果の判定処理を実行する、ように構成された、判別装置:

An arithmetic unit, the arithmetic unit comprising
The correlation between the first time point of the plurality of functional bindings selected from the functional binding identification numbers 1 to 12 shown in the following Table 3 and the time after the initiation of the treatment for the plurality of subjects after the first time point In the correlation state space spanned by each of the correlation differences between the first and second time points of the plurality of functional connections, based on information obtained by measuring the correlation of the second time point respectively. Execute a classifier generation process that generates in advance a classifier that identifies a group in which the therapeutic effect is seen and a group in which the therapeutic effect is not seen in a plurality of subjects.
Calculating a first correlation of the plurality of functional connections in the resting brain of the subject at a first time point,
Calculating a second correlation of the plurality of functional connections in the resting brain of the same subject as the subject at the second time point;
Treatment in a depressed patient, wherein the classifier determines the therapeutic effect on the subject based on the difference between the second correlation and the first correlation of the plurality of functional connections of the subject A determining device configured to perform an effect determination process:
- 前記複数の機能的結合は、
機能的結合識別番号1の機能的結合、及び機能的結合識別番号2の機能的結合である、請求項29の判別装置。 The plurality of functional connections are
30. The apparatus according to claim 29, wherein the functional combination of functional combination identification number 1 and the functional combination of functional combination identification number 2 are used. - 複数の対象者について、下記表4に示す機能的結合識別番号1~12から選択される複数の機能的結合の第1の時点の相関と治療開始後であって第1の時点よりも後の第2の時点の相関とがそれぞれ計測されて得られる情報に基づき、前記複数の機能的結合の第1の時点と第2の時点の前記相関の差の各々で張られる相関状態空間において、前記複数の対象者において治療効果がみられた群と治療効果がみられない群とを識別する分類器を予め生成する工程と、
第1の時点の被検者の安静時の脳内における、前記複数の機能的結合の第1の相関を計測する工程と、
第2の時点の前記被検者と同一の被検者の安静時の脳内における、前記複数の機能的結合の第2相関を計測する工程と、
前記被検者の前記複数の機能的結合の前記第2の相関と前記第1の相関との差に基づき、前記分類器により、前記被検者に対する治療効果を判別する工程と、
を含む、うつ病患者における治療効果の判定を補助するための判別方法:

Measuring a first correlation of the plurality of functional connections in the resting brain of a subject at a first time point;
Measuring a second correlation of the plurality of functional connections in the resting brain of the same subject as the subject at a second time point;
Determining a therapeutic effect on the subject by the classifier based on a difference between the second correlation and the first correlation of the plurality of functional combinations of the subject;
Discrimination methods for assisting determination of the treatment effect in depressed patients, including:
- 安静時において、健常者とうつ病患者を含む複数の参加者の各々の脳内の複数の所定領域における脳活動を示す信号を脳活動検知装置により時系列で予め測定した信号から分類器生成処理により生成された分類器を、被検者におけるうつ症状の有無の判定またはうつ症状のレベルの判定を補助するために使用する方法であって、
前記分類器は、前記複数の所定領域間の機能的結合のうちから機械学習により、うつ症状の疾患ラベルに関連するとして特徴選択により選択された複数の機能的結合の重み付け和に基づいて、前記うつ症状の疾患ラベルを判別するように生成され、
前記選択された複数の機能的結合は、
左背外側前頭前皮質と、左楔前部および左後部帯状皮質との間の第1の機能的結合、および
左下前頭回弁蓋部と、右背内側前頭前皮質および右補足運動野との間の第2の機能的結合から選択される少なくとも1つを含み、
前記使用方法は、前記分類器に被検者の前記複数の機能的結合の相関行列の要素から生成された指標値を入力する工程を含む、使用方法。 At rest, a signal indicating brain activity in a plurality of predetermined regions in the brain of each of a plurality of participants including a healthy person and a depressed patient is subjected to classifier generation processing from a signal previously measured in time series by a brain activity detection device A method of using the classifier generated by the method to determine the presence or absence of depressive symptoms or the determination of the level of depressive symptoms in a subject,
The classifier is based on a weighted sum of a plurality of functional combinations selected by feature selection as related to a disease label of depressive symptoms by machine learning out of functional connections among the plurality of predetermined areas. Generated to determine the disease label for depressive symptoms,
The plurality of selected functional connections are
The first functional connection between the left dorsolateral prefrontal cortex and the anterior left and posterior cingulate cortex, and the lower left forehead leaflet and the right dorsal medial prefrontal cortex and the right supplementary motor area And at least one selected from a second functional linkage between
The method of use includes the step of inputting into the classifier an index value generated from an element of a correlation matrix of the plurality of functional combinations of the subject. - 安静時において、健常者とうつ病患者を含む複数の参加者の各々の脳内の複数の所定領域における脳活動を示す信号を脳活動検知装置により時系列で予め測定した信号から分類器生成処理により生成された分類器を、うつ症状の治療の効果の判定を補助するために使用する方法であって、
前記複数の所定領域間の機能的結合のうちから機械学習により、うつ症状の疾患ラベルに関連するとして特徴選択により選択された複数の機能的結合の重み付け和に基づいて、前記うつ症状の疾患ラベルを判別するように前記分類器を生成する工程を備え、
前記選択された複数の機能的結合は、
左背外側前頭前皮質と、左楔前部および左後部帯状皮質との間の第1の機能的結合、および
左下前頭回弁蓋部と、右背内側前頭前皮質および右補足運動野との間の第2の機能的結合から選択される少なくとも1つを含み、
前記使用方法は、前記分類器に被検者の前記複数の機能的結合の相関行列の要素から生成された指標値を入力する工程をさらに備える、使用方法。 At rest, a signal indicating brain activity in a plurality of predetermined regions in the brain of each of a plurality of participants including a healthy person and a depressed patient is subjected to classifier generation processing from a signal previously measured in time series by a brain activity detection device A method of using the classifier generated by to help determine the effects of treatment for depressive symptoms,
The disease label of the depressive condition based on the weighted sum of the plurality of functional combinations selected by the feature selection as related to the disease label of the depressive condition by machine learning out of the functional connections among the plurality of predetermined areas Generating the classifier to determine
The plurality of selected functional connections are
The first functional connection between the left dorsolateral prefrontal cortex and the anterior left and posterior cingulate cortex, and the lower left forehead leaflet and the right dorsal medial prefrontal cortex and the right supplementary motor area And at least one selected from a second functional linkage between
The method of use further comprising the step of inputting into the classifier an index value generated from an element of a correlation matrix of the plurality of functional combinations of the subject. - うつ症状が予め設定された複数のサブクラスに層別化されている場合に、
安静時において、健常者とうつ病患者を含む複数の参加者の各々の脳内の複数の所定領域における脳活動を示す信号を脳活動検知装置により時系列で予め測定した信号から分類器生成処理により生成された分類器を、被検者を前記サブクラスに層別化することを補助するために使用する方法であって、
前記複数の所定領域間の機能的結合のうちから機械学習により、うつ症状の疾患ラベルに関連するとして特徴選択により選択された複数の機能的結合の重み付け和に基づいて、前記うつ症状の疾患ラベルを判別するように前記分類器を生成する工程を備え、
前記選択された複数の機能的結合は、
左背外側前頭前皮質と、左楔前部および左後部帯状皮質との間の第1の機能的結合、および
左下前頭回弁蓋部と、右背内側前頭前皮質および右補足運動野との間の第2の機能的結合から選択される少なくとも1つを含み、
前記使用方法は、前記分類器に被検者の前記複数の機能的結合の相関行列の要素から生成された指標値を入力する工程をさらに備える、使用方法。 If the depressive symptoms are stratified into multiple predefined subclasses,
At rest, a signal indicating brain activity in a plurality of predetermined regions in the brain of each of a plurality of participants including a healthy person and a depressed patient is subjected to classifier generation processing from a signal previously measured in time series by a brain activity detection device A classifier generated by the method to aid stratification of subjects into said subclasses,
The disease label of the depressive condition based on the weighted sum of the plurality of functional combinations selected by the feature selection as related to the disease label of the depressive condition by machine learning out of the functional connections among the plurality of predetermined areas Generating the classifier to determine
The plurality of selected functional connections are
The first functional connection between the left dorsolateral prefrontal cortex and the anterior left and posterior cingulate cortex, and the lower left forehead leaflet and the right dorsal medial prefrontal cortex and the right supplementary motor area And at least one selected from a second functional linkage between
The method of use further comprising the step of inputting into the classifier an index value generated from an element of a correlation matrix of the plurality of functional combinations of the subject. - 判別装置であって、
記憶装置を備え、前記記憶装置は、
プログラムと、うつ症状が予め設定された複数のサブクラスに層別化するための情報とを記憶し、
演算装置をさらに備え、前記演算装置は、前記プログラムを実行させている間に、
安静時において、健常者とうつ病患者を含む複数の参加者の各々の脳内の複数の所定領域における脳活動を示す信号を脳活動検知装置により時系列で予め測定した信号から第1の分類器を生成し、生成された第1の分類器の情報を前記記憶装置に格納し、
前記第1の分類器は、前記複数の所定領域間の機能的結合のうちから機械学習により、うつ症状の疾患ラベルに関連するとして特徴選択により選択された複数の機能的結合の重み付け和に基づいて、前記うつ症状の疾患ラベルを判別するように生成され、
前記選択された複数の機能的結合は、
左背外側前頭前皮質と、左楔前部および左後部帯状皮質との間の第1の機能的結合、および
左下前頭回弁蓋部と、右背内側前頭前皮質および右補足運動野との間の第2の機能的結合から選択される少なくとも1つを含み、
前記演算装置は、さらに、複数の対象者について、下記表5に示す機能的結合識別番号1~12から選択される複数の機能的結合の第1の時点の相関と治療開始後であって第1の時点よりも後の第2の時点の相関をそれぞれ計測して、前記複数の機能的結合の第1の時点と第2の時点の前記相関の差の各々で張られる相関状態空間において、前記複数の対象者において治療効果がみられた群と治療効果がみられない群とを識別する第2の分類器を生成し、生成された第2の分類器の情報を前記記憶装置に格納し、
前記演算装置は、
前記第1の分類器を用いて、被検者を前記サブクラスに層別化処理を実行し、
前記層別化処理によって特定のサブクラスに層別化された被検者について、第1の時点の安静時の前記複数の機能的結合の第1の相関を計測するための処理を実行し、
第2の時点の前記被検者と同一の被検者の安静時の前記複数の機能的結合の第2相関を計測するための処理を実行し、
前記被検者の前記複数の機能的結合の前記第2の相関と前記第1の相関との差に基づき、前記第2の分類器により、前記被検者に対する治療効果を判別する処理を実行する、ように構成される、判別装置:

A storage device, the storage device being
Store programs and information for stratification of depressive symptoms into multiple preset subclasses,
The computer further comprises an arithmetic unit, the arithmetic unit executing the program,
At rest, signals indicative of brain activity in a plurality of predetermined regions in the brain of each of a plurality of participants including a healthy person and a depressed patient are first classified based on a signal previously measured in time series by the brain activity detector And storing the generated information of the first classifier in the storage device,
The first classifier is based on a weighted sum of a plurality of functional combinations selected by feature selection as related to a disease label of depressive symptoms by machine learning out of functional connections among the plurality of predetermined areas. Generated to determine the disease label of the depressive symptoms,
The plurality of selected functional connections are
The first functional connection between the left dorsolateral prefrontal cortex and the anterior left and posterior cingulate cortex, and the lower left forehead leaflet and the right dorsal medial prefrontal cortex and the right supplementary motor area And at least one selected from a second functional linkage between
The arithmetic unit is further configured to correlate the first time point of the plurality of functional combinations selected from the functional combination identification numbers 1 to 12 shown in Table 5 below with respect to the plurality of subjects, and after the start of the treatment In the correlation state space spanned by each of the differences in the correlation between the first and second time points of the plurality of functional connections, respectively measuring the correlation at the second time point after the one time point; A second classifier is generated to identify a group in which the therapeutic effect is observed and a group in which the therapeutic effect is not observed in the plurality of subjects, and the generated information of the second classifier is stored in the storage device. And
The arithmetic device is
Performing a stratification process on the subject to the subclass using the first classifier;
Executing a process for measuring a first correlation of the plurality of functional connections at rest at a first time point, for the subject stratified into a specific subclass by the stratification process;
Performing a process for measuring a second correlation of the plurality of functional connections at rest of the same subject as the subject at a second time,
The second classifier performs processing to determine the therapeutic effect on the subject based on the difference between the second correlation and the first correlation of the plurality of functional combinations of the subject Discrimination device configured to:
- うつ症状が予め設定された複数のサブクラスに層別化されている場合に、安静時において、健常者とうつ病患者を含む複数の参加者の各々の脳内の複数の所定領域における脳活動を示す信号を脳活動検知装置により時系列で予め測定した信号から第1の分類器生成処理によって生成された第1の分類器を使用して、被検者を前記サブクラスに層別化する層別化工程であって、
前記第1の分類器は、前記複数の所定領域間の機能的結合のうちから機械学習により、うつ症状の疾患ラベルに関連するとして特徴選択により選択された複数の機能的結合の重み付け和に基づいて、前記うつ症状の疾患ラベルを判別するように生成され、
前記選択された複数の機能的結合は、
左背外側前頭前皮質と、左楔前部および左後部帯状皮質との間の第1の機能的結合、および
左下前頭回弁蓋部と、右背内側前頭前皮質および右補足運動野との間の第2の機能的結合から選択される少なくとも1つを含む、層別化工程と、
前記層別化工程によって特定のサブクラスに層別化された被検者について、治療開始前の安静時の前記複数の機能的結合の第1の相関を計測する第1の相関計測工程と、
治療開始から所定期間経過後の前記被検者と同一の被検者の安静時の前記複数の機能的結合の第2相関を計測する第2の相関計測工程と、
特定のサブクラスに分類された前記被検者に対する治療効果を第2の分類器を用いて判別する判別工程であって、
前記第2の分類器は、複数の対象者について、下記表6に示す機能的結合識別番号1~12から選択される複数の機能的結合の第1の時点の相関と治療開始後であって第1の時点よりも後の第2の時点の相関をそれぞれ計測して、前記複数の機能的結合の第1の時点と第2の時点の前記相関の差の各々で張られる相関状態空間において、前記複数の対象者において治療効果がみられた群と治療効果がみられない群とを識別する第2の分類器生成処理によって予め生成され、
前記被検者の前記複数の機能的結合の前記第2の相関と前記第1の相関との差に基づき、前記被検者に対する治療効果を判別する、判別工程と、
を備える、被検者における治療効果の判定を補助するための判別方法:

The first classifier is based on a weighted sum of a plurality of functional combinations selected by feature selection as related to a disease label of depressive symptoms by machine learning out of functional connections among the plurality of predetermined areas. Generated to determine the disease label of the depressive symptoms,
The plurality of selected functional connections are
The first functional connection between the left dorsolateral prefrontal cortex and the anterior left and posterior cingulate cortex, and the lower left forehead leaflet and the right dorsal medial prefrontal cortex and the right supplementary motor area A stratification process comprising at least one selected from a second functional linkage between
A first correlation measurement step of measuring a first correlation of the plurality of functional connections at rest before the start of treatment for a subject stratified into a specific subclass by the stratification step;
A second correlation measurement step of measuring a second correlation of the plurality of functional connections at rest of the same subject as the subject after a predetermined period has elapsed from the start of the treatment;
A determination step of determining a therapeutic effect on the subject classified into a specific subclass using a second classifier,
The second classifier is for the plurality of subjects, after correlation of the first time point of the plurality of functional combinations selected from the functional combination identification numbers 1 to 12 shown in Table 6 below, and after the start of the treatment. In the correlation state space spanned by each of the differences in the correlation between the first and second time points of the plurality of functional connections, respectively measuring the correlation at the second time point after the first time point A second classifier generation process that generates in advance a second classifier generation process that identifies a group in which the therapeutic effect is observed and a group in which the therapeutic effect is not observed in the plurality of subjects;
Determining a therapeutic effect on the subject based on a difference between the second correlation and the first correlation of the plurality of functional combinations of the subject;
A determination method for assisting determination of a therapeutic effect in a subject, comprising:
- さらに、ドラッグリプロファイリングのために使用される、請求項18~21、または請求項22~26に記載の判別方法。 The determination method according to any one of claims 18 to 21 or 22 to 26, which is further used for drug reprofiling.
- さらに、ドラッグリプロファイリングのために使用される、請求項29または30に記載の判別装置。 31. The discriminating apparatus according to claim 29, further used for drug reprofiling.
- ドラッグリプロファイリングのために使用される、請求項31に記載の判別方法。 32. The method of claim 31 used for drug reprofiling.
- ドラッグリプロファイリングのために使用される、請求項35に記載の判別装置。 36. The discriminator of claim 35 used for drug reprofiling.
- ドラッグリプロファイリングのために使用される、請求項36に記載の判別方法。 The method according to claim 36, which is used for drug reprofiling.
- 第1の分類器生成装置であって、
演算装置を備え、前記演算装置は、
安静時において、健常者とうつ病患者を含む複数の参加者の各々の脳内の複数の所定領域における脳活動を示す信号を脳活動検知装置により時系列で予め測定した信号から分類器を特定する情報を生成し、
前記分類器は、前記複数の所定領域間の機能的結合のうちから機械学習により、うつ症状の疾患ラベルに関連するとして特徴選択により選択された複数の機能的結合の重み付け和に基づいて、前記うつ症状の疾患ラベルを判別するように生成され、
前記選択された複数の機能的結合は、
左背外側前頭前皮質と、左楔前部および左後部帯状皮質との間の第1の機能的結合、および
左下前頭回弁蓋部と、右背内側前頭前皮質および右補足運動野との間の第2の機能的結合から選択される少なくとも1つを含み、
記憶装置をさらに備え、前記記憶装置は、前記演算装置によって生成された前記第1の分類器を特定する情報を記憶する、第1の分類器生成装置。 A first classifier generator,
An arithmetic unit, the arithmetic unit comprising
At rest, a classifier is specified based on time-series pre-measured signals indicating brain activity in a plurality of predetermined regions in the brain of each of a plurality of participants including healthy persons and depressed patients. Generate information to
The classifier is based on a weighted sum of a plurality of functional combinations selected by feature selection as related to a disease label of depressive symptoms by machine learning out of functional connections among the plurality of predetermined areas. Generated to determine the disease label for depressive symptoms,
The plurality of selected functional connections are
The first functional connection between the left dorsolateral prefrontal cortex and the anterior left and posterior cingulate cortex, and the lower left forehead leaflet and the right dorsal medial prefrontal cortex and the right supplementary motor area And at least one selected from a second functional linkage between
A first classifier generation device, further comprising: a storage device, wherein the storage device stores information identifying the first classifier generated by the arithmetic device. - 安静時において、健常者とうつ病患者を含む複数の参加者の各々の脳内の複数の所定領域における脳活動を示す信号を脳活動検知装置により時系列で予め測定した信号から分類器生成処理により第1の分類器を生成する方法であって、前記第1の分類器は、前記複数の所定領域間の機能的結合のうちから機械学習により、うつ症状の疾患ラベルに関連するとして特徴選択により選択された複数の機能的結合の重み付け和に基づいて、前記うつ症状の疾患ラベルを判別するように生成され、
前記機能的結合は、左背外側前頭前皮質と、左楔前部および左後部帯状皮質との間の第1の機能的結合、および左下前頭回弁蓋部と、右背内側前頭前皮質および右補足運動野との間の第2の機能的結合から選択される少なくとも一つを含む、第1の分類器の生成方法。 At rest, a signal indicating brain activity in a plurality of predetermined regions in the brain of each of a plurality of participants including a healthy person and a depressed patient is subjected to classifier generation processing from a signal previously measured in time series by a brain activity detection device A method of generating a first classifier according to, wherein the first classifier is selected from among functional connections among the plurality of predetermined regions as being related to a disease label of depressive symptoms by machine learning. Generated to determine the disease label of said depressive symptoms based on the weighted sum of the plurality of functional bindings selected by
The functional connection is the first functional connection between the left dorsal lateral prefrontal cortex and the left anterior and left posterior cingulate cortex, and the lower left frontal valvular portion, the right dorsal medial prefrontal cortex and A method of generating a first classifier, comprising at least one selected from a second functional connection between a right supplementary motor area. - 第2の分類器生成装置であって、
演算装置を備え、前記演算装置は、
複数の対象者について、下記表3に示す機能的結合識別番号1~12から選択される複数の機能的結合の第1の時点の相関と治療開始後であって第1の時点よりも後の第2の時点の相関をそれぞれ計測して、前記複数の機能的結合の第1の時点と第2の時点の前記相関の差の各々で張られる相関状態空間において、前記複数の対象者において治療効果がみられた群と治療効果がみられない群とを識別する第2の分類器を生成し、
記憶装置をさらに備え、前記記憶装置は、前記演算装置によって生成された前記第2の分類器を特定するための情報を記憶する、第2の分類器生成装置:

An arithmetic unit, the arithmetic unit comprising
The correlation between the first time point of the plurality of functional bindings selected from the functional binding identification numbers 1 to 12 shown in the following Table 3 and the time after the initiation of the treatment for the plurality of subjects after the first time point The correlation state at the second time point is measured, and treatment is performed in the plurality of subjects in the correlation state space spanned by each of the correlation differences at the first time point and the second time point of the plurality of functional connections. Generate a second classifier that distinguishes between groups with efficacy and no treatment
A second classifier generation device, further comprising: a storage device, wherein the storage device stores information for identifying the second classifier generated by the arithmetic device:
- 複数の対象者について、下記表4に示す機能的結合識別番号1~12から選択される複数の機能的結合の第1の時点の相関と治療開始後であって第1の時点よりも後の第2の時点の相関をそれぞれ計測して、前記複数の機能的結合の第1の時点と第2の時点の前記相関の差の各々で張られる相関状態空間において、前記複数の対象者において治療効果がみられた群と治療効果がみられない群とを識別する分類器を予め生成する工程を備える、第2の分類器生成方法:

- 脳活動訓練装置であって、
ニューロフィードバック訓練の被訓練者の脳内の複数の所定領域における脳活動を示す信号を時系列で検知する脳活動検知装置と、
記憶装置とを備え、前記記憶装置は、安静時において、健常者とうつ病患者を含む複数の参加者の各々の脳内の複数の所定領域における脳活動を示す信号を時系列で予め測定した信号に基づいて、前記複数の所定領域間の機能的結合から機械学習により、うつ症状の疾患ラベルを判別するために特徴選択により選択された複数の機能的結合のうち訓練対象の機能的結合を特定する情報と、ニューロフィードバック訓練における前記訓練対象の機能的結合の目標パターンと、を格納し、
演算装置と、
前記被訓練者に対して情報を提示するための提示装置とをさらに備え、
前記演算装置は、
前記脳活動検知装置により検知された信号から、前記訓練対象の機能的結合の時間相関を所定期間について算出し、
算出された前記時間相関に基づいて、前記目標パターンとの近似度に応じて、報酬値を算出し、
前記報酬値の大きさを示す情報を前記被訓練者に対して前記提示装置を介して提示する、ニューロフィードバック訓練の処理を実行する、ように構成され、
ここで、前記訓練対象の機能的結合は、
左背外側前頭前皮質と、左楔前部および左後部帯状皮質との間の第1の機能的結合を含み、前記被訓練者の脳内の複数の所定領域のそれぞれは、前記複数の参加者における脳内の複数の所定領域にそれぞれ対応する、脳活動訓練装置。 It is a brain activity training device, and
A brain activity detection device that detects in time series signals indicating brain activity in a plurality of predetermined regions in the brain of a trainee of neuro feedback training;
A storage device, wherein the storage device measures, in time series, signals indicating brain activity in a plurality of predetermined regions in the brain of each of a plurality of participants including a healthy person and a depressed patient at rest The functional connection of the training object is selected among the plurality of functional combinations selected by the feature selection to determine the disease label of depressive symptoms by machine learning from the functional connection between the plurality of predetermined areas based on the signal. Storing information to be identified and a target pattern of functional connection of the training target in neuro feedback training;
A computing device,
And a presentation device for presenting information to the trainee.
The arithmetic device is
From the signals detected by the brain activity detection device, the time correlation of the functional combination of the training object is calculated for a predetermined period,
Based on the calculated time correlation, a reward value is calculated according to the degree of approximation with the target pattern,
Performing processing of neuro feedback training, which presents information indicating the magnitude of the reward value to the trainee via the presentation device,
Here, the functional connection of the training target is
A first functional connection between the left dorsolateral prefrontal cortex and the anterior left and posterior cingulate cortex, wherein each of the plurality of predetermined regions in the trainee's brain comprises the plurality of participants Brain activity training device corresponding to each of a plurality of predetermined regions in the brain in a person. - 前記うつ症状は、メランコリー型うつ病に伴う症状である、請求項46に記載の脳活動訓練装置。 The brain activity training device according to claim 46, wherein the depressive symptoms are symptoms associated with melancholic depression.
- 前記被訓練者が、
請求項1~5に記載の判別装置、又は請求項10~16に記載の判別方法によりうつ症状があると判別された被検者であるか、
請求項6に記載の判別装置、又は請求項17に記載の判別方法によりうつ症状のレベルを決定された被検者であるか、
請求項8に記載の判別装置、又は請求項27の判別方法により層別化されたうつ疾患患者である、
請求項46又は47に記載の脳活動訓練装置。 The trainee is
Whether the subject is a subject judged to have a depressive symptom by the discrimination device according to claims 1 to 5 or the discrimination method according to claims 10 to 16,
Whether the subject is a subject whose level of depressive symptoms has been determined by the determination apparatus according to claim 6 or the determination method according to claim 17;
A patient with a depressive disorder stratified by the discrimination device according to claim 8 or the discrimination method according to claim 27,
48. The brain activity training device according to claim 46 or 47. - 請求項46~48のいずれか一項に記載の脳活動訓練装置を制御するコンピュータプログラム。 A computer program for controlling the brain activity training device according to any one of claims 46 to 48.
- 脳活動検知装置と、提示装置と、演算装置と、記憶装置と、を備える脳活動訓練装置の制御方法であって、
前記脳活動検知装置は、ニューロフィードバック訓練の被訓練者の脳内の複数の所定領域における脳活動を示す信号を時系列で検知し、
前記記憶装置は、安静時において、健常者とうつ病患者を含む複数の参加者の各々の脳内の複数の所定領域における脳活動を示す信号を時系列で予め測定した信号に基づいて、前記複数の所定領域間の機能的結合から機械学習により、うつ症状の疾患ラベルを判別するために特徴選択により選択された複数の機能的結合のうち訓練対象の機能的結合を特定する情報と、ニューロフィードバック訓練における前記訓練対象の機能的結合の目標パターンとを格納し、
前記脳活動検知装置により、前記ニューロフィードバック訓練の被訓練者の脳内の複数の所定領域における脳活動を示す信号を時系列で検知する工程と、
前記演算装置が、前記脳活動検知装置により検知された信号から、前記訓練対象の機能的結合の時間相関を所定期間について算出する工程と、
前記演算装置が、算出された前記時間相関に基づいて、前記目標パターンとの近似度に応じて、報酬値を算出する工程と、
前記演算装置が、前記報酬値の大きさを示す情報を前記提示装置により前記被訓練者に対して提示する工程と、を備え、
ここで、前記訓練対象の機能的結合は、
左背外側前頭前皮質と、左楔前部および左後部帯状皮質との間の第1の機能的結合を含み、前記被訓練者の脳内の複数の所定領域のそれぞれは、前記複数の参加者における脳内の複数の所定領域にそれぞれ対応する、脳活動訓練装置の制御方法。 A control method of a brain activity training device comprising a brain activity detection device, a presentation device, an arithmetic device, and a storage device,
The brain activity detection device detects in time series a signal indicating brain activity in a plurality of predetermined regions in the brain of a trainee of neuro feedback training,
The said memory | storage device is based on the signal which measured beforehand the signal which shows the brain activity in several predetermined area | regions in each brain of several participants including a healthy person and a depression patient at the time of rest at rest. Information for identifying a functional connection of a training target among a plurality of functional connections selected by feature selection to determine a disease label of depressive symptoms by machine learning from functional connections between a plurality of predetermined regions, and neuro Storing the target pattern of the functional connection of the training target in feedback training;
Detecting, in time series, signals indicating brain activity in a plurality of predetermined regions in the brain of the trainee of the neuro feedback training by the brain activity detection device;
Calculating the time correlation of the functional combination of the training object for a predetermined period from the signal detected by the brain activity detection device;
Calculating the reward value according to the degree of approximation with the target pattern based on the calculated time correlation;
Providing the computing device with information indicating the magnitude of the reward value to the trainee by the presentation device;
Here, the functional connection of the training target is
A first functional connection between the left dorsolateral prefrontal cortex and the anterior left and posterior cingulate cortex, wherein each of the plurality of predetermined regions in the trainee's brain comprises the plurality of participants Control method of the brain activity training device respectively corresponding to a plurality of predetermined regions in a brain in a person.
Priority Applications (3)
| Application Number | Priority Date | Filing Date | Title |
|---|---|---|---|
| US16/753,291 US20210034912A1 (en) | 2017-10-03 | 2018-10-02 | Differentiation device, differentiation method for depression symptoms, determination method for level of depression symptoms, stratification method for depression patients, determination method for effects of treatment of depression symptoms, and brain activity training device |
| EP18864859.6A EP3692909A4 (en) | 2017-10-03 | 2018-10-02 | Differentiation device, differentiation method for depression symptoms, determination method for level of depression symptoms, stratification method for depression patients, determination method for effects of treatment of depression symptoms, and brain activity training device |
| CN201880078144.5A CN111447874A (en) | 2017-10-03 | 2018-10-02 | Determination device, method for determining depression symptom, method for determining level of depression symptom, method for classifying depression patient, method for determining treatment effect of depression symptom, and brain activity training device |
Applications Claiming Priority (4)
| Application Number | Priority Date | Filing Date | Title |
|---|---|---|---|
| JP2017193897 | 2017-10-03 | ||
| JP2017-193897 | 2017-10-03 | ||
| JP2018005110A JP6722845B2 (en) | 2017-10-03 | 2018-01-16 | Discriminating apparatus, depressive symptom discriminating method, depressive symptom level determining method, depressive patient stratification method, depressive symptom therapeutic effect determining method, and brain activity training apparatus |
| JP2018-005110 | 2018-01-16 |
Publications (1)
| Publication Number | Publication Date |
|---|---|
| WO2019069955A1 true WO2019069955A1 (en) | 2019-04-11 |
Family
ID=65994914
Family Applications (1)
| Application Number | Title | Priority Date | Filing Date |
|---|---|---|---|
| PCT/JP2018/036952 WO2019069955A1 (en) | 2017-10-03 | 2018-10-02 | Differentiation device, differentiation method for depression symptoms, determination method for level of depression symptoms, stratification method for depression patients, determination method for effects of treatment of depression symptoms, and brain activity training device |
Country Status (1)
| Country | Link |
|---|---|
| WO (1) | WO2019069955A1 (en) |
Cited By (7)
| Publication number | Priority date | Publication date | Assignee | Title |
|---|---|---|---|---|
| EP3381361A4 (en) * | 2015-11-24 | 2019-12-04 | Advanced Telecommunications Research Institute International | Brain activity analysis device, brain activity analysis method, program, and biomarker device |
| US10748644B2 (en) | 2018-06-19 | 2020-08-18 | Ellipsis Health, Inc. | Systems and methods for mental health assessment |
| CN112971781A (en) * | 2020-12-30 | 2021-06-18 | 杭州电子科技大学 | Network depression comparison method based on brain function |
| CN113017650A (en) * | 2021-03-12 | 2021-06-25 | 南昌航空大学 | Electroencephalogram feature extraction method and system based on power spectral density image |
| US11120895B2 (en) | 2018-06-19 | 2021-09-14 | Ellipsis Health, Inc. | Systems and methods for mental health assessment |
| CN115147417A (en) * | 2022-09-02 | 2022-10-04 | 之江实验室 | Function connection matrix processing system and device based on filtering method feature selection |
| TWI780396B (en) * | 2020-01-22 | 2022-10-11 | 長庚醫療財團法人嘉義長庚紀念醫院 | Evaluation method and evaluation system of suicidal ideation based on multi-feature MRI and artificial intelligence |
Citations (5)
| Publication number | Priority date | Publication date | Assignee | Title |
|---|---|---|---|---|
| JPS5641531B2 (en) | 1974-03-20 | 1981-09-29 | ||
| JP2006132313A (en) | 2004-10-07 | 2006-05-25 | Yashima:Kk | Joint structure of foundation and frame |
| JP2011000184A (en) | 2009-06-16 | 2011-01-06 | Advanced Telecommunication Research Institute International | Magnetic resonance imaging apparatus and magnetic resonance imaging method |
| WO2014178323A1 (en) * | 2013-05-01 | 2014-11-06 | 株式会社国際電気通信基礎技術研究所 | Brain activity analysis device, brain activity analysis method, and biomarker device |
| WO2017090590A1 (en) | 2015-11-24 | 2017-06-01 | 株式会社国際電気通信基礎技術研究所 | Brain activity analysis device, brain activity analysis method, program, and biomarker device |
-
2018
- 2018-10-02 WO PCT/JP2018/036952 patent/WO2019069955A1/en unknown
Patent Citations (7)
| Publication number | Priority date | Publication date | Assignee | Title |
|---|---|---|---|---|
| JPS5641531B2 (en) | 1974-03-20 | 1981-09-29 | ||
| JP2006132313A (en) | 2004-10-07 | 2006-05-25 | Yashima:Kk | Joint structure of foundation and frame |
| JP2011000184A (en) | 2009-06-16 | 2011-01-06 | Advanced Telecommunication Research Institute International | Magnetic resonance imaging apparatus and magnetic resonance imaging method |
| WO2014178323A1 (en) * | 2013-05-01 | 2014-11-06 | 株式会社国際電気通信基礎技術研究所 | Brain activity analysis device, brain activity analysis method, and biomarker device |
| JP2015062817A (en) | 2013-05-01 | 2015-04-09 | 株式会社国際電気通信基礎技術研究所 | Brain activity analysis device, brain activity analysis method, and biomarker device |
| WO2017090590A1 (en) | 2015-11-24 | 2017-06-01 | 株式会社国際電気通信基礎技術研究所 | Brain activity analysis device, brain activity analysis method, program, and biomarker device |
| JP6195329B1 (en) | 2015-11-24 | 2017-09-13 | 株式会社国際電気通信基礎技術研究所 | Brain activity analysis device, brain activity analysis method, program, and biomarker device |
Non-Patent Citations (18)
| Title |
|---|
| DECHARMS RCMAEDA FGLOVER GH ET AL.: "Control over brain activation and pain learned by using real-time functional MRI", PROC NATL ACAD SCI USA, vol. 102, no. 51, 2005, pages 18626 - 18631, XP055191120, DOI: 10.1073/pnas.0505210102 |
| DRYSDALE ATGROSENICK LDOWNAR JDUNLOP KMANSOURI FMENG YFETCHO RNZEBLEY BOATHES DJETKIN A: "Resting-state connectivity biomarkers define neurophysiological subtypes of depression", NAT MED., vol. 23, no. 1, 2017, pages 28 - 38, XP055453891, DOI: 10.1038/nm.4246 |
| DRYSDALE, A T ET AL.: "Resting-state connectivity biomarkers define neurophysiological subtypes of depression", NAT MED., vol. 23, no. 1, January 2017 (2017-01-01), pages 28 - 38, XP055453891, DOI: 10.1038/nm.4246 * |
| ICHIKAWA, N ET AL.: "Identifying melancholic depression biomarker using whole-brain functional connectivity", IDENTIFIED 12 FCS IN THE MELANCHOLIC MDD, 3 April 2017 (2017-04-03), XP055637860, Retrieved from the Internet <URL:https://arxiv.org/abs/1704.01039v1> * |
| KAMITANI YTONG F: "Decoding the visual and subjective contents of the human brain", NAT NEUROSCI., vol. 8, 2005, pages 679 - 85 |
| NIKOLAUS WEISKOPF: "Real-time fMRI and its application to neurofeedback", NEUROIMAGE, vol. 62, 2012, pages 682 - 692, XP028928475, DOI: 10.1016/j.neuroimage.2011.10.009 |
| NORIAKI YAHATAJUN MORIMOTORYUICHIRO HASHIMOTOGIUSEPPE LISIKAZUHISA SHIBATAYUKI KAWAKUBOHITOSHI KUWABARAMIHO KURODATAKASHI YAMADAFU: "Nature Communications", MATHWORKS INC., article "A small number of abnormal brain connections predicts adult autism spectrum disorder" |
| OKITO YAMASHITAMASA AKI SATOTAKU YOSHIOKAFRANK TONGYUKIYASU KAMITANI: "Sparse Estimation automatically selects voxels relevant for the decoding of fMRI activity patterns", NEUROLMAGE, vol. 42, no. 4, 2008, pages 1414 - 1429 |
| PERROT ET AL., MED IMAGE ANAL, vol. 15, no. 4, 2011 |
| RAICHLE MEMACLEOD AMSNYDER AZ ET AL.: "A default mode of brain function", PROC NATL ACAD SCI USA, vol. 98, no. 2, 2001, pages 676 - 682 |
| See also references of EP3692909A4 * |
| SHIBASAKI CHIYO ET AL.: "MRI biomarker of mental illness", JAPANESE JOURNAL OF MOLECULAR PSYCHIATRY, vol. 17, no. 3, July 2017 (2017-07-01), pages 2 (154) - 7 (159), XP009520445, ISSN: 1345-9082 * |
| SHIMIZU, Y ET AL.: "Toward Probabilistic Diagnosis and Understanding of Depression Based on Functional MRI Data Analysis with Logistic Group LASSO", PLOS ONE, vol. 10, no. 5, 1 May 2015 (2015-05-01), pages e0123524, XP055589974 * |
| TZOURIO-MAZOYER ET AL., NEUROIMAGE, vol. 15, no. 1, 2002 |
| WITTEN DMTIBSHIRANI RT HASTIE: "A penalized matrix decomposition, with applications to sparse principal components and canonical correlation analysis", BIOSTATISTICS, vol. 10, no. 3, 2009, pages 515 - 534 |
| YAHATA, NATURE COMMUNICATIONS, vol. 7, pages 11254 |
| YAMADA, T ET AL.: "Resting-State Functional Connectivity-Based Biomarkers and Functional MRI-BasedNeurofeedback for Psychiatric Disorders: A Challengefor Developing Theranostic Biomarkers", INTERNATIONAL JOURNAL OF NEUROPSYCHOPHARMACOLOGY, vol. 20, no. 10, 17 July 2017 (2017-07-17), pages 769 - 781, XP055589968, ISSN: 1461-1457, DOI: 10.1093/ijnp/pyx059 * |
| YAMASHITA AHAYASAKA SLISI GICHIKAWA NTAKAMURA MOKADA GMORIMOTO JYAHATA NOKAMOTO YKAWATO M: "Common functional connectivity between depression and depressed mood", THE 37TH ANNUAL MEETING OF THE JAPANESE SOCIETY OF BIOLOGICAL PSYCHIATRY, 24 September 2015 (2015-09-24) |
Cited By (11)
| Publication number | Priority date | Publication date | Assignee | Title |
|---|---|---|---|---|
| EP3381361A4 (en) * | 2015-11-24 | 2019-12-04 | Advanced Telecommunications Research Institute International | Brain activity analysis device, brain activity analysis method, program, and biomarker device |
| US11382556B2 (en) | 2015-11-24 | 2022-07-12 | Advanced Telecommunications Research Institute International | Brain activity analyzing apparatus, brain activity analyzing method, program and biomarker apparatus |
| US10748644B2 (en) | 2018-06-19 | 2020-08-18 | Ellipsis Health, Inc. | Systems and methods for mental health assessment |
| US11120895B2 (en) | 2018-06-19 | 2021-09-14 | Ellipsis Health, Inc. | Systems and methods for mental health assessment |
| US11942194B2 (en) | 2018-06-19 | 2024-03-26 | Ellipsis Health, Inc. | Systems and methods for mental health assessment |
| TWI780396B (en) * | 2020-01-22 | 2022-10-11 | 長庚醫療財團法人嘉義長庚紀念醫院 | Evaluation method and evaluation system of suicidal ideation based on multi-feature MRI and artificial intelligence |
| CN112971781A (en) * | 2020-12-30 | 2021-06-18 | 杭州电子科技大学 | Network depression comparison method based on brain function |
| CN112971781B (en) * | 2020-12-30 | 2022-10-28 | 杭州电子科技大学 | Network depression contrast device based on brain function |
| CN113017650A (en) * | 2021-03-12 | 2021-06-25 | 南昌航空大学 | Electroencephalogram feature extraction method and system based on power spectral density image |
| CN115147417A (en) * | 2022-09-02 | 2022-10-04 | 之江实验室 | Function connection matrix processing system and device based on filtering method feature selection |
| CN115147417B (en) * | 2022-09-02 | 2022-11-15 | 之江实验室 | Function connection matrix processing system and device based on filtering method feature selection |
Similar Documents
| Publication | Publication Date | Title |
|---|---|---|
| JP7140348B2 (en) | Determination device, depressive symptom determination method, depressive symptom level determination method, depression patient stratification method, depressive symptom treatment effect determination method, and brain activity training device | |
| JP6497687B2 (en) | Brain activity analysis system and method | |
| JP6903518B2 (en) | Brain activity analysis system, brain activity analysis device, and brain activity analysis program | |
| Schuster et al. | Survival prediction in Amyotrophic lateral sclerosis based on MRI measures and clinical characteristics | |
| JP5641531B1 (en) | Brain activity training apparatus and brain activity training system | |
| WO2019069955A1 (en) | Differentiation device, differentiation method for depression symptoms, determination method for level of depression symptoms, stratification method for depression patients, determination method for effects of treatment of depression symptoms, and brain activity training device | |
| WO2020075737A1 (en) | Brain functional connectivity correlation value adjustment method, brain functional connectivity correlation value adjustment system, brain activity classifier harmonization method, brain activity classifier harmonization system, and brain activity biomarker system | |
| JP7247159B2 (en) | Brain activity classifier harmonization system and brain activity classifier program | |
| JP6875054B2 (en) | Brain activity training device, brain activity training method and brain activity training program | |
| JP7365496B2 (en) | Brain function connection correlation value clustering device, brain function connection correlation value clustering system, brain function connection correlation value clustering method, brain function connection correlation value classifier program, brain activity marker classification system, and brain function connection correlation value clustering classifier model | |
| JP7057995B2 (en) | Biomarkers and their use to detect the pathological profile of depression in mammals | |
| WO2022014682A1 (en) | Brain functional connectivity correlation value clustering device, brain functional connectivity correlation value clustering system, brain functional connectivity correlation value clustering method, brain functional connectivity correlation value classifier program, and brain activity marker classification system | |
| Abdulkadir | Brain MRI analysis and machine learning for diagnosis of neurodegeneration | |
| JP2024003782A (en) | Diagnosis support system, diagnosis support device, diagnosis support method, and support program for providing information on schizophrenia spectrum disorder | |
| Huizinga | Advanced Image Analysis for Modeling the Aging Brain |
Legal Events
| Date | Code | Title | Description |
|---|---|---|---|
| 121 | Ep: the epo has been informed by wipo that ep was designated in this application |
Ref document number: 18864859 Country of ref document: EP Kind code of ref document: A1 |
|
| NENP | Non-entry into the national phase |
Ref country code: DE |
|
| ENP | Entry into the national phase |
Ref document number: 2018864859 Country of ref document: EP Effective date: 20200504 |