WO2023042861A1 - Learning model generation method, image processing device, information processing device, training data generation method, and image processing method - Google Patents
Learning model generation method, image processing device, information processing device, training data generation method, and image processing method Download PDFInfo
- Publication number
- WO2023042861A1 WO2023042861A1 PCT/JP2022/034448 JP2022034448W WO2023042861A1 WO 2023042861 A1 WO2023042861 A1 WO 2023042861A1 JP 2022034448 W JP2022034448 W JP 2022034448W WO 2023042861 A1 WO2023042861 A1 WO 2023042861A1
- Authority
- WO
- WIPO (PCT)
- Prior art keywords
- region
- image
- dimensional image
- classification data
- data
- Prior art date
Links
- 238000000034 method Methods 0.000 title claims abstract description 90
- 238000012549 training Methods 0.000 title claims abstract description 65
- 238000012545 processing Methods 0.000 title claims description 95
- 230000010365 information processing Effects 0.000 title claims description 27
- 238000003672 processing method Methods 0.000 title claims description 3
- 238000010801 machine learning Methods 0.000 claims abstract description 17
- 230000008569 process Effects 0.000 claims description 40
- 238000013145 classification model Methods 0.000 description 56
- 238000010586 diagram Methods 0.000 description 38
- 238000012986 modification Methods 0.000 description 29
- 230000004048 modification Effects 0.000 description 29
- 238000004891 communication Methods 0.000 description 16
- 210000000056 organ Anatomy 0.000 description 12
- 210000004204 blood vessel Anatomy 0.000 description 9
- 230000006870 function Effects 0.000 description 8
- 238000012937 correction Methods 0.000 description 5
- 238000005401 electroluminescence Methods 0.000 description 5
- 238000006243 chemical reaction Methods 0.000 description 4
- 239000004973 liquid crystal related substance Substances 0.000 description 4
- 230000008859 change Effects 0.000 description 3
- 238000005259 measurement Methods 0.000 description 3
- 230000011218 segmentation Effects 0.000 description 3
- 239000000284 extract Substances 0.000 description 2
- 230000012447 hatching Effects 0.000 description 2
- 230000003902 lesion Effects 0.000 description 2
- 238000012014 optical coherence tomography Methods 0.000 description 2
- ORILYTVJVMAKLC-UHFFFAOYSA-N Adamantane Natural products C1C(C2)CC3CC1CC2C3 ORILYTVJVMAKLC-UHFFFAOYSA-N 0.000 description 1
- 230000003044 adaptive effect Effects 0.000 description 1
- 210000000013 bile duct Anatomy 0.000 description 1
- 239000008280 blood Substances 0.000 description 1
- 210000004369 blood Anatomy 0.000 description 1
- 230000002308 calcification Effects 0.000 description 1
- 239000000470 constituent Substances 0.000 description 1
- 230000007423 decrease Effects 0.000 description 1
- 230000007547 defect Effects 0.000 description 1
- 238000000605 extraction Methods 0.000 description 1
- 210000002837 heart atrium Anatomy 0.000 description 1
- 238000003709 image segmentation Methods 0.000 description 1
- 239000000203 mixture Substances 0.000 description 1
- 210000000277 pancreatic duct Anatomy 0.000 description 1
- 238000011176 pooling Methods 0.000 description 1
- 230000009467 reduction Effects 0.000 description 1
- 239000007787 solid Substances 0.000 description 1
- 230000003068 static effect Effects 0.000 description 1
- 238000012360 testing method Methods 0.000 description 1
- 238000013526 transfer learning Methods 0.000 description 1
- 210000000626 ureter Anatomy 0.000 description 1
- 210000003708 urethra Anatomy 0.000 description 1
Images


Classifications
-
- A—HUMAN NECESSITIES
- A61—MEDICAL OR VETERINARY SCIENCE; HYGIENE
- A61B—DIAGNOSIS; SURGERY; IDENTIFICATION
- A61B8/00—Diagnosis using ultrasonic, sonic or infrasonic waves
- A61B8/12—Diagnosis using ultrasonic, sonic or infrasonic waves in body cavities or body tracts, e.g. by using catheters
-
- G—PHYSICS
- G06—COMPUTING; CALCULATING OR COUNTING
- G06T—IMAGE DATA PROCESSING OR GENERATION, IN GENERAL
- G06T7/00—Image analysis
Definitions
- the present invention relates to a learning model generation method, an image processing device, an information processing device, a training data generation method, and an image processing method.
- Patent Document 1 A catheter system that acquires an image by inserting an image acquisition catheter into a hollow organ such as a blood vessel is used.
- the object is to provide a learning model generation method, etc. that can support understanding of images acquired by an image acquisition catheter.
- a learning model generation method acquires a two-dimensional image acquired using an image acquisition catheter, and each pixel constituting the two-dimensional image is a living tissue region and a lumen into which the image acquisition catheter is inserted. obtaining first classified data classified into a plurality of regions including a region and an extracavity region outside the biological tissue region; If it is determined that it has not reached, the two-dimensional image and the first classification data are associated and recorded in a training database, and if it is determined that it has reached, the internal creating a dividing line dividing a cavity region into a first region into which the image acquisition catheter is inserted and a second region reaching the edge of the two-dimensional image; Based on the data, second classification data is generated by distributing a probability of being the lumen region and a probability of being the extracavity region for each of the small regions constituting the lumen region in the first classification data.
- the two-dimensional A learning model is generated that outputs third classification data in which each pixel constituting an image is classified into a plurality of regions including the biological tissue region, the lumen region, and the extracavity region.
- FIG. 11 is an explanatory diagram illustrating a method of generating a third classification model; It is an explanatory view explaining the 1st classification data. It is an explanatory view explaining the composition of the information processor which creates training DB.
- FIG. 4 is an explanatory diagram for explaining a record layout of a first classification DB; FIG. It is an explanatory view explaining a record layout of training DB.
- FIG. 10 is an explanatory diagram for explaining a method of creating a dividing line;
- FIG. 10 is an explanatory diagram for explaining processing when an opening of a biological tissue region exists at an end portion in the theta direction in an RT format image; It is an explanatory view explaining the 2nd classification data.
- FIG. 11 is an explanatory diagram illustrating a method of generating a third classification model; It is an explanatory view explaining the 1st classification data. It is an explanatory view explaining the composition of the information processor which creates training DB.
- FIG. 4 is an explanatory diagram
- FIG. 9 is a schematic diagram showing an enlarged 9 pixels at a location corresponding to the B section in FIG. 8 in the first classified data;
- FIG. 9 is a schematic diagram showing enlarged 9 pixels of a B portion in FIG. 8 ;
- It is an explanatory view explaining the 2nd classification data.
- It is an explanatory view explaining the 2nd classification data.
- It is an explanatory view explaining the 2nd classification data.
- 4 is a flowchart for explaining the flow of processing of a program;
- FIG. 11 is a flow chart for explaining the flow of processing of a subroutine for creating parting lines;
- FIG. FIG. 11 is a flowchart for explaining the flow of processing of a subroutine for creating second classification data;
- FIG. 11 is an explanatory diagram illustrating the configuration of an information processing device that generates a third classification model
- 4 is a flowchart for explaining the processing flow of a program that performs machine learning
- It is an explanatory view explaining an open-and-close decision model.
- FIG. 10 is an explanatory diagram illustrating a state in which a plurality of parting line candidates are created for the first classification data displayed in RT format
- FIG. 19B is an explanatory diagram illustrating a state in which FIG. 19A is coordinate-converted into the XY format
- FIG. 12 is a flowchart for explaining the flow of processing of a subroutine for creating a dividing line according to modification 1-2
- FIG. 12 is a flowchart for explaining the processing flow of the program of modification 3-1; FIG. FIG.
- FIG. 11 is an explanatory diagram illustrating the configuration of a catheter system according to Embodiment 4;
- FIG. 13 is a flowchart for explaining the flow of processing of a program according to Embodiment 4;
- FIG. 11 is a functional block diagram of an information processing device according to a fifth embodiment;
- FIG. 12 is a functional block diagram of an image processing apparatus according to Embodiment 6;
- FIG. 12 is a functional block diagram of an image processing apparatus according to Embodiment 7;
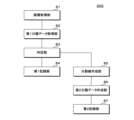
- FIG. 1 is an explanatory diagram illustrating a method of generating the third classification model 33.
- a large number of sets of two-dimensional images 58 and first classification data 51 are recorded in the first classification DB 41 .
- the two-dimensional image 58 of the present embodiment is a tomographic image acquired using the radial scanning image acquisition catheter 28 (see FIG. 25).
- the two-dimensional image 58 is an ultrasonic tomographic image will be described as an example.
- the two-dimensional image 58 may be a tomographic image obtained by OCT (Optical Coherence Tomography) using near-infrared light.
- the two-dimensional image may be a tomographic image acquired using a linear scanning or sector operating image acquisition catheter 28 .
- a two-dimensional image 58 is shown in the so-called RT format, which is formed by arranging scanning line data in parallel in the order of scanning angles.
- the left end of the two-dimensional image 58 is the image acquisition catheter 28 .
- the horizontal direction of the two-dimensional image 58 corresponds to the distance from the image acquisition catheter 28, and the vertical direction of the two-dimensional image 58 corresponds to the scanning angle.
- the first classified data 51 is data obtained by classifying each pixel constituting the two-dimensional image 58 into a biological tissue region 566, a lumen region 563, and an extracavity region 567.
- the lumen area 563 is classified into a first lumen area 561 into which the image acquisition catheter 28 is inserted and a second lumen area 562 into which the image acquisition catheter 28 is not inserted.
- Each pixel is associated with a label that indicates the classified area.
- the portion associated with the label of the biological tissue region 566 is hatched in a grid pattern, the portion associated with the label of the first lumen region 561 is not hatched, and the label of the second lumen region 562 is associated.
- the portion associated with the label of the extracavity region 567 is indicated by hatching sloping to the right.
- a label may be associated with each small region in which a plurality of pixels forming the two-dimensional image 58 are collected.
- Tissue region 566 corresponds to a hollow organ wall, such as a blood vessel wall or a heart wall.
- the first lumen region 561 is the region inside the lumen organ into which the image acquisition catheter 28 is inserted. That is, the first lumen region 561 is a region filled with blood.
- a second lumen region 562 is a region inside another lumen organ that exists in the vicinity of a blood vessel or the like into which the image acquisition catheter 28 is inserted.
- second lumen region 562 may be a region inside a blood vessel branching from the blood vessel into which image acquisition catheter 28 is inserted, or inside another blood vessel proximate to the blood vessel into which image acquisition catheter 28 is inserted. area.
- the second lumenal region 562 may also be a region inside a lumenal organ other than the circulatory system, such as, for example, the bile duct, pancreatic duct, ureter, or urethra.
- the extracavity region 567 is the region outside the biological tissue region 566 . Even an inner region such as an atrium, a ventricle, or a large blood vessel is classified as an extracavity region 567 if it does not fit within the display range of the two-dimensional image 58 .
- the first classification data 51 includes, for example, the image acquisition catheter 28, an instrument region in which a guide wire inserted together with the image acquisition catheter 28, and a lesion such as calcification are depicted. Labels corresponding to various regions, such as lesion regions, may also be included. A method for creating the first classification data 51 from the two-dimensional image 58 will be described later.
- the first lumen region 561 is continuous from the right end to the left end of the first classified data 51. That is, the first lumen region 561 is not surrounded by the living tissue region 566 because the opening exists in the living tissue region 566 .
- the state in which the first lumen region 561 is continuous from the right end to the left end of the first classification data 51 may be described as the "open" state of the first lumen region 561 .
- a state in which the first lumen region 561 is not continuous to the left end of the first classification data 51 may be described as a "closed" state of the first lumen region 561 .
- the first lumen area 561 is in an open state because the body tissue area 566 is not properly extracted and is an opening in the A part.
- the body tissue area 566 is not properly extracted and is an opening in the A part.
- an opening exists in a part of the living tissue region 566.
- first lumen region 561 in the first classification data 51 When the first lumen region 561 in the first classification data 51 is in an open state due to the presence of an opening in the biological tissue region 566, the opening of the biological tissue region 566 in the first lumen region 561
- the outer region is not important information for understanding the structure of the luminal organ. Therefore, first lumen region 561 preferably does not include regions outside the opening.
- the measurement result when automatically measuring the area, volume, perimeter, or the like of each region, if the region outside the opening of the biological tissue region 566 is included in the first lumen region 561, the measurement result will be erroneous. may occur. Furthermore, when creating a three-dimensional image using the three-dimensional scanning image acquisition catheter 28, the labeled region of the first lumen region 561 existing outside the opening of the biological tissue region 566 However, it becomes like noise on a three-dimensional image when grasping the structure of a hollow organ. Therefore, it becomes difficult for the user to grasp the three-dimensional shape.
- a dividing line dividing the first lumen region 561 into a first region 571 closer to the image acquisition catheter 28 and a second region 572 farther from the image acquisition catheter 28 61 is automatically created.
- a dividing line 61 is a line on which it is assumed that there is a biological tissue region 566 separating the first lumen region 561 and the extraluminal region 567 . A specific example of the method of creating the dividing line 61 will be described later.
- the probability of being the first lumen region 561 and the probability of being the extraluminal region 567 are automatically distributed to create the second classification data 52. be done.
- the sum of the probability of being the first lumen region 561 and the probability of being the extraluminal region 567 is one.
- the probability of being the first lumen region 561 and the probability of being the extraluminal region 567 are almost equal.
- the probability of being the first lumen region 561 increases as the distance from the dividing line 61 to the image acquisition catheter 28 increases.
- the probability of being in the extraluminal region 567 increases as the distance from the dividing line 61 to the side opposite to the image acquisition catheter 28 increases. A specific example of the probability distribution method will be described later.
- the second classification data 52 is created by.
- the set of two-dimensional image 58 and second classified data 52 constitutes a set of training data.
- a set of the two-dimensional image 58 and the first classification data 51 recorded in the first classification DB 41 the data in which the first lumen region 561 has not reached the right end of the first classification data 51 is classified as the second classification data.
- Data 52 is not created.
- a set of the two-dimensional image 58 and the first classified data 51 constitutes a set of training data.
- a training DB 42 (see FIG. 3) that records a large number of sets of training data is automatically created.
- Machine learning is performed using the training DB 42 to generate the third classification model 33 that outputs the third classification data 53 when the two-dimensional image 58 is input.
- a boundary between the first lumen region 561 and the extracavity region 567 is created at a location where the biological tissue region 566 does not exist.
- the generated third classification model 33 is an example of the learning model of this embodiment.
- the third classification model 33 for which machine learning has been completed may be referred to as a learned model.
- the catheter system 10 (Fig. 25) assists the user in quickly understanding the structure of the site being observed. ) can be provided. Furthermore, it is possible to provide the catheter system 10 that automatically measures the area and displays the three-dimensional image appropriately without the user performing complicated correction work.
- FIG. 2 is an explanatory diagram for explaining the first classification data 51.
- the first classification model 31 that creates the first classification data 51 based on the two-dimensional image 58 includes two components, the label classification model 35 and the classification data converter 39 .
- the label classification model 35 is a model that assigns a label associated with a subject depicted in the small area, such as each pixel, that constitutes the two-dimensional image 58 to the small area.
- the label classification model 35 is generated by a known machine learning technique such as semantic segmentation.
- the label data 54 includes a label indicating a living tissue region 566 indicated by grid hatching and a label indicating a non-living tissue region 568 which is the other region.
- the label data 54 is input to the classification data conversion unit 39, and the first classification data 51 described above is output. Specifically, of the non-biological tissue region 568 , the label of the region surrounded only by the biological tissue region 566 is converted to the second lumen region 562 . Of the non-biological tissue region 568 , the region in contact with the image acquisition catheter 28 , which is the left end of the first classified data 51 (center in the radial direction in the RT format image), is converted into the first lumen region 561 .
- non-biological tissue region 568 a region that has not been converted to either the first lumen region 561 or the second lumen region 562, specifically, the surrounding area is the biological tissue region 566 and the outer edge in the radial direction in the RT format image. (right end in label data 54 shown in FIG. 2) is transformed into extraluminal region 567 . Since the upper and lower ends of the RT format image in the theta direction are connected, in the example shown in FIG. being surrounded.
- the two-dimensional image 58 in RT format and the first classified data 51 can be converted into XY format by coordinate conversion. Since the conversion method between the RT format image and the XY format image is well known, the explanation is omitted.
- the label classification model 35 may be a model that receives the two-dimensional image 58 in XY format and outputs the label data 54 in XY format. However, processing the two-dimensional image 58 in the XY format is less affected by interpolation processing or the like when converting from the RT format to the XY format, so more appropriate label data 54 is created.
- the configuration of the first classification model 31 described using FIG. 2 is an example.
- the first classification model 31 may be a model trained to accept the input of the two-dimensional image 58 and directly output the first classification data 51 .
- the label classification model 35 is not limited to models using machine learning.
- the label classification model 35 may be a model that extracts the biological tissue region 566 based on a known image processing technique such as edge extraction.
- an expert skilled in interpretation of the two-dimensional image 58 may color the two-dimensional image 58 for each region to create the first classification data 51.
- a set of the two-dimensional image 58 and the first classification data 51 thus created can be used as training data when generating the first classification model 31 or the label classification model 35 by machine learning.
- FIG. 3 is an explanatory diagram illustrating the configuration of the information processing device 200 that creates the training DB.
- the information processing device 200 includes a control section 201, a main memory device 202, an auxiliary memory device 203, a communication section 204, a display section 205, an input section 206 and a bus.
- the control unit 201 is an arithmetic control device that executes the program of this embodiment.
- One or a plurality of CPUs (Central Processing Units), GPUs (Graphics Processing Units), multi-core CPUs, or the like is used for the control unit 201 .
- the control unit 201 is connected to each hardware unit forming the information processing apparatus 200 via a bus.
- the main storage device 202 is a storage device such as SRAM (Static Random Access Memory), DRAM (Dynamic Random Access Memory), flash memory, or the like.
- the main storage device 202 temporarily stores information necessary during the processing performed by the control unit 201 and the program being executed by the control unit 201 .
- the auxiliary storage device 203 is a storage device such as SRAM, flash memory, hard disk, or magnetic tape.
- the auxiliary storage device 203 stores a first classification DB (Database) 41, a training DB 42, programs to be executed by the control unit 201, and various data necessary for executing the programs.
- Communication unit 204 is an interface that performs communication between information processing apparatus 200 and a network.
- the first classification DB 41 and the training DB 42 may be stored in an external large-capacity storage device or the like connected to the information processing device 200 .
- the display unit 205 is, for example, a liquid crystal display panel or an organic EL (Electro Luminescence) panel.
- Input unit 206 is, for example, a keyboard and a mouse.
- a touch panel may be configured by stacking the input unit 206 on the display unit 205 .
- the display unit 205 may be a display device connected to the information processing device 200 .
- the information processing device 200 does not have to include the display unit 205 and the input unit 206 .
- the information processing device 200 is a general-purpose personal computer, tablet, large computer, or a virtual machine running on a large computer.
- the information processing apparatus 200 may be configured by hardware such as a plurality of personal computers or large-scale computers that perform distributed processing.
- the information processing device 200 may be configured by a cloud computing system or a quantum computer.
- FIG. 4 is an explanatory diagram for explaining the record layout of the first classification DB 41.
- the first classification DB 41 is a DB in which the two-dimensional image 58 and the first classification data 51 are associated and recorded.
- the first classification DB 41 has a two-dimensional image field and a first classification data field.
- a two-dimensional image 58 is recorded in the two-dimensional image field.
- First classification data 51 is recorded in the first classification data field.
- the first classification DB 41 stores, for example, two-dimensional images 58 collected from many medical institutions, first classification data 51 created based on the two-dimensional images 58, for example, by the method described using FIG. A number of pairs have been recorded.
- the first classification DB 41 has one record for one two-dimensional image 58 .
- FIG. 5 is an explanatory diagram for explaining the record layout of the training DB 42.
- the training DB 42 is a DB in which the two-dimensional image 58 and classification data are associated and recorded.
- the training DB 42 has a 2D image field and a classification data field.
- a two-dimensional image 58 is recorded in the two-dimensional image field.
- Classification data associated with the two-dimensional image 58 is recorded in the classification data field.
- the 2D image 58 recorded in the 2D image field of the training DB 42 is the same as the 2D image 58 recorded in the 2D image field of the first classification DB 41 .
- the classification data recorded in the classification data field of the training DB 42 is the first classification data 51 recorded in the first classification data field of the first classification DB 41, or the first classification data 51 created based on the first classification data 51. 2 classification data 52 .
- the training DB 42 has one record for one two-dimensional image 58 .
- FIG. 6 is an explanatory diagram explaining how to create the dividing line 61.
- FIG. FIG. 6 shows the first classification data 51 with the first lumen region 561 open.
- a living tissue region 566 is depicted separately in two parts, an upper part and a lower part.
- five parting line candidates 62 are created between the upper body tissue region 566 and the lower body tissue region 566 .
- the positions of the dividing line candidates 62 are arbitrary as long as they connect the upper and lower body tissue regions 566 .
- the control unit 201 selects a first point at a random position within the upper biological tissue region 566 and selects a second point at a random position within the lower biological tissue region 566 .
- the control unit 201 determines, as a dividing line candidate 62 , a portion sandwiched between the upper biological tissue region 566 and the lower biological tissue region 566 on the straight line connecting the first point and the second point.
- the first classification data 51 selects one dividing line 61 from a plurality of dividing line candidates 62 .
- the control unit 201 selects the shortest parting line candidate 62 from among the plurality of parting line candidates 62 as the parting line 61 .
- the control unit 201 may randomly select one of the parting line candidates 62 as the parting line 61 from among the plurality of parting line candidates 62 . A modification of the method for determining the dividing line 61 will be described later.
- FIG. 7 is an explanatory diagram for explaining processing when an opening of the biological tissue region 566 exists at the edge in the theta direction (the edge in the vertical direction in the first classification data 51 shown in FIG. 7) in the RT format image.
- the left side of FIG. 7 shows an example of an RT image when the scanning angle at which the display of the RT format image is started matches the direction in which the living tissue region 566 can be seen through the opening.
- a body tissue region 566 is drawn as a mass and does not touch the upper and lower edges of the RT format image. In such a state, it is difficult to create the dividing line candidate 62 .
- the control unit 201 cuts such an RT format image along a cutting line 641 parallel to the scanning line, turns it upside down, and joins it together with a pasting line 642, thereby converting it into an RT image as shown on the right side of FIG. .
- the control unit 201 can create the dividing line candidate 62 using the procedure described using FIG.
- the control unit 201 can also change the scanning angle at which the display of the RT format image is started, instead of cutting the RT format image and pasting it together. 58 is obtained.
- FIGS. 8 to 12 are explanatory diagrams explaining the second classification data 52.
- FIG. FIG. 9A is a schematic diagram showing enlarged 9 pixels in the first classified data 51 corresponding to the B section in FIG. Each pixel is associated with a label such as "1", "3".
- "1" is the label indicating the first lumen region 561
- "2” is the label indicating the extracavity region 567
- "3" is the label indicating the biological tissue region 566, respectively.
- FIG. 9B is a schematic diagram showing an enlarged 9 pixels of the B part in FIG. 9A and 9B show pixels at the same location.
- the label "1:80% 2:20%" associated with the upper left pixel indicates "80% probability of first lumen region 561, 20% probability of extraluminal region 567 percentage”.
- the probability that it is the first lumen region 561 and the probability that it is the extraluminal region 567 are distributed so that the sum of the two is 100%.
- the "3: 100%" label associated with the lower right pixel indicates "100% probability of being tissue region 566".
- the pixel associated with the label "3" in FIG. 9A is associated with the label "3:100%” in FIG.
- one pixel can be associated with a plurality of label probabilities.
- FIG. 10 schematically shows three target pixels 67 and corresponding connection lines 66 .
- a connecting line 66 is a line that connects the target pixel 67 and the dividing line 61 .
- a solid connecting line 66 indicates an example of a connecting line 66 drawn vertically from the target pixel 67 toward the dividing line 61 .
- a two-dot chain connection line 66 is an example of a connection line 66 drawn obliquely from the target pixel 67 toward the dividing line 61 .
- a dashed connection line 66 is an example of a connection line 66 that is drawn from the target pixel 67 to the connection line 66 by a polygonal line that is bent once.
- the control unit 201 sequentially determines each pixel constituting the first lumen region 561 as the target pixel 67, creates the connection line 66 so as not to cross the living tissue region 566, and calculates the length of the connection line 66. .
- the vertical connection line 66 indicated by the solid line has the highest priority when creating the connection line 66 . If the target pixel 67 perpendicular to the dividing line 61 cannot be created from the target pixel 67, the control unit 201 creates the connecting line 66 so as to be the shortest straight line that does not cross the living tissue region 566, as illustrated by the two-dot chain line. and calculate its length.
- the control unit 201 creates the connecting line so that it is the shortest polygonal line that does not cross the living tissue region 566 as illustrated by the dashed line. 66 and calculate its length. If the connecting line 66 cannot be created by one polygonal line, the control unit 201 creates the connecting line 66 of two or more polygonal lines.
- FIG. 11 is an example of a graph showing the relationship between the length of the connecting line 66 and the probability of being the first lumen region 561 and the probability of being the extraluminal region 567 .
- the horizontal axis indicates the length of the connection line 66 . “0” on the horizontal axis indicates that it is on the dividing line 61 .
- the positive direction of the horizontal axis indicates the length of the connecting line 66 belonging to the region on the right side of the dividing line 61, that is, on the far side from the image acquisition catheter 28.
- the negative direction of the horizontal axis indicates the length of the connecting line 66 belonging to the area on the left side of the dividing line 61 , that is, on the side closer to the image acquisition catheter 28 .
- the probability of being the first lumen region 561 and the probability of being the extracavity region 567 on the virtual line S drawn perpendicular to the dividing line 61 in FIG. 8 are represented by the graph shown in FIG.
- the origin of the horizontal axis corresponds to the intersection of the dividing line 61 and the virtual line S.
- the vertical axis in FIG. 11 indicates probability.
- the solid line indicates the probability of being the first lumen region 561 in percent.
- the dashed line indicates the probability of extraluminal region 567 in percent.
- the probabilities shown in FIG. 11 are, for example, sigmoid curves shown in formulas (1) to (4).
- FIG. 12 is a modified example of a graph showing the relationship between the length of the connecting line 66 and the probability of being the first lumen region 561 and the probability of being the extraluminal region 567 .
- the meanings of the vertical axis and horizontal axis, and the solid line graph and broken line graph are the same as in FIG. B shown on the horizontal axis is a constant.
- the probability of being the first lumen region 561 and the probability of being the extraluminal region 567 are not limited to the graphs shown in FIGS.
- the parameters A and B can be chosen arbitrarily.
- the left side of the dividing line 61 may have a 100% probability of being the first region 571
- the right side of the dividing line 61 may have a 100% probability of being the extracavity region 567 .
- FIG. 13 is a flowchart explaining the flow of program processing.
- the control unit 201 acquires a set of first classification records from the first classification DB 41 (step S501). By step S501, the control unit 201 realizes the function of the image acquisition unit and the function of the first classification data acquisition unit according to this embodiment.
- the control unit 201 determines whether or not the first lumen region 561 is closed (step S502). By step S502, the control unit 201 implements the function of the determination unit of this embodiment. If it is determined that the state is closed (YES in step S502), the control unit 201 creates a new record in the training DB 42, and combines the two-dimensional image 58 and the first classification data 51 recorded in the record acquired in step S501. are recorded (step S503).
- the control unit 201 starts a subroutine for creating parting lines (step S504).
- the dividing line creation subroutine divides the open first lumen region 561 into a first region 571 closer to the image acquisition catheter 28 and a second region 572 farther from the image acquisition catheter 28 .
- This is a subroutine for creating a dividing line 61 that divides the .
- the control unit 201 realizes the function of the parting line creating unit of the present embodiment. The processing flow of the dividing line creation subroutine will be described later.
- the control unit 201 activates a subroutine for creating the second classification data (step S505).
- the second classification data creation subroutine distributes the probability of being the first lumen region 561 and the probability of being the extraluminal region 567 for each small region that constitutes the first lumen region 561 of the first classification data 51.
- This is a subroutine for creating the second classification data 52.
- the control unit 201 realizes the function of the second classification data creation unit of the present embodiment by the second classification data creation unit. The processing flow of the second classification data creation subroutine will be described later.
- the control unit 201 creates a new record in the training DB 42 and records the two-dimensional image 58 and the second classification data 52 (step S506).
- the two-dimensional image 58 is the two-dimensional image 58 recorded in the record obtained in step S501.
- the second classified data 52 is the second classified data 52 created in step S505.
- control unit 201 determines whether or not to end the processing (step S507). For example, the control unit 201 determines to end the process when all the records recorded in the first classification DB 41 have been processed. The control unit 201 may determine to end the process when a predetermined number of records have been processed.
- control unit 201 If it is determined not to end the process (NO in step S507), the control unit 201 returns to step S501. If it is determined to end the process (YES in step S507), the control unit 201 ends the process.
- FIG. 14 is a flowchart for explaining the processing flow of the dividing line creation subroutine.
- the dividing line creation subroutine divides the open first lumen region 561 into a first region 571 closer to the image acquisition catheter 28 and a second region 572 farther from the image acquisition catheter 28 .
- This is a subroutine for creating a dividing line 61 that divides the .
- the control unit 201 determines whether the body tissue region 566 included in the first classification data 51 is in contact with the upper and lower edges of the RT format image (step S511). If it is determined that they are not in contact (NO in step S511), the control unit 201 cuts the first classified data 51 along the cutting line 641 passing through the biological tissue region 566 as described using FIG. Replace (step S512).
- control unit 201 determines whether they are in contact (YES in step S511), or after step S512 is completed.
- the control unit 201 selects a first point at a random position within the upper biological tissue region 566 .
- the control unit 201 selects a second point at a random position within the lower tissue region 566 .
- the control unit 201 determines, as a dividing line candidate 62 , a portion sandwiched between the upper biological tissue region 566 and the lower biological tissue region 566 on the straight line connecting the first point and the second point.
- the control unit 201 may create the dividing line candidates 62 so as to cover combinations of each pixel in the upper biological tissue region 566 and each pixel in the lower biological tissue region 566 .
- the control unit 201 calculates a predetermined parameter regarding the parting line candidate 62 (step S514).
- the parameter is, for example, the length of the parting line candidate 62, the area of the image acquisition catheter 28 rather than the parting line candidate 62 in the first lumen region 561, the inclination of the parting line candidate 62, or the like.
- the control unit 201 associates the start point and end point of the parting line candidate 62 with the calculated parameters, and temporarily records them in the main storage device 202 or the auxiliary storage device 203 (step S515).
- Table 1 shows an example of data recorded in step S515 in tabular form.
- the control unit 201 determines whether or not to end the process (step S516). For example, the control unit 201 determines to end the process when a predetermined number of dividing line candidates 62 are created. The control unit 201 may determine to end the process when the parameter calculated in step S514 satisfies a predetermined condition.
- step S516 If it is determined not to end (NO in step S516), the control unit 201 returns to step S513. If it is determined to end (YES in step S516), the control unit 201 selects the dividing line 61 from the dividing line candidates 62 recorded in step S515 (step S517). After that, the control unit 201 terminates the processing.
- control unit 201 calculates the length of the parting line candidate 62 in step S514, and selects the shortest parting line candidate 62 in step S517.
- the control unit 201 may calculate the inclination of the parting line candidate 62 in step S514, and select the parting line candidate 62 whose angle with the R axis is closest to the vertical in step S517.
- the control unit 201 may calculate a plurality of parameters in step S514 and select the dividing line 61 based on the result of computing them.
- step S517 the user may select the dividing line 61 from a plurality of dividing line candidates 62.
- the control unit 201 superimposes a plurality of dividing line candidates 62 on the two-dimensional image 58 or the first classification data 51 and outputs the result to the display unit 205 .
- the user operates the input unit 206 to select the dividing line candidate 62 that is determined to be appropriate.
- the control unit 201 determines the dividing line 61 based on the user's selection.
- FIG. 15 is a flowchart for explaining the processing flow of the second classification data creation subroutine.
- the second classification data creation subroutine distributes the probability of being the first lumen region 561 and the probability of being the extraluminal region 567 for each small region that constitutes the first lumen region 561 of the first classification data 51.
- This is a subroutine for creating the second classification data 52.
- the control unit 201 selects one pixel forming the first classified data 51 (step S521).
- the control unit 201 acquires the label associated with the selected pixel (step S522).
- the control unit 201 determines whether the label corresponds to the first lumen region 561 (step S523).
- step S523 If it is determined that the control unit 201 corresponds to the first lumen region 561 (YES in step S523), the control unit 201 connects the pixel selected in step S521 and the dividing line 61 without passing through the biological tissue region 566. 66 is calculated (step S524).
- the control unit 201 calculates the probability that the pixel selected in step S521 is the first lumen region 561 based on the relationship between the length of the connection line 66 and the probability described using FIG. 11 or 12, for example. (step S525).
- step S526 calculates the probability that the pixel selected in step S521 is the extraluminal region 567.
- control unit 201 associates the position of the pixel selected in step S521 with the probability calculated in steps S525 and S526, and records them in the second classification data 52 (step S527).
- step S527 the control unit 201 implements the function of the second recording unit of the present embodiment.
- control unit 201 determines whether it is determined not to correspond to the first lumen region 561 (NO in step S523). If it is determined not to correspond to the first lumen region 561 (NO in step S523), the control unit 201 indicates that the position of the connected pixel in step S521 and the label acquired in step S522 have a probability of 100%. are associated with each other and recorded in the second classification data 52 (step S528). By step S528, the control unit 201 implements the function of the first recording unit of this embodiment.
- the control unit 201 determines whether or not the processing of all pixels of the first classified data 51 has been completed (step S529). If it is determined that the processing has not ended (NO in step S529), the control unit 201 returns to step S521. If it is determined that the process has ended (YES in step S529), the control unit 201 ends the process.
- control unit 201 may select a small area made up of a plurality of pixels, and thereafter perform processing for each small area.
- the control unit 201 processes the entire small region based on the label associated with the pixel at a specific position in the small region, for example.
- control unit 201 executes the programs and subroutines described using FIGS. 13 to 15 to create the training DB 42 based on the first classification DB 41.
- the training DBs 42 respectively created by a plurality of medical institutions may be integrated into one database to create a large-scale training DB 42 .
- FIG. 16 is an explanatory diagram illustrating the configuration of the information processing device 210 that generates the third classification model.
- the information processing device 210 includes a control unit 211, a main storage device 212, an auxiliary storage device 213, a communication unit 214, a display unit 215, an input unit 216, and a bus.
- the control unit 211 is an arithmetic control device that executes the program of this embodiment.
- One or a plurality of CPUs, GPUs, multi-core CPUs, TPUs (Tensor Processing Units), or the like is used for the control unit 211 .
- the control unit 211 is connected to each hardware unit forming the information processing apparatus 210 via a bus.
- the main storage device 212 is a storage device such as SRAM, DRAM, and flash memory. Main storage device 212 temporarily stores information necessary during processing performed by control unit 211 and a program being executed by control unit 211 .
- the auxiliary storage device 213 is a storage device such as SRAM, flash memory, hard disk, or magnetic tape.
- the auxiliary storage device 213 stores the training DB 42, programs to be executed by the control unit 211, and various data necessary for executing the programs.
- the training DB 42 may be stored in an external large-capacity storage device or the like connected to the information processing device 210 .
- the communication unit 214 is an interface that performs communication between the information processing device 210 and the network.
- Display unit 215 is, for example, a liquid crystal display panel or an organic EL panel.
- Input unit 216 is, for example, a keyboard and a mouse.
- the information processing device 210 is a general-purpose personal computer, a tablet, a large computer, a virtual machine running on a large computer, or a quantum computer.
- the information processing apparatus 210 may be configured by hardware such as a plurality of personal computers or large computers that perform distributed processing.
- the information processing device 210 may be configured by a cloud computing system or a quantum computer.
- FIG. 17 is a flowchart explaining the processing flow of a program that performs machine learning.
- an unlearned model such as a U-Net structure that implements semantic segmentation is prepared.
- the U-Net structure includes multiple encoder layers followed by multiple decoder layers.
- Each encoder layer includes a pooling layer and a convolutional layer.
- Semantic segmentation assigns a label to each pixel that makes up the input image.
- the unlearned model may be a Mask R-CNN model or any other model that realizes image segmentation.
- the label classification model 35 described using FIG. 2 may be used for the unlearned third classification model 33.
- the machine of the third classification model 33 can be learned with less training data and less number of times of learning. Learning can be realized.
- the control unit 211 acquires a training record from the training DB 42 (step S541).
- the control unit 211 inputs the two-dimensional image 58 included in the acquired training record to the third classification model 33 being trained, and acquires output data.
- data output from the third classification model 33 during training is referred to as training classification data.
- the third classification model 33 during training is an example of the learning model during training of the present embodiment.
- the control unit 211 adjusts the parameters of the third classification model 33 so that the difference between the second classification data 52 included in the training record acquired in step S541 and the during-training classification data is reduced (step S543).
- the difference between the second classified data 52 and the training classified data is evaluated, for example, based on the number of pixels with different labels between the two.
- a known machine learning method such as SGD (Stochastic Gradient Descent) or Adam (Adaptive Moment estimation) can be used.
- the control unit 211 determines whether or not to end parameter adjustment (step S544). For example, when learning is repeated a predetermined number of times defined by the hyperparameter, the control unit 211 determines to end the process.
- the control unit 211 may acquire test data from the training DB 42, input it to the third classification model 33 being trained, and determine to end the process when an output with a predetermined accuracy is obtained.
- control unit 211 If it is determined not to end the process (NO in step S544), the control unit 211 returns to step S541. If it is determined to end the process (YES in step S544), the control unit 211 records the adjusted parameters in the auxiliary storage device 213 (step S545). After that, the control unit 211 terminates the process. With the above, the learning of the third classification model 33 is completed.
- a third classification model 33 can be provided that distinguishes and classifies the first luminal region 561 , and the extraluminal region 567 outside the tissue region 566 .
- the cross-sectional area, volume and perimeter of the first lumen region 561 can be appropriately automatically measured.
- a three-dimensional image with little noise can be generated by classifying the two-dimensional images 58 acquired in time series using the image acquisition catheter 28 for three-dimensional scanning using the third classification model 33 .
- FIG. 18 is an explanatory diagram for explaining the open/close determination model.
- the open/close determination model 37 receives the input of the two-dimensional image 58 and outputs the probability that the first lumen region 561 is open and the probability that it is closed. In FIG. 18, it is output that the probability of being in the open state is 90% and the probability of being in the closed state is 10%.
- the open/close determination model 37 is generated by machine learning using training data in which a large number of sets are recorded in association with the two-dimensional image 58 and whether the first lumen region 561 is open or closed. .
- the control unit 201 inputs the two-dimensional image 58 to the open/close determination model 37 in step S502 described using FIG.
- the control unit 201 determines that the first lumen region 561 is in an open state (YES in step S502) when the probability of being in an open state exceeds a predetermined threshold.
- the open/close determination model 37 is an example of the arrival determination model of the present embodiment.
- FIG. 19 is an explanatory diagram for explaining the method of selecting the dividing line 61 of Modification 1-2.
- FIG. 19A is an explanatory diagram illustrating a state in which a plurality of parting line candidates 62 are created for the first classification data 51 displayed in RT format. Between the upper biological tissue region 566 and the lower biological tissue region 566, five dividing line candidates 62 from dividing line candidate 62a to dividing line candidate 62e are created. All of the parting line candidates 62 are straight lines. Note that the dividing line candidate 62 illustrated in FIG. 19 is an example for explanation.
- FIG. 19B is an explanatory diagram illustrating a state in which FIG. 19A is coordinate-converted into the XY format.
- the central C indicates the center of the first classification data 51, that is, the central axis of the image acquisition catheter 28.
- both ends of the dividing line candidate 62d and the dividing line candidate 62e are connected with a straight line, they intersect with the biological tissue region 566.
- the dividing line candidate 62 that intersects the biological tissue region 566 when the coordinates are transformed into the XY format is not selected as the dividing line 61 .
- Parting line candidates 62a to 62c do not intersect living tissue region 566 when both ends are connected by straight lines. Any of these dividing line candidates 62 may be selected as the dividing line 61 .
- the parameters for each split line candidate 62 may be determined on the XY format image.
- FIG. 20 is a flow chart for explaining the process flow of the dividing line creation subroutine of modification 1-2.
- the dividing line creation subroutine divides the open first lumen region 561 into a first region 571 closer to the image acquisition catheter 28 and a second region 572 farther from the image acquisition catheter 28 .
- This is a subroutine for creating a dividing line 61 that divides the .
- the subroutine of FIG. 20 is used instead of the subroutine described using FIG.
- control unit 201 converts the first classification data 51 on which the parting line candidate 62 is superimposed into the XY format (step S551).
- the control unit 201 creates a straight line connecting both ends of the dividing line candidate 62 converted into the XY format (step S552).
- the control unit 201 determines whether or not the created straight line passes through the biological tissue region 566 (step S553). If it is determined to pass (YES in step S553), the control unit 201 returns to step S513.
- control unit 201 calculates a predetermined parameter regarding the dividing line candidate 62 (step S514).
- the control unit 201 may calculate the parameters in RT format or in XY format.
- the control unit 201 may calculate parameters in both the RT format and the XY format. Since subsequent processing is the same as the processing flow of the program described using FIG. 14, description thereof is omitted.
- the images that users normally use in clinical practice are XY format images. According to this modification, it is possible to automatically generate the dividing line 61 that matches the feeling of the user observing the XY image.
- Modification 1-3 This modification relates to a method of selecting a dividing line 61 from a plurality of dividing line candidates 62 in step S517 of the flowchart described using FIG. The description of the parts common to Modification 1-2 is omitted.
- step S514 the same parameter is calculated in both the RT format and the XY format.
- the dividing line 61 is selected based on the result of computing the parameters calculated in the RT format and the parameters calculated in the XY format.
- the control unit 201 calculates the average value of the RT length calculated on the RT format image and the XY length calculated on the XY format image for each parting line candidate 62 .
- the average value is, for example, an arithmetic average value or a geometric average value.
- the control unit 201 determines the dividing line 61 by selecting, for example, the dividing line candidate 62 having the shortest average value.
- the dividing line candidate 62 is created by extracting feature points from the boundary line between the biological tissue region 566 and the first lumen region 561 . Descriptions of parts common to the first embodiment are omitted.
- FIG. 21 is an explanatory diagram for explaining the parting line candidate 62 of modification 1-4.
- Asterisks indicate feature points extracted from the boundary line between the tissue region 566 and the first lumen region 561 .
- the feature points are, for example, a curved portion of the boundary line, an inflection point of the boundary line, and the like.
- the dividing line candidate 62 is created by connecting two feature points.
- the speed of the process of creating the dividing line 61 can be increased.
- Modification 1-5 This modification is a modification of the method of quantifying the difference between the second classification data 52 and the third classification model 33 in step S543 of the machine learning described using FIG. Descriptions of parts common to the first embodiment are omitted.
- FIG. 22 is an explanatory diagram explaining the machine learning of modification 1-5.
- a correct boundary line 691 indicated by a solid line indicates the outer boundary line of the first lumen region 561 when the second classified data 52 is displayed in the XY format. It should be noted that, for the regions in which the probabilities are distributed to the first lumen region 561 and the extraluminal region 567 based on the dividing line 61, the region where the probability of being the first lumen region 561 is 50% is defined as the first lumen region 561. Define to be the boundary of region 561 .
- An output boundary line 692 is the boundary outside the first lumen region 561 in the training classification data output from the third classification model 33 during training of the two-dimensional image 58. Show boundaries. C indicates the center of the two-dimensional image 58 , ie the central axis of the image acquisition catheter 28 . L indicates the distance between the correct boundary line 691 and the output boundary line 692 along the scanning line direction of the image acquisition catheter 28 .
- step S543 the control unit 201 adjusts the parameters of the third classification model 33 so that the average value of L measured at a total of 36 points in increments of 10 degrees, for example, becomes small.
- the control unit 201 may adjust the parameters of the third classification model 33, for example, so that the maximum value of L becomes small.
- Embodiment 2 This embodiment relates to a program that uses a two-dimensional image DB in which many two-dimensional images 58 are recorded, instead of the first classification DB 41 .
- the two-dimensional image DB is a database that does not have the first classification data field in the first classification DB 41 described using FIG. Descriptions of parts common to the first embodiment are omitted.
- FIG. 23 is a flowchart for explaining the processing flow of the program according to the second embodiment.
- the control unit 201 acquires one two-dimensional image from the two-dimensional image DB (step S601).
- the control unit 201 starts a subroutine for generating the first classification data (step S602).
- the first classification data generation subroutine is a subroutine for generating the first classification data 51 based on the two-dimensional image 58 .
- the processing flow of the first classification data generation subroutine will be described later.
- the control unit 201 determines whether or not the first lumen region 561 is closed (step S502). After that, the flow of processing up to step S603 is the same as that of the program of the first embodiment described using FIG. 13, so description thereof will be omitted.
- control unit 201 determines whether or not to end the processing (step S603). For example, the control unit 201 determines to end the process when all the records recorded in the two-dimensional image DB have been processed. The control unit 201 may determine to end the process when a predetermined number of records have been processed.
- control unit 201 If it is determined not to end the process (NO in step S603), the control unit 201 returns to step S601. If it is determined to end the process (YES in step S603), the control unit 201 ends the process.
- FIG. 24 is a flowchart for explaining the processing flow of the first classification data generation subroutine.
- the first classification data generation subroutine is a subroutine for generating the first classification data 51 based on the two-dimensional image 58 .
- the control unit 201 inputs the two-dimensional image 58 to the label classification model 35 and acquires the output label data 54 (step S611).
- the control unit 201 extracts a group of non-living tissue regions 568 in which labels corresponding to the non-living tissue regions 568 are recorded from the label data 54 (step S612).
- the control unit 201 determines whether the extracted non-biological tissue region 568 is the first lumen region 561 in contact with the edge on the image acquisition catheter 28 side (step S613). If it is determined to be the first lumen region 561 (YES in step S613), the control unit 201 replaces the label corresponding to the non-living tissue region 568 extracted in step S612 with the label corresponding to the first lumen region 561. (step S614).
- the control unit 201 determines whether the extracted non-body tissue region 568 is the second lumen region 562 surrounded by the body tissue region 566. It is determined whether or not (step S615). If it is determined to be the second lumen region 562 (YES in step S615), the control unit 201 replaces the label corresponding to the non-living tissue region 568 extracted in step S612 with the label corresponding to the second lumen region 562. (step S616).
- control unit 201 changes the label corresponding to the non-biological tissue region 568 extracted in step S612 to the label corresponding to the extracavity region 567. (step S617).
- step S614 step S616, or step S617 is completed, the control unit 201 determines whether or not processing of the non-living tissue region 568 included in the label data 54 acquired in step S611 has been completed (step S618). If it is determined that the processing has not ended (NO in step S618), the control unit 201 returns to step S612. If it is determined that the process has ended (YES in step S618), the control unit 201 ends the process.
- This embodiment relates to a catheter system 10 that uses a three-dimensional scanning image acquisition catheter 28 to generate three-dimensional images in real time. Descriptions of parts common to the first embodiment are omitted.
- FIG. 25 is an explanatory diagram illustrating the configuration of the catheter system 10 of Embodiment 3.
- the catheter system 10 includes an image processing device 220 , a catheter control device 27 , an MDU (Motor Driving Unit) 289 , and an image acquisition catheter 28 .
- Image acquisition catheter 28 is connected to image processing device 220 via MDU 289 and catheter control device 27 .
- the image processing device 220 includes a control section 221, a main memory device 222, an auxiliary memory device 223, a communication section 224, a display section 225, an input section 226 and a bus.
- the control unit 221 is an arithmetic control device that executes the program of this embodiment. One or a plurality of CPUs, GPUs, multi-core CPUs, or the like is used for the control unit 221 .
- the control unit 221 is connected to each hardware unit forming the image processing apparatus 220 via a bus.
- the main storage device 222 is a storage device such as SRAM, DRAM, and flash memory.
- the main storage device 222 temporarily stores information necessary during the process performed by the control unit 221 and the program being executed by the control unit 221 .
- the auxiliary storage device 223 is a storage device such as SRAM, flash memory, hard disk, or magnetic tape.
- the auxiliary storage device 223 stores the label classification model 35, programs to be executed by the control unit 221, and various data necessary for executing the programs.
- a communication unit 224 is an interface that performs communication between the image processing apparatus 220 and a network.
- the label classification model 35 may be stored in an external mass storage device or the like connected to the image processing device 220 .
- the display unit 225 is, for example, a liquid crystal display panel or an organic EL panel.
- Input unit 226 is, for example, a keyboard and a mouse.
- the input unit 226 may be layered on the display unit 225 to form a touch panel.
- the display unit 225 may be a display device connected to the image processing device 220 .
- the image processing device 220 is a general-purpose personal computer, tablet, large computer, or a virtual machine running on a large computer.
- the image processing apparatus 220 may be configured by hardware such as a plurality of personal computers or large computers that perform distributed processing.
- the image processing device 220 may be configured by a cloud computing system.
- the image processing device 220 and the catheter control device may constitute integrated hardware.
- the image acquisition catheter 28 has a sheath 281 , a shaft 283 inserted inside the sheath 281 , and a sensor 282 arranged at the tip of the shaft 283 .
- MDU 289 rotates and advances shaft 283 and sensor 282 inside sheath 281 .
- the catheter control device 27 generates one two-dimensional image 58 for each rotation of the sensor 282 .
- the catheter control device 27 continuously generates a plurality of two-dimensional images 58 substantially perpendicular to the sheath 281 .
- the control unit 221 sequentially acquires the two-dimensional image 58 from the catheter control device 27.
- the control unit 221 generates the first classification data 51 and the dividing line 61 based on each two-dimensional image 58 .
- the control unit 221 generates a three-dimensional image based on the plurality of first classification data 51 and the dividing line 61 acquired in time series, and outputs the three-dimensional image to the display unit 225 . As described above, so-called three-dimensional scanning is performed.
- the advance/retreat operation of the sensor 282 includes both an operation to advance/retreat the entire image acquisition catheter 28 and an operation to advance/retreat the sensor 282 inside the sheath 281 .
- the advance/retreat operation may be automatically performed at a predetermined speed by the MDU 289, or may be manually performed by the user.
- the image acquisition catheter 28 is not limited to a mechanical scanning method that mechanically rotates and advances and retreats.
- it may be an electronic radial scanning type image acquisition catheter 28 using a sensor 282 in which a plurality of ultrasonic transducers are arranged in a ring.
- FIG. 26 is a flow chart for explaining the processing flow of the program according to the third embodiment.
- the control unit 221 receives an instruction to start three-dimensional scanning from the user, the control unit 221 executes a program described using FIG. 26 .
- the control unit 221 instructs the catheter control device 27 to start three-dimensional scanning (step S631).
- Catheter controller 27 controls MDU 289 to initiate three-dimensional scanning.
- the control unit 221 acquires one two-dimensional image 58 from the catheter control device 27 (step S632).
- the control unit 221 activates the first classification data generation subroutine described using FIG. 24 (step S633).
- the first classification data generation subroutine is a subroutine for generating the first classification data 51 based on the two-dimensional image 58 .
- the control unit 221 determines whether or not the first lumen region 561 is closed (step S634). If it is determined to be closed (YES in step S634), the control unit 221 records the first classification data 51 in the auxiliary storage device 223 or main storage device 222 (step S635).
- step S634 the control unit 221 starts the dividing line creation subroutine described using FIG. 14 or FIG. 20 (step S636).
- the dividing line creation subroutine divides the open first lumen region 561 into a first region 571 closer to the image acquisition catheter 28 and a second region 572 farther from the image acquisition catheter 28 .
- This is a subroutine for creating a dividing line 61 that divides the .
- the control unit 221 changes the classification of the portion of the first lumen region 561 farther from the image acquisition catheter 28 than the parting line 61 to the extraluminal region 567 (step S637).
- the control unit 221 records the changed first classification data 51 in the auxiliary storage device 223 or the main storage device 222 (step S638).
- control unit 221 displays the three-dimensional image generated based on the first classified data 51 recorded in chronological order on the display unit 225 (step S639).
- the control unit 221 determines whether or not to end the process (step S640). For example, when a series of three-dimensional scans is completed, the control unit 221 determines to end the processing.
- control unit 221 If it is determined not to end the process (NO in step S639), the control unit 221 returns to step S632. If it is determined to end the process (YES in step S639), the control unit 221 ends the process.
- control unit 221 may record both the first classification data 51 generated in step S633 and the changed first classification data 51 in step S637 in the auxiliary storage device 223 or the main storage device 222. Instead of recording the changed first classification data 51, the control unit 221 may record the dividing line 61 and create the changed first classification data 51 each time three-dimensional display is performed. The control unit 221 may accept from the user a selection of which first classification data 51 to use in step S639.
- FIG. 27 is a display example of the third embodiment.
- a three-dimensional image of the first lumen region 561 extracted from the first classification data 51 is displayed.
- a modified region 569 indicated by a phantom line is the region whose label is changed from the first lumen region 561 to the extraluminal region 567 in step S636.
- correction area 569 is also displayed.
- Correction region 569 is noise and prevents the user from observing the shadowed portion of correction region 569 .
- control unit 221 accepts operations such as orientation change, section generation, display area change, enlargement, reduction, and measurement for the three-dimensional image illustrated in FIG. The user can appropriately observe the three-dimensional image and measure necessary data.
- the user can easily observe the three-dimensional shape of the first lumen region 561 by using the three-dimensional image in which the corrected region 569 is erased using the program described using FIG. Furthermore, the control unit 221 can accurately automatically measure the volume of the first lumen region 561 and the like.
- the catheter system 10 that uses the three-dimensional image acquisition catheter 28 to display a three-dimensional image with little noise in real time.
- Modification 3-1 This modification relates to an image processing device 220 that displays a three-dimensional image based on a data set of two-dimensional images 58 recorded in time series. The description of the parts common to the third embodiment is omitted. It should be noted that in this modified example, the catheter control device 27 does not need to be connected to the image processing device 220 .
- a data set of two-dimensional images 58 recorded in chronological order is recorded in the auxiliary storage device 223 or an external large-capacity storage device.
- the dataset may be, for example, a set of two-dimensional images 58 generated based on video data recorded during past cases.
- FIG. 28 is a flowchart for explaining the processing flow of the program of modification 3-1.
- Control unit 221 executes a program described with reference to FIG. 26 when an instruction regarding a data set for three-dimensional display is received from the user.
- the control unit 221 acquires one two-dimensional image 58 from the instructed data set (step S681).
- the control unit 221 activates the first classification data generation subroutine described using FIG. 24 (step S633).
- the subsequent processing up to step S634 and step S638 is the same as the processing of the program of the third embodiment described with reference to FIG. 26, so description thereof will be omitted.
- step S635 or step S638 the control unit 221 determines whether or not the processing of the two-dimensional image 58 included in the designated data set has been completed (step S682). If it is determined that the processing has not ended (NO in step S682), the control unit 221 returns to step S681.
- control unit 221 displays the three-dimensional image generated based on the first classified data 51 recorded in chronological order and the changed first classified data 51. It is displayed on the part 225 (step S683).
- control unit 221 records the first classification data 51 and the changed first classification data 51 in chronological order.
- the set may be recorded in auxiliary storage device 223 .
- a user can use the recorded data set to view the three-dimensional image as desired.
- This embodiment relates to a catheter system 10 equipped with the third classification model 33 generated in the first or second embodiment.
- the description of the parts common to the third embodiment is omitted.
- FIG. 29 is an explanatory diagram illustrating the configuration of the catheter system 10 of Embodiment 4.
- the catheter system 10 includes an image processor 230 , a catheter controller 27 , an MDU 289 and an image acquisition catheter 28 .
- Image acquisition catheter 28 is connected to image processing device 230 via MDU 289 and catheter control device 27 .
- the image processing device 230 includes a control section 231, a main storage device 232, an auxiliary storage device 233, a communication section 234, a display section 235, an input section 236 and a bus.
- the control unit 231 is an arithmetic control device that executes the program of this embodiment. One or a plurality of CPUs, GPUs, multi-core CPUs, or the like is used for the control unit 231 .
- the control unit 231 is connected to each hardware unit forming the image processing apparatus 230 via a bus.
- the main storage device 232 is a storage device such as SRAM, DRAM, and flash memory.
- the main storage device 232 temporarily stores information necessary during the process performed by the control unit 231 and the program being executed by the control unit 231 .
- the auxiliary storage device 233 is a storage device such as SRAM, flash memory, hard disk, or magnetic tape.
- the auxiliary storage device 233 stores the third classification model 33, programs to be executed by the control unit 231, and various data necessary for executing the programs.
- the communication unit 234 is an interface that performs communication between the image processing device 230 and the network.
- the third classification model 33 may be stored in an external mass storage device or the like connected to the image processing device 230 .
- the display unit 235 is, for example, a liquid crystal display panel or an organic EL panel.
- Input unit 236 is, for example, a keyboard and a mouse.
- the input unit 236 may be layered on the display unit 235 to form a touch panel.
- the display unit 235 may be a display device connected to the image processing device 230 .
- the image processing device 230 is a general-purpose personal computer, tablet, large computer, or a virtual machine running on a large computer.
- the image processing device 230 may be configured by hardware such as a plurality of personal computers or large computers that perform distributed processing.
- the image processing device 230 may be configured by a cloud computing system.
- the image processing device 230 and the catheter control device may constitute integrated hardware.
- the control unit 231 sequentially acquires a plurality of two-dimensional images 58 obtained from the catheter control device 27 in time series.
- the control unit 231 sequentially inputs the respective two-dimensional images 58 to the third classification model 33 and sequentially acquires the third classification data 53 .
- the control unit 231 generates a three-dimensional image based on the plurality of third classification data 53 acquired in chronological order, and outputs the three-dimensional image to the display unit 235 . As described above, so-called three-dimensional scanning is performed.
- FIG. 30 is a flowchart for explaining the processing flow of the program of the fourth embodiment.
- the control unit 231 receives an instruction to start three-dimensional scanning from the user, the control unit 231 executes a program described using FIG. 30 .
- the control unit 231 instructs the catheter control device 27 to start three-dimensional scanning (step S651).
- Catheter controller 27 controls MDU 289 to initiate three-dimensional scanning.
- the control unit 231 acquires one two-dimensional image 58 from the catheter control device 27 (step S652).
- the control unit 231 inputs the two-dimensional image 58 to the third classification model 33 and acquires the output third classification data 53 (step S653).
- the control unit 231 records the third classification data 53 in the auxiliary storage device 233 or the main storage device 232 (step S654).
- the control unit 231 displays the three-dimensional image generated based on the third classification data 53 recorded in chronological order on the display unit 235 (step S655).
- the control unit 231 determines whether or not to end the process (step S656). For example, when a series of three-dimensional scans is completed, the control unit 231 determines to end the processing.
- control unit 231 If it is determined not to end the process (NO in step S656), the control unit 231 returns to step S652. By repeating the process of step S653, the control unit 231 sequentially inputs a plurality of two-dimensional images obtained in time series to the third classification model 33, and sequentially acquires the output third classification data 53. It implements the function of the third classification data acquisition unit of the present embodiment. When determining to end the process (YES in step S656), the control unit 231 ends the process.
- the catheter system 10 loaded with the third classified data 53 generated in the first or second embodiment. According to the present embodiment, it is possible to provide the catheter system 10 that realizes the same three-dimensional image display as in the third embodiment with less computational load than the third embodiment.
- Both the third classification model 33 and the label classification model 35 are recorded in the auxiliary storage device 233 or the auxiliary storage device 223, and the user selects the processing of the third embodiment or the processing of the fourth embodiment. It may be configured to allow
- Modification 4-1 This modification relates to an image processing device 230 that displays a three-dimensional image based on a data set of two-dimensional images 58 recorded in time series. The description of the parts common to the fourth embodiment is omitted. It should be noted that in this modification, the catheter control device 27 does not need to be connected to the image processing device 230 .
- a data set of two-dimensional images 58 recorded in chronological order is recorded in the auxiliary storage device 233 or an external large-capacity storage device.
- the dataset may be, for example, a set of two-dimensional images 58 generated based on video data recorded during past cases.
- the control unit 231 acquires one two-dimensional image 58 from the data set, inputs it to the third classification model 33, and acquires the output third classification data 53.
- the control unit 231 records the third classification data 53 in the auxiliary storage device 233 or main storage device 232 . After finishing the processing of a series of data sets, the control unit 231 displays a three-dimensional image based on the recorded third classification data 53 .
- control unit 231 may record a data set in which the third classification data 53 are recorded in chronological order in the auxiliary storage device 233. good. A user can use the recorded data set to view the three-dimensional image as desired.
- FIG. 31 is a functional block diagram of the information processing device 200 according to the fifth embodiment.
- the information processing apparatus 200 includes an image acquisition section 81, a first classification data acquisition section 82, a determination section 83, a first recording section 84, a dividing line creation section 85, a second classification data creation section 86, and a second recording section 87. .
- the image acquisition unit 81 acquires the two-dimensional image 58 acquired using the image acquisition catheter 28 .
- the first classification data acquisition unit 82 divides the two-dimensional image 58 into a living tissue region 566, a first lumen region 561 into which the image acquisition catheter 28 is inserted, and an extracavity region outside the living tissue region 566. First classified data 51 classified into a plurality of areas including 567 is obtained.
- the determination unit 83 determines whether or not the first lumen region 561 has reached the edge of the two-dimensional image 58 in the two-dimensional image 58 .
- the first recording unit 84 associates the two-dimensional image 58 with the first classification data 51 and records them in the training DB 42 .
- the parting line creation unit 85 divides the first lumen region 561 between the first region 571 into which the image acquisition catheter 28 is inserted and the edge of the two-dimensional image 58.
- a dividing line 61 is created to divide the second region 572 reached.
- the second classification data generation unit 86 Based on the dividing line 61 and the first classification data 51 , the second classification data generation unit 86 generates the first lumen region 561 for each small region that constitutes the first lumen region 561 in the first classification data 51 .
- the second classification data 52 is created by distributing the probability of being an extraluminal region 567 and the probability of being an extracavity region 567 .
- the second recording unit 87 associates the two-dimensional image 58 with the second classification data 52 and records them in the training DB 42 .
- FIG. 32 is a functional block diagram of the image processing device 220 of Embodiment 6. As shown in FIG. The image processing device 220 includes an image acquisition section 71 , a first classification data acquisition section 72 , a determination section 83 , a dividing line creation section 85 and a three-dimensional image creation section 88 .
- the image acquisition unit 71 acquires a plurality of two-dimensional images 58 obtained in time series using the image acquisition catheter 28 .
- the first classification data acquisition unit 72 determines that each pixel constituting each of the plurality of two-dimensional images 58 is divided into a living tissue region 566, a first lumen region 561 into which the image acquisition catheter 28 is inserted, and a living tissue region.
- a series of first classified data 51 classified into a plurality of regions including an extraluminal region 567 outside the region 566 is obtained.
- the determination unit 83 determines whether or not the first lumen region 561 has reached the edge of the two-dimensional image 58 in each of the two-dimensional images 58 .
- the determination unit 83 determines that the parting line creation unit 85 has reached the first lumen region 561
- the parting line creation unit 85 divides the first lumen region 561 between the first region 571 into which the image acquisition catheter 28 is inserted and the edge of the two-dimensional image 58.
- a dividing line 61 is created to divide the second region 572 reached.
- the three-dimensional image generation unit 88 uses the series of first classified data 51 in which the classification of the second region 572 is changed to the extracavity region 567, or uses the series of first classified data 51 and the second region A three-dimensional image is created by treating 572 as the same region as the extracavity region 567 .
- FIG. 33 is a functional block diagram of the image processing device 230 according to the seventh embodiment.
- the image processing device 230 includes an image acquisition section 71 and a third classification data acquisition section 73 .
- the image acquisition unit 71 acquires a plurality of two-dimensional images 58 obtained in time series using the image acquisition catheter 28 .
- the third classification data acquisition unit 73 sequentially inputs the two-dimensional images 58 to the trained model 33 generated using the above-described method, and sequentially acquires the output third classification data 53 .
- catheter system 200 information processing device 201 control unit 202 main storage device 203 auxiliary storage device 204 communication unit 205 display unit 206 input unit 210 information processing device 211 control unit 212 main storage device 213 auxiliary storage device 214 communication unit 215 display unit 216 input Unit 220 Image processing device 221 Control unit 222 Main storage device 223 Auxiliary storage device 224 Communication unit 225 Display unit 226 Input unit 230 Image processing device 231 Control unit 232 Main storage device 233 Auxiliary storage device 234 Communication unit 235 Display unit 236 Input unit 27 Catheter Control Device 28 Image Acquisition Catheter 281 Sheath 282 Sensor 283 Shaft 289 MDU 31 first classification model 33 third classification model (learning model, trained model) 35 Label Classification Model 37 Open/Close Judgment Model (Arrival Judgment Model) 39 classification data converter 41 first classification DB 42 training database 51 first classification data 52 second classification data 53 third classification data 54 label data 561 first lumen region (luminal region) 562 second lumen region 563 lumen region 566
Abstract
The purpose of the present invention is to provide a learning model generation method that generates a learning model that supports understanding of images acquired by an image acquisition catheter. The learning model generation method: creates a dividing line, in a two-dimensional image (58), that divides a lumen area (561) into a first area (571) in which an image acquisition catheter has been inserted and a second area (572) that reaches the edge of the two-dimensional image (58), when a determination has been made that the lumen area (561) has reached the edge of the two-dimensional image (58); creates second classification data (52) that distributes the probability of being the lumen area (561) and an extraluminal area (567); associates the second classification data to the two-dimensional image (58) and stores same in a training database; and generates a learning model (33) that outputs third classification data (53) that, by machine learning, has divided the two-dimensional image (58), if input, into a plurality of areas including a biological tissue area (566), the lumen area (561), and an extraluminal area (567).
Description
本発明は、学習モデル生成方法、画像処理装置、情報処理装置、訓練データ生成方法および画像処理方法に関する。
The present invention relates to a learning model generation method, an image processing device, an information processing device, a training data generation method, and an image processing method.
血管等の管腔器官に画像取得用カテーテルを挿入して、画像を取得するカテーテルシステムが使用されている(特許文献1)。
A catheter system that acquires an image by inserting an image acquisition catheter into a hollow organ such as a blood vessel is used (Patent Document 1).
しかしながら、画像取得用カテーテルを用いて取得した画像では、管腔器官の一部の情報が欠損した状態に描出される場合がある。このような欠損が生じた画像では、管腔器官の構造を正しく描出できていない。したがって、ユーザが管腔器官の構造を素早く理解しにくい場合がある。
However, in images acquired using an image acquisition catheter, there are cases where the information of a part of the luminal organ is missing. An image with such a defect does not correctly depict the structure of the luminal organ. Therefore, it may be difficult for the user to quickly understand the structure of the hollow organ.
一つの側面では、画像取得用カテーテルにより取得した画像の理解を支援することが可能な、学習モデル生成方法等を提供することを目的とする。
In one aspect, the object is to provide a learning model generation method, etc. that can support understanding of images acquired by an image acquisition catheter.
学習モデル生成方法は、画像取得用カテーテルを用いて取得された二次元画像を取得し、前記二次元画像を構成する各ピクセルが、生体組織領域、前記画像取得用カテーテルが挿入されている内腔領域、および、生体組織領域よりも外側の腔外領域を含む複数の領域に分類された、第1分類データを取得し、前記二次元画像において、前記内腔領域が前記二次元画像の縁に到達しているか否かを判定し、到達していないと判定した場合、前記二次元画像と前記第1分類データとを関連づけて訓練データベースに記録し、到達していると判定した場合、前記内腔領域を、前記画像取得用カテーテルが挿入されている第1領域と前記二次元画像の縁に到達している第2領域とに分割する分割線を作成し、前記分割線および前記第1分類データに基づいて、前記第1分類データのうち前記内腔領域を構成するそれぞれの小領域について、前記内腔領域である確率と前記腔外領域である確率とを配分した第2分類データを作成し、前記二次元画像と前記第2分類データとを関連づけて前記訓練データベースに記録し、前記訓練データベースに記録した訓練データを用いた機械学習により、二次元画像を入力した場合に、当該二次元画像を構成する各ピクセルが、前記生体組織領域、前記内腔領域、および、前記腔外領域を含む複数の領域に分類された、第3分類データを出力する学習モデルを生成する。
A learning model generation method acquires a two-dimensional image acquired using an image acquisition catheter, and each pixel constituting the two-dimensional image is a living tissue region and a lumen into which the image acquisition catheter is inserted. obtaining first classified data classified into a plurality of regions including a region and an extracavity region outside the biological tissue region; If it is determined that it has not reached, the two-dimensional image and the first classification data are associated and recorded in a training database, and if it is determined that it has reached, the internal creating a dividing line dividing a cavity region into a first region into which the image acquisition catheter is inserted and a second region reaching the edge of the two-dimensional image; Based on the data, second classification data is generated by distributing a probability of being the lumen region and a probability of being the extracavity region for each of the small regions constituting the lumen region in the first classification data. Then, when the two-dimensional image and the second classification data are associated and recorded in the training database, and a two-dimensional image is input by machine learning using the training data recorded in the training database, the two-dimensional A learning model is generated that outputs third classification data in which each pixel constituting an image is classified into a plurality of regions including the biological tissue region, the lumen region, and the extracavity region.
一つの側面では、画像取得用カテーテルにより取得した画像の理解を支援することが可能な、学習モデル生成方法等を提供できる。
In one aspect, it is possible to provide a learning model generation method and the like that can support understanding of images acquired by an image acquisition catheter.
[実施の形態1]
図1は、第3分類モデル33の生成方法を説明する説明図である。第1分類DB41に、二次元画像58と第1分類データ51との組が多数記録されている。本実施の形態の二次元画像58は、ラジアル走査型の画像取得用カテーテル28(図25参照)を用いて取得された断層像である。以下の説明では、二次元画像58は超音波断層像である場合を例にして説明する。 [Embodiment 1]
FIG. 1 is an explanatory diagram illustrating a method of generating thethird classification model 33. As shown in FIG. A large number of sets of two-dimensional images 58 and first classification data 51 are recorded in the first classification DB 41 . The two-dimensional image 58 of the present embodiment is a tomographic image acquired using the radial scanning image acquisition catheter 28 (see FIG. 25). In the following description, a case where the two-dimensional image 58 is an ultrasonic tomographic image will be described as an example.
図1は、第3分類モデル33の生成方法を説明する説明図である。第1分類DB41に、二次元画像58と第1分類データ51との組が多数記録されている。本実施の形態の二次元画像58は、ラジアル走査型の画像取得用カテーテル28(図25参照)を用いて取得された断層像である。以下の説明では、二次元画像58は超音波断層像である場合を例にして説明する。 [Embodiment 1]
FIG. 1 is an explanatory diagram illustrating a method of generating the
二次元画像58は、近赤外光を用いたOCT(Optical Coherence Tomography)による断層像であってもよい。二次元画像は、リニア走査型またはセクタ操作型の画像取得用カテーテル28を用いて取得された断層像であってもよい。
The two-dimensional image 58 may be a tomographic image obtained by OCT (Optical Coherence Tomography) using near-infrared light. The two-dimensional image may be a tomographic image acquired using a linear scanning or sector operating image acquisition catheter 28 .
図1においては、走査線データを走査角度順に平行に配列して形成した、いわゆるRT形式で二次元画像58を図示する。二次元画像58の左端が画像取得用カテーテル28である。二次元画像58の横方向は、画像取得用カテーテル28との距離に対応し、二次元画像58の縦方向は走査角度に対応する。
In FIG. 1, a two-dimensional image 58 is shown in the so-called RT format, which is formed by arranging scanning line data in parallel in the order of scanning angles. The left end of the two-dimensional image 58 is the image acquisition catheter 28 . The horizontal direction of the two-dimensional image 58 corresponds to the distance from the image acquisition catheter 28, and the vertical direction of the two-dimensional image 58 corresponds to the scanning angle.
第1分類データ51は、二次元画像58を構成する各ピクセルを、生体組織領域566、内腔領域563および腔外領域567に分類したデータである。内腔領域563は、画像取得用カテーテル28が挿入されている第1内腔領域561と画像取得用カテーテル28が挿入されていない第2内腔領域562とに分類されている。
The first classified data 51 is data obtained by classifying each pixel constituting the two-dimensional image 58 into a biological tissue region 566, a lumen region 563, and an extracavity region 567. The lumen area 563 is classified into a first lumen area 561 into which the image acquisition catheter 28 is inserted and a second lumen area 562 into which the image acquisition catheter 28 is not inserted.
それぞれのピクセルには、分類された領域を示すラベルが関連づけられている。図1においては、生体組織領域566のラベルが関連付けられた部分を格子状のハッチング、第1内腔領域561のラベルが関連付けられた部分をハッチング無し、第2内腔領域562のラベルが関連付けられた部分を左下がりのハッチング、腔外領域567のラベルが関連付けられた部分を右下がりのハッチングでそれぞれ示す。なお、二次元画像58を構成する複数のピクセルをまとめた小領域ごとにラベルが関連づけられていてもよい。
Each pixel is associated with a label that indicates the classified area. In FIG. 1, the portion associated with the label of the biological tissue region 566 is hatched in a grid pattern, the portion associated with the label of the first lumen region 561 is not hatched, and the label of the second lumen region 562 is associated. The portion associated with the label of the extracavity region 567 is indicated by hatching sloping to the right. A label may be associated with each small region in which a plurality of pixels forming the two-dimensional image 58 are collected.
画像取得用カテーテル28が血管または心臓等の循環器に挿入されている場合を例にして、具体的に説明する。生体組織領域566は血管壁または心臓壁等の、管腔器官壁に対応する。第1内腔領域561は、画像取得用カテーテル28が挿入されている管腔器官の内側の領域である。すなわち、第1内腔領域561は、血液で満たされている領域である。
A specific description will be given by taking as an example a case where the image acquisition catheter 28 is inserted into a blood vessel or a circulatory system such as the heart. Tissue region 566 corresponds to a hollow organ wall, such as a blood vessel wall or a heart wall. The first lumen region 561 is the region inside the lumen organ into which the image acquisition catheter 28 is inserted. That is, the first lumen region 561 is a region filled with blood.
第2内腔領域562は、画像取得用カテーテル28が挿入されている血管等の近傍に存在する別の管腔器官の内側の領域である。たとえば第2内腔領域562は画像取得用カテーテル28が挿入されている血管から分岐した血管の内側の領域、または、画像取得用カテーテル28が挿入されている血管に近接する他の血管の内側の領域である。第2内腔領域562は、たとえば胆管、膵管、尿管または尿道等の、循環器以外の管腔器官の内側の領域である場合もある。
A second lumen region 562 is a region inside another lumen organ that exists in the vicinity of a blood vessel or the like into which the image acquisition catheter 28 is inserted. For example, second lumen region 562 may be a region inside a blood vessel branching from the blood vessel into which image acquisition catheter 28 is inserted, or inside another blood vessel proximate to the blood vessel into which image acquisition catheter 28 is inserted. area. The second lumenal region 562 may also be a region inside a lumenal organ other than the circulatory system, such as, for example, the bile duct, pancreatic duct, ureter, or urethra.
腔外領域567は、生体組織領域566の外側の領域である。心房、心室または太い血管等の内側の領域であっても、二次元画像58の表示レンジに収まっていない場合には、腔外領域567に分類される。
The extracavity region 567 is the region outside the biological tissue region 566 . Even an inner region such as an atrium, a ventricle, or a large blood vessel is classified as an extracavity region 567 if it does not fit within the display range of the two-dimensional image 58 .
図示を省略するが、第1分類データ51は、たとえば画像取得用カテーテル28、画像取得用カテーテル28と共に挿入されたガイドワイヤ等が描出された器具領域、および石灰化等の病変部が描出された病変領域等の、種々の領域に対応するラベルを含んでもよい。二次元画像58から第1分類データ51を作成する方法については、後述する。
Although illustration is omitted, the first classification data 51 includes, for example, the image acquisition catheter 28, an instrument region in which a guide wire inserted together with the image acquisition catheter 28, and a lesion such as calcification are depicted. Labels corresponding to various regions, such as lesion regions, may also be included. A method for creating the first classification data 51 from the two-dimensional image 58 will be described later.
図1に示す第1分類データ51においては、第1分類データ51の右端から左端まで第1内腔領域561が連続している。すなわち、生体組織領域566に開口部が存在するために、第1内腔領域561が生体組織領域566により囲まれていない状態である。以下の説明では第1分類データ51の右端から左端まで第1内腔領域561が連続している状態を、第1内腔領域561が「開いた」状態であると記載する場合がある。同様に第1内腔領域561が第1分類データ51の左端まで連続していない状態を、第1内腔領域561が「閉じた」状態であると記載する場合がある。
In the first classified data 51 shown in FIG. 1, the first lumen region 561 is continuous from the right end to the left end of the first classified data 51. That is, the first lumen region 561 is not surrounded by the living tissue region 566 because the opening exists in the living tissue region 566 . In the following description, the state in which the first lumen region 561 is continuous from the right end to the left end of the first classification data 51 may be described as the "open" state of the first lumen region 561 . Similarly, a state in which the first lumen region 561 is not continuous to the left end of the first classification data 51 may be described as a "closed" state of the first lumen region 561 .
図1に示す例においては、A部において生体組織領域566が適切に抽出されずに開口部になっているために、第1内腔領域561が開いた状態になっている。たとえば画像取得用カテーテル28と生体組織の内壁と間の角度の状態、画像取得用カテーテル28と生体組織の内壁との間の距離、および生体組織の性状等の様々な要因により、偶発的に生体組織の一部が途切れた状態、または不鮮明な状態の二次元画像58が撮影される場合があることが知られている。そのような、二次元画像58に基づいて作成された第1分類データ51においては、生体組織領域566の一部に開口部が存在する状態になる。
In the example shown in FIG. 1, the first lumen area 561 is in an open state because the body tissue area 566 is not properly extracted and is an opening in the A part. For example, due to various factors such as the state of the angle between the image acquisition catheter 28 and the inner wall of the living tissue, the distance between the image acquisition catheter 28 and the inner wall of the living tissue, and the properties of the living tissue, an accidental It is known that a two-dimensional image 58 may be captured with portions of the tissue cut off or blurred. In such first classification data 51 created based on the two-dimensional image 58, an opening exists in a part of the living tissue region 566. FIG.
生体組織領域566に開口部が存在することにより、第1分類データ51中の第1内腔領域561が開いた状態である場合、第1内腔領域561のうち生体組織領域566の開口部よりも外側の領域は、管腔器官の構造を把握するうえでは重要な情報ではない。したがって、第1内腔領域561は開口部よりも外側の領域を含まないことが好ましい。
When the first lumen region 561 in the first classification data 51 is in an open state due to the presence of an opening in the biological tissue region 566, the opening of the biological tissue region 566 in the first lumen region 561 The outer region is not important information for understanding the structure of the luminal organ. Therefore, first lumen region 561 preferably does not include regions outside the opening.
たとえば、それぞれの領域の面積、体積または周囲長等の自動測定を行なう場合、生体組織領域566の開口部よりも外側の領域を第1内腔領域561に含めてしまうと、測定結果に誤りが生じる可能性がある。さらに、三次元走査型の画像取得用カテーテル28を使用して三次元画像を作成する場合、生体組織領域566の開口部よりも外側に存在する第1内腔領域561のラベルが付与された領域は、管腔器官の構造を把握するうえでは三次元画像上のノイズのようになってしまう。そのため、ユーザが三次元形状を把握しにくくなる。
For example, when automatically measuring the area, volume, perimeter, or the like of each region, if the region outside the opening of the biological tissue region 566 is included in the first lumen region 561, the measurement result will be erroneous. may occur. Furthermore, when creating a three-dimensional image using the three-dimensional scanning image acquisition catheter 28, the labeled region of the first lumen region 561 existing outside the opening of the biological tissue region 566 However, it becomes like noise on a three-dimensional image when grasping the structure of a hollow organ. Therefore, it becomes difficult for the user to grasp the three-dimensional shape.
十分に熟練していないユーザは、このようなノイズに惑わされて観察中の部位の構造を理解するのに苦労する場合がある。熟練した医師または検査技師等のユーザが二次元画像58を見た場合には、生体組織領域566の開口部に起因して、三次元画像上にノイズが生じていることを比較的容易に判別できる。しかし、たとえば面積等の自動測定を正しく行なうために、ユーザが手作業で第1分類データ51のラベルを修正する作業は煩雑である。
Users who are not sufficiently skilled may be confused by such noise and have difficulty understanding the structure of the part under observation. When a user such as a skilled doctor or laboratory technician views the two-dimensional image 58, it is relatively easy to determine that noise is generated on the three-dimensional image due to the opening of the living tissue region 566. can. However, it is troublesome for the user to manually correct the label of the first classification data 51 in order to perform the automatic measurement of the area correctly.
本実施の形態においては、第1内腔領域561を画像取得用カテーテル28に近い側である第1領域571と、画像取得用カテーテル28から遠い側である第2領域572とに分割する分割線61が自動的に作成される。分割線61は、第1内腔領域561と腔外領域567とを分ける生体組織領域566が存在すると仮定する線である。分割線61の作成方法の具体例については、後述する。
In the present embodiment, a dividing line dividing the first lumen region 561 into a first region 571 closer to the image acquisition catheter 28 and a second region 572 farther from the image acquisition catheter 28 61 is automatically created. A dividing line 61 is a line on which it is assumed that there is a biological tissue region 566 separating the first lumen region 561 and the extraluminal region 567 . A specific example of the method of creating the dividing line 61 will be described later.
その後、第1内腔領域561を構成する各ピクセルについて、第1内腔領域561である確率と、腔外領域567である確率とが、自動的に配分されて、第2分類データ52が作成される。第1内腔領域561である確率と、腔外領域567である確率との和は、1である。分割線61の近傍では、第1内腔領域561である確率と腔外領域567である確率とはほぼ等しい。分割線61から画像取得用カテーテル28に近づくにつれて、第1内腔領域561である確率が大きくなる。分割線61から画像取得用カテーテル28とは反対側に離れるにつれて、腔外領域567である確率が大きくなる。確率の分配方法の具体例については、後述する。
After that, for each pixel constituting the first lumen region 561, the probability of being the first lumen region 561 and the probability of being the extraluminal region 567 are automatically distributed to create the second classification data 52. be done. The sum of the probability of being the first lumen region 561 and the probability of being the extraluminal region 567 is one. In the vicinity of the dividing line 61, the probability of being the first lumen region 561 and the probability of being the extraluminal region 567 are almost equal. The probability of being the first lumen region 561 increases as the distance from the dividing line 61 to the image acquisition catheter 28 increases. The probability of being in the extraluminal region 567 increases as the distance from the dividing line 61 to the side opposite to the image acquisition catheter 28 increases. A specific example of the probability distribution method will be described later.
第1分類DB41に記録された二次元画像58と第1分類データ51との組のうち、第1内腔領域561が第1分類データ51の右端まで到達しているデータについては、以上の処理により第2分類データ52が作成される。二次元画像58と第2分類データ52との組が、一組の訓練データを構成する。
Of the set of the two-dimensional image 58 and the first classification data 51 recorded in the first classification DB 41, the data in which the first lumen region 561 reaches the right end of the first classification data 51 is processed as described above. The second classification data 52 is created by. The set of two-dimensional image 58 and second classified data 52 constitutes a set of training data.
第1分類DB41に記録された二次元画像58と第1分類データ51との組のうち、第1内腔領域561が第1分類データ51の右端まで到達していないデータについては、第2分類データ52は作成されない。二次元画像58と第1分類データ51との組が、一組の訓練データを構成する。
Among the set of the two-dimensional image 58 and the first classification data 51 recorded in the first classification DB 41, the data in which the first lumen region 561 has not reached the right end of the first classification data 51 is classified as the second classification data. Data 52 is not created. A set of the two-dimensional image 58 and the first classified data 51 constitutes a set of training data.
以上により、多数の訓練データの組を記録した訓練DB42(図3参照)が自動的に作成される。訓練DB42を用いて機械学習を行ない、二次元画像58を入力した際に第3分類データ53を出力する第3分類モデル33が生成される。図1に示すように、第3分類データ53においては生体組織領域566が存在しない場所に第1内腔領域561と腔外領域567との境界が作成されている。
Through the above, a training DB 42 (see FIG. 3) that records a large number of sets of training data is automatically created. Machine learning is performed using the training DB 42 to generate the third classification model 33 that outputs the third classification data 53 when the two-dimensional image 58 is input. As shown in FIG. 1, in the third classification data 53, a boundary between the first lumen region 561 and the extracavity region 567 is created at a location where the biological tissue region 566 does not exist.
以上により、二次元画像58において生体組織が明瞭に描出されていない場所が存在した場合であっても、適切にラベルを付与する第3分類モデル33を生成できる。生成された第3分類モデル33は、本実施の形態の学習モデルの例示である。以後の説明では、機械学習が完了した第3分類モデル33を、学習済モデルと記載する場合がある。
As described above, even if there is a place where the living tissue is not clearly depicted in the two-dimensional image 58, it is possible to generate the third classification model 33 that appropriately labels it. The generated third classification model 33 is an example of the learning model of this embodiment. In the following description, the third classification model 33 for which machine learning has been completed may be referred to as a learned model.
このようにして生成された第3分類モデル33を用いて、第3分類データ53を出力することにより、ユーザが速やかに観察中の部位の構造を理解できるように支援するカテーテルシステム10(図25参照)を提供できる。さらに、ユーザが煩雑な修正作業を行なうことなく、面積等の自動計測、および、三次元画像の表示を適切に行なうカテーテルシステム10を提供できる。
By outputting the third classification data 53 using the third classification model 33 generated in this manner, the catheter system 10 (Fig. 25) assists the user in quickly understanding the structure of the site being observed. ) can be provided. Furthermore, it is possible to provide the catheter system 10 that automatically measures the area and displays the three-dimensional image appropriately without the user performing complicated correction work.
図2は、第1分類データ51を説明する説明図である。二次元画像58に基づいて第1分類データ51を作成する第1分類モデル31は、ラベル分類モデル35と、分類データ変換部39との二つのコンポーネントを含む。
FIG. 2 is an explanatory diagram for explaining the first classification data 51. FIG. The first classification model 31 that creates the first classification data 51 based on the two-dimensional image 58 includes two components, the label classification model 35 and the classification data converter 39 .
まず、二次元画像58がラベル分類モデル35に入力されて、ラベルデータ54が出力される。ラベル分類モデル35は、二次元画像58を構成するそれぞれのピクセル等の小領域に、当該小領域に描出されている被写体に関するラベルを付与するモデルである。ラベル分類モデル35は、たとえばセマンティックセグメンテーション等の公知の機械学習手法により生成される。
First, the two-dimensional image 58 is input to the label classification model 35, and the label data 54 is output. The label classification model 35 is a model that assigns a label associated with a subject depicted in the small area, such as each pixel, that constitutes the two-dimensional image 58 to the small area. The label classification model 35 is generated by a known machine learning technique such as semantic segmentation.
図2に示す例においては、ラベルデータ54は格子状のハッチングで示す生体組織領域566を示すラベルと、それ以外の領域である非生体組織領域568を示すラベルとを含む。
In the example shown in FIG. 2, the label data 54 includes a label indicating a living tissue region 566 indicated by grid hatching and a label indicating a non-living tissue region 568 which is the other region.
ラベルデータ54が分類データ変換部39に入力されて、前述の第1分類データ51が出力される。具体的には、非生体組織領域568のうち、周囲が生体組織領域566のみにより囲まれた領域のラベルは、第2内腔領域562に変換される。非生体組織領域568のうち、第1分類データ51の左端(RT形式画像におけるラジアル方向の中心)である画像取得用カテーテル28に接する領域は、第1内腔領域561に変換される。
The label data 54 is input to the classification data conversion unit 39, and the first classification data 51 described above is output. Specifically, of the non-biological tissue region 568 , the label of the region surrounded only by the biological tissue region 566 is converted to the second lumen region 562 . Of the non-biological tissue region 568 , the region in contact with the image acquisition catheter 28 , which is the left end of the first classified data 51 (center in the radial direction in the RT format image), is converted into the first lumen region 561 .
非生体組織領域568のうち、第1内腔領域561にも第2内腔領域562にも変換されなかった領域、具体的には周囲が生体組織領域566とRT形式画像におけるラジアル方向の外端(図2に示すラベルデータ54における右端)により囲まれた領域は、腔外領域567に変換される。なお、RT形式画像のシータ方向における上下端部は繋がっているため、図2に示す例において、腔外領域567は、その周囲が生体組織領域566とRT形式画像のラジアル方向の外端とに囲まれている。
Of the non-biological tissue region 568, a region that has not been converted to either the first lumen region 561 or the second lumen region 562, specifically, the surrounding area is the biological tissue region 566 and the outer edge in the radial direction in the RT format image. (right end in label data 54 shown in FIG. 2) is transformed into extraluminal region 567 . Since the upper and lower ends of the RT format image in the theta direction are connected, in the example shown in FIG. being surrounded.
RT形式の二次元画像58および第1分類データ51は、座標変換によりXY形式に変換可能である。RT形式画像とXY形式画像との間の変換方法は公知であるため、説明を省略する。なお、ラベル分類モデル35はXY形式の二次元画像58を受け付けてXY形式のラベルデータ54を出力するモデルであってもよい。しかしながら、XY形式の二次元画像58を処理する方が、RT形式からXY形式に変換する際の補間処理等の影響を受けないため、より適切なラベルデータ54が作成される。
The two-dimensional image 58 in RT format and the first classified data 51 can be converted into XY format by coordinate conversion. Since the conversion method between the RT format image and the XY format image is well known, the explanation is omitted. Note that the label classification model 35 may be a model that receives the two-dimensional image 58 in XY format and outputs the label data 54 in XY format. However, processing the two-dimensional image 58 in the XY format is less affected by interpolation processing or the like when converting from the RT format to the XY format, so more appropriate label data 54 is created.
図2を使用して説明した第1分類モデル31の構成は例示である。第1分類モデル31は、二次元画像58の入力を受け付けて、第1分類データ51を直接出力するように学習したモデルであってもよい。
The configuration of the first classification model 31 described using FIG. 2 is an example. The first classification model 31 may be a model trained to accept the input of the two-dimensional image 58 and directly output the first classification data 51 .
ラベル分類モデル35は、機械学習を利用したモデルに限定しない。ラベル分類モデル35は、たとえばエッジ抽出等の公知の画像処理手法に基づいて生体組織領域566を抽出するモデルであってもよい。
The label classification model 35 is not limited to models using machine learning. The label classification model 35 may be a model that extracts the biological tissue region 566 based on a known image processing technique such as edge extraction.
第1分類モデル31を使用する代わりに、二次元画像58の読影に習熟した専門家が二次元画像58を領域ごとに塗分けて、第1分類データ51を作成してもよい。このようにして作成された二次元画像58と第1分類データ51との組は、機械学習により第1分類モデル31またはラベル分類モデル35を生成する際の訓練データに利用できる。
Instead of using the first classification model 31, an expert skilled in interpretation of the two-dimensional image 58 may color the two-dimensional image 58 for each region to create the first classification data 51. A set of the two-dimensional image 58 and the first classification data 51 thus created can be used as training data when generating the first classification model 31 or the label classification model 35 by machine learning.
図3は、訓練DBを作成する情報処理装置200の構成を説明する説明図である。情報処理装置200は、制御部201、主記憶装置202、補助記憶装置203、通信部204、表示部205、入力部206およびバスを備える。制御部201は、本実施の形態のプログラムを実行する演算制御装置である。制御部201には、一または複数のCPU(Central Processing Unit)、GPU(Graphics Processing Unit)、またはマルチコアCPU等が使用される。制御部201は、バスを介して情報処理装置200を構成するハードウェア各部と接続されている。
FIG. 3 is an explanatory diagram illustrating the configuration of the information processing device 200 that creates the training DB. The information processing device 200 includes a control section 201, a main memory device 202, an auxiliary memory device 203, a communication section 204, a display section 205, an input section 206 and a bus. The control unit 201 is an arithmetic control device that executes the program of this embodiment. One or a plurality of CPUs (Central Processing Units), GPUs (Graphics Processing Units), multi-core CPUs, or the like is used for the control unit 201 . The control unit 201 is connected to each hardware unit forming the information processing apparatus 200 via a bus.
主記憶装置202は、SRAM(Static Random Access Memory)、DRAM(Dynamic Random Access Memory)、フラッシュメモリ等の記憶装置である。主記憶装置202には、制御部201が行なう処理の途中で必要な情報、および、制御部201で実行中のプログラムが一時的に保存される。
The main storage device 202 is a storage device such as SRAM (Static Random Access Memory), DRAM (Dynamic Random Access Memory), flash memory, or the like. The main storage device 202 temporarily stores information necessary during the processing performed by the control unit 201 and the program being executed by the control unit 201 .
補助記憶装置203は、SRAM、フラッシュメモリ、ハードディスクまたは磁気テープ等の記憶装置である。補助記憶装置203には、第1分類DB(Database)41、訓練DB42、制御部201に実行させるプログラム、およびプログラムの実行に必要な各種データが保存される。通信部204は、情報処理装置200とネットワークとの間の通信を行なうインターフェースである。第1分類DB41および訓練DB42は、情報処理装置200に接続された外部の大容量記憶装置等に記憶されていてもよい。
The auxiliary storage device 203 is a storage device such as SRAM, flash memory, hard disk, or magnetic tape. The auxiliary storage device 203 stores a first classification DB (Database) 41, a training DB 42, programs to be executed by the control unit 201, and various data necessary for executing the programs. Communication unit 204 is an interface that performs communication between information processing apparatus 200 and a network. The first classification DB 41 and the training DB 42 may be stored in an external large-capacity storage device or the like connected to the information processing device 200 .
表示部205は、たとえば液晶表示パネルまたは有機EL(Electro Luminescence)パネル等である。入力部206は、たとえばキーボードおよびマウス等である。表示部205に入力部206が積層されてタッチパネルを構成していてもよい。表示部205は、情報処理装置200に接続された表示装置であってもよい。情報処理装置200は、表示部205および入力部206を備えなくてもよい。
The display unit 205 is, for example, a liquid crystal display panel or an organic EL (Electro Luminescence) panel. Input unit 206 is, for example, a keyboard and a mouse. A touch panel may be configured by stacking the input unit 206 on the display unit 205 . The display unit 205 may be a display device connected to the information processing device 200 . The information processing device 200 does not have to include the display unit 205 and the input unit 206 .
情報処理装置200は、汎用のパソコン、タブレット、大型計算機、または、大型計算機上で動作する仮想マシンである。情報処理装置200は、分散処理を行なう複数のパソコン、または大型計算機等のハードウェアにより構成されても良い。情報処理装置200は、クラウドコンピューティングシステムまたは量子コンピュータにより構成されても良い。
The information processing device 200 is a general-purpose personal computer, tablet, large computer, or a virtual machine running on a large computer. The information processing apparatus 200 may be configured by hardware such as a plurality of personal computers or large-scale computers that perform distributed processing. The information processing device 200 may be configured by a cloud computing system or a quantum computer.
図4は、第1分類DB41のレコードレイアウトを説明する説明図である。第1分類DB41は、二次元画像58と第1分類データ51とを関連づけて記録したDBである。第1分類DB41は、二次元画像フィールドおよび第1分類データフィールドを有する。二次元画像フィールドには、二次元画像58が記録されている。第1分類データフィールドには第1分類データ51が記録されている。
FIG. 4 is an explanatory diagram for explaining the record layout of the first classification DB 41. FIG. The first classification DB 41 is a DB in which the two-dimensional image 58 and the first classification data 51 are associated and recorded. The first classification DB 41 has a two-dimensional image field and a first classification data field. A two-dimensional image 58 is recorded in the two-dimensional image field. First classification data 51 is recorded in the first classification data field.
第1分類DB41には、たとえば多くの医療機関から収集された二次元画像58と、二次元画像58に基づいて、たとえば図2を使用して説明した手法により作成された第1分類データ51との組が多数記録されている。第1分類DB41は、一枚の二次元画像58について、一つのレコードを有する。
The first classification DB 41 stores, for example, two-dimensional images 58 collected from many medical institutions, first classification data 51 created based on the two-dimensional images 58, for example, by the method described using FIG. A number of pairs have been recorded. The first classification DB 41 has one record for one two-dimensional image 58 .
図5は、訓練DB42のレコードレイアウトを説明する説明図である。訓練DB42は、二次元画像58と分類データとを関連づけて記録したDBである。訓練DB42は、二次元画像フィールドおよび分類データフィールドを有する。二次元画像フィールドには、二次元画像58が記録されている。分類データフィールドには、二次元画像58に関連づけられた分類データが記録されている。
FIG. 5 is an explanatory diagram for explaining the record layout of the training DB 42. The training DB 42 is a DB in which the two-dimensional image 58 and classification data are associated and recorded. The training DB 42 has a 2D image field and a classification data field. A two-dimensional image 58 is recorded in the two-dimensional image field. Classification data associated with the two-dimensional image 58 is recorded in the classification data field.
訓練DB42の二次元画像フィールドに記録されている二次元画像58は、第1分類DB41の二次元画像フィールドに記録されている二次元画像58と同一である。訓練DB42の分類データフィールドに記録されている分類データは、第1分類DB41の第1分類データフィールドに記録されている第1分類データ51、または、第1分類データ51に基づいて作成された第2分類データ52である。訓練DB42は、一枚の二次元画像58について、一つのレコードを有する。
The 2D image 58 recorded in the 2D image field of the training DB 42 is the same as the 2D image 58 recorded in the 2D image field of the first classification DB 41 . The classification data recorded in the classification data field of the training DB 42 is the first classification data 51 recorded in the first classification data field of the first classification DB 41, or the first classification data 51 created based on the first classification data 51. 2 classification data 52 . The training DB 42 has one record for one two-dimensional image 58 .
図6は、分割線61を作成する方法を説明する説明図である。図6は、第1内腔領域561が開いた状態である第1分類データ51を示す。生体組織領域566は、上側と下側の二つの部分に分離して描出されている。
FIG. 6 is an explanatory diagram explaining how to create the dividing line 61. FIG. FIG. 6 shows the first classification data 51 with the first lumen region 561 open. A living tissue region 566 is depicted separately in two parts, an upper part and a lower part.
図6においては、上側の生体組織領域566と下側の生体組織領域566との間に5本の分割線候補62が作成されている。上下の生体組織領域566を結ぶ限り、分割線候補62の位置は任意である。たとえば制御部201は、上側の生体組織領域566内のランダムな位置に第1点を選択し、下側の生体組織領域566内のランダムな位置に第2点を選択する。制御部201は、第1点と第2点とを結ぶ直線のうち、上側の生体組織領域566と下側の生体組織領域566とに挟まれた部分を分割線候補62に定める。
In FIG. 6, five parting line candidates 62 are created between the upper body tissue region 566 and the lower body tissue region 566 . The positions of the dividing line candidates 62 are arbitrary as long as they connect the upper and lower body tissue regions 566 . For example, the control unit 201 selects a first point at a random position within the upper biological tissue region 566 and selects a second point at a random position within the lower biological tissue region 566 . The control unit 201 determines, as a dividing line candidate 62 , a portion sandwiched between the upper biological tissue region 566 and the lower biological tissue region 566 on the straight line connecting the first point and the second point.
その後第1分類データ51は複数の分割線候補62から1本の分割線61を選択する。たとえば制御部201は、複数の分割線候補62のなかで最も短い分割線候補62を分割線61に選択する。制御部201は、複数の分割線候補62の中からランダムに1本の分割線候補62を分割線61に選択してもよい。分割線61を決定する方法の変形例については後述する。
After that, the first classification data 51 selects one dividing line 61 from a plurality of dividing line candidates 62 . For example, the control unit 201 selects the shortest parting line candidate 62 from among the plurality of parting line candidates 62 as the parting line 61 . The control unit 201 may randomly select one of the parting line candidates 62 as the parting line 61 from among the plurality of parting line candidates 62 . A modification of the method for determining the dividing line 61 will be described later.
図7は、RT形式画像におけるシータ方向の端部(図7に示す第1分類データ51における上下方向の端部)に生体組織領域566の開口部が存在する場合の処理を説明する説明図である。図7の左側に、RT形式画像の表示を開始する走査角度と、生体組織領域566が開口して見える向きと一致している場合のRT画像の例を示す。生体組織領域566が一塊に描出され、RT形式画像の上下の縁に接していない。このような状態では、分割線候補62の作成が難しい。
FIG. 7 is an explanatory diagram for explaining processing when an opening of the biological tissue region 566 exists at the edge in the theta direction (the edge in the vertical direction in the first classification data 51 shown in FIG. 7) in the RT format image. be. The left side of FIG. 7 shows an example of an RT image when the scanning angle at which the display of the RT format image is started matches the direction in which the living tissue region 566 can be seen through the opening. A body tissue region 566 is drawn as a mass and does not touch the upper and lower edges of the RT format image. In such a state, it is difficult to create the dividing line candidate 62 .
制御部201は、このようなRT形式画像を走査線に平行な切断線641で切断し、上下を入れ替えて貼付線642で接合することにより、図7の右側に示すようなRT画像に変換できる。生体組織領域566の開口部が向かい合った状態にすることにより、制御部201は、図6を使用して説明した手順を用いて分割線候補62を作成できる。
The control unit 201 cuts such an RT format image along a cutting line 641 parallel to the scanning line, turns it upside down, and joins it together with a pasting line 642, thereby converting it into an RT image as shown on the right side of FIG. . By arranging the openings of the biological tissue region 566 to face each other, the control unit 201 can create the dividing line candidate 62 using the procedure described using FIG.
制御部201は、RT形式画像を切断してから貼り合わせる代わりに、RT形式画像の表示を開始する走査角度を変更することによっても、同様の手順で分割線候補62を作成可能な二次元画像58を得られる。
The control unit 201 can also change the scanning angle at which the display of the RT format image is started, instead of cutting the RT format image and pasting it together. 58 is obtained.
図8から図12は、第2分類データ52を説明する説明図である。図9Aは、第1分類データ51中の、図8におけるB部に対応する場所の9ピクセルを拡大して示す模式図である。それぞれのピクセルに、「1」、「3」等のラベルが関連づけられている。以下の説明では「1」は第1内腔領域561を、「2」は腔外領域567を、「3」は生体組織領域566をそれぞれ示すラベルである。
FIGS. 8 to 12 are explanatory diagrams explaining the second classification data 52. FIG. FIG. 9A is a schematic diagram showing enlarged 9 pixels in the first classified data 51 corresponding to the B section in FIG. Each pixel is associated with a label such as "1", "3". In the following description, "1" is the label indicating the first lumen region 561, "2" is the label indicating the extracavity region 567, and "3" is the label indicating the biological tissue region 566, respectively.
図9Bは、図8におけるB部の9ピクセルを拡大して示す模式図である。図9Aと図9Bとは、同一の位置のピクセルを示す。図9Bにおいては、たとえば左上のピクセルに関連づけられた「1:80% 2:20%」のラベルは、「第1内腔領域561である確率が80パーセント、腔外領域567である確率が20パーセント」であることを示す。いずれのピクセルにおいても、第1内腔領域561である確率と、腔外領域567である確率とは、両者の合計が100%になるように配分されている。
FIG. 9B is a schematic diagram showing an enlarged 9 pixels of the B part in FIG. 9A and 9B show pixels at the same location. In FIG. 9B, for example, the label "1:80% 2:20%" associated with the upper left pixel indicates "80% probability of first lumen region 561, 20% probability of extraluminal region 567 percentage”. For any pixel, the probability that it is the first lumen region 561 and the probability that it is the extraluminal region 567 are distributed so that the sum of the two is 100%.
同様に、右下のピクセルに関連づけられた「3:100%」のラベルは、「生体組織領域566である確率が100パーセント」であることを示す。図9Aにおいて「3」のラベルが関連付けられたピクセルは、図9においては「3:100%」のラベルが関連づけられている。このように、第2分類データ52においては、1つのピクセルに対して複数のラベルの確率を関連づけることができる。
Similarly, the "3: 100%" label associated with the lower right pixel indicates "100% probability of being tissue region 566". The pixel associated with the label "3" in FIG. 9A is associated with the label "3:100%" in FIG. Thus, in the second classification data 52, one pixel can be associated with a plurality of label probabilities.
図10および図11を使用して、それぞれのピクセルに対応する確率を定める方法の一例を説明する。図10に、3個の対象ピクセル67と、それぞれに対応する接続線66を模式的に示す。接続線66は、対象ピクセル67と分割線61とを結ぶ線である。
An example of a method for determining the probability corresponding to each pixel will be described using FIGS. 10 and 11. FIG. FIG. 10 schematically shows three target pixels 67 and corresponding connection lines 66 . A connecting line 66 is a line that connects the target pixel 67 and the dividing line 61 .
実線の接続線66は、対象ピクセル67から分割線61に向けて垂直に引いた接続線66の例を示す。二点鎖線の接続線66は、対象ピクセル67から分割線61に向けて斜めに引いた接続線66の例を示す。破線の接続線66は、対象ピクセル67から接続線66に一回折れ曲がった折れ線で引いた接続線66の例を示す。
A solid connecting line 66 indicates an example of a connecting line 66 drawn vertically from the target pixel 67 toward the dividing line 61 . A two-dot chain connection line 66 is an example of a connection line 66 drawn obliquely from the target pixel 67 toward the dividing line 61 . A dashed connection line 66 is an example of a connection line 66 that is drawn from the target pixel 67 to the connection line 66 by a polygonal line that is bent once.
制御部201は、第1内腔領域561を構成するそれぞれのピクセルを対象ピクセル67に順次定め、生体組織領域566と交差しないように接続線66を作成し、接続線66の長さを算出する。接続線66を作成する際の優先度は、実線で示す垂直な接続線66が最も高い。対象ピクセル67から分割線61に垂直な対象ピクセル67を作成できない場合、制御部201は二点鎖線で例示したように生体組織領域566と交差しない最短の直線になるように接続線66を作成して、その長さを算出する。
The control unit 201 sequentially determines each pixel constituting the first lumen region 561 as the target pixel 67, creates the connection line 66 so as not to cross the living tissue region 566, and calculates the length of the connection line 66. . The vertical connection line 66 indicated by the solid line has the highest priority when creating the connection line 66 . If the target pixel 67 perpendicular to the dividing line 61 cannot be created from the target pixel 67, the control unit 201 creates the connecting line 66 so as to be the shortest straight line that does not cross the living tissue region 566, as illustrated by the two-dot chain line. and calculate its length.
対象ピクセル67と分割線61とを直線で接続する接続線66を作成できない場合、制御部201は、破線で例示するように生体組織領域566と交差せず、最短の折れ線になるように接続線66を作成して、その長さを算出する。1回の折れ線で接続線66を作成できない場合、制御部201は、2回以上の折れ線の接続線66を作成する。
If the connecting line 66 that connects the target pixel 67 and the dividing line 61 with a straight line cannot be created, the control unit 201 creates the connecting line so that it is the shortest polygonal line that does not cross the living tissue region 566 as illustrated by the dashed line. 66 and calculate its length. If the connecting line 66 cannot be created by one polygonal line, the control unit 201 creates the connecting line 66 of two or more polygonal lines.
図11は、接続線66の長さと、第1内腔領域561である確率および腔外領域567である確率との関係を示すグラフの一例である。横軸は、接続線66の長さを示す。横軸の「0」は、分割線61上であることを示す。横軸の正方向は、分割線61よりも右側、すなわち画像取得用カテーテル28から遠い側の領域に属する接続線66の長さを示す。横軸の負方向は、分割線61よりも左側、すなわち画像取得用カテーテル28に近い側の領域に属する接続線66の長さを示す。
FIG. 11 is an example of a graph showing the relationship between the length of the connecting line 66 and the probability of being the first lumen region 561 and the probability of being the extraluminal region 567 . The horizontal axis indicates the length of the connection line 66 . “0” on the horizontal axis indicates that it is on the dividing line 61 . The positive direction of the horizontal axis indicates the length of the connecting line 66 belonging to the region on the right side of the dividing line 61, that is, on the far side from the image acquisition catheter 28. FIG. The negative direction of the horizontal axis indicates the length of the connecting line 66 belonging to the area on the left side of the dividing line 61 , that is, on the side closer to the image acquisition catheter 28 .
たとえば、図8において分割線61に垂直に引いた仮想線S上における、第1内腔領域561である確率および腔外領域567である確率は、図11で示すグラフで表される。ここで、横軸の原点は、分割線61と仮想線Sとの交点に対応する。
For example, the probability of being the first lumen region 561 and the probability of being the extracavity region 567 on the virtual line S drawn perpendicular to the dividing line 61 in FIG. 8 are represented by the graph shown in FIG. Here, the origin of the horizontal axis corresponds to the intersection of the dividing line 61 and the virtual line S. As shown in FIG.
図11の縦軸は、確率を示す。実線は、第1内腔領域561である確率を、パーセントで示す。破線は、腔外領域567である確率を、パーセントで示す。図11に示す確率は、たとえば(1)式から(4)式に示すシグモイド曲線である。
The vertical axis in FIG. 11 indicates probability. The solid line indicates the probability of being the first lumen region 561 in percent. The dashed line indicates the probability of extraluminal region 567 in percent. The probabilities shown in FIG. 11 are, for example, sigmoid curves shown in formulas (1) to (4).

なお、図11においては、定数A=1である場合のグラフを例示する。
Note that FIG. 11 illustrates a graph when the constant A=1.
図12は、接続線66の長さと、第1内腔領域561である確率および腔外領域567である確率との関係を示すグラフの変形例である。縦軸および横軸と、実線グラフおよび破線グラフの意味とは、図11と同様であるため、説明を省略する。横軸に示すBは定数である。
FIG. 12 is a modified example of a graph showing the relationship between the length of the connecting line 66 and the probability of being the first lumen region 561 and the probability of being the extraluminal region 567 . The meanings of the vertical axis and horizontal axis, and the solid line graph and broken line graph are the same as in FIG. B shown on the horizontal axis is a constant.
図12においては、接続線66の長さが「-B」よりも小さい場合、すなわち閾値Bよりも画像取得用カテーテル28に近い場合、第1内腔領域561である確率が100パーセントである。同様に接続線66の長さが「+B」よりも大きい場合、すなわち閾値Bよりも画像取得用カテーテル28から遠い場合、腔外領域567である確率が100パーセントである。接続線66の長さが「-B」から「+B」までの範囲では、第1内腔領域561である確率は直線状に単調減少し、腔外領域567である確率は直線状に単調増加する。
In FIG. 12, when the length of the connecting line 66 is smaller than "-B", that is, when it is closer to the image acquisition catheter 28 than the threshold value B, the probability of being the first lumen region 561 is 100%. Similarly, if the length of connecting line 66 is greater than "+B", that is, if it is further from image acquisition catheter 28 than threshold B, the probability of being in extraluminal region 567 is 100 percent. In the range of the length of the connecting line 66 from "-B" to "+B", the probability of being the first lumen region 561 linearly and monotonically decreases, and the probability of being the extraluminal region 567 monotonously linearly increases. do.
第1内腔領域561である確率と腔外領域567である確率は、図11および図12に示すグラフに限定しない。パラメータであるAおよびBは任意に選択できる。たとえば、分割線61よりも左側では、第1領域571である確率が100パーセントであり、分割線61よりも右側では腔外領域567である確率が100パーセントであってもよい。
The probability of being the first lumen region 561 and the probability of being the extraluminal region 567 are not limited to the graphs shown in FIGS. The parameters A and B can be chosen arbitrarily. For example, the left side of the dividing line 61 may have a 100% probability of being the first region 571 , and the right side of the dividing line 61 may have a 100% probability of being the extracavity region 567 .
図13は、プログラムの処理の流れを説明するフローチャートである。制御部201は、第1分類DB41から1組の第1分類レコードを取得する(ステップS501)。ステップS501により、制御部201は本実施の形態の画像取得部の機能、および、第1分類データ取得部の機能を実現する。
FIG. 13 is a flowchart explaining the flow of program processing. The control unit 201 acquires a set of first classification records from the first classification DB 41 (step S501). By step S501, the control unit 201 realizes the function of the image acquisition unit and the function of the first classification data acquisition unit according to this embodiment.
制御部201は、第1内腔領域561が閉じた状態であるか否かを判定する(ステップS502)。ステップS502により、制御部201は本実施の形態の判定部の機能を実現する。閉じた状態であると判定した場合(ステップS502でYES)、制御部201は訓練DB42に新規レコードを作成して、ステップS501で取得したレコードに記録された二次元画像58と第1分類データ51とを記録する(ステップS503)。
The control unit 201 determines whether or not the first lumen region 561 is closed (step S502). By step S502, the control unit 201 implements the function of the determination unit of this embodiment. If it is determined that the state is closed (YES in step S502), the control unit 201 creates a new record in the training DB 42, and combines the two-dimensional image 58 and the first classification data 51 recorded in the record acquired in step S501. are recorded (step S503).
閉じた状態ではないと判定した場合(ステップS502でNO)、制御部201は分割線作成のサブルーチンを起動する(ステップS504)。分割線作成のサブルーチンは、開いた状態である第1内腔領域561を、画像取得用カテーテル28に近い側である第1領域571と、画像取得用カテーテル28から遠い側である第2領域572とに分割する分割線61を作成するサブルーチンである。分割線作成のサブルーチンにより、制御部201は本実施の形態の分割線作成部の機能を実現する。分割線作成のサブルーチンの処理の流れは後述する。
If it is determined that it is not in the closed state (NO in step S502), the control unit 201 starts a subroutine for creating parting lines (step S504). The dividing line creation subroutine divides the open first lumen region 561 into a first region 571 closer to the image acquisition catheter 28 and a second region 572 farther from the image acquisition catheter 28 . This is a subroutine for creating a dividing line 61 that divides the . By the parting line creation subroutine, the control unit 201 realizes the function of the parting line creating unit of the present embodiment. The processing flow of the dividing line creation subroutine will be described later.
制御部201は、第2分類データ作成のサブルーチンを起動する(ステップS505)。第2分類データ作成のサブルーチンは、第1分類データ51の第1内腔領域561を構成する各小領域について、第1内腔領域561である確率と、腔外領域567である確率とを配分した、第2分類データ52を作成するサブルーチンである。第2分類データ作成部により、制御部201は本実施の形態の第2分類データ作成部の機能を実現する。第2分類データ作成のサブルーチンの処理の流れは後述する。
The control unit 201 activates a subroutine for creating the second classification data (step S505). The second classification data creation subroutine distributes the probability of being the first lumen region 561 and the probability of being the extraluminal region 567 for each small region that constitutes the first lumen region 561 of the first classification data 51. This is a subroutine for creating the second classification data 52. The control unit 201 realizes the function of the second classification data creation unit of the present embodiment by the second classification data creation unit. The processing flow of the second classification data creation subroutine will be described later.
制御部201は、訓練DB42に新規レコードを作成して、二次元画像58と第2分類データ52とを記録する(ステップS506)。ここで二次元画像58は、ステップS501で取得されたレコードに記録された二次元画像58である。第2分類データ52は、ステップS505で作成した第2分類データ52である。
The control unit 201 creates a new record in the training DB 42 and records the two-dimensional image 58 and the second classification data 52 (step S506). Here, the two-dimensional image 58 is the two-dimensional image 58 recorded in the record obtained in step S501. The second classified data 52 is the second classified data 52 created in step S505.
ステップS503またはステップS506の終了後、制御部201は処理を終了するか否かを判定する(ステップS507)。たとえば制御部201は、第1分類DB41に記録されたすべてのレコードの処理を終了した場合に、処理を終了すると判定する。制御部201は、所定の数のレコードの処理を終了した場合に、処理を終了すると判定してもよい。
After the end of step S503 or step S506, the control unit 201 determines whether or not to end the processing (step S507). For example, the control unit 201 determines to end the process when all the records recorded in the first classification DB 41 have been processed. The control unit 201 may determine to end the process when a predetermined number of records have been processed.
処理を終了しないと判定した場合(ステップS507でNO)、制御部201はステップS501に戻る。処理を終了すると判定した場合(ステップS507でYES)、制御部201は処理を終了する。
If it is determined not to end the process (NO in step S507), the control unit 201 returns to step S501. If it is determined to end the process (YES in step S507), the control unit 201 ends the process.
図14は、分割線作成のサブルーチンの処理の流れを説明するフローチャートである。分割線作成のサブルーチンは、開いた状態である第1内腔領域561を、画像取得用カテーテル28に近い側である第1領域571と、画像取得用カテーテル28から遠い側である第2領域572とに分割する分割線61を作成するサブルーチンである。
FIG. 14 is a flowchart for explaining the processing flow of the dividing line creation subroutine. The dividing line creation subroutine divides the open first lumen region 561 into a first region 571 closer to the image acquisition catheter 28 and a second region 572 farther from the image acquisition catheter 28 . This is a subroutine for creating a dividing line 61 that divides the .
制御部201は、第1分類データ51に含まれる生体組織領域566が、RT形式画像の上下の縁に接しているか否かを判定する(ステップS511)。接していないと判定した場合(ステップS511でNO)、制御部201は、図7を使用して説明したように生体組織領域566を通る切断線641で第1分類データ51を切断し、上下を張り替える(ステップS512)。
The control unit 201 determines whether the body tissue region 566 included in the first classification data 51 is in contact with the upper and lower edges of the RT format image (step S511). If it is determined that they are not in contact (NO in step S511), the control unit 201 cuts the first classified data 51 along the cutting line 641 passing through the biological tissue region 566 as described using FIG. Replace (step S512).
接していると判定した場合(ステップS511でYES)、またはステップS512の終了後、制御部201は分割線候補62を1本作成する(ステップS513)。具体例を挙げて説明する。制御部201は、上側の生体組織領域566内のランダムな位置に第1点を選択する。制御部201は、下側の生体組織領域566内のランダムな位置に第2点を選択する。制御部201は、第1点と第2点とを結ぶ直線のうち、上側の生体組織領域566と下側の生体組織領域566とに挟まれた部分を分割線候補62に定める。
If it is determined that they are in contact (YES in step S511), or after step S512 is completed, the control unit 201 creates one dividing line candidate 62 (step S513). A specific example will be given for explanation. The control unit 201 selects a first point at a random position within the upper biological tissue region 566 . The control unit 201 selects a second point at a random position within the lower tissue region 566 . The control unit 201 determines, as a dividing line candidate 62 , a portion sandwiched between the upper biological tissue region 566 and the lower biological tissue region 566 on the straight line connecting the first point and the second point.
制御部201は、上側の生体組織領域566内の各ピクセルと、下側の生体組織領域566内の各ピクセルとの組み合わせを網羅するように、分割線候補62を作成してもよい。
The control unit 201 may create the dividing line candidates 62 so as to cover combinations of each pixel in the upper biological tissue region 566 and each pixel in the lower biological tissue region 566 .
制御部201は、分割線候補62に関する所定のパラメータを算出する(ステップS514)。パラメータは、たとえば分割線候補62の長さ、第1内腔領域561のうち、分割線候補62よりも画像取得用カテーテル28である領域の面積、または、分割線候補62の傾き等である。
The control unit 201 calculates a predetermined parameter regarding the parting line candidate 62 (step S514). The parameter is, for example, the length of the parting line candidate 62, the area of the image acquisition catheter 28 rather than the parting line candidate 62 in the first lumen region 561, the inclination of the parting line candidate 62, or the like.
制御部201は、分割線候補62の始点および終点と、算出したパラメータとを関連づけて、主記憶装置202または補助記憶装置203に一時的に記録する(ステップS515)。表1にステップS515で記録するデータの例を表形式で示す。
The control unit 201 associates the start point and end point of the parting line candidate 62 with the calculated parameters, and temporarily records them in the main storage device 202 or the auxiliary storage device 203 (step S515). Table 1 shows an example of data recorded in step S515 in tabular form.

制御部201は処理を終了するか否かを判定する(ステップS516)。たとえば、制御部201は所定の数の分割線候補62を作成した場合に、処理を終了すると判定する。制御部201は、ステップS514で算出したパラメータが所定の条件を満たした場合に、処理を終了すると判定してもよい。
The control unit 201 determines whether or not to end the process (step S516). For example, the control unit 201 determines to end the process when a predetermined number of dividing line candidates 62 are created. The control unit 201 may determine to end the process when the parameter calculated in step S514 satisfies a predetermined condition.
終了しないと判定した場合(ステップS516でNO)、制御部201はステップS513に戻る。終了すると判定した場合(ステップS516でYES)、制御部201はステップS515で記録した分割線候補62から、分割線61を選択する(ステップS517)。その後、制御部201は処理を終了する。
If it is determined not to end (NO in step S516), the control unit 201 returns to step S513. If it is determined to end (YES in step S516), the control unit 201 selects the dividing line 61 from the dividing line candidates 62 recorded in step S515 (step S517). After that, the control unit 201 terminates the processing.
たとえば制御部201は、ステップS514で分割線候補62の長さを算出し、ステップS517で最も短い分割線候補62をステップS517で選択する。制御部201は、ステップS514で分割線候補62の傾きを算出し、ステップS517でR軸となす角度がもっとも垂直に近い分割線候補62を選択してもよい。制御部201はステップS514で複数のパラメータを算出し、それらを演算した結果に基づいて分割線61を選択してもよい。
For example, the control unit 201 calculates the length of the parting line candidate 62 in step S514, and selects the shortest parting line candidate 62 in step S517. The control unit 201 may calculate the inclination of the parting line candidate 62 in step S514, and select the parting line candidate 62 whose angle with the R axis is closest to the vertical in step S517. The control unit 201 may calculate a plurality of parameters in step S514 and select the dividing line 61 based on the result of computing them.
なおステップS517において、複数の分割線候補62からユーザが分割線61を選択してもよい。具体的には、制御部201は二次元画像58または第1分類データ51に複数の分割線候補62を重畳させて表示部205に出力する。ユーザは、入力部206を操作して、適切だと判断した分割線候補62を選択する。制御部201は、ユーザによる選択に基づいて、分割線61を決定する。
In step S517, the user may select the dividing line 61 from a plurality of dividing line candidates 62. Specifically, the control unit 201 superimposes a plurality of dividing line candidates 62 on the two-dimensional image 58 or the first classification data 51 and outputs the result to the display unit 205 . The user operates the input unit 206 to select the dividing line candidate 62 that is determined to be appropriate. The control unit 201 determines the dividing line 61 based on the user's selection.
図15は、第2分類データ作成のサブルーチンの処理の流れを説明するフローチャートである。第2分類データ作成のサブルーチンは、第1分類データ51の第1内腔領域561を構成する各小領域について、第1内腔領域561である確率と、腔外領域567である確率とを配分した、第2分類データ52を作成するサブルーチンである。
FIG. 15 is a flowchart for explaining the processing flow of the second classification data creation subroutine. The second classification data creation subroutine distributes the probability of being the first lumen region 561 and the probability of being the extraluminal region 567 for each small region that constitutes the first lumen region 561 of the first classification data 51. This is a subroutine for creating the second classification data 52.
制御部201は、第1分類データ51を構成するピクセルを1個選択する(ステップS521)。制御部201は、選択したピクセルに関連づけられたラベルを取得する(ステップS522)。制御部201は、ラベルが第1内腔領域561に対応するか否かを判定する(ステップS523)。
The control unit 201 selects one pixel forming the first classified data 51 (step S521). The control unit 201 acquires the label associated with the selected pixel (step S522). The control unit 201 determines whether the label corresponds to the first lumen region 561 (step S523).
第1内腔領域561に対応すると判定した場合(ステップS523でYES)、制御部201はステップS521で選択したピクセルと、分割線61とを、生体組織領域566を通過せずに接続する接続線66の長さを算出する(ステップS524)。制御部201は、たとえば図11または図12を使用して説明した、接続線66の長さと確率との関係に基づいて、ステップS521で選択したピクセルが第1内腔領域561である確率を算出する(ステップS525)。同様に制御部201は、ステップS521で選択したピクセルが腔外領域567である確率を算出する(ステップS526)。
If it is determined that the control unit 201 corresponds to the first lumen region 561 (YES in step S523), the control unit 201 connects the pixel selected in step S521 and the dividing line 61 without passing through the biological tissue region 566. 66 is calculated (step S524). The control unit 201 calculates the probability that the pixel selected in step S521 is the first lumen region 561 based on the relationship between the length of the connection line 66 and the probability described using FIG. 11 or 12, for example. (step S525). Similarly, the control unit 201 calculates the probability that the pixel selected in step S521 is the extraluminal region 567 (step S526).
図9Bを使用して説明したように、制御部201は、ステップS521で選択したピクセルの位置と、ステップS525およびステップS526でそれぞれ算出した確率とを関連づけて、第2分類データ52に記録する(ステップS527)。ステップS527により、制御部201は本実施の形態の第2記録部の機能を実現する。
As described using FIG. 9B, the control unit 201 associates the position of the pixel selected in step S521 with the probability calculated in steps S525 and S526, and records them in the second classification data 52 ( step S527). By step S527, the control unit 201 implements the function of the second recording unit of the present embodiment.
第1内腔領域561に対応しないと判定した場合(ステップS523でNO)、制御部201はステップS521で接続したピクセルの位置と、ステップS522で取得したラベルである確率が100パーセントである旨とを関連づけて、第2分類データ52に記録する(ステップS528)。ステップS528により、制御部201は本実施の形態の第1記録部の機能を実現する。
If it is determined not to correspond to the first lumen region 561 (NO in step S523), the control unit 201 indicates that the position of the connected pixel in step S521 and the label acquired in step S522 have a probability of 100%. are associated with each other and recorded in the second classification data 52 (step S528). By step S528, the control unit 201 implements the function of the first recording unit of this embodiment.
制御部201は、第1分類データ51のすべてのピクセルの処理を終了したか否かを判定する(ステップS529)。終了していないと判定した場合(ステップS529でNO)、制御部201はステップS521に戻る。終了したと判定した場合(ステップS529でYES)、制御部201は処理を終了する。
The control unit 201 determines whether or not the processing of all pixels of the first classified data 51 has been completed (step S529). If it is determined that the processing has not ended (NO in step S529), the control unit 201 returns to step S521. If it is determined that the process has ended (YES in step S529), the control unit 201 ends the process.
なお、ステップS521において、制御部201は複数のピクセルにより構成された小領域を選択し、以後は小領域ごとに処理を行なってもよい。小領域ごとに処理する場合、制御部201はたとえば小領域中の特定の位置にあるピクセルに関連づけられたラベルに基づいて、当該小領域全体の処理を行なう。
It should be noted that in step S521, the control unit 201 may select a small area made up of a plurality of pixels, and thereafter perform processing for each small area. When processing each small region, the control unit 201 processes the entire small region based on the label associated with the pixel at a specific position in the small region, for example.
以上に説明したように、制御部201は、図13から図15を使用して説明したプログラムおよびサブルーチンを実行して、第1分類DB41に基づいて、訓練DB42を作成する。たとえば複数の医療機関等でそれぞれ作成された訓練DB42が一つのデータベースに統合されて、大規模な訓練DB42が作成されてもよい。
As described above, the control unit 201 executes the programs and subroutines described using FIGS. 13 to 15 to create the training DB 42 based on the first classification DB 41. For example, the training DBs 42 respectively created by a plurality of medical institutions may be integrated into one database to create a large-scale training DB 42 .
次に、作成された訓練DB42に基づいて第3分類モデル33を生成する処理について説明する。図16は、第3分類モデルを生成する情報処理装置210の構成を説明する説明図である。
Next, the process of generating the third classification model 33 based on the created training DB 42 will be described. FIG. 16 is an explanatory diagram illustrating the configuration of the information processing device 210 that generates the third classification model.
情報処理装置210は、制御部211、主記憶装置212、補助記憶装置213、通信部214、表示部215、入力部216およびバスを備える。制御部211は、本実施の形態のプログラムを実行する演算制御装置である。制御部211には、一または複数のCPU、GPU、マルチコアCPUまたはTPU(Tensor processing unit)等が使用される。制御部211は、バスを介して情報処理装置210を構成するハードウェア各部と接続されている。
The information processing device 210 includes a control unit 211, a main storage device 212, an auxiliary storage device 213, a communication unit 214, a display unit 215, an input unit 216, and a bus. The control unit 211 is an arithmetic control device that executes the program of this embodiment. One or a plurality of CPUs, GPUs, multi-core CPUs, TPUs (Tensor Processing Units), or the like is used for the control unit 211 . The control unit 211 is connected to each hardware unit forming the information processing apparatus 210 via a bus.
主記憶装置212は、SRAM、DRAM、フラッシュメモリ等の記憶装置である。主記憶装置212には、制御部211が行なう処理の途中で必要な情報、および、制御部211で実行中のプログラムが一時的に保存される。
The main storage device 212 is a storage device such as SRAM, DRAM, and flash memory. Main storage device 212 temporarily stores information necessary during processing performed by control unit 211 and a program being executed by control unit 211 .
補助記憶装置213は、SRAM、フラッシュメモリ、ハードディスクまたは磁気テープ等の記憶装置である。補助記憶装置213には、訓練DB42、制御部211に実行させるプログラム、およびプログラムの実行に必要な各種データが保存される。訓練DB42は、情報処理装置210に接続された外部の大容量記憶装置等に記憶されていてもよい。
The auxiliary storage device 213 is a storage device such as SRAM, flash memory, hard disk, or magnetic tape. The auxiliary storage device 213 stores the training DB 42, programs to be executed by the control unit 211, and various data necessary for executing the programs. The training DB 42 may be stored in an external large-capacity storage device or the like connected to the information processing device 210 .
通信部214は、情報処理装置210とネットワークとの間の通信を行なうインターフェースである。表示部215は、たとえば液晶表示パネルまたは有機ELパネル等である。入力部216は、たとえばキーボードおよびマウス等である。
The communication unit 214 is an interface that performs communication between the information processing device 210 and the network. Display unit 215 is, for example, a liquid crystal display panel or an organic EL panel. Input unit 216 is, for example, a keyboard and a mouse.
情報処理装置210は、汎用のパソコン、タブレット、大型計算機、大型計算機上で動作する仮想マシン、または、量子コンピュータである。情報処理装置210は、分散処理を行なう複数のパソコン、または大型計算機等のハードウェアにより構成されても良い。情報処理装置210は、クラウドコンピューティングシステムまたは量子コンピュータにより構成されても良い。
The information processing device 210 is a general-purpose personal computer, a tablet, a large computer, a virtual machine running on a large computer, or a quantum computer. The information processing apparatus 210 may be configured by hardware such as a plurality of personal computers or large computers that perform distributed processing. The information processing device 210 may be configured by a cloud computing system or a quantum computer.
図17は、機械学習を行なうプログラムの処理の流れを説明するフローチャートである。図17のプログラムの実行に先立ち、たとえばセマンティックセグメンテーションを実現するU-Net構造等の未学習のモデルが準備されている。U-Net構造は、多層のエンコーダ層と、その後ろに接続された多層のデコーダ層とを含む。それぞれのエンコーダ層は、プーリング層と畳込層とを含む。セマンティックセグメンテーションにより、入力された画像を構成するそれぞれの画素に対してラベルが付与される。なお、未学習のモデルは、Mask R-CNNモデル、その他任意の画像のセグメンテーションを実現するモデルであってもよい。
FIG. 17 is a flowchart explaining the processing flow of a program that performs machine learning. Prior to executing the program in FIG. 17, an unlearned model such as a U-Net structure that implements semantic segmentation is prepared. The U-Net structure includes multiple encoder layers followed by multiple decoder layers. Each encoder layer includes a pooling layer and a convolutional layer. Semantic segmentation assigns a label to each pixel that makes up the input image. Note that the unlearned model may be a Mask R-CNN model or any other model that realizes image segmentation.
たとえば、図2を使用して説明したラベル分類モデル35を未学習の第3分類モデル33に使用してもよい。ラベルデータ54を出力する学習が完了したラベル分類モデル35に対して、第3分類データ53を出力する学習を追加的に行なう転移学習により、少ない訓練データおよび学習回数で第3分類モデル33の機械学習を実現できる。
For example, the label classification model 35 described using FIG. 2 may be used for the unlearned third classification model 33. By transfer learning that additionally performs learning to output the third classification data 53 for the label classification model 35 that has completed learning to output the label data 54, the machine of the third classification model 33 can be learned with less training data and less number of times of learning. Learning can be realized.
制御部211は、訓練DB42から訓練レコードを取得する(ステップS541)。制御部211は、取得した訓練レコードに含まれる二次元画像58を、訓練中の第3分類モデル33に入力し、出力されるデータを取得する。以下の説明では、訓練中の第3分類モデル33から出力されるデータを、訓練中分類データと記載する。訓練中の第3分類モデル33は、本実施の形態の訓練中の学習モデルの例示である。
The control unit 211 acquires a training record from the training DB 42 (step S541). The control unit 211 inputs the two-dimensional image 58 included in the acquired training record to the third classification model 33 being trained, and acquires output data. In the following description, data output from the third classification model 33 during training is referred to as training classification data. The third classification model 33 during training is an example of the learning model during training of the present embodiment.
制御部211は、ステップS541で取得した訓練レコードに含まれる第2分類データ52と、訓練中分類データとの差異が小さくなるように、第3分類モデル33のパラメータを調整する(ステップS543)。ここで第2分類データ52と訓練中分類データとの差異は、たとえば両者のラベルが異なるピクセルの数に基づいて評価する。第3分類モデル33のパラメータの調整には、たとえば、SGD(Stochastic Gradient Descent:確率的勾配降下法)、またはAdam(Adaptive Moment estimation)等の、公知の機械学習手法を使用できる。
The control unit 211 adjusts the parameters of the third classification model 33 so that the difference between the second classification data 52 included in the training record acquired in step S541 and the during-training classification data is reduced (step S543). Here, the difference between the second classified data 52 and the training classified data is evaluated, for example, based on the number of pixels with different labels between the two. For adjusting the parameters of the third classification model 33, for example, a known machine learning method such as SGD (Stochastic Gradient Descent) or Adam (Adaptive Moment estimation) can be used.
制御部211は、パラメータの調整を終了するか否かを判定する(ステップS544)。たとえば、ハイパーパラメータで規定された所定の回数の学習を繰り返した場合に、制御部211は処理を終了すると判定する。制御部211は、訓練DB42からテストデータを取得して訓練中の第3分類モデル33に入力し、所定の精度の出力が得られた場合に処理を終了すると判定してもよい。
The control unit 211 determines whether or not to end parameter adjustment (step S544). For example, when learning is repeated a predetermined number of times defined by the hyperparameter, the control unit 211 determines to end the process. The control unit 211 may acquire test data from the training DB 42, input it to the third classification model 33 being trained, and determine to end the process when an output with a predetermined accuracy is obtained.
処理を終了しないと判定した場合(ステップS544でNO)、制御部211はステップS541に戻る。処理を終了すると判定した場合(ステップS544でYES)、制御部211は調整したパラメータを補助記憶装置213に記録する(ステップS545)。その後、制御部211は処理を終了する。以上により、第3分類モデル33の学習が完了する。
If it is determined not to end the process (NO in step S544), the control unit 211 returns to step S541. If it is determined to end the process (YES in step S544), the control unit 211 records the adjusted parameters in the auxiliary storage device 213 (step S545). After that, the control unit 211 terminates the process. With the above, the learning of the third classification model 33 is completed.
本実施の形態によると、管腔器官を構成する生体組織領域566の一部が欠損した状態に描出された二次元画像58が入力された場合であっても、画像取得用カテーテル28が挿入されている第1内腔領域561と、生体組織領域566の外側の腔外領域567とを区別して分類する第3分類モデル33を提供できる。第3分類モデル33を用いて分類を行なった第3分類データ53を表示することにより、ユーザが管腔器官の構造を素早く理解できるように支援できる。
According to the present embodiment, even when a two-dimensional image 58 rendered in a state in which a part of the biological tissue region 566 forming a hollow organ is missing is input, the image acquisition catheter 28 is inserted. A third classification model 33 can be provided that distinguishes and classifies the first luminal region 561 , and the extraluminal region 567 outside the tissue region 566 . By displaying the third classification data 53 classified using the third classification model 33, it is possible to assist the user in quickly understanding the structure of the hollow organ.
第3分類データ53を使用して二次元画像58を分類することにより、たとえば第1内腔領域561の断面積、体積および周囲長等の自動測定を適切に行なえる。
By classifying the two-dimensional image 58 using the third classification data 53, for example, the cross-sectional area, volume and perimeter of the first lumen region 561 can be appropriately automatically measured.
三次元走査用の画像取得用カテーテル28を使用して時系列的に取得した二次元画像58を、第3分類モデル33を用いて分類することにより、ノイズが少ない三次元画像を生成できる。
A three-dimensional image with little noise can be generated by classifying the two-dimensional images 58 acquired in time series using the image acquisition catheter 28 for three-dimensional scanning using the third classification model 33 .
[変形例1-1]
本変形例においては、第1内腔領域561が閉じた状態であるか否かの判定に、機械学習を用いて生成した開閉判定モデル37を使用する。実施の形態1と共通する部分については、説明を省略する。図18は、開閉判定モデルを説明する説明図である。 [Modification 1-1]
In this modified example, the open/close determination model 37 generated using machine learning is used to determine whether or not the first lumen region 561 is in the closed state. Descriptions of parts common to the first embodiment are omitted. FIG. 18 is an explanatory diagram for explaining the open/close determination model.
本変形例においては、第1内腔領域561が閉じた状態であるか否かの判定に、機械学習を用いて生成した開閉判定モデル37を使用する。実施の形態1と共通する部分については、説明を省略する。図18は、開閉判定モデルを説明する説明図である。 [Modification 1-1]
In this modified example, the open/
開閉判定モデル37は、二次元画像58の入力を受け付けて、第1内腔領域561が開いた状態である確率、および、閉じた状態である確率をそれぞれ出力する。図18においては、開いた状態である確率が90パーセントであり、閉じた状態である確率が10パーセントである旨が出力されている。
The open/close determination model 37 receives the input of the two-dimensional image 58 and outputs the probability that the first lumen region 561 is open and the probability that it is closed. In FIG. 18, it is output that the probability of being in the open state is 90% and the probability of being in the closed state is 10%.
開閉判定モデル37は、二次元画像58と、第1内腔領域561が開いた状態であるか、閉じた状態であるかを関連づけて多数組記録した訓練データを用いた機械学習により生成される。制御部201は、図13を使用して説明したステップS502において、二次元画像58を開閉判定モデル37に入力する。制御部201は、開いた状態である確率が所定の閾値を超えた場合に、第1内腔領域561が開いた状態である(ステップS502でYES)と判定する。開閉判定モデル37は、本実施の形態の到達判定モデルの例示である。
The open/close determination model 37 is generated by machine learning using training data in which a large number of sets are recorded in association with the two-dimensional image 58 and whether the first lumen region 561 is open or closed. . The control unit 201 inputs the two-dimensional image 58 to the open/close determination model 37 in step S502 described using FIG. The control unit 201 determines that the first lumen region 561 is in an open state (YES in step S502) when the probability of being in an open state exceeds a predetermined threshold. The open/close determination model 37 is an example of the arrival determination model of the present embodiment.
[変形例1-2]
本変形例においては、RT形式画像とXY形式画像との両方を使用して、複数の分割線候補62から分割線61を選択する。実施の形態1と共通する部分については、説明を省略する。図19は、変形例1-2の分割線61選択方法を説明する説明図である。図19Aは、RT形式で表示した第1分類データ51に対して、複数の分割線候補62を作成した状態を説明する説明図である。上側の生体組織領域566と、下側の生体組織領域566との間に、分割線候補62aから分割線候補62eまでの5本の分割線候補62が作成されている。分割線候補62はいずれも直線である。なお、図19に図示する分割線候補62は、説明のための例示である。 [Modification 1-2]
In this modification, both the RT format image and the XY format image are used to select adividing line 61 from a plurality of dividing line candidates 62 . Descriptions of parts common to the first embodiment are omitted. FIG. 19 is an explanatory diagram for explaining the method of selecting the dividing line 61 of Modification 1-2. FIG. 19A is an explanatory diagram illustrating a state in which a plurality of parting line candidates 62 are created for the first classification data 51 displayed in RT format. Between the upper biological tissue region 566 and the lower biological tissue region 566, five dividing line candidates 62 from dividing line candidate 62a to dividing line candidate 62e are created. All of the parting line candidates 62 are straight lines. Note that the dividing line candidate 62 illustrated in FIG. 19 is an example for explanation.
本変形例においては、RT形式画像とXY形式画像との両方を使用して、複数の分割線候補62から分割線61を選択する。実施の形態1と共通する部分については、説明を省略する。図19は、変形例1-2の分割線61選択方法を説明する説明図である。図19Aは、RT形式で表示した第1分類データ51に対して、複数の分割線候補62を作成した状態を説明する説明図である。上側の生体組織領域566と、下側の生体組織領域566との間に、分割線候補62aから分割線候補62eまでの5本の分割線候補62が作成されている。分割線候補62はいずれも直線である。なお、図19に図示する分割線候補62は、説明のための例示である。 [Modification 1-2]
In this modification, both the RT format image and the XY format image are used to select a
図19Bは、図19AをXY形式に座標変換した状態を説明する説明図である。中央のCは、第1分類データ51の中心、すなわち画像取得用カテーテル28の中心軸を示す。座標変換により、分割線候補62aから分割線候補62eは、略円弧形状に変換される。
FIG. 19B is an explanatory diagram illustrating a state in which FIG. 19A is coordinate-converted into the XY format. The central C indicates the center of the first classification data 51, that is, the central axis of the image acquisition catheter 28. FIG. Due to the coordinate conversion, the dividing line candidates 62a to 62e are transformed into a substantially circular arc shape.
図19Bにおいて、分割線候補62dおよび分割線候補62eの両端を直線で結んだ場合、生体組織領域566と交差する。本変形例においては、XY形式に座標変換した場合に生体組織領域566と交差する分割線候補62は、分割線61に選択されない。分割線候補62aから62cは、両端を直線で結んだ場合に生体組織領域566と交差しない。これらの分割線候補62は、いずれも分割線61に選択される可能性がある。それぞれの分割線候補62に関するパラメータは、XY形式画像上で判定されてもよい。
In FIG. 19B, when both ends of the dividing line candidate 62d and the dividing line candidate 62e are connected with a straight line, they intersect with the biological tissue region 566. In this modified example, the dividing line candidate 62 that intersects the biological tissue region 566 when the coordinates are transformed into the XY format is not selected as the dividing line 61 . Parting line candidates 62a to 62c do not intersect living tissue region 566 when both ends are connected by straight lines. Any of these dividing line candidates 62 may be selected as the dividing line 61 . The parameters for each split line candidate 62 may be determined on the XY format image.
図20は、変形例1-2の分割線作成のサブルーチンの処理の流れを説明するフローチャートである。分割線作成のサブルーチンは、開いた状態である第1内腔領域561を、画像取得用カテーテル28に近い側である第1領域571と、画像取得用カテーテル28から遠い側である第2領域572とに分割する分割線61を作成するサブルーチンである。図20のサブルーチンは、図14を使用して説明したサブルーチンの代わりに使用される。
FIG. 20 is a flow chart for explaining the process flow of the dividing line creation subroutine of modification 1-2. The dividing line creation subroutine divides the open first lumen region 561 into a first region 571 closer to the image acquisition catheter 28 and a second region 572 farther from the image acquisition catheter 28 . This is a subroutine for creating a dividing line 61 that divides the . The subroutine of FIG. 20 is used instead of the subroutine described using FIG.
ステップS511からステップS513までは、図14を使用して説明したプログラムの処理の流れと同一であるため、説明を省略する。制御部201は、分割線候補62を重畳した第1分類データ51をXY形式に変換する(ステップS551)。
Since steps S511 to S513 are the same as the processing flow of the program described using FIG. 14, description thereof will be omitted. The control unit 201 converts the first classification data 51 on which the parting line candidate 62 is superimposed into the XY format (step S551).
制御部201は、XY形式に変換した分割線候補62の両端を結ぶ直線を作成する(ステップS552)。制御部201は、作成した直線が、生体組織領域566を通過するか否かを判定する(ステップS553)。通過すると判定した場合(ステップS553でYES)、制御部201はステップS513に戻る。
The control unit 201 creates a straight line connecting both ends of the dividing line candidate 62 converted into the XY format (step S552). The control unit 201 determines whether or not the created straight line passes through the biological tissue region 566 (step S553). If it is determined to pass (YES in step S553), the control unit 201 returns to step S513.
通過しないと判定した場合(ステップS553でNO)、制御部201は、分割線候補62に関する所定のパラメータを算出する(ステップS514)。制御部201は、RT形式でパラメータを算出しても、XY形式で算出してもよい。制御部201は、RT形式とXY形式の両方でパラメータを算出してもよい。以後の処理は、図14を使用して説明したプログラムの処理の流れと同一であるため、説明を省略する。
If it is determined not to pass through (NO in step S553), the control unit 201 calculates a predetermined parameter regarding the dividing line candidate 62 (step S514). The control unit 201 may calculate the parameters in RT format or in XY format. The control unit 201 may calculate parameters in both the RT format and the XY format. Since subsequent processing is the same as the processing flow of the program described using FIG. 14, description thereof is omitted.
ユーザが臨床現場で通常使用する画像は、XY形式の画像である。本変形例によると、XY画像を観察するユーザの感覚と合致する分割線61を自動的に生成できる。
The images that users normally use in clinical practice are XY format images. According to this modification, it is possible to automatically generate the dividing line 61 that matches the feeling of the user observing the XY image.
[変形例1-3]
本変形例は、図20を使用して説明したフローチャートのステップS517において、複数の分割線候補62から分割線61を選択する方法に関する。変形例1-2と共通する部分については、説明を省略する。本変形例においては、ステップS514においては、同一のパラメータをRT形式とXY形式の双方で算出する。その後、RT形式で算出したパラメータと、XY形式で算出したパラメータとを演算した結果に基づいて、分割線61を選択する。 [Modification 1-3]
This modification relates to a method of selecting adividing line 61 from a plurality of dividing line candidates 62 in step S517 of the flowchart described using FIG. The description of the parts common to Modification 1-2 is omitted. In this modification, in step S514, the same parameter is calculated in both the RT format and the XY format. After that, the dividing line 61 is selected based on the result of computing the parameters calculated in the RT format and the parameters calculated in the XY format.
本変形例は、図20を使用して説明したフローチャートのステップS517において、複数の分割線候補62から分割線61を選択する方法に関する。変形例1-2と共通する部分については、説明を省略する。本変形例においては、ステップS514においては、同一のパラメータをRT形式とXY形式の双方で算出する。その後、RT形式で算出したパラメータと、XY形式で算出したパラメータとを演算した結果に基づいて、分割線61を選択する。 [Modification 1-3]
This modification relates to a method of selecting a
分割線候補62の長さをパラメータに使用する場合を例にして説明する。制御部201は、それぞれの分割線候補62について、RT形式画像上で算出したRT長さと、XY形式画像上で算出したXY長さとの平均値を算出する。平均値は、たとえば相加平均値、または、相乗平均値である。制御部201は、たとえば平均値がもっとも短い分割線候補62を選択して、分割線61を定める。
A case where the length of the dividing line candidate 62 is used as a parameter will be described as an example. The control unit 201 calculates the average value of the RT length calculated on the RT format image and the XY length calculated on the XY format image for each parting line candidate 62 . The average value is, for example, an arithmetic average value or a geometric average value. The control unit 201 determines the dividing line 61 by selecting, for example, the dividing line candidate 62 having the shortest average value.
[変形例1-4]
本変形例においては、生体組織領域566と第1内腔領域561との間の境界線から特徴点を抽出して分割線候補62を作成する。実施の形態1と共通する部分については、説明を省略する。 [Modification 1-4]
In this modification, the dividingline candidate 62 is created by extracting feature points from the boundary line between the biological tissue region 566 and the first lumen region 561 . Descriptions of parts common to the first embodiment are omitted.
本変形例においては、生体組織領域566と第1内腔領域561との間の境界線から特徴点を抽出して分割線候補62を作成する。実施の形態1と共通する部分については、説明を省略する。 [Modification 1-4]
In this modification, the dividing
図21は、変形例1-4の分割線候補62を説明する説明図である。星印は、生体組織領域566と第1内腔領域561との間の境界線から抽出された特徴点を示す。特徴点は、たとえば境界線が曲がっている部分、および、境界線の変曲点等である。
FIG. 21 is an explanatory diagram for explaining the parting line candidate 62 of modification 1-4. Asterisks indicate feature points extracted from the boundary line between the tissue region 566 and the first lumen region 561 . The feature points are, for example, a curved portion of the boundary line, an inflection point of the boundary line, and the like.
本変形例においては、分割線候補62は、2つの特徴点同士を結んで作成される。分割線候補62の起点および終点を特徴点に限定することにより、分割線61を作成する処理を高速化できる。
In this modified example, the dividing line candidate 62 is created by connecting two feature points. By limiting the starting point and the ending point of the dividing line candidate 62 to feature points, the speed of the process of creating the dividing line 61 can be increased.
[変形例1-5]
本変形例は、図17を使用して説明した機械学習のステップS543において、第2分類データ52と第3分類モデル33との差異の定量化を行なう手法の変形例である。実施の形態1と共通する部分については、説明を省略する。 [Modification 1-5]
This modification is a modification of the method of quantifying the difference between thesecond classification data 52 and the third classification model 33 in step S543 of the machine learning described using FIG. Descriptions of parts common to the first embodiment are omitted.
本変形例は、図17を使用して説明した機械学習のステップS543において、第2分類データ52と第3分類モデル33との差異の定量化を行なう手法の変形例である。実施の形態1と共通する部分については、説明を省略する。 [Modification 1-5]
This modification is a modification of the method of quantifying the difference between the
図22は、変形例1-5の機械学習を説明する説明図である。実線で示す正解境界線691は、第2分類データ52をXY形式で表示した場合の、第1内腔領域561の外側の境界線を示す。なお、分割線61に基づいて第1内腔領域561と腔外領域567とに確率を配分した領域については、第1内腔領域561である確率が50パーセントである場所を、第1内腔領域561の境界線であると定義する。
FIG. 22 is an explanatory diagram explaining the machine learning of modification 1-5. A correct boundary line 691 indicated by a solid line indicates the outer boundary line of the first lumen region 561 when the second classified data 52 is displayed in the XY format. It should be noted that, for the regions in which the probabilities are distributed to the first lumen region 561 and the extraluminal region 567 based on the dividing line 61, the region where the probability of being the first lumen region 561 is 50% is defined as the first lumen region 561. Define to be the boundary of region 561 .
破線で示す出力境界線692は、二次元画像58を訓練中の第3分類モデル33に入力し、第3分類モデル33から出力された訓練中分類データにおける、第1内腔領域561の外側の境界線を示す。Cは、二次元画像58の中心、すなわち画像取得用カテーテル28の中心軸を示す。Lは、画像取得用カテーテル28の走査線方向に沿った正解境界線691と出力境界線692との距離を示す。
An output boundary line 692, indicated by a dashed line, is the boundary outside the first lumen region 561 in the training classification data output from the third classification model 33 during training of the two-dimensional image 58. Show boundaries. C indicates the center of the two-dimensional image 58 , ie the central axis of the image acquisition catheter 28 . L indicates the distance between the correct boundary line 691 and the output boundary line 692 along the scanning line direction of the image acquisition catheter 28 .
ステップS543において制御部201は、たとえば10度刻みの合計36か所で測定したLの平均値が小さくなるように、第3分類モデル33のパラメータを調整する。制御部201は、たとえばLの最大値が小さくなるように、第3分類モデル33のパラメータを調整してもよい。
In step S543, the control unit 201 adjusts the parameters of the third classification model 33 so that the average value of L measured at a total of 36 points in increments of 10 degrees, for example, becomes small. The control unit 201 may adjust the parameters of the third classification model 33, for example, so that the maximum value of L becomes small.
[実施の形態2]
本実施の形態は、第1分類DB41の代わりに、多数の二次元画像58が記録された二次元画像DBを使用するプログラムに関する。二次元画像DBは、図4を使用して説明した第1分類DB41のうち、第1分類データフィールドを有さないデータベースである。実施の形態1と共通する部分については、説明を省略する。 [Embodiment 2]
This embodiment relates to a program that uses a two-dimensional image DB in which many two-dimensional images 58 are recorded, instead of the first classification DB 41 . The two-dimensional image DB is a database that does not have the first classification data field in the first classification DB 41 described using FIG. Descriptions of parts common to the first embodiment are omitted.
本実施の形態は、第1分類DB41の代わりに、多数の二次元画像58が記録された二次元画像DBを使用するプログラムに関する。二次元画像DBは、図4を使用して説明した第1分類DB41のうち、第1分類データフィールドを有さないデータベースである。実施の形態1と共通する部分については、説明を省略する。 [Embodiment 2]
This embodiment relates to a program that uses a two-dimensional image DB in which many two-
図23は、実施の形態2のプログラムの処理の流れを説明するフローチャートである。制御部201は、二次元画像DBから1枚の二次元画像を取得する(ステップS601)。制御部201は、第1分類データ生成のサブルーチンを起動する(ステップS602)。第1分類データ生成のサブルーチンは、二次元画像58に基づいて第1分類データ51を生成するサブルーチンである。第1分類データ生成のサブルーチンの処理の流れは後述する。
FIG. 23 is a flowchart for explaining the processing flow of the program according to the second embodiment. The control unit 201 acquires one two-dimensional image from the two-dimensional image DB (step S601). The control unit 201 starts a subroutine for generating the first classification data (step S602). The first classification data generation subroutine is a subroutine for generating the first classification data 51 based on the two-dimensional image 58 . The processing flow of the first classification data generation subroutine will be described later.
制御部201は、第1内腔領域561が閉じた状態であるか否かを判定する(ステップS502)。以後、ステップS603までの処理の流れは、図13を使用して説明した実施の形態1のプログラムと同様であるため、説明を省略する。
The control unit 201 determines whether or not the first lumen region 561 is closed (step S502). After that, the flow of processing up to step S603 is the same as that of the program of the first embodiment described using FIG. 13, so description thereof will be omitted.
ステップS503またはステップS506の終了後、制御部201は処理を終了するか否かを判定する(ステップS603)。たとえば制御部201は、二次元画像DBに記録されたすべてのレコードの処理を終了した場合に、処理を終了すると判定する。制御部201は、所定の数のレコードの処理を終了した場合に、処理を終了すると判定してもよい。
After the end of step S503 or step S506, the control unit 201 determines whether or not to end the processing (step S603). For example, the control unit 201 determines to end the process when all the records recorded in the two-dimensional image DB have been processed. The control unit 201 may determine to end the process when a predetermined number of records have been processed.
処理を終了しないと判定した場合(ステップS603でNO)、制御部201はステップS601に戻る。処理を終了すると判定した場合(ステップS603でYES)、制御部201は処理を終了する。
If it is determined not to end the process (NO in step S603), the control unit 201 returns to step S601. If it is determined to end the process (YES in step S603), the control unit 201 ends the process.
図24は、第1分類データ生成のサブルーチンの処理の流れを説明するフローチャートである。第1分類データ生成のサブルーチンは、二次元画像58に基づいて第1分類データ51を生成するサブルーチンである。
FIG. 24 is a flowchart for explaining the processing flow of the first classification data generation subroutine. The first classification data generation subroutine is a subroutine for generating the first classification data 51 based on the two-dimensional image 58 .
制御部201は、二次元画像58をラベル分類モデル35に入力し、出力されたラベルデータ54を取得する(ステップS611)。制御部201は、ラベルデータ54から非生体組織領域568に対応するラベルが記録された、一塊の非生体組織領域568を抽出する(ステップS612)。
The control unit 201 inputs the two-dimensional image 58 to the label classification model 35 and acquires the output label data 54 (step S611). The control unit 201 extracts a group of non-living tissue regions 568 in which labels corresponding to the non-living tissue regions 568 are recorded from the label data 54 (step S612).
制御部201は、抽出した非生体組織領域568が、画像取得用カテーテル28側の縁に接する第1内腔領域561であるか否かを判定する(ステップS613)。第1内腔領域561であると判定した場合(ステップS613でYES)、制御部201は、ステップS612で抽出した非生体組織領域568に対応するラベルを、第1内腔領域561に対応するラベルに変更する(ステップS614)。
The control unit 201 determines whether the extracted non-biological tissue region 568 is the first lumen region 561 in contact with the edge on the image acquisition catheter 28 side (step S613). If it is determined to be the first lumen region 561 (YES in step S613), the control unit 201 replaces the label corresponding to the non-living tissue region 568 extracted in step S612 with the label corresponding to the first lumen region 561. (step S614).
第1内腔領域561ではないと判定した場合(ステップS613でNO)、制御部201は、抽出した非生体組織領域568が、生体組織領域566に囲まれた第2内腔領域562であるか否かを判定する(ステップS615)。第2内腔領域562であると判定した場合(ステップS615でYES)、制御部201は、ステップS612で抽出した非生体組織領域568に対応するラベルを、第2内腔領域562に対応するラベルに変更する(ステップS616)。
When it is determined that the extracted non-body tissue region 568 is not the first lumen region 561 (NO in step S613), the control unit 201 determines whether the extracted non-body tissue region 568 is the second lumen region 562 surrounded by the body tissue region 566. It is determined whether or not (step S615). If it is determined to be the second lumen region 562 (YES in step S615), the control unit 201 replaces the label corresponding to the non-living tissue region 568 extracted in step S612 with the label corresponding to the second lumen region 562. (step S616).
第2内腔領域562ではないと判定した場合(ステップS615でNO)、制御部201は、ステップS612で抽出した非生体組織領域568に対応するラベルを、腔外領域567に対応するラベルに変更する(ステップS617)。
If it is determined not to be the second lumen region 562 (NO in step S615), the control unit 201 changes the label corresponding to the non-biological tissue region 568 extracted in step S612 to the label corresponding to the extracavity region 567. (step S617).
ステップS614、ステップS616またはステップS617の終了後、制御部201はステップS611で取得したラベルデータ54に含まれる非生体組織領域568の処理を終了したか否かを判定する(ステップS618)。終了していないと判定した場合(ステップS618でNO)、制御部201はステップS612に戻る。終了したと判定した場合(ステップS618でYES)、制御部201は処理を終了する。
After step S614, step S616, or step S617 is completed, the control unit 201 determines whether or not processing of the non-living tissue region 568 included in the label data 54 acquired in step S611 has been completed (step S618). If it is determined that the processing has not ended (NO in step S618), the control unit 201 returns to step S612. If it is determined that the process has ended (YES in step S618), the control unit 201 ends the process.
[実施の形態3]
本実施の形態は、三次元走査型の画像取得用カテーテル28を使用して、リアルタイムに三次元画像を生成するカテーテルシステム10に関する。実施の形態1と共通する部分については、説明を省略する。 [Embodiment 3]
This embodiment relates to acatheter system 10 that uses a three-dimensional scanning image acquisition catheter 28 to generate three-dimensional images in real time. Descriptions of parts common to the first embodiment are omitted.
本実施の形態は、三次元走査型の画像取得用カテーテル28を使用して、リアルタイムに三次元画像を生成するカテーテルシステム10に関する。実施の形態1と共通する部分については、説明を省略する。 [Embodiment 3]
This embodiment relates to a
図25は、実施の形態3のカテーテルシステム10の構成を説明する説明図である。カテーテルシステム10は、画像処理装置220と、カテーテル制御装置27とMDU(Motor Driving Unit)289と、画像取得用カテーテル28とを備える。画像取得用カテーテル28は、MDU289およびカテーテル制御装置27を介して画像処理装置220に接続されている。
FIG. 25 is an explanatory diagram illustrating the configuration of the catheter system 10 of Embodiment 3. FIG. The catheter system 10 includes an image processing device 220 , a catheter control device 27 , an MDU (Motor Driving Unit) 289 , and an image acquisition catheter 28 . Image acquisition catheter 28 is connected to image processing device 220 via MDU 289 and catheter control device 27 .
画像処理装置220は、制御部221、主記憶装置222、補助記憶装置223、通信部224、表示部225、入力部226およびバスを備える。制御部221は、本実施の形態のプログラムを実行する演算制御装置である。制御部221には、一または複数のCPU、GPU、またはマルチコアCPU等が使用される。制御部221は、バスを介して画像処理装置220を構成するハードウェア各部と接続されている。
The image processing device 220 includes a control section 221, a main memory device 222, an auxiliary memory device 223, a communication section 224, a display section 225, an input section 226 and a bus. The control unit 221 is an arithmetic control device that executes the program of this embodiment. One or a plurality of CPUs, GPUs, multi-core CPUs, or the like is used for the control unit 221 . The control unit 221 is connected to each hardware unit forming the image processing apparatus 220 via a bus.
主記憶装置222は、SRAM、DRAM、フラッシュメモリ等の記憶装置である。主記憶装置222には、制御部221が行なう処理の途中で必要な情報、および、制御部221で実行中のプログラムが一時的に保存される。
The main storage device 222 is a storage device such as SRAM, DRAM, and flash memory. The main storage device 222 temporarily stores information necessary during the process performed by the control unit 221 and the program being executed by the control unit 221 .
補助記憶装置223は、SRAM、フラッシュメモリ、ハードディスクまたは磁気テープ等の記憶装置である。補助記憶装置223には、ラベル分類モデル35、制御部221に実行させるプログラム、およびプログラムの実行に必要な各種データが保存される。通信部224は、画像処理装置220とネットワークとの間の通信を行なうインターフェースである。ラベル分類モデル35は、画像処理装置220に接続された外部の大容量記憶装置等に記憶されていてもよい。
The auxiliary storage device 223 is a storage device such as SRAM, flash memory, hard disk, or magnetic tape. The auxiliary storage device 223 stores the label classification model 35, programs to be executed by the control unit 221, and various data necessary for executing the programs. A communication unit 224 is an interface that performs communication between the image processing apparatus 220 and a network. The label classification model 35 may be stored in an external mass storage device or the like connected to the image processing device 220 .
表示部225は、たとえば液晶表示パネルまたは有機ELパネル等である。入力部226は、たとえばキーボードおよびマウス等である。表示部225に入力部226が積層されてタッチパネルを構成していてもよい。表示部225は、画像処理装置220に接続された表示装置であってもよい。
The display unit 225 is, for example, a liquid crystal display panel or an organic EL panel. Input unit 226 is, for example, a keyboard and a mouse. The input unit 226 may be layered on the display unit 225 to form a touch panel. The display unit 225 may be a display device connected to the image processing device 220 .
画像処理装置220は、汎用のパソコン、タブレット、大型計算機、または、大型計算機上で動作する仮想マシンである。画像処理装置220は、分散処理を行なう複数のパソコン、または大型計算機等のハードウェアにより構成されても良い。画像処理装置220は、クラウドコンピューティングシステムにより構成されても良い。画像処理装置220とカテーテル制御装置とは、一体のハードウェアを構成していてもよい。
The image processing device 220 is a general-purpose personal computer, tablet, large computer, or a virtual machine running on a large computer. The image processing apparatus 220 may be configured by hardware such as a plurality of personal computers or large computers that perform distributed processing. The image processing device 220 may be configured by a cloud computing system. The image processing device 220 and the catheter control device may constitute integrated hardware.
画像取得用カテーテル28は、シース281と、シース281の内部に挿通されたシャフト283と、シャフト283の先端に配置されたセンサ282とを有する。MDU289は、シース281の内部でシャフト283およびセンサ282を回転および進退させる。
The image acquisition catheter 28 has a sheath 281 , a shaft 283 inserted inside the sheath 281 , and a sensor 282 arranged at the tip of the shaft 283 . MDU 289 rotates and advances shaft 283 and sensor 282 inside sheath 281 .
カテーテル制御装置27は、センサ282の一回転ごとに1枚の二次元画像58を生成する。MDU289がセンサ282を引っ張りながら、または押し込みながら回転させる操作により、カテーテル制御装置27はシース281に略垂直な複数枚の二次元画像58を連続的に生成する。
The catheter control device 27 generates one two-dimensional image 58 for each rotation of the sensor 282 . By rotating the sensor 282 while the MDU 289 is pulling or pushing it, the catheter control device 27 continuously generates a plurality of two-dimensional images 58 substantially perpendicular to the sheath 281 .
制御部221は、カテーテル制御装置27から二次元画像58を逐次取得する。制御部221は、それぞれの二次元画像58に基づいて第1分類データ51および分割線61を生成する。制御部221は、時系列的に取得した複数の第1分類データ51と分割線61とに基づいて三次元画像を生成し、表示部225に出力する。以上により、いわゆる三次元走査が行なわれる。
The control unit 221 sequentially acquires the two-dimensional image 58 from the catheter control device 27. The control unit 221 generates the first classification data 51 and the dividing line 61 based on each two-dimensional image 58 . The control unit 221 generates a three-dimensional image based on the plurality of first classification data 51 and the dividing line 61 acquired in time series, and outputs the three-dimensional image to the display unit 225 . As described above, so-called three-dimensional scanning is performed.
センサ282の進退操作には、画像取得用カテーテル28全体を進退させる操作と、シース281の内部でセンサ282を進退させる操作との両方を含む。進退操作は、MDU289により所定の速度で自動的に行なわれても、ユーザにより手動で行なわれても良い。
The advance/retreat operation of the sensor 282 includes both an operation to advance/retreat the entire image acquisition catheter 28 and an operation to advance/retreat the sensor 282 inside the sheath 281 . The advance/retreat operation may be automatically performed at a predetermined speed by the MDU 289, or may be manually performed by the user.
なお、画像取得用カテーテル28は機械的に回転および進退を行なう機械走査方式に限定しない。たとえば、複数の超音波トランスデューサを環状に配置したセンサ282を用いた、電子ラジアル走査型の画像取得用カテーテル28であってもよい。
It should be noted that the image acquisition catheter 28 is not limited to a mechanical scanning method that mechanically rotates and advances and retreats. For example, it may be an electronic radial scanning type image acquisition catheter 28 using a sensor 282 in which a plurality of ultrasonic transducers are arranged in a ring.
図26は、実施の形態3のプログラムの処理の流れを説明するフローチャートである。制御部221は、ユーザから三次元走査開始の指示を受け付けた場合に、図26を使用して説明するプログラムを実行する。
FIG. 26 is a flow chart for explaining the processing flow of the program according to the third embodiment. When the control unit 221 receives an instruction to start three-dimensional scanning from the user, the control unit 221 executes a program described using FIG. 26 .
制御部221は、カテーテル制御装置27に三次元走査の開始を指示する(ステップS631)。カテーテル制御装置27は、MDU289を制御して、三次元走査を開始する。制御部221は、カテーテル制御装置27から1枚の二次元画像58を取得する(ステップS632)。制御部221は、図24を使用して説明した第1分類データ生成のサブルーチンを起動する(ステップS633)。第1分類データ生成のサブルーチンは、二次元画像58に基づいて第1分類データ51を生成するサブルーチンである。
The control unit 221 instructs the catheter control device 27 to start three-dimensional scanning (step S631). Catheter controller 27 controls MDU 289 to initiate three-dimensional scanning. The control unit 221 acquires one two-dimensional image 58 from the catheter control device 27 (step S632). The control unit 221 activates the first classification data generation subroutine described using FIG. 24 (step S633). The first classification data generation subroutine is a subroutine for generating the first classification data 51 based on the two-dimensional image 58 .
制御部221は、第1内腔領域561が閉じた状態であるか否かを判定する(ステップS634)。閉じた状態であると判定した場合(ステップS634でYES)、制御部221は補助記憶装置223または主記憶装置222に第1分類データ51を記録する(ステップS635)。
The control unit 221 determines whether or not the first lumen region 561 is closed (step S634). If it is determined to be closed (YES in step S634), the control unit 221 records the first classification data 51 in the auxiliary storage device 223 or main storage device 222 (step S635).
閉じた状態ではないと判定した場合(ステップS634でNO)、制御部221は図14または図20を使用して説明した分割線作成のサブルーチンを起動する(ステップS636)。分割線作成のサブルーチンは、開いた状態である第1内腔領域561を、画像取得用カテーテル28に近い側である第1領域571と、画像取得用カテーテル28から遠い側である第2領域572とに分割する分割線61を作成するサブルーチンである。
If it is determined that it is not in the closed state (NO in step S634), the control unit 221 starts the dividing line creation subroutine described using FIG. 14 or FIG. 20 (step S636). The dividing line creation subroutine divides the open first lumen region 561 into a first region 571 closer to the image acquisition catheter 28 and a second region 572 farther from the image acquisition catheter 28 . This is a subroutine for creating a dividing line 61 that divides the .
制御部221は、第1内腔領域561のうち、分割線61よりも画像取得用カテーテル28から遠い部分の分類を腔外領域567に変更する(ステップS637)。制御部221は補助記憶装置223または主記憶装置222に、変更後の第1分類データ51を記録する(ステップS638)。
The control unit 221 changes the classification of the portion of the first lumen region 561 farther from the image acquisition catheter 28 than the parting line 61 to the extraluminal region 567 (step S637). The control unit 221 records the changed first classification data 51 in the auxiliary storage device 223 or the main storage device 222 (step S638).
ステップS635またはステップS638の終了後、制御部221は時系列的に記録した第1分類データ51に基づいて生成した三次元画像を表示部225に表示する(ステップS639)。制御部221は、処理を終了するか否かを判定する(ステップS640)。たとえば、一連の三次元走査が終了した場合に、制御部221は処理を終了すると判定する。
After the end of step S635 or step S638, the control unit 221 displays the three-dimensional image generated based on the first classified data 51 recorded in chronological order on the display unit 225 (step S639). The control unit 221 determines whether or not to end the process (step S640). For example, when a series of three-dimensional scans is completed, the control unit 221 determines to end the processing.
処理を終了しないと判定した場合(ステップS639でNO)、制御部221はステップS632に戻る。処理を終了すると判定した場合(ステップS639でYES)、制御部221は処理を終了する。
If it is determined not to end the process (NO in step S639), the control unit 221 returns to step S632. If it is determined to end the process (YES in step S639), the control unit 221 ends the process.
なお制御部221は、ステップS633で生成した第1分類データ51と、ステップS637で変更後の第1分類データ51との両方を補助記憶装置223または主記憶装置222に記録してもよい。制御部221は、変更後の第1分類データ51を記録する代わりに、分割線61を記録し、三次元表示を行なう都度変更後の第1分類データ51を作成してもよい。制御部221は、どちらの第1分類データ51をステップS639で使用するかの選択をユーザから受け付けてもよい。
Note that the control unit 221 may record both the first classification data 51 generated in step S633 and the changed first classification data 51 in step S637 in the auxiliary storage device 223 or the main storage device 222. Instead of recording the changed first classification data 51, the control unit 221 may record the dividing line 61 and create the changed first classification data 51 each time three-dimensional display is performed. The control unit 221 may accept from the user a selection of which first classification data 51 to use in step S639.
図27は、実施の形態3の表示例である。第1分類データ51から抽出された、第1内腔領域561の三次元画像が表示されている。仮想線で示す修正領域569は、ステップS636において、第1内腔領域561から腔外領域567にラベルが変更された領域である。
FIG. 27 is a display example of the third embodiment. A three-dimensional image of the first lumen region 561 extracted from the first classification data 51 is displayed. A modified region 569 indicated by a phantom line is the region whose label is changed from the first lumen region 561 to the extraluminal region 567 in step S636.
仮に、ステップS633で生成された第1分類データ51に基づいて第1内腔領域561を三次元表示した場合は、修正領域569の部分も表示される。修正領域569はノイズであり、ユーザが修正領域569の影になった部分を観察することを阻害する。
If the first lumen area 561 is three-dimensionally displayed based on the first classification data 51 generated in step S633, the correction area 569 is also displayed. Correction region 569 is noise and prevents the user from observing the shadowed portion of correction region 569 .
フローチャートおよび画面例を省略するが、制御部221は図27に例示する3次元画像について、たとえば向きの変更、断面の生成、表示する領域の変更、拡大、縮小および計測等の操作を受け付ける。ユーザは、三次元画像を適宜観察し、必要なデータを計測できる。
Although the flow chart and screen examples are omitted, the control unit 221 accepts operations such as orientation change, section generation, display area change, enlargement, reduction, and measurement for the three-dimensional image illustrated in FIG. The user can appropriately observe the three-dimensional image and measure necessary data.
図26を使用して説明したプログラムを使用して修正領域569の部分を消去した三次元画像により、ユーザは第1内腔領域561の三次元形状を容易に観察できる。さらに、制御部221は、第1内腔領域561の体積等の自動測定を正確に行なえる。
The user can easily observe the three-dimensional shape of the first lumen region 561 by using the three-dimensional image in which the corrected region 569 is erased using the program described using FIG. Furthermore, the control unit 221 can accurately automatically measure the volume of the first lumen region 561 and the like.
本実施の形態によると、三次元用の画像取得用カテーテル28を使用して、リアルタイムでノイズの少ない三次元画像を表示するカテーテルシステム10を提供できる。
According to the present embodiment, it is possible to provide the catheter system 10 that uses the three-dimensional image acquisition catheter 28 to display a three-dimensional image with little noise in real time.
[変形例3-1]
本変形例は、時系列的に記録された二次元画像58のデータセットに基づいて三次元画像を表示する画像処理装置220に関する。実施の形態3と共通する部分については、説明を省略する。なお、本変形例においては、画像処理装置220にカテーテル制御装置27が接続されている必要はない。 [Modification 3-1]
This modification relates to animage processing device 220 that displays a three-dimensional image based on a data set of two-dimensional images 58 recorded in time series. The description of the parts common to the third embodiment is omitted. It should be noted that in this modified example, the catheter control device 27 does not need to be connected to the image processing device 220 .
本変形例は、時系列的に記録された二次元画像58のデータセットに基づいて三次元画像を表示する画像処理装置220に関する。実施の形態3と共通する部分については、説明を省略する。なお、本変形例においては、画像処理装置220にカテーテル制御装置27が接続されている必要はない。 [Modification 3-1]
This modification relates to an
補助記憶装置223または外部の大容量記憶装置に、時系列的に記録された二次元画像58のデータセットが記録されている。データセットは、たとえば過去の症例中に記録された動画データに基づいて生成された複数の二次元画像58のセットであってもよい。
A data set of two-dimensional images 58 recorded in chronological order is recorded in the auxiliary storage device 223 or an external large-capacity storage device. The dataset may be, for example, a set of two-dimensional images 58 generated based on video data recorded during past cases.
図28は、変形例3-1のプログラムの処理の流れを説明するフローチャートである。制御部221は、ユーザから三次元表示を行なうデータセットに関する指示を受け付けた場合に、図26を使用して説明するプログラムを実行する。
FIG. 28 is a flowchart for explaining the processing flow of the program of modification 3-1. Control unit 221 executes a program described with reference to FIG. 26 when an instruction regarding a data set for three-dimensional display is received from the user.
制御部221は、指示されたデータセットから1枚の二次元画像58を取得する(ステップS681)。制御部221は、図24を使用して説明した第1分類データ生成のサブルーチンを起動する(ステップS633)。以後ステップS634およびステップS638までの処理は、図26を使用して説明した実施の形態3のプログラムの処理と同様であるため、説明を省略する。
The control unit 221 acquires one two-dimensional image 58 from the instructed data set (step S681). The control unit 221 activates the first classification data generation subroutine described using FIG. 24 (step S633). The subsequent processing up to step S634 and step S638 is the same as the processing of the program of the third embodiment described with reference to FIG. 26, so description thereof will be omitted.
ステップS635またはステップS638の終了後、制御部221は、指示されたデータセットに含まれる二次元画像58の処理を終了したか否かを判定する(ステップS682)。処理を終了していないと判定した場合(ステップS682でNO)、制御部221はステップS681に戻る。
After step S635 or step S638 is completed, the control unit 221 determines whether or not the processing of the two-dimensional image 58 included in the designated data set has been completed (step S682). If it is determined that the processing has not ended (NO in step S682), the control unit 221 returns to step S681.
処理を終了したと判定した場合(ステップS682でYES)、制御部221は時系列的に記録した第1分類データ51および変更後の第1分類データ51に基づいて生成した三次元画像を、表示部225に表示する(ステップS683)。
If it is determined that the process has ended (YES in step S682), the control unit 221 displays the three-dimensional image generated based on the first classified data 51 recorded in chronological order and the changed first classified data 51. It is displayed on the part 225 (step S683).
本変形例によると、時系列的に記録された二次元画像58のデータセットに基づいて、ノイズの少ない三次元画像を表示する画像処理装置220を提供できる。
According to this modified example, it is possible to provide the image processing device 220 that displays a three-dimensional image with little noise based on the data set of the two-dimensional image 58 recorded in chronological order.
なお制御部221は、ステップS683で三次元画像の表示を行なう代わりに、または、ステップS683の処理とともに、第1分類データ51と変更後の第1分類データ51とを時系列的に記録したデータセットを補助記憶装置223に記録してもよい。ユーザは、記録されたデータセットを使用して、必要に応じて三次元画像を観察できる。
Instead of displaying the three-dimensional image in step S683, or along with the process of step S683, the control unit 221 records the first classification data 51 and the changed first classification data 51 in chronological order. The set may be recorded in auxiliary storage device 223 . A user can use the recorded data set to view the three-dimensional image as desired.
[実施の形態4]
本実施の形態は、実施の形態1または実施の形態2で生成された第3分類モデル33が搭載されたカテーテルシステム10に関する。実施の形態3と共通する部分については、説明を省略する。 [Embodiment 4]
This embodiment relates to acatheter system 10 equipped with the third classification model 33 generated in the first or second embodiment. The description of the parts common to the third embodiment is omitted.
本実施の形態は、実施の形態1または実施の形態2で生成された第3分類モデル33が搭載されたカテーテルシステム10に関する。実施の形態3と共通する部分については、説明を省略する。 [Embodiment 4]
This embodiment relates to a
図29は、実施の形態4のカテーテルシステム10の構成を説明する説明図である。カテーテルシステム10は、画像処理装置230と、カテーテル制御装置27とMDU289と、画像取得用カテーテル28とを備える。画像取得用カテーテル28は、MDU289およびカテーテル制御装置27を介して画像処理装置230に接続されている。
FIG. 29 is an explanatory diagram illustrating the configuration of the catheter system 10 of Embodiment 4. FIG. The catheter system 10 includes an image processor 230 , a catheter controller 27 , an MDU 289 and an image acquisition catheter 28 . Image acquisition catheter 28 is connected to image processing device 230 via MDU 289 and catheter control device 27 .
画像処理装置230は、制御部231、主記憶装置232、補助記憶装置233、通信部234、表示部235、入力部236およびバスを備える。制御部231は、本実施の形態のプログラムを実行する演算制御装置である。制御部231には、一または複数のCPU、GPU、またはマルチコアCPU等が使用される。制御部231は、バスを介して画像処理装置230を構成するハードウェア各部と接続されている。
The image processing device 230 includes a control section 231, a main storage device 232, an auxiliary storage device 233, a communication section 234, a display section 235, an input section 236 and a bus. The control unit 231 is an arithmetic control device that executes the program of this embodiment. One or a plurality of CPUs, GPUs, multi-core CPUs, or the like is used for the control unit 231 . The control unit 231 is connected to each hardware unit forming the image processing apparatus 230 via a bus.
主記憶装置232は、SRAM、DRAM、フラッシュメモリ等の記憶装置である。主記憶装置232には、制御部231が行なう処理の途中で必要な情報、および、制御部231で実行中のプログラムが一時的に保存される。
The main storage device 232 is a storage device such as SRAM, DRAM, and flash memory. The main storage device 232 temporarily stores information necessary during the process performed by the control unit 231 and the program being executed by the control unit 231 .
補助記憶装置233は、SRAM、フラッシュメモリ、ハードディスクまたは磁気テープ等の記憶装置である。補助記憶装置233には、第3分類モデル33、制御部231に実行させるプログラム、およびプログラムの実行に必要な各種データが保存される。通信部234は、画像処理装置230とネットワークとの間の通信を行なうインターフェースである。第3分類モデル33は、画像処理装置230に接続された外部の大容量記憶装置等に記憶されていてもよい。
The auxiliary storage device 233 is a storage device such as SRAM, flash memory, hard disk, or magnetic tape. The auxiliary storage device 233 stores the third classification model 33, programs to be executed by the control unit 231, and various data necessary for executing the programs. The communication unit 234 is an interface that performs communication between the image processing device 230 and the network. The third classification model 33 may be stored in an external mass storage device or the like connected to the image processing device 230 .
表示部235は、たとえば液晶表示パネルまたは有機ELパネル等である。入力部236は、たとえばキーボードおよびマウス等である。表示部235に入力部236が積層されてタッチパネルを構成していてもよい。表示部235は、画像処理装置230に接続された表示装置であってもよい。
The display unit 235 is, for example, a liquid crystal display panel or an organic EL panel. Input unit 236 is, for example, a keyboard and a mouse. The input unit 236 may be layered on the display unit 235 to form a touch panel. The display unit 235 may be a display device connected to the image processing device 230 .
画像処理装置230は、汎用のパソコン、タブレット、大型計算機、または、大型計算機上で動作する仮想マシンである。画像処理装置230は、分散処理を行なう複数のパソコン、または大型計算機等のハードウェアにより構成されても良い。画像処理装置230は、クラウドコンピューティングシステムにより構成されても良い。画像処理装置230とカテーテル制御装置とは、一体のハードウェアを構成していてもよい。
The image processing device 230 is a general-purpose personal computer, tablet, large computer, or a virtual machine running on a large computer. The image processing device 230 may be configured by hardware such as a plurality of personal computers or large computers that perform distributed processing. The image processing device 230 may be configured by a cloud computing system. The image processing device 230 and the catheter control device may constitute integrated hardware.
制御部231は、カテーテル制御装置27から時系列的に得られた複数の二次元画像58を順次取得する。制御部231は、それぞれの二次元画像58を第3分類モデル33に順次入力して、第3分類データ53を順次取得する。制御部231は、時系列的に取得した複数の第3分類データ53に基づいて三次元画像を生成し、表示部235に出力する。以上により、いわゆる三次元走査が行なわれる。
The control unit 231 sequentially acquires a plurality of two-dimensional images 58 obtained from the catheter control device 27 in time series. The control unit 231 sequentially inputs the respective two-dimensional images 58 to the third classification model 33 and sequentially acquires the third classification data 53 . The control unit 231 generates a three-dimensional image based on the plurality of third classification data 53 acquired in chronological order, and outputs the three-dimensional image to the display unit 235 . As described above, so-called three-dimensional scanning is performed.
図30は、実施の形態4のプログラムの処理の流れを説明するフローチャートである。制御部231は、ユーザから三次元走査開始の指示を受け付けた場合に、図30を使用して説明するプログラムを実行する。
FIG. 30 is a flowchart for explaining the processing flow of the program of the fourth embodiment. When the control unit 231 receives an instruction to start three-dimensional scanning from the user, the control unit 231 executes a program described using FIG. 30 .
制御部231は、カテーテル制御装置27に三次元走査の開始を指示する(ステップS651)。カテーテル制御装置27は、MDU289を制御して、三次元走査を開始する。制御部231は、カテーテル制御装置27から1枚の二次元画像58を取得する(ステップS652)。
The control unit 231 instructs the catheter control device 27 to start three-dimensional scanning (step S651). Catheter controller 27 controls MDU 289 to initiate three-dimensional scanning. The control unit 231 acquires one two-dimensional image 58 from the catheter control device 27 (step S652).
制御部231は、二次元画像58を第3分類モデル33に入力し、出力された第3分類データ53を取得する(ステップS653)。制御部231は補助記憶装置233または主記憶装置232に第3分類データ53を記録する(ステップS654)。
The control unit 231 inputs the two-dimensional image 58 to the third classification model 33 and acquires the output third classification data 53 (step S653). The control unit 231 records the third classification data 53 in the auxiliary storage device 233 or the main storage device 232 (step S654).
制御部231は時系列的に記録した第3分類データ53に基づいて生成した三次元画像を表示部235に表示する(ステップS655)。制御部231は、処理を終了するか否かを判定する(ステップS656)。たとえば、一連の三次元走査が終了した場合に、制御部231は処理を終了すると判定する。
The control unit 231 displays the three-dimensional image generated based on the third classification data 53 recorded in chronological order on the display unit 235 (step S655). The control unit 231 determines whether or not to end the process (step S656). For example, when a series of three-dimensional scans is completed, the control unit 231 determines to end the processing.
処理を終了しないと判定した場合(ステップS656でNO)、制御部231はステップS652に戻る。ステップS653の処理を繰り返すことにより、制御部231は時系列的に得られた複数の二次元画像を第3分類モデル33に順次入力して、出力される第3分類データ53を順次取得する、本実施の形態の第3分類データ取得部の機能を実現する。処理を終了すると判定した場合(ステップS656でYES)、制御部231は処理を終了する。
If it is determined not to end the process (NO in step S656), the control unit 231 returns to step S652. By repeating the process of step S653, the control unit 231 sequentially inputs a plurality of two-dimensional images obtained in time series to the third classification model 33, and sequentially acquires the output third classification data 53. It implements the function of the third classification data acquisition unit of the present embodiment. When determining to end the process (YES in step S656), the control unit 231 ends the process.
本実施の形態によると、実施の形態1または実施の形態2で生成した第3分類データ53を搭載したカテーテルシステム10を提供できる。本実施の形態によると、実施の形態3と同様の三次元画像表示を、実施の形態3よりも少ない計算負荷で実現するカテーテルシステム10を提供できる。
According to the present embodiment, it is possible to provide the catheter system 10 loaded with the third classified data 53 generated in the first or second embodiment. According to the present embodiment, it is possible to provide the catheter system 10 that realizes the same three-dimensional image display as in the third embodiment with less computational load than the third embodiment.
なお、補助記憶装置233または補助記憶装置223に、第3分類モデル33とラベル分類モデル35との両方が記録されており、ユーザが実施の形態3の処理と実施の形態4の処理とを選択できるように構成されていてもよい。
Both the third classification model 33 and the label classification model 35 are recorded in the auxiliary storage device 233 or the auxiliary storage device 223, and the user selects the processing of the third embodiment or the processing of the fourth embodiment. It may be configured to allow
[変形例4-1]
本変形例は、時系列的に記録された二次元画像58のデータセットに基づいて三次元画像を表示する画像処理装置230に関する。実施の形態4と共通する部分については、説明を省略する。なお、本変形例においては、画像処理装置230にカテーテル制御装置27が接続されている必要はない。 [Modification 4-1]
This modification relates to animage processing device 230 that displays a three-dimensional image based on a data set of two-dimensional images 58 recorded in time series. The description of the parts common to the fourth embodiment is omitted. It should be noted that in this modification, the catheter control device 27 does not need to be connected to the image processing device 230 .
本変形例は、時系列的に記録された二次元画像58のデータセットに基づいて三次元画像を表示する画像処理装置230に関する。実施の形態4と共通する部分については、説明を省略する。なお、本変形例においては、画像処理装置230にカテーテル制御装置27が接続されている必要はない。 [Modification 4-1]
This modification relates to an
補助記憶装置233または外部の大容量記憶装置に、時系列的に記録された二次元画像58のデータセットが記録されている。データセットは、たとえば過去の症例中に記録された動画データに基づいて生成された複数の二次元画像58のセットであってもよい。
A data set of two-dimensional images 58 recorded in chronological order is recorded in the auxiliary storage device 233 or an external large-capacity storage device. The dataset may be, for example, a set of two-dimensional images 58 generated based on video data recorded during past cases.
制御部231は、データセットから1枚の二次元画像58を取得して第3分類モデル33に入力し、出力された第3分類データ53を取得する。制御部231は補助記憶装置233または主記憶装置232に第3分類データ53を記録する。一連のデータセットの処理を終了した後に、制御部231は記録した第3分類データ53に基づいて三次元画像を表示する。
The control unit 231 acquires one two-dimensional image 58 from the data set, inputs it to the third classification model 33, and acquires the output third classification data 53. The control unit 231 records the third classification data 53 in the auxiliary storage device 233 or main storage device 232 . After finishing the processing of a series of data sets, the control unit 231 displays a three-dimensional image based on the recorded third classification data 53 .
本変形例によると、時系列的に記録された二次元画像58のデータセットに基づいて、ノイズの少ない三次元画像を表示する画像処理装置230を提供できる。
According to this modified example, it is possible to provide the image processing device 230 that displays a three-dimensional image with little noise based on the data set of the two-dimensional image 58 recorded in chronological order.
なお制御部231は、三次元画像の表示を行なう代わりに、または、三次元画像を表示するとともに、第3分類データ53を時系列的に記録したデータセットを補助記憶装置233に記録してもよい。ユーザは、記録されたデータセットを使用して、必要に応じて三次元画像を観察できる。
Instead of displaying the three-dimensional image, or in addition to displaying the three-dimensional image, the control unit 231 may record a data set in which the third classification data 53 are recorded in chronological order in the auxiliary storage device 233. good. A user can use the recorded data set to view the three-dimensional image as desired.
[実施の形態5]
図31は、実施の形態5の情報処理装置200の機能ブロック図である。情報処理装置200は、画像取得部81、第1分類データ取得部82、判定部83、第1記録部84、分割線作成部85、第2分類データ作成部86および第2記録部87を備える。 [Embodiment 5]
FIG. 31 is a functional block diagram of theinformation processing device 200 according to the fifth embodiment. The information processing apparatus 200 includes an image acquisition section 81, a first classification data acquisition section 82, a determination section 83, a first recording section 84, a dividing line creation section 85, a second classification data creation section 86, and a second recording section 87. .
図31は、実施の形態5の情報処理装置200の機能ブロック図である。情報処理装置200は、画像取得部81、第1分類データ取得部82、判定部83、第1記録部84、分割線作成部85、第2分類データ作成部86および第2記録部87を備える。 [Embodiment 5]
FIG. 31 is a functional block diagram of the
画像取得部81は、画像取得用カテーテル28を用いて取得された二次元画像58を取得する。第1分類データ取得部82は、二次元画像58が、生体組織領域566、画像取得用カテーテル28が挿入されている第1内腔領域561、および、生体組織領域566よりも外側の腔外領域567を含む複数の領域に分類された、第1分類データ51を取得する。
The image acquisition unit 81 acquires the two-dimensional image 58 acquired using the image acquisition catheter 28 . The first classification data acquisition unit 82 divides the two-dimensional image 58 into a living tissue region 566, a first lumen region 561 into which the image acquisition catheter 28 is inserted, and an extracavity region outside the living tissue region 566. First classified data 51 classified into a plurality of areas including 567 is obtained.
判定部83は、二次元画像58において、第1内腔領域561が二次元画像58の縁に到達しているか否かを判定する。判定部83が到達していないと判定した場合、第1記録部84は、二次元画像58と第1分類データ51とを関連づけて訓練DB42に記録する。
The determination unit 83 determines whether or not the first lumen region 561 has reached the edge of the two-dimensional image 58 in the two-dimensional image 58 . When the determination unit 83 determines that the first recording unit 84 has not reached the destination, the first recording unit 84 associates the two-dimensional image 58 with the first classification data 51 and records them in the training DB 42 .
判定部83が到達していると判定した場合、分割線作成部85は、第1内腔領域561を、画像取得用カテーテル28が挿入されている第1領域571と二次元画像58の縁に到達している第2領域572とに分割する分割線61を作成する。第2分類データ作成部86は、分割線61および第1分類データ51に基づいて、第1分類データ51のうち第1内腔領域561を構成するそれぞれの小領域について、第1内腔領域561である確率と腔外領域567である確率とを配分した第2分類データ52を作成する。第2記録部87は、二次元画像58と第2分類データ52とを関連づけて訓練DB42に記録する。
When the determination unit 83 determines that the parting line creation unit 85 has reached the first lumen region 561, the parting line creation unit 85 divides the first lumen region 561 between the first region 571 into which the image acquisition catheter 28 is inserted and the edge of the two-dimensional image 58. A dividing line 61 is created to divide the second region 572 reached. Based on the dividing line 61 and the first classification data 51 , the second classification data generation unit 86 generates the first lumen region 561 for each small region that constitutes the first lumen region 561 in the first classification data 51 . The second classification data 52 is created by distributing the probability of being an extraluminal region 567 and the probability of being an extracavity region 567 . The second recording unit 87 associates the two-dimensional image 58 with the second classification data 52 and records them in the training DB 42 .
[実施の形態6]
図32は、実施の形態6の画像処理装置220の機能ブロック図である。画像処理装置220は、画像取得部71、第1分類データ取得部72、判定部83、分割線作成部85および三次元画像作成部88を備える。 [Embodiment 6]
FIG. 32 is a functional block diagram of theimage processing device 220 of Embodiment 6. As shown in FIG. The image processing device 220 includes an image acquisition section 71 , a first classification data acquisition section 72 , a determination section 83 , a dividing line creation section 85 and a three-dimensional image creation section 88 .
図32は、実施の形態6の画像処理装置220の機能ブロック図である。画像処理装置220は、画像取得部71、第1分類データ取得部72、判定部83、分割線作成部85および三次元画像作成部88を備える。 [Embodiment 6]
FIG. 32 is a functional block diagram of the
画像取得部71は、画像取得用カテーテル28を用いて時系列的に得られた複数の二次元画像58を取得する。第1分類データ取得部72は、複数の二次元画像58のそれぞれを構成する各ピクセルが、生体組織領域566、画像取得用カテーテル28が挿入されている第1内腔領域561、および、生体組織領域566よりも外側の腔外領域567を含む複数の領域に分類された、一連の第1分類データ51を取得する。
The image acquisition unit 71 acquires a plurality of two-dimensional images 58 obtained in time series using the image acquisition catheter 28 . The first classification data acquisition unit 72 determines that each pixel constituting each of the plurality of two-dimensional images 58 is divided into a living tissue region 566, a first lumen region 561 into which the image acquisition catheter 28 is inserted, and a living tissue region. A series of first classified data 51 classified into a plurality of regions including an extraluminal region 567 outside the region 566 is obtained.
判定部83は、二次元画像58のそれぞれにおいて、第1内腔領域561が二次元画像58の縁に到達しているか否かを判定する。判定部83が到達していると判定した場合、分割線作成部85は、第1内腔領域561を、画像取得用カテーテル28が挿入されている第1領域571と二次元画像58の縁に到達している第2領域572とに分割する分割線61を作成する。
The determination unit 83 determines whether or not the first lumen region 561 has reached the edge of the two-dimensional image 58 in each of the two-dimensional images 58 . When the determination unit 83 determines that the parting line creation unit 85 has reached the first lumen region 561, the parting line creation unit 85 divides the first lumen region 561 between the first region 571 into which the image acquisition catheter 28 is inserted and the edge of the two-dimensional image 58. A dividing line 61 is created to divide the second region 572 reached.
三次元画像作成部88は、第2領域572の分類を腔外領域567に変更した一連の第1分類データ51を使用して、または、一連の第1分類データ51を使用するとともに第2領域572を腔外領域567と同じ領域として処理した三次元画像を作成する。
The three-dimensional image generation unit 88 uses the series of first classified data 51 in which the classification of the second region 572 is changed to the extracavity region 567, or uses the series of first classified data 51 and the second region A three-dimensional image is created by treating 572 as the same region as the extracavity region 567 .
[実施の形態7]
図33は、実施の形態7の画像処理装置230の機能ブロック図である。画像処理装置230は、画像取得部71および第3分類データ取得部73を備える。 [Embodiment 7]
FIG. 33 is a functional block diagram of theimage processing device 230 according to the seventh embodiment. The image processing device 230 includes an image acquisition section 71 and a third classification data acquisition section 73 .
図33は、実施の形態7の画像処理装置230の機能ブロック図である。画像処理装置230は、画像取得部71および第3分類データ取得部73を備える。 [Embodiment 7]
FIG. 33 is a functional block diagram of the
画像取得部71は、画像取得用カテーテル28を用いて時系列的に得られた複数の二次元画像58を取得する。第3分類データ取得部73は、二次元画像58を、上述の方法を用いて生成した学習済モデル33に順次入力して、出力される第3分類データ53を順次取得する。
The image acquisition unit 71 acquires a plurality of two-dimensional images 58 obtained in time series using the image acquisition catheter 28 . The third classification data acquisition unit 73 sequentially inputs the two-dimensional images 58 to the trained model 33 generated using the above-described method, and sequentially acquires the output third classification data 53 .
各実施例で記載されている技術的特徴(構成要件)はお互いに組合せ可能であり、組み合わせすることにより、新しい技術的特徴を形成することができる。
今回開示された実施の形態はすべての点で例示であって、制限的なものでは無いと考えられるべきである。本発明の範囲は、上記した意味では無く、請求の範囲によって示され、請求の範囲と均等の意味および範囲内でのすべての変更が含まれることが意図される。 The technical features (constituent elements) described in each embodiment can be combined with each other, and new technical features can be formed by combining them.
The embodiments disclosed this time are illustrative in all respects and should be considered not restrictive. The scope of the present invention is not defined by the above-described meaning, but is indicated by the scope of claims, and is intended to include all modifications within the meaning and scope equivalent to the scope of claims.
10 カテーテルシステム
200 情報処理装置
201 制御部
202 主記憶装置
203 補助記憶装置
204 通信部
205 表示部
206 入力部
210 情報処理装置
211 制御部
212 主記憶装置
213 補助記憶装置
214 通信部
215 表示部
216 入力部
220 画像処理装置
221 制御部
222 主記憶装置
223 補助記憶装置
224 通信部
225 表示部
226 入力部
230 画像処理装置
231 制御部
232 主記憶装置
233 補助記憶装置
234 通信部
235 表示部
236 入力部
27 カテーテル制御装置
28 画像取得用カテーテル
281 シース
282 センサ
283 シャフト
289 MDU
31 第1分類モデル
33 第3分類モデル(学習モデル、学習済モデル)
35 ラベル分類モデル
37 開閉判定モデル(到達判定モデル)
39 分類データ変換部
41 第1分類DB
42 訓練DB
51 第1分類データ
52 第2分類データ
53 第3分類データ
54 ラベルデータ
561 第1内腔領域(内腔領域)
562 第2内腔領域
563 内腔領域
566 生体組織領域
567 腔外領域
568 非生体組織領域
569 修正領域
571 第1領域
572 第2領域
58 二次元画像
61 分割線
62 分割線候補
641 切断線
642 貼付線
66 接続線
67 対象ピクセル
691 正解境界線
692 出力境界線
71 画像取得部
72 第1分類データ取得部
73 第3分類データ取得部
81 画像取得部
82 第1分類データ取得部
83 判定部
84 第1記録部
85 分割線作成部
86 第2分類データ作成部
87 第2記録部
88 三次元画像作成部 10catheter system 200 information processing device 201 control unit 202 main storage device 203 auxiliary storage device 204 communication unit 205 display unit 206 input unit 210 information processing device 211 control unit 212 main storage device 213 auxiliary storage device 214 communication unit 215 display unit 216 input Unit 220 Image processing device 221 Control unit 222 Main storage device 223 Auxiliary storage device 224 Communication unit 225 Display unit 226 Input unit 230 Image processing device 231 Control unit 232 Main storage device 233 Auxiliary storage device 234 Communication unit 235 Display unit 236 Input unit 27 Catheter Control Device 28 Image Acquisition Catheter 281 Sheath 282 Sensor 283 Shaft 289 MDU
31first classification model 33 third classification model (learning model, trained model)
35Label Classification Model 37 Open/Close Judgment Model (Arrival Judgment Model)
39classification data converter 41 first classification DB
42 training database
51first classification data 52 second classification data 53 third classification data 54 label data 561 first lumen region (luminal region)
562second lumen region 563 lumen region 566 body tissue region 567 extracavity region 568 non-body tissue region 569 correction region 571 first region 572 second region 58 two-dimensional image 61 division line 62 division line candidate 641 cutting line 642 paste Line 66 Connection line 67 Target pixel 691 Correct boundary line 692 Output boundary line 71 Image acquisition unit 72 First classification data acquisition unit 73 Third classification data acquisition unit 81 Image acquisition unit 82 First classification data acquisition unit 83 Judgment unit 84 First Recording unit 85 Parting line creating unit 86 Second classification data creating unit 87 Second recording unit 88 Three-dimensional image creating unit
200 情報処理装置
201 制御部
202 主記憶装置
203 補助記憶装置
204 通信部
205 表示部
206 入力部
210 情報処理装置
211 制御部
212 主記憶装置
213 補助記憶装置
214 通信部
215 表示部
216 入力部
220 画像処理装置
221 制御部
222 主記憶装置
223 補助記憶装置
224 通信部
225 表示部
226 入力部
230 画像処理装置
231 制御部
232 主記憶装置
233 補助記憶装置
234 通信部
235 表示部
236 入力部
27 カテーテル制御装置
28 画像取得用カテーテル
281 シース
282 センサ
283 シャフト
289 MDU
31 第1分類モデル
33 第3分類モデル(学習モデル、学習済モデル)
35 ラベル分類モデル
37 開閉判定モデル(到達判定モデル)
39 分類データ変換部
41 第1分類DB
42 訓練DB
51 第1分類データ
52 第2分類データ
53 第3分類データ
54 ラベルデータ
561 第1内腔領域(内腔領域)
562 第2内腔領域
563 内腔領域
566 生体組織領域
567 腔外領域
568 非生体組織領域
569 修正領域
571 第1領域
572 第2領域
58 二次元画像
61 分割線
62 分割線候補
641 切断線
642 貼付線
66 接続線
67 対象ピクセル
691 正解境界線
692 出力境界線
71 画像取得部
72 第1分類データ取得部
73 第3分類データ取得部
81 画像取得部
82 第1分類データ取得部
83 判定部
84 第1記録部
85 分割線作成部
86 第2分類データ作成部
87 第2記録部
88 三次元画像作成部 10
31
35
39
42 training database
51
562
Claims (25)
- 画像取得用カテーテルを用いて取得された二次元画像を取得し、
前記二次元画像を構成する各ピクセルが、生体組織領域、前記画像取得用カテーテルが挿入されている内腔領域、および、生体組織領域よりも外側の腔外領域を含む複数の領域に分類された、第1分類データを取得し、
前記二次元画像において、前記内腔領域が前記二次元画像の縁に到達しているか否かを判定し、
到達していないと判定した場合、前記二次元画像と前記第1分類データとを関連づけて訓練データベースに記録し、
到達していると判定した場合、
前記内腔領域を、前記画像取得用カテーテルが挿入されている第1領域と前記二次元画像の縁に到達している第2領域とに分割する分割線を作成し、
前記分割線および前記第1分類データに基づいて、前記第1分類データのうち前記内腔領域を構成するそれぞれの小領域について、前記内腔領域である確率と前記腔外領域である確率とを配分した第2分類データを作成し、
前記二次元画像と前記第2分類データとを関連づけて前記訓練データベースに記録し、
前記訓練データベースに記録した訓練データを用いた機械学習により、二次元画像を入力した場合に、当該二次元画像を構成する各ピクセルが、前記生体組織領域、前記内腔領域、および、前記腔外領域を含む複数の領域に分類された、第3分類データを出力する学習モデルを生成する
学習モデル生成方法。 Acquiring a two-dimensional image acquired using an image acquisition catheter,
Each pixel constituting the two-dimensional image is classified into a plurality of regions including a biological tissue region, a lumen region into which the image acquisition catheter is inserted, and an extracavity region outside the biological tissue region. , to obtain the first classification data,
in the two-dimensional image, determining whether or not the lumen region has reached the edge of the two-dimensional image;
If it is determined that it has not reached, the two-dimensional image and the first classification data are associated and recorded in a training database;
If it is determined that it has reached
creating a dividing line dividing the lumen region into a first region into which the image acquisition catheter is inserted and a second region reaching the edge of the two-dimensional image;
Based on the parting line and the first classification data, the probability of being the lumen region and the probability of being the extraluminal region are calculated for each of the small regions constituting the lumen region in the first classification data. Create the distributed second classification data,
recording the two-dimensional image and the second classification data in association with the training database;
By machine learning using the training data recorded in the training database, when a two-dimensional image is input, each pixel constituting the two-dimensional image corresponds to the biological tissue region, the lumen region, and the extraluminal region. A learning model generation method for generating a learning model that outputs third classification data classified into a plurality of areas including areas. - 前記内腔領域が前記二次元画像の縁に到達しているか否かは、前記第1分類データに基づいて判定する
請求項1に記載の学習モデル生成方法。 2. The learning model generation method according to claim 1, wherein whether or not the lumen region has reached the edge of the two-dimensional image is determined based on the first classification data. - 前記内腔領域が前記二次元画像の縁に到達しているか否かは、前記二次元画像に基づいて判定する
請求項1に記載の学習モデル生成方法。 2. The learning model generation method according to claim 1, wherein whether or not the lumen region has reached the edge of the two-dimensional image is determined based on the two-dimensional image. - 前記内腔領域が前記二次元画像の縁に到達しているか否かは、前記二次元画像を、二次元画像を入力した場合に内腔領域が前記二次元画像の縁に到達しているか否かを出力する到達判定モデルに入力し、前記到達判定モデルの出力に基づいて定める
請求項1に記載の学習モデル生成方法。 Whether the lumen region has reached the edge of the two-dimensional image is determined by determining whether the lumen region has reached the edge of the two-dimensional image when the two-dimensional image is input. 2. The method of generating a learning model according to claim 1, further comprising: inputting to an attainment judgment model that outputs whether or not, and determining based on the output of the attainment judgment model. - 前記第2分類データにおいて、それぞれの前記小領域が前記内腔領域である確率、および、前記腔外領域である確率は、前記小領域と前記分割線との間を結ぶ接続線の長さに基づいて定められる
請求項1から請求項4のいずれか一つに記載の学習モデル生成方法。 In the second classification data, the probability that each of the small regions is the lumen region and the probability that the small region is the extracavity region are determined by the length of the connecting line connecting the small region and the dividing line. The learning model generation method according to any one of claims 1 to 4. - 前記接続線は、前記第1分類データにおいて前記内腔領域に分類された領域のみを通過する
請求項5に記載の学習モデル生成方法。 6. The learning model generation method according to claim 5, wherein the connection line passes through only the area classified as the lumen area in the first classification data. - 前記第2分類データにおいて、それぞれの前記小領域が前記内腔領域である確率、および、前記腔外領域である確率は、下式により定められる
請求項5または請求項6に記載の学習モデル生成方法。

- 前記第2分類データにおいてそれぞれの前記小領域は、前記分割線よりも前記画像取得用カテーテルに近い場合には前記内腔領域であり、前記分割線よりも前記画像取得用カテーテルから遠い場合には前記腔外領域であると定められる
請求項1から請求項4のいずれか一つに記載の学習モデル生成方法。 Each of the small regions in the second classified data is the lumen region if it is closer to the image acquisition catheter than the parting line, and if it is farther from the image acquisition catheter than the parting line The learning model generation method according to any one of claims 1 to 4, wherein the extraluminal region is determined. - 前記分割線は、前記第1分類データをRT形式で表示したRT形式画像、または、前記第1分類データをXY形式で表示したXY形式画像において、前記内腔領域のみを通過する線である
請求項1から請求項8のいずれか一つに記載の学習モデル生成方法。 The dividing line is a line that passes through only the lumen region in an RT format image in which the first classified data is displayed in RT format or an XY format image in which the first classified data is displayed in XY format. The learning model generation method according to any one of claims 1 to 8. - 前記分割線は、前記RT形式画像または前記XY形式画像において直線である
請求項9に記載の学習モデル生成方法。 10. The learning model generation method according to claim 9, wherein the dividing line is a straight line in the RT format image or the XY format image. - 前記分割線は、前記RT形式画像または前記XY形式画像において、前記生体組織領域に分類された領域と前記内腔領域に分類された領域との境界線から抽出された特徴点同士を結ぶ
請求項9または請求項10に記載の学習モデル生成方法。 3. The dividing line connects feature points extracted from a boundary line between a region classified as the biological tissue region and a region classified as the lumen region in the RT format image or the XY format image. The learning model generation method according to claim 9 or 10. - 前記分割線の条件を満たす複数の分割線候補を取得し、
それぞれの前記分割線候補について前記RT形式画像における長さを取得し、
前記分割線候補のうち、最も短い分割線候補を前記分割線に選択する
請求項9から請求項11のいずれか一つに記載の学習モデル生成方法。 obtaining a plurality of parting line candidates that satisfy the parting line conditions;
obtaining a length in the RT format image for each of the dividing line candidates;
The learning model generating method according to any one of claims 9 to 11, wherein the shortest dividing line candidate is selected as the dividing line among the dividing line candidates. - 前記分割線の条件を満たす複数の分割線候補を取得し、
それぞれの前記分割線候補について前記XY形式画像における長さを取得し、
前記分割線候補のうち、最も短い分割線候補を前記分割線に選択する
請求項9から請求項11のいずれか一つに記載の学習モデル生成方法。 obtaining a plurality of parting line candidates that satisfy the parting line conditions;
obtaining a length in the XY format image for each of the dividing line candidates;
The learning model generating method according to any one of claims 9 to 11, wherein the shortest dividing line candidate is selected as the dividing line among the dividing line candidates. - 前記分割線の条件を満たす複数の分割線候補を取得し、
それぞれの前記分割線候補について前記RT形式画像におけるRT長さと、前記XY形式画像におけるXY長さとを取得し、
前記RT長さと前記XY長さとの平均値が最も短い分割線候補を前記分割線に選択する
請求項9から請求項11のいずれか一つに記載の学習モデル生成方法。 obtaining a plurality of parting line candidates that satisfy the parting line conditions;
acquiring the RT length in the RT format image and the XY length in the XY format image for each of the dividing line candidates;
The learning model generating method according to any one of claims 9 to 11, wherein a dividing line candidate having the shortest average value of said RT length and said XY length is selected as said dividing line. - 前記平均値は、相加平均値である
請求項14に記載の学習モデル生成方法。 The learning model generation method according to claim 14, wherein the average value is an arithmetic average value. - 前記平均値は、相乗平均値である
請求項14に記載の学習モデル生成方法。 The learning model generation method according to claim 14, wherein the average value is a geometric average value. - 前記機械学習は、
前記訓練データベースから一組の訓練データを取得し、
前記訓練データに含まれる二次元画像を訓練中の学習モデルに入力して、出力された第3分類データを取得し、
前記訓練データに記録された分類データと、前記第3分類データとの差が少なくなるように、訓練中の学習モデルのパラメータを調整する処理を繰り返す
請求項1から請求項16のいずれか一つに記載の学習モデル生成方法。 The machine learning is
obtaining a set of training data from the training database;
inputting the two-dimensional image included in the training data into the learning model being trained to acquire output third classification data;
17. The process of adjusting the parameters of the learning model being trained is repeated so that the difference between the classification data recorded in the training data and the third classification data is reduced. The learning model generation method described in . - 前記差は、前記訓練データに記録された分類データを構成する各ピクセルのうち、前記分類データにおける分類と、前記第3分類データにおける分類とが異なるピクセルの数である
請求項17に記載の学習モデル生成方法。 The learning according to claim 17, wherein the difference is the number of pixels whose classification in the classification data differs from the classification in the third classification data among the pixels constituting the classification data recorded in the training data. Model generation method. - 前記差は、前記訓練データに記録された分類データにおける所定の領域に関する正解境界線と、前記第3分類データにおける前記所定の領域に関する出力境界線との間の距離である
請求項17に記載の学習モデル生成方法。 18. The method according to claim 17, wherein the difference is the distance between a correct boundary line for a given region in the classification data recorded in the training data and an output boundary line for the given region in the third classification data. Learning model generation method. - 前記距離は、前記画像取得用カテーテルの中心から離れる方向に沿った距離である
請求項19に記載の学習モデル生成方法。 The learning model generation method according to claim 19, wherein the distance is a distance along a direction away from the center of the image acquisition catheter. - 画像取得用カテーテルを用いて時系列的に得られた複数の二次元画像を取得する画像取得部と、
前記二次元画像を、請求項1から請求項20のいずれか一つに記載の学習モデル生成方法で生成した学習済モデルに順次入力して、出力される前記第3分類データを順次取得する第3分類データ取得部と、
を備える画像処理装置。 an image acquisition unit that acquires a plurality of two-dimensional images obtained in time series using an image acquisition catheter;
The two-dimensional image is sequentially input to a trained model generated by the learning model generation method according to any one of claims 1 to 20, and the output third classification data is sequentially obtained. 3 classification data acquisition unit;
An image processing device comprising: - 画像取得用カテーテルを用いて時系列的に得られた複数の二次元画像を取得する画像取得部と、
前記複数の二次元画像のそれぞれを構成する各ピクセルが、生体組織領域、前記画像取得用カテーテルが挿入されている内腔領域、および、生体組織領域よりも外側の腔外領域を含む複数の領域に分類された、一連の第1分類データを取得する第1分類データ取得部と、
前記複数の二次元画像のそれぞれにおいて、前記内腔領域が各二次元画像の縁に到達しているか否かを判定する判定部と、
前記判定部が到達していると判定した場合、前記内腔領域を、前記画像取得用カテーテルが挿入されている第1領域と前記二次元画像の縁に到達している第2領域とに分割する分割線を作成する分割線作成部と、
前記第2領域の分類を前記腔外領域に変更した前記一連の第1分類データを使用して、または、前記一連の第1分類データを使用するとともに前記第2領域を前記腔外領域と同じ領域として処理した三次元画像を作成する三次元画像作成部と
を備える画像処理装置。 an image acquisition unit that acquires a plurality of two-dimensional images obtained in time series using an image acquisition catheter;
Each pixel constituting each of the plurality of two-dimensional images has a plurality of regions including a biological tissue region, a lumen region into which the image acquisition catheter is inserted, and an extracavity region outside the biological tissue region. a first classified data acquisition unit that acquires a series of first classified data classified into
a determination unit that determines whether or not the lumen region has reached the edge of each of the plurality of two-dimensional images;
When the judging unit judges that the lumen area has reached, the lumen area is divided into a first area where the image acquisition catheter is inserted and a second area where the edge of the two-dimensional image is reached. a dividing line creation unit that creates a dividing line that
using the series of first classified data in which the classification of the second region is changed to the extraluminal region, or using the series of first classified data and classifying the second region as the extraluminal region A 3D image generator that generates a 3D image processed as regions. - 画像取得用カテーテルを用いて取得された二次元画像を取得する画像取得部と、
前記二次元画像が、生体組織領域、前記画像取得用カテーテルが挿入されている内腔領域、および、生体組織領域よりも外側の腔外領域を含む複数の領域に分類された、第1分類データを取得する第1分類データ取得部と、
前記二次元画像において、前記内腔領域が前記二次元画像の縁に到達しているか否かを判定する判定部と、
前記判定部が到達していないと判定した場合、前記二次元画像と前記第1分類データとを関連づけて訓練データベースに記録する第1記録部と
前記判定部が到達していると判定した場合、
前記内腔領域を、前記画像取得用カテーテルが挿入されている第1領域と前記二次元画像の縁に到達している第2領域とに分割する分割線を作成する分割線作成部と、
前記分割線および前記第1分類データに基づいて、前記第1分類データのうち前記内腔領域を構成するそれぞれの小領域について、前記内腔領域である確率と前記腔外領域である確率とを配分した第2分類データを作成する第2分類データ作成部と
前記二次元画像と前記第2分類データとを関連づけて前記訓練データベースに記録する第2記録部と、
を備える情報処理装置。 an image acquisition unit that acquires a two-dimensional image acquired using an image acquisition catheter;
First classified data in which the two-dimensional image is classified into a plurality of regions including a biological tissue region, a lumen region into which the image acquisition catheter is inserted, and an extracavity region outside the biological tissue region. a first classification data acquisition unit that acquires
a determination unit that determines whether or not the lumen region has reached the edge of the two-dimensional image;
If the determining unit determines that the first recording unit has not reached the first recording unit that associates the two-dimensional image with the first classification data and records them in a training database, and if the determining unit determines that the first recording unit has reached
a dividing line creating unit that creates a dividing line that divides the lumen area into a first area into which the image acquisition catheter is inserted and a second area that reaches the edge of the two-dimensional image;
Based on the parting line and the first classification data, the probability of being the lumen region and the probability of being the extraluminal region are calculated for each of the small regions constituting the lumen region in the first classification data. a second classification data creation unit that creates distributed second classification data; a second recording unit that associates the two-dimensional image with the second classification data and records them in the training database;
Information processing device. - 画像取得用カテーテルを用いて取得された二次元画像を取得し、
前記二次元画像が、生体組織領域、前記画像取得用カテーテルが挿入されている内腔領域、および、生体組織領域よりも外側の腔外領域を含む複数の領域に分類された、第1分類データを取得し、
前記二次元画像において、前記内腔領域が前記二次元画像の縁に到達しているか否かを判定し、
到達していると判定した場合、
前記内腔領域を、前記画像取得用カテーテルが挿入されている第1領域と前記二次元画像の縁に到達している第2領域とに分割する分割線を作成し、
前記分割線および前記第1分類データに基づいて、前記第1分類データのうち前記内腔領域を構成するそれぞれの小領域について、前記内腔領域である確率と前記腔外領域である確率とを配分した第2分類データを作成し、
前記二次元画像と前記第2分類データとを関連づけて訓練データベースに記録し、
到達していないと判定した場合、前記二次元画像と前記第1分類データとを関連づけて前記訓練データベースに記録する
訓練データ生成方法。 Acquiring a two-dimensional image acquired using an image acquisition catheter,
First classified data in which the two-dimensional image is classified into a plurality of regions including a biological tissue region, a lumen region into which the image acquisition catheter is inserted, and an extracavity region outside the biological tissue region. and get
in the two-dimensional image, determining whether or not the lumen region has reached the edge of the two-dimensional image;
If it is determined that it has reached
creating a dividing line dividing the lumen region into a first region into which the image acquisition catheter is inserted and a second region reaching the edge of the two-dimensional image;
Based on the parting line and the first classification data, the probability of being the lumen region and the probability of being the extraluminal region are calculated for each of the small regions constituting the lumen region in the first classification data. Create the distributed second classification data,
record the two-dimensional image and the second classification data in a training database in association with each other;
A method of generating training data, wherein, when it is determined that the data has not reached, the two-dimensional image and the first classification data are associated with each other and recorded in the training database. - 画像取得用カテーテルを用いて時系列的に得られた複数の二次元画像を取得し、
前記複数の二次元画像のそれぞれを構成する各ピクセルが、生体組織領域、前記画像取得用カテーテルが挿入されている内腔領域、および、生体組織領域よりも外側の腔外領域を含む複数の領域に分類された、一連の第1分類データを取得し、
前記複数の二次元画像のそれぞれにおいて、前記内腔領域が各二次元画像の縁に到達しているか否かを判定し、
到達していると判定した場合、前記内腔領域を、前記画像取得用カテーテルが挿入されている第1領域と前記二次元画像の縁に到達している第2領域とに分割する分割線を作成し、
前記第2領域の分類を前記腔外領域に変更した前記一連の第1分類データを使用して、または、前記一連の第1分類データを使用するとともに前記第2領域を前記腔外領域と同じ領域として処理した三次元画像を作成する
画像処理方法。 Acquiring a plurality of two-dimensional images obtained in time series using an image acquisition catheter,
Each pixel constituting each of the plurality of two-dimensional images has a plurality of regions including a biological tissue region, a lumen region into which the image acquisition catheter is inserted, and an extracavity region outside the biological tissue region. Obtain a series of first classification data classified into
determining whether or not the lumen region has reached the edge of each two-dimensional image in each of the plurality of two-dimensional images;
If it is determined that the image acquisition catheter has been reached, a dividing line that divides the lumen region into a first region where the image acquisition catheter is inserted and a second region that reaches the edge of the two-dimensional image. make,
using the series of first classified data in which the classification of the second region is changed to the extraluminal region, or using the series of first classified data and classifying the second region as the extraluminal region An image processing method that creates a three-dimensional image processed as regions.
Applications Claiming Priority (2)
| Application Number | Priority Date | Filing Date | Title |
|---|---|---|---|
| JP2021-152459 | 2021-09-17 | ||
| JP2021152459 | 2021-09-17 |
Publications (1)
| Publication Number | Publication Date |
|---|---|
| WO2023042861A1 true WO2023042861A1 (en) | 2023-03-23 |
Family
ID=85602918
Family Applications (1)
| Application Number | Title | Priority Date | Filing Date |
|---|---|---|---|
| PCT/JP2022/034448 WO2023042861A1 (en) | 2021-09-17 | 2022-09-14 | Learning model generation method, image processing device, information processing device, training data generation method, and image processing method |
Country Status (1)
| Country | Link |
|---|---|
| WO (1) | WO2023042861A1 (en) |
Citations (3)
| Publication number | Priority date | Publication date | Assignee | Title |
|---|---|---|---|---|
| JP2010148778A (en) * | 2008-12-26 | 2010-07-08 | Toshiba Corp | Image display and image display method |
| WO2015136853A1 (en) * | 2014-03-14 | 2015-09-17 | テルモ株式会社 | Image processing device, image processing method, and program |
| US20200129147A1 (en) * | 2018-10-26 | 2020-04-30 | Volcano Corporation | Intraluminal ultrasound vessel border selection and associated devices, systems, and methods |
-
2022
- 2022-09-14 WO PCT/JP2022/034448 patent/WO2023042861A1/en active Application Filing
Patent Citations (3)
| Publication number | Priority date | Publication date | Assignee | Title |
|---|---|---|---|---|
| JP2010148778A (en) * | 2008-12-26 | 2010-07-08 | Toshiba Corp | Image display and image display method |
| WO2015136853A1 (en) * | 2014-03-14 | 2015-09-17 | テルモ株式会社 | Image processing device, image processing method, and program |
| US20200129147A1 (en) * | 2018-10-26 | 2020-04-30 | Volcano Corporation | Intraluminal ultrasound vessel border selection and associated devices, systems, and methods |
Similar Documents
| Publication | Publication Date | Title |
|---|---|---|
| US11101033B2 (en) | Medical image aided diagnosis method and system combining image recognition and report editing | |
| CN108335304B (en) | Aortic aneurysm segmentation method of abdominal CT scanning sequence image | |
| US7130457B2 (en) | Systems and graphical user interface for analyzing body images | |
| CN102395320B (en) | Medical apparatus and method for controlling the medical apparatus | |
| EP2157905B1 (en) | A method for tracking 3d anatomical and pathological changes in tubular-shaped anatomical structures | |
| JP5222082B2 (en) | Information processing apparatus, control method therefor, and data processing system | |
| US20050251021A1 (en) | Methods and systems for generating a lung report | |
| US20030028401A1 (en) | Customizable lung report generator | |
| JPWO2007129493A1 (en) | Medical image observation support device | |
| CN107004305A (en) | Medical image editor | |
| CN112819818B (en) | Image recognition module training method and device | |
| WO2023186133A1 (en) | System and method for puncture path planning | |
| US9123163B2 (en) | Medical image display apparatus, method and program | |
| CN113470060B (en) | Coronary artery multi-angle curved surface reconstruction visualization method based on CT image | |
| US20230133103A1 (en) | Learning model generation method, image processing apparatus, program, and training data generation method | |
| WO2023042861A1 (en) | Learning model generation method, image processing device, information processing device, training data generation method, and image processing method | |
| CN104915989A (en) | CT image-based blood vessel three-dimensional segmentation method | |
| JP6827707B2 (en) | Information processing equipment and information processing system | |
| CN107610772A (en) | A kind of thyroid nodule CT image diagnostic system design methods | |
| JP6461743B2 (en) | Medical image processing apparatus and medical image processing method | |
| CN116309346A (en) | Medical image detection method, device, equipment, storage medium and program product | |
| CN114419032B (en) | Method and device for segmenting the endocardium and/or the epicardium of the left ventricle of the heart | |
| WO2022071326A1 (en) | Information processing device, learned model generation method and training data generation method | |
| JP7275961B2 (en) | Teacher image generation program, teacher image generation method, and teacher image generation system | |
| JP6920477B2 (en) | Image processing equipment, image processing methods, and programs |
Legal Events
| Date | Code | Title | Description |
|---|---|---|---|
| 121 | Ep: the epo has been informed by wipo that ep was designated in this application |
Ref document number: 22870008 Country of ref document: EP Kind code of ref document: A1 |
|
| WWE | Wipo information: entry into national phase |
Ref document number: 2023548489 Country of ref document: JP |