WO2023032438A1 - Regression estimation device and method, program, and trained model generation method - Google Patents
Regression estimation device and method, program, and trained model generation method Download PDFInfo
- Publication number
- WO2023032438A1 WO2023032438A1 PCT/JP2022/025288 JP2022025288W WO2023032438A1 WO 2023032438 A1 WO2023032438 A1 WO 2023032438A1 JP 2022025288 W JP2022025288 W JP 2022025288W WO 2023032438 A1 WO2023032438 A1 WO 2023032438A1
- Authority
- WO
- WIPO (PCT)
- Prior art keywords
- regression
- data
- model
- estimation device
- estimated
- Prior art date
Links
- 238000000034 method Methods 0.000 title claims abstract description 48
- 238000003860 storage Methods 0.000 claims abstract description 18
- 238000009826 distribution Methods 0.000 claims description 145
- 230000006870 function Effects 0.000 claims description 48
- 238000012549 training Methods 0.000 claims description 23
- 238000010801 machine learning Methods 0.000 claims description 18
- 230000010354 integration Effects 0.000 claims description 17
- 238000002347 injection Methods 0.000 claims description 15
- 239000007924 injection Substances 0.000 claims description 15
- 238000006243 chemical reaction Methods 0.000 claims description 13
- 239000002872 contrast media Substances 0.000 claims description 13
- 230000009466 transformation Effects 0.000 claims description 11
- 238000013527 convolutional neural network Methods 0.000 claims description 9
- 238000004364 calculation method Methods 0.000 claims description 4
- 238000012545 processing Methods 0.000 description 71
- 238000002591 computed tomography Methods 0.000 description 28
- 238000004891 communication Methods 0.000 description 25
- 238000010586 diagram Methods 0.000 description 23
- 238000003384 imaging method Methods 0.000 description 13
- 230000008569 process Effects 0.000 description 13
- 238000005516 engineering process Methods 0.000 description 8
- 238000012935 Averaging Methods 0.000 description 4
- 238000010191 image analysis Methods 0.000 description 4
- 210000004185 liver Anatomy 0.000 description 4
- 210000000056 organ Anatomy 0.000 description 4
- 238000013135 deep learning Methods 0.000 description 3
- 238000002595 magnetic resonance imaging Methods 0.000 description 3
- 238000012986 modification Methods 0.000 description 3
- 230000004048 modification Effects 0.000 description 3
- 238000002600 positron emission tomography Methods 0.000 description 3
- 239000004065 semiconductor Substances 0.000 description 3
- 102100039398 C-X-C motif chemokine 2 Human genes 0.000 description 2
- 101000889128 Homo sapiens C-X-C motif chemokine 2 Proteins 0.000 description 2
- 230000008859 change Effects 0.000 description 2
- 238000001514 detection method Methods 0.000 description 2
- 238000011478 gradient descent method Methods 0.000 description 2
- 230000010365 information processing Effects 0.000 description 2
- 238000012417 linear regression Methods 0.000 description 2
- 230000003287 optical effect Effects 0.000 description 2
- 230000001131 transforming effect Effects 0.000 description 2
- 238000004458 analytical method Methods 0.000 description 1
- 238000013459 approach Methods 0.000 description 1
- 230000037007 arousal Effects 0.000 description 1
- 238000003491 array Methods 0.000 description 1
- 238000013528 artificial neural network Methods 0.000 description 1
- 230000003416 augmentation Effects 0.000 description 1
- 238000013170 computed tomography imaging Methods 0.000 description 1
- 238000004195 computer-aided diagnosis Methods 0.000 description 1
- 238000005520 cutting process Methods 0.000 description 1
- 230000007423 decrease Effects 0.000 description 1
- 230000006866 deterioration Effects 0.000 description 1
- 201000010099 disease Diseases 0.000 description 1
- 208000037265 diseases, disorders, signs and symptoms Diseases 0.000 description 1
- 239000003814 drug Substances 0.000 description 1
- 229940079593 drug Drugs 0.000 description 1
- 238000005401 electroluminescence Methods 0.000 description 1
- 230000008909 emotion recognition Effects 0.000 description 1
- 238000003709 image segmentation Methods 0.000 description 1
- 230000006698 induction Effects 0.000 description 1
- 230000003902 lesion Effects 0.000 description 1
- 239000004973 liquid crystal related substance Substances 0.000 description 1
- 238000004519 manufacturing process Methods 0.000 description 1
- 238000013507 mapping Methods 0.000 description 1
- 230000007246 mechanism Effects 0.000 description 1
- 230000001537 neural effect Effects 0.000 description 1
- 210000003240 portal vein Anatomy 0.000 description 1
- 238000011160 research Methods 0.000 description 1
- 230000011218 segmentation Effects 0.000 description 1
- 239000007787 solid Substances 0.000 description 1
- 230000005236 sound signal Effects 0.000 description 1
- 238000002604 ultrasonography Methods 0.000 description 1
Images


Classifications
-
- G—PHYSICS
- G06—COMPUTING; CALCULATING OR COUNTING
- G06N—COMPUTING ARRANGEMENTS BASED ON SPECIFIC COMPUTATIONAL MODELS
- G06N20/00—Machine learning
Definitions
- the present disclosure relates to a regression estimation device and method, a program, and a method of generating a trained model, and more particularly to an information processing technology that performs regression estimation for estimating numerical values of objective variables based on input data.
- Non-Patent Literature 1 discloses a configuration for a classification problem in which, when integrating multiple inference results, the weight of inference results near the boundary value (0.5) is reduced.
- Non-Patent Document 2 discloses a configuration in which inference results obtained from a plurality of linear regression models are integrated with a median weighted for each model.
- a plurality of regression models are used to estimate a valence (induction) value and an arousal (awakening) value as music impression values from a music sound signal, and a plurality of estimation results obtained by the plurality of regression models are used. Describes how to integrate.
- Non-Patent Document 3 when solving a regression problem, after creating multiple images by rotating or flipping a single image, input them to a learning model and calculate the estimated values for the number of inputs obtained. The final result is obtained by averaging.
- a normal deep regression model does not output the confidence level for the estimated value, but in Non-Patent Document 4, the regression confidence level is obtained by using the mean and standard deviation of the normal distribution as the output of the deep learning machine.
- Non-Patent Document 2 uses a weighted median, but this method is intended for linear regression and does not dynamically change the weight according to the input.
- Non-Patent Document 3 the final result is obtained by simple averaging from multiple estimated values obtained from the learning model, so the influence of inputs unsuitable for estimation cannot be reduced by weighting.
- the method described in Non-Patent Document 4 only obtains the degree of certainty of regression, and is not a mechanism for integrating estimation results.
- the present disclosure has been made in view of such circumstances, and integrates the estimation results obtained by performing multiple different inputs to one (single) regression model to derive one estimated value. It is an object of the present invention to provide a regression estimation device and method, a program, and a method of generating a trained model that can improve the accuracy of case estimation.
- a regression estimation device includes one or more processors and one or more storage devices in which programs executed by the one or more processors are stored, wherein the one or more processors are , by executing a program instruction, accepts multiple data inputs, inputs multiple data into a single regression model, and estimates multiple pairs of estimated values and the likelihood of estimated values from multiple data Then, the multiple sets of estimation results are integrated based on the multiple sets of estimated values estimated by the regression model and the likelihood of the estimated values.
- a plurality of data are input to a single regression model to obtain a plurality of sets of estimated values and their probabilities according to the input, and these sets of The estimation results are integrated based on the estimated values and their likelihoods, and an estimated value is obtained as the integrated result. Since the probability of each estimated value is taken into consideration when integrating, the estimated value (final estimated value) as the integration result derived by this embodiment can be a highly accurate estimated value.
- Single regression model means one type of regression model, and may have multiple processing modules that operate as the same regression model.
- estimate includes the concepts of inference and prediction.
- probability encompasses the concepts of certainty and confidence.
- one or more processors estimate a probability distribution with the estimated value as a random variable, based on the estimated value and the probability of the estimated value, and each of the plurality of sets are integrated to generate an integrated distribution, and the final estimated value is determined based on the integrated distribution.
- one or more processors estimate a probability distribution with the estimated value as a random variable, based on the estimated value and the probability of the estimated value, and each of the plurality of sets A value that maximizes the product of probabilities of the same random variable can be specified based on the probability distribution of .
- the one or more processors transform the estimated value output from the regression model into the first parameter of the probability distribution model, and the probability output from the regression model can be configured to variable-transform the value indicating to the second parameter of the probability distribution model.
- the probability distribution model may be Laplace distribution.
- the probability distribution model may be Gaussian distribution.
- the one or more processors perform logarithmic transformation that takes logarithms of the probability distributions, and when integrating, logarithmic probability densities corresponding to each of the plurality of sets of probability distributions. It can be configured to calculate the sum and find the value that maximizes the joint logarithmic probability density.
- the regression model includes a learned model generated by performing machine learning using training data in which input data and teacher signals are associated.
- the regression model may be constructed using a convolutional neural network.
- the plurality of data may be medical images.
- the multiple data may be slice images within the same series.
- the plurality of data may be configured to include different partial images included in the 3D image.
- the plurality of data may include generated images generated based on different partial images included in the 3D image.
- the plurality of data may be configured to include different partial images included in the time-series images.
- the plurality of data may include images with different resolutions.
- the estimated value may be a value indicating the position of a specific target.
- the estimated value may be a value indicating the position of the partial image in the 3D image.
- the estimated value may be the age of the person in the image that is the input data.
- a regression estimation method is a regression estimation method executed by a processor, which receives input of a plurality of data and inputs the plurality of data into a single regression model to obtain a plurality of Estimate multiple sets of estimated values and the likelihood of the estimated values from the data, and integrate the multiple sets of estimation results based on the multiple sets of estimated values and the likelihood of the estimated values estimated by the regression model including
- a program provides a computer with a function of receiving input of a plurality of data, and inputting the plurality of data into a single regression model, so that the estimated value and the accuracy of the estimated value are obtained from the plurality of data.
- a function of estimating a plurality of sets of likelihood and a function of integrating a plurality of sets of estimation results based on the plurality of sets of estimated values estimated by a regression model and the likelihood of the estimated values are realized.
- a method of generating a trained model is a method of generating a trained model used as a regression model that receives data input and outputs an estimated value and the likelihood of the estimated value from the data. Then, using the training data in which the input data and the teacher signal are associated, the input data is input to the learning model, and the output of the estimated value and the value indicating the likelihood of the estimated value is obtained from the learning model. , variable conversion of the estimated value output from the learning model to the first parameter of the probability distribution model, and variable conversion of the value indicating the likelihood output from the learning model to the second parameter of the probability distribution model. calculating a loss function using the first parameter, the second parameter, and the teacher signal; and updating the parameters of the learning model based on the calculation result of the loss function.
- a method for generating a trained model is understood as an invention of a method for manufacturing (producing) a trained model.
- the probability distribution model is a Laplace distribution
- the first parameter is ⁇
- the second parameter is b
- the teacher signal is t.
- the probability distribution model is a Gaussian distribution
- the first parameter is ⁇
- the second parameter is ⁇ 2
- the teacher signal is t.
- log ⁇ 2 +(t- ⁇ ) 2 /2 ⁇ 2 can be used.
- highly accurate estimates can be derived from multiple data inputs for a single regression model.
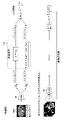
- FIG. 1 is a conceptual diagram showing an outline of processing by the regression estimation device according to the first embodiment.
- FIG. 2 is an explanatory diagram showing an example 1 of processing in the number-of-seconds distribution estimating unit.
- FIG. 4 shows an example of a graph of the number-of-seconds distribution (Laplace distribution) estimated by the parameters ⁇ and b estimated by the number-of-seconds distribution estimator.
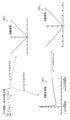
- FIG. 5 is an explanatory diagram of an example of processing in the integrating unit and the maximum point specifying unit.
- FIG. 6 is a schematic illustration of an example of a machine learning method for generating a regression model to be applied to the seconds distribution estimator.
- FIG. 1 is a conceptual diagram showing an outline of processing by the regression estimation device according to the first embodiment.
- FIG. 2 is an explanatory diagram showing an example 1 of processing in the number-of-seconds distribution estimating unit.
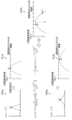
- FIG. 7 is an explanatory diagram of a loss function used during training.
- FIG. 8 is a block diagram schematically showing an example of the hardware configuration of the regression estimation device according to the first embodiment;
- FIG. 9 is a functional block diagram showing an overview of processing functions of the regression estimation device according to the first embodiment.
- FIG. 10 is an explanatory diagram showing example 2 of processing in the number-of-seconds distribution estimation unit of the regression estimation device according to the second embodiment.
- FIG. 11 shows an example of a graph of the number-of-seconds distribution (Gaussian distribution) estimated by the parameters ⁇ and ⁇ 2 estimated by the number-of-seconds distribution estimator.
- FIG. 12 is an explanatory diagram illustrating an example of processing in the integration unit and maximum point identification unit of the regression estimation device according to the second embodiment.
- FIG. 13 is a schematic explanatory diagram of an example of a machine learning method for generating a regression model applied to the number-of-seconds distribution estimator in the second embodiment.
- FIG. 14 is an explanatory diagram showing Modified Example 1 of data used for input to the regression estimation device.
- FIG. 15 is an explanatory diagram showing Modified Example 2 of data used for input to the regression estimation apparatus.
- FIG. 16 is a block diagram showing a configuration example of a medical information system to which the regression estimation device is applied.
- FIG. 1 is a conceptual diagram showing an outline of processing by the regression estimation device 10 according to the first embodiment.
- a plurality of slice images sampled at equal intervals from a patient's three-dimensional CT data taken using a CT (Computed Tomography) device are used as input, and a contrast agent is injected based on the input plurality of slice images.
- the term "seconds" in this specification includes the number of seconds indicating the elapsed time from the injection of the contrast medium, unless explicitly stated otherwise.
- the slice image may also be called a tomographic image.
- a slice image may be understood as a substantially two-dimensional image (cross-sectional image).
- the regression estimation device 10 can be realized using computer hardware and software.
- the regression estimation device 10 includes a seconds distribution estimating unit 14 that receives an input of an image IM and estimates a probability distribution of seconds (hereinafter referred to as a "seconds distribution"), and a plurality of seconds estimated from a plurality of inputs. It includes an integration unit 16 that integrates the number distribution PD, and a maximum point identification unit 18 that identifies the number of seconds with the maximum probability from the new distribution obtained by the integration process (hereinafter referred to as "integrated distribution"). The number of seconds specified by the maximum point specifying unit 18 (the number of seconds with the maximum probability) is output as the final result.
- FIG. 1 three seconds distribution estimating units 14 are shown in order to show the flow of processing when three different images IM are input.
- the distribution estimator 14 is the same (single) processor.
- FIG. 2 is an explanatory diagram showing Example 1 of processing in the number-of-seconds distribution estimation unit 14.
- the number-of-seconds distribution estimator 14 includes a regression estimator 22 and a variable converter 24 .
- the regression estimation unit 22 is trained by machine learning so as to receive an input of the image IM and output an estimated value Oa of the number of seconds and a score value Ob indicating the likelihood (certainty factor) of the estimated value Oa.
- a trained model as a regression model applied to the regression estimation unit 22 is configured using, for example, a convolutional neural network (CNN).
- CNN convolutional neural network
- the numerical range of the estimated value Oa of the number of seconds output from the regression estimation unit 22 may be “ ⁇ Oa ⁇ ”, and the numerical range of the likelihood score value Ob may be “ ⁇ Ob ⁇ ”. It's okay.
- the regression model is not limited to CNN, and various machine learning models can be applied.
- the function of formula (2) is an example of a mapping that converts the likelihood score value Ob to a value b in the positive region.
- Parameter ⁇ is an example of a “first parameter” in the present disclosure.
- Parameter b is an example of a "second parameter" in the present disclosure.
- the Laplace distribution is applied as the probability distribution model of the number of seconds distribution.
- Laplacian distribution is represented by the function of the following equation (3).
- the reason for converting the likelihood score value Ob to a positive value b is related to applying the Laplace distribution as a probability distribution model for the number of seconds distribution. This is because if the parameter b is a negative value (b ⁇ 0), the Laplace distribution does not hold as a probability distribution, so it is necessary to ensure that the parameter b is a positive value (b>0). .
- FIG. 4 shows an example of a graph of the number-of-seconds distribution estimated by the parameters ⁇ and b estimated by the number-of-seconds distribution estimation unit 14 .
- the position indicated by the dashed line GT in the drawing corresponds to the correct number of seconds (correct number of seconds).
- Estimating a set of the estimated value Oa and the probability score Ob from the input image IM substantially corresponds to estimating the number-of-seconds distribution.
- the estimated value Oa of the number of seconds is an example of a "random variable" in this disclosure.
- FIG. 5 is an explanatory diagram showing an example of processing in the integrating section 16 and the maximum point specifying section 18.
- FIG. 5 To simplify the explanation, an example of integrating two distributions of seconds estimated by the distribution of seconds estimating unit 14 is shown here, but the same applies to the case of integrating three or more distributions of seconds.
- Graph GD1 shown in the upper left of FIG. 5 is a distribution of seconds (probability distribution P1 ) is an example.
- the integration unit 16 takes the logarithm of the estimated number-of-seconds distribution, converts it into a logarithmic probability density, takes the sum of a plurality of logarithmic probability densities, and integrates them. This corresponds to finding the product of probabilities over the same number of seconds.
- Graph GL1 in FIG. 5 is an example of logarithmic probability density logP1 obtained by taking the logarithm of probability distribution P1.
- Graph GD2 shown in the lower left of FIG. 5 is a distribution of seconds (probability distribution P2 ) is an example.
- a graph GL2 in FIG. 5 is an example of the logarithmic probability density obtained by taking the logarithm of the probability distribution P2.
- the rightmost graph GLS in FIG. 5 is an example of the joint logarithmic probability density that integrates the logarithmic probability density logP1 and the logarithmic probability density logP2.
- the distribution shown in graph GLS is an example of "integrated distribution" in the present disclosure.
- the maximum point identifying unit 18 identifies the value x of the parameter ⁇ that maximizes the logarithmic probability from the integrated logarithmic probability density.
- the processing in the maximum point identification unit 18 can be expressed by the following equation (4).
- the target function of argmin shown on the right side of the equal sign in the second row of Equation (4) corresponds to the loss function during training in machine learning, which will be described later.
- the right side of the equal sign described in the third row corresponds to the weighted median formula.
- the parameter bi corresponding to the weight for integration dynamically changes according to the output of the regression estimator 22 .
- the input value (maximum point) at which the joint log probability is maximized is ⁇ 1, and ⁇ 1 is selected as the final estimation result (final result).
- ⁇ 1 is the estimation result for the image IM1 among the plurality of input slice images.
- the calculation is performed by converting the distribution of seconds into a logarithmic probability density. Processing is performed to derive the maximum value as the final result.
- the integrated distribution takes the form of a weighted median.
- a highly accurate estimated value can be obtained by suppressing the influence of the outlier.
- ⁇ Description of medical images used for input In the DICOM (Digital Imaging and Communications in Medicine) standard, which defines the format and communication protocol of medical images, a unit called a study ID, which is an identification code (ID) for specifying the type of examination, , the series ID is defined.
- DICOM Digital Imaging and Communications in Medicine
- CT imaging of a range including the liver is performed a plurality of times (four times in this case) at different imaging timings as described below.
- CT data is three-dimensional data composed of a plurality of continuous slice images (tomographic images), and is an aggregate of a plurality of slice images (continuous slices) that constitute the three-dimensional data.
- a set of images) is called an “image series”.
- CT data is an example of a "three-dimensional image" in this disclosure.
- “study 1” is given as a study ID for a specific patient's liver contrast imaging examination
- “series 1” is given as the series ID of CT data obtained by imaging before contrast medium injection
- “series 1” is given as a series ID for CT data obtained by imaging before "Series 2" for CT data obtained by imaging 35 seconds after injection
- "Series 3" for CT data obtained by imaging 70 seconds after injection of contrast agent, 180 seconds after injection of contrast injection
- a unique ID is assigned to each series, such as "series 4", to the CT data obtained by imaging. Therefore, CT data can be identified by a combination of study ID and series ID.
- CT data can be identified by a combination of study ID and series ID.
- the correspondence relationship between the series ID and the imaging timing elapsed time after injection of the contrast medium
- the number of seconds is estimated by image analysis using multiple slice images in the same series as input. "By image analysis” means by processing based on pixel values that constitute image data.
- FIG. 6 is a schematic explanatory diagram of an example of a machine learning method for generating a regression model applied to the number-of-seconds distribution estimator 14.
- Training data used for machine learning includes an image TIM as input data and correct data (teacher signal t) corresponding to the input.
- the image TIM may be a slice image that constitutes an image series of three-dimensional CT data
- the teacher signal t is a value that indicates the number of seconds (ground truth) from the injection of the contrast agent when the series to which the slice image belongs is captured. It can be.
- a plurality of training data are generated by linking the corresponding teacher signal t.
- "Binding” may also be referred to as correspondence or association.
- "Training” is synonymous with "learning.”
- the same teacher signal t may be associated with slices of the same image series. That is, the teacher signal t may be associated with each image series.
- each slice is associated with a corresponding teacher signal t to generate multiple training data.
- a set of training data thus generated is used as a training data set.
- the learning model 20 When the image TIM read from the training data set is input to the learning model 20, the learning model 20 outputs the estimated value Oa of the number of seconds and the likelihood score Ob.
- the estimated value Oa and the score value Ob are variable-transformed into the parameter ⁇ and the parameter b of the probability distribution model by the variable transformation unit 24 .
- the loss function L used during training is defined by the following equation (5).
- the subscript i is an index that identifies each slice.
- FIG. 7 is an explanatory diagram of the loss function used during training.
- the loss function is a negative log-likelihood, which directly optimizes the formula used for regression estimation by learning. Learning maximizes the log-likelihood of the teacher signal t in seconds.
- a graph for the parameter ⁇ of the loss function shown in Equation (5) is the graph GR ⁇ in FIG.
- the graph GR ⁇ has a stable slope with respect to the parameter ⁇ .
- the graph for parameter b of the loss function shown in Equation (5) is graph GRb in FIG.
- Graph GRb has an unstable slope with respect to parameter b. In regions where the value of b is small, 1/b is dominant, and in regions where the value of b is large, logb is dominant.
- the function used for variable transformation of the parameter b is a function that asymptotically approaches -1/x when x ⁇ - ⁇ and exp(x) when x ⁇ . can be canceled.
- the machine learning method of the learning model 20 described using FIGS. 6 and 7 is an example of the "learned model generating method" in the present disclosure.
- the regression estimator 10 includes a processor 102 , a non-transitory tangible computer-readable medium 104 , a communication interface 106 , an input/output interface 108 and a bus 110 .
- the processor 102 includes a CPU (Central Processing Unit). Processor 102 may include a GPU (Graphics Processing Unit). Processor 102 is coupled to computer-readable media 104 , communication interface 106 , and input/output interface 108 via bus 110 . The processor 102 reads various programs and data stored in the computer-readable medium 104 and executes various processes.
- CPU Central Processing Unit
- GPU Graphics Processing Unit
- the computer-readable medium 104 includes, for example, a memory 104A that is a main storage device and a storage 104B that is an auxiliary storage device.
- the storage 104B is configured using, for example, a hard disk drive (HDD) device, a solid state drive (SSD) device, an optical disk, a magneto-optical disk, or a semiconductor memory, or an appropriate combination thereof. .
- HDD hard disk drive
- SSD solid state drive
- Various programs, data, and the like are stored in the storage 104B.
- Computer-readable medium 104 is an example of a "storage device" in this disclosure.
- the memory 104A is used as a work area for the processor 102, and is used as a storage unit that temporarily stores programs and various data read from the storage 104B.
- a program stored in the storage 104B is loaded into the memory 104A, and the processor 102 executes the instructions of the program, whereby the processor 102 functions as means for performing various processes defined by the program.
- the memory 104A stores a regression estimation program 130 executed by the processor 102, various data, and the like.
- the regression estimation program 130 includes a trained model trained by machine learning, and causes the processor 102 to execute the processing described with reference to FIG.
- the communication interface 106 performs wired or wireless communication processing with an external device, and exchanges information with the external device.
- the regression estimation device 10 is connected to a communication line (not shown) via a communication interface 106 .
- the communication line may be a local area network or a wide area network.
- the communication interface 106 can serve as a data acquisition unit that receives input of data such as images.
- the regression estimator 10 may further include an input device 114 and a display device 116 .
- Input device 114 and display device 116 are connected to bus 110 via input/output interface 108 .
- the input device 114 may be, for example, a keyboard, mouse, multi-touch panel, or other pointing device, voice input device, or any suitable combination thereof.
- the display device 116 is an output interface that displays various information.
- the display device 116 may be, for example, a liquid crystal display, an organic electro-luminescence (OEL) display, a projector, or an appropriate combination thereof.
- OEL organic electro-luminescence
- FIG. 9 is a functional block diagram showing an outline of processing functions of the regression estimation device 10 according to the first embodiment.
- the processor 102 of the regression estimation device 10 executes the regression estimation program 130 stored in the memory 104A to obtain the data acquisition unit 12, the number-of-seconds distribution estimation unit 14, the integration unit 16, the maximum point identification unit 18, and the output unit 19. function as
- the data acquisition unit 12 accepts input of data to be processed.
- the data acquisition unit 12 acquires an image IMi, which is a slice image sampled from CT data.
- the data acquisition unit 12 may perform processing for cutting out slice images from CT data at regular intervals, or may acquire slice images sampled in advance by a processing unit (not shown) or the like.
- the image IMi captured via the data acquisition unit 12 is input to the regression estimation unit 22 of the seconds distribution estimation unit 14 .
- the regression estimator 22 outputs a set of an estimated value Oa of the number of seconds and a score value Ob indicating the likelihood of the estimated value Oa from each of the input images IMi.
- the estimated value Oa output from the regression estimating unit 22 is converted into the parameter ⁇ i of the probability distribution model in the variable transforming unit 24, and the likelihood score Ob output from the regression estimating unit 22 is converted to probability in the variable transforming unit 24. It is converted into parameters bi of the distribution model. These two parameters ⁇ i, bi estimate the probability distribution Pi of the seconds.
- the integration unit 16 performs processing to integrate multiple probability distributions Pi obtained by inputting multiple images IMi.
- the logarithm of the probability distribution Pi is taken in the logarithmic conversion unit 26 and converted into the logarithmic probability density logPi, and the integrated distribution is obtained by calculating the sum of the logarithmic probability densities logPi in the integrated distribution generation unit 28 .
- the maximum point specifying unit 18 specifies the value of the number of seconds (maximum point) with the maximum probability from the integrated distribution, and outputs the value of the specified number of seconds as the final estimated value. Note that the maximum point identification unit 18 may be configured to be incorporated in the integration unit 16 .
- the output unit 19 is an output interface for displaying the final estimated value specified by the maximum point specifying unit 18 and providing it to other processing units.
- the output unit 19 may include a processing unit such as processing for generating data for display and/or data conversion processing for transmitting data to the outside.
- the number of seconds estimated by the regression estimation device 10 may be displayed on a display device (not shown) or the like.
- the contrast-enhanced state may be estimated from the number of seconds estimated by the regression estimation device 10, and the estimated result of the contrast-enhanced state classification may be displayed on a display device or the like instead of or together with the number of seconds.
- the estimated result of the contrast-enhanced state classification may be displayed on a display device or the like instead of or together with the number of seconds.
- the contrast-enhanced state may be estimated from the number of seconds estimated by the regression estimation device 10, and the estimated result of the contrast-enhanced state classification may be displayed on a display device or the like instead of or together with the number of seconds.
- the contrast-enhanced state may be estimated from the number of seconds estimated by the regression estimation device 10, and the estimated result of the contrast-enhanced state classification may be displayed on a display device or the like instead of or together with the number of seconds.
- the regression estimation device 10 may be incorporated in a medical image processing device for processing medical images acquired in medical institutions such as hospitals. Also, the processing functions of the regression estimation device 10 may be provided as a cloud service.
- the method of regression estimation processing executed by the processor 102 is an example of the “regression estimation method” in the present disclosure.
- the hardware configuration of the regression estimation device 10 according to the second embodiment may be the same as that of the first embodiment. Regarding the second embodiment, points different from the first embodiment will be described. In the second embodiment, the processing contents of each of the second number distribution estimation unit 14, the integration unit 16, and the maximum point identification unit 18 are different from those in the first embodiment.
- FIG. 10 is an explanatory diagram showing Example 2 of processing in the number-of-seconds distribution estimation unit 14 of the regression estimation device 10 according to the second embodiment. Instead of the processing described with reference to FIG. 2, the processing of FIG. 10 is applied.
- variable conversion unit 24 in the second embodiment converts the likelihood score value Ob into the parameter ⁇ 2 using the following equation (7) instead of equation (2).
- ⁇ 2 1/log(1+exp( ⁇ Ob)) (7)
- ⁇ 2 plays the role of certainty. ⁇ 2 corresponds to variance and ⁇ to standard deviation.
- the Gaussian distribution is represented by the function of the following formula (8).
- the reason for converting the score value Ob into a positive value ( ⁇ 2 ) is the same as in the first embodiment. This is because if the parameter ⁇ 2 is a negative value, the Gaussian distribution does not hold as a probability distribution, so it is necessary to ensure that the parameter ⁇ 2 is a positive value ( ⁇ 2 >0).
- FIG. 11 shows an example of a graph of the number-of-seconds distribution estimated by the parameters ⁇ and ⁇ 2 estimated by the number-of-seconds distribution estimator 14 .
- FIG. 12 is an explanatory diagram showing an example of processing in the integration unit 16 and the maximum point identification unit 18 of the regression estimation device 10 according to the second embodiment. Here, an example of integrating two number-of-seconds distributions estimated by the number-of-seconds distribution estimating unit 14 is shown.
- a graph GD1g shown in the upper left of FIG. 12 is an example of the number of seconds distribution (probability distribution P1) represented by the parameters ⁇ 1 and ⁇ 2 1 estimated by the number of seconds distribution estimation unit 14 of FIG.
- the integration unit 16 takes the logarithm of the estimated number-of-seconds distribution, converts it into a logarithmic probability density, takes the sum of a plurality of logarithmic probability densities, and integrates them. This corresponds to finding the product of probabilities over the same number of seconds.
- a graph GL1g in FIG. 12 is an example of the logarithmic probability density logP1 obtained by taking the logarithm of the probability distribution P1.
- a graph GD2g shown in the lower left of FIG. 12 is an example of the number of seconds distribution (probability distribution P2 ) represented by the parameters ⁇ 2 and ⁇ 22 estimated by the number of seconds distribution estimation unit 14 .
- a graph GL2g in FIG. 12 is an example of the logarithmic probability density obtained by taking the logarithm of the probability distribution P2.
- the rightmost graph GLSg in FIG. 12 is an example of the joint logarithmic probability density that integrates the logarithmic probability density logP1 and the logarithmic probability density logP2.
- the maximum point identifying unit 18 identifies the value x that maximizes the logarithmic probability from the integrated joint logarithmic probability density.
- the processing in the maximum point identification unit 18 can be represented by the following equation (9).
- the target function of argmin shown on the right side of the equal sign in the second row of Equation (9) corresponds to the loss function during training in machine learning, which will be described later. Also, the right side of the equal sign described in the third row corresponds to the weighted average formula.
- the input value (maximum point) x that maximizes the logarithmic probability is selected as the final estimation result (final result).
- FIG. 13 is an explanatory diagram schematically showing an example of a machine learning method for generating a regression model applied to the number-of-seconds distribution estimator 14 in the second embodiment.
- Training data used for learning may be the same as in the first embodiment.
- FIG. 13 points different from FIG. 6 will be described.
- the learning model 20 When the image TIM read from the training data set is input to the learning model 20, the learning model 20 outputs the estimated value Oa of the number of seconds and the likelihood score Ob.
- the estimated value Oa and the likelihood score value Ob are variable-transformed into the parameters ⁇ and ⁇ 2 of the probability distribution model by the variable transformation unit 24 .
- the loss function L during training is defined by the following equation (10).
- the error backpropagation method is applied using the loss sum represented by Equation (11), and the learning model 20 is trained using the stochastic gradient descent method in the same way as in normal CNN learning.
- the learning model 20 is trained using multiple training data comprising multiple image series, the parameters of the learning model 20 are optimized to obtain a trained model.
- the learned model thus obtained is applied to the number-of-seconds distribution estimation unit 14 .
- slice images obtained by extracting slices at equal intervals from three-dimensional CT data were used as input, but the image to be processed is not limited to this.
- a MIP (Maximum Intensity Projection) image MIPimg configured at regular intervals or an average image AVEimg generated from a plurality of slice images may be used.
- Data used for input is not limited to a two-dimensional image, and may be a three-dimensional image (three-dimensional data). For example, 3D partial images at different positions within the same series may be used as input.
- the input to the number-of-seconds distribution estimation unit 14 may be a combination of multiple types of data elements. For example, as shown in FIG. 15, at least one of three-dimensional images (a set of multiple slice images), slice images, MIP images, and average images, which are partial images of the same series of CT data, is used as an input. A combination of these image types may be input to the seconds distribution estimating unit 14 to obtain an output of the estimated value of seconds and its likelihood. For example, the combination of the average image and the MIP image may be input to the seconds distribution estimation unit 14 to estimate the seconds distribution.
- MIP images and average images are examples of generated images generated from partial images of three-dimensional CT data.
- FIG. 16 is a block diagram showing a configuration example of a medical information system 200 including a medical image processing device 220. As shown in FIG. The regression estimation device 10 described as the first embodiment and the second embodiment is incorporated into a medical image processing device 220, for example.
- a medical information system 200 is a computer network built in a medical institution such as a hospital.
- the medical information system 200 includes a modality 230 that captures medical images, a DICOM server 240, a medical image processing device 220, an electronic chart system 244, and a viewer terminal 246. These elements are connected via a communication line 248. Connected. Communication line 248 may be a local communication line within a medical institution. Also, part of the communication line 248 may be a wide area communication line.
- the modality 230 include a CT device 231, an MRI (Magnetic Resonance Imaging) device 232, an ultrasonic diagnostic device 233, a PET (Positron Emission Tomography) device 234, an X-ray diagnostic device 235, an X-ray fluoroscopic diagnostic device 236, and an internal A scope device 237 and the like are included.
- the types of modalities 230 connected to the communication line 248 can be combined in various ways for each medical institution.
- the DICOM server 240 is a server that operates according to the DICOM specifications.
- the DICOM server 240 is a computer that stores and manages various data including images captured using the modality 230, and has a large-capacity external storage device and a database management program.
- the DICOM server 240 communicates with other devices via a communication line 248 to transmit and receive various data including image data.
- the DICOM server 240 receives image data generated by the modality 230 and other various data via a communication line 248, and stores and manages them in a recording medium such as a large-capacity external storage device.
- the storage format of image data and communication between devices via the communication line 248 are based on the DICOM protocol.
- the medical image processing apparatus 220 can acquire data from the DICOM server 240 or the like via the communication line 248.
- the medical image processing apparatus 220 performs image analysis and various other processes on medical images captured by the modality 230 .
- the medical image processing device 220 performs, for example, a process of recognizing a lesion area from an image, a process of identifying a classification such as a disease name, or a segmentation process of recognizing an area such as an organ. , various Computer Aided Diagnosis (Computer Aided Detection: CAD) and other analytical processes.
- the medical image processor 220 can also send processing results to the DICOM server 240 and viewer terminal 246 . Note that the processing functions of the medical image processing apparatus 220 may be installed in the DICOM server 240 or the viewer terminal 246 .
- Various data stored in the database of the DICOM server 240 and various information including the processing results generated by the medical image processing apparatus 220 can be displayed on the viewer terminal 246.
- the viewer terminal 246 is a terminal for viewing images called a PACS (Picture Archiving and Communication Systems) viewer or a DICOM viewer.
- a plurality of viewer terminals 246 can be connected to the communication line 248 .
- the form of the viewer terminal 246 is not particularly limited, and may be a personal computer, a workstation, a tablet terminal, or the like.
- a program that causes a computer to implement the processing functions of the regression estimation device 10 is recorded on a computer-readable medium that is a non-temporary information storage medium that is an optical disk, a magnetic disk, or a semiconductor memory or other tangible object, and the program is transmitted through this information storage medium. It is possible to provide
- part or all of the processing functions in the regression estimation device 10 may be realized by cloud computing, or may be provided as a SasS (Software as a Service) service.
- SasS Software as a Service
- processors include CPUs, which are general-purpose processors that run programs and function as various processing units, GPUs, which are processors specialized for image processing, and FPGAs (Field Programmable Gate Arrays).
- PLD Programmable Logic Device
- ASIC Application Specific Integrated Circuit
- a single processing unit may be composed of one of these various processors, or may be composed of two or more processors of the same type or different types.
- one processing unit may be configured by a plurality of FPGAs, a combination of CPU and FPGA, or a combination of CPU and GPU.
- a plurality of processing units may be configured by one processor.
- a single processor is configured by combining one or more CPUs and software. There is a form in which a processor functions as multiple processing units.
- SoC System On Chip
- the various processing units are configured using one or more of the above various processors as a hardware structure.
- the hardware structure of these various processors is, more specifically, an electrical circuit that combines circuit elements such as semiconductor elements.
- the first and second embodiments have the following advantages.
- the DICOM tag Since the number of seconds with a high degree of certainty can be estimated by image analysis of the input image, the DICOM tag does not record attached information related to the shooting time, or images in which incorrect time information is recorded. etc., it is possible to estimate the number of seconds with high confidence.
- ⁇ 4> As an input to the regression model, it may be difficult to input and process three-dimensional CT data at once due to size, but as described in the first and second embodiments, By sequentially processing two-dimensional images such as slice images, which are part of three-dimensional CT data, and integrating these estimation results, an appropriate estimated value can be obtained by looking at the entirety of the input data. can lead.
- the joint probability distribution takes the shape of a weighted median, and when one of the estimation results for some inputs deviates greatly due to artifacts, etc., it is less susceptible to the outliers and is even more robust.
- An image used for the final result (estimation of the final estimated value) can be extracted from the multiple images used for input.
- the technology of the present disclosure can be applied to various uses, and there are various aspects of the types of data used for input and target variables to be estimated.
- the technology of the present disclosure is applicable to, for example, the following regression estimation problem.
- Application Example 1 Problem of Regression Using Multiple Slice Images It is applicable to the task of recognizing the position of target organs from slice images (two-dimensional images) in three-dimensional directions as well.
- the technology of the present disclosure can be applied to regression estimation of the coordinates of a rectangular parallelepiped (three-dimensional bounding box) indicating the position of an organ from a plurality of slice images within the same series.
- the organ referred to here is an example of the "specific object” in the present disclosure
- the coordinates of the bounding box are an example of the "value indicating the position of the specific object” in the present disclosure.
- the technique of the present disclosure can be applied to the process of estimating the slice position (position within CT data) of an input slice image.
- the slice position here is an example of the “partial image position” in the present disclosure.
- Application example 2 Problem of performing regression on input of time-series images such as moving images or multiple images Specifically, for example, the technology of the present disclosure can be applied to processing for estimating the age of a person appearing in images such as moving images. . The technology of the present disclosure can also be applied to regression estimation processing when scene recognition is performed on images such as moving images.
- Application Example 3 Problem of Regression from Sound Data
- the technology of the present disclosure can be applied to regression estimation processing, for example, when performing emotion recognition from voice.
- Application Example 4 Problem of regressing one value from multiple resolutions Specifically, for example, the technology of the present disclosure can be applied to a process of regressively estimating the position of a bounding box for object detection from multiple images with different resolutions. .
Landscapes
- Engineering & Computer Science (AREA)
- Theoretical Computer Science (AREA)
- Software Systems (AREA)
- Data Mining & Analysis (AREA)
- Evolutionary Computation (AREA)
- Medical Informatics (AREA)
- Computer Vision & Pattern Recognition (AREA)
- Physics & Mathematics (AREA)
- Computing Systems (AREA)
- General Engineering & Computer Science (AREA)
- General Physics & Mathematics (AREA)
- Mathematical Physics (AREA)
- Artificial Intelligence (AREA)
- Image Analysis (AREA)
Abstract
Provided are a regression estimation device and method, a program, and a trained model generation method that are capable of improving the accuracy of estimation when deriving one estimation value by integrating estimation results obtained through a plurality of inputs. This regression estimation device comprises one or more processors and one or more storage devices storing programs to be executed by the one or more processors, the one or more processors executing the commands of the programs to: receive input of a plurality of sets of data; input the plurality of sets of data into a single regression model to estimate a plurality of combinations of estimation values and likelihoods of the estimation values from the plurality of sets of data; and integrate the plurality of combinations of estimation results on the basis of the plurality of combinations of estimation values and likelihoods of the estimation values estimated by the regression model.
Description
本開示は、回帰推定装置および方法、プログラム並びに学習済みモデルの生成方法に係り、特に、入力されたデータに基づいて目的変数の数値を推定する回帰推定を行う情報処理技術に関する。
The present disclosure relates to a regression estimation device and method, a program, and a method of generating a trained model, and more particularly to an information processing technology that performs regression estimation for estimating numerical values of objective variables based on input data.
深層学習などの機械学習のアルゴリズムを用いて回帰推定の処理を行う技術が知られている。機械学習の分野において、入力に対応した推定を行う処理の推定精度を高めるために、一つの入力に対し複数の学習モデルでの推定結果を統合し、推定性能を向上させるアンサンブルという方法が知られている。推定結果の統合には、「平均」が広く使われるが、学習モデルの性能によって重みを付けて平均をとると性能が向上することが知られている。
Techniques for performing regression estimation processing using machine learning algorithms such as deep learning are known. In the field of machine learning, in order to improve the estimation accuracy of the process that performs estimation corresponding to input, a method called ensemble is known that integrates the estimation results of multiple learning models for one input and improves estimation performance. ing. "Averaging" is widely used to integrate estimation results, and it is known that averaging weighted by the performance of a learning model improves performance.
一方で、平均の重みを固定するのではなく、入力によりダイナミックに重みを変化させる方法もある。非特許文献1は、分類問題について、複数の推論結果を統合する際に、確信度が境界値(0.5)付近の推論結果の重みを減らす構成を開示している。
On the other hand, instead of fixing the average weight, there is also a method of dynamically changing the weight according to the input. Non-Patent Literature 1 discloses a configuration for a classification problem in which, when integrating multiple inference results, the weight of inference results near the boundary value (0.5) is reduced.
また、推定結果を統合する際に重み付き平均ではなく、重み付きメジアンを使用する方法もある。非特許文献2は、複数の線形回帰モデルから得られる推論結果をモデルごとに重み付けされたメジアンで統合する構成を開示している。特許文献1には、複数の回帰モデルを用いて音楽音響信号から音楽印象値としてのValence(誘起)値とArousal(覚醒)値とを推定し、複数の回帰モデルにより得られる複数の推定結果を統合する方法が記載されている。
There is also a method of using the weighted median instead of the weighted average when integrating the estimation results. Non-Patent Document 2 discloses a configuration in which inference results obtained from a plurality of linear regression models are integrated with a median weighted for each model. In Patent Document 1, a plurality of regression models are used to estimate a valence (induction) value and an arousal (awakening) value as music impression values from a music sound signal, and a plurality of estimation results obtained by the plurality of regression models are used. Describes how to integrate.
また、別の手法として、一つの学習モデルに対し、異なる複数の入力を行い、複数の入力から得られる複数の推定結果を統合して、推定性能を向上させる方法が知られている。非特許文献3では、回帰問題を解く際に、一枚の画像を回転または反転させるなどして複数の画像を作成した後、それらを学習モデルに入力して得られる入力数分の推定値を平均することにより最終結果を得ている。
Another known method is to provide multiple different inputs to a single learning model, integrate multiple estimation results obtained from multiple inputs, and improve estimation performance. In Non-Patent Document 3, when solving a regression problem, after creating multiple images by rotating or flipping a single image, input them to a learning model and calculate the estimated values for the number of inputs obtained. The final result is obtained by averaging.
通常の深層回帰モデルは推定値に対する確信度は出力されないが、非特許文献4では、深層学習器の出力を正規分布の平均と標準偏差とすることで回帰の確信度を得ている。
A normal deep regression model does not output the confidence level for the estimated value, but in Non-Patent Document 4, the regression confidence level is obtained by using the mean and standard deviation of the normal distribution as the output of the deep learning machine.
複数の入力によって得られる複数の推定結果を統合する場合、平均を用いる方法では、複数の推定結果の中に大きく外れた値が含まれていた場合に、統合後の推定値(最終結果)の誤差が大きくなるという欠点がある。この点、非特許文献2では重み付きメジアンを使用するが、この方法は線形回帰を対象とし、入力によって重みを動的に変化させていない。
When integrating multiple estimation results obtained from multiple inputs, in the method using the average, if the multiple estimation results include values that deviate greatly, the estimated value after integration (final result) There is a drawback that the error becomes large. In this regard, Non-Patent Document 2 uses a weighted median, but this method is intended for linear regression and does not dynamically change the weight according to the input.
非特許文献3に記載の方法では、学習モデルから得られた複数の推定値から単純平均により最終結果を得る方法のため、推定に適さない入力の影響を重み付けにより減らすことができない。非特許文献4に記載の方法は、あくまで回帰の確信度を求めるものであり、推定結果を統合する仕組みではない。
In the method described in Non-Patent Document 3, the final result is obtained by simple averaging from multiple estimated values obtained from the learning model, so the influence of inputs unsuitable for estimation cannot be reduced by weighting. The method described in Non-Patent Document 4 only obtains the degree of certainty of regression, and is not a mechanism for integrating estimation results.
本開示はこのような事情に鑑みてなされたものであり、一つの(単一の)回帰モデルに対して異なる複数の入力を行うことにより得られる推定結果を統合して一つの推定値を導く場合の推定の精度を高めることができる回帰推定装置および方法、プログラム並びに学習済みモデルの生成方法を提供することを目的とする。
The present disclosure has been made in view of such circumstances, and integrates the estimation results obtained by performing multiple different inputs to one (single) regression model to derive one estimated value. It is an object of the present invention to provide a regression estimation device and method, a program, and a method of generating a trained model that can improve the accuracy of case estimation.
本開示の一態様に係る回帰推定装置は、1つ以上のプロセッサと、1つ以上のプロセッサによって実行されるプログラムが記憶される1つ以上の記憶装置と、を備え、1つ以上のプロセッサは、プログラムの命令を実行することにより、複数のデータの入力を受け付け、複数のデータを単一の回帰モデルに入力することにより、複数のデータから推定値と推定値の確からしさとを複数組推定し、回帰モデルにより推定された複数組の推定値と推定値の確からしさとを基に、複数組の推定結果を統合する。
A regression estimation device according to an aspect of the present disclosure includes one or more processors and one or more storage devices in which programs executed by the one or more processors are stored, wherein the one or more processors are , by executing a program instruction, accepts multiple data inputs, inputs multiple data into a single regression model, and estimates multiple pairs of estimated values and the likelihood of estimated values from multiple data Then, the multiple sets of estimation results are integrated based on the multiple sets of estimated values estimated by the regression model and the likelihood of the estimated values.
本態様の回帰推定装置によれば、単一の回帰モデルに対して複数のデータの入力が行われることにより、入力に応じた推定値とその確からしさとが複数組得られ、これら複数組の推定値とその確からしさとを基に推定結果が統合され、統合結果としての推定値が得られる。統合に際して、それぞれの推定値の確からしさが考慮されるため、本態様によって導き出される統合結果としての推定値(最終推定値)は、精度の高い推定値となり得る。
According to the regression estimation device of this aspect, a plurality of data are input to a single regression model to obtain a plurality of sets of estimated values and their probabilities according to the input, and these sets of The estimation results are integrated based on the estimated values and their likelihoods, and an estimated value is obtained as the integrated result. Since the probability of each estimated value is taken into consideration when integrating, the estimated value (final estimated value) as the integration result derived by this embodiment can be a highly accurate estimated value.
「単一の回帰モデル」とは、1種類の回帰モデルであることを意味しており、同一の回帰モデルとして動作する複数の処理モジュールを備えていてもよい。「推定」という用語は、推論および予測の概念を含む。「確からしさ」という用語は、確信度および信頼度の概念を含む。
"Single regression model" means one type of regression model, and may have multiple processing modules that operate as the same regression model. The term "estimation" includes the concepts of inference and prediction. The term "probability" encompasses the concepts of certainty and confidence.
本開示の他の態様に係る回帰推定装置において、1つ以上のプロセッサは、推定値と推定値の確からしさとに基づいて、推定値を確率変数とする確率分布を推定し、複数組のそれぞれの確率分布を統合して統合分布を生成し、統合分布に基づいて最終推定値を決定する構成とすることができる。
In the regression estimation device according to another aspect of the present disclosure, one or more processors estimate a probability distribution with the estimated value as a random variable, based on the estimated value and the probability of the estimated value, and each of the plurality of sets are integrated to generate an integrated distribution, and the final estimated value is determined based on the integrated distribution.
本開示の他の態様に係る回帰推定装置において、1つ以上のプロセッサは、推定値と推定値の確からしさとに基づいて、推定値を確率変数とする確率分布を推定し、複数組のそれぞれの確率分布を基に、同じ確率変数での確率の積が最大となる値を特定する構成とすることができる。
In the regression estimation device according to another aspect of the present disclosure, one or more processors estimate a probability distribution with the estimated value as a random variable, based on the estimated value and the probability of the estimated value, and each of the plurality of sets A value that maximizes the product of probabilities of the same random variable can be specified based on the probability distribution of .
複数のデータの入力から推定される複数の確率分布を基に、同時確率が最大になる値を求めることにより、入力に応じて推定された確からしさが考慮された精度の高い推定値を導き出すことができる。
Based on multiple probability distributions estimated from multiple data inputs, by finding the value that maximizes the joint probability, deriving a highly accurate estimated value that takes into account the probability estimated according to the input. can be done.
本開示の他の態様に係る回帰推定装置において、1つ以上のプロセッサは、回帰モデルから出力される推定値を確率分布モデルの第1のパラメータに変数変換し、回帰モデルから出力される確からしさを示す値を確率分布モデルの第2のパラメータに変数変換する構成とすることができる。
In the regression estimation device according to another aspect of the present disclosure, the one or more processors transform the estimated value output from the regression model into the first parameter of the probability distribution model, and the probability output from the regression model can be configured to variable-transform the value indicating to the second parameter of the probability distribution model.
本開示の他の態様に係る回帰推定装置において、確率分布モデルは、ラプラス分布であってもよい。
In the regression estimation device according to another aspect of the present disclosure, the probability distribution model may be Laplace distribution.
本開示の他の態様に係る回帰推定装置において、確率分布モデルは、ガウス分布であってもよい。
In the regression estimation device according to another aspect of the present disclosure, the probability distribution model may be Gaussian distribution.
本開示の他の態様に係る回帰推定装置において、1つ以上のプロセッサは、確率分布の対数を取る対数変換を行い、統合の際に、複数組のそれぞれの確率分布に対応した対数確率密度の和を計算し、同時対数確率密度が最大になる値を求める構成とすることができる。
In the regression estimation device according to another aspect of the present disclosure, the one or more processors perform logarithmic transformation that takes logarithms of the probability distributions, and when integrating, logarithmic probability densities corresponding to each of the plurality of sets of probability distributions. It can be configured to calculate the sum and find the value that maximizes the joint logarithmic probability density.
本開示の他の態様に係る回帰推定装置において、回帰モデルは、入力用のデータと教師信号とが対応付けされた訓練データを用いて機械学習を行うことにより生成された学習済みモデルを含む構成とすることができる。
In the regression estimation device according to another aspect of the present disclosure, the regression model includes a learned model generated by performing machine learning using training data in which input data and teacher signals are associated. can be
本開示の他の態様に係る回帰推定装置において、回帰モデルは、畳み込みニューラルネットワークを用いて構成されてもよい。
In the regression estimation device according to another aspect of the present disclosure, the regression model may be constructed using a convolutional neural network.
本開示の他の態様に係る回帰推定装置において、複数のデータは、医療画像であってもよい。
In the regression estimation device according to another aspect of the present disclosure, the plurality of data may be medical images.
本開示の他の態様に係る回帰推定装置において、複数のデータは、同一シリーズ内のスライス画像であってもよい。
In the regression estimation device according to another aspect of the present disclosure, the multiple data may be slice images within the same series.
本開示の他の態様に係る回帰推定装置において、複数のデータは、3次元画像に含まれる、異なる部分画像を含む構成であってもよい。
In the regression estimation device according to another aspect of the present disclosure, the plurality of data may be configured to include different partial images included in the 3D image.
本開示の他の態様に係る回帰推定装置において、複数のデータは、3次元画像に含まれる、異なる部分画像を基に生成される生成画像を含む構成であってもよい。
In the regression estimation device according to another aspect of the present disclosure, the plurality of data may include generated images generated based on different partial images included in the 3D image.
本開示の他の態様に係る回帰推定装置において、複数のデータは、時系列画像に含まれる、異なる部分画像を含む構成であってもよい。
In the regression estimation device according to another aspect of the present disclosure, the plurality of data may be configured to include different partial images included in the time-series images.
3次元画像あるいは時系列画像に含まれる部分画像、または部分画像から生成される生成画像を入力として用いることにより、精度劣化を抑えつつ、処理を高速化することができる。
By using a partial image included in a three-dimensional image or a time-series image, or a generated image generated from the partial image as an input, it is possible to speed up the processing while suppressing accuracy deterioration.
本開示の他の態様に係る回帰推定装置において、複数のデータは、異なる解像度の画像を含む構成であってもよい。
In the regression estimation device according to another aspect of the present disclosure, the plurality of data may include images with different resolutions.
本開示の他の態様に係る回帰推定装置において、推定値は、造影剤注入からの経過時間であってもよい。
In the regression estimation device according to another aspect of the present disclosure, the estimated value may be the elapsed time from contrast agent injection.
本開示の他の態様に係る回帰推定装置において、推定値は、特定の対象物の位置を示す値であってもよい。
In the regression estimation device according to another aspect of the present disclosure, the estimated value may be a value indicating the position of a specific target.
本開示の他の態様に係る回帰推定装置において、推定値は、3次元画像における部分画像の位置を示す値であってもよい。
In the regression estimation device according to another aspect of the present disclosure, the estimated value may be a value indicating the position of the partial image in the 3D image.
本開示の他の態様に係る回帰推定装置において、推定値は、入力されたデータである画像に写る人物の年齢であってもよい。
In the regression estimation device according to another aspect of the present disclosure, the estimated value may be the age of the person in the image that is the input data.
本開示の他の態様に係る回帰推定方法は、プロセッサが実行する回帰推定方法であって、複数のデータの入力を受け付けることと、複数のデータを単一の回帰モデルに入力することにより、複数のデータから推定値と推定値の確からしさとを複数組推定することと、回帰モデルにより推定された複数組の推定値と推定値の確からしさとを基に、複数組の推定結果を統合することと、を含む。
A regression estimation method according to another aspect of the present disclosure is a regression estimation method executed by a processor, which receives input of a plurality of data and inputs the plurality of data into a single regression model to obtain a plurality of Estimate multiple sets of estimated values and the likelihood of the estimated values from the data, and integrate the multiple sets of estimation results based on the multiple sets of estimated values and the likelihood of the estimated values estimated by the regression model including
本開示の他の態様に係るプログラムは、コンピュータに、複数のデータの入力を受け付ける機能と、複数のデータを単一の回帰モデルに入力することにより、複数のデータから推定値と推定値の確からしさとを複数組推定する機能と、回帰モデルにより推定された複数組の推定値と推定値の確からしさとを基に、複数組の推定結果を統合する機能とを実現させる。
A program according to another aspect of the present disclosure provides a computer with a function of receiving input of a plurality of data, and inputting the plurality of data into a single regression model, so that the estimated value and the accuracy of the estimated value are obtained from the plurality of data. A function of estimating a plurality of sets of likelihood and a function of integrating a plurality of sets of estimation results based on the plurality of sets of estimated values estimated by a regression model and the likelihood of the estimated values are realized.
本開示の他の態様に係る学習済みモデルの生成方法は、データの入力を受けて、データから推定値と推定値の確からしさとを出力する回帰モデルとして用いられる学習済みモデルの生成方法であって、入力用のデータと教師信号とが対応付けされた訓練データを用い、入力用のデータを学習モデルに入力し、学習モデルから推定値と推定値の確からしさを示す値との出力を得ることと、学習モデルから出力された推定値を確率分布モデルの第1のパラメータに変数変換することと、学習モデルから出力された確からしさを示す値を確率分布モデルの第2のパラメータに変数変換することと、第1のパラメータと第2のパラメータと教師信号とを用いてロス関数を計算することと、ロス関数の計算結果に基づいて、学習モデルのパラメータを更新することと、を含む。
A method of generating a trained model according to another aspect of the present disclosure is a method of generating a trained model used as a regression model that receives data input and outputs an estimated value and the likelihood of the estimated value from the data. Then, using the training data in which the input data and the teacher signal are associated, the input data is input to the learning model, and the output of the estimated value and the value indicating the likelihood of the estimated value is obtained from the learning model. , variable conversion of the estimated value output from the learning model to the first parameter of the probability distribution model, and variable conversion of the value indicating the likelihood output from the learning model to the second parameter of the probability distribution model. calculating a loss function using the first parameter, the second parameter, and the teacher signal; and updating the parameters of the learning model based on the calculation result of the loss function.
学習済みモデルの生成方法は、学習済みモデルを製造(生産)する方法の発明として理解される。
A method for generating a trained model is understood as an invention of a method for manufacturing (producing) a trained model.
本開示の他の態様に係る学習済みモデルの生成方法において、確率分布モデルはラプラス分布であり、第1のパラメータをμ、第2のパラメータをb、教師信号をtとする場合に、ロス関数として、次式
logb+|t-μ|/b
が用いられる構成とすることができる。 In the method of generating a trained model according to another aspect of the present disclosure, the probability distribution model is a Laplace distribution, the first parameter is μ, the second parameter is b, and the teacher signal is t. , the following formula logb+|t-μ|/b
can be used.
本開示の他の態様に係る学習済みモデルの生成方法において、確率分布モデルはガウス分布であり、第1のパラメータをμ、第2のパラメータをσ2、教師信号をtとする場合に、ロス関数として、次式
logσ2+(t-μ)2/2σ2
が用いられる構成とすることができる。 In the method of generating a trained model according to another aspect of the present disclosure, the probability distribution model is a Gaussian distribution, the first parameter is μ, the second parameter is σ 2 , and the teacher signal is t. As a function, logσ 2 +(t-μ) 2 /2σ 2
can be used.
本開示によれば、単一の回帰モデルに対する複数のデータの入力から精度の高い推定値を導き出すことができる。
According to the present disclosure, highly accurate estimates can be derived from multiple data inputs for a single regression model.
以下、添付図面に従って本発明の好ましい実施形態について説明する。
Preferred embodiments of the present invention will be described below with reference to the accompanying drawings.
《第1実施形態に係る回帰推定装置10の概要》
図1は、第1実施形態に係る回帰推定装置10による処理の概要を示す概念図である。ここでは、CT(Computed Tomography)装置を用いて撮影された患者の3次元CTデータから等間隔にサンプリングされた複数のスライス画像を入力として用い、入力された複数のスライス画像に基づき、造影剤注入からの秒数を推定する回帰推定装置10の例を説明する。以後、本明細書で「秒数」というときは、明示的な記載がない限り、造影剤注入からの経過時間を示す秒数の意味を含む。なお、スライス画像は、断層画像と言い換えてもよい。スライス画像は実質的に2次元画像(断面画像)として理解してよい。 <<Overview ofRegression Estimation Device 10 According to First Embodiment>>
FIG. 1 is a conceptual diagram showing an outline of processing by theregression estimation device 10 according to the first embodiment. Here, a plurality of slice images sampled at equal intervals from a patient's three-dimensional CT data taken using a CT (Computed Tomography) device are used as input, and a contrast agent is injected based on the input plurality of slice images. An example of a regression estimator 10 that estimates the number of seconds since . Henceforth, the term "seconds" in this specification includes the number of seconds indicating the elapsed time from the injection of the contrast medium, unless explicitly stated otherwise. Note that the slice image may also be called a tomographic image. A slice image may be understood as a substantially two-dimensional image (cross-sectional image).
図1は、第1実施形態に係る回帰推定装置10による処理の概要を示す概念図である。ここでは、CT(Computed Tomography)装置を用いて撮影された患者の3次元CTデータから等間隔にサンプリングされた複数のスライス画像を入力として用い、入力された複数のスライス画像に基づき、造影剤注入からの秒数を推定する回帰推定装置10の例を説明する。以後、本明細書で「秒数」というときは、明示的な記載がない限り、造影剤注入からの経過時間を示す秒数の意味を含む。なお、スライス画像は、断層画像と言い換えてもよい。スライス画像は実質的に2次元画像(断面画像)として理解してよい。 <<Overview of
FIG. 1 is a conceptual diagram showing an outline of processing by the
回帰推定装置10は、コンピュータのハードウェアとソフトウェアとを用いて実現できる。回帰推定装置10は、画像IMの入力を受け付けて、秒数の確率分布(以下、「秒数分布」という。)を推定する秒数分布推定部14と、複数の入力から推定した複数の秒数分布PDを統合する統合部16と、統合処理により得られた新たな分布(以下、「統合分布」という。)から確率が最大となる秒数を特定する最大点特定部18とを含む。最大点特定部18により特定された秒数(確率が最大となる秒数)が最終結果として出力される。
The regression estimation device 10 can be realized using computer hardware and software. The regression estimation device 10 includes a seconds distribution estimating unit 14 that receives an input of an image IM and estimates a probability distribution of seconds (hereinafter referred to as a "seconds distribution"), and a plurality of seconds estimated from a plurality of inputs. It includes an integration unit 16 that integrates the number distribution PD, and a maximum point identification unit 18 that identifies the number of seconds with the maximum probability from the new distribution obtained by the integration process (hereinafter referred to as "integrated distribution"). The number of seconds specified by the maximum point specifying unit 18 (the number of seconds with the maximum probability) is output as the final result.
なお、図1では、3枚の異なる画像IMが入力される場合の処理の流れを示すために、3つの秒数分布推定部14が図示されているが、各画像IMが入力される秒数分布推定部14は同じ(単一の)処理部である。
In FIG. 1, three seconds distribution estimating units 14 are shown in order to show the flow of processing when three different images IM are input. The distribution estimator 14 is the same (single) processor.
図2は、秒数分布推定部14における処理の例1を示す説明図である。秒数分布推定部14は、回帰推定部22と、変数変換部24とを含む。回帰推定部22は、画像IMの入力を受けて、秒数の推定値Oaと、推定値Oaの確からしさ(確信度)を示すスコア値Obとを出力するように、機械学習によって訓練された学習済みモデルを含む。回帰推定部22に適用される回帰モデルとしての学習済みモデルは、例えば、畳み込みニューラルネットワーク(Convolutional neural network:CNN)を用いて構成される。回帰推定部22から出力される秒数の推定値Oaの数値範囲は「-∞<Oa<∞」であってよく、確からしさのスコア値Obの数値範囲は「-∞<Ob<∞」であってよい。なお、回帰モデルは、CNNに限らず、各種の機械学習モデルを適用し得る。
FIG. 2 is an explanatory diagram showing Example 1 of processing in the number-of-seconds distribution estimation unit 14. FIG. The number-of-seconds distribution estimator 14 includes a regression estimator 22 and a variable converter 24 . The regression estimation unit 22 is trained by machine learning so as to receive an input of the image IM and output an estimated value Oa of the number of seconds and a score value Ob indicating the likelihood (certainty factor) of the estimated value Oa. Contains trained models. A trained model as a regression model applied to the regression estimation unit 22 is configured using, for example, a convolutional neural network (CNN). The numerical range of the estimated value Oa of the number of seconds output from the regression estimation unit 22 may be “−∞<Oa<∞”, and the numerical range of the likelihood score value Ob may be “−∞<Ob<∞”. It's okay. Note that the regression model is not limited to CNN, and various machine learning models can be applied.
変数変換部24は、秒数の推定値Oaと、その確からしさのスコア値Obとのそれぞれを次式(1)、(2)に従って変数変換し、確率分布モデルのパラメータμおよびbを生成する。
μ=Oa (1)
b=1/log(1+exp(-Ob)) (2) Thevariable conversion unit 24 converts the estimated value Oa of the number of seconds and the score value Ob of the likelihood thereof according to the following equations (1) and (2), respectively, to generate the parameters μ and b of the probability distribution model. .
μ = Oa (1)
b=1/log(1+exp(-Ob)) (2)
μ=Oa (1)
b=1/log(1+exp(-Ob)) (2) The
μ = Oa (1)
b=1/log(1+exp(-Ob)) (2)
式(2)の関数は、確からしさのスコア値Obを正の領域の値bへ変換する写像の一例である。図3は、式(2)の変数変換に用いられる関数y=1/log(1+exp(-x))のグラフである。パラメータμは本開示における「第1のパラメータ」の一例である。パラメータbは本開示における「第2のパラメータ」の一例である。
The function of formula (2) is an example of a mapping that converts the likelihood score value Ob to a value b in the positive region. FIG. 3 is a graph of the function y=1/log(1+exp(-x)) used for variable transformation in equation (2). Parameter μ is an example of a “first parameter” in the present disclosure. Parameter b is an example of a "second parameter" in the present disclosure.
第1実施形態では、秒数分布の確率分布モデルとしてラプラス分布が適用される。ラプラス分布は、次式(3)の関数で表される。
In the first embodiment, the Laplace distribution is applied as the probability distribution model of the number of seconds distribution. Laplacian distribution is represented by the function of the following equation (3).

確からしさのスコア値Obを正の値bに変換する理由は、秒数分布の確率分布モデルとしてラプラス分布を適用することに関係している。仮に、パラメータbが負の値(b<0)であると、ラプラス分布が確率分布として成り立たないため、パラメータbが正の値(b>0)であることを保証する必要があるからである。
The reason for converting the likelihood score value Ob to a positive value b is related to applying the Laplace distribution as a probability distribution model for the number of seconds distribution. This is because if the parameter b is a negative value (b<0), the Laplace distribution does not hold as a probability distribution, so it is necessary to ensure that the parameter b is a positive value (b>0). .
図4は、秒数分布推定部14によって推定されたパラメータμおよびbにより推定される秒数分布のグラフの例を示す。なお、図中の破線GTで示す位置は、正しい秒数(正解の秒数)に対応している。入力された画像IMから推定値Oaとその確からしさのスコア値Obとの組を推定することは、実質的に秒数分布を推定することに相当する。秒数の推定値Oaは本開示における「確率変数」の一例である。
FIG. 4 shows an example of a graph of the number-of-seconds distribution estimated by the parameters μ and b estimated by the number-of-seconds distribution estimation unit 14 . The position indicated by the dashed line GT in the drawing corresponds to the correct number of seconds (correct number of seconds). Estimating a set of the estimated value Oa and the probability score Ob from the input image IM substantially corresponds to estimating the number-of-seconds distribution. The estimated value Oa of the number of seconds is an example of a "random variable" in this disclosure.
図5は、統合部16と最大点特定部18における処理の例を示す説明図である。ここでは説明を簡単にするために、秒数分布推定部14によって推定された2つの秒数分布を統合する例を示すが、3つ以上の秒数分布を統合する場合も同様である。
FIG. 5 is an explanatory diagram showing an example of processing in the integrating section 16 and the maximum point specifying section 18. FIG. To simplify the explanation, an example of integrating two distributions of seconds estimated by the distribution of seconds estimating unit 14 is shown here, but the same applies to the case of integrating three or more distributions of seconds.
図5中の左上に示すグラフGD1は、画像IM1(図5中不図示)の入力に対して秒数分布推定部14によって推定されたパラメータμ1およびb1により表される秒数分布(確率分布P1)の例である。統合部16は、推定された秒数分布の対数を取り、対数確率密度に変換し、複数の対数確率密度の和をとって統合する。これは、同秒数での確率の積を求めることに対応している。
Graph GD1 shown in the upper left of FIG. 5 is a distribution of seconds (probability distribution P1 ) is an example. The integration unit 16 takes the logarithm of the estimated number-of-seconds distribution, converts it into a logarithmic probability density, takes the sum of a plurality of logarithmic probability densities, and integrates them. This corresponds to finding the product of probabilities over the same number of seconds.
図5中のグラフGL1は、確率分布P1の対数を取ることで得られる対数確率密度logP1の例である。図5中の左下に示すグラフGD2は、画像IM2(図5中不図示)の入力に対して秒数分布推定部14によって推定されたパラメータμ2およびb2により表される秒数分布(確率分布P2)の例である。図5中のグラフGL2は、確率分布P2の対数を取ることで得られる対数確率密度の例である。
Graph GL1 in FIG. 5 is an example of logarithmic probability density logP1 obtained by taking the logarithm of probability distribution P1. Graph GD2 shown in the lower left of FIG. 5 is a distribution of seconds (probability distribution P2 ) is an example. A graph GL2 in FIG. 5 is an example of the logarithmic probability density obtained by taking the logarithm of the probability distribution P2.
図5中の最右に示すグラフGLSは、対数確率密度logP1と対数確率密度logP2とを統合した同時対数確率密度の例である。グラフGLSに示す分布は本開示における「統合分布」の一例である。
The rightmost graph GLS in FIG. 5 is an example of the joint logarithmic probability density that integrates the logarithmic probability density logP1 and the logarithmic probability density logP2. The distribution shown in graph GLS is an example of "integrated distribution" in the present disclosure.
最大点特定部18は、統合した対数確率密度から対数確率が最大になるパラメータμの値xを特定する。最大点特定部18における処理は、次の式(4)で表すことができる。
The maximum point identifying unit 18 identifies the value x of the parameter μ that maximizes the logarithmic probability from the integrated logarithmic probability density. The processing in the maximum point identification unit 18 can be expressed by the following equation (4).

式(4)の2段目に記載された等号の右辺に示されたarg minの対象関数(Σ以降の部分)は、後述の機械学習における訓練時のロス関数に相当している。また、3段目に記載された等号の右辺は重み付きメジアンの式に相当している。統合の際の重みに相当するパラメータbiは、回帰推定部22の出力に応じて動的に変化する。
The target function of argmin shown on the right side of the equal sign in the second row of Equation (4) (the part after Σ) corresponds to the loss function during training in machine learning, which will be described later. Also, the right side of the equal sign described in the third row corresponds to the weighted median formula. The parameter bi corresponding to the weight for integration dynamically changes according to the output of the regression estimator 22 .
図5のグラフGLSに示す統合された対数確率密度の場合、同時対数確率が最大になる入力値(最大点)はμ1であり、μ1が最終的な推定結果(最終結果)として選択される。なお、μ1は、入力された複数のスライス画像のうちの画像IM1での推定結果である。図5では、秒数分布から対数確率密度に変換して演算を行っているが、要するに、異なる複数の入力から推定される複数の秒数分布(確率分布)の同時確率を考え、同時確率が最大になる値を最終結果として導き出す処理を行っている。
In the case of the integrated log probability density shown in the graph GLS in FIG. 5, the input value (maximum point) at which the joint log probability is maximized is μ1, and μ1 is selected as the final estimation result (final result). Note that μ1 is the estimation result for the image IM1 among the plurality of input slice images. In FIG. 5, the calculation is performed by converting the distribution of seconds into a logarithmic probability density. Processing is performed to derive the maximum value as the final result.
確率分布モデルとしてラプラス分布を採用することにより、統合分布(同時確率分布)が重み付きメジアンの形になるため、複数の推定結果の一部がアーチファクトなどによって大きく外れた値となった場合に、その外れ値の影響を抑制して精度の高い推定値を得ることができる。
By adopting the Laplace distribution as the probability distribution model, the integrated distribution (joint probability distribution) takes the form of a weighted median. A highly accurate estimated value can be obtained by suppressing the influence of the outlier.
《入力に用いられる医療画像の説明》
医療画像のフォーマットと通信プロトコルとを定義したDICOM(Digital Imaging and Communications in Medicine)の規格においては、検査種を特定するための識別符号(identification:ID)であるスタディ(Study)IDという単位の中に、シリーズIDが定義されている。 《Description of medical images used for input》
In the DICOM (Digital Imaging and Communications in Medicine) standard, which defines the format and communication protocol of medical images, a unit called a study ID, which is an identification code (ID) for specifying the type of examination, , the series ID is defined.
例えば、ある患者の肝臓造影撮影を行う場合、下記のように撮影タイミングを変えて、複数回(ここでは4回)、肝臓を含む範囲のCT撮影を行う。
[1回目の撮影]造影剤注入前
[2回目の撮影]造影剤注入後35秒経過時
[3回目の撮影]造影剤注入後70秒経過時
[4回目の撮影]造影剤注入後180秒経過時 For example, when performing liver contrast imaging of a certain patient, CT imaging of a range including the liver is performed a plurality of times (four times in this case) at different imaging timings as described below.
[1st shot] Before injection of contrast agent [2nd shot] 35 seconds after injection of contrast agent [3rd shot] 70 seconds after injection of contrast agent [4th shot] 180 seconds after injection of contrast agent Elapsed time
これら4回の撮影によって、4種のCTデータが得られる。ここでいう「CTデータ」は、連続する複数枚のスライス画像(断層画像)から構成される3次元データであり、3次元データを構成している複数枚のスライス画像の集合体(連続するスライス画像のまとまり)を「画像シリーズ(Series)」という。CTデータは本開示における「3次元画像」の一例である。
Four types of CT data are obtained from these four imagings. The “CT data” here is three-dimensional data composed of a plurality of continuous slice images (tomographic images), and is an aggregate of a plurality of slice images (continuous slices) that constitute the three-dimensional data. A set of images) is called an “image series”. CT data is an example of a "three-dimensional image" in this disclosure.
上記の4回の撮影を含む一連の撮影により得られた4種のCTデータには、それぞれ同じスタディIDと、それぞれ別々のシリーズIDとが付与される。
The same study ID and separate series IDs are assigned to the four types of CT data obtained by a series of imaging including the above four imagings.
例えば、ある特定の患者の肝臓造影撮影という検査についてのスタディIDとして「スタディ1」が付与され、造影剤注入前の撮影により得られたCTデータのシリーズIDとして「シリーズ1」、造影剤注入後35秒経過時の撮影により得られたCTデータには「シリーズ2」、造影剤注入後70秒経過時の撮影により得られたCTデータには「シリーズ3」、造影剤注入後180秒経過時の撮影により得られたCTデータには「シリーズ4」というように、シリーズごとに固有のIDが付与される。したがって、スタディIDとシリーズIDとの組み合わせにより、CTデータを識別することができる。その一方で、実際のCTデータにおいては、シリーズIDと、撮影タイミング(造影剤注入後経過時間)との対応関係が明確に把握されていない場合がある。
For example, "study 1" is given as a study ID for a specific patient's liver contrast imaging examination, "series 1" is given as the series ID of CT data obtained by imaging before contrast medium injection, and "series 1" is given as a series ID for CT data obtained by imaging before "Series 2" for CT data obtained by imaging 35 seconds after injection, "Series 3" for CT data obtained by imaging 70 seconds after injection of contrast agent, 180 seconds after injection of contrast injection A unique ID is assigned to each series, such as "series 4", to the CT data obtained by imaging. Therefore, CT data can be identified by a combination of study ID and series ID. On the other hand, in actual CT data, there are cases where the correspondence relationship between the series ID and the imaging timing (elapsed time after injection of the contrast medium) is not clearly understood.
また、3次元のCTデータはデータのサイズが大きいため、CTデータをそのまま入力データとして用いて、秒数推定などの処理を行うことは困難な場合がある。第1実施形態では、同じシリーズ内の複数のスライス画像を入力に用いて、画像解析により秒数の推定が行われる。「画像解析により」とは、画像データを構成する画素値に基づく処理により、という意味である。
Also, since the size of the three-dimensional CT data is large, it may be difficult to use the CT data as it is as input data and perform processing such as estimating the number of seconds. In a first embodiment, the number of seconds is estimated by image analysis using multiple slice images in the same series as input. "By image analysis" means by processing based on pixel values that constitute image data.
《機械学習方法の例1》
図6は、秒数分布推定部14に適用される回帰モデルを生成するための機械学習方法の例を概略的に説明図である。機械学習に用いる訓練データは、入力用のデータとしての画像TIMと、その入力に対応する正解のデータ(教師信号t)とを含む。画像TIMは、3次元CTデータの画像シリーズを構成するスライス画像であってよく、教師信号tはスライス画像が属するシリーズを撮影したときの造影剤注入からの秒数(グラウンドトゥルース)を示す値であってよい。 《Example 1 of machine learning method》
FIG. 6 is a schematic explanatory diagram of an example of a machine learning method for generating a regression model applied to the number-of-seconds distribution estimator 14. As shown in FIG. Training data used for machine learning includes an image TIM as input data and correct data (teacher signal t) corresponding to the input. The image TIM may be a slice image that constitutes an image series of three-dimensional CT data, and the teacher signal t is a value that indicates the number of seconds (ground truth) from the injection of the contrast agent when the series to which the slice image belongs is captured. It can be.
図6は、秒数分布推定部14に適用される回帰モデルを生成するための機械学習方法の例を概略的に説明図である。機械学習に用いる訓練データは、入力用のデータとしての画像TIMと、その入力に対応する正解のデータ(教師信号t)とを含む。画像TIMは、3次元CTデータの画像シリーズを構成するスライス画像であってよく、教師信号tはスライス画像が属するシリーズを撮影したときの造影剤注入からの秒数(グラウンドトゥルース)を示す値であってよい。 《Example 1 of machine learning method》
FIG. 6 is a schematic explanatory diagram of an example of a machine learning method for generating a regression model applied to the number-of-
例えば、画像シリーズの全てのスライスについて、それぞれ対応する教師信号tが紐付けされて複数の訓練データが生成される。「紐付け」は、対応付け、あるいは関連付けと言い換えてもよい。「訓練」は「学習」と同義である。同じ画像シリーズのスライスに対しては、同じ教師信号tが紐付けされてよい。つまり、画像シリーズの単位で教師信号tが紐付けされてもよい。複数の画像シリーズについて同様に、それぞれのスライスに、対応する教師信号tが紐付けされて、複数の訓練データが生成される。こうして生成された複数の訓練データの集合が訓練データセットとして用いられる。
For example, for all slices of the image series, a plurality of training data are generated by linking the corresponding teacher signal t. "Binding" may also be referred to as correspondence or association. "Training" is synonymous with "learning." The same teacher signal t may be associated with slices of the same image series. That is, the teacher signal t may be associated with each image series. Similarly for multiple image series, each slice is associated with a corresponding teacher signal t to generate multiple training data. A set of training data thus generated is used as a training data set.
学習モデル20は、CNNを用いて構成される。学習モデル20は、変数変換部24と組み合わせて使用される。なお、変数変換部24は学習モデル20に一体的に組み込まれていてもよい。
The learning model 20 is configured using CNN. The learning model 20 is used in combination with the variable conversion section 24 . Note that the variable conversion unit 24 may be integrally incorporated into the learning model 20 .
訓練データセットから読み出された画像TIMが学習モデル20に入力されると、学習モデル20から秒数の推定値Oaと、その確からしさのスコア値Obとが出力される。推定値Oaとスコア値Obとは変数変換部24により、確率分布モデルのパラメータμとパラメータbとに変数変換される。
When the image TIM read from the training data set is input to the learning model 20, the learning model 20 outputs the estimated value Oa of the number of seconds and the likelihood score Ob. The estimated value Oa and the score value Ob are variable-transformed into the parameter μ and the parameter b of the probability distribution model by the variable transformation unit 24 .
訓練時に使用するロス関数Lは次式(5)で定義される。
The loss function L used during training is defined by the following equation (5).

図6の下段に示すように、同じ画像シリーズの全てのスライスについて、ロス(損失)の和を取ると、次式(6)となる。
As shown in the lower part of FIG. 6, the sum of losses for all slices of the same image series yields the following equation (6).

添字のiは各スライスを識別するインデックスである。式(6)で表されるロスの和を用いて誤差逆伝播法を適用し、通常のCNNの学習と同様に、確率的勾配降下法を使って学習モデル20を訓練する(学習モデル20のパラメータを更新する)。式(6)によって計算されるロスの和は本開示における「ロス関数の計算結果」の一例である。複数の画像シリーズを含む複数の訓練データを用いて学習モデル20の訓練を行うことにより、学習モデル20のパラメータが適性化され、学習済みモデルが得られる。こうして得られた学習済みモデルが秒数分布推定部14の回帰モデルとして適用される。
The subscript i is an index that identifies each slice. Apply error backpropagation using the sum of losses represented by Equation (6), and train the learning model 20 using the stochastic gradient descent method in the same way as in normal CNN learning ( parameters). The loss sum calculated by Equation (6) is an example of the “loss function calculation result” in the present disclosure. By training the learning model 20 using multiple training data comprising multiple image series, the parameters of the learning model 20 are optimized to obtain a trained model. The learned model thus obtained is applied as a regression model of the number-of-seconds distribution estimation unit 14 .
図7は、訓練時に使用するロス関数の説明図である。ロス関数は負の対数尤度となっており、回帰推定に使う式を学習によって直接最適化するものとなっている。学習により教師信号tの秒数での対数尤度を最大化する。式(5)に示すロス関数のパラメータμについてのグラフは、図7中のグラフGRμとなる。グラフGRμはパラメータμに対する勾配が安定している。
FIG. 7 is an explanatory diagram of the loss function used during training. The loss function is a negative log-likelihood, which directly optimizes the formula used for regression estimation by learning. Learning maximizes the log-likelihood of the teacher signal t in seconds. A graph for the parameter μ of the loss function shown in Equation (5) is the graph GRμ in FIG. The graph GRμ has a stable slope with respect to the parameter μ.
一方で、式(5)に示すロス関数のパラメータbについてのグラフは、図7中のグラフGRbとなる。グラフGRbはパラメータbに対する勾配が不安定である。bの値が小さい領域では1/bが支配的であり、bの値が大きい領域ではlogbが支配的となる。
On the other hand, the graph for parameter b of the loss function shown in Equation (5) is graph GRb in FIG. Graph GRb has an unstable slope with respect to parameter b. In regions where the value of b is small, 1/b is dominant, and in regions where the value of b is large, logb is dominant.
勾配が不安定なグラフGRbは、パラメータbをb=1/softplus(-Ob)などの関数を用いて変数変換することにより、グラフGRObに変換される。ソフトプラス(softplus)関数は、softplus(x)=log(1+exp(x))で定義される。パラメータbの変数変換に用いる関数は、x→-∞において-1/xに漸近し、x→∞においてexp(x)に漸近する関数であり、このような関数を用いて勾配の不安定性を打ち消すことができる。
Graph GRb with an unstable gradient is transformed into graph GROb by variable transformation of parameter b using a function such as b=1/softplus(-Ob). A softplus function is defined as softplus(x)=log(1+exp(x)). The function used for variable transformation of the parameter b is a function that asymptotically approaches -1/x when x→-∞ and exp(x) when x→∞. can be canceled.
図6および図7を用いて説明した学習モデル20の機械学習方法は、本開示における「学習済みモデルの生成方法」の一例である。
The machine learning method of the learning model 20 described using FIGS. 6 and 7 is an example of the "learned model generating method" in the present disclosure.
《ハードウェア構成の例》
図8は、第1実施形態に係る回帰推定装置10のハードウェア構成の例を概略的に示すブロック図である。回帰推定装置10は、1台または複数台のコンピュータを用いて構成されるコンピュータシステムによって実現することができる。ここでは、1台のコンピュータがプログラムを実行することにより、回帰推定装置10の各種機能を実現する例を述べる。なお、回帰推定装置10として機能するコンピュータの形態は特に限定されず、サーバコンピュータであってもよいし、ワークステーションであってもよく、パーソナルコンピュータあるいはタブレット端末などであってもよい。 《Example of hardware configuration》
FIG. 8 is a block diagram schematically showing an example of the hardware configuration of theregression estimation device 10 according to the first embodiment. The regression estimation device 10 can be realized by a computer system configured using one or more computers. Here, an example in which one computer executes a program to realize various functions of the regression estimation device 10 will be described. The form of the computer that functions as the regression estimation device 10 is not particularly limited, and may be a server computer, a workstation, a personal computer, a tablet terminal, or the like.
図8は、第1実施形態に係る回帰推定装置10のハードウェア構成の例を概略的に示すブロック図である。回帰推定装置10は、1台または複数台のコンピュータを用いて構成されるコンピュータシステムによって実現することができる。ここでは、1台のコンピュータがプログラムを実行することにより、回帰推定装置10の各種機能を実現する例を述べる。なお、回帰推定装置10として機能するコンピュータの形態は特に限定されず、サーバコンピュータであってもよいし、ワークステーションであってもよく、パーソナルコンピュータあるいはタブレット端末などであってもよい。 《Example of hardware configuration》
FIG. 8 is a block diagram schematically showing an example of the hardware configuration of the
回帰推定装置10は、プロセッサ102と、非一時的な有体物であるコンピュータ可読媒体104と、通信インターフェース106と、入出力インターフェース108とバス110とを含む。
The regression estimator 10 includes a processor 102 , a non-transitory tangible computer-readable medium 104 , a communication interface 106 , an input/output interface 108 and a bus 110 .
プロセッサ102は、CPU(Central Processing Unit)を含む。プロセッサ102はGPU(Graphics Processing Unit)を含んでもよい。プロセッサ102は、バス110を介してコンピュータ可読媒体104、通信インターフェース106および入出力インターフェース108と接続される。プロセッサ102は、コンピュータ可読媒体104に記憶された各種のプログラムおよびデータ等を読み出し、各種の処理を実行する。
The processor 102 includes a CPU (Central Processing Unit). Processor 102 may include a GPU (Graphics Processing Unit). Processor 102 is coupled to computer-readable media 104 , communication interface 106 , and input/output interface 108 via bus 110 . The processor 102 reads various programs and data stored in the computer-readable medium 104 and executes various processes.
コンピュータ可読媒体104は、例えば、主記憶装置であるメモリ104Aおよび補助記憶装置であるストレージ104Bを含む。ストレージ104Bは、例えば、ハードディスク(Hard Disk Drive:HDD)装置、ソリッドステートドライブ(Solid State Drive:SSD)装置、光ディスク、光磁気ディスク、もしくは半導体メモリ、またはこれらの適宜の組み合わせを用いて構成される。ストレージ104Bには、各種プログラムやデータ等が記憶される。コンピュータ可読媒体104は本開示における「記憶装置」の一例である。
The computer-readable medium 104 includes, for example, a memory 104A that is a main storage device and a storage 104B that is an auxiliary storage device. The storage 104B is configured using, for example, a hard disk drive (HDD) device, a solid state drive (SSD) device, an optical disk, a magneto-optical disk, or a semiconductor memory, or an appropriate combination thereof. . Various programs, data, and the like are stored in the storage 104B. Computer-readable medium 104 is an example of a "storage device" in this disclosure.
メモリ104Aは、プロセッサ102の作業領域として使用され、ストレージ104Bから読み出されたプログラムおよび各種のデータを一時的に記憶する記憶部として用いられる。ストレージ104Bに記憶されているプログラムがメモリ104Aにロードされ、プログラムの命令をプロセッサ102が実行することにより、プロセッサ102は、プログラムで規定される各種の処理を行う手段として機能する。メモリ104Aには、プロセッサ102によって実行される回帰推定プログラム130および各種のデータ等が記憶される。回帰推定プログラム130は、機械学習によって訓練された学習済みモデルを含み、図1で説明した処理をプロセッサ102に実行させる。
The memory 104A is used as a work area for the processor 102, and is used as a storage unit that temporarily stores programs and various data read from the storage 104B. A program stored in the storage 104B is loaded into the memory 104A, and the processor 102 executes the instructions of the program, whereby the processor 102 functions as means for performing various processes defined by the program. The memory 104A stores a regression estimation program 130 executed by the processor 102, various data, and the like. The regression estimation program 130 includes a trained model trained by machine learning, and causes the processor 102 to execute the processing described with reference to FIG.
通信インターフェース106は、有線または無線により外部装置との通信処理を行い、外部装置との間で情報のやり取りを行う。回帰推定装置10は通信インターフェース106を介して図示せぬ通信回線に接続される。通信回線は、ローカルエリアネットワークであってもよいし、ワイドエリアネットワークであってもよい。通信インターフェース106は、画像等のデータの入力を受け付けるデータ取得部の役割を担うことができる。
The communication interface 106 performs wired or wireless communication processing with an external device, and exchanges information with the external device. The regression estimation device 10 is connected to a communication line (not shown) via a communication interface 106 . The communication line may be a local area network or a wide area network. The communication interface 106 can serve as a data acquisition unit that receives input of data such as images.
回帰推定装置10は、さらに、入力装置114および表示装置116を含んでもよい。入力装置114および表示装置116は入出力インターフェース108を介してバス110に接続される。入力装置114は、例えば、キーボード、マウス、マルチタッチパネル、もしくはその他のポインティングデバイス、もしくは、音声入力装置、またはこれらの適宜の組み合わせであってよい。
The regression estimator 10 may further include an input device 114 and a display device 116 . Input device 114 and display device 116 are connected to bus 110 via input/output interface 108 . The input device 114 may be, for example, a keyboard, mouse, multi-touch panel, or other pointing device, voice input device, or any suitable combination thereof.
表示装置116は、各種の情報が表示される出力インターフェースである。表示装置116は、例えば、液晶ディスプレイ、有機EL(organic electro-luminescence:OEL)ディスプレイ、もしくは、プロジェクタ、またはこれらの適宜の組み合わせであってよい。
The display device 116 is an output interface that displays various information. The display device 116 may be, for example, a liquid crystal display, an organic electro-luminescence (OEL) display, a projector, or an appropriate combination thereof.
《回帰推定装置10の機能的構成》
図9は、第1実施形態に係る回帰推定装置10の処理機能の概要を示す機能ブロック図である。回帰推定装置10のプロセッサ102は、メモリ104Aに記憶された回帰推定プログラム130を実行することにより、データ取得部12、秒数分布推定部14、統合部16、最大点特定部18および出力部19として機能する。 <<Functional Configuration ofRegression Estimation Device 10>>
FIG. 9 is a functional block diagram showing an outline of processing functions of theregression estimation device 10 according to the first embodiment. The processor 102 of the regression estimation device 10 executes the regression estimation program 130 stored in the memory 104A to obtain the data acquisition unit 12, the number-of-seconds distribution estimation unit 14, the integration unit 16, the maximum point identification unit 18, and the output unit 19. function as
図9は、第1実施形態に係る回帰推定装置10の処理機能の概要を示す機能ブロック図である。回帰推定装置10のプロセッサ102は、メモリ104Aに記憶された回帰推定プログラム130を実行することにより、データ取得部12、秒数分布推定部14、統合部16、最大点特定部18および出力部19として機能する。 <<Functional Configuration of
FIG. 9 is a functional block diagram showing an outline of processing functions of the
データ取得部12は、処理対象のデータの入力を受け付ける。図9の例では、データ取得部12は、CTデータからサンプリングされたスライス画像である画像IMiを取得する。添字iは、複数の画像を識別するインデックス番号を表しており、図9では、i=1からnまでの異なるn枚の画像が入力され得ることを表している。nは2以上の整数であってよい。データ取得部12は、CTデータから等間隔にスライス画像を切り出す処理を実行してもよいし、不図示の処理部などによって予めサンプリングされたスライス画像を取得してもよい。
The data acquisition unit 12 accepts input of data to be processed. In the example of FIG. 9, the data acquisition unit 12 acquires an image IMi, which is a slice image sampled from CT data. The subscript i represents an index number that identifies a plurality of images, and in FIG. 9, it represents that n different images from i=1 to n can be input. n may be an integer of 2 or greater. The data acquisition unit 12 may perform processing for cutting out slice images from CT data at regular intervals, or may acquire slice images sampled in advance by a processing unit (not shown) or the like.
データ取得部12を介して取り込まれた画像IMiは、秒数分布推定部14の回帰推定部22に入力される。回帰推定部22は、入力された画像IMiのそれぞれから秒数の推定値Oaとその確からしさを示すスコア値Obとの組を出力する。
The image IMi captured via the data acquisition unit 12 is input to the regression estimation unit 22 of the seconds distribution estimation unit 14 . The regression estimator 22 outputs a set of an estimated value Oa of the number of seconds and a score value Ob indicating the likelihood of the estimated value Oa from each of the input images IMi.
回帰推定部22から出力された推定値Oaは、変数変換部24において確率分布モデルのパラメータμiに変換され、回帰推定部22から出力された確からしさのスコア値Obは、変数変換部24において確率分布モデルのパラメータbiに変換される。これら2つのパラメータμi、biにより、秒数の確率分布Piが推定される。
The estimated value Oa output from the regression estimating unit 22 is converted into the parameter μi of the probability distribution model in the variable transforming unit 24, and the likelihood score Ob output from the regression estimating unit 22 is converted to probability in the variable transforming unit 24. It is converted into parameters bi of the distribution model. These two parameters μi, bi estimate the probability distribution Pi of the seconds.
同じシリーズ内の複数の画像IMi(i=1~n)を入力することにより、画像IMiごとに推定値Oaとスコア値Obとの組が推定され、パラメータμi、biの組に変換されて、秒数の確率分布Piが推定される。各画像IMiから推定される複数組の推定値Oaとスコア値Obとは本開示における「複数組の推定結果」の一例である。
By inputting a plurality of images IMi (i = 1 to n) in the same series, a set of an estimated value Oa and a score value Ob is estimated for each image IMi, converted into a set of parameters μi and bi, A probability distribution Pi of seconds is estimated. Multiple sets of estimated values Oa and score values Ob estimated from each image IMi are an example of "multiple sets of estimation results" in the present disclosure.
統合部16は、複数の画像IMiの入力により得られた複数の確率分布Piを統合する処理を行う。図9では、対数変換部26において、確率分布Piの対数を取り、対数確率密度logPiに変換し、統合分布生成部28にて、対数確率密度logPiの総和を計算することにより、統合分布を得る。
The integration unit 16 performs processing to integrate multiple probability distributions Pi obtained by inputting multiple images IMi. In FIG. 9, the logarithm of the probability distribution Pi is taken in the logarithmic conversion unit 26 and converted into the logarithmic probability density logPi, and the integrated distribution is obtained by calculating the sum of the logarithmic probability densities logPi in the integrated distribution generation unit 28 .
最大点特定部18は、統合分布から確率が最大となる秒数の値(最大点)を特定し、特定した秒数の値を最終推定値として出力する。なお、最大点特定部18は統合部16の中に組み込まれた構成であってもよい。
The maximum point specifying unit 18 specifies the value of the number of seconds (maximum point) with the maximum probability from the integrated distribution, and outputs the value of the specified number of seconds as the final estimated value. Note that the maximum point identification unit 18 may be configured to be incorporated in the integration unit 16 .
出力部19は、最大点特定部18により特定された最終推定値を表示させたり、他の処理部に提供したりするための出力インターフェースである。出力部19は表示用のデータを生成する処理および/または外部へのデータ送信等のためのデータ変換処理などの処理部を含んでもよい。回帰推定装置10によって推定された秒数は、不図示の表示装置などに表示させてもよい。
The output unit 19 is an output interface for displaying the final estimated value specified by the maximum point specifying unit 18 and providing it to other processing units. The output unit 19 may include a processing unit such as processing for generating data for display and/or data conversion processing for transmitting data to the outside. The number of seconds estimated by the regression estimation device 10 may be displayed on a display device (not shown) or the like.
また、回帰推定装置10によって推定された秒数から造影状態を推定し、秒数に代えて、または秒数と共に造影状態の分類の推定結果を表示装置などに表示させてもよい。例えば、肝臓を撮影したCT画像の場合、造影状態の分類には、非造影(造影剤注入前)、動脈相、門脈相および平衡相の4つのフェーズ(カテゴリー)がある。回帰推定装置10から出力される秒数と、造影状態の分類との対応関係を定義したテーブルなどを用いて、秒数から造影状態を推定する構成も可能である。
Alternatively, the contrast-enhanced state may be estimated from the number of seconds estimated by the regression estimation device 10, and the estimated result of the contrast-enhanced state classification may be displayed on a display device or the like instead of or together with the number of seconds. For example, in the case of a CT image of the liver, there are four phases (categories) of non-contrast (before contrast medium injection), arterial phase, portal vein phase, and equilibrium phase. It is also possible to estimate the contrast-enhanced state from the number of seconds using a table or the like that defines the correspondence relationship between the number of seconds output from the regression estimation device 10 and the classification of the contrast-enhanced state.
回帰推定装置10は、例えば、病院などの医療機関において取得される医療画像を処理するための医療画像処理装置に組み込まれてもよい。また、回帰推定装置10の処理機能は、クラウドサービスとして提供されてもよい。プロセッサ102が実行する回帰推定の処理の方法は本開示における「回帰推定方法」の一例である。
For example, the regression estimation device 10 may be incorporated in a medical image processing device for processing medical images acquired in medical institutions such as hospitals. Also, the processing functions of the regression estimation device 10 may be provided as a cloud service. The method of regression estimation processing executed by the processor 102 is an example of the “regression estimation method” in the present disclosure.
《第2実施形態》
第1実施形態では秒数分布の確率分布モデルとしてラプラス分布を用いたが、これに限らず、他の確率分布モデルを適用してもよい。第2実施形態では、ラプラス分布の代わりに、ガウス分布を用いる例を説明する。 <<Second embodiment>>
Although the Laplace distribution is used as the probability distribution model of the number of seconds distribution in the first embodiment, other probability distribution models may be applied. In the second embodiment, an example using Gaussian distribution instead of Laplacian distribution will be described.
第2実施形態に係る回帰推定装置10のハードウェア構成は第1実施形態と同様であってよい。第2実施形態について、第1実施形態と異なる点を説明する。第2実施形態では、秒数分布推定部14と統合部16と最大点特定部18とのそれぞれの処理部における処理内容が第1実施形態と異なる。
The hardware configuration of the regression estimation device 10 according to the second embodiment may be the same as that of the first embodiment. Regarding the second embodiment, points different from the first embodiment will be described. In the second embodiment, the processing contents of each of the second number distribution estimation unit 14, the integration unit 16, and the maximum point identification unit 18 are different from those in the first embodiment.
図10は、第2実施形態に係る回帰推定装置10の秒数分布推定部14における処理の例2を示す説明図である。図2で説明した処理の代わりに、図10の処理が適用される。
FIG. 10 is an explanatory diagram showing Example 2 of processing in the number-of-seconds distribution estimation unit 14 of the regression estimation device 10 according to the second embodiment. Instead of the processing described with reference to FIG. 2, the processing of FIG. 10 is applied.
第2実施形態における変数変換部24は、確からしさのスコア値Obを、式(2)の代わりに、次式(7)を用いてパラメータσ2に変換する。
σ2=1/log(1+exp(-Ob)) (7) Thevariable conversion unit 24 in the second embodiment converts the likelihood score value Ob into the parameter σ2 using the following equation (7) instead of equation (2).
σ 2 =1/log(1+exp(−Ob)) (7)
σ2=1/log(1+exp(-Ob)) (7) The
σ 2 =1/log(1+exp(−Ob)) (7)
σ2は確からしさの役割を果たす。σ2は分散、σは標準偏差に相当する。
σ 2 plays the role of certainty. σ2 corresponds to variance and σ to standard deviation.
ガウス分布は、次式(8)の関数で表される。
The Gaussian distribution is represented by the function of the following formula (8).

スコア値Obを正の値(σ2)に変換する理由は、第1実施形態と同様である。パラメータσ2が負の値であると、ガウス分布が確率分布として成り立たないため、パラメータσ2が正の値(σ2>0)であることを保証する必要があるからである。
The reason for converting the score value Ob into a positive value (σ 2 ) is the same as in the first embodiment. This is because if the parameter σ 2 is a negative value, the Gaussian distribution does not hold as a probability distribution, so it is necessary to ensure that the parameter σ 2 is a positive value (σ 2 >0).
図11は、秒数分布推定部14によって推定されたパラメータμおよびσ2により推定される秒数分布のグラフの例を示す。
FIG. 11 shows an example of a graph of the number-of-seconds distribution estimated by the parameters μ and σ2 estimated by the number-of-seconds distribution estimator 14 .
図12は、第2実施形態に係る回帰推定装置10の統合部16と最大点特定部18とにおける処理の例を示す説明図である。ここでは、秒数分布推定部14によって推定された2つの秒数分布を統合する例を示す。
FIG. 12 is an explanatory diagram showing an example of processing in the integration unit 16 and the maximum point identification unit 18 of the regression estimation device 10 according to the second embodiment. Here, an example of integrating two number-of-seconds distributions estimated by the number-of-seconds distribution estimating unit 14 is shown.
図12中の左上に示すグラフGD1gは、図10の秒数分布推定部14によって推定されたパラメータμ1およびσ2
1により表される秒数分布(確率分布P1)の例である。統合部16は、推定された秒数分布の対数を取り、対数確率密度に変換し、複数の対数確率密度の和をとって統合する。これは、同秒数での確率の積を求めることに対応している。
A graph GD1g shown in the upper left of FIG. 12 is an example of the number of seconds distribution (probability distribution P1) represented by the parameters μ1 and σ 2 1 estimated by the number of seconds distribution estimation unit 14 of FIG. The integration unit 16 takes the logarithm of the estimated number-of-seconds distribution, converts it into a logarithmic probability density, takes the sum of a plurality of logarithmic probability densities, and integrates them. This corresponds to finding the product of probabilities over the same number of seconds.
図12中のグラフGL1gは、確率分布P1の対数を取ることで得られる対数確率密度logP1の例である。図12中の左下に示すグラフGD2gは、秒数分布推定部14によって推定されたパラメータμ2およびσ2
2により表される秒数分布(確率分布P2)の例である。図12中のグラフGL2gは、確率分布P2の対数を取ることで得られる対数確率密度の例である。
A graph GL1g in FIG. 12 is an example of the logarithmic probability density logP1 obtained by taking the logarithm of the probability distribution P1. A graph GD2g shown in the lower left of FIG. 12 is an example of the number of seconds distribution (probability distribution P2 ) represented by the parameters μ2 and σ 22 estimated by the number of seconds distribution estimation unit 14 . A graph GL2g in FIG. 12 is an example of the logarithmic probability density obtained by taking the logarithm of the probability distribution P2.
図12中の最右に示すグラフGLSgは、対数確率密度logP1と対数確率密度logP2とを統合した同時対数確率密度の例である。
The rightmost graph GLSg in FIG. 12 is an example of the joint logarithmic probability density that integrates the logarithmic probability density logP1 and the logarithmic probability density logP2.
最大点特定部18は、統合した同時対数確率密度から対数確率が最大になる値xを特定する。最大点特定部18における処理は、次式(9)で表すことができる。
The maximum point identifying unit 18 identifies the value x that maximizes the logarithmic probability from the integrated joint logarithmic probability density. The processing in the maximum point identification unit 18 can be represented by the following equation (9).

式(9)の2段目に記載された等号の右辺に示されたarg minの対象関数(Σ以降の部分)は、後述の機械学習における訓練時のロス関数に相当している。また、3段目に記載された等号の右辺は重み付き平均の式に相当している。
The target function of argmin shown on the right side of the equal sign in the second row of Equation (9) (the part after Σ) corresponds to the loss function during training in machine learning, which will be described later. Also, the right side of the equal sign described in the third row corresponds to the weighted average formula.
図12のグラフGLSgに示す統合された対数確率密度の場合、対数確率が最大になる入力値(最大点)xが最終的な推定結果(最終結果)として選択される。
In the case of the integrated logarithmic probability density shown in the graph GLSg of FIG. 12, the input value (maximum point) x that maximizes the logarithmic probability is selected as the final estimation result (final result).
《機械学習方法の例2》
図13は、第2実施形態における秒数分布推定部14に適用される回帰モデルを生成するための機械学習方法の例を概略的に示す説明図である。学習に用いる訓練データは、第1実施形態と同様であってよい。図13について、図6と異なる点を説明する。 《Example 2 of machine learning method》
FIG. 13 is an explanatory diagram schematically showing an example of a machine learning method for generating a regression model applied to the number-of-seconds distribution estimator 14 in the second embodiment. Training data used for learning may be the same as in the first embodiment. Regarding FIG. 13, points different from FIG. 6 will be described.
図13は、第2実施形態における秒数分布推定部14に適用される回帰モデルを生成するための機械学習方法の例を概略的に示す説明図である。学習に用いる訓練データは、第1実施形態と同様であってよい。図13について、図6と異なる点を説明する。 《Example 2 of machine learning method》
FIG. 13 is an explanatory diagram schematically showing an example of a machine learning method for generating a regression model applied to the number-of-
訓練データセットから読み出された画像TIMが学習モデル20に入力されると、学習モデル20から秒数の推定値Oaと、その確からしさのスコア値Obとが出力される。推定値Oaと確からしさのスコア値Obとは変数変換部24により、確率分布モデルのパラメータμとσ2とに変数変換される。
When the image TIM read from the training data set is input to the learning model 20, the learning model 20 outputs the estimated value Oa of the number of seconds and the likelihood score Ob. The estimated value Oa and the likelihood score value Ob are variable-transformed into the parameters μ and σ2 of the probability distribution model by the variable transformation unit 24 .
訓練時のロス関数Lは次式(10)で定義される。
The loss function L during training is defined by the following equation (10).

図13の下段に示すように、同じ画像シリーズの全てのスライスについて、ロス(損失)の和を取ると、次式(11)となる。
As shown in the lower part of FIG. 13, the sum of losses for all slices of the same image series yields the following equation (11).

式(11)で表されるロスの和を用いて誤差逆伝播法を適用し、通常のCNNの学習と同様に、確率的勾配降下法を使って、学習モデル20を訓練する。複数の画像シリーズを含む複数の訓練データを用いて学習モデル20の訓練を行うことにより、学習モデル20のパラメータが適性化され、学習済みモデルが得られる。こうして得られた学習済みモデルが秒数分布推定部14に適用される。
The error backpropagation method is applied using the loss sum represented by Equation (11), and the learning model 20 is trained using the stochastic gradient descent method in the same way as in normal CNN learning. By training the learning model 20 using multiple training data comprising multiple image series, the parameters of the learning model 20 are optimized to obtain a trained model. The learned model thus obtained is applied to the number-of-seconds distribution estimation unit 14 .
《変形例1》
第1実施形態および第2実施形態では、3次元のCTデータからスライスを等間隔に切り出したスライス画像(断層画像)を入力に用いたが、処理の対象とする画像はこれに限らず、例えば、図14に示すように、断層画像TGimgの代わりに、等間隔に構成されたMIP(Maximum Intensity Projection)画像MIPimgあるいは複数のスライス画像から生成される平均画像AVEimgなどであってもよい。また、入力に用いるデータは2次元画像に限らず、3次元画像(3次元データ)であってもよい。例えば、同一シリーズ内の異なる位置の3次元部分画像を入力として用いてもよい。 <<Modification 1>>
In the first and second embodiments, slice images (tomographic images) obtained by extracting slices at equal intervals from three-dimensional CT data were used as input, but the image to be processed is not limited to this. , instead of the tomographic image TGimg, a MIP (Maximum Intensity Projection) image MIPimg configured at regular intervals or an average image AVEimg generated from a plurality of slice images may be used. Data used for input is not limited to a two-dimensional image, and may be a three-dimensional image (three-dimensional data). For example, 3D partial images at different positions within the same series may be used as input.
第1実施形態および第2実施形態では、3次元のCTデータからスライスを等間隔に切り出したスライス画像(断層画像)を入力に用いたが、処理の対象とする画像はこれに限らず、例えば、図14に示すように、断層画像TGimgの代わりに、等間隔に構成されたMIP(Maximum Intensity Projection)画像MIPimgあるいは複数のスライス画像から生成される平均画像AVEimgなどであってもよい。また、入力に用いるデータは2次元画像に限らず、3次元画像(3次元データ)であってもよい。例えば、同一シリーズ内の異なる位置の3次元部分画像を入力として用いてもよい。 <<
In the first and second embodiments, slice images (tomographic images) obtained by extracting slices at equal intervals from three-dimensional CT data were used as input, but the image to be processed is not limited to this. , instead of the tomographic image TGimg, a MIP (Maximum Intensity Projection) image MIPimg configured at regular intervals or an average image AVEimg generated from a plurality of slice images may be used. Data used for input is not limited to a two-dimensional image, and may be a three-dimensional image (three-dimensional data). For example, 3D partial images at different positions within the same series may be used as input.
《変形例2》
秒数分布推定部14への入力は、複数種のデータ要素の組み合わせであってもよい。例えば、図15に示すように、同一シリーズのCTデータの部分画像である3次元画像(複数枚のスライス画像のセット)、スライス画像、MIP画像および平均画像のうち少なくとも1種類以上を入力として用いることができ、これら複数の画像種の組み合わせを秒数分布推定部14に入力して、秒数の推定値とその確からしさとの出力を得てもよい。例えば、平均画像とMIP画像との組み合わせを秒数分布推定部14に入力して秒数分布を推定してもよい。MIP画像および平均画像は、3次元のCTデータの部分画像から生成される生成画像の一例である。 <<Modification 2>>
The input to the number-of-secondsdistribution estimation unit 14 may be a combination of multiple types of data elements. For example, as shown in FIG. 15, at least one of three-dimensional images (a set of multiple slice images), slice images, MIP images, and average images, which are partial images of the same series of CT data, is used as an input. A combination of these image types may be input to the seconds distribution estimating unit 14 to obtain an output of the estimated value of seconds and its likelihood. For example, the combination of the average image and the MIP image may be input to the seconds distribution estimation unit 14 to estimate the seconds distribution. MIP images and average images are examples of generated images generated from partial images of three-dimensional CT data.
秒数分布推定部14への入力は、複数種のデータ要素の組み合わせであってもよい。例えば、図15に示すように、同一シリーズのCTデータの部分画像である3次元画像(複数枚のスライス画像のセット)、スライス画像、MIP画像および平均画像のうち少なくとも1種類以上を入力として用いることができ、これら複数の画像種の組み合わせを秒数分布推定部14に入力して、秒数の推定値とその確からしさとの出力を得てもよい。例えば、平均画像とMIP画像との組み合わせを秒数分布推定部14に入力して秒数分布を推定してもよい。MIP画像および平均画像は、3次元のCTデータの部分画像から生成される生成画像の一例である。 <<
The input to the number-of-seconds
《医療情報システムの構成例》
図16は、医療画像処理装置220を含む医療情報システム200の構成例を示すブロック図である。第1実施形態および第2実施形態として説明した回帰推定装置10は、例えば、医療画像処理装置220に組み込まれる。医療情報システム200は、病院などの医療機関に構築されるコンピュータネットワークである。医療情報システム200は、医療画像を撮影するモダリティ230と、DICOMサーバ240と、医療画像処理装置220と、電子カルテシステム244と、ビューワ端末246とを含み、これらの要素は通信回線248を介して接続される。通信回線248は、医療機関内の構内通信回線であってよい。また通信回線248の一部は、広域通信回線であってもよい。 <<Configuration example of medical information system>>
FIG. 16 is a block diagram showing a configuration example of amedical information system 200 including a medical image processing device 220. As shown in FIG. The regression estimation device 10 described as the first embodiment and the second embodiment is incorporated into a medical image processing device 220, for example. A medical information system 200 is a computer network built in a medical institution such as a hospital. The medical information system 200 includes a modality 230 that captures medical images, a DICOM server 240, a medical image processing device 220, an electronic chart system 244, and a viewer terminal 246. These elements are connected via a communication line 248. Connected. Communication line 248 may be a local communication line within a medical institution. Also, part of the communication line 248 may be a wide area communication line.
図16は、医療画像処理装置220を含む医療情報システム200の構成例を示すブロック図である。第1実施形態および第2実施形態として説明した回帰推定装置10は、例えば、医療画像処理装置220に組み込まれる。医療情報システム200は、病院などの医療機関に構築されるコンピュータネットワークである。医療情報システム200は、医療画像を撮影するモダリティ230と、DICOMサーバ240と、医療画像処理装置220と、電子カルテシステム244と、ビューワ端末246とを含み、これらの要素は通信回線248を介して接続される。通信回線248は、医療機関内の構内通信回線であってよい。また通信回線248の一部は、広域通信回線であってもよい。 <<Configuration example of medical information system>>
FIG. 16 is a block diagram showing a configuration example of a
モダリティ230の具体例としては、CT装置231、MRI(Magnetic Resonance Imaging)装置232、超音波診断装置233、PET(Positron Emission Tomography)装置234、X線診断装置235、X線透視診断装置236および内視鏡装置237等が挙げられる。通信回線248に接続されるモダリティ230の種類は、医療機関ごとに様々な組み合わせがありうる。
Specific examples of the modality 230 include a CT device 231, an MRI (Magnetic Resonance Imaging) device 232, an ultrasonic diagnostic device 233, a PET (Positron Emission Tomography) device 234, an X-ray diagnostic device 235, an X-ray fluoroscopic diagnostic device 236, and an internal A scope device 237 and the like are included. The types of modalities 230 connected to the communication line 248 can be combined in various ways for each medical institution.
DICOMサーバ240は、DICOMの仕様にて動作するサーバである。DICOMサーバ240は、モダリティ230を用いて撮影された画像を含む各種データを保存および管理するコンピュータであり、大容量外部記憶装置およびデータベース管理用プログラムを備えている。DICOMサーバ240は、通信回線248を介して他の装置と通信を行い、画像データを含む各種データを送受信する。DICOMサーバ240は、モダリティ230によって生成された画像データその他の含む各種データを通信回線248経由で受信し、大容量外部記憶装置等の記録媒体に保存して管理する。なお、画像データの格納形式および通信回線248経由での各装置間の通信は、DICOMのプロトコルに基づいている。
The DICOM server 240 is a server that operates according to the DICOM specifications. The DICOM server 240 is a computer that stores and manages various data including images captured using the modality 230, and has a large-capacity external storage device and a database management program. The DICOM server 240 communicates with other devices via a communication line 248 to transmit and receive various data including image data. The DICOM server 240 receives image data generated by the modality 230 and other various data via a communication line 248, and stores and manages them in a recording medium such as a large-capacity external storage device. The storage format of image data and communication between devices via the communication line 248 are based on the DICOM protocol.
医療画像処理装置220は、通信回線248を介してDICOMサーバ240等からデータを取得することができる。医療画像処理装置220は、モダリティ230により撮影された医療画像について画像解析その他の各種処理を行う。医療画像処理装置220は、回帰推定装置10の処理機能の他、例えば、画像から病変領域などを認識する処理、病名などの分類を特定する処理、あるいは、臓器等の領域を認識するセグメンテーション処理など、様々なコンピュータ支援診断(Computer Aided Diagnosis, Computer Aided Detection :CAD)等の解析処理を行うように構成されてもよい。また、医療画像処理装置220は、処理結果をDICOMサーバ240およびビューワ端末246に送ることができる。なお、医療画像処理装置220の処理機能は、DICOMサーバ240に搭載されてもよいし、ビューワ端末246に搭載されてもよい。
The medical image processing apparatus 220 can acquire data from the DICOM server 240 or the like via the communication line 248. The medical image processing apparatus 220 performs image analysis and various other processes on medical images captured by the modality 230 . In addition to the processing functions of the regression estimation device 10, the medical image processing device 220 performs, for example, a process of recognizing a lesion area from an image, a process of identifying a classification such as a disease name, or a segmentation process of recognizing an area such as an organ. , various Computer Aided Diagnosis (Computer Aided Detection: CAD) and other analytical processes. The medical image processor 220 can also send processing results to the DICOM server 240 and viewer terminal 246 . Note that the processing functions of the medical image processing apparatus 220 may be installed in the DICOM server 240 or the viewer terminal 246 .
DICOMサーバ240のデータベースに保存された各種データ、並びに医療画像処理装置220により生成された処理結果を含む様々な情報は、ビューワ端末246に表示させることができる。
Various data stored in the database of the DICOM server 240 and various information including the processing results generated by the medical image processing apparatus 220 can be displayed on the viewer terminal 246.
ビューワ端末246は、PACS(Picture Archiving and Communication Systems)ビューワ、あるいはDICOMビューワと呼ばれる画像閲覧用の端末である。通信回線248には複数のビューワ端末246が接続され得る。ビューワ端末246の形態は特に限定されず、パーソナルコンピュータであってもよいし、ワークステーションであってもよく、また、タブレット端末などであってもよい。
The viewer terminal 246 is a terminal for viewing images called a PACS (Picture Archiving and Communication Systems) viewer or a DICOM viewer. A plurality of viewer terminals 246 can be connected to the communication line 248 . The form of the viewer terminal 246 is not particularly limited, and may be a personal computer, a workstation, a tablet terminal, or the like.
《コンピュータを動作させるプログラムについて》
回帰推定装置10における処理機能のコンピュータに実現させるプログラムを、光ディスク、磁気ディスク、もしくは、半導体メモリその他の有体物たる非一時的な情報記憶媒体であるコンピュータ可読媒体に記録し、この情報記憶媒体を通じてプログラムを提供することが可能である。 《Regarding the program that operates the computer》
A program that causes a computer to implement the processing functions of theregression estimation device 10 is recorded on a computer-readable medium that is a non-temporary information storage medium that is an optical disk, a magnetic disk, or a semiconductor memory or other tangible object, and the program is transmitted through this information storage medium. It is possible to provide
回帰推定装置10における処理機能のコンピュータに実現させるプログラムを、光ディスク、磁気ディスク、もしくは、半導体メモリその他の有体物たる非一時的な情報記憶媒体であるコンピュータ可読媒体に記録し、この情報記憶媒体を通じてプログラムを提供することが可能である。 《Regarding the program that operates the computer》
A program that causes a computer to implement the processing functions of the
またこのような有体物たる非一時的なコンピュータ可読媒体にプログラムを記憶させて提供する態様に代えて、インターネットなどの電気通信回線を利用してプログラム信号をダウンロードサービスとして提供することも可能である。
In addition, instead of storing the program in such a tangible non-temporary computer-readable medium and providing it, it is also possible to provide the program signal as a download service using telecommunication lines such as the Internet.
さらに、回帰推定装置10における処理機能の一部または全部をクラウドコンピューティングによって実現してもよく、また、SasS(Software as a Service)サービスとして提供することも可能である。
Furthermore, part or all of the processing functions in the regression estimation device 10 may be realized by cloud computing, or may be provided as a SasS (Software as a Service) service.
《各処理部のハードウェア構成について》
回帰推定装置10におけるデータ取得部12、秒数分布推定部14、統合部16、最大点特定部18、出力部19、回帰推定部22、変数変換部24、対数変換部26および統合分布生成部28などの各種の処理を実行する処理部(processing unit)のハードウェア的な構造は、例えば、次に示すような各種のプロセッサ(processor)である。 <<About the hardware configuration of each processing unit>>
Thedata acquisition unit 12, the number-of-seconds distribution estimation unit 14, the integration unit 16, the maximum point identification unit 18, the output unit 19, the regression estimation unit 22, the variable conversion unit 24, the logarithmic conversion unit 26, and the integrated distribution generation unit in the regression estimation device 10 The hardware structure of the processing unit (processing unit) that executes various processes such as 28 is, for example, various processors as shown below.
回帰推定装置10におけるデータ取得部12、秒数分布推定部14、統合部16、最大点特定部18、出力部19、回帰推定部22、変数変換部24、対数変換部26および統合分布生成部28などの各種の処理を実行する処理部(processing unit)のハードウェア的な構造は、例えば、次に示すような各種のプロセッサ(processor)である。 <<About the hardware configuration of each processing unit>>
The
各種のプロセッサには、プログラムを実行して各種の処理部として機能する汎用的なプロセッサであるCPU、画像処理に特化したプロセッサであるGPU、FPGA(Field Programmable Gate Array)などの製造後に回路構成を変更可能なプロセッサであるプログラマブルロジックデバイス(Programmable Logic Device:PLD)、ASIC(Application Specific Integrated Circuit)などの特定の処理を実行させるために専用に設計された回路構成を有するプロセッサである専用電気回路などが含まれる。
Various types of processors include CPUs, which are general-purpose processors that run programs and function as various processing units, GPUs, which are processors specialized for image processing, and FPGAs (Field Programmable Gate Arrays). Programmable Logic Device (PLD), ASIC (Application Specific Integrated Circuit), which is a processor that can change and so on.
1つの処理部は、これら各種のプロセッサのうちの1つで構成されていてもよいし、同種または異種の2つ以上のプロセッサで構成されてもよい。例えば、1つの処理部は、複数のFPGA、あるいは、CPUとFPGAの組み合わせ、またはCPUとGPUの組み合わせによって構成されてもよい。また、複数の処理部を1つのプロセッサで構成してもよい。複数の処理部を1つのプロセッサで構成する例としては、第一に、クライアントやサーバなどのコンピュータに代表されるように、1つ以上のCPUとソフトウェアの組み合わせで1つのプロセッサを構成し、このプロセッサが複数の処理部として機能する形態がある。第二に、システムオンチップ(System On Chip:SoC)などに代表されるように、複数の処理部を含むシステム全体の機能を1つのIC(Integrated Circuit)チップで実現するプロセッサを使用する形態がある。このように、各種の処理部は、ハードウェア的な構造として、上記各種のプロセッサを1つ以上用いて構成される。
A single processing unit may be composed of one of these various processors, or may be composed of two or more processors of the same type or different types. For example, one processing unit may be configured by a plurality of FPGAs, a combination of CPU and FPGA, or a combination of CPU and GPU. Also, a plurality of processing units may be configured by one processor. As an example of configuring a plurality of processing units with a single processor, first, as represented by a computer such as a client or a server, a single processor is configured by combining one or more CPUs and software. There is a form in which a processor functions as multiple processing units. Secondly, as typified by System On Chip (SoC), etc., there is a form of using a processor that realizes the functions of the entire system including multiple processing units with a single IC (Integrated Circuit) chip. be. In this way, the various processing units are configured using one or more of the above various processors as a hardware structure.
さらに、これらの各種のプロセッサのハードウェア的な構造は、より具体的には、半導体素子などの回路素子を組み合わせた電気回路(circuitry)である。
Furthermore, the hardware structure of these various processors is, more specifically, an electrical circuit that combines circuit elements such as semiconductor elements.
《本実施形態による利点》
第1実施形態および第2実施形態によれば、次のような利点がある。 <<Advantages of this embodiment>>
The first and second embodiments have the following advantages.
第1実施形態および第2実施形態によれば、次のような利点がある。 <<Advantages of this embodiment>>
The first and second embodiments have the following advantages.
〈1〉複数の入力のそれぞれに対応した推定結果に重みを付けて統合できるため、秒数を推定しにくい画像(例えば、アーチファクトを含みシーン解析が困難な画像など)の影響を減らすことができ、精度の高い推定値を得ることができる。例えば、推定に不適切なデータが入力の一つとして入ってきた場合、この入力に対応する推定値が大きく外れても確からしさが下がることで、統合結果への影響を抑えられる。
<1> Since the estimation results corresponding to each of multiple inputs can be weighted and integrated, it is possible to reduce the influence of images in which it is difficult to estimate the number of seconds (for example, images containing artifacts that make scene analysis difficult). , we can get an accurate estimate. For example, when data inappropriate for estimation is input as one of the inputs, even if the estimated value corresponding to this input deviates significantly, the probability decreases, thereby suppressing the influence on the integration result.
〈2〉回帰モデルの推論に使う式を機械学習により直接最適化できる。
<2> The formula used for inference of the regression model can be directly optimized by machine learning.
〈3〉入力された画像の画像解析によって確信度の高い秒数を推定し得るため、DICOMタグに撮影時間に関する付属情報が記録されていない画像、あるいは誤った時刻情報などが記録されている画像などについても、確信度の高い秒数を推定することが可能である。
<3> Since the number of seconds with a high degree of certainty can be estimated by image analysis of the input image, the DICOM tag does not record attached information related to the shooting time, or images in which incorrect time information is recorded. etc., it is possible to estimate the number of seconds with high confidence.
〈4〉回帰モデルへの入力として、3次元のCTデータを一度に入力して処理することはサイズ的に困難な場合があり得るが、第1実施形態および第2実施形態で説明したように、3次元のCTデータの一部であるスライス画像等の2次元画像を逐次的に処理して、これらの推定結果を統合することにより、入力されたデータの全体を見て適切な推定値を導くことが可能である。
<4> As an input to the regression model, it may be difficult to input and process three-dimensional CT data at once due to size, but as described in the first and second embodiments, By sequentially processing two-dimensional images such as slice images, which are part of three-dimensional CT data, and integrating these estimation results, an appropriate estimated value can be obtained by looking at the entirety of the input data. can lead.
また、第1実施形態で説明したように、確率分布モデルとしてラプラス分布を採用することにより、次の利点がある。
Also, as described in the first embodiment, the following advantages are obtained by adopting the Laplace distribution as the probability distribution model.
〈5〉学習が安定し、ラベルノイズにもある程度ロバストになる。
<5> Learning is stable and robust to some extent against label noise.
〈6〉同時確率分布が重み付きメジアンの形になり、アーチファクトなどにより一部の入力に対する推定結果の一つが大きく外れた時に、その外れ値の影響を受け難く、さらに頑強(ロバスト)になる。
<6> The joint probability distribution takes the shape of a weighted median, and when one of the estimation results for some inputs deviates greatly due to artifacts, etc., it is less susceptible to the outliers and is even more robust.
〈7〉入力に用いた複数の画像の中から、最終結果(最終推定値の推定)に使用した画像を取り出すことができる。
<7> An image used for the final result (estimation of the final estimated value) can be extracted from the multiple images used for input.
《他の適用例》
本開示の技術は、様々な用途に適用可能であり、入力に用いるデータの種類および推定する目的変数については、様々な態様があり得る。本開示の技術は、例えば、次のような回帰推定の問題に適用可能である。 《Other application examples》
The technology of the present disclosure can be applied to various uses, and there are various aspects of the types of data used for input and target variables to be estimated. The technology of the present disclosure is applicable to, for example, the following regression estimation problem.
適用例1:複数のスライス画像を用いて回帰を行う問題
具体的には、第1実施形態および第2実施形態で説明したように造影剤注入からの経過時間を推定するタスクの他、複数のスライス画像(2次元画像)から対象とする臓器の位置を3次元方向にも認識するタスクに適用可能である。例えば、同一シリーズ内の複数のスライス画像から臓器の位置を示す直方体(3次元のバウンディングボックス)の座標を回帰推定する処理おいて本開示の技術を適用できる。ここでいう臓器は本開示における「特定の対象物」の一例であり、バウンディングボックスの座標は本開示における「特定の対象物の位置を示す値」の一例である。 Application Example 1: Problem of Regression Using Multiple Slice Images It is applicable to the task of recognizing the position of target organs from slice images (two-dimensional images) in three-dimensional directions as well. For example, the technology of the present disclosure can be applied to regression estimation of the coordinates of a rectangular parallelepiped (three-dimensional bounding box) indicating the position of an organ from a plurality of slice images within the same series. The organ referred to here is an example of the "specific object" in the present disclosure, and the coordinates of the bounding box are an example of the "value indicating the position of the specific object" in the present disclosure.
具体的には、第1実施形態および第2実施形態で説明したように造影剤注入からの経過時間を推定するタスクの他、複数のスライス画像(2次元画像)から対象とする臓器の位置を3次元方向にも認識するタスクに適用可能である。例えば、同一シリーズ内の複数のスライス画像から臓器の位置を示す直方体(3次元のバウンディングボックス)の座標を回帰推定する処理おいて本開示の技術を適用できる。ここでいう臓器は本開示における「特定の対象物」の一例であり、バウンディングボックスの座標は本開示における「特定の対象物の位置を示す値」の一例である。 Application Example 1: Problem of Regression Using Multiple Slice Images It is applicable to the task of recognizing the position of target organs from slice images (two-dimensional images) in three-dimensional directions as well. For example, the technology of the present disclosure can be applied to regression estimation of the coordinates of a rectangular parallelepiped (three-dimensional bounding box) indicating the position of an organ from a plurality of slice images within the same series. The organ referred to here is an example of the "specific object" in the present disclosure, and the coordinates of the bounding box are an example of the "value indicating the position of the specific object" in the present disclosure.
また、入力されたスライス画像についてのスライス位置(CTデータ内での位置)を推定する処理について本開示の技術を適用できる。ここでいうスライス位置は本開示における「部分画像の位置」の一例である。
Also, the technique of the present disclosure can be applied to the process of estimating the slice position (position within CT data) of an input slice image. The slice position here is an example of the “partial image position” in the present disclosure.
適用例2:動画などの時系列画像もしくは複数画像の入力に対して回帰を行う問題
具体的には、例えば、動画等の画像に写る人物の年齢を推定する処理について本開示の技術を適用できる。また動画等の画像についてシーン認識をする場合の回帰推定の処理についても本開示の技術を適用できる。 Application example 2: Problem of performing regression on input of time-series images such as moving images or multiple images Specifically, for example, the technology of the present disclosure can be applied to processing for estimating the age of a person appearing in images such as moving images. . The technology of the present disclosure can also be applied to regression estimation processing when scene recognition is performed on images such as moving images.
具体的には、例えば、動画等の画像に写る人物の年齢を推定する処理について本開示の技術を適用できる。また動画等の画像についてシーン認識をする場合の回帰推定の処理についても本開示の技術を適用できる。 Application example 2: Problem of performing regression on input of time-series images such as moving images or multiple images Specifically, for example, the technology of the present disclosure can be applied to processing for estimating the age of a person appearing in images such as moving images. . The technology of the present disclosure can also be applied to regression estimation processing when scene recognition is performed on images such as moving images.
適用例3:音のデータから回帰を行う問題
具体的には、例えば、音声から感情認識をする場合などの回帰推定の処理について本開示の技術を適用できる。 Application Example 3: Problem of Regression from Sound Data Specifically, the technology of the present disclosure can be applied to regression estimation processing, for example, when performing emotion recognition from voice.
具体的には、例えば、音声から感情認識をする場合などの回帰推定の処理について本開示の技術を適用できる。 Application Example 3: Problem of Regression from Sound Data Specifically, the technology of the present disclosure can be applied to regression estimation processing, for example, when performing emotion recognition from voice.
適用例4:複数の解像度から一つの値を回帰する問題
具体的には、例えば、解像度の異なる複数の画像から、物体検出のバウンディングボックスの位置を回帰推定する処理について本開示の技術を適用できる。 Application Example 4: Problem of regressing one value from multiple resolutions Specifically, for example, the technology of the present disclosure can be applied to a process of regressively estimating the position of a bounding box for object detection from multiple images with different resolutions. .
具体的には、例えば、解像度の異なる複数の画像から、物体検出のバウンディングボックスの位置を回帰推定する処理について本開示の技術を適用できる。 Application Example 4: Problem of regressing one value from multiple resolutions Specifically, for example, the technology of the present disclosure can be applied to a process of regressively estimating the position of a bounding box for object detection from multiple images with different resolutions. .
《その他》
本開示は上述した実施形態に限定されるものではなく、本開示の技術的思想の趣旨を逸脱しない範囲で種々の変形が可能である。 "others"
The present disclosure is not limited to the embodiments described above, and various modifications are possible without departing from the spirit of the technical idea of the present disclosure.
本開示は上述した実施形態に限定されるものではなく、本開示の技術的思想の趣旨を逸脱しない範囲で種々の変形が可能である。 "others"
The present disclosure is not limited to the embodiments described above, and various modifications are possible without departing from the spirit of the technical idea of the present disclosure.
10 回帰推定装置
12 データ取得部
14 秒数分布推定部
16 統合部
18 最大点特定部
19 出力部
20 学習モデル
22 回帰推定部
24 変数変換部
26 対数変換部
28 統合分布生成部
102 プロセッサ
104 コンピュータ可読媒体
104A メモリ
104B ストレージ
106 通信インターフェース
108 入出力インターフェース
110 バス
114 入力装置
116 表示装置
130 回帰推定プログラム
200 医療情報システム
220 医療画像処理装置
230 モダリティ
231 CT装置
232 MRI装置
233 超音波診断装置
234 PET装置
235 X線診断装置
236 X線透視診断装置
237 内視鏡装置
240 DICOMサーバ
244 電子カルテシステム
246 ビューワ端末
248 通信回線
GD1 グラフ
GD1g グラフ
GD2 グラフ
GD2g グラフ
GL1 グラフ
GL1g グラフ
GL2 グラフ
GL2g グラフ
GLS グラフ
GLSg グラフ
GRb グラフ
GRμ グラフ
GROb グラフ
IM 画像
IM1、IM2、IMn 画像
IMi 画像
TIM 画像
Oa 推定値
Ob スコア値
P1、P2、Pi 確率分布
PD 秒数分布 10regression estimation device 12 data acquisition unit 14 second distribution estimation unit 16 integration unit 18 maximum point identification unit 19 output unit 20 learning model 22 regression estimation unit 24 variable transformation unit 26 logarithmic transformation unit 28 integrated distribution generation unit 102 processor 104 computer readable Medium 104A Memory 104B Storage 106 Communication interface 108 Input/output interface 110 Bus 114 Input device 116 Display device 130 Regression estimation program 200 Medical information system 220 Medical image processing device 230 Modality 231 CT device 232 MRI device 233 Ultrasound diagnostic device 234 PET device 235 X-ray diagnostic device 236 X-ray fluoroscopic diagnostic device 237 Endoscope device 240 DICOM server 244 Electronic chart system 246 Viewer terminal 248 Communication line GD1 Graph GD1g Graph GD2 Graph GD2g Graph GL1 Graph GL1g Graph GL2 Graph GL2g Graph GLS Graph GLSg Graph GRb Graph GRμ Graph GROb Graph IM Images IM1, IM2, IMn Image IMi Image TIM Image Oa Estimated value Ob Score values P1, P2, Pi Probability distribution PD Seconds distribution
12 データ取得部
14 秒数分布推定部
16 統合部
18 最大点特定部
19 出力部
20 学習モデル
22 回帰推定部
24 変数変換部
26 対数変換部
28 統合分布生成部
102 プロセッサ
104 コンピュータ可読媒体
104A メモリ
104B ストレージ
106 通信インターフェース
108 入出力インターフェース
110 バス
114 入力装置
116 表示装置
130 回帰推定プログラム
200 医療情報システム
220 医療画像処理装置
230 モダリティ
231 CT装置
232 MRI装置
233 超音波診断装置
234 PET装置
235 X線診断装置
236 X線透視診断装置
237 内視鏡装置
240 DICOMサーバ
244 電子カルテシステム
246 ビューワ端末
248 通信回線
GD1 グラフ
GD1g グラフ
GD2 グラフ
GD2g グラフ
GL1 グラフ
GL1g グラフ
GL2 グラフ
GL2g グラフ
GLS グラフ
GLSg グラフ
GRb グラフ
GRμ グラフ
GROb グラフ
IM 画像
IM1、IM2、IMn 画像
IMi 画像
TIM 画像
Oa 推定値
Ob スコア値
P1、P2、Pi 確率分布
PD 秒数分布 10
Claims (25)
- 1つ以上のプロセッサと、
前記1つ以上の前記プロセッサによって実行されるプログラムが記憶される1つ以上の記憶装置と、を備え、
前記1つ以上の前記プロセッサは、前記プログラムの命令を実行することにより、
複数のデータの入力を受け付け、
前記複数のデータを単一の回帰モデルに入力することにより、前記複数のデータから推定値と前記推定値の確からしさとを複数組推定し、
前記回帰モデルにより推定された前記複数組の前記推定値と前記推定値の確からしさとを基に、前記複数組の推定結果を統合する、
回帰推定装置。 one or more processors;
one or more storage devices in which programs executed by the one or more processors are stored;
The one or more processors execute instructions of the program to
accept multiple data inputs,
By inputting the plurality of data into a single regression model, estimating multiple sets of estimated values and the likelihood of the estimated values from the plurality of data,
integrating the plurality of sets of estimation results based on the plurality of sets of estimated values estimated by the regression model and the likelihood of the estimated values;
Regression estimator. - 前記1つ以上の前記プロセッサは、
前記推定値と前記推定値の確からしさとに基づいて、前記推定値を確率変数とする確率分布を推定し、
前記複数組のそれぞれの前記確率分布を統合して統合分布を生成し、
前記統合分布に基づいて最終推定値を特定する、
請求項1に記載の回帰推定装置。 The one or more processors are
estimating a probability distribution with the estimated value as a random variable based on the estimated value and the likelihood of the estimated value;
Integrating the probability distributions of each of the plurality of sets to generate an integrated distribution;
determining a final estimate based on the integrated distribution;
The regression estimation device according to claim 1. - 前記1つ以上の前記プロセッサは、
前記推定値と前記推定値の確からしさとに基づいて、前記推定値を確率変数とする確率分布を推定し、
前記複数組のそれぞれの前記確率分布を基に、同じ確率変数での確率の積が最大となる値を特定する、
請求項1に記載の回帰推定装置。 The one or more processors are
estimating a probability distribution with the estimated value as a random variable based on the estimated value and the likelihood of the estimated value;
Based on each of the plurality of sets of probability distributions, identifying a value that maximizes the product of probabilities for the same random variable;
The regression estimation device according to claim 1. - 前記1つ以上の前記プロセッサは、
前記回帰モデルから出力される前記推定値を確率分布モデルの第1のパラメータに変数変換し、
前記回帰モデルから出力される前記確からしさを示す値を前記確率分布モデルの第2のパラメータに変数変換する、
請求項2または3に記載の回帰推定装置。 The one or more processors are
variable transformation of the estimated value output from the regression model to a first parameter of a probability distribution model;
Variable conversion of the value indicating the likelihood output from the regression model to a second parameter of the probability distribution model;
The regression estimation device according to claim 2 or 3. - 前記確率分布モデルは、ラプラス分布である、
請求項4に記載の回帰推定装置。 wherein the probability distribution model is a Laplace distribution;
The regression estimation device according to claim 4. - 前記確率分布モデルは、ガウス分布である、
請求項4に記載の回帰推定装置。 wherein the probability distribution model is a Gaussian distribution;
The regression estimation device according to claim 4. - 前記1つ以上の前記プロセッサは、
前記確率分布の対数を取る対数変換を行い、
前記統合の際に、前記複数組のそれぞれの前記確率分布に対応した対数確率密度の和を計算し、
同時対数確率密度が最大になる値を求める、
請求項2から6のいずれか一項に記載の回帰推定装置。 The one or more processors are
perform logarithmic transformation that takes the logarithm of the probability distribution;
During the integration, calculating the sum of the logarithmic probability densities corresponding to the probability distributions of each of the plurality of sets;
find the value that maximizes the joint logarithmic probability density,
The regression estimation device according to any one of claims 2 to 6. - 前記回帰モデルは、入力用のデータと教師信号とが対応付けされた訓練データを用いて機械学習を行うことにより生成された学習済みモデルを含む、
請求項1から7のいずれか一項に記載の回帰推定装置。 The regression model includes a trained model generated by performing machine learning using training data in which input data and teacher signals are associated,
The regression estimation device according to any one of claims 1 to 7. - 前記回帰モデルは、畳み込みニューラルネットワークを用いて構成される、
請求項1から8のいずれか一項に記載の回帰推定装置。 wherein the regression model is constructed using a convolutional neural network;
The regression estimation device according to any one of claims 1 to 8. - 前記複数のデータは、医療画像である、
請求項1から9のいずれか一項に記載の回帰推定装置。 wherein the plurality of data are medical images;
The regression estimation device according to any one of claims 1 to 9. - 前記複数のデータは、同一シリーズ内のスライス画像である、
請求項10に記載の回帰推定装置。 The plurality of data are slice images within the same series,
The regression estimation device according to claim 10. - 前記複数のデータは、3次元画像に含まれる、異なる部分画像を含む、
請求項1から11のいずれか一項に記載の回帰推定装置。 the plurality of data includes different partial images included in the three-dimensional image;
A regression estimation device according to any one of claims 1 to 11. - 前記複数のデータは、3次元画像に含まれる、異なる部分画像を基に生成される生成画像を含む、
請求項1から11のいずれか一項に記載の回帰推定装置。 the plurality of data includes generated images generated based on different partial images included in the three-dimensional image;
A regression estimation device according to any one of claims 1 to 11. - 前記複数のデータは、時系列画像に含まれる、異なる部分画像を含む、
請求項1から11のいずれか一項に記載の回帰推定装置。 the plurality of data includes different partial images included in the time-series images;
A regression estimation device according to any one of claims 1 to 11. - 前記複数のデータは、異なる解像度の画像を含む、
請求項1から11のいずれか一項に記載の回帰推定装置。 the plurality of data includes images of different resolutions;
A regression estimation device according to any one of claims 1 to 11. - 前記推定値は、造影剤注入からの経過時間である、
請求項10から15のいずれか一項に記載の回帰推定装置。 wherein the estimated value is the elapsed time since injection of the contrast agent;
A regression estimation device according to any one of claims 10 to 15. - 前記推定値は、特定の対象物の位置を示す値である、
請求項10から15のいずれか一項に記載の回帰推定装置。 The estimated value is a value indicating the position of a specific object,
A regression estimation device according to any one of claims 10 to 15. - 前記推定値は、前記3次元画像における前記部分画像の位置を示す値である、
請求項12又は13に記載の回帰推定装置。 the estimated value is a value indicating the position of the partial image in the three-dimensional image;
The regression estimation device according to claim 12 or 13. - 前記推定値は、入力された前記データである画像に写る人物の年齢である、
請求項14に記載の回帰推定装置。 The estimated value is the age of the person in the image that is the input data.
The regression estimation device according to claim 14. - プロセッサが実行する回帰推定方法であって、
複数のデータの入力を受け付けることと、
前記複数のデータを単一の回帰モデルに入力することにより、前記複数のデータから推定値と前記推定値の確からしさとを複数組推定することと、
前記回帰モデルにより推定された前記複数組の前記推定値と前記推定値の確からしさとを基に、前記複数組の推定結果を統合することと、
を含む、回帰推定方法。 A regression estimation method executed by a processor, comprising:
accepting multiple data inputs;
estimating multiple sets of estimated values and likelihoods of the estimated values from the plurality of data by inputting the plurality of data into a single regression model;
Integrating the plurality of sets of estimation results based on the plurality of sets of estimated values estimated by the regression model and the likelihood of the estimated values;
Regression estimation methods, including . - コンピュータに、
複数のデータの入力を受け付ける機能と、
前記複数のデータを単一の回帰モデルに入力することにより、前記複数のデータから推定値と前記推定値の確からしさとを複数組推定する機能と、
前記回帰モデルにより推定された前記複数組の前記推定値と前記推定値の確からしさとを基に、前記複数組の推定結果を統合する機能とを実現させる、プログラム。 to the computer,
A function that accepts input of multiple data,
A function of estimating multiple sets of estimated values and the likelihood of the estimated values from the plurality of data by inputting the plurality of data into a single regression model;
A program for realizing a function of integrating the plurality of sets of estimation results based on the plurality of sets of estimated values estimated by the regression model and the likelihood of the estimated values. - 非一時的かつコンピュータ読取可能な記録媒体であって、請求項21に記載のプログラムが記録された記録媒体。 A recording medium that is non-temporary and computer-readable, in which the program according to claim 21 is recorded.
- データの入力を受けて、前記データから推定値と前記推定値の確からしさとを出力する回帰モデルとして用いられる学習済みモデルの生成方法であって、
入力用のデータと教師信号とが対応付けされた訓練データを用い、
前記入力用のデータを学習モデルに入力し、前記学習モデルから前記推定値と前記推定値の確からしさを示す値との出力を得ることと、
前記学習モデルから出力された前記推定値を確率分布モデルの第1のパラメータに変数変換することと、
前記学習モデルから出力された前記確からしさを示す値を前記確率分布モデルの第2のパラメータに変数変換することと、
前記第1のパラメータと前記第2のパラメータと前記教師信号とを用いてロス関数を計算することと、
前記ロス関数の計算結果に基づいて、前記学習モデルのパラメータを更新することと、
を含む、
学習済みモデルの生成方法。 A method of generating a trained model used as a regression model that receives data input and outputs an estimated value and the likelihood of the estimated value from the data,
Using training data in which input data and teacher signals are associated,
inputting the input data into a learning model, and obtaining an output of the estimated value and a value indicating the likelihood of the estimated value from the learning model;
Variable conversion of the estimated value output from the learning model to a first parameter of a probability distribution model;
Variable conversion of the value indicating the likelihood output from the learning model to a second parameter of the probability distribution model;
calculating a loss function using the first parameter, the second parameter and the teacher signal;
updating the parameters of the learning model based on the calculation result of the loss function;
including,
How to generate the trained model. - 前記確率分布モデルはラプラス分布であり、
前記第1のパラメータをμ、前記第2のパラメータをb、前記教師信号をtとする場合に、前記ロス関数として、次式
logb+|t-μ|/b
が用いられる、
請求項23に記載の学習済みモデルの生成方法。 The probability distribution model is a Laplace distribution,
When the first parameter is μ, the second parameter is b, and the teacher signal is t, the loss function is expressed by the following equation logb+|t−μ|/b
is used,
The method for generating a learned model according to claim 23. - 前記確率分布モデルはガウス分布であり、
前記第1のパラメータをμ、前記第2のパラメータをσ2、前記教師信号をtとする場合に、前記ロス関数として、次式
logσ2+(t-μ)2/2σ2
が用いられる、
請求項23に記載の学習済みモデルの生成方法。 the probability distribution model is a Gaussian distribution;
When the first parameter is μ, the second parameter is σ 2 , and the teacher signal is t, the loss function is given by the following equation logσ 2 +(t−μ) 2 /2σ 2
is used,
The method for generating a learned model according to claim 23.
Applications Claiming Priority (2)
| Application Number | Priority Date | Filing Date | Title |
|---|---|---|---|
| JP2021141458 | 2021-08-31 | ||
| JP2021-141458 | 2021-08-31 |
Publications (1)
| Publication Number | Publication Date |
|---|---|
| WO2023032438A1 true WO2023032438A1 (en) | 2023-03-09 |
Family
ID=85412040
Family Applications (1)
| Application Number | Title | Priority Date | Filing Date |
|---|---|---|---|
| PCT/JP2022/025288 WO2023032438A1 (en) | 2021-08-31 | 2022-06-24 | Regression estimation device and method, program, and trained model generation method |
Country Status (1)
| Country | Link |
|---|---|
| WO (1) | WO2023032438A1 (en) |
Citations (2)
| Publication number | Priority date | Publication date | Assignee | Title |
|---|---|---|---|---|
| JP2009230751A (en) * | 2008-02-25 | 2009-10-08 | Omron Corp | Age estimation device |
| JP2013003662A (en) * | 2011-06-13 | 2013-01-07 | Sony Corp | Information processing apparatus, method, and program |
-
2022
- 2022-06-24 WO PCT/JP2022/025288 patent/WO2023032438A1/en active Application Filing
Patent Citations (2)
| Publication number | Priority date | Publication date | Assignee | Title |
|---|---|---|---|---|
| JP2009230751A (en) * | 2008-02-25 | 2009-10-08 | Omron Corp | Age estimation device |
| JP2013003662A (en) * | 2011-06-13 | 2013-01-07 | Sony Corp | Information processing apparatus, method, and program |
Similar Documents
| Publication | Publication Date | Title |
|---|---|---|
| US11847781B2 (en) | Systems and methods for medical acquisition processing and machine learning for anatomical assessment | |
| KR101857624B1 (en) | Medical diagnosis method applied clinical information and apparatus using the same | |
| Kamran et al. | RV-GAN: Segmenting retinal vascular structure in fundus photographs using a novel multi-scale generative adversarial network | |
| US10984905B2 (en) | Artificial intelligence for physiological quantification in medical imaging | |
| Khan et al. | Deep neural architectures for medical image semantic segmentation | |
| JP2022025095A (en) | System and method for translation of medical imaging using machine learning | |
| US20220328189A1 (en) | Systems, methods, and apparatuses for implementing advancements towards annotation efficient deep learning in computer-aided diagnosis | |
| EP3611699A1 (en) | Image segmentation using deep learning techniques | |
| US11398304B2 (en) | Imaging and reporting combination in medical imaging | |
| CN111369562B (en) | Image processing method, image processing device, electronic equipment and storage medium | |
| KR101957811B1 (en) | Method for computing severity with respect to dementia of subject based on medical image and apparatus using the same | |
| Eslami et al. | Automatic vocal tract landmark localization from midsagittal MRI data | |
| Ahn et al. | Multi-frame attention network for left ventricle segmentation in 3d echocardiography | |
| WO2019208130A1 (en) | Medical document creation support device, method, and program, learned model, and learning device, method, and program | |
| WO2023032438A1 (en) | Regression estimation device and method, program, and trained model generation method | |
| CN112825619A (en) | Training machine learning algorithm using digitally reconstructed radiological images | |
| US20230260652A1 (en) | Self-Supervised Machine Learning for Medical Image Analysis | |
| KR102556646B1 (en) | Method and apparatus for generating medical image | |
| WO2023032437A1 (en) | Contrast state determination device, contrast state determination method, and program | |
| EP3667674A1 (en) | Method and system for evaluating images of different patients, computer program and electronically readable storage medium | |
| WO2023032436A1 (en) | Medical image processing device, medical image processing method, and program | |
| CN113316803A (en) | Correcting segmentation of medical images using statistical analysis of historical corrections | |
| US20230206477A1 (en) | Image processing method, image processing device, program, and trained model | |
| JP7376715B2 (en) | Progress prediction device, method of operating the progress prediction device, and progress prediction program | |
| US20230046302A1 (en) | Blood flow field estimation apparatus, learning apparatus, blood flow field estimation method, and program |
Legal Events
| Date | Code | Title | Description |
|---|---|---|---|
| 121 | Ep: the epo has been informed by wipo that ep was designated in this application |
Ref document number: 22864026 Country of ref document: EP Kind code of ref document: A1 |
|
| WWE | Wipo information: entry into national phase |
Ref document number: 2023545114 Country of ref document: JP |
|
| NENP | Non-entry into the national phase |
Ref country code: DE |