WO2022054711A1 - Computer program, information processing device, terminal device, information processing method, learned model generation method, and image output device - Google Patents
Computer program, information processing device, terminal device, information processing method, learned model generation method, and image output device Download PDFInfo
- Publication number
- WO2022054711A1 WO2022054711A1 PCT/JP2021/032440 JP2021032440W WO2022054711A1 WO 2022054711 A1 WO2022054711 A1 WO 2022054711A1 JP 2021032440 W JP2021032440 W JP 2021032440W WO 2022054711 A1 WO2022054711 A1 WO 2022054711A1
- Authority
- WO
- WIPO (PCT)
- Prior art keywords
- brain
- image
- pet
- mri
- time point
- Prior art date
Links
Images


Classifications
-
- A—HUMAN NECESSITIES
- A61—MEDICAL OR VETERINARY SCIENCE; HYGIENE
- A61B—DIAGNOSIS; SURGERY; IDENTIFICATION
- A61B5/00—Measuring for diagnostic purposes; Identification of persons
- A61B5/05—Detecting, measuring or recording for diagnosis by means of electric currents or magnetic fields; Measuring using microwaves or radio waves
- A61B5/055—Detecting, measuring or recording for diagnosis by means of electric currents or magnetic fields; Measuring using microwaves or radio waves involving electronic [EMR] or nuclear [NMR] magnetic resonance, e.g. magnetic resonance imaging
-
- G—PHYSICS
- G01—MEASURING; TESTING
- G01T—MEASUREMENT OF NUCLEAR OR X-RADIATION
- G01T1/00—Measuring X-radiation, gamma radiation, corpuscular radiation, or cosmic radiation
- G01T1/16—Measuring radiation intensity
- G01T1/161—Applications in the field of nuclear medicine, e.g. in vivo counting
-
- G—PHYSICS
- G06—COMPUTING; CALCULATING OR COUNTING
- G06N—COMPUTING ARRANGEMENTS BASED ON SPECIFIC COMPUTATIONAL MODELS
- G06N20/00—Machine learning
-
- G—PHYSICS
- G06—COMPUTING; CALCULATING OR COUNTING
- G06T—IMAGE DATA PROCESSING OR GENERATION, IN GENERAL
- G06T7/00—Image analysis
Definitions
- the present invention relates to a computer program, an information processing device, a terminal device, an information processing method, a trained model generation method, and an image output device.
- AD Alzheimer-type dementia
- DLB Lewy body dementia
- FTLD frontotemporal lobar degeneration
- MS sclerosis
- amyloid ⁇ causes amyloid plaque deposition and accumulation of abnormal proteins mainly in tau on the outside of nerve cells.
- amyloid plaque deposition occurs in the earliest stages of the onset of Alzheimer's disease and begins long before clinical symptoms appear (eg, a dozen years ago).
- ⁇ -synuclein a protein of unknown function, is expressed in nerve cells of the brain, which is considered to be the cause of neurodegenerative diseases such as Parkinson's disease.
- Patent Document 1 discloses a device that injects a drug that binds to amyloid ⁇ in brain tissue to a subject and uses a PET (Positron Emission Tomography) image showing the concentration distribution of the drug on a cut section across the brain. ing.
- PET Pulsitron Emission Tomography
- the present invention has been made in view of such circumstances, and is a computer program, an information processing device, a terminal device, an information processing method, and a learned model that can provide brain diagnostic information equivalent to a PET image without performing a PET examination. It is an object of the present invention to provide a generation method and an image output device.
- the brain when one or a plurality of MRI images taken at one or a plurality of time points regarding the subject's brain are acquired and the MRI image regarding the brain is input to the computer, the brain.
- the acquired one or more MRI images are input to the trained model for outputting the pseudo PET image of the subject, and the process of outputting the pseudo PET image at the one or more time points regarding the brain of the subject is executed. ..
- the information processing apparatus is the case where the acquisition unit for acquiring one or more MRI images captured at one or a plurality of time points regarding the subject's brain and the MRI image regarding the brain are input.
- An output unit that inputs the acquired one or more MRI images to the trained model that outputs a pseudo PET image about the brain and outputs the pseudo PET image at the one or a plurality of time points about the subject's brain. Be prepared.
- the terminal device displays a pseudo PET image over one or more time points and at least one of the amyloid accumulation over one or more time points for the brain of a subject to whom a particular drug has been administered. do.
- the information processing method acquires one or a plurality of MRI images captured at one or a plurality of time points regarding the subject's brain, and when the MRI image regarding the brain is input, the pseudo brain.
- the acquired one or more MRI images are input to the trained model for outputting the PET image, and the pseudo PET image at the one or more time points regarding the subject's brain is output.
- the trained model generation method acquires MRI images and PET images captured at a first time point regarding the brain, and relates to the brain imaged at a second time point after the first time point.
- An MRI image and a PET image are acquired, and the MRI image and the PET image taken at the first time point and the second time point are used to obtain the MRI image and the PET image about the brain taken at the first time point.
- a trained model that outputs a pseudo PET image of the brain at the second time point is generated.
- the image output device inputs an MRI image and a PET image taken at the first time point regarding the brain and an MRI image about the brain taken at the second time point after the first time point.
- a pseudo PET image relating to the brain at the second time point is output.
- the present invention it is possible to provide brain diagnostic information equivalent to a PET image without performing a PET examination.
- FIG. 1 is a schematic diagram showing an example of the configuration of the information processing system of the present embodiment.
- the information processing system includes an information processing device 50.
- the information processing device 50 is connected to the communication network 1.
- a terminal device 10 used by a medical worker, a researcher, or the like, and a terminal device 20 used by a subject (patient) are connected to the communication network 1.
- the terminal device 10 for example, a personal computer, a smartphone, a tablet, or the like can be used.
- An image DB 61, a PET device 71, and an MRI device 72 are connected to the information processing device 50.
- the information processing device 50, the image DB 61, the PET device 71, and the MRI device 72 are installed in a medical institution such as a hospital, for example.
- the information processing device 50 and the image DB 61 may be installed in a place other than a facility such as a medical institution.
- the information processing device 50 includes a control unit 51, a communication unit 52, a storage unit 53, a diagnostic information generation unit 54, an estimation unit 55, a learning processing unit 56, and an interface unit 57 that control the entire information processing device 50.
- the control unit 51 can be configured by a CPU (Central Processing Unit), a ROM (Read Only Memory), a RAM (Random Access Memory), and the like.
- Each function of the information processing device 50 may be distributed to a plurality of devices.
- the estimation unit 55 may be provided in the information processing device 50
- the learning processing unit 56 may be provided in another device.
- the communication unit 52 is composed of a required communication module or the like, and provides a communication function between the terminal device 10 and the terminal device 20 via the communication network 1.
- the communication unit 52 can transmit diagnostic information to, for example, the terminal device 10 and the terminal device 20.
- the terminal device 10 and the terminal device 20 can display the received diagnostic information.
- the storage unit 53 can be composed of a hard disk, a semiconductor memory, or the like, and can store required data such as data obtained as a result of processing in the information processing device 50.
- the diagnostic information generation unit 54 generates diagnostic information of the brain, particularly diagnostic information based on the transition of the state of the brain over a plurality of time points. Details of the diagnostic information will be described later.
- the interface unit 57 provides an interface function between the image DB 61, the PET (Positron Emission Tomography) device 71, and the MRI (Magnetic Resonance Imaging) device 72.
- the interface unit 57 can acquire a PET image obtained as a result of the PET inspection from the PET device 71.
- PET images include both amyloid PET and tau PET.
- the interface unit 57 can acquire an MRI image obtained as a result of an MRI examination from the MRI apparatus 72.
- the MRI image is also referred to as an MR image.
- the estimation unit 55 has a function of estimating the brain state, and includes an input data generation unit 551 and a model unit 552.
- the model unit 552 is composed of a semiconductor memory, a hard disk, or the like, and stores a model (learned model) generated by machine learning.
- the trained model for example, the trained model can be configured by a neural network, and for example, GAN (Generative Adversarial Network), U-net, or a combination thereof can be used.
- the input data generation unit 551 generates data to be input to the learning model when performing the brain state estimation process.
- the learning processing unit 56 has a function of generating a trained model by machine learning, and includes a learning data generation unit 561, a model unit 562, and a parameter determination unit 563.
- the model unit 562 is composed of a semiconductor memory, a hard disk, or the like, and stores a model before machine learning.
- the trained model generated by performing machine learning in the learning processing unit 56 can be stored in the model unit 552 of the estimation unit 55.
- the model unit 562 may store a model in the middle of machine learning, a model for re-learning, and a model that has been trained. Further, the learning processing unit 56 is not an indispensable configuration, and may be configured to include the learning processing unit 56 in another learning device.
- the training data generation unit 561 generates training input data and teacher data when generating a trained model.
- the parameter determination unit 563 adjusts the parameters of the neural network (for example, weights, biases, filter parameters, etc.) when generating the trained model, and finally determines the parameters.
- the learning processing unit 56 is, for example, a hardware such as a CPU (for example, a multi-processor having a plurality of processor cores mounted), a GPU (Graphics Processing Units), a DSP (Digital Signal Processors), an FPGA (Field-Programmable Gate Arrays), or the like. It can be configured by combining wear.
- a CPU for example, a multi-processor having a plurality of processor cores mounted
- a GPU Graphics Processing Units
- DSP Digital Signal Processors
- FPGA Field-Programmable Gate Arrays
- the image DB 61 can record various images (for example, MRI image, PET image, etc.) used in machine learning when generating a trained model. Further, the image DB 61 can record a pseudo PET image generated by the information processing apparatus 50. In addition, in this specification, a pseudo PET image is also literally referred to as a pseudo PET image.
- the information processing device 50 includes patient information (subject information), MRI image, PET image (including presence / absence of PET image), and initial time, which are necessary for generating diagnostic information of the brain from a doctor or the like who operates the terminal device 10. Whether or not it is a medical examination, date of medical examination, adverse events (including side effects, such as nausea, vomiting, headache, slow pulse, angina, myocardial infarction, cerebrovascular attack, spasm attack, amyloid-related imaging abnormality (ARIA) , ARIA-E, ARIA-H, etc.), falls, etc.), biomarkers (FDG-PET, tau protein, blood test results, genetic information, etc.), cognitive test results, and the like can be obtained.
- adverse events including side effects, such as nausea, vomiting, headache, slow pulse, angina, myocardial infarction, cerebrovascular attack, spasm attack, amyloid-related imaging abnormality (ARIA) , ARIA-E, ARIA-H, etc.
- biomarkers FDG-PET
- the cognitive test is a test for checking the cognitive function of the brain.
- the content of the cognitive test includes, for example, calculations such as addition and subtraction, Stroop, N-Back, and word prescription, but is not limited thereto.
- Specific examples of the cognitive test include, for example, a test for "forward” and “reverse”, a test for "Stroop”, a test for "addition” and “subtraction”, and a test for N-Back (for example, 1-Back). , Can be mentioned as a test for "immediate reproduction” (word recall).
- the cognitive ability test is not limited to these, and a test or test for measuring the state of brain health (including the state of cognitive function and the presence and degree of brain disease and mental illness) or other similar type of test or test is performed. It may be adopted.
- the above information can be displayed on either the terminal device 10 used by a doctor or the like or the terminal device 20 used by a subject (patient).
- the brain diagnostic information is diagnostic information regarding a disease related to the brain, amyloid ⁇ , tau protein, or a disease related to ⁇ -synuclein (also referred to as ⁇ -synuclein aggregate).
- diseases related to the brain include dementia and multiple sclerosis.
- Diseases related to amyloid ⁇ or tau protein include, for example, mild cognitive impairment (MCI: Mild cognitive impairment), mild cognitive impairment due to Alzheimer's disease (MCIdue to AD), prodromal AD, and Alzheimer's disease.
- Presymptomatic stage / preclinical AD Parkinson's disease, multiple sclerosis, insomnia, sleep disorders, cognitive decline, cognitive impairment, amyloid positive / negative disorders, motor disorders, motor disorders, etc.
- Diseases associated with alpha-synuclein include, for example, Alzheimer's disease (amyloid plaque), dementia (Lewy bodies), synucleinopathy (protein aggregates in neurons, nerve fibers, glial cells), multiple system atrophy, Parkinson's disease. (Lewy bodies), including motor dysfunction.
- the PET image is estimated by generating a pseudo PET image at each MRI examination time point, and the diagnostic information of the brain is obtained.
- the MRI examination time point is the MRI examination time point which is continuously performed after the first MRI examination based on the instruction of the doctor.
- the MRI image is obtained by performing a predetermined calculation on the MRI signal as well as the MRI image (for example, T1 weighted image, T2 weighted image, diffusion weighted image, flare image, diffusion tensor image) obtained by the MRI apparatus 72. It also includes processed images (eg, QSM images) and the like.
- processed images eg, QSM images
- the term "pseudo-PET image” is used to distinguish it from an actual PET image, but in the present specification, it means not only an image similar to a PET image but also numerical information that can be estimated from the image. .. That is, "pseudo" means that not only the image itself but also information (numerical information, etc.) obtained from the image is included.
- the pseudo PET image may include an image similar to an amyloid PET image, a tau PET image, or an ⁇ -synuclein aggregate image. Further, the pseudo PET image may include a centiroid value.
- amyloid PET the value of composite SUVR differs depending on the PET drug even if the accumulation of the same amyloid is the same, so that this is standardized by the value that does not depend on the drug.
- the degree of accumulation of amyloid in the brain can be expressed by a numerical value from 0 to 100, where the average of healthy young people is 0 and the average of reliable AD is 100.
- Sentiloid can be estimated directly from the MRI image, or can be estimated via the distribution information of amyloid ⁇ estimated from the MRI image.
- the pseudo PET image also includes, for example, numerical information obtained by quantifying an amyloid PET image with an index called SUVR and correcting it by a standardization method called a centiroid method.
- the pseudo PET image includes distribution information (for example, UVVR value for each voxel) that visualizes the distribution of amyloid ⁇ , tau protein or ⁇ -synuclein in the brain, as in the PET image.
- the SUVR Standardized Uptake Value Ratio
- the SUVR generally includes a SUVR (voxelUVR) for each boxel, a SUVR (regional SUVR) for each site, a SUVR (composite UVR) within a region of interest, and the like, but in the present specification.
- SUVR Any SUVR may be used. That is, in the present specification, the description of SUVR shall include any of the above-mentioned SUVRs.
- composite SUVR is the sum of SUVs (Standardized Uptake Value: amyloid ⁇ protein accumulation) of four sites of cerebellar gray matter (prefrontal cortex, anterior and posterior cingulate cortex, parietal lobe, and lateral temporal lobe) as regions of interest. Can be determined by dividing by the SUV of a particular reference region (eg, cerebellum, etc.).
- the degree of accumulation (SUV) of amyloid ⁇ , tau protein or ⁇ -synuclein can be determined, for example, by counting the number of voxels in which the value indicating the brightness of each voxel constituting the required site is equal to or higher than a predetermined threshold value. Accumulation (for example, OO%) can be calculated from the ratio of the count value to the total number of voxels of the required part.
- the SUVR for each voxel is a value obtained by dividing the SUV of a certain voxel by the average value of the SUV in the reference region (for example, the cerebellum).
- the SUVR for each site is a value obtained by dividing the SUV of a certain site by the average value of the SUV in the reference region (for example, the cerebellum).
- FIG. 2 is a schematic diagram showing a first example of the PET image estimation method by the estimation unit 55.
- the model unit 552 is a trained model, and the model is composed of a neural network (for example, CNN: Convolutional Neural Network), and GAN (Generative Adversarial Network), U-net, or a combination thereof can be used.
- the model unit 552 includes an input layer, an intermediate layer, and an output layer, and neural network parameters (weights, biases, filter parameters, etc.) are determined by machine learning.
- the input data generation unit 551 inputs the MRI image acquired from the MRI apparatus 72 via the interface unit 57 to the model unit 552 as input data.
- Time points t1, t2, t3, t4, ..., TN can be the time points of the MRI examination of the subject (patient).
- the time interval between adjacent time points is the time interval of a normal MRI examination, and can be, for example, 6 months or 1 year.
- FIG. 2 it is expressed that the MRI images at the time points t1, t2, t3, t4, ..., TN are simultaneously input to the model unit 552, but it is not necessary and the MRI image is not necessary.
- the MRI image may be input to the model unit 552 each time.
- the pseudo PET image is an image that estimates the actual PET image.
- PET images are images of the distribution of amyloid ⁇ , tau protein or ⁇ -synuclein in the brain.
- Amyloid ⁇ and tau protein are mild cognitive impairment (MCI: Mild cognitive impairment), mild cognitive impairment due to Alzheimer's disease (MCIdue to AD), prodromal AD, pre-symptomatic stage of Alzheimer's disease / preclinical AD (preclinical AD).
- MCI Mild cognitive impairment
- AD Alzheimer's disease
- prodromal AD pre-symptomatic stage of Alzheimer's disease / preclinical AD (preclinical AD).
- Abnormalities found in the brain of patients such as preclinical AD
- Parkinson's disease multiple sclerosis, insomnia, sleep disorders, cognitive decline, cognitive impairment, and neurodegenerative diseases such as amyloid positive / negative disorders. It is a protein.
- the test drug is administered to the patient by intravenous injection, and the drug specifically adsorbs amyloid ⁇ , tau protein or ⁇ -synuclein. This makes it possible to observe the distribution of amyloid ⁇ , tau protein or ⁇ -synuclein in the brain.
- the diagnostic information generation unit 54 generates diagnostic information based on the pseudo PET images at the time points t1, t2, t3, t4, ..., TN output by the model unit 552. Since pseudo-PET images at multiple time points are obtained, not only the state of the brain at a specific time point (specifically, the distribution state of amyloid ⁇ , tau protein or ⁇ -synuclein) but also the state of the brain over multiple time points. Diagnostic information based on changes in state can be obtained. This makes it possible to provide brain diagnostic information equivalent to a PET image without performing a PET examination. The details of the diagnostic information will be described later.
- FIG. 3 is a schematic diagram showing a second example of the PET image estimation method by the estimation unit 55.
- the difference from the first example shown in FIG. 2 is that, in addition to the MRI image, the PET image at the time point t1 is input to the model unit 552 as input data.
- the PET image at time point t1 is obtained by a PET examination performed at the same timing as the MRI examination at time point t1.
- the time point t1 of the MRI examination and the time point t1 of the PET examination do not necessarily have to be the same timing, and there may be a time difference of about several days, about several weeks, or about several months. Further, in the example of FIG.
- the PET image is at the time point t1, but is not limited to the time point t1, and may be a time point t2, a time point t3, or the like. This is because the PET examination is not always performed at the time of the first MRI examination, and the PET examination may be performed at the second or third MRI examination depending on the patient's symptoms.
- the model unit 552 includes MRI and PET images captured at the first time point (time point t1 in the example of the figure) and the second time point (time point t2, t3, t4 in the example of the figure) after the first time point with respect to the brain. , ...,
- a pseudo PET image of the brain at time points t2, t3, t4, ..., TN can be output. can.
- the model unit 552 It is possible to output a pseudo PET image related to the brain at the time of the second and subsequent MRI examinations.
- the information of the actual PET image at the time point t1 is also used, so that the subject is in the initial stage.
- the accuracy of the pseudo PET image output by the model unit 552 will be improved.
- FIG. 4 is a schematic diagram showing a first example of a method of generating a trained model in the learning processing unit 56.
- the method of generating the trained model shown in FIG. 4 corresponds to the method of generating the model unit 552 of FIG.
- learning input data MRI at time point nt regarding the brain of many subjects including healthy subjects and patients with diseases related to brain and amyloid ⁇ , tau protein or ⁇ -synuclein-related diseases.
- the image is used, and the PET image at the time point nt of the relevant brain is used as the teacher data.
- the time point nt may be different for each target person, but the time points of the MRI image and the PET image for one target person are the same time point. However, the time point nt of the MRI image and the time point nt of the PET image do not necessarily have to be at the same timing, and there may be a time difference of about several days, about several weeks, or about several months.
- a trained model can be generated by adjusting the parameters of the model unit 562 (eg, weight wij, bias bkl, filter parameters, etc.) so that the value of the loss function based on the image is minimized). ..
- FIG. 5 is a schematic diagram showing a second example of a method of generating a trained model in the learning processing unit 56.
- the method of generating the trained model shown in FIG. 5 corresponds to the method of generating the model unit 552 of FIG.
- the difference from the first example shown in FIG. 4 is that in the second example, the PET image at the time point t1 is used as the input data for learning.
- the MRI image and PET image at the first time point and the MRI image at the second time point regarding the brain are input to the model unit 562 so that the pseudo PET image output by the model unit 562 approaches the actual PET image as the teacher data.
- Learning by adjusting the parameters of the model unit 562 eg, weight wij, bias bkl, filter parameters, etc.
- the model unit 562 is set in consideration of the distribution state of amyloid ⁇ , tau protein or ⁇ -synuclein in the brain at the initial stage. It can be machine-learned, and it is expected that the accuracy of the pseudo PET image output by the trained model will be improved.
- diagnostic information displayed on each of the terminal device 10 and the terminal device 20 will be described.
- diagnostic information displayed on the terminal device 10 used by medical professionals, researchers, and the like hereinafter, also referred to as “doctors and the like”.
- FIG. 6 is a schematic diagram showing a first example of diagnostic information displayed on a terminal device 10 of a doctor or the like.
- the diagnostic information 101 includes first, second, third, and fourth pseudo PET images for a patient.
- the actual PET image may be displayed instead of the pseudo PET image for the first time.
- an identifier (mark) for identifying whether the image is an actual PET image or a pseudo PET image can be displayed.
- the number of pseudo PET images is not limited to four.
- the time interval between the first time and the second time may be, for example, two years, and the interval after the second time may be one year, and the like, but the time interval is not limited thereto.
- the diagnostic information 101 includes the dementia diagnosis result for the patient.
- the dementia diagnosis result is a comprehensive judgment of the result of a cognitive ability test or the like by a doctor, and is not necessarily judged only by a pseudo PET image. In the example of the figure, it is judged as NC (Normal Control, healthy person, healthy elderly person, etc.) at the first time, but it is judged as MCI (mild cognitive impairment) after the second time.
- Diagnostic information 101 includes a state of amyloid accumulation for the patient.
- the state of amyloid accumulation may be the presence or absence of amyloid ⁇ accumulation at a required site in the brain (for example, cerebral cortex), or may be the degree of amyloid ⁇ accumulation (SUV).
- the presence / absence and degree of accumulation of abnormal proteins such as tau protein or ⁇ -synuclein may be displayed instead of or in addition to amyloid accumulation.
- Amyloid ⁇ -induced amyloid plaque deposition is thought to be a pathological change that occurs from the earliest stages of the onset of Alzheimer's disease, and is said to begin more than a dozen years before clinical symptoms appear. As shown in FIG. 6, even in the case of NC, the distribution of amyloid ⁇ is likely to be remarkable (in the example of the figure, amyloid accumulation is “present”). Thus, early diagnosis of MCI is facilitated at an early stage when there is no subjective symptom of dementia.
- amyloid plaque begins to accumulate from the base of the neocortex and gradually spreads over the entire cerebral cortex. Therefore, in MCI (mild cognitive impairment), AD (Alzheimer's disease) develops by observing the time-series display of pseudo-PET images or the transition of the distribution state of amyloid ⁇ based on the pseudo-PET images obtained in chronological order. Is likely to be foreseen. In the example of FIG. 6, since the accumulation degree of amyloid ⁇ in the cerebral cortex obtained from the pseudo PET image at the 4th time is higher than a predetermined threshold value, the possibility of developing AD is diagnosed as “possible”.
- MCI mimild cognitive impairment
- the diagnostic information includes a pseudo PET image at a plurality of time points and a PET diagnostic index specified based on each pseudo PET image.
- the PET diagnostic index is an index that can be obtained based on a pseudo PET image, and may be, for example, an accumulation degree (SUV) indicating the accumulation of amyloid ⁇ , tau protein, or ⁇ -synuclein, or SUVR.
- the degree of accumulation of amyloid ⁇ , tau protein or ⁇ -synuclein may be the degree of accumulation of each part of the brain, the total degree of accumulation of a plurality of parts, or the degree of accumulation in the entire brain. Since it is based on pseudo PET images at multiple time points, it is possible to generate diagnostic information considering the transition of accumulation of amyloid ⁇ , tau protein or ⁇ -synuclein.
- the diagnostic information includes the brain disease diagnosis result and the PET diagnostic index for the subject for each pseudo PET image.
- Brain disease diagnosis results include, for example, NC (Normal Control, healthy person, healthy elderly person, etc.), MCI (mild cognitive impairment) and the like.
- NC Normal Control, healthy person, healthy elderly person, etc.
- MCI mimild cognitive impairment
- FIG. 7 is a schematic diagram showing a second example of diagnostic information displayed on a terminal device 10 of a doctor or the like.
- the diagnostic information 102 includes an MRI image and a pseudo PET image in June 2018, an MRI image and a pseudo PET image in January 2019, and an MRI image and a pseudo PET image in June 2019. Images, MRI images and pseudo PET images as of January 2020 are displayed in chronological order.
- the MRI diagnostic index is displayed in chronological order together with the SUVR value as the PET diagnostic index.
- the MRI diagnostic index is an index that can be obtained based on an MRI image, and as shown in FIG. 7, for example, it can be a value related to atrophy of each part of the brain (for example, the degree of atrophy in the region of interest).
- the atrophy is not limited to this, and the volume of each site may be used.
- the site may be a plurality of sites or a specific site.
- Methods for assessing cerebral atrophy include, for example, 3D T1-weighted whole-brain MRI separated into gray matter, white matter, and cerebrospinal fluid (segmentation) and morphologically transformed into standard brain templates to determine the gray matter concentration of individual subjects.
- VBM Veloxel Based Morphometry
- Alzheimer's disease it is said that atrophy of the medial temporal region of the brain, which is not observed in normal aging, occurs at an early stage. That is, attention can be paid to medial temporal atrophy as a means for predicting the onset of Alzheimer's disease at the stage of MCI (mild cognitive impairment).
- MCI mimild cognitive impairment
- FIG. 7 while grasping the stage of MCI (mild cognitive impairment) of a patient by displaying a pseudo PET image and a PET diagnostic index in a time series, the medial temporal region is displayed by displaying the MRI image and the MRI diagnostic index in a time series. The onset of Alzheimer's disease can be predicted by observing the transition of atrophy of the part.
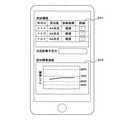
- FIG. 8 is a schematic diagram showing a third example of diagnostic information displayed on a terminal device 10 of a doctor or the like.
- the diagnostic information includes age-specific amyloid accumulation information 103.
- the age-specific amyloid accumulation information 103 displays the average value of amyloid accumulation in the cerebral cortex of many healthy subjects with normal cognitive function by age group.
- MCI mimild cognitive impairment
- healthy people in their 50s have 10% amyloid accumulation
- healthy people in their 60s have 15% amyloid accumulation
- healthy people in their 70s have 30% amyloid accumulation
- healthy people in their 80s have 30% amyloid accumulation. Healthy individuals have 50% amyloid accumulation.
- the numerical value of amyloid accumulation is an example schematically shown, and may differ from the actual numerical value, and is not limited to these numerical values. Moreover, it is not limited to each age group, and may be gender. Diagnostic information also includes patient age, amyloid accumulation in the cerebral cortex, and up-to-date pseudo-PET images. Although not shown, the accumulation of abnormal proteins such as tau protein or ⁇ -synuclein may be indicated in place of or in addition to the accumulation of amyloid.
- the diagnostic information includes the PET diagnostic index (in the example of FIG. 8, amyloid accumulation) and the PET diagnostic index for each age group of the comparison subject.
- the PET diagnostic index for example, the average value of the PET diagnostic index by age group
- the comparative subject for example, a person with normal cognitive function
- the brain condition of the subject may be compared with that of the comparative subject of the same age. You can judge whether it is bad or bad.
- FIG. 9 is a schematic diagram showing a fourth example of diagnostic information displayed on a terminal device 10 of a doctor or the like.
- FIG. 9 shows an example of evaluating the efficacy of a drug for a disease related to the brain or a disease related to amyloid ⁇ .
- Drugs include unapproved drugs and approved drugs.
- the drug may be an approved drug, an unapproved drug, a drug, an investigational drug, a test drug, a control drug, or the like. It should be noted that not only the evaluation of the medicinal effect of the drug but also the evaluation of foods and drinks other than the drug, such as health foods, foods with functional claims, special purpose foods, nutritional supplements, supplements or foods for specified health use, etc. are included. good.
- regions 111 and 113 in which pseudo PET images are displayed in chronological order and regions 112 and 114 in which changes in amyloid accumulation are displayed are displayed. Changes in amyloid accumulation are shown to change over an appropriate period, for example, 2 years, 5 years, 10 years. The period can be set by doctors and researchers as appropriate. For example, suppose that a large number of subjects diagnosed with MCI are divided into two groups, one group continues to receive drug A and the other group continues to receive drug B. As shown in FIG. 9, it is assumed that the change in the average amyloid accumulation of the subjects who received the drug A increased with the period. Further, it is assumed that the rate of change in the average amyloid accumulation of the subjects who received the drug B does not change so much.
- the drug B is effective in suppressing the progression of dementia.
- Adverse events including side effects, such as nausea, vomiting, headache, bradycardia, angina, myocardial infarction, cerebrovascular attack, spasm attack, amyloid-related imaging abnormalities (ARIA, ARIA-E, ARIA-H, etc.)
- ARIA, ARIA-E, ARIA-H, etc. amyloid-related imaging abnormalities
- FIG. 9 shows an example of displaying both the pseudo PET image and the change in the amyloid accumulation, only one of the pseudo PET image and the change in the amyloid accumulation may be displayed.
- changes in the accumulation of abnormal proteins such as tau protein or ⁇ -synuclein may be displayed in place of changes in amyloid accumulation or in addition to changes in amyloid accumulation.
- FIG. 10 is a schematic diagram showing a first example of diagnostic information displayed on the patient's terminal device 20.
- the diagnostic information includes the consultation history 201 and the cognitive impairment transition 202.
- the consultation history 201 a detail icon for displaying the date of consultation, the doctor in charge, the diagnosis result, and the details of the diagnosis result is displayed.
- the patient can see the past consultation history in a list, and can easily recognize, for example, the transition of the diagnosis result (mild in the example of the figure).
- the scheduled date of the next medical examination it is possible to prevent forgetting to receive the medical examination.
- the cognitive impairment transition 202 the transition of the disability level of the patient's cognitive dysfunction is displayed. From the past diagnosis results, the patient can judge at a glance whether the disability level has deteriorated or has remained almost unchanged. In addition, by displaying the average disability level for each age group in the cognitive impairment transition 202, the patient can determine whether it is better or worse than the average value of the same age group with reference to his / her own age.
- FIG. 11 is a schematic diagram showing a second example of diagnostic information displayed on the patient's terminal device 20.
- the diagnostic information 203 shown in FIG. 11 is displayed.
- a case where the detail icons of the three consultation dates are operated is shown.
- a pseudo PET image is displayed on the diagnosis information 203 together with the consultation date.
- the pseudo PET image included in the diagnostic information 203 may be a pseudo PET image output by the model unit 552, or may be an image after image processing of the pseudo PET image output by the model unit 552 so that a general patient can easily understand it. good.
- FIG. 12 is a schematic diagram showing a third example of diagnostic information displayed on the patient's terminal device 20.
- FIG. 12 shows an example of evaluating the efficacy of a drug for a disease related to the brain or a disease related to amyloid ⁇ , tau protein or ⁇ -synuclein.
- the diagnostic information 204 displays a patient name (may be a patient number), a drug administered to the patient, a drug administration period, and the like.
- pseudo PET images are displayed in chronological order over the administration period.
- one pseudo PET image may be displayed. As schematically shown in FIG.
- the drug is a disease associated with amyloid ⁇ , tau protein or ⁇ -synuclein. It can be seen that the progress is suppressed. Adverse events (including side effects, such as nausea, vomiting, headache, bradycardia, angina, myocardial infarction, cerebrovascular attack, spasm attack, amyloid-related imaging abnormalities (ARIA, ARIA-E, ARIA-H, etc.)) , At least one such as a fall) may be displayed. As a result, not only the efficacy of the drug but also side effects and the like can be confirmed.
- side effects including side effects, such as nausea, vomiting, headache, bradycardia, angina, myocardial infarction, cerebrovascular attack, spasm attack, amyloid-related imaging abnormalities (ARIA, ARIA-E, ARIA-H, etc.
- the change in may be displayed.
- the amyloid accumulation state and the tau protein accumulation state ⁇ -synuclein accumulation state at a certain point in time may be displayed during the administration period.
- FIG. 13 is a flowchart showing an example of the procedure for generating brain diagnostic information.
- the control unit 51 determines whether or not it is the first medical examination (S11), and if it is the first medical examination (YES in S11), determines whether or not the subject has a PET image (S12). When there is a PET image (YES in S12), the control unit 51 acquires the PET image of the subject (S13). When it is not the first examination (NO in S11) and when there is no PET image of the subject (NO in S12), the control unit 51 performs the process of step S14 described later.
- the control unit 51 acquires an MRI image of the subject (S14), and inputs the acquired MRI image and PET image (if there is a PET image) into the trained model (S15).
- the control unit 51 calculates the PET diagnostic index based on the pseudo PET image output by the trained model (S16), and calculates the MRI diagnostic index based on the acquired MRI image (S17).
- the control unit 51 determines the presence or absence of another MRI image at the time of imaging (S18), and if there is another MRI image (YES in S18), the process after step S14 is repeated. When there is no other MRI image (NO in S18), the control unit 51 generates diagnostic information (S19) and ends the process.
- FIG. 14 is a flowchart showing an example of the procedure of the trained model generation process.
- the control unit 51 reads out the model (S31) and sets the initial values of the parameters of the neural network (S32).
- the control unit 51 inputs the PET image at the imaging time t1 and the MRI image at the imaging time tun into the model (model unit 562), and outputs the pseudo PET image at the imaging time tun and the PET at the imaging time tun output by the model.
- the model parameters are adjusted so that the value of the loss function based on the image is minimized (S35).
- the control unit 51 determines whether or not the value of the loss function is within the permissible range (S36), and if it is not within the permissible range (NO in S36), the process after step S34 is repeated. When the value of the loss function is within the permissible range (YES in S36), the control unit 51 determines whether or not all the processing at the time of imaging is completed (S37).
- control unit 51 When all the processing at the time of imaging is not completed (NO in S37), the control unit 51 adds 1 to the count value (S38), and repeats the processing in steps S34 and subsequent steps. When all the processing at the time of imaging is completed (YES in S37), the control unit 51 stores the generated trained model in the model unit 552 (S39), and ends the processing.
- the information processing device 50 can also be realized by using a computer equipped with a CPU (processor), RAM, and the like.
- a computer program (which can be recorded on a recording medium) that defines the processing procedure as shown in FIGS. 13 and 14 is read by a recording medium reading unit provided in the computer, the read computer program is loaded into the RAM, and the computer program is loaded.
- the information processing device 50 can be realized on a computer by executing the program on a CPU (processor).
- MCI mimild cognitive impairment
- AD Alzheimerer's disease
- DLB dementia
- MS multiple sclerosis
- FTLD frontal lobe temporal lobe degeneration
- brain atrophy in Lewy body disease is associated with the accumulation of amyloid ⁇ or tau protein, similar to Alzheimer's disease.
- Alzheimer's disease Alzheimer's disease
- dementia Lewy bodies
- synucleinopathy protein aggregates in neurons, nerve fibers, glial cells
- multiple system atrophy Parkinson's disease (Lewy bodies), motor function.
- Disorders and the like are associated with the accumulation of ⁇ -synuclein.
- the pseudo PET for the brain is described.
- the acquired one or a plurality of MRI images are input to the trained model that outputs an image, and a process of outputting a pseudo PET image at the one or a plurality of time points regarding the subject's brain is executed.
- the information processing apparatus of the present embodiment has an acquisition unit that acquires one or a plurality of MRI images captured at one or a plurality of time points regarding the subject's brain, and when an MRI image regarding the brain is input, the pseudo brain.
- the trained model that outputs the PET image is provided with an output unit that inputs the acquired one or a plurality of MRI images and outputs a pseudo PET image at the one or a plurality of time points regarding the subject's brain.
- the information processing method of the present embodiment acquires one or a plurality of MRI images captured at one or a plurality of time points regarding the subject's brain, and when the MRI image regarding the brain is input, the pseudo PET image regarding the brain is obtained.
- the acquired one or more MRI images are input to the trained model to be output, and the pseudo PET images at the one or more time points regarding the subject's brain are output.
- the trained model generation method of the present embodiment acquires the MRI image and the PET image captured at the first time point regarding the brain, and obtains the MRI image and the PET image regarding the brain taken at the second time point after the first time point. Using the PET images acquired and the MRI and PET images captured at the first and second time points, respectively, the MRI and PET images of the brain captured at the first time point, and the above-mentioned When an MRI image of the brain captured at the second time point is input, a trained model that outputs a pseudo PET image of the brain at the second time point is generated.
- the image output device of the present embodiment inputs an MRI image and a PET image taken at the first time point regarding the brain and an MRI image about the brain taken at the second time point after the first time point, the image output device has the same.
- a pseudo PET image relating to the brain at the second time point is output.
- the computer program acquires one or more MRI images of the subject's brain taken at one or more time points.
- the MRI image is not only an MRI image obtained by an MRI apparatus (for example, a T1 weighted image, a T2 weighted image, a diffusion weighted image, a flare image, a diffusion tensor image), but also a process obtained by performing a predetermined operation on the MRI signal. It also includes images (eg, QSM images) and the like.
- the plurality of time points can be, for example, a time point for performing an MRI examination of a subject (patient).
- the trained model When the trained model inputs an MRI image at one or more time points regarding the subject's brain, it outputs a pseudo PET image at each of the one or more time points regarding the subject's brain.
- the "pseudo PET image” is a word used to distinguish it from an actual PET image, and is substantially equivalent to a PET image. Similar to the PET image, the pseudo PET image includes, for example, distribution information that visualizes the distribution of amyloid ⁇ (for example, the SUVR value for each voxel).
- SUVR Standardized Uptake Value Ratio
- SUVs Standardized Uptake Value: amyloid ⁇ protein accumulation
- cerebellar gray matter prefrontal cortex, anterior and posterior cingulate cortex, parietal lobe, and lateral temporal lobe.
- the trained model can be configured with a neural network, and for example, GAN (Generative Adversarial Network), U-net, or a combination thereof can be used.
- GAN Geneative Adversarial Network
- the pre-learning model (also simply referred to as "model") uses an MRI image of the brain as input data for learning, and a PET image at the same time as when the MRI image of the brain was captured as teacher data. Input an MRI image of the brain into the model and adjust the model parameters (eg, weights, biases, filter parameters, etc.) so that the pseudo PET image output by the model is closer to the actual PET image as teacher data. Allows you to generate a trained model.
- model parameters eg, weights, biases, filter parameters, etc.
- the pseudo PET image at one or a plurality of time points is output, it is possible to provide brain diagnostic information equivalent to the PET image without performing a PET examination.
- the computer acquires a PET image of the subject's brain captured at the first time point among the plurality of time points, and the MRI image and PET image taken at the first time point of the brain.
- a learning model that outputs a pseudo PET image of the brain at the second time point when an image and an MRI image of the brain imaged at the second time point after the first time point of the plurality of time points are input. Is input with a PET image of the subject's brain captured at the first time point, and outputs a pseudo PET image of the subject's brain at the second time point.
- the computer program acquires PET images of the subject's brain captured at the first of multiple time points.
- the first time point may be the first of multiple time points (ie, the time point of the PET examination received at the same time as the first MRI examination), or the same time point as the second or third MRI examination after the first time. good.
- the trained model When the trained model inputs an MRI image and a PET image taken at the first time point regarding the brain and an MRI image about the brain taken at the second time point after the first time point, the trained model relates to the brain at the second time point. Output a pseudo PET image. For example, when the MRI image and PET image obtained by the MRI examination and the PET examination performed at the first examination and the MRI image obtained by the second and subsequent MRI examinations are input to the trained model, the trained model is obtained. It is possible to output a pseudo PET image related to the brain at the time of the second and subsequent MRI examinations.
- the pre-learning model uses MRI and PET images captured at the first time point on the brain and MRI images taken at the second time point after the first time point as training input data, and is used as a teacher.
- the actual PET image obtained by the PET examination at the second time point is used.
- Trained models can be generated by adjusting (eg, weights, biases, filter parameters, etc.).
- the information of the MRI image and PET image at the first time point before the second time point is also used, so it reflects the change in the state of the brain. It is expected that the model can be machine-learned and the accuracy of the pseudo PET image output by the model can be improved.
- the computer program of the present embodiment causes the computer to execute a process of displaying the pseudo PET images at the plurality of time points in chronological order.
- the computer program displays pseudo PET images at multiple time points in chronological order. This makes it possible to provide brain diagnostic information while comparing pseudo PET images at a plurality of time points.
- the computer program of the present embodiment causes the computer to execute a process of generating diagnostic information based on the pseudo PET images at the plurality of time points.
- the computer program generates diagnostic information based on pseudo PET images at multiple time points. Since pseudo PET images at a plurality of time points can be obtained, it is possible to obtain diagnostic information based on not only the state of the brain at a specific time point but also changes in the state of the brain over a plurality of time points. This makes it possible to provide brain diagnostic information equivalent to a PET image without performing a PET examination.
- the diagnostic information includes a PET diagnostic index specified based on the pseudo PET images at the plurality of time points.
- the diagnostic information includes a PET diagnostic index specified based on pseudo PET images at a plurality of time points.
- the PET diagnostic index is an index that can be obtained based on a pseudo PET image, and may be, for example, the degree of accumulation (SUV) representing the accumulation of amyloid ⁇ or tau protein, or SUVR.
- the degree of accumulation of amyloid ⁇ or tau protein may be the degree of accumulation of each part of the brain, the total degree of accumulation of a plurality of parts, or the degree of accumulation in the entire brain. Since it is based on pseudo PET images at a plurality of time points, it is possible to generate diagnostic information considering the transition of accumulation of amyloid ⁇ or tau protein.
- the diagnostic information includes a brain disease diagnosis result for the subject and the PET diagnostic index for each pseudo PET image.
- the diagnostic information includes the brain disease diagnosis result and the PET diagnostic index for the subject for each pseudo PET image.
- Brain disease diagnosis results include, for example, NC (healthy elderly), MCI (mild cognitive impairment) and the like.
- the diagnostic information includes the PET diagnostic index and the PET diagnostic index of the comparison target person.
- the diagnostic information includes the PET diagnostic index and the PET diagnostic index of the comparison target.
- the PET diagnostic index for example, the average value of the PET diagnostic index by age group
- the comparative subject for example, a person with normal cognitive function
- the brain condition of the subject may be compared with that of the comparative subject of the same age. You can judge whether it is bad or bad.
- the terminal device of this embodiment is a pseudo-PET image of a subject's brain administered with a particular drug over one or more time points, amyloid accumulation over the one or more time points, and the one or more time points. Display at least one of the tau protein accumulations over.
- the terminal device may be used by a doctor or the like, or may be used by a subject (patient).
- One pseudo-PET image, or pseudo-PET image is displayed in chronological order over the administration period of a specific drug, or changes in amyloid accumulation state or amyloid accumulation, or changes in tau protein accumulation state or tau protein accumulation are displayed. Therefore, it is possible to confirm the presence or absence of the effect of the drug.
- the terminal device of the present embodiment displays adverse events related to the drug.
- Adverse events include side effects. For example, including at least one of nausea, vomiting, headache, bradycardia, angina, myocardial infarction, cerebrovascular attack, seizure attack, amyloid-related imaging abnormalities (ARIA, ARIA-E, ARIA-H, etc.), falls, etc. .. As a result, not only the efficacy of the drug but also side effects and the like can be confirmed.
Landscapes
- Health & Medical Sciences (AREA)
- Engineering & Computer Science (AREA)
- Physics & Mathematics (AREA)
- Life Sciences & Earth Sciences (AREA)
- General Physics & Mathematics (AREA)
- Medical Informatics (AREA)
- Nuclear Medicine, Radiotherapy & Molecular Imaging (AREA)
- Theoretical Computer Science (AREA)
- General Health & Medical Sciences (AREA)
- Biomedical Technology (AREA)
- High Energy & Nuclear Physics (AREA)
- Molecular Biology (AREA)
- Software Systems (AREA)
- Computer Vision & Pattern Recognition (AREA)
- Heart & Thoracic Surgery (AREA)
- Data Mining & Analysis (AREA)
- Biophysics (AREA)
- Surgery (AREA)
- Animal Behavior & Ethology (AREA)
- Public Health (AREA)
- Veterinary Medicine (AREA)
- Artificial Intelligence (AREA)
- Radiology & Medical Imaging (AREA)
- Pathology (AREA)
- Evolutionary Computation (AREA)
- Spectroscopy & Molecular Physics (AREA)
- Computing Systems (AREA)
- General Engineering & Computer Science (AREA)
- Mathematical Physics (AREA)
- Optics & Photonics (AREA)
- Nuclear Medicine (AREA)
- Magnetic Resonance Imaging Apparatus (AREA)
Abstract
Provided are a computer program, information processing device, terminal device, information processing method, learned model generation method and image output device which make it possible to provide the same brain diagnosis information as does a PET image without performing a PET exam. This computer program causes a computer to execute processing for obtaining one or more MRI images about the brain of an imaging subject and captured at one or more points in time, and when an MRI image about the brain is inputted, inputting the obtained one or more MRI images to a learned model for outputting pseudo-PET images about the brain, and outputting the pseudo-PET images about the brain of the imaging subject at the one or more points in time.
Description
本発明は、コンピュータプログラム、情報処理装置、端末装置、情報処理方法、学習済みモデル生成方法及び画像出力装置に関する。
The present invention relates to a computer program, an information processing device, a terminal device, an information processing method, a trained model generation method, and an image output device.
近年、高齢化が進み、認知症患者や認知症予備軍(軽度認知障害)の数が増加している。認知症の原因となる4大疾患には、アルツハイマー型認知症(AD)、レビー小体型認知症(DLB)、脳血管性認知症、前頭葉側頭葉変性症(FTLD)があり、その他、多発性硬化症(MS)なども認知症を含む様々な神経症状が現れる。アルツハイマー型認知症の原因は未だ解明されていないが、病状の進行に伴って脳内に特有の病変が見られる。例えば、アルツハイマー型認知症や前頭葉側頭葉変性症では、神経細胞の外側ではアミロイドβによる老人斑の沈着やタウを主とする異常タンパク質の蓄積が知られている。老人斑の沈着は、アルツハイマー型認知症の発症の最も初期段階から生じ、臨床症状が現れるかなり前(例えば、十数年前)から始まることが明らかになっている。また、脳の神経細胞にはαシヌクレインという機能不明のタンパク質が発現し、パーキンソン病をはじめとする神経変性疾患の原因とされている。
In recent years, the number of dementia patients and dementia reserves (mild cognitive impairment) is increasing due to the aging of the population. The four major diseases that cause dementia include Alzheimer-type dementia (AD), Lewy body dementia (DLB), cerebrovascular dementia, frontotemporal lobar degeneration (FTLD), and other frequent occurrences. Various neurological symptoms including dementia also appear in sclerosis (MS) and the like. The cause of Alzheimer's disease has not yet been elucidated, but as the condition progresses, peculiar lesions are found in the brain. For example, in Alzheimer-type dementia and frontotemporal lobar degeneration, it is known that amyloid β causes amyloid plaque deposition and accumulation of abnormal proteins mainly in tau on the outside of nerve cells. It has been shown that amyloid plaque deposition occurs in the earliest stages of the onset of Alzheimer's disease and begins long before clinical symptoms appear (eg, a dozen years ago). In addition, α-synuclein, a protein of unknown function, is expressed in nerve cells of the brain, which is considered to be the cause of neurodegenerative diseases such as Parkinson's disease.
特許文献1には、脳組織内のアミロイドβと結合する薬剤を被検体に注射投与し、脳を横切る裁断面上の薬剤の濃度分布を表すPET(Positron Emission Tomography)画像を用いる装置が開示されている。
Patent Document 1 discloses a device that injects a drug that binds to amyloid β in brain tissue to a subject and uses a PET (Positron Emission Tomography) image showing the concentration distribution of the drug on a cut section across the brain. ing.
しかし、薬剤を用いたPET画像の撮影は、少量とはいえ放射性物質を体内に摂取する必要があり、被爆するおそれがあり患者に負担を掛ける。また、腎臓病などの特定の疾病を患っている患者には薬剤を投与できない場合もある。さらに、一般的にPET検査の費用は高額であるという問題もある。
However, taking a PET image using a drug requires ingesting a radioactive substance into the body, even if it is a small amount, and there is a risk of being exposed to radiation, which puts a burden on the patient. In addition, the drug may not be given to patients suffering from certain diseases such as kidney disease. Further, there is also a problem that the cost of PET examination is generally high.
本発明は、斯かる事情に鑑みてなされたものであり、PET検査を行うことなくPET画像と同等の脳診断情報を提供できるコンピュータプログラム、情報処理装置、端末装置、情報処理方法、学習済みモデル生成方法及び画像出力装置を提供することを目的とする。
The present invention has been made in view of such circumstances, and is a computer program, an information processing device, a terminal device, an information processing method, and a learned model that can provide brain diagnostic information equivalent to a PET image without performing a PET examination. It is an object of the present invention to provide a generation method and an image output device.
本発明の実施の形態に係るコンピュータプログラムは、コンピュータに、被験者の脳に関する、1又は複数の時点で撮像された1又は複数のMRI画像を取得し、脳に関するMRI画像を入力した場合、前記脳に関する疑似PET画像を出力する学習済みモデルに、取得した1又は複数のMRI画像を入力して、前記被験者の脳に関する、前記1又は複数の時点での疑似PET画像を出力する、処理を実行させる。
In the computer program according to the embodiment of the present invention, when one or a plurality of MRI images taken at one or a plurality of time points regarding the subject's brain are acquired and the MRI image regarding the brain is input to the computer, the brain. The acquired one or more MRI images are input to the trained model for outputting the pseudo PET image of the subject, and the process of outputting the pseudo PET image at the one or more time points regarding the brain of the subject is executed. ..
本発明の実施の形態に係る情報処理装置は、被験者の脳に関する、1又は複数の時点で撮像された1又は複数のMRI画像を取得する取得部と、脳に関するMRI画像を入力した場合、前記脳に関する疑似PET画像を出力する学習済みモデルに、取得した1又は複数のMRI画像を入力して、前記被験者の脳に関する、前記1又は複数の時点での疑似PET画像を出力する出力部とを備える。
The information processing apparatus according to the embodiment of the present invention is the case where the acquisition unit for acquiring one or more MRI images captured at one or a plurality of time points regarding the subject's brain and the MRI image regarding the brain are input. An output unit that inputs the acquired one or more MRI images to the trained model that outputs a pseudo PET image about the brain and outputs the pseudo PET image at the one or a plurality of time points about the subject's brain. Be prepared.
本発明の実施の形態に係る端末装置は、特定の薬物を投与された被験者の脳に関する、1又は複数の時点に亘る疑似PET画像及び前記1又は複数の時点に亘るアミロイド蓄積の少なくとも一方を表示する。
The terminal device according to the embodiment of the present invention displays a pseudo PET image over one or more time points and at least one of the amyloid accumulation over one or more time points for the brain of a subject to whom a particular drug has been administered. do.
本発明の実施の形態に係る情報処理方法は、被験者の脳に関する、1又は複数の時点で撮像された1又は複数のMRI画像を取得し、脳に関するMRI画像を入力した場合、前記脳に関する疑似PET画像を出力する学習済みモデルに、取得した1又は複数のMRI画像を入力して、前記被験者の脳に関する、前記1又は複数の時点での疑似PET画像を出力する。
The information processing method according to the embodiment of the present invention acquires one or a plurality of MRI images captured at one or a plurality of time points regarding the subject's brain, and when the MRI image regarding the brain is input, the pseudo brain. The acquired one or more MRI images are input to the trained model for outputting the PET image, and the pseudo PET image at the one or more time points regarding the subject's brain is output.
本発明の実施の形態に係る学習済みモデル生成方法は、脳に関する第1時点で撮像されたMRI画像及びPET画像を取得し、前記第1時点より後の第2時点で撮像された前記脳に関するMRI画像及びPET画像を取得し、取得された、前記第1時点及び第2時点それぞれで撮像されたMRI画像及びPET画像を用いて、前記第1時点で撮像された脳に関するMRI画像及びPET画像、並びに前記第2時点で撮像された前記脳に関するMRI画像を入力した場合、前記第2時点での前記脳に関する疑似PET画像を出力する学習済みモデルを生成する。
The trained model generation method according to the embodiment of the present invention acquires MRI images and PET images captured at a first time point regarding the brain, and relates to the brain imaged at a second time point after the first time point. An MRI image and a PET image are acquired, and the MRI image and the PET image taken at the first time point and the second time point are used to obtain the MRI image and the PET image about the brain taken at the first time point. , And when an MRI image of the brain captured at the second time point is input, a trained model that outputs a pseudo PET image of the brain at the second time point is generated.
本発明の実施の形態に係る画像出力装置は、脳に関する第1時点で撮像されたMRI画像及びPET画像並びに前記第1時点より後の第2時点で撮像された前記脳に関するMRI画像を入力した場合に、前記第2時点での前記脳に関する疑似PET画像を出力する。
The image output device according to the embodiment of the present invention inputs an MRI image and a PET image taken at the first time point regarding the brain and an MRI image about the brain taken at the second time point after the first time point. In this case, a pseudo PET image relating to the brain at the second time point is output.
本発明によれば、PET検査を行うことなくPET画像と同等の脳診断情報を提供できる。
According to the present invention, it is possible to provide brain diagnostic information equivalent to a PET image without performing a PET examination.
以下、本発明の実施の形態を図面に基づいて説明する。図1は本実施の形態の情報処理システムの構成の一例を示す模式図である。情報処理システムは、情報処理装置50を備える。情報処理装置50は、通信ネットワーク1に接続されている。通信ネットワーク1には、医療従事者や研究者などが使用する端末装置10、被験者(患者)が使用する端末装置20が接続されている。端末装置10としては、例えば、パーソナルコンピュータ、スマートフォン、タブレット等を用いることができる。端末装置20としては、例えば、スマートフォン、タブレット、パーソナルコンピュータ等を用いることができる。情報処理装置50には、画像DB61、PET装置71、MRI装置72が接続されている。情報処理装置50、画像DB61、PET装置71、MRI装置72は、例えば、病院などの医療機関内に設置されている。なお、情報処理装置50、画像DB61は、医療機関などの施設以外の場所に設置されてもよい。
Hereinafter, embodiments of the present invention will be described with reference to the drawings. FIG. 1 is a schematic diagram showing an example of the configuration of the information processing system of the present embodiment. The information processing system includes an information processing device 50. The information processing device 50 is connected to the communication network 1. A terminal device 10 used by a medical worker, a researcher, or the like, and a terminal device 20 used by a subject (patient) are connected to the communication network 1. As the terminal device 10, for example, a personal computer, a smartphone, a tablet, or the like can be used. As the terminal device 20, for example, a smartphone, a tablet, a personal computer, or the like can be used. An image DB 61, a PET device 71, and an MRI device 72 are connected to the information processing device 50. The information processing device 50, the image DB 61, the PET device 71, and the MRI device 72 are installed in a medical institution such as a hospital, for example. The information processing device 50 and the image DB 61 may be installed in a place other than a facility such as a medical institution.
情報処理装置50は、情報処理装置50全体を制御する制御部51、通信部52、記憶部53、診断情報生成部54、推定部55、学習処理部56及びインタフェース部57を備える。制御部51は、CPU(Central Processing Unit)、ROM(Read Only Memory)及びRAM(Random Access Memory)などで構成することができる。情報処理装置50の各機能は、複数の装置に分散してもよい。例えば、推定部55を情報処理装置50に設け、学習処理部56を別の装置に設けてもよい。
The information processing device 50 includes a control unit 51, a communication unit 52, a storage unit 53, a diagnostic information generation unit 54, an estimation unit 55, a learning processing unit 56, and an interface unit 57 that control the entire information processing device 50. The control unit 51 can be configured by a CPU (Central Processing Unit), a ROM (Read Only Memory), a RAM (Random Access Memory), and the like. Each function of the information processing device 50 may be distributed to a plurality of devices. For example, the estimation unit 55 may be provided in the information processing device 50, and the learning processing unit 56 may be provided in another device.
通信部52は、所要の通信モジュール等で構成され、通信ネットワーク1を介して端末装置10、端末装置20との間の通信機能を提供する。通信部52は、例えば、端末装置10、端末装置20に対して、診断情報を送信することができる。端末装置10、端末装置20では、受信した診断情報を表示することができる。
The communication unit 52 is composed of a required communication module or the like, and provides a communication function between the terminal device 10 and the terminal device 20 via the communication network 1. The communication unit 52 can transmit diagnostic information to, for example, the terminal device 10 and the terminal device 20. The terminal device 10 and the terminal device 20 can display the received diagnostic information.
記憶部53は、ハードディスク、半導体メモリ等で構成することができ、情報処理装置50内の処理の結果得られたデータなどの所要のデータを記憶することができる。
The storage unit 53 can be composed of a hard disk, a semiconductor memory, or the like, and can store required data such as data obtained as a result of processing in the information processing device 50.
診断情報生成部54は、脳の診断情報、特に複数の時点に亘る脳の状態推移に基づく診断情報を生成する。診断情報の詳細は後述する。
The diagnostic information generation unit 54 generates diagnostic information of the brain, particularly diagnostic information based on the transition of the state of the brain over a plurality of time points. Details of the diagnostic information will be described later.
インタフェース部57は、画像DB61、PET(Positron Emission Tomography)装置71、MRI(Magnetic Resonance Imaging)装置72との間のインタフェース機能を提供する。インタフェース部57は、PET装置71からPET検査の結果得られたPET画像を取得することができる。本明細書において、PET画像は、アミロイドPET及びタウPETの両方を含む。インタフェース部57は、MRI装置72からMRI検査の結果得られたMRI画像を取得することができる。なお、MRI画像はMR画像とも称する。
The interface unit 57 provides an interface function between the image DB 61, the PET (Positron Emission Tomography) device 71, and the MRI (Magnetic Resonance Imaging) device 72. The interface unit 57 can acquire a PET image obtained as a result of the PET inspection from the PET device 71. As used herein, PET images include both amyloid PET and tau PET. The interface unit 57 can acquire an MRI image obtained as a result of an MRI examination from the MRI apparatus 72. The MRI image is also referred to as an MR image.
推定部55は、脳状態の推定処理を行う機能を有し、入力データ生成部551及びモデル部552を備える。モデル部552は、半導体メモリ又はハードディスク等で構成され、機械学習によって生成されたモデル(学習済みのモデル)を格納している。学習済みモデルは、例えば、学習済みモデルは、ニューラルネットワークで構成することができ、例えば、GAN(Generative Adversarial Network)やU-net、あるいはこれらの組み合わせを用いることができる。入力データ生成部551は、脳状態の推定処理を行う際に学習モデルに入力するデータを生成する。
The estimation unit 55 has a function of estimating the brain state, and includes an input data generation unit 551 and a model unit 552. The model unit 552 is composed of a semiconductor memory, a hard disk, or the like, and stores a model (learned model) generated by machine learning. As the trained model, for example, the trained model can be configured by a neural network, and for example, GAN (Generative Adversarial Network), U-net, or a combination thereof can be used. The input data generation unit 551 generates data to be input to the learning model when performing the brain state estimation process.
学習処理部56は、機械学習により学習済みモデルを生成する機能を有し、学習データ生成部561、モデル部562、及びパラメータ決定部563を備える。モデル部562は、半導体メモリ又はハードディスク等で構成され、機械学習前のモデルを格納している。学習処理部56で機械学習を行って生成された学習済みモデルは、推定部55のモデル部552に格納することができる。なお、モデル部562に、機械学習途中のモデル、再学習用のモデル、学習済みのモデルを格納してもよい。また、学習処理部56は必須の構成ではなく、学習処理部56を別の学習装置に具備する構成でもよい。学習データ生成部561は、学習済みモデルを生成する際に、学習用入力データ及び教師データを生成する。パラメータ決定部563は、学習済みモデルを生成する際に、ニューラルネットワークのパラメータ(例えば、重み、バイアス、フィルタのパラメータなど)を調整し、最終的にパラメータを決定する。
The learning processing unit 56 has a function of generating a trained model by machine learning, and includes a learning data generation unit 561, a model unit 562, and a parameter determination unit 563. The model unit 562 is composed of a semiconductor memory, a hard disk, or the like, and stores a model before machine learning. The trained model generated by performing machine learning in the learning processing unit 56 can be stored in the model unit 552 of the estimation unit 55. The model unit 562 may store a model in the middle of machine learning, a model for re-learning, and a model that has been trained. Further, the learning processing unit 56 is not an indispensable configuration, and may be configured to include the learning processing unit 56 in another learning device. The training data generation unit 561 generates training input data and teacher data when generating a trained model. The parameter determination unit 563 adjusts the parameters of the neural network (for example, weights, biases, filter parameters, etc.) when generating the trained model, and finally determines the parameters.
学習処理部56は、例えば、CPU(例えば、複数のプロセッサコアを実装したマルチ・プロセッサなど)、GPU(Graphics Processing Units)、DSP(Digital Signal Processors)、FPGA(Field-Programmable Gate Arrays)などのハードウェアを組み合わせることによって構成することができる。
The learning processing unit 56 is, for example, a hardware such as a CPU (for example, a multi-processor having a plurality of processor cores mounted), a GPU (Graphics Processing Units), a DSP (Digital Signal Processors), an FPGA (Field-Programmable Gate Arrays), or the like. It can be configured by combining wear.
画像DB61は、学習済みモデルを生成する際に、機械学習で使用する各種画像(例えば、MRI画像、PET画像など)を記録しておくことができる。また、画像DB61は、情報処理装置50が生成した疑似PET画像を記録することができる。なお、本明細書では、疑似PET画像を文字通り疑似PET画像とも称する。
The image DB 61 can record various images (for example, MRI image, PET image, etc.) used in machine learning when generating a trained model. Further, the image DB 61 can record a pseudo PET image generated by the information processing apparatus 50. In addition, in this specification, a pseudo PET image is also literally referred to as a pseudo PET image.
情報処理装置50は、端末装置10を操作する医師等から、脳の診断情報を生成するために必要な、患者情報(被験者情報)、MRI画像、PET画像(PET画像の有無も含む)、初回診察であるか否か、診察年月日、有害事象(副作用を含む。例えば、悪心、嘔吐、頭痛、徐脈、狭心症、心筋梗塞、脳血管発作、痙攣発作、アミロイド関連画像異常(ARIA、ARIA-E、ARIA-Hなど)、転倒など)、バイオマーカー(FDG-PET、タウ蛋白、血液検査結果、遺伝子情報など)、認知力テストの結果等の情報を取得することができる。認知力テストは、脳の認知機能をチェックするためのテストである。認知力テストの内容は、例えば、足し算や引き算などの計算、ストループ、N-Back、単語早記などを挙げることができるが、これらに限られない。認知力テストの具体例は、例えば、「順唱」及び「逆唱」に関するテスト、「ストループ」に関するテスト、「足し算」及び「引き算」に関するテスト、N-Back(例えば、1-Back)に関するテスト、「即時再生」(単語想起)に関するテストを挙げることができる。なお、認知力テストはこれらに限定されず、脳の健康状態(認知機能の状態並びに脳疾患及び精神疾患の有無及び程度を含む)を測定する検査またはテストその他の同様の形式の検査またはテストを採用してもよい。なお、上述の情報は、医師等が使用する端末装置10、被験者(患者)が使用する端末装置20のいずれにも表示することができる。
The information processing device 50 includes patient information (subject information), MRI image, PET image (including presence / absence of PET image), and initial time, which are necessary for generating diagnostic information of the brain from a doctor or the like who operates the terminal device 10. Whether or not it is a medical examination, date of medical examination, adverse events (including side effects, such as nausea, vomiting, headache, slow pulse, angina, myocardial infarction, cerebrovascular attack, spasm attack, amyloid-related imaging abnormality (ARIA) , ARIA-E, ARIA-H, etc.), falls, etc.), biomarkers (FDG-PET, tau protein, blood test results, genetic information, etc.), cognitive test results, and the like can be obtained. The cognitive test is a test for checking the cognitive function of the brain. The content of the cognitive test includes, for example, calculations such as addition and subtraction, Stroop, N-Back, and word prescription, but is not limited thereto. Specific examples of the cognitive test include, for example, a test for "forward" and "reverse", a test for "Stroop", a test for "addition" and "subtraction", and a test for N-Back (for example, 1-Back). , Can be mentioned as a test for "immediate reproduction" (word recall). The cognitive ability test is not limited to these, and a test or test for measuring the state of brain health (including the state of cognitive function and the presence and degree of brain disease and mental illness) or other similar type of test or test is performed. It may be adopted. The above information can be displayed on either the terminal device 10 used by a doctor or the like or the terminal device 20 used by a subject (patient).
次に、情報処理装置50による脳診断情報の生成方法の詳細について説明する。脳診断情報は、脳に関連する疾患、アミロイドβ、タウ蛋白又はαシヌクレイン(αシヌクレイン凝集体ともいう)に関連する疾患に関する診断情報である。例えば、脳に関連する疾患は、認知症や多発性硬化症などである。また、アミロイドβ又はタウ蛋白に関連する疾患は、例えば、軽度認知障害(MCI:Mild cognitive impairment)、アルツハイマー病による軽度認知障害(MCIdue to AD)、前駆期アルツハイマー病(prodromal AD)、アルツハイマー病の発症前段階/プレクリニカルAD(preclinical AD)、パーキンソン病、多発性硬化症、不眠症、睡眠障害、認知機能の低下、認知機能障害、アミロイド陽性/陰性に係る疾患、運動障害、運動障害疾患などの神経変性疾患を含む。αシヌクレインに関連する疾患は、例えば、アルツハイマー病(アミロイド斑)、認知症(レビー小体)、シヌクレイノパチー(ニューロン、神経線維、グリア細胞におけるタンパク質凝集体)、多系統萎縮症、パーキンソン病(レビー小体)、運動機能障害などを含む。具体的には、1又は複数のMRI検査の時点に得られた各MRI画像に基づいて、各MRI検査時点での疑似PET画像を生成することによりPET画像を推定して、脳の診断情報を提供する。MRI検査時点は、医師の指示に基づく初回のMRI検査以降、継続して行われるMRI検査時点である。
Next, the details of the method of generating the brain diagnostic information by the information processing apparatus 50 will be described. The brain diagnostic information is diagnostic information regarding a disease related to the brain, amyloid β, tau protein, or a disease related to α-synuclein (also referred to as α-synuclein aggregate). For example, diseases related to the brain include dementia and multiple sclerosis. Diseases related to amyloid β or tau protein include, for example, mild cognitive impairment (MCI: Mild cognitive impairment), mild cognitive impairment due to Alzheimer's disease (MCIdue to AD), prodromal AD, and Alzheimer's disease. Presymptomatic stage / preclinical AD, Parkinson's disease, multiple sclerosis, insomnia, sleep disorders, cognitive decline, cognitive impairment, amyloid positive / negative disorders, motor disorders, motor disorders, etc. Including neurodegenerative diseases. Diseases associated with alpha-synuclein include, for example, Alzheimer's disease (amyloid plaque), dementia (Lewy bodies), synucleinopathy (protein aggregates in neurons, nerve fibers, glial cells), multiple system atrophy, Parkinson's disease. (Lewy bodies), including motor dysfunction. Specifically, based on each MRI image obtained at the time of one or a plurality of MRI examinations, the PET image is estimated by generating a pseudo PET image at each MRI examination time point, and the diagnostic information of the brain is obtained. offer. The MRI examination time point is the MRI examination time point which is continuously performed after the first MRI examination based on the instruction of the doctor.
MRI画像は、MRI装置72で得られるMRI画像(例えば、T1強調画像、T2強調画像、拡散強調画像、フレア画像、拡散テンソル画像)のみならず、MRI信号に所定の演算を施すことによって得られる加工画像(例えば、QSM画像)なども含む。「疑似PET画像」は、実際のPET画像と区別する意味で用いる文言であるが、本明細書においては、PET画像と同様の画像を意味するのみならず、画像から推定できる数値情報も含むものとする。すなわち、「疑似」とは、画像自体だけでなく、画像から得られる情報(数値情報など)も含むことを表す。例えば、疑似PET画像は、アミロイドPET画像やタウPET画像、αシヌクレイン凝集体画像と同様の画像を含めてもよい。また、疑似PET画像は、センチロイド値を含めてもよい。センチロイド(Centiloid)は、アミロイドPETにおいて、同じアミロイドの蓄積具合でも、PET薬剤によってcompositeSUVRの値が異なるので、これを薬剤に依らない値によって標準化したものである。例えば、脳内アミロイドの蓄積の度合いを若年健常者の平均を0とし、確実なADの平均を100として、0から100までの数値で表現することができる。センチロイドは、MRI画像から直接推定することができ、あるいは、MRI画像から推定されたアミロイドβの分布情報を介して推定することもできる。すなわち、疑似PET画像は、例えば、アミロイドPET画像をSUVRと称する指標で定量し、センチロイド法と呼ばれる標準化手法で補正された数値情報も含む。また、疑似PET画像は、PET画像と同様に、例えば、脳内のアミロイドβ、タウ蛋白又はαシヌクレインの分布を可視化した分布情報(例えば、ボクセル毎のSUVR値)を含む。SUVR(Standardized Uptake Value Ratio)は、一般的に、ボクセル毎のSUVR(voxelSUVR)、部位毎のSUVR(regional SUVR)、関心領域内のSUVR(composite SUVR)などが含まれるが、本明細書においては、いずれのSUVRを用いてもよい。すなわち、本明細書において、SUVRとの記載は、前述のいずれのSUVRも含むものとする。例えば、composite SUVRは、関心領域としての大脳灰白質の4つの部位(前頭前野、前後帯状皮質、頭頂葉、及び外側側頭葉)のSUV(Standardized Uptake Value:アミロイドβ蛋白の集積度)の合算を、特定の参照領域(例えば、小脳など)のSUVで除算することにより求めることができる。アミロイドβ、タウ蛋白又はαシヌクレインの集積度(SUV)は、例えば、所要部位を構成する各ボクセルの輝度を示す値が所定の閾値以上であるボクセルの数をカウントすることにより求めることができる。所要部位の総ボクセル数に対するカウント値の比率により集積(例えば、OO%等)が算出できる。ボクセル毎のSUVRは、あるボクセルのSUVを参照領域(例えば、小脳など)におけるSUVの平均値で除算した値である。部位毎のSUVRは、ある部位のSUVを参照領域(例えば、小脳など)におけるSUVの平均値で除算した値である。
The MRI image is obtained by performing a predetermined calculation on the MRI signal as well as the MRI image (for example, T1 weighted image, T2 weighted image, diffusion weighted image, flare image, diffusion tensor image) obtained by the MRI apparatus 72. It also includes processed images (eg, QSM images) and the like. The term "pseudo-PET image" is used to distinguish it from an actual PET image, but in the present specification, it means not only an image similar to a PET image but also numerical information that can be estimated from the image. .. That is, "pseudo" means that not only the image itself but also information (numerical information, etc.) obtained from the image is included. For example, the pseudo PET image may include an image similar to an amyloid PET image, a tau PET image, or an α-synuclein aggregate image. Further, the pseudo PET image may include a centiroid value. In amyloid PET, the value of composite SUVR differs depending on the PET drug even if the accumulation of the same amyloid is the same, so that this is standardized by the value that does not depend on the drug. For example, the degree of accumulation of amyloid in the brain can be expressed by a numerical value from 0 to 100, where the average of healthy young people is 0 and the average of reliable AD is 100. Sentiloid can be estimated directly from the MRI image, or can be estimated via the distribution information of amyloid β estimated from the MRI image. That is, the pseudo PET image also includes, for example, numerical information obtained by quantifying an amyloid PET image with an index called SUVR and correcting it by a standardization method called a centiroid method. Further, the pseudo PET image includes distribution information (for example, UVVR value for each voxel) that visualizes the distribution of amyloid β, tau protein or α-synuclein in the brain, as in the PET image. The SUVR (Standardized Uptake Value Ratio) generally includes a SUVR (voxelUVR) for each boxel, a SUVR (regional SUVR) for each site, a SUVR (composite UVR) within a region of interest, and the like, but in the present specification. , Any SUVR may be used. That is, in the present specification, the description of SUVR shall include any of the above-mentioned SUVRs. For example, composite SUVR is the sum of SUVs (Standardized Uptake Value: amyloid β protein accumulation) of four sites of cerebellar gray matter (prefrontal cortex, anterior and posterior cingulate cortex, parietal lobe, and lateral temporal lobe) as regions of interest. Can be determined by dividing by the SUV of a particular reference region (eg, cerebellum, etc.). The degree of accumulation (SUV) of amyloid β, tau protein or α-synuclein can be determined, for example, by counting the number of voxels in which the value indicating the brightness of each voxel constituting the required site is equal to or higher than a predetermined threshold value. Accumulation (for example, OO%) can be calculated from the ratio of the count value to the total number of voxels of the required part. The SUVR for each voxel is a value obtained by dividing the SUV of a certain voxel by the average value of the SUV in the reference region (for example, the cerebellum). The SUVR for each site is a value obtained by dividing the SUV of a certain site by the average value of the SUV in the reference region (for example, the cerebellum).
図2は推定部55によるPET画像推定方法の第1例を示す模式図である。モデル部552は、学習済みモデルであり、モデルは、ニューラルネットワーク(例えば、CNN:Convolutional Neural Network)で構成され、GAN(Generative Adversarial Network)やU-net、あるいはこれらの組み合わせを用いることができる。モデル部552は、入力層、中間層、出力層を備え、機械学習によって、ニューラルネットワークのパラメータ(重み、バイアス、フィルタのパラメータなど)が決定されている。入力データ生成部551は、インタフェース部57を介してMRI装置72から取得したMRI画像を入力データとしてモデル部552に入力する。
FIG. 2 is a schematic diagram showing a first example of the PET image estimation method by the estimation unit 55. The model unit 552 is a trained model, and the model is composed of a neural network (for example, CNN: Convolutional Neural Network), and GAN (Generative Adversarial Network), U-net, or a combination thereof can be used. The model unit 552 includes an input layer, an intermediate layer, and an output layer, and neural network parameters (weights, biases, filter parameters, etc.) are determined by machine learning. The input data generation unit 551 inputs the MRI image acquired from the MRI apparatus 72 via the interface unit 57 to the model unit 552 as input data.
図2に示すように、時点t1でのMRI画像をモデル部552に入力すると、モデル部552は、時点t1での疑似PET画像を出力する。同様に、時点t2でのMRI画像をモデル部552に入力すると、モデル部552は、時点t2での疑似PET画像を出力する。以下、同様に、時点tNでのMRI画像をモデル部552に入力すると、モデル部552は、時点tNでの疑似PET画像を出力する。時点t1、t2、t3、t4、…、tNは、被験者(患者)のMRI検査時点とすることができる。隣り合う時点間の時間間隔は、通常のMRI検査の時間間隔であり、例えば、6か月、1年などとすることができる。なお、図2では、時点t1、t2、t3、t4、…、tNでのMRI画像が同時にモデル部552に入力されているように表現されているが、その必要はなく、MRI検査によってMRI画像が得られる都度に、MRI画像をモデル部552に入力すればよい。
As shown in FIG. 2, when the MRI image at the time point t1 is input to the model unit 552, the model unit 552 outputs a pseudo PET image at the time point t1. Similarly, when the MRI image at the time point t2 is input to the model unit 552, the model unit 552 outputs a pseudo PET image at the time point t2. Hereinafter, similarly, when the MRI image at the time point tN is input to the model unit 552, the model unit 552 outputs the pseudo PET image at the time point tN. Time points t1, t2, t3, t4, ..., TN can be the time points of the MRI examination of the subject (patient). The time interval between adjacent time points is the time interval of a normal MRI examination, and can be, for example, 6 months or 1 year. In FIG. 2, it is expressed that the MRI images at the time points t1, t2, t3, t4, ..., TN are simultaneously input to the model unit 552, but it is not necessary and the MRI image is not necessary. The MRI image may be input to the model unit 552 each time.
疑似PET画像は、実際のPET画像を推定する画像である。PET画像は、脳内のアミロイドβ、タウ蛋白又はαシヌクレインの分布を画像化したものである。アミロイドβやタウ蛋白は、軽度認知障害(MCI:Mild cognitive impairment)、アルツハイマー病による軽度認知障害(MCIdue to AD)、前駆期アルツハイマー病(prodromal AD)、アルツハイマー病の発症前段階/プレクリニカルAD(preclinical AD)、パーキンソン病、多発性硬化症、不眠症、睡眠障害、認知機能の低下、認知機能障害、アミロイド陽性/陰性に係る疾患などの神経変性疾患などの患者の脳内にみられる異常な蛋白質である。アミロイドβ、タウ蛋白又はαシヌクレインの蓄積を確認する目的で行われるPET検査では、検査用の薬剤を静脈注射で患者に投与し、薬剤がアミロイドβ、タウ蛋白又はαシヌクレインと特異的に吸着することで脳内のアミロイドβ、タウ蛋白又はαシヌクレインの分布状態を観察することができる。
The pseudo PET image is an image that estimates the actual PET image. PET images are images of the distribution of amyloid β, tau protein or α-synuclein in the brain. Amyloid β and tau protein are mild cognitive impairment (MCI: Mild cognitive impairment), mild cognitive impairment due to Alzheimer's disease (MCIdue to AD), prodromal AD, pre-symptomatic stage of Alzheimer's disease / preclinical AD (preclinical AD). Abnormalities found in the brain of patients such as preclinical AD), Parkinson's disease, multiple sclerosis, insomnia, sleep disorders, cognitive decline, cognitive impairment, and neurodegenerative diseases such as amyloid positive / negative disorders. It is a protein. In the PET test performed for the purpose of confirming the accumulation of amyloid β, tau protein or α-synuclein, the test drug is administered to the patient by intravenous injection, and the drug specifically adsorbs amyloid β, tau protein or α-synuclein. This makes it possible to observe the distribution of amyloid β, tau protein or α-synuclein in the brain.
診断情報生成部54は、モデル部552が出力する時点t1、t2、t3、t4、…、tNでの疑似PET画像に基づいて診断情報を生成する。複数の時点での疑似PET画像が得られるので、ある特定の時点の脳の状態(具体的には、アミロイドβ、タウ蛋白又はαシヌクレインの分布状態)だけでなく、複数の時点に亘る脳の状態の変化に基づく診断情報を得ることができる。これにより、PET検査を行うことなくPET画像と同等の脳診断情報を提供できる。なお、診断情報の詳細は後述する。
The diagnostic information generation unit 54 generates diagnostic information based on the pseudo PET images at the time points t1, t2, t3, t4, ..., TN output by the model unit 552. Since pseudo-PET images at multiple time points are obtained, not only the state of the brain at a specific time point (specifically, the distribution state of amyloid β, tau protein or α-synuclein) but also the state of the brain over multiple time points. Diagnostic information based on changes in state can be obtained. This makes it possible to provide brain diagnostic information equivalent to a PET image without performing a PET examination. The details of the diagnostic information will be described later.
図3は推定部55によるPET画像推定方法の第2例を示す模式図である。図2に示す第1例との相違は、入力データとして、MRI画像に加えて、時点t1でのPET画像がモデル部552に入力される。時点t1でのPET画像は、時点t1でのMRI検査と同じタイミングで行われたPET検査によって得られたものである。なお、MRI検査の時点t1とPET検査の時点t1とは、必ずしも同じタイミングである必要はなく、数日程度、数週間程度又は数か月程度の時間差があってもよい。また、図3の例では、PET画像は、時点t1でのものであるが、時点t1に限定されるものではなく、時点t2や時点t3などでもよい。初回のMRI検査のときにPET検査も行うとは限らず、患者の症状に応じて2回目や3回目のMRI検査のときにPET検査を行う場合もあるからである。
FIG. 3 is a schematic diagram showing a second example of the PET image estimation method by the estimation unit 55. The difference from the first example shown in FIG. 2 is that, in addition to the MRI image, the PET image at the time point t1 is input to the model unit 552 as input data. The PET image at time point t1 is obtained by a PET examination performed at the same timing as the MRI examination at time point t1. The time point t1 of the MRI examination and the time point t1 of the PET examination do not necessarily have to be the same timing, and there may be a time difference of about several days, about several weeks, or about several months. Further, in the example of FIG. 3, the PET image is at the time point t1, but is not limited to the time point t1, and may be a time point t2, a time point t3, or the like. This is because the PET examination is not always performed at the time of the first MRI examination, and the PET examination may be performed at the second or third MRI examination depending on the patient's symptoms.
モデル部552は、脳に関する第1時点(図の例では、時点t1)で撮像されたMRI画像及びPET画像並びに第1時点より後の第2時点(図の例では、時点t2、t3、t4、…、tN)で撮像された脳に関するMRI画像を入力した場合、第2時点図の例では、時点t2、t3、t4、…、tN)での当該脳に関する疑似PET画像を出力することができる。例えば、初回の診察時に行ったMRI検査とPET検査それぞれによって得られたMRI画像及びPET画像、さらに、2回目以降のMRI検査によって得られたMRI画像をモデル部552に入力すると、モデル部552は、2回目以降のMRI検査時の脳に関する疑似PET画像を出力することができる。
The model unit 552 includes MRI and PET images captured at the first time point (time point t1 in the example of the figure) and the second time point (time point t2, t3, t4 in the example of the figure) after the first time point with respect to the brain. , ..., When an MRI image of the brain imaged at tN) is input, in the example of the second time point diagram, a pseudo PET image of the brain at time points t2, t3, t4, ..., TN) can be output. can. For example, when the MRI image and PET image obtained by the MRI examination and the PET examination performed at the first examination and the MRI image obtained by the second and subsequent MRI examinations are input to the model unit 552, the model unit 552 It is possible to output a pseudo PET image related to the brain at the time of the second and subsequent MRI examinations.
図2に示すような、単にモデル部552に時点t1~tNでのMRI画像を入力する場合に比べて、時点t1での実際のPET画像の情報も使用されるので、被験者の初期の段階での脳内のアミロイドβ、タウ蛋白又はαシヌクレインの分布状態が考慮され、モデル部552が出力する疑似PET画像の精度を高めることが期待される。
Compared to the case where the MRI image at the time points t1 to tN is simply input to the model unit 552 as shown in FIG. 2, the information of the actual PET image at the time point t1 is also used, so that the subject is in the initial stage. Considering the distribution state of amyloid β, tau protein or α-synuclein in the brain, it is expected that the accuracy of the pseudo PET image output by the model unit 552 will be improved.
次に、学習済みモデルの生成方法について説明する。
Next, the method of generating the trained model will be explained.
図4は学習処理部56での学習済みモデルの生成方法の第1例を示す模式図である。図4に示す学習済みモデルの生成方法は、図2のモデル部552の生成方法に対応している。図4に示すように、学習用入力データとして、健常者及び脳に関連する疾患やアミロイドβ、タウ蛋白又はαシヌクレインに関連する疾患の患者を含む多くの対象者の脳に関する時点tnでのMRI画像を用い、教師データとして当該の脳の時点tnでのPET画像を用いる。ここで、nはn=1、2、…、Nとすることができる。なお、対象者毎に時点tnは異なっていてもよいが、一人の対象者についてのMRI画像とPET画像の時点は同じ時点とする。ただし、MRI画像の時点tnとPET画像の時点tnとは、必ずしも同じタイミングである必要はなく、数日程度、数週間程度又は数か月程度の時間差があってもよい。
FIG. 4 is a schematic diagram showing a first example of a method of generating a trained model in the learning processing unit 56. The method of generating the trained model shown in FIG. 4 corresponds to the method of generating the model unit 552 of FIG. As shown in FIG. 4, as learning input data, MRI at time point nt regarding the brain of many subjects including healthy subjects and patients with diseases related to brain and amyloid β, tau protein or α-synuclein-related diseases. The image is used, and the PET image at the time point nt of the relevant brain is used as the teacher data. Here, n can be n = 1, 2, ..., N. The time point nt may be different for each target person, but the time points of the MRI image and the PET image for one target person are the same time point. However, the time point nt of the MRI image and the time point nt of the PET image do not necessarily have to be at the same timing, and there may be a time difference of about several days, about several weeks, or about several months.
モデル部562に脳に関する時点tnでのMRI画像を入力し、モデル部562が出力する疑似PET画像が教師データとしての時点tnでの実際のPET画像に近づくように(疑似PET画像と実際のPET画像とに基づく損失関数の値が最小になるように)、モデル部562のパラメータ(例えば、重みwij、バイアスbkl、フィルタのパラメータなど)を調整することにより、学習済みモデルを生成することができる。
An MRI image at the time point nt regarding the brain is input to the model part 562, and the pseudo PET image output by the model part 562 approaches the actual PET image at the time point nt as teacher data (pseudo PET image and actual PET). A trained model can be generated by adjusting the parameters of the model unit 562 (eg, weight wij, bias bkl, filter parameters, etc.) so that the value of the loss function based on the image is minimized). ..
図5は学習処理部56での学習済みモデルの生成方法の第2例を示す模式図である。図5に示す学習済みモデルの生成方法は、図3のモデル部552の生成方法に対応している。図4に示す第1例との相違点では、第2例では、時点t1でのPET画像を学習用入力データとして用いる点である。
FIG. 5 is a schematic diagram showing a second example of a method of generating a trained model in the learning processing unit 56. The method of generating the trained model shown in FIG. 5 corresponds to the method of generating the model unit 552 of FIG. The difference from the first example shown in FIG. 4 is that in the second example, the PET image at the time point t1 is used as the input data for learning.
図5に示すように、学習用入力データとして、健常者及び認知症患者を含む多くの対象者の脳に関する第1時点(図の例では時点t1)で撮像されたMRI画像及びPET画像、並びに第1時点より後の第2時点(図の例では、時点tn、n=2、3、…、N)で撮像された当該脳に関するMRI画像を用い、教師データとして当該第2時点(図の例では、時点tn、n=2、3、…、N)のPET検査により得られた実際のPET画像を用いる。
As shown in FIG. 5, as learning input data, MRI images and PET images taken at the first time point (time point t1 in the example of the figure) regarding the brains of many subjects including healthy subjects and dementia patients, and Using the MRI image of the brain taken at the second time point (in the example of the figure, time point nt, n = 2, 3, ..., N) after the first time point, the second time point (in the figure) is used as teacher data. In the example, the actual PET image obtained by the PET examination at time points nt, n = 2, 3, ..., N) is used.
モデル部562に脳に関する第1時点でのMRI画像及びPET画像並びに第2時点でのMRI画像を入力し、モデル部562が出力する疑似PET画像が教師データとしての実際のPET画像に近づくように(疑似PET画像と実際のPET画像とに基づく損失関数の値が最小になるように)、モデル部562のパラメータ(例えば、重みwij、バイアスbkl、フィルタのパラメータなど)を調整することにより、学習済みモデルを生成することができる。
The MRI image and PET image at the first time point and the MRI image at the second time point regarding the brain are input to the model unit 562 so that the pseudo PET image output by the model unit 562 approaches the actual PET image as the teacher data. Learning by adjusting the parameters of the model unit 562 (eg, weight wij, bias bkl, filter parameters, etc.) (so that the value of the loss function based on the pseudo PET image and the actual PET image is minimized). You can generate a finished model.
単にモデル部562に第2時点(図の例では、時点tn、n=2、3、…、N)でのMRI画像を入力する場合に比べて、第2時点よりも前の第1時点(図の例では、時点t1)でのMRI画像及びPET画像の情報も使用されるので、初期の段階での脳内のアミロイドβ、タウ蛋白又はαシヌクレインの分布状態を考慮してモデル部562を機械学習させることができ、学習済みモデルが出力する疑似PET画像の精度を高めることが期待される。
Compared to the case where the MRI image at the second time point (in the example of the figure, time point tn, n = 2, 3, ..., N) is simply input to the model unit 562, the first time point before the second time point (in the example of the figure). In the example of the figure, the information of the MRI image and the PET image at the time point t1) is also used, so the model unit 562 is set in consideration of the distribution state of amyloid β, tau protein or α-synuclein in the brain at the initial stage. It can be machine-learned, and it is expected that the accuracy of the pseudo PET image output by the trained model will be improved.
次に、脳に関する診断情報の詳細について説明する。以下では、端末装置10、端末装置20それぞれで表示される診断情報について説明する。まず、医療従事者や研究者など(以下、「医師等」ともいう)が使用する端末装置10に表示される診断情報について説明する。
Next, the details of the diagnostic information about the brain will be explained. Hereinafter, the diagnostic information displayed on each of the terminal device 10 and the terminal device 20 will be described. First, diagnostic information displayed on the terminal device 10 used by medical professionals, researchers, and the like (hereinafter, also referred to as “doctors and the like”) will be described.
図6は医師等の端末装置10に表示する診断情報の第1例を示す模式図である。図6に示すように、診断情報101には、ある患者に対する初回、2回目、3回目及び4回目での疑似PET画像が含まれる。なお、初回にPET検査を行って実際のPET画像が得られている場合には、初回の疑似PET画像に代えて実際のPET画像を表示すればよい。この場合、実際のPET画像であるか疑似PET画像であるかを識別するための識別子(マーク)を表示することができる。また、疑似PET画像の数は4に限定されない。初回と2回目との間の時間間隔は、例えば、2年とし、2回目以降の間隔は1年などとすることができるが、これらに限定されない。各疑似PET画像には、脳内の所要部位におけるアミロイドβ、タウ蛋白又はαシヌクレインの分布状態が可視化されている。診断情報101には、患者に対する認知症診断結果が含まれる。認知症診断結果は、認知力テストなどの結果を医師が総合的に判断したものであり、必ずしも疑似PET画像のみで判断されたものではない。図の例では、初回時はNC(Normal Control、健常者、健常老年者等)と判断されているが、2回目以降はMCI(軽度認知障害)と判断されている。診断情報101には、患者に対するアミロイド蓄積の状態が含まれる。アミロイド蓄積の状態は、図示するように、脳内の所要部位(例えば、大脳皮質など)におけるアミロイドβの蓄積の有無でもよく、あるいは、アミロイドβの集積度(SUV)でもよい。なお、図示していないが、アミロイド蓄積に代えて、あるいはアミロイド蓄積に加えて、タウ蛋白又はαシヌクレインなどの異常タンパク質の蓄積の有無や集積度を表示してもよい。
FIG. 6 is a schematic diagram showing a first example of diagnostic information displayed on a terminal device 10 of a doctor or the like. As shown in FIG. 6, the diagnostic information 101 includes first, second, third, and fourth pseudo PET images for a patient. When the actual PET image is obtained by performing the PET examination for the first time, the actual PET image may be displayed instead of the pseudo PET image for the first time. In this case, an identifier (mark) for identifying whether the image is an actual PET image or a pseudo PET image can be displayed. Further, the number of pseudo PET images is not limited to four. The time interval between the first time and the second time may be, for example, two years, and the interval after the second time may be one year, and the like, but the time interval is not limited thereto. In each pseudo PET image, the distribution state of amyloid β, tau protein or α-synuclein at a required site in the brain is visualized. The diagnostic information 101 includes the dementia diagnosis result for the patient. The dementia diagnosis result is a comprehensive judgment of the result of a cognitive ability test or the like by a doctor, and is not necessarily judged only by a pseudo PET image. In the example of the figure, it is judged as NC (Normal Control, healthy person, healthy elderly person, etc.) at the first time, but it is judged as MCI (mild cognitive impairment) after the second time. Diagnostic information 101 includes a state of amyloid accumulation for the patient. As shown in the figure, the state of amyloid accumulation may be the presence or absence of amyloid β accumulation at a required site in the brain (for example, cerebral cortex), or may be the degree of amyloid β accumulation (SUV). Although not shown, the presence / absence and degree of accumulation of abnormal proteins such as tau protein or α-synuclein may be displayed instead of or in addition to amyloid accumulation.
アミロイドβによる老人斑の沈着は、アルツハイマー病発症過程の最も初期段階から生じる病理学的変化であると考えられており、臨床症状が現れる十数年前から始まると言われている。図6に示すように、NCの場合でも、アミロイドβの分布が顕著になる可能性が高い(図の例では、アミロイド蓄積「あり」)。このように、認知症の自覚症状がない早期の段階において、MCIの早期診断が容易になる。
Amyloid β-induced amyloid plaque deposition is thought to be a pathological change that occurs from the earliest stages of the onset of Alzheimer's disease, and is said to begin more than a dozen years before clinical symptoms appear. As shown in FIG. 6, even in the case of NC, the distribution of amyloid β is likely to be remarkable (in the example of the figure, amyloid accumulation is “present”). Thus, early diagnosis of MCI is facilitated at an early stage when there is no subjective symptom of dementia.
また、老人斑は、新皮質の基底部から蓄積し始め、徐々に大脳皮質の全域に広がる。従って、MCI(軽度認知障害)において、疑似PET画像の時系列表示、あるいは時系列に得られた疑似PET画像に基づくアミロイドβの分布状態の推移を観察することにより、AD(アルツハイマー病)の発症を予見できる可能性が高い。図6の例では、4回目における疑似PET画像から得られる、大脳皮質でのアミロイドβの集積度が所定の閾値より高いので、AD発症の可能性が「あり」と診断されている。このように、アルツハイマー病発症前のMCIの段階において、将来のAD発症の有無を推測することができる。また、タウ蛋白の脳内蓄積は、アミロイドβよりも神経細胞の脱落や記憶障害と密接に関連すると考えられ、認知症初期段階における重症度を評価できることが期待される。また、過剰なαシヌクレインは、いずれ神経細胞を死に至らしめ、運動機能障害などの症状を引き起こすことから、神経細胞内でのαシヌクレインの過剰発現は、例えば、パーキンソン病の初期段階で生じていると考えられている。
In addition, amyloid plaque begins to accumulate from the base of the neocortex and gradually spreads over the entire cerebral cortex. Therefore, in MCI (mild cognitive impairment), AD (Alzheimer's disease) develops by observing the time-series display of pseudo-PET images or the transition of the distribution state of amyloid β based on the pseudo-PET images obtained in chronological order. Is likely to be foreseen. In the example of FIG. 6, since the accumulation degree of amyloid β in the cerebral cortex obtained from the pseudo PET image at the 4th time is higher than a predetermined threshold value, the possibility of developing AD is diagnosed as “possible”. In this way, it is possible to infer the presence or absence of future AD onset at the stage of MCI before the onset of Alzheimer's disease. In addition, the accumulation of tau protein in the brain is considered to be more closely related to the loss of nerve cells and memory impairment than to amyloid β, and it is expected that the severity in the early stage of dementia can be evaluated. In addition, excessive α-synuclein eventually causes death of nerve cells and causes symptoms such as motor dysfunction. Therefore, overexpression of α-synuclein in nerve cells occurs, for example, in the early stage of Parkinson's disease. It is believed that.
上述のように、診断情報は、複数の時点での疑似PET画像及び各疑似PET画像に基づいて特定されるPET診断指標を含む。PET診断指標は、疑似PET画像に基づいて求めることができる指標であり、例えば、アミロイドβ、タウ蛋白又はαシヌクレインの蓄積を表す集積度(SUV)でもよく、SUVRでもよい。アミロイドβ、タウ蛋白又はαシヌクレインの集積度は、脳の各部位の集積度でもよく、複数の部位の集積度の合計でもよく、脳全体での集積度でもよい。複数の時点での疑似PET画像に基づくので、アミロイドβ、タウ蛋白又はαシヌクレインの蓄積の推移を考慮した診断情報を生成することができる。
As described above, the diagnostic information includes a pseudo PET image at a plurality of time points and a PET diagnostic index specified based on each pseudo PET image. The PET diagnostic index is an index that can be obtained based on a pseudo PET image, and may be, for example, an accumulation degree (SUV) indicating the accumulation of amyloid β, tau protein, or α-synuclein, or SUVR. The degree of accumulation of amyloid β, tau protein or α-synuclein may be the degree of accumulation of each part of the brain, the total degree of accumulation of a plurality of parts, or the degree of accumulation in the entire brain. Since it is based on pseudo PET images at multiple time points, it is possible to generate diagnostic information considering the transition of accumulation of amyloid β, tau protein or α-synuclein.
また、診断情報は、疑似PET画像毎に被験者に関する脳疾患診断結果とPET診断指標とを含む。脳疾患診断結果は、例えば、NC(Normal Control、健常者、健常老年者等)、MCI(軽度認知障害)などを含む。脳疾患診断結果とPET診断指標の推移を含むことにより、例えば、ADの発症の可能性を推定することができる。
Further, the diagnostic information includes the brain disease diagnosis result and the PET diagnostic index for the subject for each pseudo PET image. Brain disease diagnosis results include, for example, NC (Normal Control, healthy person, healthy elderly person, etc.), MCI (mild cognitive impairment) and the like. By including the brain disease diagnosis result and the transition of the PET diagnostic index, for example, the possibility of developing AD can be estimated.
図7は医師等の端末装置10に表示する診断情報の第2例を示す模式図である。図7に示すように、診断情報102には、2018年6月でのMRI画像及び疑似PET画像、2019年1月でのMRI画像及び疑似PET画像、2019年6月でのMRI画像及び疑似PET画像、及び2020年1月でのMRI画像及び疑似PET画像が時系列に表示されている。診断情報102には、PET診断指標としてのSUVR値とともに、MRI診断指標が時系列に表示されている。
FIG. 7 is a schematic diagram showing a second example of diagnostic information displayed on a terminal device 10 of a doctor or the like. As shown in FIG. 7, the diagnostic information 102 includes an MRI image and a pseudo PET image in June 2018, an MRI image and a pseudo PET image in January 2019, and an MRI image and a pseudo PET image in June 2019. Images, MRI images and pseudo PET images as of January 2020 are displayed in chronological order. In the diagnostic information 102, the MRI diagnostic index is displayed in chronological order together with the SUVR value as the PET diagnostic index.
MRI診断指標は、MRI画像に基づいて求めることができる指標であり、図7に示すように、例えば、脳の各部位の萎縮に関する値(例えば、関心領域における萎縮程度等)とすることができるが、萎縮に限定されるものではなく、部位毎の容積等でもよい。なお、部位は、複数の部位でもよく、特定の部位でもよい。脳萎縮を評価する手法は、たとえば、3DのT1強調の全脳MRIを灰白質、白質、髄液に分離(セグメンテーション)し、標準脳のテンプレートに形態変換して個々の被験者の灰白質濃度や容積絶対値をボクセルごとに正常データベースと統計学的に比較するVBM(Voxel Based Morphometry)を用いることができる。
The MRI diagnostic index is an index that can be obtained based on an MRI image, and as shown in FIG. 7, for example, it can be a value related to atrophy of each part of the brain (for example, the degree of atrophy in the region of interest). However, the atrophy is not limited to this, and the volume of each site may be used. The site may be a plurality of sites or a specific site. Methods for assessing cerebral atrophy include, for example, 3D T1-weighted whole-brain MRI separated into gray matter, white matter, and cerebrospinal fluid (segmentation) and morphologically transformed into standard brain templates to determine the gray matter concentration of individual subjects. VBM (Voxel Based Morphometry), which statistically compares the absolute volume value with the normal database for each voxel, can be used.
アルツハイマー病では、正常加齢では観察されない、脳の内側側頭部の萎縮が早い段階で起こると言われている。すなわち、MCI(軽度認知障害)の段階においてアルツハイマー病の発症を予見する手段として、内側側頭部の萎縮に注目することができる。図7に示すように、疑似PET画像及びPET診断指標の時系列表示により、患者のMCI(軽度認知障害)の段階を把握しつつ、MRI画像及びMRI診断指標の時系列表示により、内側側頭部の萎縮の推移を観察してアルツハイマー病の発症を予見することができる。
In Alzheimer's disease, it is said that atrophy of the medial temporal region of the brain, which is not observed in normal aging, occurs at an early stage. That is, attention can be paid to medial temporal atrophy as a means for predicting the onset of Alzheimer's disease at the stage of MCI (mild cognitive impairment). As shown in FIG. 7, while grasping the stage of MCI (mild cognitive impairment) of a patient by displaying a pseudo PET image and a PET diagnostic index in a time series, the medial temporal region is displayed by displaying the MRI image and the MRI diagnostic index in a time series. The onset of Alzheimer's disease can be predicted by observing the transition of atrophy of the part.
図8は医師等の端末装置10に表示する診断情報の第3例を示す模式図である。診断情報には、年代別アミロイド蓄積情報103が含まれる。年代別アミロイド蓄積情報103は、認知機能が正常である多くの健常者の大脳皮質でのアミロイド蓄積の平均値が年代別に表示される。なお、健常者に限定されるものではなく、例えば、MCI(軽度認知障害)であってもよい。例えば、50代の健常者は10%のアミロイド蓄積が見られ、60代の健常者は15%のアミロイド蓄積が見られ、70代の健常者は30%のアミロイド蓄積が見られ、80代の健常者は50%のアミロイド蓄積が見られる。なお、アミロイド蓄積の数値は、模式的に示す一例であって、実際の数値と異なる場合もあり、これらの数値に限定されない。また、年代別に限定されるものではなく、性別であってもよい。診断情報には、患者の年齢、大脳皮質でのアミロイド集積、最新の疑似PET画像も含まれる。なお、図示していないが、アミロイド蓄積に代えて、あるいはアミロイド蓄積に加えて、タウ蛋白又はαシヌクレインなどの異常タンパク質の蓄積を表示してもよい。
FIG. 8 is a schematic diagram showing a third example of diagnostic information displayed on a terminal device 10 of a doctor or the like. The diagnostic information includes age-specific amyloid accumulation information 103. The age-specific amyloid accumulation information 103 displays the average value of amyloid accumulation in the cerebral cortex of many healthy subjects with normal cognitive function by age group. It should be noted that the present invention is not limited to a healthy person, and may be, for example, MCI (mild cognitive impairment). For example, healthy people in their 50s have 10% amyloid accumulation, healthy people in their 60s have 15% amyloid accumulation, healthy people in their 70s have 30% amyloid accumulation, and healthy people in their 80s have 30% amyloid accumulation. Healthy individuals have 50% amyloid accumulation. The numerical value of amyloid accumulation is an example schematically shown, and may differ from the actual numerical value, and is not limited to these numerical values. Moreover, it is not limited to each age group, and may be gender. Diagnostic information also includes patient age, amyloid accumulation in the cerebral cortex, and up-to-date pseudo-PET images. Although not shown, the accumulation of abnormal proteins such as tau protein or α-synuclein may be indicated in place of or in addition to the accumulation of amyloid.
上述のように、診断情報は、PET診断指標(図8の例では、アミロイド蓄積)と比較対象者の年代別のPET診断指標とを含む。比較対象者(例えば、認知機能正常者)のPET診断指標(例えば、年代別のPET診断指標の平均値)と対比することにより、被験者の脳の状態が、同年代の比較対象者と比べて良いのか悪いのかを判断することができる。
As described above, the diagnostic information includes the PET diagnostic index (in the example of FIG. 8, amyloid accumulation) and the PET diagnostic index for each age group of the comparison subject. By comparing with the PET diagnostic index (for example, the average value of the PET diagnostic index by age group) of the comparative subject (for example, a person with normal cognitive function), the brain condition of the subject may be compared with that of the comparative subject of the same age. You can judge whether it is bad or bad.
図9は医師等の端末装置10に表示する診断情報の第4例を示す模式図である。図9では、脳に関連する疾患やアミロイドβに関連する疾患の薬物の薬効を評価する場合の一例を示す。薬物は承認されていない薬物も承認されている薬物も含まれる。また、薬物は、既承認薬、未承認薬、医薬品、治験薬、被験薬、対照薬等であってよい。なお、薬物の薬効の評価だけでなく、薬物以外の、例えば、健康食品、機能性表示食品、特別用途食品、栄養補助食品、サプリメント又は特定保健用食品等の飲食品等の評価を含めてもよい。薬物毎に、疑似PET画像が時系列に表示される領域111、113、アミロイド蓄積の変化が表示される領域112、114が表示されている。アミロイド蓄積の変化は、例えば、2年、5年、10年など適宜の期間に亘る変化が示される。期間は、医師や研究者が適宜設定できる。例えば、MCIと診断された多数の被験者を2つのグループに分け、一方のグループに薬物Aを投与し続け、他方のグループに薬物Bを投与し続けたとする。図9に示すように、薬物Aを投与された被験者の平均のアミロイド蓄積の変化が期間と共に増加したとする。また、薬物Bを投与された被験者の平均のアミロイド蓄積の変化率がそれほど変わらないとする。この場合、薬物Bは、認知症の進行の抑制に効果があるという結果を得ることができる。なお、有害事象(副作用を含む。例えば、悪心、嘔吐、頭痛、徐脈、狭心症、心筋梗塞、脳血管発作、痙攣発作、アミロイド関連画像異常(ARIA、ARIA-E、ARIA-Hなど)、転倒などの少なくとも1つ)を表示してもよい。これにより、薬物の効用だけでなく、副作用等も確認できる。また、図9では、疑似PET画像とアミロイド蓄積の変化の両方を表示する例を示すが、疑似PET画像とアミロイド蓄積の変化のいずれか一方のみを表示してもよい。なお、図示していないが、アミロイド蓄積の変化に代えて、あるいはアミロイド蓄積の変化に加えて、タウ蛋白又はαシヌクレインなどの異常タンパク質の蓄積の変化を表示してもよい。
FIG. 9 is a schematic diagram showing a fourth example of diagnostic information displayed on a terminal device 10 of a doctor or the like. FIG. 9 shows an example of evaluating the efficacy of a drug for a disease related to the brain or a disease related to amyloid β. Drugs include unapproved drugs and approved drugs. The drug may be an approved drug, an unapproved drug, a drug, an investigational drug, a test drug, a control drug, or the like. It should be noted that not only the evaluation of the medicinal effect of the drug but also the evaluation of foods and drinks other than the drug, such as health foods, foods with functional claims, special purpose foods, nutritional supplements, supplements or foods for specified health use, etc. are included. good. For each drug, regions 111 and 113 in which pseudo PET images are displayed in chronological order and regions 112 and 114 in which changes in amyloid accumulation are displayed are displayed. Changes in amyloid accumulation are shown to change over an appropriate period, for example, 2 years, 5 years, 10 years. The period can be set by doctors and researchers as appropriate. For example, suppose that a large number of subjects diagnosed with MCI are divided into two groups, one group continues to receive drug A and the other group continues to receive drug B. As shown in FIG. 9, it is assumed that the change in the average amyloid accumulation of the subjects who received the drug A increased with the period. Further, it is assumed that the rate of change in the average amyloid accumulation of the subjects who received the drug B does not change so much. In this case, it can be obtained that the drug B is effective in suppressing the progression of dementia. Adverse events (including side effects, such as nausea, vomiting, headache, bradycardia, angina, myocardial infarction, cerebrovascular attack, spasm attack, amyloid-related imaging abnormalities (ARIA, ARIA-E, ARIA-H, etc.)) , At least one such as a fall) may be displayed. As a result, not only the efficacy of the drug but also side effects and the like can be confirmed. Further, although FIG. 9 shows an example of displaying both the pseudo PET image and the change in the amyloid accumulation, only one of the pseudo PET image and the change in the amyloid accumulation may be displayed. Although not shown, changes in the accumulation of abnormal proteins such as tau protein or α-synuclein may be displayed in place of changes in amyloid accumulation or in addition to changes in amyloid accumulation.
次に、患者の端末装置20に表示される診断情報について説明する。
Next, the diagnostic information displayed on the patient's terminal device 20 will be described.
図10は患者の端末装置20に表示する診断情報の第1例を示す模式図である。図10に示すように、診断情報には、受診履歴201、認知障害推移202が含まれる。受診履歴201には、受診の年月日、担当医、診断結果、診断結果の詳細を表示させるための詳細アイコンが表示される。患者は、過去の受診履歴を一覧で見ることができ、例えば、診断結果(図の例では、軽度)の推移を容易に認識できる。また、次回診察予定日を表示することにより、受診忘れを防止できる。
FIG. 10 is a schematic diagram showing a first example of diagnostic information displayed on the patient's terminal device 20. As shown in FIG. 10, the diagnostic information includes the consultation history 201 and the cognitive impairment transition 202. In the consultation history 201, a detail icon for displaying the date of consultation, the doctor in charge, the diagnosis result, and the details of the diagnosis result is displayed. The patient can see the past consultation history in a list, and can easily recognize, for example, the transition of the diagnosis result (mild in the example of the figure). In addition, by displaying the scheduled date of the next medical examination, it is possible to prevent forgetting to receive the medical examination.
認知障害推移202には、患者の認知機能障害の障害レベルの推移が表示される。患者は過去の診断結果から、障害レベルが悪くなっているのか、ほとんど変化なく推移しているのか等を一瞥で判断することができる。また、認知障害推移202に、年代別の平均的な障害レベルを表示することにより、患者は自身の年齢を参考にして、同年代の平均値より良いのか悪いのかも判断できる。
In the cognitive impairment transition 202, the transition of the disability level of the patient's cognitive dysfunction is displayed. From the past diagnosis results, the patient can judge at a glance whether the disability level has deteriorated or has remained almost unchanged. In addition, by displaying the average disability level for each age group in the cognitive impairment transition 202, the patient can determine whether it is better or worse than the average value of the same age group with reference to his / her own age.
次に、詳細アイコンを操作した場合に表示される診断情報について説明する。
Next, the diagnostic information displayed when the detail icon is operated will be explained.
図11は患者の端末装置20に表示する診断情報の第2例を示す模式図である。図10において、受診の年月日を選択して詳細アイコンを操作すると、図11に示す診断情報203が表示される。図11の例では、3つの受診日の詳細アイコンが操作された場合を示す。診断情報203には、受診日とともに疑似PET画像が表示される。なお、診断情報203に含まれる疑似PET画像は、モデル部552が出力した疑似PET画像でもよく、モデル部552が出力した疑似PET画像を一般の患者が分かりやすいように画像処理した後の画像でもよい。
FIG. 11 is a schematic diagram showing a second example of diagnostic information displayed on the patient's terminal device 20. In FIG. 10, when the date of consultation is selected and the detail icon is operated, the diagnostic information 203 shown in FIG. 11 is displayed. In the example of FIG. 11, a case where the detail icons of the three consultation dates are operated is shown. A pseudo PET image is displayed on the diagnosis information 203 together with the consultation date. The pseudo PET image included in the diagnostic information 203 may be a pseudo PET image output by the model unit 552, or may be an image after image processing of the pseudo PET image output by the model unit 552 so that a general patient can easily understand it. good.
図12は患者の端末装置20に表示する診断情報の第3例を示す模式図である。図12では、脳に関連する疾患やアミロイドβ、タウ蛋白又はαシヌクレインに関連する疾患の薬物の薬効を評価する場合の一例を示す。図12に示すように、診断情報204には、患者名(患者番号でもよい)、患者に投与された薬物、薬物の投与期間などが表示される。また、投与期間に亘って、疑似PET画像が時系列に表示される。なお、1つの疑似PET画像を表示してもよい。図12に模式的に示すように、疑似PET画像で表されるアミロイド蓄積又はタウ蛋白の蓄積が期間の経過とともに増加していない場合、薬物はアミロイドβ、タウ蛋白又はαシヌクレインに関連する疾患の進行を抑制していることが分かる。なお、有害事象(副作用を含む。例えば、悪心、嘔吐、頭痛、徐脈、狭心症、心筋梗塞、脳血管発作、痙攣発作、アミロイド関連画像異常(ARIA、ARIA-E、ARIA-Hなど)、転倒などの少なくとも1つ)を表示してもよい。これにより、薬物の効用だけでなく、副作用等も確認できる。なお、図示していないが、複数の時点での疑似PET画像に加えて、あるいは疑似PET画像に代えて、当該複数の時点に亘るアミロイド蓄積の変化、タウ蛋白の蓄積の変化又はαシヌクレインの蓄積の変化を表示してもよい。なお、投与期間内における、ある時点でのアミロイド蓄積状態、タウ蛋白蓄積状態αシヌクレイン蓄積状態を表示してもよい。
FIG. 12 is a schematic diagram showing a third example of diagnostic information displayed on the patient's terminal device 20. FIG. 12 shows an example of evaluating the efficacy of a drug for a disease related to the brain or a disease related to amyloid β, tau protein or α-synuclein. As shown in FIG. 12, the diagnostic information 204 displays a patient name (may be a patient number), a drug administered to the patient, a drug administration period, and the like. In addition, pseudo PET images are displayed in chronological order over the administration period. In addition, one pseudo PET image may be displayed. As schematically shown in FIG. 12, if the amyloid accumulation or tau protein accumulation represented by the pseudo-PET image does not increase over time, the drug is a disease associated with amyloid β, tau protein or α-synuclein. It can be seen that the progress is suppressed. Adverse events (including side effects, such as nausea, vomiting, headache, bradycardia, angina, myocardial infarction, cerebrovascular attack, spasm attack, amyloid-related imaging abnormalities (ARIA, ARIA-E, ARIA-H, etc.)) , At least one such as a fall) may be displayed. As a result, not only the efficacy of the drug but also side effects and the like can be confirmed. Although not shown, changes in amyloid accumulation, changes in tau protein accumulation, or α-synuclein accumulation over the plurality of time points in addition to or in place of the pseudo PET images at multiple time points. The change in may be displayed. The amyloid accumulation state and the tau protein accumulation state α-synuclein accumulation state at a certain point in time may be displayed during the administration period.
次に、情報処理装置50の動作について説明する。
Next, the operation of the information processing apparatus 50 will be described.
図13は脳診断情報の生成処理の手順の一例を示すフローチャートである。以下では便宜上、処理の主体を制御部51として説明する。制御部51は、初回診察であるか否かを判定し(S11)、初回診察である場合(S11でYES)、被験者のPET画像の有無を判定する(S12)。PET画像がある場合(S12でYES)、制御部51は、被験者のPET画像を取得する(S13)。初回診察でない場合(S11でNO)、及び被験者のPET画像がない場合(S12でNO)、制御部51は、後述のステップS14の処理を行う。
FIG. 13 is a flowchart showing an example of the procedure for generating brain diagnostic information. Hereinafter, for convenience, the subject of processing will be described as the control unit 51. The control unit 51 determines whether or not it is the first medical examination (S11), and if it is the first medical examination (YES in S11), determines whether or not the subject has a PET image (S12). When there is a PET image (YES in S12), the control unit 51 acquires the PET image of the subject (S13). When it is not the first examination (NO in S11) and when there is no PET image of the subject (NO in S12), the control unit 51 performs the process of step S14 described later.
制御部51は、被験者のMRI画像を取得し(S14)、取得したMRI画像、PET画像(PET画像がある場合)を学習済みモデルに入力する(S15)。制御部51は、学習済みモデルが出力する疑似PET画像に基づいてPET診断指標を算出し(S16)、取得したMRI画像に基づいてMRI診断指標を算出する(S17)。
The control unit 51 acquires an MRI image of the subject (S14), and inputs the acquired MRI image and PET image (if there is a PET image) into the trained model (S15). The control unit 51 calculates the PET diagnostic index based on the pseudo PET image output by the trained model (S16), and calculates the MRI diagnostic index based on the acquired MRI image (S17).
制御部51は、他の撮像時点のMRI画像の有無を判定し(S18)、他のMRI画像がある場合(S18でYES)、ステップS14以降の処理を繰り返す。他のMRI画像がない場合(S18でNO)、制御部51は、診断情報を生成し(S19)、処理を終了する。
The control unit 51 determines the presence or absence of another MRI image at the time of imaging (S18), and if there is another MRI image (YES in S18), the process after step S14 is repeated. When there is no other MRI image (NO in S18), the control unit 51 generates diagnostic information (S19) and ends the process.
図14は学習済みモデル生成処理の手順の一例を示すフローチャートである。制御部51は、モデルを読み出し(S31)、ニューラルネットワークのパラメータの初期値を設定する(S32)。制御部51は、カウント値n=1とし(S33)、撮像時点tnでのMRI画像及びPET画像を取得する(S34)。
FIG. 14 is a flowchart showing an example of the procedure of the trained model generation process. The control unit 51 reads out the model (S31) and sets the initial values of the parameters of the neural network (S32). The control unit 51 sets the count value n = 1 (S33) and acquires an MRI image and a PET image at the time of imaging tun (S34).
制御部51は、撮像時点t1でのPET画像及び撮像時点tnでのMRI画像をモデル(モデル部562)に入力し、モデルが出力する撮像時点tnでの疑似PET画像と撮像時点tnでのPET画像とに基づく損失関数の値が最小となるようにモデルのパラメータを調整する(S35)。
The control unit 51 inputs the PET image at the imaging time t1 and the MRI image at the imaging time tun into the model (model unit 562), and outputs the pseudo PET image at the imaging time tun and the PET at the imaging time tun output by the model. The model parameters are adjusted so that the value of the loss function based on the image is minimized (S35).
制御部51は、損失関数の値が許容範囲内であるか否かを判定し(S36)、許容範囲内でない場合(S36でNO)、ステップS34以降の処理を繰り返す。損失関数の値が許容範囲内である場合(S36でYES)、制御部51は、すべての撮像時点の処理が終了したか否かを判定する(S37)。
The control unit 51 determines whether or not the value of the loss function is within the permissible range (S36), and if it is not within the permissible range (NO in S36), the process after step S34 is repeated. When the value of the loss function is within the permissible range (YES in S36), the control unit 51 determines whether or not all the processing at the time of imaging is completed (S37).
すべての撮像時点の処理が終了していない場合(S37でNO)、制御部51は、カウント値に1を加算し(S38)、ステップS34以降の処理を繰り返す。すべての撮像時点の処理が終了した場合(S37でYES)、制御部51は、生成した学習済みモデルをモデル部552に記憶し(S39)、処理を終了する。
When all the processing at the time of imaging is not completed (NO in S37), the control unit 51 adds 1 to the count value (S38), and repeats the processing in steps S34 and subsequent steps. When all the processing at the time of imaging is completed (YES in S37), the control unit 51 stores the generated trained model in the model unit 552 (S39), and ends the processing.
情報処理装置50は、CPU(プロセッサ)、RAMなどを備えたコンピュータを用いて実現することもできる。図13及び図14に示すような処理の手順を定めたコンピュータプログラム(記録媒体に記録可能)をコンピュータに備えられた記録媒体読取部で読み取り、読み取ったコンピュータプログラムをRAMにロードし、コンピュータプログラムをCPU(プロセッサ)で実行することにより、コンピュータ上で情報処理装置50を実現することができる。
The information processing device 50 can also be realized by using a computer equipped with a CPU (processor), RAM, and the like. A computer program (which can be recorded on a recording medium) that defines the processing procedure as shown in FIGS. 13 and 14 is read by a recording medium reading unit provided in the computer, the read computer program is loaded into the RAM, and the computer program is loaded. The information processing device 50 can be realized on a computer by executing the program on a CPU (processor).
上述の実施の形態では、主にMCI(軽度認知障害)、AD(アルツハイマー病)について説明したが、本実施形態の対象とする疾病は、これらに限定されるものではなく、例えば、レビー小体型認知症(DLB)や多発性硬化症(MS)、パーキンソン病、前頭葉側頭葉変性症(FTLD)、その他の神経変性疾患等にも適用することができる。例えば、レビー小体病の脳萎縮にも、アルツハイマー病と同様にアミロイドβ又はタウ蛋白の蓄積が関連している。また、アルツハイマー病(アミロイド斑)、認知症(レビー小体)、シヌクレイノパチー(ニューロン、神経線維、グリア細胞におけるタンパク質凝集体)、多系統萎縮症、パーキンソン病(レビー小体)、運動機能障害などは、αシヌクレインの蓄積が関連している。
In the above-described embodiment, MCI (mild cognitive impairment) and AD (Alzheimer's disease) have been mainly described, but the diseases targeted by this embodiment are not limited to these, and for example, Lewy body dementias. It can also be applied to dementia (DLB), multiple sclerosis (MS), Parkinson's disease, frontal lobe temporal lobe degeneration (FTLD), and other neurodegenerative diseases. For example, brain atrophy in Lewy body disease is associated with the accumulation of amyloid β or tau protein, similar to Alzheimer's disease. Also, Alzheimer's disease (amyloid plaque), dementia (Lewy bodies), synucleinopathy (protein aggregates in neurons, nerve fibers, glial cells), multiple system atrophy, Parkinson's disease (Lewy bodies), motor function. Disorders and the like are associated with the accumulation of α-synuclein.
本実施の形態のコンピュータプログラムは、コンピュータに、被験者の脳に関する、1又は複数の時点で撮像された1又は複数のMRI画像を取得し、脳に関するMRI画像を入力した場合、前記脳に関する疑似PET画像を出力する学習済みモデルに、取得した1又は複数のMRI画像を入力して、前記被験者の脳に関する、前記1又は複数の時点での疑似PET画像を出力する、処理を実行させる。
In the computer program of the present embodiment, when one or a plurality of MRI images taken at one or a plurality of time points regarding the subject's brain are acquired by the computer and the MRI image regarding the brain is input, the pseudo PET for the brain is described. The acquired one or a plurality of MRI images are input to the trained model that outputs an image, and a process of outputting a pseudo PET image at the one or a plurality of time points regarding the subject's brain is executed.
本実施の形態の情報処理装置は、被験者の脳に関する、1又は複数の時点で撮像された1又は複数のMRI画像を取得する取得部と、脳に関するMRI画像を入力した場合、前記脳に関する疑似PET画像を出力する学習済みモデルに、取得した1又は複数のMRI画像を入力して、前記被験者の脳に関する、前記1又は複数の時点での疑似PET画像を出力する出力部とを備える。
The information processing apparatus of the present embodiment has an acquisition unit that acquires one or a plurality of MRI images captured at one or a plurality of time points regarding the subject's brain, and when an MRI image regarding the brain is input, the pseudo brain. The trained model that outputs the PET image is provided with an output unit that inputs the acquired one or a plurality of MRI images and outputs a pseudo PET image at the one or a plurality of time points regarding the subject's brain.
本実施の形態の情報処理方法は、被験者の脳に関する、1又は複数の時点で撮像された1又は複数のMRI画像を取得し、脳に関するMRI画像を入力した場合、前記脳に関する疑似PET画像を出力する学習済みモデルに、取得した1又は複数のMRI画像を入力して、前記被験者の脳に関する、前記1又は複数の時点での疑似PET画像を出力する。
The information processing method of the present embodiment acquires one or a plurality of MRI images captured at one or a plurality of time points regarding the subject's brain, and when the MRI image regarding the brain is input, the pseudo PET image regarding the brain is obtained. The acquired one or more MRI images are input to the trained model to be output, and the pseudo PET images at the one or more time points regarding the subject's brain are output.
本実施の形態の学習済みモデル生成方法は、脳に関する第1時点で撮像されたMRI画像及びPET画像を取得し、前記第1時点より後の第2時点で撮像された前記脳に関するMRI画像及びPET画像を取得し、取得された、前記第1時点及び第2時点それぞれで撮像されたMRI画像及びPET画像を用いて、前記第1時点で撮像された脳に関するMRI画像及びPET画像、並びに前記第2時点で撮像された前記脳に関するMRI画像を入力した場合、前記第2時点での前記脳に関する疑似PET画像を出力する学習済みモデルを生成する。
The trained model generation method of the present embodiment acquires the MRI image and the PET image captured at the first time point regarding the brain, and obtains the MRI image and the PET image regarding the brain taken at the second time point after the first time point. Using the PET images acquired and the MRI and PET images captured at the first and second time points, respectively, the MRI and PET images of the brain captured at the first time point, and the above-mentioned When an MRI image of the brain captured at the second time point is input, a trained model that outputs a pseudo PET image of the brain at the second time point is generated.
本実施の形態の画像出力装置は、脳に関する第1時点で撮像されたMRI画像及びPET画像並びに前記第1時点より後の第2時点で撮像された前記脳に関するMRI画像を入力した場合に、前記第2時点での前記脳に関する疑似PET画像を出力する。
When the image output device of the present embodiment inputs an MRI image and a PET image taken at the first time point regarding the brain and an MRI image about the brain taken at the second time point after the first time point, the image output device has the same. A pseudo PET image relating to the brain at the second time point is output.
コンピュータプログラムは、被験者の脳に関する、1又は複数の時点で撮像された1又は複数のMRI画像を取得する。MRI画像は、MRI装置で得られるMRI画像(例えば、T1強調画像、T2強調画像、拡散強調画像、フレア画像、拡散テンソル画像)のみならず、MRI信号に所定の演算を施すことによって得られる加工画像(例えば、QSM画像)なども含む。複数の時点は、例えば、被験者(患者)のMRI検査の実施時点とすることができる。
The computer program acquires one or more MRI images of the subject's brain taken at one or more time points. The MRI image is not only an MRI image obtained by an MRI apparatus (for example, a T1 weighted image, a T2 weighted image, a diffusion weighted image, a flare image, a diffusion tensor image), but also a process obtained by performing a predetermined operation on the MRI signal. It also includes images (eg, QSM images) and the like. The plurality of time points can be, for example, a time point for performing an MRI examination of a subject (patient).
学習済みモデルは、被験者の脳に関する1又は複数の時点でのMRI画像を入力した場合、当該被験者の脳に関する当該1又は複数の時点それぞれでの疑似PET画像を出力する。「疑似PET画像」は、実際のPET画像と区別する意味で用いる文言であり、実質的にPET画像と同等である。疑似PET画像は、PET画像と同様に、例えば、アミロイドβの分布を可視化した分布情報(例えば、ボクセル毎のSUVR値)を含む。SUVR(Standardized Uptake Value Ratio)は、大脳灰白質の4つの部位(前頭前野、前後帯状皮質、頭頂葉、及び外側側頭葉)のSUV(Standardized Uptake Value:アミロイドβ蛋白の集積度)の合算を、小脳のSUVで除算することにより求めることができる。学習済みモデルは、ニューラルネットワークで構成することができ、例えば、GAN(Generative Adversarial Network)やU-net、あるいはこれらの組み合わせを用いることができる。
When the trained model inputs an MRI image at one or more time points regarding the subject's brain, it outputs a pseudo PET image at each of the one or more time points regarding the subject's brain. The "pseudo PET image" is a word used to distinguish it from an actual PET image, and is substantially equivalent to a PET image. Similar to the PET image, the pseudo PET image includes, for example, distribution information that visualizes the distribution of amyloid β (for example, the SUVR value for each voxel). SUVR (Standardized Uptake Value Ratio) is the sum of SUVs (Standardized Uptake Value: amyloid β protein accumulation) of four sites of cerebellar gray matter (prefrontal cortex, anterior and posterior cingulate cortex, parietal lobe, and lateral temporal lobe). , Can be determined by dividing by the SUV of the cerebellum. The trained model can be configured with a neural network, and for example, GAN (Generative Adversarial Network), U-net, or a combination thereof can be used.
学習前のモデル(単に「モデル」とも称する)は、学習用入力データとして脳に関するMRI画像を用い、教師データとして当該の脳のMRI画像が撮像されたときと同時期のPET画像を用いる。モデルに脳に関するMRI画像を入力し、モデルが出力する疑似PET画像が教師データとしての実際のPET画像に近づくように、モデルのパラメータ(例えば、重み、バイアス、フィルタのパラメータなど)を調整することにより、学習済みモデルを生成することができる。
The pre-learning model (also simply referred to as "model") uses an MRI image of the brain as input data for learning, and a PET image at the same time as when the MRI image of the brain was captured as teacher data. Input an MRI image of the brain into the model and adjust the model parameters (eg, weights, biases, filter parameters, etc.) so that the pseudo PET image output by the model is closer to the actual PET image as teacher data. Allows you to generate a trained model.
1又は複数の時点での疑似PET画像を出力するので、PET検査を行うことなくPET画像と同等の脳診断情報を提供できる。
Since the pseudo PET image at one or a plurality of time points is output, it is possible to provide brain diagnostic information equivalent to the PET image without performing a PET examination.
本実施の形態のコンピュータプログラムは、コンピュータに、前記複数の時点のうちの第1時点で撮像された前記被験者の脳に関するPET画像を取得し、脳に関する第1時点で撮像されたMRI画像及びPET画像並びに前記複数の時点のうちの前記第1時点より後の第2時点で撮像された前記脳に関するMRI画像を入力した場合、前記第2時点での前記脳に関する疑似PET画像を出力する学習モデルに、前記第1時点で撮像された前記被験者の脳に関するPET画像を入力して、前記第2時点での前記被験者の脳に関する疑似PET画像を出力する、処理を実行させる。
In the computer program of the present embodiment, the computer acquires a PET image of the subject's brain captured at the first time point among the plurality of time points, and the MRI image and PET image taken at the first time point of the brain. A learning model that outputs a pseudo PET image of the brain at the second time point when an image and an MRI image of the brain imaged at the second time point after the first time point of the plurality of time points are input. Is input with a PET image of the subject's brain captured at the first time point, and outputs a pseudo PET image of the subject's brain at the second time point.
コンピュータプログラムは、複数の時点のうちの第1時点で撮像された被験者の脳に関するPET画像を取得する。第1時点は、複数の時点のうちの最初の時点(すなわち、最初のMRI検査と同時に受けたPET検査の時点)でもよく、初回より後の2回目又は3回目などのMRI検査と同じ時点でもよい。
The computer program acquires PET images of the subject's brain captured at the first of multiple time points. The first time point may be the first of multiple time points (ie, the time point of the PET examination received at the same time as the first MRI examination), or the same time point as the second or third MRI examination after the first time. good.
学習済みモデルは、脳に関する第1時点で撮像されたMRI画像及びPET画像並びに第1時点より後の第2時点で撮像された脳に関するMRI画像を入力した場合、第2時点での当該脳に関する疑似PET画像を出力する。例えば、初回の診察時に行ったMRI検査とPET検査それぞれによって得られたMRI画像及びPET画像、さらに、2回目以降のMRI検査によって得られたMRI画像を学習済みモデルに入力すると、学習済みモデルは、2回目以降のMRI検査時の脳に関する疑似PET画像を出力することができる。
When the trained model inputs an MRI image and a PET image taken at the first time point regarding the brain and an MRI image about the brain taken at the second time point after the first time point, the trained model relates to the brain at the second time point. Output a pseudo PET image. For example, when the MRI image and PET image obtained by the MRI examination and the PET examination performed at the first examination and the MRI image obtained by the second and subsequent MRI examinations are input to the trained model, the trained model is obtained. It is possible to output a pseudo PET image related to the brain at the time of the second and subsequent MRI examinations.
学習前のモデルは、学習用入力データとして、脳に関する第1時点で撮像されたMRI画像及びPET画像、並びに第1時点より後の第2時点で撮像された当該脳に関するMRI画像を用い、教師データとして当該第2時点のPET検査により得られた実際のPET画像を用いる。モデルに脳に関する第1時点でのMRI画像及びPET画像並びに第2時点でのMRI画像を入力し、モデルが出力する疑似PET画像が教師データとしての実際のPET画像に近づくように、モデルのパラメータ(例えば、重み、バイアス、フィルタのパラメータなど)を調整することにより、学習済みモデルを生成することができる。単にモデルに第2時点でのMRI画像を入力する場合に比べて、第2時点よりも前の第1時点でのMRI画像及びPET画像の情報も使用されるので、脳の状態変化を反映してモデルを機械学習させることができ、モデルが出力する疑似PET画像の精度を高めることが期待される。
The pre-learning model uses MRI and PET images captured at the first time point on the brain and MRI images taken at the second time point after the first time point as training input data, and is used as a teacher. As the data, the actual PET image obtained by the PET examination at the second time point is used. Input the MRI image and PET image at the first time point and the MRI image at the second time point to the model, and the parameters of the model so that the pseudo PET image output by the model approaches the actual PET image as the teacher data. Trained models can be generated by adjusting (eg, weights, biases, filter parameters, etc.). Compared to simply inputting the MRI image at the second time point into the model, the information of the MRI image and PET image at the first time point before the second time point is also used, so it reflects the change in the state of the brain. It is expected that the model can be machine-learned and the accuracy of the pseudo PET image output by the model can be improved.
本実施の形態のコンピュータプログラムは、コンピュータに、前記複数の時点での疑似PET画像を時系列に表示する、処理を実行させる。
The computer program of the present embodiment causes the computer to execute a process of displaying the pseudo PET images at the plurality of time points in chronological order.
コンピュータプログラムは、複数の時点での疑似PET画像を時系列に表示する。これにより、複数の時点での疑似PET画像を比較しながら、脳診断情報を提供できる。
The computer program displays pseudo PET images at multiple time points in chronological order. This makes it possible to provide brain diagnostic information while comparing pseudo PET images at a plurality of time points.
本実施の形態のコンピュータプログラムは、コンピュータに、前記複数の時点での疑似PET画像に基づく診断情報を生成する、処理を実行させる。
The computer program of the present embodiment causes the computer to execute a process of generating diagnostic information based on the pseudo PET images at the plurality of time points.
コンピュータプログラムは、複数の時点での疑似PET画像に基づく診断情報を生成する。複数の時点での疑似PET画像が得られるので、ある特定の時点の脳の状態だけでなく、複数の時点に亘る脳の状態の変化に基づく診断情報を得ることができる。これにより、PET検査を行うことなくPET画像と同等の脳診断情報を提供できる。
The computer program generates diagnostic information based on pseudo PET images at multiple time points. Since pseudo PET images at a plurality of time points can be obtained, it is possible to obtain diagnostic information based on not only the state of the brain at a specific time point but also changes in the state of the brain over a plurality of time points. This makes it possible to provide brain diagnostic information equivalent to a PET image without performing a PET examination.
本実施の形態のコンピュータプログラムにおいて、前記診断情報は、前記複数の時点での疑似PET画像に基づいて特定されるPET診断指標を含む。
In the computer program of the present embodiment, the diagnostic information includes a PET diagnostic index specified based on the pseudo PET images at the plurality of time points.
診断情報は、複数の時点での疑似PET画像に基づいて特定されるPET診断指標を含む。PET診断指標は、疑似PET画像に基づいて求めることができる指標であり、例えば、アミロイドβ又はタウ蛋白の蓄積を表す集積度(SUV)でもよく、SUVRでもよい。アミロイドβ又はタウ蛋白の集積度は、脳の各部位の集積度でもよく、複数の部位の集積度の合計でもよく、脳全体での集積度でもよい。複数の時点での疑似PET画像に基づくので、アミロイドβ又はタウ蛋白の蓄積の推移を考慮した診断情報を生成することができる。
The diagnostic information includes a PET diagnostic index specified based on pseudo PET images at a plurality of time points. The PET diagnostic index is an index that can be obtained based on a pseudo PET image, and may be, for example, the degree of accumulation (SUV) representing the accumulation of amyloid β or tau protein, or SUVR. The degree of accumulation of amyloid β or tau protein may be the degree of accumulation of each part of the brain, the total degree of accumulation of a plurality of parts, or the degree of accumulation in the entire brain. Since it is based on pseudo PET images at a plurality of time points, it is possible to generate diagnostic information considering the transition of accumulation of amyloid β or tau protein.
本実施の形態のコンピュータプログラムにおいて、前記診断情報は、前記疑似PET画像毎に前記被験者に関する脳疾患診断結果と前記PET診断指標とを含む。
In the computer program of the present embodiment, the diagnostic information includes a brain disease diagnosis result for the subject and the PET diagnostic index for each pseudo PET image.
診断情報は、疑似PET画像毎に被験者に関する脳疾患診断結果とPET診断指標とを含む。脳疾患診断結果は、例えば、NC(健常老年者)、MCI(軽度認知障害)などを含む。脳疾患診断結果とPET診断指標の推移を含むことにより、例えば、ADの発症の可能性を推定することができる。
The diagnostic information includes the brain disease diagnosis result and the PET diagnostic index for the subject for each pseudo PET image. Brain disease diagnosis results include, for example, NC (healthy elderly), MCI (mild cognitive impairment) and the like. By including the brain disease diagnosis result and the transition of the PET diagnostic index, for example, the possibility of developing AD can be estimated.
本実施の形態のコンピュータプログラムにおいて、前記診断情報は、前記PET診断指標と比較対象者のPET診断指標とを含む。
In the computer program of the present embodiment, the diagnostic information includes the PET diagnostic index and the PET diagnostic index of the comparison target person.
診断情報は、PET診断指標と比較対象者のPET診断指標とを含む。比較対象者(例えば、認知機能正常者)のPET診断指標(例えば、年代別のPET診断指標の平均値)と対比することにより、被験者の脳の状態が、同年代の比較対象者と比べて良いのか悪いのかを判断することができる。
The diagnostic information includes the PET diagnostic index and the PET diagnostic index of the comparison target. By comparing with the PET diagnostic index (for example, the average value of the PET diagnostic index by age group) of the comparative subject (for example, a person with normal cognitive function), the brain condition of the subject may be compared with that of the comparative subject of the same age. You can judge whether it is bad or bad.
本実施の形態の端末装置は、特定の薬物を投与された被験者の脳に関する、1又は複数の時点に亘る疑似PET画像、前記1又は複数の時点に亘るアミロイド蓄積、及び前記1又は複数の時点に亘るタウ蛋白蓄積の少なくとも一方を表示する。
The terminal device of this embodiment is a pseudo-PET image of a subject's brain administered with a particular drug over one or more time points, amyloid accumulation over the one or more time points, and the one or more time points. Display at least one of the tau protein accumulations over.
端末装置は、医師等が使用するものでもよく、被験者(患者)が使用するものでもよい。特定の薬物の投与期間に亘って、1つの疑似PET画像、又は疑似PET画像が時系列に表示され、あるいはアミロイド蓄積状態又はアミロイド蓄積の変化、あるいはタウ蛋白蓄積状態又はタウ蛋白蓄積の変化が表示されるので、薬物の効果の有無を確認することができる。
The terminal device may be used by a doctor or the like, or may be used by a subject (patient). One pseudo-PET image, or pseudo-PET image, is displayed in chronological order over the administration period of a specific drug, or changes in amyloid accumulation state or amyloid accumulation, or changes in tau protein accumulation state or tau protein accumulation are displayed. Therefore, it is possible to confirm the presence or absence of the effect of the drug.
本実施の形態の端末装置は、前記薬物に関連する有害事象を表示する。
The terminal device of the present embodiment displays adverse events related to the drug.
有害事象は、副作用を含む。例えば、悪心、嘔吐、頭痛、徐脈、狭心症、心筋梗塞、脳血管発作、痙攣発作、アミロイド関連画像異常(ARIA、ARIA-E、ARIA-Hなど)、転倒などの少なくとも1つを含む。これにより、薬物の効用だけでなく、副作用等も確認できる。
Adverse events include side effects. For example, including at least one of nausea, vomiting, headache, bradycardia, angina, myocardial infarction, cerebrovascular attack, seizure attack, amyloid-related imaging abnormalities (ARIA, ARIA-E, ARIA-H, etc.), falls, etc. .. As a result, not only the efficacy of the drug but also side effects and the like can be confirmed.
1 通信ネットワーク
10、20 端末装置
50 情報処理装置
51 制御部
52 通信部
53 記憶部
54 診断情報生成部
55 推定部
551 入力データ生成部
552 モデル部
56 学習処理部
561 学習データ生成部
562 モデル部
563 パラメータ決定部
57 インタフェース部
61 画像DB
71 PET装置
72 MRI装置 1 Communication network 10, 20 Terminal equipment 50 Information processing equipment 51 Control unit 52 Communication unit 53 Storage unit 54 Diagnostic information generation unit 55 Estimating unit 551 Input data generation unit 552 Model unit 56 Learning processing unit 561 Learning data generation unit 562 Model unit 563 Parameter determination unit 57 Interface unit 61 Image DB
71PET device 72 MRI device
10、20 端末装置
50 情報処理装置
51 制御部
52 通信部
53 記憶部
54 診断情報生成部
55 推定部
551 入力データ生成部
552 モデル部
56 学習処理部
561 学習データ生成部
562 モデル部
563 パラメータ決定部
57 インタフェース部
61 画像DB
71 PET装置
72 MRI装置 1
71
Claims (13)
- コンピュータに、
被験者の脳に関する、1又は複数の時点で撮像された1又は複数のMRI画像を取得し、
脳に関するMRI画像を入力した場合、前記脳に関する疑似PET画像を出力する学習済みモデルに、取得した1又は複数のMRI画像を入力して、前記被験者の脳に関する、前記1又は複数の時点での疑似PET画像を出力する、
処理を実行させるコンピュータプログラム。 On the computer
Obtain one or more MRI images of the subject's brain taken at one or more time points.
When an MRI image about the brain is input, the acquired one or more MRI images are input to the trained model that outputs a pseudo PET image about the brain, and the acquired MRI image is input to the subject's brain at the one or more time points. Output a pseudo PET image,
A computer program that executes processing. - コンピュータに、
前記複数の時点のうちの第1時点で撮像された前記被験者の脳に関するPET画像を取得し、
脳に関する第1時点で撮像されたMRI画像及びPET画像並びに前記複数の時点のうちの前記第1時点より後の第2時点で撮像された前記脳に関するMRI画像を入力した場合、前記第2時点での前記脳に関する疑似PET画像を出力する学習モデルに、前記第1時点で撮像された前記被験者の脳に関するPET画像を入力して、前記第2時点での前記被験者の脳に関する疑似PET画像を出力する、
処理を実行させる請求項1に記載のコンピュータプログラム。 On the computer
A PET image of the subject's brain captured at the first of the plurality of time points was acquired.
When the MRI image and PET image taken at the first time point regarding the brain and the MRI image about the brain taken at the second time point after the first time point among the plurality of time points are input, the second time point is mentioned. The PET image of the subject's brain captured at the first time point is input to the learning model that outputs the pseudo PET image of the brain in the second time point, and the pseudo PET image of the subject's brain at the second time point is obtained. Output,
The computer program according to claim 1, wherein the processing is executed. - コンピュータに、
前記複数の時点での疑似PET画像を時系列に表示する、
処理を実行させる請求項1又は請求項2に記載のコンピュータプログラム。 On the computer
The pseudo PET images at the plurality of time points are displayed in chronological order.
The computer program according to claim 1 or 2, wherein the process is executed. - コンピュータに、
前記複数の時点での疑似PET画像に基づく診断情報を生成する、
処理を実行させる請求項1から請求項3のいずれか一項に記載のコンピュータプログラム。 On the computer
Generate diagnostic information based on the pseudo PET images at the plurality of time points.
The computer program according to any one of claims 1 to 3, wherein the processing is executed. - 前記診断情報は、
前記複数の時点での疑似PET画像に基づいて特定されるPET診断指標を含む、
請求項4に記載のコンピュータプログラム。 The diagnostic information is
Includes PET diagnostic indicators identified based on the pseudo-PET images at the plurality of time points.
The computer program according to claim 4. - 前記診断情報は、
前記疑似PET画像毎に前記被験者に関する脳疾患診断結果と前記PET診断指標とを含む、
請求項5に記載のコンピュータプログラム。 The diagnostic information is
Each pseudo PET image includes a brain disease diagnosis result for the subject and the PET diagnostic index.
The computer program according to claim 5. - 前記診断情報は、
前記PET診断指標と比較対象者のPET診断指標とを含む、
請求項5又は請求項6に記載のコンピュータプログラム。 The diagnostic information is
The PET diagnostic index and the PET diagnostic index of the comparison subject are included.
The computer program according to claim 5 or 6. - 被験者の脳に関する、1又は複数の時点で撮像された1又は複数のMRI画像を取得する取得部と、
脳に関するMRI画像を入力した場合、前記脳に関する疑似PET画像を出力する学習済みモデルに、取得した1又は複数のMRI画像を入力して、前記被験者の脳に関する、前記1又は複数の時点での疑似PET画像を出力する出力部と
を備える情報処理装置。 An acquisition unit that acquires one or more MRI images taken at one or more time points with respect to the subject's brain.
When an MRI image about the brain is input, the acquired one or more MRI images are input to the trained model that outputs a pseudo PET image about the brain, and the acquired MRI image is input to the subject's brain at the one or more time points. An information processing device including an output unit that outputs a pseudo PET image. - 特定の薬物を投与された被験者の脳に関する、1又は複数の時点に亘る疑似PET画像、前記1又は複数の時点に亘るアミロイド蓄積、及び前記1又は複数の時点に亘るタウ蛋白蓄積の少なくとも一方を表示する、
端末装置。 Pseudo-PET images of a subject's brain treated with a particular drug over one or more time points, amyloid accumulation over one or more time points, and at least one of the tau protein accumulations over one or more time points. indicate,
Terminal device. - 前記薬物に関連する有害事象を表示する、
請求項9に記載の端末装置。 Display adverse events related to the drug,
The terminal device according to claim 9. - 被験者の脳に関する、1又は複数の時点で撮像された1又は複数のMRI画像を取得し、
脳に関するMRI画像を入力した場合、前記脳に関する疑似PET画像を出力する学習済みモデルに、取得した1又は複数のMRI画像を入力して、前記被験者の脳に関する、前記1又は複数の時点での疑似PET画像を出力する、
情報処理方法。 Obtain one or more MRI images of the subject's brain taken at one or more time points.
When an MRI image about the brain is input, the acquired one or more MRI images are input to the trained model that outputs a pseudo PET image about the brain, and the acquired MRI image is input to the subject's brain at the one or more time points. Output a pseudo PET image,
Information processing method. - 脳に関する第1時点で撮像されたMRI画像及びPET画像を取得し、
前記第1時点より後の第2時点で撮像された前記脳に関するMRI画像及びPET画像を取得し、
取得された、前記第1時点及び第2時点それぞれで撮像されたMRI画像及びPET画像を用いて、前記第1時点で撮像された脳に関するMRI画像及びPET画像、並びに前記第2時点で撮像された前記脳に関するMRI画像を入力した場合、前記第2時点での前記脳に関する疑似PET画像を出力する学習済みモデルを生成する、
学習済みモデル生成方法。 MRI and PET images taken at the first time point regarding the brain are acquired and
MRI images and PET images related to the brain captured at the second time point after the first time point were acquired.
Using the acquired MRI and PET images captured at the first and second time points, respectively, the MRI and PET images of the brain captured at the first time point and the second time point are captured. When an MRI image relating to the brain is input, a trained model that outputs a pseudo PET image relating to the brain at the second time point is generated.
Trained model generation method. - 脳に関する第1時点で撮像されたMRI画像及びPET画像並びに前記第1時点より後の第2時点で撮像された前記脳に関するMRI画像を入力した場合に、前記第2時点での前記脳に関する疑似PET画像を出力する、
画像出力装置。
When the MRI image and PET image taken at the first time point regarding the brain and the MRI image about the brain taken at the second time point after the first time point are input, the pseudo image about the brain at the second time point is input. Output PET image,
Image output device.
Priority Applications (1)
| Application Number | Priority Date | Filing Date | Title |
|---|---|---|---|
| JP2022547553A JPWO2022054711A1 (en) | 2020-09-10 | 2021-09-03 |
Applications Claiming Priority (2)
| Application Number | Priority Date | Filing Date | Title |
|---|---|---|---|
| JP2020-152199 | 2020-09-10 | ||
| JP2020152199 | 2020-09-10 |
Publications (1)
| Publication Number | Publication Date |
|---|---|
| WO2022054711A1 true WO2022054711A1 (en) | 2022-03-17 |
Family
ID=80631772
Family Applications (1)
| Application Number | Title | Priority Date | Filing Date |
|---|---|---|---|
| PCT/JP2021/032440 WO2022054711A1 (en) | 2020-09-10 | 2021-09-03 | Computer program, information processing device, terminal device, information processing method, learned model generation method, and image output device |
Country Status (2)
| Country | Link |
|---|---|
| JP (1) | JPWO2022054711A1 (en) |
| WO (1) | WO2022054711A1 (en) |
Cited By (2)
| Publication number | Priority date | Publication date | Assignee | Title |
|---|---|---|---|---|
| WO2024044696A1 (en) * | 2022-08-25 | 2024-02-29 | Genentech, Inc. | Quantifying amyloid-related imaging abnormalites (aria) in alzheimer's patients |
| WO2024044695A1 (en) * | 2022-08-25 | 2024-02-29 | Genentech, Inc. | Segmenting and detecting amyloid-related imaging abnormalites (aria) in alzheimer's patients |
Citations (6)
| Publication number | Priority date | Publication date | Assignee | Title |
|---|---|---|---|---|
| JP2006320387A (en) * | 2005-05-17 | 2006-11-30 | Univ Of Tsukuba | Computer-aided diagnosis apparatus and method |
| JP2010520478A (en) * | 2007-03-06 | 2010-06-10 | コーニンクレッカ フィリップス エレクトロニクス エヌ ヴィ | Automatic diagnosis and automatic alignment supplemented using PET / MR flow estimation |
| US20130266198A1 (en) * | 2012-04-04 | 2013-10-10 | Siemens Corporation | Method for creating attenuation correction maps for pet image reconstruction |
| JP2018505705A (en) * | 2014-12-10 | 2018-03-01 | コーニンクレッカ フィリップス エヌ ヴェKoninklijke Philips N.V. | System and method for transforming medical imaging using machine learning |
| KR20180097214A (en) * | 2017-02-23 | 2018-08-31 | 고려대학교 산학협력단 | Method of predicting recurrence region and generating pet image using deep learning, and apparatus thereof |
| WO2020054803A1 (en) * | 2018-09-12 | 2020-03-19 | 株式会社Splink | Diagnosis assistance system and method |
-
2021
- 2021-09-03 WO PCT/JP2021/032440 patent/WO2022054711A1/en active Application Filing
- 2021-09-03 JP JP2022547553A patent/JPWO2022054711A1/ja active Pending
Patent Citations (6)
| Publication number | Priority date | Publication date | Assignee | Title |
|---|---|---|---|---|
| JP2006320387A (en) * | 2005-05-17 | 2006-11-30 | Univ Of Tsukuba | Computer-aided diagnosis apparatus and method |
| JP2010520478A (en) * | 2007-03-06 | 2010-06-10 | コーニンクレッカ フィリップス エレクトロニクス エヌ ヴィ | Automatic diagnosis and automatic alignment supplemented using PET / MR flow estimation |
| US20130266198A1 (en) * | 2012-04-04 | 2013-10-10 | Siemens Corporation | Method for creating attenuation correction maps for pet image reconstruction |
| JP2018505705A (en) * | 2014-12-10 | 2018-03-01 | コーニンクレッカ フィリップス エヌ ヴェKoninklijke Philips N.V. | System and method for transforming medical imaging using machine learning |
| KR20180097214A (en) * | 2017-02-23 | 2018-08-31 | 고려대학교 산학협력단 | Method of predicting recurrence region and generating pet image using deep learning, and apparatus thereof |
| WO2020054803A1 (en) * | 2018-09-12 | 2020-03-19 | 株式会社Splink | Diagnosis assistance system and method |
Cited By (2)
| Publication number | Priority date | Publication date | Assignee | Title |
|---|---|---|---|---|
| WO2024044696A1 (en) * | 2022-08-25 | 2024-02-29 | Genentech, Inc. | Quantifying amyloid-related imaging abnormalites (aria) in alzheimer's patients |
| WO2024044695A1 (en) * | 2022-08-25 | 2024-02-29 | Genentech, Inc. | Segmenting and detecting amyloid-related imaging abnormalites (aria) in alzheimer's patients |
Also Published As
| Publication number | Publication date |
|---|---|
| JPWO2022054711A1 (en) | 2022-03-17 |
Similar Documents
| Publication | Publication Date | Title |
|---|---|---|
| Vemuri et al. | Antemortem MRI based STructural Abnormality iNDex (STAND)-scores correlate with postmortem Braak neurofibrillary tangle stage | |
| Biondetti et al. | Spatiotemporal changes in substantia nigra neuromelanin content in Parkinson’s disease | |
| Hiscox et al. | Mechanical property alterations across the cerebral cortex due to Alzheimer’s disease | |
| Warren et al. | Elevated markers of inflammation are associated with longitudinal changes in brain function in older adults | |
| Mutlu et al. | Distinct influence of specific versus global connectivity on the different Alzheimer’s disease biomarkers | |
| Jack Jr et al. | 11C PiB and structural MRI provide complementary information in imaging of Alzheimer's disease and amnestic mild cognitive impairment | |
| Schultz et al. | Subjective memory complaints, cortical thinning, and cognitive dysfunction in middle-age adults at risk of AD | |
| Sperling et al. | Amyloid deposition is associated with impaired default network function in older persons without dementia | |
| Tosun et al. | Spatial patterns of brain amyloid-β burden and atrophy rate associations in mild cognitive impairment | |
| Greene et al. | Subregions of the inferior parietal lobule are affected in the progression to Alzheimer's disease | |
| EP1595205B1 (en) | Tissue disorder imaging analysis | |
| Haris et al. | T1rho (T 1ρ) MR imaging in Alzheimer’disease and Parkinson’s disease with and without dementia | |
| Spulber et al. | Whole brain atrophy rate predicts progression from MCI to Alzheimer’s disease | |
| WO2022054711A1 (en) | Computer program, information processing device, terminal device, information processing method, learned model generation method, and image output device | |
| Kawagoe et al. | Subjective memory complaints are associated with altered resting-state functional connectivity but not structural atrophy | |
| Rasero et al. | Group-level progressive alterations in brain connectivity patterns revealed by diffusion-tensor brain networks across severity stages in Alzheimer’s disease | |
| Schäfer et al. | Predicting brain atrophy from tau pathology: a summary of clinical findings and their translation into personalized models | |
| Sánchez et al. | White matter fiber density abnormalities in cognitively normal adults at risk for late-onset Alzheimer's disease | |
| Firbank et al. | Hippocampal and insula volume in mild cognitive impairment with Lewy bodies | |
| Uscătescu et al. | Effective connectivity of the hippocampus can differentiate patients with schizophrenia from healthy controls: a spectral DCM approach | |
| Kara et al. | 1H MR spectroscopy biomarkers of neuronal and synaptic function are associated with tau deposition in cognitively unimpaired older adults | |
| Corriveau-Lecavalier et al. | Default mode network failure and neurodegeneration across aging and amnestic and dysexecutive Alzheimer’s disease | |
| Lingo VanGilder et al. | Using whole-brain diffusion tensor analysis to evaluate white matter structural correlates of delayed visuospatial memory and one-week motor skill retention in nondemented older adults: A preliminary study | |
| Chen et al. | Relationship between hippocampal subfield volumes and memory deficits in patients with thalamus infarction | |
| JP7489645B2 (en) | COMPUTER PROGRAM, INFORMATION PROCESSING APPARATUS, INFORMATION PROCESSING METHOD, TRAINED MODEL GENERATION METHOD, AND CORRELATION IMAGE OUTPUT APPARATUS |
Legal Events
| Date | Code | Title | Description |
|---|---|---|---|
| 121 | Ep: the epo has been informed by wipo that ep was designated in this application |
Ref document number: 21866670 Country of ref document: EP Kind code of ref document: A1 |
|
| ENP | Entry into the national phase |
Ref document number: 2022547553 Country of ref document: JP Kind code of ref document: A |
|
| NENP | Non-entry into the national phase |
Ref country code: DE |
|
| 122 | Ep: pct application non-entry in european phase |
Ref document number: 21866670 Country of ref document: EP Kind code of ref document: A1 |