WO2019109077A1 - Nanoparticles and distinct exosome subsets for detection and treatment of cancer - Google Patents
Nanoparticles and distinct exosome subsets for detection and treatment of cancer Download PDFInfo
- Publication number
- WO2019109077A1 WO2019109077A1 PCT/US2018/063612 US2018063612W WO2019109077A1 WO 2019109077 A1 WO2019109077 A1 WO 2019109077A1 US 2018063612 W US2018063612 W US 2018063612W WO 2019109077 A1 WO2019109077 A1 WO 2019109077A1
- Authority
- WO
- WIPO (PCT)
- Prior art keywords
- subject
- exosomes
- absence
- standard
- exomeres
- Prior art date
Links
Classifications
-
- G—PHYSICS
- G01—MEASURING; TESTING
- G01N—INVESTIGATING OR ANALYSING MATERIALS BY DETERMINING THEIR CHEMICAL OR PHYSICAL PROPERTIES
- G01N33/00—Investigating or analysing materials by specific methods not covered by groups G01N1/00 - G01N31/00
- G01N33/48—Biological material, e.g. blood, urine; Haemocytometers
- G01N33/50—Chemical analysis of biological material, e.g. blood, urine; Testing involving biospecific ligand binding methods; Immunological testing
- G01N33/53—Immunoassay; Biospecific binding assay; Materials therefor
- G01N33/574—Immunoassay; Biospecific binding assay; Materials therefor for cancer
- G01N33/57484—Immunoassay; Biospecific binding assay; Materials therefor for cancer involving compounds serving as markers for tumor, cancer, neoplasia, e.g. cellular determinants, receptors, heat shock/stress proteins, A-protein, oligosaccharides, metabolites
-
- G—PHYSICS
- G01—MEASURING; TESTING
- G01N—INVESTIGATING OR ANALYSING MATERIALS BY DETERMINING THEIR CHEMICAL OR PHYSICAL PROPERTIES
- G01N33/00—Investigating or analysing materials by specific methods not covered by groups G01N1/00 - G01N31/00
- G01N33/48—Biological material, e.g. blood, urine; Haemocytometers
- G01N33/50—Chemical analysis of biological material, e.g. blood, urine; Testing involving biospecific ligand binding methods; Immunological testing
- G01N33/53—Immunoassay; Biospecific binding assay; Materials therefor
- G01N33/574—Immunoassay; Biospecific binding assay; Materials therefor for cancer
-
- C—CHEMISTRY; METALLURGY
- C12—BIOCHEMISTRY; BEER; SPIRITS; WINE; VINEGAR; MICROBIOLOGY; ENZYMOLOGY; MUTATION OR GENETIC ENGINEERING
- C12Q—MEASURING OR TESTING PROCESSES INVOLVING ENZYMES, NUCLEIC ACIDS OR MICROORGANISMS; COMPOSITIONS OR TEST PAPERS THEREFOR; PROCESSES OF PREPARING SUCH COMPOSITIONS; CONDITION-RESPONSIVE CONTROL IN MICROBIOLOGICAL OR ENZYMOLOGICAL PROCESSES
- C12Q1/00—Measuring or testing processes involving enzymes, nucleic acids or microorganisms; Compositions therefor; Processes of preparing such compositions
- C12Q1/68—Measuring or testing processes involving enzymes, nucleic acids or microorganisms; Compositions therefor; Processes of preparing such compositions involving nucleic acids
- C12Q1/6876—Nucleic acid products used in the analysis of nucleic acids, e.g. primers or probes
- C12Q1/6883—Nucleic acid products used in the analysis of nucleic acids, e.g. primers or probes for diseases caused by alterations of genetic material
- C12Q1/6886—Nucleic acid products used in the analysis of nucleic acids, e.g. primers or probes for diseases caused by alterations of genetic material for cancer
-
- G—PHYSICS
- G01—MEASURING; TESTING
- G01N—INVESTIGATING OR ANALYSING MATERIALS BY DETERMINING THEIR CHEMICAL OR PHYSICAL PROPERTIES
- G01N33/00—Investigating or analysing materials by specific methods not covered by groups G01N1/00 - G01N31/00
- G01N33/48—Biological material, e.g. blood, urine; Haemocytometers
- G01N33/50—Chemical analysis of biological material, e.g. blood, urine; Testing involving biospecific ligand binding methods; Immunological testing
- G01N33/68—Chemical analysis of biological material, e.g. blood, urine; Testing involving biospecific ligand binding methods; Immunological testing involving proteins, peptides or amino acids
-
- C—CHEMISTRY; METALLURGY
- C12—BIOCHEMISTRY; BEER; SPIRITS; WINE; VINEGAR; MICROBIOLOGY; ENZYMOLOGY; MUTATION OR GENETIC ENGINEERING
- C12Q—MEASURING OR TESTING PROCESSES INVOLVING ENZYMES, NUCLEIC ACIDS OR MICROORGANISMS; COMPOSITIONS OR TEST PAPERS THEREFOR; PROCESSES OF PREPARING SUCH COMPOSITIONS; CONDITION-RESPONSIVE CONTROL IN MICROBIOLOGICAL OR ENZYMOLOGICAL PROCESSES
- C12Q2600/00—Oligonucleotides characterized by their use
- C12Q2600/106—Pharmacogenomics, i.e. genetic variability in individual responses to drugs and drug metabolism
-
- C—CHEMISTRY; METALLURGY
- C12—BIOCHEMISTRY; BEER; SPIRITS; WINE; VINEGAR; MICROBIOLOGY; ENZYMOLOGY; MUTATION OR GENETIC ENGINEERING
- C12Q—MEASURING OR TESTING PROCESSES INVOLVING ENZYMES, NUCLEIC ACIDS OR MICROORGANISMS; COMPOSITIONS OR TEST PAPERS THEREFOR; PROCESSES OF PREPARING SUCH COMPOSITIONS; CONDITION-RESPONSIVE CONTROL IN MICROBIOLOGICAL OR ENZYMOLOGICAL PROCESSES
- C12Q2600/00—Oligonucleotides characterized by their use
- C12Q2600/118—Prognosis of disease development
-
- G—PHYSICS
- G01—MEASURING; TESTING
- G01N—INVESTIGATING OR ANALYSING MATERIALS BY DETERMINING THEIR CHEMICAL OR PHYSICAL PROPERTIES
- G01N33/00—Investigating or analysing materials by specific methods not covered by groups G01N1/00 - G01N31/00
- G01N33/48—Biological material, e.g. blood, urine; Haemocytometers
- G01N33/50—Chemical analysis of biological material, e.g. blood, urine; Testing involving biospecific ligand binding methods; Immunological testing
- G01N33/68—Chemical analysis of biological material, e.g. blood, urine; Testing involving biospecific ligand binding methods; Immunological testing involving proteins, peptides or amino acids
- G01N33/6893—Chemical analysis of biological material, e.g. blood, urine; Testing involving biospecific ligand binding methods; Immunological testing involving proteins, peptides or amino acids related to diseases not provided for elsewhere
Definitions
- the present invention relates to rmnoparticies and distinct exosome subsets for detection and treatment of cancer.
- EVs are heterogeneous and comprise various subclasses, including exosomes, which are small (50 ran to 150 nm) extracellular membrane vesicles of endosomal origin, and microvesicles, which are large (150 nm to 500 nm or even larger to >10gm) vesicles shed directly by budding from the cellular plasma membrane. Cancer cells shed atypical!y large vesicles, known as large oncosomes (0.5 p to 10 pm) which result from alterations in specific signaling pathways (e g.
- Ras Homolog Family Member A/Rho-associaied protein kinase (RhoA/Rock) signaling) (Di Vizio et al,“Oncosome Formation in Prostate Cancer: Association with a Region of Frequent Chromosomal Deletion in Metastatic Disease,” Cancer Res 69:5601- 5609 (2009); More!!o et a!.,“Large Oncosomes Mediate Intercellular Transfer of Functional MieroRNA,” Cell Cycle 12:3526-3536 (2013); Mineiacehi et ah,“MYC Mediates Large Oncosome- induced Fibroblast Reprogramming in Prostate Cancer,” Cancer Res 77:2306-2317 (2017)).
- Exosomes are narsosixed extracellular membrane vesicles of endosomal origin secreted by most cell types, including cancer cells (Thery et ah,‘'Exosomes: Composition, Biogenesis and Function,” Nature Reviews, Imnmmdog ⁇ 2:569-579 (2002); El Andaioussi et al, "Extracellular Vesicles: Biology and Emerging Therapeutic Opportunities;’ Nature Reviews. Drug Discovery 12:347-357 (2013); Raposo et al, "Extracellular Vesicles: Exosomes,
- a first aspect of the present invention is directed to a method of diagnosing cancer in a subject. This method involves selecting a subject having cancer and obtaining, from the selected subject, a population of either exomeres having a diameter of less than 50 nm, small exosomes having a diameter of 60-80 nm, or large exosomes having a diameter of 90- i 20 nm.
- exomeres, small exosomes, or large exosomes are recovered from the sample, and the exomeres, small exosomes, or large exosomes or portions thereof are contacted with one or more reagents suitable to detect: ( l ) higher or lower levels, relative to a standard for subjects not having cancer, or the presence or absence, of one or more proteins contained In said exomeres, small exosomes, or large exosomes, (2) higher or lower levels, relative to a standard for subjects not having cancer, or the presence or absence, of one or more N-g!yeans contained In said exomeres, small exosomes, or large exosomes, (3) higher or lower levels, relative to a standard for subjects not having cancer, or the presence or absence, of one or more lipids contained in said exomeres, small exosomes, or large exosomes, (4) the presence or absence of one or more genetic mutations in nucleic acid molecules associated with cancer and contained in said exomeres, small exosome
- Another aspect of the present invention is directed to a method of prognosing cancer in a subject. This method involves selecting a subject having cancer and obtaining, from the selected subject, a population of either exomeres having a diameter of less than 50 nm, small exosomes having a diameter of 60-80 nm, or large exosomes having a diameter of 90- 120 nm.
- exomeres, small exosomes, or large exosomes are recovered from the sample, and the exomeres, small exosomes, or large exosomes or portions thereof are contacted with one or more reagents suitable to detect: (I) higher or lower levels, relative to a standard or to the level in a prior sample obtained from the subject, or the presence or absence, of one or more proteins contained in said exomeres, small exosomes, or large exosomes, (2) higher or lower levels, relative to a standard or to the level in a prior sample obtained from the subject, or the presence or absence, of one or more N-glycans contained in said exomeres, small exosomes, or large exosomes, (3) higher or lower levels, relative to a standard or to the level in a prior sample obtained from the subject, or the presence or absence, of one or more lipids contained in said exomeres, small exosomes, or large exosomes, (4) the presence or absence of one or more genetic mutations in
- Another aspect of the present invention is directed to a method of managing treatment in a subject. This method involves selecting a subject undergoing treatment for cancer and obtaining, from the selected subject, a population of either exomeres having a diameter of less than 50 nm, small exosomes having a diameter of 60-80 nm, or large exosomes having a diameter of 90-120 nm.
- exomeres, small exosomes, or large exosomes are recovered from the sample and the exomeres, small exosomes, or large exosomes or portions thereof are co tacted with one or more reagents suitable to detect: ( 1 ) higher or lower levels, relative to a standard or to the level in a prior sample obtained from the subject, or the presence or absence, of one or more proteins contained in said exomeres, small exosomes, or large exosomes, (2) higher or lower levels, relative to a standard or to the level in a prior sample obtained from the subject, or the presence or absence, of one or more N ⁇ giycans contained in said exomeres, small exosomes, or large exosomes, (3) higher or lower levels, relative to a standard or to the level in a prior sample obtained from the subject, or the presence or absence, of one or more lipids contained in said exomeres, small exosomes, or large exosomes, (4) the presence or absence of one or more genetic
- kits suitable for diagnosing cancer includes one or more reagents suitable to detect: (1 ) higher or lower levels, relative to a standard or to a sample from a subject, or the presence or absence, of one or more proteins contained in exomeres, small exosomes, or large exosomes, ⁇ 2 ⁇ higher or lower levels, relative to a standard or to a sample from a subject, or the presence or absence, of one or more N- glycans contained in exomeres, small exosomes, or large exosomes, (3) higher or lower levels, relative to a standard or to a sample from a subject, or the presence or absence, of one or more lipids contained in exomeres, small exosomes, or large exosomes, (4) the presence or absence of one or more genetic mutations in nucleic acid molecules associated with cancer and contained in exomeres, small exosomes, or large exosomes, or (5) combinations thereof
- exomeres are a prominent and heterogeneous population of small ( ⁇ 50 n hydrodynamic diameter, with a peak about 35 nm), weakly negatively charged (-2.7 mV to -9.7 mV), and highly stiff ⁇ - 145-SI 6 MPa) nanoparticles secreted by cells.
- Exo-S and Bxo-L contain unique molecular signatures In comparison to each other, These nanoparticles are secreted into both the surrounding environment of cells and the peripheral circulation system and other types of body fluids. Therefore, these nanopartides represent a reservoir of biomarkers for cancer diagnosis, prognosis and monitoring disease progression and recurrence post treatment.
- exomeres and exosome subsets can horizontally transfer their cargo to recipient cells, thereby acting as vehicles of lntercelluSar communication in both physiological and pathological conditions, thus representing targets of therapeutics development.
- exomere proteomic profiling revealed an enrichment in metabolic enzymes and hypoxia, microtubule and coagulation proteins and specs fie pathways, such as glycolysis and mTOR signaling.
- Exo-S and Exo ⁇ L contained proteins involved In endosomal function and secretion pathways, and mitotic spindle and 1L-2/STAT5 signaling pathways, respectively .
- Exo-S demonstrated higher uptake by the lung and Exo-L by lymph nodes, suggesting their potential roles in mediating organ-specific metastasis and immune response during disease progression, respectively
- FIGs. I A- IG show the identification, via AF4 and EM imaging analysis, of exomeres and two distinct subpopulations of exosomes released by tumor cells
- FIG, 1 A shows a representative AF4 fractionation profile of B 16-F 10-derived exosomes, x- axis, time (min); y- axis (scale) and black dots, hydrodynamic radius (nm); red and blue lines Illustrate the QELS (DLS) intensity and UV absorbance (shown on a relative scale) respectively- P I-P5 marks the peaks detected based on UV absorbance.
- DLS QELS
- UV absorbance shown on a relative scale
- FIG. 1 B shows a representative correlation function at peak 3 (P3), t - 25.1 min.
- FIG. 1 C shows TEM imaging analysis of exosome Input mixture (pre-fractionation) and fractionated exomeres, Exo-S and Exo-L subpopulations. Arrows point to exomeres (red), Exo-S (blue) and Exo-L (green). Scale bar, 200 nm. This experiment was repeated 7 times Independently with similar results.
- FIG. 1 C shows a representative correlation function at peak
- i D shows Western blotting analysis of exosomal marker proteins in fractionated samples. ! 00 pg of whole cell extract (WCE) and ID pg of exosome and exomere mixture input and each subset were analyzed. This experiment was done once.
- FIG. I E shows measurement of hydrodynamic diameters of exomeres, Exo-S and Exo-L derived from representative DC 1 1 ines (/. ⁇ ?.
- FIG. IG shows TEM imaging analysis of fractions collected from explant culture of fresh human melanoma tissue, Scale bar, 200 nm. This experiment was performed with two independent specimens with similar results, FIG. IG shows a batch mode measurement of hydrodynamic diameters of fractions shown in FIG, 1 F, Data are presented as meaniSEM (exomeres and Exo-L, ?r ⁇ 6: Exo-S, 7 independent measurements). Unprocessed blots are provided in FIG. 14.
- FIGs, 2A-2K shows characterization of AF4 fractions using TEM Imaging
- FIG. 2 A shows TEM analysis of particles in AP4 peaks PI and P5 of B16-F10, The experiment was repeated independently 3 times with similar result. Scale bar, 500 nm.
- FIG, 2B shows a comparison of the hydrodynam c diameter of each fraction determined by AF4-QELS versus NTA, Individual fractions (time slice, 0,5 min/fraction) were taken every 2 minutes from 20 to 44 minutes during the AF4 time course, and subjected to NT A. Results shown are mean ⁇ SEM (nO independent samples). Mode size from TA was utilized.
- FIG, 2C shows the size distribution profiles of representative fractions by NTA (input, unfractionated samples; fractions at 20, 32, and 44 minutes). Multiple peaks were detected for fractions at 20 and 44 minutes by NTA. A mode size of 126 nm of input indicates that NTA cannot efficiently resolve
- FIG. 2D shows the particle concentration of each fraction measured by NT A.
- the hydrodynamic diameter of the peak fraction (28 minutes) was 77nm
- Results shown are mean ⁇ SEM (n 3 independent samples)
- FIGs, 2E-2I show AF4 profiles of BI6-FI0 sEVs collected from technical (blue lines, replicate # 1 ; red lines, replicate
- FIG. 2E biological replicates
- Differences in UV and QELS signal Intensity is due to the different amount of input samples for two replicates
- FIG. 2F kept at either 4 " C or - 80 a C for one week (red lines, QELS; blue lines, UV; black (fresh) and green dots (frozen), hydrodynamic radius)
- FIGs. 2G cells of different passage numbers (blue and red lines, UV of cells at passage 10 and 18, respectively; black dots, hydrodynamic radius) (FIG, 2H), and under hypoxic versus norm ox ic conditions for 48 h (blue and red lines, UV for samples cultured with 20% and 1 % f3 ⁇ 4 5 respectively; black dots, hydrodynamic radius) (FIG. 21).
- FIGs. 2E-2G and twice fo FIG, 2H with similar results.
- FIG, 21 the experiment was repeated with 3 different cell lines independently with similar results.
- FIGs, 2i and 2k show AF4 (FIG, 2J) and TEM (FIG.
- FIGs, 3A-3B show identification of exomeres and exoso e subpopulations released by multiple cancer cell lines. Shown are AF4 profiles (FIG, 3A) and representative TEM images (FIG, 3B) of m fractionated input samples and pooled fractions of exomeres, Exo S and Exo ⁇ L that derived from various cancer cell lines, including AsPG-L Pan02, MDA-MB- 231 -41 75, and 4TI . Multiple independent experiments were conducted with similar results for (FIG.
- FIGs, 4A-4B show defection of exomeres, Exo-S and Exo-L In samples isolated from the tissue explant cultures.
- FIG. 4A is an AF4 profile of exosomes Isolated from explant culture of fresh human melanoma tissues. Red and blue lines illustrate the QELS (DLS) intensity and UV absorbance, respectively. This experiment was repeated with 4 Independent specimens with similar results.
- FIG. 4B shows TEM images of exosome samples isolated from the explant culture of normal mouse mammary fat pad and lung tissues, This experiment was repeated independently 2 times with similar results, Seale bar, 500 n .
- FIG. 5A-5D show characterization of physical and mechanical properties of exomeres and exosome subpopulations.
- Zeia potential (FIG. 5 A) and stiffness (FIG. SB) of exomeres and exosome subpopulations derived from various cancer cells were measured using Zetasizer and AFM indentation, respectively. Young's modulus was used to express particle stiffness. At least 3 and 5 replicates for each group of particles was measured for zeta potential and stiffness, respectively. Data are presented as meaniSEM, For FIG.
- FIG. SC shows a representative AFM image of exomeres derived from B I 6F I 0.
- FIG. 5D shows AFM imaging analysis of the height (z ⁇ dimension) of exomeres derived from B I 6F I 0 («—754 particles analyzed), AsPC l ( « 475) and MDA-MB-4175 ( «“160). Mean ⁇ SEM Is depicted.
- FIGs. 6A-6G show proteomic profiling of exomeres and exosome subpopulations derived from various cancer cells.
- FIG. 6A shows a Venn diagram of proteins identified in each subset of particles.
- FIG, 6B shows principal component analysis and
- FIG. 6C shows consensus clustering analysis of normalized proteomic mass spectrometry datasets from human (MDA-MB- 4175 and AsPC 1 ) and mouse ( B 16F 10, 4T I , and Pan02) cell lines.
- FIG. 6D shows a heat map illustration of unique proteins specifically associated with exomeres, Exo-S and Exo-L, Scale shown is intensity (area) subtracted by mean and divided by row standard deviation (i.e. D fatea- mean)/SD).
- FIG. 6E shows Western blot analysis of representative signature proteins in
- FIG. 6F shows a heat map illustration of the relative abundance of conventional exosome markers in exomeres.
- Exo-S and Exo-L Seale shown is Intensity (area) subtracted by mean and divided by row standard deviation (i.e, A (area- mean)/SD).
- FIG. 6G shows identification of top candidate gene sets enriched in exomere, Exo-S and Exo-L populations by gene set enrichment analysis (GSEA).
- Proteins in each subset of nanopartlcles are ranked by GSEA based on their differential expression level, Whether a prespecified pathway is significantly overrepresented toward the top or bottom of the ranked gene list in each subset of nanoparticle is evaluated using the normalized enrichment score (the green Erse), Black vertical lines mark the positions where the members of a particular pathway appear in the ranked list of genes. Proteins that contributed most to the enrichment score are listed below the plot For all proteomic analysis (FIGs. 6B-6D, FIGs. 6F-6G), a total of 30 samples (3 nanoparticle subtypes derived from 5 different cell fines; and two independent biological replicates for each narsoparticle sample) were subjected to statistical analysis. Unprocessed blots are provided in FIG. 14.
- FIGs. 7A-7E show preteomic profiling of exomeres and exosome subpopulations derived from multiple cancer cell lines.
- FIG. 7 A shows principal component analysis of normalized proteomic mass spectrometry data of exomeres, Exo-S and Exo-L derived from multiple cell lines, including DA-lVfB ⁇ 23 i -41?5, AsPC ⁇ I , 4T1 , B16F-I0 and Pan02, Two independent biological replicates were analyzed for each nanoparticle sample.
- FIG. 7B is a heat map illustration of the relative abundance of the Rab family proteins in exomeres, Exo-S and Exo-t.
- FIG. ?C shows evaluation of the presence oi ' Hpoprote - partic!e associated proteins (listed in Table 2) among the total proteins detected in the exomere, Exo-S and Exo-L derived from different cell lines. Results shown arc mean of 2 biologically independent experiments.
- FIG. 7D shows TE imaging analysis of MDL, LDL and VLDL. Scale bar, 200 n . This experiment was done once with multiple images showing similar results.
- FIG. ?C shows evaluation of the presence oi ' Hpoprote - partic!e
- FIG. 7E shows identification of specific association of signaling pathways including hypoxia (FDR, q value - 0,004), microtubule (FDR, q value ⁇ 0.002) and coagulation (FDR, q value - 0.013) with exomeres by GSEA (left panel) and the heat map illustration of the expression level of related proteins In different subsets of nanoparticles (right panel).
- FDR hypoxia
- FDR microtubule
- FDR q value ⁇ 0.002
- FDR, q value - 0.013 coagulation
- FIGs. 8A-SC show characterization of L-glycosylation of proteins associated with exomere, Exo-S and Exo-L.
- FIG. 8A shows lectin blotting analysis of A ; -glycan profile of proteins associated with exomeres versus exosome subpopulations Exo-S and Exo-L.
- Phaseolm vulgaris erythroagglutinin (E-PHA) and Phaseohis vulgari leucoaggiutinin (L-PHA) recognize bisected and branched A ; -glycans, respectively.
- Akuvia aunmtia lectin (AAL) recognizes FucabGIc Ac and Fuec GlcNAc.
- FIG. SB shows mass spectrometric analysis of A ' -giyeans of glycoproteins present in exomeres, Exo-S and Exo-L subsets of B I 6F 10, One representative experiment of two biologically independent replicates is shown.
- FIG. 8C shows a comparison of the relative abundance of the top six most abundant A- glycan structures among exomere, Exo-S and Exo-L of BI 6F 10.
- the assignments ( /z) [charge; neutral exchange] for MALD!-MS and nanoLC-ESI-MS/MS are the following: (2015,8 [-H; 0];
- FIGs. 9A-9J show mass spectrometric analysis of/V ' -glycans enriched in exomeres, Exo-S and Exo ⁇ L derived from AsPC- 1 and DA-M B-231-4175.
- FIG. 9A shows the total protein profile content of the isolated exomere, Exo-S and Exo-L subpopulations derived from AsPC-!, MDA ⁇ MB-23 I 4S 75 and B16-F SO assessed by silver staining.
- FIG. 9B shows the A-glycan mass spectra of particles derived from AsPC- 1 (left panel) and MDA-M B 231 -4 i 75 (right panel), respectively. This experiment was done once with 3 analytic replicates with similar results.
- FIG, 9C and FIG, 9D shows quantification of the top six most abundant A-glycan structures identified in the study of AsPC- 1 and MDA-MB-23 I-4 I 75 derived particles. Data shown were quantified and normalized to the most abundant structure in the sample. Results are represented as mean of 2 and 3 independent analytical measurements for AsPC- 1 for MDA- MB-231-4175.
- FIGs. 9E-9G the ion at m/z 1007.38(2-) * corresponding to a core-fucosylated complex type A r ⁇ glycan, characteristic of exomere
- FIGs. 9H-9J the ion at m/z 1 1 1 1.39(2-), corresponding to a disialylated complex-type A-glycan found in all fractions of B I6F10, Fragmentation analysis for extracted son chromatogram miz 1007.38 (2-) confirming the structure of this A-glycan in exomeres (FIG.
- exomeres contain both a.2,3-linked and a2,6-!inked sialoglycofor s of the ions at m/z I I I ! ,39(2-) (FIG, 9H).
- the iV-glycan m/z I I I ! ,39(2-) from Exo-S showed A-giycans displaying exclusively a2,3-!ioked sialic acids based on PGC-LC relative retention time (FIG, 91), This experiment (FIGs, 9E-9J) was done once.
- FIGs, 10A- 10C show' characterization of lipid composition in exomeres and exoso e subsets.
- FIG, 10A shows a comparison of total lipid content of each subset of nanopartides derived from different cell lines. Total signal intensity of each sample after normalization to sample weight and internal standards was compared to that f exomeres from the same set of samples (expressed as fold change). Data are presented as mean ⁇ SEM ( :; 3 biologically independent samples).
- FIG, 10B shows the relative abundance of each lipid class present in each subset of nanopartides from different cell lines. Data are presented as rrsearrfcSEfVl (it-3 biologically independent samples).
- FIG. 10A shows a comparison of total lipid content of each subset of nanopartides derived from different cell lines. Total signal intensity of each sample after normalization to sample weight and internal standards was compared to that f exomeres from the same set of samples (expressed as fold change). Data are presented as mean ⁇ SEM ( :; 3
- 10C shows a heat map illustration of lipid classes specifically associated with exomeres, Exo-S and Exo ⁇ L (ANOVA test, q G.05), Statistical analysis was performed on a total of 9 samples tor each cel! line (3 different nanoparticle subtypes and 3 independent biological repeats for each nanopartide sample).
- Car ceram ide
- CerGl -3 glucosylceraniides
- CL cardiolipin
- DG diglyceride
- LPC lysophosphaiidylchoMne
- LPE lysopbosphatidyleihanolam e
- LPG LPG
- phosphatidylcholine phosphatidylethanolamine
- PG phosphatidylglycerol
- PI phosphatidylglycerol
- phosphatidyl inositol PS, phosphatidylserine
- SM sphingomyelin
- TG triglyceride
- FIGs, 1 1 AG I D show characterization of nucleic add association with exomere and exosome subsets.
- FIG, ! 1 A shows the relative abundance of DMA associated with each sub population of particles from representative fractionations of B 16F 10, AsPC I and DA- B- 4175.
- FIG. I I B shows Agilent Bioanalyzer analysis of the size distribution of DNA associated with different subsets of particles. Data shown are the electropherograms (left) and
- FIG. 1 1C shows the relative abundance of total RNA associated with each subpopulation of particles From representative fractionations of B16F10 and AsPC 1.
- FIG. 1 1 D shows the size distribution of RNA isolated from different fractions of B 16F ⁇ 0. Shown are representative profiles from one of two independent experiments. For FIG.
- FIG. 12 shows bioanalyzer analysis of the size distribution of DNA associated with exomere, Exo-S and Exo-L derived from B 16-FIG (top) and MDA-MB-231 -4175 (bottom). This experiment was repeated twice independently with similar results,
- FIGs. 13AG3B show organ biodistribution of B 16F 10-derived exomeres and exosome subpopulations In syngeneic naive mice.
- FIG. I3A shows whole organ imaging of NIR dye-labeled exomeres, Exo-S and Exo-L from a representative experiment using the Odyssey imaging system (LI-CGR Biosciences; independent experiments). The dynamic range of signal intensity was adjusted for each organ so that the differences among these nanopartide subsets can be easily recognized. Scale bar, 2.5 mm, FIG. 13B shows quantification of the nanopartide uptake in different organs in one representative experiment. This experiment was repeated independently 4 times with similar results.
- FIG. 14 shows unprocessed blots for related figures in FIG, I , FIG. 6 and FIG, 8.
- FIGs. 15A-15C show a schematic illustration of the AF4 working principle
- FIGs, 15A-I 5C show the side views of the AF4 channel, whose height is usually several hundreds of pm. The part size shown in the figure is for illustration only and not drawn to scale.
- FIG. I 5L shows that in the Focus stage, two flows in opposing directions are pumped into the channel from the inlet and outlet posts and balanced near the injection port. Samples are Injected during the Focus stage and focused in a thin band. Particles reach level heights related to their diffusion coefficients.
- FIG, 15B shows that in the Elution stage of the normal mode, particles with small hydrodynamic size and high diffusion coefficient are eluted at an early time point, whereas particles with large hydrodynamic size and low diffusion coefficient elute late, FIG,
- FIGs. 16A-16C show the influence of cross-flow on AF4 fractionation
- FIG. 16A shows a representative AF4 fractionation profile of B 16-F10 sEVs collected by applying a linear cross-flow gradient with an initial flow rate at 0.5 mL/min within 45 minutes (Peaks are marked as PG-P5; UV (red line), QELS (blue line), 3 ⁇ 4 (black dots», or (FIG, 16B) with an Initial flow rate at 0.3 mL/min (blue line), 0,5 mL/min (red line) or 1 ,0 mL/min (black line) and dropping to 0 mL/min over 45 minutes, or (FIG, I 6C) with an initial flow rate at 0,5 mL/min and dropping to 0 mL/min over 15 minutes (blue), 30 minutes (black) or 45 minutes (red).
- FIG, 17 shows the effect of the channel height upon AF4 fractionation. Shown are AF4 fractionation profiles of B 16-F 10 sEVs collected using a channel with a spacer of 350 mhi (blue) and 490 pm (red), Top, QELS at 100°; bottom, UV absorbance at 280nm.
- the other AF4 parameters are: channel flow rate, 1 ,0 mL/min; a linear gradient of cross-flow decreasing from 0,5 mL/min to 0 mL/min over 45 minutes; sample focus time, 2 minutes; membrane, regenerated cell is lose (RC), input amount, 40 pg,
- FIG, 18 shows the effect of the focus time upon AF4 fractionation. Shown are
- the other AF4 parameters are; channel flow rate, 1 ,0 mL/min; a linear gradient of cross flow decreasing from 0.5 mL/min to 0 mL/min over 45 minutes; channel height, 490 p ;
- FIG, ! 9 shows examination of the sample (B16-F 10 sEVs) loading capacity for
- AF4 analysis Shown are AF4 fractionation profiles of B16-F10 sEVs with an input of 15pg (black), 40 pg (red); 100 pg (blue), or 150 pg (green). Top, QELS at 100°; bottom, UV absorbance at 2S0nm.
- the other AF4 parameters are; channel flow rate, 1.0 mL/min; a linear gradient of cross-flow decreasing from 0.5 mL/ in to 0 mL/min over 45 minutes; channel height, 490 pm; sample focus time, 2 minutes; membrane, regenerated cellulose (RC).
- FIG. 20 shows a comparison of the AF4 performance for separating EVs using different membranes: regenerated cellulose (RC, red) versus poly(ether)sulfone (FES, blue), B I6-F I0 sEVs were analyzed using the following AF4 parameters: channel flow rate, 1.0 mL/min; a linear gradient of cross-flow decreasing from 0,5 mL/min to 0 mL/min over 45 minutes; channel height, 490 p ; sample focus time, 2 minutes; input amount, 40 pg. Top,
- FIGs, 21 A-21 B show a schematic illustration of the overall procedure and the flow route of AF4.
- FIG. 21 A shows the overview of experimental design for cell culture-derived sEV isolation and AF4 fractionation
- FIG. 21 B is an illustration of the AF4 flow route and arrangement of online detectors.
- FIGs. 22A-22C shows representative AF4 fractionation analysis of B 16-F 10 sEVs, Shown are representative AF4 fractionation profile of B 16-F 10 sEVs (FIG, 22A) and autocorrelation functions at specific time points (FIG. 22B), FIG. 22C shows TEM imaging analysis of combined fractions for peaks P2 (exomere), P3 (Exo-S), and P4 (Exo-L), Seale bar, 200 nm. Colored arrows point to representative particles In each subpopulation.
- FIGs. 23A-23B show gene expression analysis of the livers from mice 24 hours post injection of B! 6-F! 0 derived exomeres, Exo-S and F.xo-L, in comparison with PBS control. !Opg of exomeres, Exo-S. and Exo-L, and equal volume of PBS were intravenously Injected into C57BI/6 mice, respectively. The livers of the mice were collected for RNA extraction and sequencing analysis 24 hours post injection, The total numbers of genes that are differently expressed in each comparison group are listed in FIG, 23A, and Clustering analysis of top 2000 genes that are significantly changed In comparison with the PBS control are shown In FIG, 23B.
- FIGs. 24A-24B show a heatmap illustration of the top 50 upregulated genes (FIG.
- FIGs, 25A-25E show Ingenuity Pathway Analysis (IPA) of differently expressed genes in the livers of mice 24 hours post injection of B 16-F IG derived exomeres, Exo-S and Exo-L, in comparison with PBS control Shown are representative top pathways that are significantly affected between Exomere and PBS (FIG. 25A), Exo-S and PBS (FIG, 25B), Exo-L and PBS (FIG, 2SG), Exomere and Exo-S (FIG, 25D). and Exomere and Exo-L (FIG, 25 E).
- IPA Ingenuity Pathway Analysis
- FIGs. 2SA-26C show metabolic mass spectrometry' analysis of the livers from mice treated with B16-F IQ-derived exomeres, Exo-S and Exo-L, compared with PBS control Metabolites whose abundance were significantly changed are identified using unpaired t test (FIG. 26A) and one-way ANGVA analysis (FIGs, 26B-26C) (metabolites differently detected in each group via one-way ANOVA are shown as specific individual data points in (FIG, 26B), or as clusters highlighted in boxes in (FIG, 26C) ⁇ , rt ⁇ 3 mice per group,
- FIGs, 27A-27B shows that metabolites that are upregulated or downregubted in all three groups of exomeres, Exo-S and Exo-L-trea ted mouse livers in comparison with the PBS control were identified via one-way ANOVA analysis, and the changes in their abundance are displayed in FIG, 27A and FIG, 27 B, respectively, n 3 mice per group,
- FIGs, 28A-28C show a demonstration of representative metabolites that are specifically upregulated in exomeres (FIG. 28A), Exo-S (FIG, 2SB), and Exo-L (FIG, 28C) respectively, compared with the PBS control group, n ⁇ : 3 mice per group.
- FIG. 29 shows an immunofluorescence colocalization study that revealed that kupffer cells, the liver resident macrophages, are the primary cell type that uptakes B 16-F IG melanoma-derived exomeres.
- Exomeres that are labeled with green fluorescent lipophilic PKH67 dye or the mock labeling reaction mixture were injected intravenously into naive, syngeneic C57BL/6 mice and 24 hours post injection, the livers were harvest and fixed for immunofluorescence colocalization analysis, n-3 mice per group, F4/80 was stained (in red) to Identify the macrophages in the liver.
- a first aspect of the present invention is directed to a method of diagnosing cancer in a subject
- This method involves selecting a subject having cancer and obtaining, from the selected subject, a population of either exomeres having a diameter of less than 50 nni, small exosomes having a diameter of 60-80 nm, or large exosomes having a diameter of 90-120 nm,
- the exomeres, small exosomes, or large exosomes are recovered from the sample, and the exomeres, small exosomes, or large exosomes or portions thereof are contacted with one or more reagents suitable to detect: (1) higher or lower levels, relative to a standard for subjects not having cancer, or the presence or absence, of one or more proteins contained m said exomeres, small exosomes, or large exosomes, (2) higher or lower levels, relative to a standard for subjects not having cancer, or the presence or absence, of one or more N-g] eans contained in said exomeres, small
- Another aspect of the present invention is directed to a method of prognosing cancer in a subject. This method involves selecting a subject having cancer and obtaining, from the selected subject a population of either exomeres having a diameter of iess than 50 nm, small exosomes having a diameter of 60-80 nm, or large exosomes having a diameter of 90- 120 n .
- exomeres, small exosomes, or large exosomes are recovered from the sample, and the exomeres, small exosomes, or large exosomes or portions thereof are contacted with one or more reagents suitable to detect: ⁇ I ⁇ higher or lower levels, relative to a standard or to the level In a prior sample obtained from the subject, or the presence or absence, of one or more proteins contained In said exomeres, small exosomes, or large exosomes, (2) higher or lower levels, relative to a standard or to the level In a prior sample obtained from the subject, or the presence or absence, of one or more N-gl yeans contained m said exomeres, small exosomes, or large exosomes, (3) higher or lower levels, relative to a standard or to the level In a prior sample obtained from the subject, or the presence or absence, of one or more lipids contained in said exomeres, small exosomes, or large exosomes, (4) the presence or absence of one or
- Another aspect of the present invention is directed to a method of managing treatment in a subject.
- This method Involves selecting a subject undergoing treatment for cancer and obtaining, from the selected subject, a population of either exomeres having a diameter of less than 50 nm, small exosomes having a diameter of 60 80 nm, or large exosomes having a diameter of 90 120 nm.
- exomeres, small exosomes, or large exosomes are recovered from the sample, and the exomeres, small exosomes, or large exosomes or portions thereof are contacted with one or more reagents suitable to detect: ( I ⁇ higher or lower levels, relative to a standard or to the level In a prior sample obtained from the subject, or the presence or absence, of one or more proteins contained In said exomeres, small exosomes, or large exosomes, (2) higher or lower levels, relative to a standard or to the level in a prior sample obtained from the subject, or the presence or absence, of one or more N-g!ycans contained In said exomeres, small exosomes, or large exosomes, (3) higher or lower levels, relative to a standard or to the level in a prior sample obtained from the subject, or the presence or absence, of one or more lipids
- Treatment is then modified based on the contacting step.
- Cancer prognosis as described herein includes determining the probable progression and course of the cancerous condition, and determining the chances of recovery and survival of a subject with the cancer, .g., a favorable prognosis indicates an increased probability of recovery and/or survival for the cancer patient, while an unfavorable prognosis indicates a decreased probability of recovery and/or survival for the cancer patient, A subject’s prognosis can be determined or modified by the availability of a suitable treatment ⁇ / £?., a treatment that will increase the probability of recovery and survival of the subject with cancer). Accordingly, another aspect of the present invention includes selecting a suitable cancer therapeutic based on the determined prognosis and administering the selected therapeutic to the subject.
- Prognosis also encompasses the metastatic potential of a cancer.
- a favorable prognosis based on the presence or absence of a protein, N-giycan, lipid, and/or genetic phenotype can indicate that the cancer is a type of cancer having low metastatic potential, and the patient has an increased probability of long term recovery and/or survival.
- an unfavorable prognosis, based on the presence or absence of a protein, N-glycan, lipid, and/or genetic phenotype can indicate that the cancer is a type of cancer having a high metastatic potential, and the patient has a decreased probability of long term recovery and/or survival
- Prognosis further encompasses prediction of sites of metastasis, determination of the stage of the cancer, or identifying the location of a primary tu or in a subject
- a change in the levels of certain proteins, N-glycans, lipids, and/or the mutational status of genes associated with cancer ⁇ e.g commis BRAF dhr EGFR ) indicates that a cancer is present or a change in the cancer phenotype has occurred with disease progression, For example, detecting the presence of a genetic mutation in an exomere, small exosomal, or large exosomal dsDNA sample from a subject whereas no genetic mutation was detected in an earlier exomere, small exosomal, or large exosomal dsDNA sample obtained from the same subject, can be indicative of a particular site of metastasis or progression to a more advanced stage of the cancer. Therefore, periodic monitoring of exomere, small exosomal, or large exosomal dsDNA mutational status provides a means for detecting primary tumor progression, metastasis, and facilitating optimal targeted or personalized treatment of the cancerous condition,
- the detection of certain proteins, N-glycans, lipids, and/or exomere, small exosomal, or large exosomal dsDNA mutations in a metastatic cancer sample can also identify the location of a primary tumor, For example, the detection of one or more BRAF mutations a metastatic tumor or cancer cell-derived exomere, small exosomal, or large exosomal sample can indicate that the primary tumor or cancer was melanoma or a form of brain cancer, e.g.
- glioblastoma The detection of one or more EGFR mutations in a metastatic tumor or cancer cell derived exomere. small exosomal, or large exosomal dsDNA sample indicates that the primary tumor originated in the lung, or alternatively the primary cancer was head and neck cancer, ovarian cancer, cervical cancer, bladder cancer, or esophageal cancer.
- another aspect of the present invention is directed to a method of managing treatment of a subject having cancer, in accordance with this aspect, cancer treatment is modified based on the contacting step,
- a "subject” or “patient” encompasses any animal, but preferably a mammal, e.g., human, non-human primate, a dog, a cat, a horse, a cow, or a rodent. More preferably, the subject or patient is a human.
- the subject has cancer, for example and without limitation, melanoma, breast cancer, or pancreatic cancer.
- the cancer is a primary tumor, while in other embodiments, the cancer is a secondary or metastatic tumor.
- Exosomes are mierovesides released from a variety of different cells, including cancer cells (i.e.,’’cancer-derived exosomes”). These small vesicles (50-1 QOnm in diameter) derive from large multi vesicular endosomes and are secreted into the extracellular milieu, The precise mechanisms of e osome release/shedding remain unclear; however, this release is an energy-requiring phenomenon, modulated by extracellular signals, They appear to form by invagination and budding from the limiting membrane of late endosomes, resulting in vesicles that contain cytosol and that expose the extracellular domain of membrane-bound cellular proteins on their surface.
- Exo-S refers to a population of small exosomes having a diameter of 60 to 80 nm, an average surface charge of -9.0 mV to - 123 mV, and a particle stiffness of 70 to 420 mPa.
- Exo-S are also enriched in genes involved in membrane vesicle biogenesis and transport, protein secretion and receptor signaling“Exo ⁇ L”, as used herein, refers to a population of large exosomes having a diameter of 90 to 120 nm, an average surface charge of -123 to -16.0 mV, and a particle stiffness of 26 to 73 mPa.
- Exo-L are also enriched in genes involved in the mitotic spindle, !L-2/StatS signaling, multl-orgstrism organelfeorganization, and
- Exomere refers to a nort-membranous nanoparticle having a diameter of less than 50 nm, often approximately 35 nm, an average surface charge of -2.7 mV to -9.7 mV, and a particle stillness of 145 to 81 mPa
- Bxomeres are enriched in metabolic enzymes and hypoxia, microtubule and coagulation proteins as well as proteins involved in glycolysis and TOR signaling
- exomeres, small exosomes, and large exosomes can be isolated or obtained from most biological fluids Including, without limitation, blood, serum, plasma, ascites, cyst fluid pleural fluid, peritoneal fluid, cerebrospinal fluid, tears, urine, saliva, sputum, nipple aspirates, lymph fluid, fluid of the respiratory, intestinal, and genitourinary trances, breast milk, intra-organ system fluid, conditioned media from tissue explant culture, or combinations thereof,
- exomeres small exosomes or large exosomes can be obtained from a biological sample using methods described herein.
- exomeres, small exosomes, or large exosomes may be concentrated or isolated from a biologicai sample asymmetric flow field- flow fractionation (AF4) (Fraunhofer et ah, ' he Use of Asymmetrical Flow Field-How Fractionation in Pharmaceutics and BiopharmaeeulicsA European Journal of Pharmaceutics and Biopharmaceutks 58:369-383 (2004); Yohannes et ah, "Asymmetrical Flow Field-Flow Fractionation Technique for Separation and Characterization of Biopolymers and
- AF4 asymmetric flow field- flow fractionation
- Exomeres small exosomes, or large exosomes isolated from a bodily fluid (/. ⁇ ?., peripheral blood, cerebrospinal fluid, urine) can be enriched for those originating from a specific cell type, for example, lung, pancreas, stomach, intestine, bladder, kidney, ovary, testis, skin, colorectal breast, prostate, brain, esophagus, liver, placenta, and fetal cells. Because the exomeres, small exosomes, or large exosomes often carry surface molecules such as antigens from their donor cells, surface molecules may be used to identify, isolate or enrich for exomeres, small exosomes, or large exosomes from a specific donor cell type.
- exomeres, small exosomes, or large exosomes originating from distinct cell populations can be analyzed for their nucleic acid content,
- tumor (malignant and nan-malignant) exosomes carry tumor- associated surface antigens and these exosomes can be isolated or enriched via these specific tumor-associated surface antigens.
- the tumor-associated surface antigen Is epithelial-ccli-adhesion-rnolecu!e (EpCAM), which is specific to exosomes from carcinomas of lung, colorectal, breast, prostate, head and neck, and hepatic origin, but not of hematological cell origin (Balzar et aL“The Biology of the 17- I A Antigen (Ep-CAM)T J Mol Med 77 ⁇ 10); 699- 712 ( 1 99); Wentef ah“Frequent EpCam Protein Expression in Human Carcinomas,” Hum Pathol 35(1 ): 122-8 (2004), which are hereby incorporated by reference in their entirety).
- the surface antigen is CD24, which is a glycoprotein specific to urine
- the surface antigen is CD70, carcinoembryonic antigen
- tumor specific exosomes may be characterized by the lack of surface markers, such as the lack of CD80 and CDS6 expression.
- exomeres, small exosomes, or large exosomes from specific cell types can he accomplished, for example, by using antibodies, apiamers, aptamer analogs, or moleeuiar!y imprinted polymers specific lor a desired surface antigen.
- the surface antigen is specific for a cancer type.
- the surface antigen Is specific for a ceil type which Is not necessarily cancerous.
- a method of exosome separation based on cell surface antigen Is provided In U,S. Patent No. 7,198,923, which is hereby incorporated by reference in its entirety. As described in, e.g., U.S. Patent Nos.
- apiamers and their analogs specifically bind surface molecules and can he used as a separation tool for retrieving cell type-sped He exosomes.
- Moleeularly Imprinted polymers also specifically recognize surface molecules as described In, e.gchev U.S, Patent Nos, 6,525,154, 7,332,553 and 7,384,589, which are hereby incorporated by reference in their entirety, and are a tool for retrieving and isolating cell type-sped lie exosomes. These methods can be adapted for use in Isolating exomeres, small exosomes, or large exosomes,
- the recovered exomeres, small exosomes, or large exosomes are then contacted with one or more reagents suitable to detect higher or lower levels, relative to a standard For subjects not having cancer or to a prior sample from a subject having cancer, or the presence or absence of one or more proteins in the exomere, small exosome, or large exosome sample.
- a subject Is selected that has or Is undergoing treatment for cancer,
- exomeres are recovered from the sample and the method is carried out by detecting, higher or lower levels, relative to a standard for subjects not having cancer, or the presence or absence, of one or more of the proteins selected from the group consisting of PPID, GANAB, MAT!
- small exoso es are recovered from the sample and the method Is carried out to by detecting, higher or lower levels, relative to a standard for subjects not having cancer, or the presence or absence, of one or more of the proteins selected from the group consisting ofTTYFB, PLOT!, FLOT2, TSPA 14, LAM Cl, CD63, MVBI2A,
- large exosomes are recovered from the sample and the method Is carried out by detecting, higher or lower levels, relative to a standard for subjects not having cancer, or the presence or absence, of one or more of the proteins selected from the group consisting of SQSTM I, STIFF, HINT!, WASF2, RASA3, EPB4IL2, G1PCS, SIGGA1G, MPP6, K.IF23, RACGAP1, ANXA5.
- VPS4B GNGI2, PACS1N3, GLGL VTA I, LYN, VPS37C, CHMP5, F3, DNAJAL RHOC, GNA13, CHMP2A, ATP2BI, RDX, ATP!Bl, CAPZB, EF1D1, DNAJA2, and CTNNDI,
- the methods described herein may be performed to diagnose, prognose, or manage treatment of specific types of cancer.
- meiattoma, breast cancer, or pancreatic cancer may be diagnosed or prognosed, in other embodiments, treatment of melanoma, breast cancer, or pancreatic cancer may be modified.
- the method is performed to diagnose, prognose, or manage treatment of melanoma, For purposes of prognosing or managing treatment of melanoma, a subject is selected that has or is undergoing treatment for melanoma,
- exo meres are recovered from the sample and the method is carried out by detecting, higher or lower levels, relative to a standard for subjects not having melanoma or to a prior sample from the subject, or the presence or absence, of one or more of the proteins selected from the group consisting of GPH2, ITIH3, H2AFX, PM EL,
- small exosomes are recovered from the sample and the method Is carried by detecting, higher or lower levels, relative to a standard for subjects not having melanoma or to a prior sample from the subject, or the presence or absence, of one or more of the proteins selected from the group consisting of TYR I, SDCBP, SDCBP, CD63, IGSF8, HSPA8, MLANA, HBA1/HBA2, GPNMB, DCT, HSPA2, HSPAI L, HSPA5, Fv4, PDCD6IP, RAB7A, ENVI , CD8I, GNB I , SYT4, GNB2, HIST!
- large exosomes are recovered from the sample and the method is carried out by detecting, higher or lower levels, relative to a standard for subjects not having melanoma, or the presence or absence, of one or more of the proteins selected from the group consisting of HSPA8, TYRP ) , SDCBP, HSPA2, RPS27A, HSPAI L, MLANA, HSPA5, CD63, IGSF8, GPNMB, Fv4, ENVi, PDCD6IP, HSPA!
- the method is performed to diagnose, prognose, or manage treatment of breast cancer.
- a subject is selected that has or is undergoing treatment for breast cancer,
- exo meres are recovered from the sample and the method is carded out to by detecting, higher or lower levels, relative to a standard for subjects not having breast cancer or to a prior sample from the subject, or the presence or absence, of one or more of the proteins selected from the group consisting of FOB, H1ST2H2AB, COMP, H1ST1H2BJ, C7, GSTA5, ENQ3, ARF3, SULTIC4, E1F4A2, MAT! A, GWB2, UGDH, AKRIB10, MTHFDI, CISC, DPP3, RFSA, OTUBI, ALDH8A1, FU, CTPS2, MOATS,
- RAP IB HIST2H2AB, ACTBL2, TUBB2A, FiG, CNTN!, HPD, ACE, EML2, HSPAI3,
- PRK.ACB LARS, PPID, LTA4H, PSMD7, CAPNSS, ETF1, IARS, VPS35, TKFC, HUOIP, PGM2, TKJ, BMCNR CYB5R3, GPS1, USV1PS, SNDR RTCB, RPL26, CARM!, PLCG2, P4HA2, CORG6, GMPS, IGSF8, PPP1R7, T1MP3, UXS!, DNM2, MEMOS, RPS3, ARHGDI A, PTGES3, NRP2, RAB!A, HBG2, and YWHAQ.
- small exosomes are recovered from the sample and the method is carried out to by delecting, higher or Sower levels, relative to a standard for subjects not having breast cancer or to a prior sample from the subject, or the presence or absence, of one or more of the proteins selected from the group consisting of SDCBP, HSSTSH2BN,
- CDS S CDS S , VPS378, TUBB6, RAPS A, EPCAM, Hist!hlb, PP!A, ADAM 10, NBA I, HISTIH2BK, A2M, EDIL3, SDCBP, MFGE8, GSN, HIST2H2AC, HSST1 H2AC, H2AFX, ACTB, THBSI, ⁇ TIH4, TUBE , TUBB2A, IUBB4B, FIG, H2AFZ, TUBB4A, TUBB6,
- HSPA8 CD9 CDS I, GAPDH, PFN1, HSST1 H4A, HSP90AAI, HSP90ABI, HSPA2, HSST2H3A , PGKI, THBS2, EEFIA!,GPX3, ITGB!, PPIA, PDCD6SP, EEF3A2, FBLNS, AT1C, CPNE8, TINS, HSPA5, PKM, MISTI 11 SC, WD I, RAN, PYGL, and ITGA3,
- large exosomes are recovered from the sample and the method is carried out to by delecting, higher or lower levels, relative to a standard lor subjects not having breast cancer, or the presence or absence, of one or more of the proteins selected from the group consisting of PDCD6IP, SDCBP, BHD I, ITGB1, S10GA6, ITGA3,CD9, VPS37C, Hist!
- h4a RAP IB, CTNNAL MSN, HISTIH2AH, ITGA2, PTGFRN, ACTG!, B!ST!BIBN, Calm 1 , EPCAM, 1TGA6, YWHAE, HSPA I A/HSPA I B, GNBI , SLC3A2, GNB2, EHD2, H2AFX, PPIA, NTSE, VPS4B, GNB4, Cdc42, SLCIA5, GNAI2, CFLL YWHAH, EEF1A1, YWHAB, His?lh3b, TSGIOI, YWHAG, ANXA5, GNA13, F5, H3F3A/H3F3B, CHMP4B, HSPA5, EZR, GAPDH, CDS I, EDIL3, HBAI/HBA2, UBC, SDCBP, HSPA8, ITGBL €D9, HSPA2, ACTCi, ACTS, ACTGI, PDCD6IP, AFP, HBG2,
- H2BK GAPDH, CDS I, SLC3A2, GNAI2, GRAB, GNAH, ATPIA!, HIST2M2AC, CPKE8, IST1, PFNI, TUBA4A, H2AFX, TUBA 1C, HSPA5, YWHAZ, ENOL ANXA5, GNAS, DNAJAI, GHMP5, EEFI AT, RHGA, KRT!, GEP5S, GNB i, AGTBL2, FTGA2, EPHA2, GNA13, PPIA, RAP1A, and CD59.
- the method is performed to diagnose, prognose, or manage treatment of pancreatic cancer.
- a subject s selected that has or Is undergoing treatment for pancreatic cancer [# ⁇ 77]
- exomeres are recovered from the sample and the method is carried out to by detecting, higher or lower levels, relative to o standard for subjects not having pancreatic cancer, or the presence or absence, of one or more of the proteins selected from the group consisting of SULTI El, PKLR, EN02, AKRIBI, FH, MGAT2, GPXI, DPP3, SEMA4B, GPDI, CSAD, NCAfVft, PCMTi, MARS, THOPI, UMPS, PD ESA, CACNA2DI, TJE CDHS I, AOX!, FH, GLB1, RPLIGA, ACAP2, UXSI, ADSL, B P1, PSMD3, LANCE I,
- A MA ⁇ 2A, PFKL, CLIC5, FIGD, GLOD4, AGE, PLE HB2, CLSTNl, STI3, CMBL AK 1E2, PRKAR2A, GPDI, LGALSL, GLA, ILiRAP, GMPFB, PCSK6, SEPT9, PSMC6, FYN, PAFAHIBI, VPS37C, GT NDi, RBP1, ERP44, SHMTL DARS, ADSL GGLM, ALDOC, EPHA4, PEPD, CKB, PCMTI, UGDH, PRKARIA, and GNAS.
- small exoso es are recovered from the sample and the method Is carried out to by detecting, higher or lower levels, relative to a standard for subjects not having pancreatic cancer, or the presence or absence, of one or more of the proteins selected from the group consisting of SDCBP, PDCD6IP, HSPA8, IGSF8, CD9, PTGFRN, ACTCI, LY6E, ACTB, iV!FGES, HSPA2, CDS I, ITGA3, ITGBL 1TIH2, VPS28, CD63, HTRAI, ENV1, Fv4, GSN, ENOl, EDIL3, MVBI2A, 1F1TM3, SERP1NC1, ACTBL2, TUBA4A, PPIA, HSPA I A/HSPA IB, HSPA5, GAPDH, TSGI0I, TUBS, PLEKHB2, TUBA 1C, TUBB4B, PFNLGPC!, GJAI, EHDL GNB2, TSPAN
- large exosomes are recovered from the sample and the method is carried out to by detecting, higher or lower levels, relative to a standard for subjects not having pancreatic cancer, or the presence or absence, of one or more of the proteins selected from the group consisting of ACTC I, AGIO 1, ACTS, MFGE8, ITGB1 , HSPA8, 1TGA3,
- the standard level of a protein Is the average expression level of the protein in exomere, small exosomal, or large exosomal samples taken From a cohort of healthy individuals ⁇ .edeem the average level in non-eaneerous exomere, small exosomal, or large exosomal samples), in another embodiment, the standard level is the average level of the marker in exomere, small exosomal, or large exosomal samples taken from individuals having a primary tumor, e.g., a gastrointestinal tumor that never metastasized to the l ver or other organ of the body in another embodiment, the standard level of a protein is the level of the protein in an exomere, small exosomal, or large exosomal sample taken from the subject being tested, but at an earlier time point (e.g., a
- a“higher level ’ refers to an expression level (Le., protein or gene expression level) that is higher than the standard level. For example, a higher expression level is at least 50% higher than the standard expression level.
- A“lower level” refers to an expression level (U , protein or gene expression level) that is lower than the standard level. For example, a lower expression level Is at least 50% lower than the standard expression level.
- suitable methods for detecting proteins include, but are not limited to, measuring A expression level and measuring protein expression levels. These methods are commonly used in the art. For measuring protein expression levels, this method generally involve contacting the sample with one or more detectable reagents that is suitable for measuring protein expression, e.g,, a labeled antibody or a primary antibody used in conjunction with a secondary antibody, and measuring protein expression level based on the level of detectable reagent in the sample after normalizing to total protein in the sample.
- Suitable methods for detecting protein expression level in an exosome sample that are commonly employed in the art include, for example and without limitation, western blot, im unoprecipitation, enzyme-linked
- ELISA immunosorbent assay
- RIA radioimmunoassay
- FACS fluorescent activated cell sorting
- RNAse protection assay Hod et aL "A Simplified Ribonuelease Protection Assay,” Biotcchmques 13:852-854 (1992), which Is hereby incorporated b reference in its entirety
- RT-PCR reverse transcription polymerase chain reaction
- the exomeres, small exosomes, or large exosomes are then contacted with one or more reagents suitable to detect higher or lower levels, relative to a standard for subjects not having cancer or to a prior sample from a subject having cancer, or the presence or absence of one or more N-glycans in the exomere, small exosome, or large exosome sample.
- a subject is selected that has or is undergoing treatment for cancer.
- exomeres are recovered from the sample and the method is carried out by detecting N-giycans selected from the group consisting ofN-g!ycan (Fucose) + GlcNAcp I -6(GkNAcP !
- small exosomes are recovered from the sample and the method Is carried out by detecting N-glycans.
- large exosomes are recovered from the sample and the method is carried out by detecting N-glycans.
- glycoproteins are well known in the art, For example, as a first step, the nanoparticles are lysed and total protein is collected, which contains glycoproteins of interest The complex carbohydrate portion of the glycoproteins may be readily analyzed if desired, by conventional techniques of carbohydrate analysis.
- lectin bloting which is well-known in the art, reveal proportions of ter inal mannose or other sugars such as galactose, Termination of mono-, bi ⁇ , tri , or tetra-antennary oligosaccharide by sialic adds can be confirmed by release of sugars from the protein using anhydrous hydrazine or enzymatic methods and fractionation of oligosaccharides by ion-exchange or size exclusion chromatography or other methods well-known in the art.
- the isoelectric point (pi) of the glycoprotein can also be measured, before and after treatment with neuraminidase to remove sialic acids. An increase in pi following neuraminidase treatment indicates the presence of sialic acids on the glycoprotein,
- the carbohydrates can be analyzed by any method known in the art including those methods described herein. Several methods are known in the art for glycosylation analysis and are useful in the context of the present invention. Such methods provide information regarding the identity and the composition of the oligosaccharide. Methods for carbohydrate analysis useful in the present invention include but are not limited to lectin chromatography; HPAEC-PAD, which uses high pH anion exchange chromatography to separate oligosaccharides based on charge; NMR; Mass spectrometry; MFLC; GPC; monosaccharide compositional analysis; sequential enzymatic digestion,
- glycoproteins extracts are reduced, alkylated and digested with sequencing-grade, modified trypsin (Promega) using a standard proteo ics protocol (Ferreira et aL 'Synthesis and Optimization of Lectin Functionalized Nanoprobes for the Selective Recovery of Glycoproteins from Human Body Fluids, " Analytical Chemistry 83:7035 7043 (201 1), which is hereby incorporated by reference in its entirety).
- the l-glycans can then be analyzed based on a modification of Jensen et ai (Koianch et ah, "Isomer-Specific Analysis of Released N-Glycans by LC-ESI MS/MS with Porous Graphitized Carbon, " Methods in Molecular Biology ⁇ 1321 :427 ⁇ 433 (2015), which is hereby incorporated by reference in its entirety).
- A-LInked glycans are released with PNGase F ⁇ EUzahethkingia meningoseptica; Sigma), deaminated and partially purified using porous graphitized carbon solid-phase extraction cartridges (PGC-SPE, HyperSep-96-Hyperearb,
- Glycan profiling and characterization may be performed by MALDi TOF/TOF mass spectrometry (4800 Plus, SC1EX) using alpha-cyano ⁇ 4- hydroxycinnamic acid (CHCA; 10 mg/mL in 50% ACM), operated in reflector negative mode (mass range of m/z 1000 to 5000) with external calibration (TOF/TOF calibration mixture, SC1EX), NanoHPLC- High Resolution Mass Spectrometry (FIRMS) may be used to validate the presence of most discriminative ions in MALDI-MS spectra using a nanoHPLC system (Dionex, 3000 Ultimate RSLCnano) coupled on-line to a LTQ-Orbitrap XL mass spectrometer (Thermo Scientific) equipped with a nano-electrospray ion source (Thermo Scientific, EASY-Spray 0 source).
- MALDi TOF/TOF mass spectrometry 4800 Plus, SC1EX
- CHCA al
- ,Y ⁇ Giycan chromatographic separation using Porous Graphitized Carbon may be adapted from a procedure previously described (Jensen et al., "Structural Analysis of N- and O- Gf yeans Released from Glycoproteins,” Nature Protocols 7:1299 1310 (2012), which is hereby incorporated by reference in its entirety), A nanoflow PGC column ⁇ HyperCard, 150 mm x 75 pm ID, 3 pm particle size, Thermo Scientific) followed by a reversed phase Cl 8 column (EASY-
- the glycan structures are assigned based on nanoHPLC-PGC-HRMS analysis considering: i) molecular monolsoiopic mass; (ii) C1D-MS/ S de novo sequencing; and (Hi) PGC-LC relative retention times.
- a2 s 3-!mked and tx2,6-l hiked sialylaied A-glyeans were
- MS/MS fragmentation profiles are matched to giycosidic fragments calculated in silica on GiyeoWorkBench (Ceroni et ah, "Glyco Workbench: a Tool for the Computer-Assisted Annotation of Mass Spectra of Glyeans," Journal of Proteome Research 7:1650-1659 (2008), which is hereby incorporated by reference in its entirety).
- GiyeoWorkBench Chemical et ah, "Glyco Workbench: a Tool for the Computer-Assisted Annotation of Mass Spectra of Glyeans," Journal of Proteome Research 7:1650-1659 (2008), which is hereby incorporated by reference in its entirety.
- GiyeoWorkBench General understanding of mammalian iV-glyeosylation may be used to determine some structural aspects
- a semiquanfitive approach may be used to compare glycan compositions based on MALDI-MS assignments, taking nto account the monoisotopic peak intensity,
- the exomeres, small exosomes, or large exosomes are then contacted with one or more reagents suitable to detect higher or lower levels, relative to a standard for subjects not having cancer or to a prior sample from a subject having cancer, or the presence or absence of one or more lipids in the exomere, small exosome, or large exosome sample,
- lipidomlcs refers to the use of metabolomics as applied to the evaluation of lipid metabolites in biological samples.
- Lipid profiling generally involves an evaluation of lipid metabolites in one or more lipid classes (e.g., fatty acids, triglycerides, diglycerides, cholesterol esters, and the phospholipid classes including phosphatidylcholine, phosphatidylethanolamine, lysophosphatidylcholine, sphingomyelin, phosphatidylcholine, phosphatidylsenne, phosphatidylethanolamine and cardioiipm),
- the term “Hpid” is intended broadly and encompasses a diverse range of molecules that are relatively water- insoluble or nonpolar compounds of biological origin, including waxes, triglycerides, free fatty acids, diaeylgiyereols, fatty-acid derived phospholipids, sphingoilpids,
- the lipid profile can be quantitative, semi-quantitative and/or qualitative. For example, the lipid profile can evaluate the presence or absence of a lipid, can evaluate the presence of a !ipid(s) above or below a particular threshold, and/or can evaluate the relative or absolute amount of a lipld(s). In some embodiments, a ratio among two, three, four or more lipids Is determined. Changes or perturbations in lipid ratios can be advantageous in indicating where there are metabolic blocks (or releases of such blocks) or other alterations in metabolic pathways associated with disease, response to treatment, development of side effects, and the like.
- the level of a lipid metabolite is normalized against another lipid metabolite,
- the ratio between two or more lipid metabolites can be normalized against an index associated with a pathway, enzymatic activity, class of metabolites, and/or status of certain metabolic activities,
- the level of a lipid metabolite can be normalized against a housekeeping lipid metabolite, e g. a lipid metabolite that is relatively stable in amount under a variety of conditions in the subject.
- Quantitative metabolomic data include molar quantitative data, mass quantitative data and relational data by either moles or mass (mole % or weight %, respectively) for individual lipid metabolites or subsets of metabolites.
- quantitative aspects of iipidomie analysis can be provided and/or improved by including one or more quantitative Internal standards during the analysis, for instance, one standard for each lipid class, internal standards are described In more detail in U.S. Patent Publication No.
- Truly quantitative data can be Integrated from multiple sources (e.g,, the data do not need to be generated with the same assay, In the same location and/or at the same time) into a single seamless database regardless of the number of metabolites measured In each, discrete, individual analysis,
- level Is Intended broadly and can mean a quantitative amount (e.g,, weight or moles), a semi-quantitative amount, a relative amount (e,g,, weight % os- mole % within class or a ratio), a concentration, and the like,
- a subject For purposes of prognosing or managing treatment of cancer, a subject is selected that has or is undergoing treatment for cancer,
- exomeres are recovered from the sample and the method Is carried out by detecting one or more lipids selected from the group consisting of phospholipids, sphingolipids, and glycerollpids.
- lipids selected from the group consisting of phospholipids, sphingolipids, and glycerollpids.
- Exemplary specific lipids include, without limitation, TG, Cer, LPG, LPE, PC, PI, PE, LPI, PS, SM, MG, LPC, PG, DG, CerG3, and CerG l ,
- small exosomes are recovered from the sample and the method Is carried out by detecting lipids selected from the group consisting of LPE, PC, PL PE, LPI, PS, PC, SM, and CerG3,
- large exosomes are recovered from the sample and the method Is carried out by detecting lipids selected from the group consisting of tPE, PC, PI, PE, IPS, PS, PC, SM, and CerG3,
- the hpld profile of the exomere, small exosomal, or large exosomal sample can be determined using any suitable method.
- the different classes o lipids and methods of detecting and optionally quantifying the same are well known in the art (e.g grav thin layer chromatography, gas chromatography, liquid chromatography, mass and NMR spectrometry, and any combination thereof (e.g. GC/MS), and the like).
- One suitable method of detecti g, and optionally quantifying, lipids in a biological sample employs stable isotope tracers to label the lipids. Methods of obtaining lipid profiles from biological samples have been described, see, e. « perpetu U.8. Patent Publication No, 2004/014346! to Watkins and Watkins e? oh (2002 ) J Lipid Res, 43(1 1 ): 1809- 17, which are hereby incorporated by reference in their entirety.
- the exomeres, small exosomes, or large exosomes are then contacted with one or more reagents suitable to detect higher or lower levels, relative to a standard for subjects not having cancer or to a prior sample from a subject having cancer, or the presence or absence of one or more genetic mutations in nucleic acid molecules associated with cancer
- the exomere, small exosome, or large exosome sample are then contacted with one or more reagents suitable to detect higher or lower levels, relative to a standard for subjects not having cancer or to a prior sample from a subject having cancer, or the presence or absence of one or more genetic mutations in nucleic acid molecules associated with cancer.
- a subject For purposes of prognosing or managing treatment of cancer, a subject Is selected that has or is undergoing treatment for cancer.
- the nucleic acid molecule may be DMA or RNA
- exomere, small exosome, or large exosome fraction from a bodily fluid of a subject can be p re-treated wdth DNase to eliminate or substantially eliminate any DMA located on the surface or outside of the exosomes, Without DNAse pre-treatment short DMA fragments on the outside of the exosomes may remain and eo-isoiate with nucleic adds extracted from inside the exosomes.
- elimination of all or substantially all DNA associated wdth the outside or surface of the exosomes by pre-treatment of with DNase has the ability to enrich for internal exomere, small exosome, or large exosome dsDNA.
- Shrimp DNase specifically digests double- stranded DNA
- SI nuclease specifically digests single-stranded DNA.
- DNA may be isolated by extracting the DNA from the exomeres, small exosomes, or large exosomes prior to or for analysis,
- the extracted DNA can be analyzed directly without an amplification step.
- NanoStrlng technology enables identification and quantification of individual large! molecules in a biological sample by attaching a color coded fluorescent reporter to each target molecule. This approach Is similar to the concept of measuring inventory by scanning barcodes. Reporters can be made with hundreds or even thousands of different codes allowing for highly multiplexed analysis. The technology is described in a publication by Gdss el al.“Direct Multiplexed Measurement of Gene Expression with Color-Coded Probe Pairs," Nai Biotechml 26(3); 317-25 (2008), which is hereby incorporated by reference in Its entirety, fO!
- nucleic acid of the exomeres it may be beneficial or otherwise desirable to amplify the nucleic acid of the exomeres, small exosomes, or large exosomes prior lo analyzing it.
- Methods of nucleic acid amplification are commonly used and generally known in the art, if desired, the amplification can be performed such that it is quantitative. Quantitative amplification will allow quantitative determination of relative amounts of the various exosomai nucleic acids,
- Nucleic acid amplification methods include, without limitation, polymerase chain reaction (PCR) (U.S, Patent No. 5,219,727, which is hereby incorporated by reference In Its entirety) and its variants such as in situ polymerase chain reaction (U.S. Patent No, 5,538,871 , which is hereby incorporated by reference in Its entirety), quantitative polymerase chain reaction (U.S, Patent No. 5,219,727, which Is hereby Incorporated by reference in its entirely), nested polymerase chain reaction (U.S. Patent No.
- the Isolated DNA is contacted with one or more reagents suitable to detect the presence or absence of one or more genetic imitations that are associated with cancer.
- Exemplary genetic mutations associated with cancer include, but are not limited to. BRAF, EGER , APC, NOTCH l, HRAS, KRAS , NBAS, MET p53, PTEN, HER2, FITS , BBC AT BRCA2, PIK3CA , KIT, RET AKT, ABL, CDK4, MYC, RAF, PDGFR, BCR-ABL NPM1 , CEBPs!pha, and SRC.
- the one or mare mutations in the one or more identified genes cm be detected using a hybridization assay, in a hybridization assay, the presence or absence of a gene mutation is determined based on the hybridization of one or more allele-specific oligonucleotide probes to one or more nucleic acid molecules in the exomere, small exosomal, or large exosomal DNA sample from the subject,
- the oligonucleotide probe or probes comprise a nucleotide sequence that is complementary to at least the region of the gene that contains the mutation of Interest,
- the oligonucleotide probes are designed to be complementary to the wildtype, nonmutant nucleotide sequence and/or the mutant nucleotide sequence of the one or more genes to effectuate the detection of the presence or the absence of the mutation in the sample from the subject upon contacting the sample with the oligonucleotide probes,
- a variety of hybridization assays that are known in the art are suitable for use in the methods of
- direct hybridization assays such as northern blot or Southern blot (sec e.g, Ausabe! et ah, Current Protocols in Molecular Biology, John Wiley & Sons, NY f 1991 ), which is hereby incorporated by reference in its entirety).
- direct hybridization can be carried out using an array based method where a series of oligonucleotide probes designed to be complementary to a particular non-mutant or mutant gene region are affixed to a solid support (glass, silicon, nylon membranes).
- a labeled exomere, small exosomal, or large exosoma DNA or cD A sample from the subject is contacted with the array containing the oligonucleotide probes, and hybridization of nucleic acid molecules from the sample to their complementary oligonucleotide probes on the array surface is detected.
- Examples of direct hybridization array platforms include, without limitation, the Affymetrlx GeneChip or SNP arrays and tilumina’s Bead Array.
- the sample is bound to a solid support (often DNA or PCR. amplified DNA) and labeled with oligonucleotides in solution (either allele specific or short so as to allow' sequencing by hybridization).
- genotyping methods include, but are not limited to, restriction fragment length polymorphism assays; amplification based assays such as molecular beacon assays, nucleic acid arrays, high resolution melting curve analysis (Reed and Wittwer,
- primer extension assays e.g., Sequenom iPLEX SNP genotyping assay
- mass spec rometry e.g., Sequenom iPLEX SNP genotyping assay
- Primenom iPLEX SNP genotyping assay e.g., Sequenom iPLEX SNP genotyping assay
- multiplex primer extension sorted on genetic arrays
- flap endonuclease assays e.g., the Invader ' * ' assay
- xee Olivier M xee Olivier M, "The Invader Assay for SNP Genotyping,” Mutat Res.
- S ' nuclease assays such as the TaqMah assay (see ITS. Patent Nos. 5,210,015 to Gelfand et ah and 5,538,848 to Livak et al., which are hereby incorporated by reference in their entirety); and oligonucleotide ligation assays, such as ligation with rolling circle amplification, homogeneous ligation, OLA Gee II, S.
- Such methods may be used in combination with detection mechanisms such as, for example, luminescence or chemiluminescence detection, fluorescence detection, time-resolved fluorescence detection, fluorescence resonance energy transfer, fluorescence polarization, mass spectrometry, and electrical detection.
- detection mechanisms such as, for example, luminescence or chemiluminescence detection, fluorescence detection, time-resolved fluorescence detection, fluorescence resonance energy transfer, fluorescence polarization, mass spectrometry, and electrical detection.
- detection mechanisms such as, for example, luminescence or chemiluminescence detection, fluorescence detection, time-resolved fluorescence detection, fluorescence resonance energy transfer, fluorescence polarization, mass spectrometry, and electrical detection.
- the methods for analyzing genetic aberrations are reported in numerous publications, not limited to those cited herein, and are available to those skilled in the art. The appropriate method of analysis will depend upon the specific goals of the analysis, the condition/history of the patient, and the
- the presence or absence of one or more mutations identified supra cm be detected by direct sequencing of the genes, or preferably particular gene regions comprising the one or more identified mutations, from the patient sample.
- Direct sequencing assays typically Involve Isolating D A sample from the subject using any suitable method known in the art, and cloning the region of interest to be sequenced into a suitable vector for amplification by growth In a host ceil (e.g. bacteria) or direct amplification by PCR or other amplification assay. Following amplification, the DNA can be sequenced using any suitable method, A preferable sequencing method involves high-throughput next generation sequencing (NOS) to Identify genetic variation.
- NOS next generation sequencing
- NGS sequencing chemistries are available and suitable for use In carrying out the claimed Invention, Including pyrasequendng (Roche * 454), sequencing by reversible dye terminators (lllumina* HiSeq, Genome Analyzer and MiSeq systems), sequencing by sequential ligation of oligonucleotide probes (Life Technologies* 1 SOLID), and hydrogen ion semiconductor sequencing (Life Technologies 1 ’, Ion TorrentTM).
- the selected subject has melanoma, breast cancer, or pancreatic cancer.
- the methods described herein may further include selection of a suitable cancer therapeutic and administering the selected cancer therapeutic to a subject.
- the administering step is carried out to treat the cancer, achieve inhibition of metastasis or metastatic disease progression.
- Such administration can be carried out sys!emieally or via direct or local administration to the tumor site.
- suitable modes of systemic administration include, without limitation orally, topically, transderma!
- Suitable modes of local administration include, without limitation, catheterization, implantation, direct injection, dermai/transdermal application, or portal vein administration to relevant tissues, or by any other local administration technique, method or procedure generally known in the art.
- the mode of affecting delivery of agent will vary depending on the type of therapeutic agent (e.g,, an antibody or an inhibitory nucleic acid molecule) and the disease to be treated.
- Effective doses for the treatment of a metastatic disease vary depending upon many different factors, including type and stage of cancer, means of administration, target site, physiological state of the patient, other medications or therapies administered, and physical state of the patient relative to other medical complications. Treatment dosages need to be titrated to optimize safety and efficacy,
- kits suitable for diagnosing cancer includes one or more reagents suitable to defect: ( I ) higher or lower levels, relative to a standard or to a sample from a subject, or the presence or absence, of one or more proteins contained in exomeres, small exosomes, or large exosomes, (2) higher or lower levels, relative to a standard or to a sample from a subject, or the presence or absence, of one or more N ⁇ gfyeans contained m exomeres, small exosomes, or large exosomes, (3) higher or lower levels, relative to a standard or to a sample from a subject, or the presence or absence, of one or more hpids contained in exomeres, small exosomes, or large exosomes, (4) the presence or absence of one or more genetic mutations n nucleic acid molecules associated with cancer and contained in exomeres, small exosomes, or large exosomes, or (5) combinations
- the kit contains one or more reagents suitable for isolating exomeres, small exosomes, or large exosomes.
- suitable markers for isolation of exomeres include, without limitation, HSP90AB I , MTHFDI, ACTIO, PBPD, !DH t , HMGCS i , EGALS3BP, CALR, HSPA 13, UGP2, MAT!
- Suitable markers for isolation of small exosomes include, without limitation, PLOT I, FLOT2, TTY 10, TSPANI4, and VPS37B.
- Suitable markers for isolation of large exosomes include, without limitation, STIR I , MPP6, DLG I , ABP, ATP2B I , ANXA4, MYOI C, STXBP3, RDX, ANXA I, ANXA5, ON A 13, PACS1N3, VPS4B, CHMPI A, CHMP5, CHMP2A, SH3GLI, CHMP4B, GNG 12, and DNAJA ! ,
- the kit comprises one or more reagents suitable to detect higher or lower levels, relative to a standard or to a sample from a subject, or the presence or absence, of one or more proteins contained In exomeres. Exemplary proteins contained in exomeres are described above.
- the kit comprises one or more reagents suitable to detect higher or lower levels, relative to a standard or to a sample from a subject, or the presence or absence, of one or more proteins contained in small exosomes. Exemplary proteins contained in small exosomes are described above,
- the kit comprises one or more reagents suitable to detect higher or lower levels, relative to a standard or to a sample from a subject, or the presence or absence, of one or more proteins contained in large exosomes. Exemplary proteins contained in large exosomes are described above,
- the kit of the present invention may also contain reagents suitable to determine if a subject has a particular type of cancer.
- the kit contains reagents suitable to determine if a subject has melanoma, breast cancer, and/or pancreatic cancer.
- kits are contemplated to encompass a variety of methods. These kits optionally include reagents to process a tissue or cell sample for the technique employed by that particular kit.
- a kit for PCR or PCR enhanced in situ hybridization cars include reagents to process the sample and Isolate the RNA (for PCR), It will also contain suitable primers to amplify the target sequence and additional probes, If necessary, to detect the desired nucleic acid fragments as well as buffers and reagents for the polymerase chain reaction and the buffers and emulsions required for in situ hybridization methods.
- Other kits can alternatively include reagents for immunofluorescence or ELISA using antibodies or probes, primers and reagents for modifications of in situ or PCR in situ hybridization methods.
- kits of the present invention the isolation of nucleic adds from the exomere, small exosomaS, or large exosomal sample may be desirable. Accordingly, kits may contain reagents necessary to carry out such methods. Methods of isolating R A and ON A from biological samples for use in the methods of the present Invention are readily known in the art. These methods are described in detail In LABORATORY TECHNIQUES IN BIOCHEMISTRY AND MOLECULAR BIOLOGY: HYBRIDIZATION WITH NUCLEIC ACID PROBES, PART L THEORY AND NUCLEIC ACID PREPARATION (P. Tijssen ed., Elsevier 1993), which is hereby incorporated by reference in its entirety.
- Total RNA can be isolated from a given sample using, for example, an acid goanidinium-phenoi-ehloroform extraction, a guanidinium isothiocyanate- ultracentrifugation method, or lithium ch!oride-SDS-urea method.
- PolyA" mRNA can be isolated using oiigo(dT) column chromatography or (dT)n magnetic beads (See e.g,, SAMBROOK AND RUSSELL, MOLECULAR CLONING: A LABORATORY MANUAL (Cold Springs Laboratory Press, i 989) or CURREN T PROTOCOLS IN MOLECULAR BIOLOGY (Fred M.
- PCR polymerase chain reaction
- the sample can also be amplified on an array as described in U.S. Patent No. 6.300,070 to Boles, which is hereby incorporated by reference in its entirety,
- LCR ligase chain reaction
- nucleic acid based sequence amplification See U.S. Patent Nos. 5,409,81 8. 5,554,51 7, and 6,063,603 all to Davey, which are hereby Incorporated by reference in their entirety).
- Other amplification methods that may be used are described in U.S. Patent Nos. 5,242,794 to Whiteley; 5,494,810 to Barany; and 4,988,617 to Landgren, which are hereby incorporated by reference in their entirety,
- kits may also contain probes or primers which hybridize to complementary nucleic acid molecules in the exomere. small e.xosomai, or large exosomal sample.
- the probes comprise nucleotide sequences that are complementary to at least a region of mRNA or corresponding cDNA of the desired proteins.
- hybridization refers to the complementary base-pairing interaction of one nucleic acid with another nucleic add that results in formation of a duplex, triplex, or other higher-ordered structure.
- the primary interaction is base specific, e.g., A/T and Q/C, by Watson/Crick and Hoogsteen-type hydrogen bonding, Base-stacking and hydrophobic interactions can also contribute to duplex stability.
- Base-stacking and hydrophobic interactions can also contribute to duplex stability.
- Conditions for hybridizing detector probes to complementary and substantially complementary target sequences ar well known in the art ⁇ see e.g., NUCLEIC ACID HYBRIDIZATION, A
- hybridization is influenced by, among other things, the length of the polynucleotides and their complements, the pH, the temperature, the presence of mono- and divalent cations, the proportion of G and C nucleotides in the hybridizing region, the viscosity of the medium, and the presence of denalurants, Such variables influence the time required for hybridization.
- the preferred hybridization conditions will depend upon the particular application. Such conditions, however, can be routinely determined by the person of ordinary skill In the art without undue experimentation.
- complementarity need not be perfect; there can be a small number of base pair mismatches that will minimally interfere with hybridization between the target sequence and single stranded nucleic add probe.
- complementarity herein Is that the probes are sufficiently complementary to the target sequence to hybridize under the selected reaction conditions to achieve selective detection and measurement,
- Detection of hybridization between probes and corresponding target molecules from an exomere, small exosomal, or large exosoma! sample can be performed by several assays known in the art that permit detection of the expression level of the one or more proteins.
- the“expression level ' ’ of a protein can be achieved by measuring any suitable value that is representative of the gene expression level.
- the measurement of gene expression levels can be direct or indirect A direct measurement involves measuring the level or quantity of RNA or protein.
- An indirect measurement may Involve measuring the level or quantity of cD A, amplified RNA, DNA, or protein; the activity level of RNA or protein; or the level or activity of other molecules (eg, a metabolite) that are indicative of the foregoing.
- the measurement of expression can be a measurement of the absolute quantity of a gene product.
- the measurement can also be a value representative of the absolute quantity, a normalized value (e,g., a quantity of gene product normalized against the quantity of a reference gene product), an averaged value (e.g,, average quantity obtained at different time points or from different sample from a subject, or average quantity obtained using different probes, etc.), or a combination thereof,
- a normalized value e.g., a quantity of gene product normalized against the quantity of a reference gene product
- an averaged value e.g, average quantity obtained at different time points or from different sample from a subject, or average quantity obtained using different probes, etc.
- hybridization is detected by measuring RNA expression level. Measuring gene expression by quantifying RNA expression can he achieved using any commonly used method known hi the art Including northern blotting and In ska hybridization (Parker et ah,“rrsRNA: Detection by in Situ and Northern Hybridization,” Methods in Molecular Biolog y 106:247-283 (1999), which is hereby Incorporated by reference In Its entirety); RNAse protection assay (Hod et a!., vi A Simplified Ribonue!ease Protection Assay, " ’ Biotechniques 13:852-854 ( 1992), which Is hereby incorporated by reference in its entirety); reverse transcription polymerase chain reaction (RT-PCR) (Weis et ah, "Detection of Rare mRNAs via Quantitative RT-PCR,” Trends in Genetics 8:263-264 (1992), which Is hereby incorporated by reference in its entirety); and serial analysis of
- a microarray comprises an assembly of distinct polynucleotide or oligonucleotide probes immobilized at defined positions on a substrate.
- Arrays are formed on substrates fabricated with materials such as paper, glass, plastic (e.g., polypropylene, nylon), polyacrylamide, nitrocellulose, silicon, optical fiber or any other suitable solid or semi-solid support, and configured in a planar (e.g,, glass plates, silicon chips) or three- dimensional (e.g., pins, fibers, beads, particles, microtiter wells, capillaries) configuration
- Probes forming the arrays may be attached to the substrate by any number of ways including (i) in situ synthesis (e.g., high-density oligonucleotide arrays) using photolithographic techniques (see Fodor et ah,“Light-Directed, Spatially Addressable Parallel Chemical Synthesis,” Science 251 :76? ⁇ 773 ( 1991 ); Pease et ah,“Light-Generated Oligonucleotide Arrays for Rapid DNA Sequence Analysis,” Proe, Natl Acad ScL U.S.A.
- Probes may also be noncovalently immobilized on the substrate by hybridization to anchors, by means of magnetic beads, or in a fluid phase such as In r crotiter wells or capillaries.
- the probe molecules are generally nucleic adds such as DMA, RNA, RN ⁇ , and cDNA,
- Fluorescenily labeled cDNA for hybridization to the array may be generated through incorporation of fluorescent nucleotides by reverse transcription of RNA extracted from exomere, small exosomaL or large exosomal samples. Labeled cDNA applied to the array hybridizes with specificity to each nucleic add probe spotted on the array. After stringent washing to remove non-specifically bound cDNA, the array is scanned by con!oeai laser microscopy or by another detection method, such as a CCD camera. Quantitation of
- a nucleic acid amplification assay that is a semi-quantitative or quantitative realtime polymerase chain reaction (RT-PCR) assay can also be performed. Because RNA cannot serve as a template for PCR, the first step in gene expression profiling by RT-PCR is the reverse transcription of the RNA template into cDNA, followed by Its exponential amplification in a PCR reaction.
- RT-PCR realtime polymerase chain reaction
- the two most commonly used reverse transcriptases are avian myeloblastosis virus reverse transcriptase (AMV-RT) and Moloney murine leukemia virus reverse transcriptase (MLV-RT), although others are also known and suitable for this purpose
- AMV-RT avian myeloblastosis virus reverse transcriptase
- MMV-RT Moloney murine leukemia virus reverse transcriptase
- the reverse transcription step is typically primed using specific primers, random hexamers, or oligo-dT primers, depending on the circumstances and the goal of expression profiling.
- extracted RNA can be reverse-transcribed using a GeneAmp RNA PCR kit (Perkin Elmer, Calif,, USA), following the manufacturer's instructions.
- the derived cDNA can then he used as a template in the subsequent PCR reaction.
- the PCR step can use a variety of thermostable DNA-dependen DNA polymerases, it typically employs the Taq DNA polymerase, which has a 5'-3’ nuclease activity but lacks a 3 -5’ proofreading endonuclease activity.
- An exemplary PCR amplification system using Taq polymerase is TaqMan* PCR (Applied Biosystems, Foster City, CA)
- Taqnian* PCR typically utilizes the 5'mudease activity of Taq or Tth polymerase to hydrolyze & hybridization probe bound to its target amplicon, but any enzyme with equivalent 5' nuclease activity can be used.
- Two oligonucleotide primers are used to generate an amplicon typical of a PCR reaction.
- a third oligonucleotide, or probe, Is designed to detect the nucleotide sequence located between the two PCR primers,
- the probe is non-extendible by Taq DNA polymerase enzyme, and is labeled with a reporter fluorescent dye and a quencher fluorescent dye. Any laser-induced emission fro the reporter dye is quenched by the quenching dye when the two dyes are located dose together as they are on the probe.
- the Taq DNA polymerase enzyme cleaves the probe In a template-dependent manner.
- the resultant probe fragments disassociate in solution, and signal from the released reporter dye is free from the quenching effect of the second fluorophore,
- One molecule of reporter dye is liberated for each new molecule synthesized, and detection of the unquenched reporter dye provides the basis for quantitative interpretation of the data,
- Taq Man” RT-PCR can be performed using commercially available equipment, such as, for example, the ABI PRISM 7700 * Sequence Detection System 5 (Perkin-Elmer- AppHed Biosystems, Foster City, Calif, USA), or the Lightcycler (Roche Molecular Materials).
- RT-PCR is usually performed using an internal standard or spike in control.
- the ideal internal standard is expressed at a constant level among different tissues, R
- RNAs for the housekeeping genes glyceraidehyde-3-phosphate ⁇ dehydrogenase (GAPDH) and b-actin are most frequently used to normalize patterns of gene expression.
- Real time PC is compatible both with quantitative competitive PCR, where internal competitor for each target sequence is used for normalization and quantitative comparative PCR using a normalization gene contained within the sample, or a housekeeping gene for RT-PCR.
- internal competitor for each target sequence is used for normalization
- quantitative comparative PCR using a normalization gene contained within the sample, or a housekeeping gene for RT-PCR.
- the kit may contain reagents suitable for performing any protein hybridization or immunodetection based assay known in the art.
- a protein hybridization based assay an antibody or other agent that selectively binds to a protein is used to detect the amount of that protein expressed in a sample.
- the level of expression of a protein can be measured using methods that include, but are not limited to, western blot, immunopreeipitation, enzyme-linked immunosorbent assay (ELISA), radioimmunoassay (R1A), fluorescent activated cell sorting (FACS), i m m u nob istochem istry, immunocytochemistry, or any combination thereof.
- antibodies, aptamers, or other ligands that specifically bind to a protein can be affixed to so-called “protein chips” (protein microarrays) and used to measure the level of expression of a protein in a sample.
- assessing the level o protein expression can involve analyzing one or more proteins by two-dimensional gel electrophoresis, mass spectroscopy (MS), matrix-assisted laser desorption/ionizaf lon-tlme of flight- MS (MALDI- TOF), surface- enhanced laser desorption ionization-time of flight (SELDI-TOF), high performance liquid chromatography (HPLC), fast protein liquid chromatography (i-PLC), multidimensional liquid chromatography (LC) followed by tandem mass spectrometry (MS/ MS), protein chip expression analysis, gene chip expression analysis, and laser densitometry, or any combinations of these techniques.
- MS mass spectroscopy
- MALDI- TOF matrix-assisted laser desorption/ionizaf lon-tl
- kits may contain an antibody that specifically binds a protein of interest,
- the antibody can be fixed to a solid support to facilitate washing and subsequent isolation of the complex, prior to contacting the antibody with a sample.
- solid supports include glass or plastic in the form of a microtiter plate, a stick, a bead, or a microbead.
- solid supports encompassed herein include those formed partially or entirely of glass (e.g. f controlled pore glass), polysaccharides (e,g Configuration agarose), polyacrylamides, silicones, and plastics such as polystyrene, polypropylene and polyvinyl alcohol.
- the sample can be diluted with a suitable diluent or eluant before contacting the sample to the antibody.
- the mixture can be washed and the antibody-antigen complex formed can be detected, This can be accomplished by Incubating the washed mixture with a detection reagent.
- This detection reagent may be a second antibody which is labeled with a detectable label, for example.
- detectable labels include magnetic beads (e,g,, DYNABEADSTM), fluorescent dyes, radiolabels, enzymes (for example, horse radish peroxidase, alkaline phosphatase and others commonly used in an ELISA), and colorimetric labels such as colloidal gold or colored glass or plastic beads.
- the antigens in the sample can be detected using an indirect assay, wherein, for example, a second, labeled antibody is used to detect bound specific, primary antibody, and/or in a competition or inhibition assay wherein, for example, a monoclonal antibody which binds to a distinct epitope of the antigen (i.e., proteins uniquely associated with exomeres, small exosomes, or large exosomes) Is incubated simultaneously with the mixture.
- a second, labeled antibody is used to detect bound specific, primary antibody
- a competition or inhibition assay wherein, for example, a monoclonal antibody which binds to a distinct epitope of the antigen (i.e., proteins uniquely associated with exomeres, small exosomes, or large exosomes) Is incubated simultaneously with the mixture.
- immunoassays can be used to determine presence or absence of proteins in an exomere, small exosoma!, and/or large exosoma! sample as well as the quantity of the proteins in the sample. If a protein Is present in the sample, it will form an antibody-protein complex with an antibody that specifically binds the protein under suitable Incubation conditions described above. The amount of an antibody-protein complex can be determined by comparing to a standard.
- a standard can be a known compound or another protein known to be present in a sample, for example.
- the test amount of antigen i.e., proteins uniquely associated with exomeres, small exosomes, or large exosomes
- the test amount of antigen need not be measured In absolute units, as long as the unit of measurement can be compared to a control
- the kit contains one or more reagents suitable to detect higher or lower levels, or the presence or absence of one or more lipids contained in exomeres, small exosomes, or large exosomes.
- the kit comprises reagents and reference compounds suitable for detecting lipids, '
- the reference compounds may be one or more of the following, but are not limited to, lipid standard(s), one or more control markers) that i s/a re regularly measured in & clinical setting, and positive and/ or negative controls, interna! and/ or external standards.
- the lipid coneentration(s), lipid ratio(s) or (a) lipid eomb ation(s) thereof In a sample from a subject is (are) determined by using mass
- the sample may be subjected to purification and/or other sample pre-preparation step(s) before mass spectrometry analysis.
- the purification step may be, but is not limited to chromatography, for example, high performance liquid chromatography (HPLC), ultra performance liquid chromatography (UPLC) and/ or ultra high performance liquid
- the sample pre-preparation step may be, but is not limited to solid- phase extraction (SPE), derivatization, liquid-liquid extraction and/or lipoprotein fractionation.
- SPE solid- phase extraction
- the said mass spectrometry determination may be done by tandem mass spectrometry.
- the kit contains one or more reagents suitable to detect higher or lower levels, or the presence or absence of one or more W-giyeans contained in exomeres, small exosomes, or large exosomes.
- the kit contains one or more lectins for a specific gjyean structure, in addition to detection reagents and buffers.
- the kit contains reagents for identifying glycosylated protein (e.g surround the glycosyiation detection reagents) in addition to reagents for identifying giycan structures.
- the kit contains all of the components necessary and/or sufficient to perform at least one detection assay, Including all controls, directions for performing assays, and any necessary or desired software for analysis and presentation of results.
- reagents e. - lectins
- A375M and A375P were obtained from MSfCCC), human prostatie carcinoma cell lines PC3 and DU 145, as well as BXPC-3, HPAF-II, PC-9, ET2B (gift from Dr, P, Gao and i, Bromberg), K- 562 (DSMZ) and B * 4 (DSMZ) cells were cultured in R.PMI, supplemented with penicillin (100 U/mi) and streptomycin (100 pg/ml) and 10% FBS Ceil lines were obtained from American Type Culture Collection, If not otherwise mentioned, and authenticated using STR profiling by commercial providers, All cells were maintained in a humidified incubator with 5% CG at 37 °C and routinely tested and confirmed to he free of mycoplasma contamination.
- FBS Fluorescence-Activated Cell Sorting
- Conditioned media was processed for exosome isolation and AF4 fractionation as described below,
- the spring constant of cantilever was determined as 559.73 pN/nm by the thermal noise method (Langlo s et aL "Spring Constant Calibration of Atomic Force Microscopy Cantilevers with a Piezosensor Transfer Standard,” The Review ofSe&miJk Insimmems 78:093705 (2007), which is hereby incorporated by reference in its entirety).
- the curvature radius of cantilever was -15 nm, and the resonant frequency of 325 kHz were used for the stiffness analysis (/, ⁇ ?., indentation of cantilever) and imaging. Force measurements were performed with an approximate force distance of 300 nm and velocity of 500 n /s,
- the following antibodies were used for western blot analysis: anii-TsgiOI (Santa Cruz se-7964); anti-Alix l (Cell Signaling 2171); anti Hsp90 (Stressgen ADLSPA-S30-F ⁇ , anti-MATi A I (Abeam ab 174687); anti-lDH I (Proteintech 23309- l -AP): anti-FLOTI (BD Biosekmces 610820); anti-TOLLIP (Abeam ah 117198); anti ⁇ VPS4B (Santa Cruz sc-32922); anli-DNAJA !
- Proteomic expression data was imported and was normalized using‘ normal izeBetween Arrays function (method ⁇ quantile) (Bolstad et ah, "A Comparison of Normalization Methods For High Density Oligonucleotide Array Data Based on Variance and Bias," Bknnjhn tks 19: 185-193 (2003), which is hereby Incorporated by reference in its entirety), PCA was performed for data reduction, simplifying datasets to three dimensions for plotting purposes using‘princompQ' function with default options, and illustrated using the mgp package and "ploLldQ 5 function.
- Proteins were sorted by signal-to-noise statistic, (m ⁇ - RB)7(K L *3 ⁇ 4) where m and a represent the mean and standard deviation of proteomic expression, respectively, for each class (Golub et ah,“Molecular Classification of Cancer: Class Discovery and Class Prediction by Gene Expression
- GSEA Gene Set Enrichment Analysis
- Nanoparticles were lysed with
- RapiGest SF Waters containing 1 mM sodium orihovanadate and protease inhibitor cocktail (Roche), for 30 minutes on ice and centrifuged at 16,000 x g for 20 minutes, For lectin blotting O.Spg of total protein extracts were separated using 4-15% gradient gels (Biorad) and transferred onto nitrocellulose membranes.
- GalNAc M-ac ety I ga I actosam i ne ,
- glycoproteins extracts from the different fractions were reduced alkylated and digested with sequencing-grade, modified trypsin (Promega) using a standard proteo ies protocol (Ferreira et aL“Synthesis and Optimization of Lectin
- Gl can profiling and characterization was performed by M.ALD1 TGF/TOF mass spectrometry (4800 Pius, 5GEX) using alpha-eyano-4- hydroxydnnamic acid (CMC A; 10 mg/mL in 50% ACN), operated in reflector negative mode (mass range of /z 1000 to 5000) with external calibration (TOF/TOF calibration mixture,
- NanoHPLC- High Resolution Mass Spectrometry was used to validate the presence of most discriminative ions MALDI-MS spectra using a nanoHPLC system (Dionex, 3000 Ultimate RSLCnano) coupled on-line to a LTQ-Orbitrap XL mass spectrometer (Thermo Scientific) equipped with a nano-electrospray Ion source (Thermo Scientific, EASY-Spray source), A lycan
- a nanofiow FGC column (HyperCard, 150 mm x 75 pm ID, 3 p particle size. Thermo Scientific) followed by a reversed phase C I S column (EASY- Spray €18 PepMap. 100 A, 150 mm x 75pm ID and 3 pm particle size, Thermo Scientific) were combined in series. This allowed a better separation of carbohydrates and remaining tryptic peptides, while minimizing salt precipitation events encountered when a nanospray emitter was utilized directly after the FGC column. The mass spectrometer was operated in negative ion mode.
- the possibility of neutral exchanges with Na + and K + was considered for sialoglyeans.
- the glycan structures were assigned based on nanoHPLC-PGG-H MS analysis considering: i) molecular monoisotopic mass; (ii) CID-MS/MS de novo sequencing; and (id) PGC-LC relative retention times, in particular, a2, 3-1 Inked and «2,64 inked sialylated /V-gl yeans were differentiated based on retention time (a2,6 ⁇ «2,3) (Kolarich et ah, "Isomer-Specific Analysis of Released N-Glycans by LC-ESI MS/MS with Porous Graphitized Carbon,” Methods m Molecular Biology 1321 :427-435 (2015), which is hereby Incorporated by reference in its entirety).
- the linear gradient was as follows: 0 minutes, 70% A; 4 minutes, 55% A; 12 minutes, 35% A; 18 minutes, 15% A; 20 -25 minutes, 0% A; 26-33 minutes, 70% A,
- the autosampler was set to I 5°C and the column was kept at 45°C.
- the injection volume was 10 pL.
- Mass spectra were acquired under both positive (sheath gas flow rate, 50; aux gas flow rate: 13; sweep gas flow rate, 3; spray voltage, 3,5 kV; capillary temperature, 263 C; Aux gas heater temperature, 425 °C) and negative eleetrospray ionization (sheath gas flow rate, 50; aux gas flow rate: 13; sweep gas flow rate, 3; spray voltage, -2,5 kV; capillary temperature, 263 °C; Aux gas heater temperature, 425 °C).
- the full scan mass spectrum resolution was set to 70,000 with the scan range of /z 230 ⁇ m/z 1 ,600, and the AGC target was I E6 with a maximum injection time of 200 msec.
- the lipid signal responses were normalized to the corresponding internal standard signal response, For those lipid classes without corresponding internal standard, positive lipid ion signals were normalized with the signal of lntemal standard Cer 18:1/12:0 and negative ion signals were normalized with the signal of intemal standard PG 14:0/14:0, The percentage of lipid classes within a sample was calculated by adding that of each of the individual molecular species quantified within a specific lipid class, and the relative abundance was represented by the mean percentage of 3 replicates for each group of samples. Differences among different subpopulations of particles derived from the same cell line were analyzed using A QVA test (q ⁇ 0,05).
- XP beads (Agenecurt) following the manufacturer ’ s protocol, An equal volume of nanopartides in PBS and lysis buffer At ⁇ QIAGEN) were mixed and incubated with Proteinase (20 pg /nil, QiAGEN) at 56“C for 10 minutes. The mixture was mixed with one volume of each, AM Pure beads, isopropanol and PEG solution (Beckman), and incubated for 5 minutes at RT, DNA bound to the beads was then separated from the solution/supernatant on magnet for 5 minutes at RT, The supernatant was removed by pipetting and bead-bound DNA was washed twice with freshly prepared 80% ethanol, then air dried for 5 minutes. Lastly, DNA was eluted from beads with nuclease free water and quantified using QuBit assay (Life Technology), DNA extraction was performed for two independent biological replicates of each sample,
- NanoHPLC-PGC-HRMS was done once (FIGs. 9E-9I). Lipldomlc analysis was conducted on 3 biologically independent samples. DNA and RNA analyses of each particle subtype were repeated twice. Organ biodistribution analysis of each particle subtype was repeated 4x independently. NTA analysis was conducted using 3 biologically independent samples. TEM analysis as repeats d 3 times for AF4 peaks P I and P5 and once for HDL, IDL and VLDL
- Exo-L derived from different cell lines in batch mode were repeated (in the order of exomere, Exo-S and Exo-L): B 16- F 10 (n-lG, 9, and B independent measurements, respectively); Pan02 (ii 1 1, 6, 1 1); As PC ! ? :5i; S, 5, 5); 4175 ( « 3, 5, 3); 4T! (« 5, 5, 5».
- B 1 -F 10 -8, 10, 12
- Pan02 l 3, 1 1 , 13
- AsPO l «*12, 12, 12
- 4175 ⁇ 17, 9, 6
- 4T1 (n 13, 3, 9).
- 6-F 10 (*R6, 6, 6); Pan02 ⁇ q ( « ⁇ d, 6, 6); AsPC-1 (L*2 I , 1 , 16); 4175 P1 1, 10, 5); 4TI (H 9, 8, 9).
- B 16F10 m s ?54 particles analyzed
- AsPC ! «-475)
- 4175 m-160
- GSEA Gene set enrichment analysis
- Lipid classes identified in exomeres and exosome subsets derived from different cell lines are shown in Tables 6-8.
- B 16-F IG melanoma-derived sEVs were first fractionated by AF4 (see Methods).
- PS was composed of individual or aggregated particles and protein aggregates with much larger sizes, which arc outside the separation range of the current AF4 protocol, and eluted when crossflow dropped to
- NTA Nanosight Tracking Analysis
- Exomeres and Exo-S/L were also detected in AF4-fractlonated sEVs from CM of human melanoma tumor explants by TEM (FIG. I f, arrows; FIG. 4A).
- Exomere and Exo-S size measured in batch mode using Zetasizer, was comparable to results from tumor cell lines (FIG, 1 G), AF4 profiling and TEM imaging analysis showed that the normal mouse tissue explants (mammary fat pad and lung) also secreted exomeres, and Exo-S/L nanoparticles (FIG, 4B).
- Example 2 Biophysical Characterization of Exomeres and Exosome Subpopalations
- their biophysical properties such as zefa potential and stiffness, were examined. Measuring zeta potential, an average surface charge, using Zetasizer, revealed all particles were negatively charged, with exomeres being the weakest negatively charged (-2.7 mV to -9.7 mV); Exo-L, the strongest (- 12.3 mV to -16.0 mV); and Exo-S, intermediate (-9.0 mV to -12.3 mV) (FIG, 5A).
- Exomeres demonstrated the highest stiffness ( I4SMS16 mPa) and Exo-L the lowest (26-73 mPa), with Exo-S stiffness being intermediate (70-420 mPa),
- PCA Principal component analysis
- exomeres were significantly enriched in proteins involved in metabolism (see gene set enrichment analysis [GSEA] analysis below), including MAT! A, !DH I , GMPPB, UGP2, EC ⁇ , and PFKL.
- GSEA gene set enrichment analysis
- exomere cargo may mediate the targeting of recipient ceils through spec fic giycan recognition and modulate glycosyiation in recipient cells.
- proteins uniquely represented in Exo-S/ L were annexing, ESC T components (charged multivesieular body proteins/CHMPs, vacuolar protein-sorting proteins, HGS, Alix!/PDCD6IP, and Tsg!O!
- Hsp4G (DnaJ) fam ly proteins, signaling transducer G protein subunits, integrins, Rab proteins, and solute carrier family members.
- JAK 1 , TGFBR2, and MET were also enriched in Exo-S/L.
- a second set of filters protein intensity /area > 10 s and fold change >5.0 ⁇ was applied to the identified signature for exomeres and Exo-L, but not for Exo-S (FIG.
- Hsp40/DnaJ family (F13P7G co-chaperones) members were also found in the top 50 proteins for Bxo-L, Interestingly, HSP90AB I was preferentially packaged in exomeres, while HSP70 members (HSPA8, HSPA2 and HSPA5) were more abundant in Exo- S/L, Other proteins relatively enriched in exomeres included inter-alpha-trypsin inhibitor heavy chain family members (ITt!-i), gelsolin (GSN), talin 1 (TL !
- WDRI WD repeat domain 1
- proteins involved in metabolism such as phosphoglycerate kinase I (PGK I ), pyruvate kinase muscle (PKM), and eno!ase 1 (ENOS ).
- PKA I phosphoglycerate kinase I
- PLM pyruvate kinase muscle
- ENOS eno!ase 1
- SDCBP, PDCD6IP/Alix tetraspanins (CD9, CD63, CD81 and others)
- G protein family proteins and integrins were highly represented In both Exo-S and Exo-L, Tetraspanins were preferentially enriched in Exo-S while G proteins and integrins were more prominent in Exo-L, Eukaryotic translation elongation factor i alpha 1 (EEF ! A!
- Exo-S was most often present in exomeres and Exo-L.
- Other proteins preferentially associated with Exo-S included immunoglobulin superfamily member 8 (IGSF8) and its para!og prostaglandin F2 receptor inhibitor (PTGFRN), milk fat globule-EGF factor 8 protein (MFGE8), and components of the ESCRT-l complex.
- IGSF8 immunoglobulin superfamily member 8
- PTGFRN para!og prostaglandin F2 receptor inhibitor
- MFGE8 milk fat globule-EGF factor 8 protein
- SI 00 proteins were only represented in the top 50 proteins of Exo-L,
- proteins that are typically associated with purified lipoprotein particles were examined by proteomic MS analysis and then evaluated their presence in exomeres and Exo-S/L. Much fewer proteins were found in lipoproteins (Table 2) and only some of these proteins were detected m exomeres and Exo-S/L, suggesting most nanoparticle proteins are distinct from lipoproteins. A rough estimation showed that the lipoprotein-associated proteins account for 0-8% of total nanopamcle proteins (FIG.
- Exo-S were enriched in membrane vesicle biogenesis and transport, protein secretion and receptor signaling gene sets.
- enriched gene sets included mitotic spindle, IL-2/StatS signaling, multi-organism organelle organization, and G-protein signaling.
- E-PHA detected a high molecular- weight glycoprotein (240 kDa) in MDA-MB-4175 exomeres and a high molecular weight glycoprotein ( 150 kDa) in AsPC- 1 and MDA-MB-4 175 exomeres
- L-PHA recognizing branched A-glycans detected a predominant band at 75 kDa in both Exo-S and Exo-L of B ! 6F- 10 and AsPC-i .
- Exo-S and Exo-L versus exomeres display distinct /V-glycosy!ation patterns.
- exomere and Exo-S L-associated A'-glycan profiles vary by ceil type. Future studies will address the identity of these
- glycoproteins via g!ycoproteomic approaches.
- FIG. 8C depicts the quantification of the top six most abundant jV-glycan structures detected in one of the representat ve experiments.
- Example 5 Distinct Lipid Composition Among Exomeres and Exosome Stibpopwiaiiotss
- PC Phosphatidylcholine
- PE and PS phosphatidySethanolamine
- PS phosphatidylserine
- PI Phosphatidyl inositol
- Sphingomyelin accounts for 2-10% of the total lipid in all samples except for AsPC-l Exo-S/L, which contained a higher level of SM (28%, FIG. 10B, 10C). Cholesterol data were not collected in this study,
- MG Monoglyceride
- PG phosphatidylglycerol
- !ysophosphatidylcholine i I .PC Monoglyceride
- PG phosphatidylglycerol
- !ysophosphatidylcholine i I .PC Monoglyceride
- PG phosphatidylglycerol
- lysophosphatidy!ethanolamirte was detected at higher levels in Exo-S/L from Bi 6-F IG and MDA-MB-4175, but not from AsPC-l .
- LPE lysophosphatidy!ethanolamirte
- Exomere DNA was relatively evenly distributed in a broad range of sizes between 100 bp and 10 kb with a slight enrichment around 2 kb in several eases.
- a strong enrichment between 2 kb to 4 kb was detected for Exo-S/L DNA, and the peak size of Exo-L DNA was slightly larger than that of Exo-S DNA. This phenomenon may be due to the structural capacity and different biogenesis mechanisms of each panicle subset.
- RNA associated with exomeres and Exo-S showed a monomodal distribution (peak at 400nt and 5G0nt, respectively), whereas Exo-L R A displayed a bi modal distribution (FIG. I I D) (additional peak >400Gnt).
- 18S and 28S rRNAs were detected at very low levels in Exo-L, barely detected in Exo-S and absent in exomeres compared to cellular RNA
- a strong small R A peak (corresponding to tRNAs, icroRNAs and other small R A ) was detected in Exo-S and Exo-L, but not in exomeres.
- a unique RNA peak of unknown identity, of ⁇ 3! 5nt in size was detected only in Exo-L,
- AF4 is highly reproducible, fast, simple, label-free and gentle. Moreover, the exosome subpopulations and exomeres were able to be efficiently resolved In a single AF4 run with real-time
- exomere cargo may modulate giycosylation In distant recipient cells
- Suhcellular localization analysis of exomere- enriched proteins revealed their specific association with Ell, mitochondria and microtubules, demonstrating the potential roles of these proteins In exomere biogenesis and secretion.
- tissue factor a well-studied exosame protein (Gardiner et ai hinge "Extracellular Vesicles, Tissue Factor, Cancer and Thrombosis - Discussion Themes of the 1SEV 2014 Educational Day,” Journal of Extracellular Ves ies 4:26901 (2015), which is hereby
- Exo-S were predominantly enriched in proteins associated with endosomes, multivesieular bodies, vacuoles, and phagocytic vesicles, while Exo-L were specifically enriched m plasma membrane, cell-cell contact/junction, iate-endosome, and trans Golgi network proteins. These data indicate that Exo-S are most likely bona fide/canonical exosomes (he., derived from intraluminal vesicles of endosomal compartments), whereas Exo-L may represent non-canonical exosomes or probably sEVs of different sub-cellular origin (he,, plasma membrane budding),
- Hsp9G ⁇ p highly represented in exomeres, could be a potential exomere marker, whereas several Hsp7Q family members, such as HSC70/HSPA8 could serve as possible markers for Exo-S/L subpopulations,
- exomeres and exosomes Similar to the expression in metastatic tumor cells, exoso e subsets were enriched with sialyiated glycoproteins, supporting the role of these structures in exosome-medkued cellular recognition.
- LGALS3BP galectin-3-bindmg protein
- a modulator of cell communication and immune responses White et aL,“Galee ⁇ In ⁇ 3 Binding Protein Secreted by Breast Cancer Cells Inhibits Monocyte-Derived Fibrocyte Differentiation” Journal of Immunology 195: 1858-1867 (2015); Laubli et ah,“Lectin Galactoside-Binding Soluble 3 Binding Protein (LGALS3BP) Is a Tumor-Associated Immunomodulatory Ligand for CD33-Rciated Siglees,” The Journal of Biological Chemistry 289:33481 -3349 !
- exomeres distinguished exomeres from Exo-S and Exo-L, For instance, exomeres were found to contain higher levels of triglycerides and ceram Ides compared to exosome subpopu lotions and thus may serve to transport these metabolites to recipient cells.
- the study further revealed that DNA packaging in exomeres and exoso es varied by tumor-type, while RNA was packaged in Exo-S and Exo-L independent of tumor classification. [ 223J
- the findings demonstrate that proteins, glycans, lipids, and nucleic acids arc selectively packaged in exomeres, fi ⁇ o ⁇ S. and Exo-L, further supporting the idea that these are distinct nanoparticle subsets,
- exomeres The identification of exomeres highlights the diversity of BVs and particles secreted by cells. Elucidating their biogenesis will be essential to unravel their roles in cellular and organ function. Target cells and the functional outcomes exerted by each nanopartide subset in organs need to be further delineated to advance the understanding of the collective, systemic effects of nanoparticles In the metastasis process. Undoubtedly, these discoveries will open avenues for translational studies of EVs and particles in diagnostic, prognostic, and therapeutic appl cations.
- sEVs small extracellular vesicles
- sEVs isolated using dUC as the input samples for AF4 were studied.
- Alternative methods, such as DOF, UF and SEC, can also be used for sEV Input sampling, EVs captured by 1AC cars be applied, as well, if the antibody can be removed from the EVs.
- this protocol could also be applied to sEVs prepared from other resources, such as bodily fluids, Including plasma, AF4 parameters, such as the cross-flow gradient, can be further adjusted to meet the specific requirements of particular samples (for example, existence of additional types of ENPs).
- AF4 parameters such as the cross-flow gradient
- the EV composition is more complicated than that derived from conditioned media of ceil cultures.
- the presence of lipoprotein particles in blood plasma may interfere with the separation of exosomes due to their partial overlap in size.
- other means of prior removal of lipoproteins from the plasma sample is desired before loading them onto the AF4 channel,
- R h is the radius of a sphere with the same translational diffusion coefficient as the analyzed solute.
- R 3 ⁇ 4 depends only on the physical size of the solute and its size-related behavior, such as diffusion and viscosity, but is not affected by its density or molecular weight.
- the measurement range of 0-5 nm to 1000 run radius makes DUS an effective tool to measure the size of sEVs.
- Combining AF4 with online DLS measurements is critical for accurate size determination, hi a polydlsperse sample. DLS measurement yields an average h and the specific information on each compositional species in a given sample is missing.
- fractionation results in the separation of solutes with different sizes and each fraction contains only a very small admixture of different 3 ⁇ 4 particles.
- fractionation allows the size of each species to be more accurately measured.
- the resulting autocorrelation functions are single exponentials, which are simple to interpret. Fitting the data to a single exponential function is performed in the Astra software using the Cumulants model (Wyatt Technology Corporation. DYNAMICS Users Guide, Version 7.0 (M 1400 Rev, !) Appendix A-2 (2010), which is hereby incorporated by reference in its entirety), By examining the ideal fitting to a single exponential, one can further evaluate the separation quality.
- R h One requirement for accurate DLS measurement of R h is that the sample concentration must be sufficient so that the sample scatters at least three times more light than the solvent to obtain an acceptable signal/noise ratio.
- small molecules, such as exomeres scatter less light and require even higher concentrations of analyte to optimize results, (0233 !
- SLS static light scattering
- R e the radius of gyration
- R s is defined as the mass averaged distance of each point in a molecule from its gravity center and is generally different from R 3 ⁇ 4 Comparing R g to Rs can further reveal the compactness of a solute (hi?., empty versus filled particles).
- the MALS detector is more sensitive than DLS monitoring and thus it will be of specific use when only little amount of material available for analysis.
- the UV detector Is used as part of the instrumentation for online concentration measurements, The intensity of UV absorbance can provide us an approximation of the relative abundance of different species in the sample, despite not having defined extinction coefficients for different species in the EV sample mixture.
- the peaks of UV absorbance are useful in guiding the choice of combining fractions of similar particles.
- the bicinchoninic add assay (BCA assay) and TA is often conducted after fraction collection for quantification purposes. Once pure EVs are obtained and further characterization can be performed, the extinction coefficients of each species for improved interpretation of the UV absorbance data to concentration can then be determined.
- dRl considered a universal concentration detector
- FLDs are useful if autofluorescent molecules or artificial fluorescent labeling are present in specific subsets of EVs.
- the fractionated particles take a longer path and more time to reach the fraction collector. As a result, diffusion of molecules will lead to broadening of peaks, dilution of fractionated samples and reduction in separation resolution. Therefore, only- detectors considered essential for the real-time monitoring should be installed.
- Fraction collection, concentrations and characterization Fraction collection, concentrations and characterization.
- AF4 fractions can be collected automatically or manually for downstream offline characterization
- the Agilent Fraction Collector (1260 series) has been installed to automatically collect fractions into 96 ⁇ well plates, but similar fraction collectors can be utilized for accurate and reproducible fraction collections.
- Fractions can be collected either by volume or over time, and fractions of particles with the saute identity based on online and offline characterization can be further pooled together for downstream analysis.
- this fraction combination step cars be empirically determined. Due to the different composition of EV subpopulations in a given sample, occasionally the UV peaks are not identifiable and thus the fraction combination will rely more on other properties, such as size and morphology,
- the individual or combined fractions can be directly utilized for downstream analysis or subjected to a concentration step before further characterization.
- the collected fractions arc usually concentrated using the Amicon Ultra-series of centrifugal filter units with Ultracel-30 (30 KDa cutoff) membrane (Mlllipore).
- Other alternative means of concentration such as tangential filtration centrifugation, direct UF, UC, or 1AC, can be applied depending on the need for the downstream analysis.
- fractionated EVs A variety of analyses can be performed on fractionated EVs, including but not limited to: BCA assay, NTA, atomic force microscopy, electron microscopy, mass spectrometry of molecular contents (e.g handed proteins, lipids, glycan, and metabolites), western blotting or the enzyme-linked immunosorbent assay, sequencing of genetic material (DNA and RNAs), DLS measurement in batch mode, and zeta potential measurement
- BCA assay BCA assay
- NTA atomic force microscopy
- electron microscopy e.g., atomic force microscopy, electron microscopy, mass spectrometry of molecular contents (e.g staggering proteins, lipids, glycan, and metabolites), western blotting or the enzyme-linked immunosorbent assay, sequencing of genetic material (DNA and RNAs), DLS measurement in batch mode, and zeta potential measurement
- the functional roles of the fractionated EV subpopulations can be further investigated in vitro or
- B 16-F 10 cell line (ATCC), Cell lines should be regularly checked to ensure that they are authentic and free of mycoplasma contamination,
- FBS Premium Grade Fetal Bovine Serum
- Penicillin-Streptomycin Solution 50X (Corning, Catalog No, 30-001 -Cl)
- ATCC Universal Mycoplasma Detection kit (ATCC, Catalog No. 30-1012K)
- Bovine serum albumin (BSA) (Sigma, Catalog No, A 1900)
- VWR 15ml../ 50m t conical tubes (VWR, Catalog No, 82050-276/ 82050-346) * 1.7 ml icrocentrifuge Tubes (VWR, Catalog No, 53550-698)
- Chemstation integrated with the Eclipse module (Wyatt Technology) to operate the AF4 flow
- ell culture medium 500 ml. of D EM is supplemented with 10% (vol/vol) FB5 (exosome-depSeted), 50 unsts/mL Penicillin, 50 pg/mL Streptomycin, and 2mM L- G!utamine, and stored month.
- ultracentrifugation should be autoclaved.
- the entire FBS handling process should be carried out i a Bioloefca! Safe v Cabinet for tissue culture,
- the final solution is made freshly and filtered with a 0,22pm filter unit,
- BSA solution Dissolve BSA powder in PBS at a concentration of 0.5 mg/mL and store aliquot at -20 °C for long term.
- 1% (vol/vol) Csmira 7Cb Dilute Contrad 70 with Mills Q water to a ftrsal concentration of 1% (vot/vol), and store at room temperature (RT, ⁇ 22 °C) for long term.
- Type 45-Ti ultracentrifuge rotor pre-chilled at 4 ft C.
- the rotors should be kept at 4°G when no in use, , Transfer the supernatant to new ultracentrifuge tubes and centrifuge at 100,000 x g at
- the sEV sample for AF4 fraction in the next section The pellet sometimes may be hard to break and resuspended into a homogeneous suspension. If so, the samples can be kept on ice for another 15 to 30 minutes or an extra volume of PBS can be added to the sample. Then gently pipette up and down to resuspend the samples and transfer to Eppendorf tubes for quantification. Avoid introducing air bubbles, 8. Quantify the sEV yield by measuring the protein concentration using the Pierce BCA
- Protein Assay Kit Following the manufacture r s instruction to mix the samples or B8A standards provided by the kit with the reagents in a 96-well plate and incubate at 37 °C for 30 minutes. Read the absorbance at 562 mn using the AccuScan GO UV Vis Microplate Spectrophotometer and calculate the concentration of the samples based on the BSA standards included. 9, The samples can be Immediately applied for AF4 fractionation, or kept on ice overnight to be processed further the next day. The samples can be frozen at -8(fC for long term storage,
- the membrane type and cutoff size e.g, t € membrane with 10 KDa cutoff size
- the spacer with desired thickness III i,e, the channel height, preferably 490pm
- the instrument can be operated in the Night Rinse mode overnight, up to a few days after membrane coating.
- the purpose of this step is to block non-specific binding of the samples to the membrane.
- the sample to be analyzed if extra sample is available, can be used for this blocking step, too, This step Is only needed when a new membrane is installed.
- turn on the COMET of the DAWN HELEOS II detector for about 30 min to clean the flow cell.
- QELS interval at 2 seconds; set the duration for data collection at 60 minutes; select "T igger on Auto-Inject”;
- Pre-spinning of the sample before loading onto AF4 is critical to avoid analyzing artifacts of aggregates formed during the high-speed ukracentrifugation, .
- the Autosampier module of Chemstation specify the sample volume to analyze (40 to 100 pi; Le, 40 to 100 pg at I pg/pl), and then click the "Single Sample” to start the fractionation, real time data collection (MALS, DLS, and UV absorption), and fraction collection (by time slice of 0,5 L),
- MALS, DLS, and UV absorption real time data collection
- fraction collection by time slice of 0,5 L
- a good practice includes running a PBS blank control (or other types of running buffer used to analyze the samples) using the same AF4 running method for the samples on the same day.
- This blank control cars help evaluate the Instrument performance such as background noise level and identify systemic problems than may influence sample analysis.
- Step 12 After ail samples have been analyzed for the day, turn on the COMET of the DAWN HELEOS 11 for -30 minutes and switch off the laser, UV lamp, thermostat and fraction collector. Change the aqueous solvent to water and run in the Night Rinse mode overnight or tip to a few days. For long term storage, please refer to Step 12,
- Online data analysis is performed using Astra 6. First, select the experiment to be analyzed and
- the sample concentration should be high enough to scatter enough light for accurate R h deter ination, especially for small size particles as they scatter much less light.
- Adjacent fractions with similar properties can be combined and concentrated for downstream analysts, If a high amount of material is required for the
- the filter columns are first pre-rinsed by adding 5 ml- (for Ultra-4 filter column) or 15 mL (for Ultra- 15 filter column) of Ice-cold PBS followed by spinning at 3,700 x g at 4°C for 5 minutes. The flow-through and liquid remaining in the top filter columns are discarded,
- step 31 (c) Repeat step 31 (b) until each sample is concentrated to the desired volume.
- the same filter column can be repeatedly loaded and spun to concentrate the sample.
- the concentrated samples can be kept on ice for short-term storage (up to 2-3 days) or frozen at ⁇ 80°C for long term storage. Downstream molecular characterizations and functional study can be followed up on these concentrated fractionated samples.
- AF4 for the first time, check the morphology of representative individual fractions by TEM first before pooling fractions together for further analysis. It is possible that particles with same hydrodynamic size but different morphology are eluted together from AF4.
- Step 10- 12 the AF4 channel assembling; -I hour,
- Step 13-14 Equilibration and coating the membrane with BSA: 2 - 3 hours.
- Step 10- 14 are only needed when a new membrane is installed .
- Step 15-26 AF4 fractionation of sEVs: 1-2 hours per sample.
- cross-flow is the driving force counteracting the
- cross-flow is a defining factor In AF4 fractionation quality.
- Exosome fractionation profiles (fractograms of UV absorbance and DLS) were devised from representative cross-flow settings, as shown in FIG. 16, Specifically, linear gradients of cross -flow with different starting flow rates (at 0.3, 0,5 and 1 ,0 mL/min) and slopes (U' how fast the cross-flow drops to 0 mL/min; tested conditions: a decrease in flow rate from 0.5 to 0 mL/min within 35, 30 and 45 min) were examined.
- P0 Is the void peak, resulting from flow disturbance when switching from the focus/injection mode to the elution mode, PI is a very minor peak, generated by the concomitant elution of the void peak and species that were smaller than exomeres.
- P 1 was sometimes barely detected, P5 was generated due to loss of control on flow rate when it decreased be few -0,08 mL/min and afl retained sample components (larger microparticles and/or aggregates of small particles) were eluted out.
- the height the thickness of the channel was the only parameter available for further optimization, A series of spacers with different thicknesses ( 190, 250, 350 and 490 pm) were provided by the manufacturer, The channel height affects the parabolic laminar flow rate profile and thus the separation resolution, it also affects the channel capacity, with a thicker channel allowing for analysis of larger sample amounts. Since enough sample needed to be recovered for downstream analysis, the loading capacity is an important factor for the fractionation and so employing only spacers with a thickness of 350 pm and 490 pm were considered, As shown in FIG. 17, the channel with the 350-pm spacer eluted samples earlier but with narrower peaks and a reduced separation resolution compared to the channel with the 490-pm spacer. Therefore, the 490-pm spacer was chosen for the work.
- the focusing flow rate was fixed at 0.5 mL mirs, the same as the initial cross- flow rate for elution, and then tested different time periods (2, 5, d 10 minutes) for focusing efficiency. As shown in FIG. 18, different focusing times did not significantly affect peak shape or resolution power. Moreover, before exomere elution occurred, the fractograms of both UV and DLS reached similar baselines, Notably, it was observed that the P5 signal Intensity increased as focusing time increased, suggesting potential particle aggregation caused by extensive focusing. Therefore, a focusing time of 2 minutes was chosen for the study.
- the RC membrane was selected for the studies.
- AF4 was then examined.
- the minimal amount of material required for AF4 is determined primarily by the sensitivity limit of the online detectors, such as DLS and UV monitors. The signal/noise ratio must be adequate for accurate data collection and interpretation.
- the maximal amoun of material is determined by the required resolution of fractionation, which depends on the purpose of the experiment and the complexity of the sample to be analyzed. To efficiently separate exomeres and the two exosome subsets that are reposted herein from small (s)BVs prepared using UC, different amounts of Bf 6-F!G ⁇ derived sEV input samples ranging from 15 pg to 165 pg were tested.
- AF4 technology provides unique capabilities io separate nanoparticles with high resolution within a large size range.
- AF4 distinct exosome subpopulations and exomeres were able to be efficiently separated.
- AF4 can yield valuable data on E P analytes, including particle morphology and size, relative abundance, molecular composition, and other biophysical and biochemical properties.
- a powerful tool, AF4 can help researchers decipher the complexities and
- the AF4 protocol describes the fractionation of exonieres and exosome subsets from sEVs isolated from the conditioned media of B 16-F 10 celts and a panel of more than 20 different cancer cell lines and 5 normal cell lines.
- This AF4 method can be used to fractionate and characterize sEVs isolated from an array of bodily fluids (including blood plasma or serum, lymphatic fluid, bone marrow plasma, cerebrospinal fluid, urine, saliva, bronchoalveolar lavage, milk and amniotic fluid), given their similar particle compositional complexity. Since ah cells are capable of shedding EVs, this protocol can be employed to study the EV biology of any organism,
- this protocol can also be modified for use in the field of quality control in exosome ⁇ based pharmaceutical production.
- Exosomes have become obligate therapeutic delivery vehicles for treating cancer and other types of diseases (Batrakova & Ki ,“Using Exosomes, Naturally-Equipped Nanocarriers, for Drug Delivery, " ./ Control Release 219:396-405 (2015), which is hereby incorporated by reference in its entirety).
- AF4 coupled with sensitive molecular assays can serve as an improved analytic tool to evaluate purity, drug loading efficiency, and the integrity of the exosome product by detecting debris or aggregates,
- this protocol can serve as a reference to further develop and optimize methods for fractionating and characterizing other types of ENPs.
- Some unique advantages of AF4 are its high resolution and large size range of fractionation and that different conditions, such as cross-flow setting and focus time, can be easily tested by simply programing the settings into the software, with minimal handling of the channel.
- fractionation protocols for large EVs such as larger microparticles and oncosomes, can be further developed. Specific caution should be taken when fractionating large particles since they may be too large to elute in the normal mode (when the particle is small and considered as point-mass compared to the channel height) but in the steric model instead (FIG. 15).
- other Helds such as electric field, can also be applied to AF4 to stratify particles based on additional biophysical properties other than size, allowing even broader application of AF4 technology,
- dUC can process large volumes and high amounts of sample, hut the purify of the material recovered is poor, it can only roughly partition particles Into groups, such as large vesicles, microparticles, and sEVs (enriched for exomeres and exosomes), with expected heterogeneity within each group and contamination for other groups.
- groups such as large vesicles, microparticles, and sEVs (enriched for exomeres and exosomes)
- the high centrifugal force may also cause sample aggregation.
- the advantage of dUC was used by first stratifying and concentrating the sBV population and then analyzing particles at much higher resolution to further fractionate exomeres and exosome subsets,
- DGF Density gradient floatation
- DGP DGP-dependent reproducibility
- AF4 AF4 is rapid, fully automated, highly reproducible, robust, and compatible with many buffer choices that mimic physiological conditions.
- AF4 demonstrates superior resolution over a much wider size range (Fraunhofer et ah,“The Use of Asymmetrical Flow Field-Flow Fractionation in Pharmaceutics and Biopharmaceutics, ” Ear J Pharm Biophann 58:369-383 (2004), which is hereby Incorporated by reference in its entirety). SEC resolution drops when particles are close to or larger than the upper limits of pore size. Furthermore, SEC is not as flexible as AF4 in changing separation parameters and its size range of separation is fixed for a given column with a specific solitary phase. Moreover, AF4 contains a hollow channel with only a membrane at the accumulation wall but, unlike SEC, requires no stationary phase.
- UF allows for straightforward Isolation of EV populations based on their size by filtering the sample through a series of sermpermeahle membranes with defined pore sizes (be., as reflected by molecular weight cutoffs) (Xu ef aL, "Highly-Purified Exo somes and Shed Mierovesicles Isolated from the Human Colon Cancer Cell Line LIM 1863 by Sequential Centrifugal Ultrafiltration are Biochemically and Functionally Distinct,” Methods 87:1 1 -25 (2015); Xu et ah,“A Protocol for Isolation and Proteomic Characterization of Distinct
- UF Extracellular Vesicle Subtypes by Sequential Centrifugal Uitnifiitratlonw Methods Mol Biol 1545:9 M 16 (2017), which are hereby incorporated by reference in their entirety). Smaller particles below the cutoff size can penetrate through the pores while larger ones are retained, UF provides a crude separation of EVs due to limitations of membrane pore size availability. Most EVs are not rigid spheres but rather flexible particles and can transfigure to pass through the pores, especially when pressure is applied. Another concern is the uniformity of membrane pore size, which Is critical for separation purity. Though the separation power of UF is Inferior to AF4, UF can serve as a means to pre-strati fy and concentrate input samples for further analysis by AF4.
- the AF4 instrument is commercially available (e,g., Wyatt Technology) and the manufacturer can perform the initial set-up.
- the method development for specific sample analysis, routine maintenance of instruments, and troubleshooti ng require a good understanding of the working principles of AF4 and installed detectors, training for handing the AF4 channel and detectors, and being familiar with software used for AF4 operation and data collection, Previous experience with chromatography and/or microfluidics is helpful in mastering the AF4 application.
- only minimal skills, such as familiarity with software Interface and proper instructions, are necessary to complete the fractionation process since nearly all the steps are automatic and programmed. Limitations
- AF4 fractionates samples based on their size.
- a second inherent drawback is that AF4 cars accommodate only small amounts of sample ie.g., 40 pg to 100 pg in the present case), which is often not efficient for large-scale preparations in more detailed assessments of nanoparticle properties.
- the sample instead can he divided into multiple fractionation analyses for improved characterization of specific
- a third limitation of AF4 is that due to the loading capacity limitation, the input sample requires UC preparation or other means to first stratify and concentrate the analytes (i.e. sEVs in the present study) prior to fractionation.
- Another key factor for successful AF4 analysis and fractionation is the amount of Input samples loaded onto the AF4 system. Overloading the system will result in poor resolution and inefficient separation of narsopartseles; whereas loading too little a sample will lead to poor signal detection and inaccurate data deduction, as shown in FIG. 19.
- FIG. 22A i.e, exomeres, Exo-S and Exo-L, corresponding to peaks P2, P3 and P4,
- the autocorrelation function I is a key factor to determine the purity of each fraction (FIG, 22B),
- the separated particles can be further recovered and usuall need further concentration for a variety of offline analyses, such as TEM, NTA, BCA assay,
- FIG. 22C Shown in FIG. 22C is TEM imaging analysis of combined fractions for B l b- Fi O exomeres, Exo-S and Exo-L, revealing the distinct morphology of each sEV subset.
- FIG. 24 shown in FIG. 24 are the top 50 gene lists that are up-regulated (FIG. 24A) or down-regulated (FIG, 24 B) in all three groups when compared to the PBS control group, respectively.
- These genes can therefore serve as potential biomarkers for detection of disease, monitoring liver dysfunction, and therapeutic targets to intervene with tumor progression in cancer patients.
- the Serum Amyloid A family genes (Saal , Saa2 and Saa3), Si 00 calcium-binding protein A4 (S I 00A4), and a subset of rtfaosoma! protein subunits (Rp!4i , Kps24, Rp!36, Rpl35, Rpl21 , Rps 12, Rps 18, Rps 14, Rp!
- RpL14. Rps 10, and Rpi 17 are specifically upregulated in the liver of mice treated with exomeres, Exo-S md Exo-L when compared to the FBS control
- transcription factors such as Forkhead box protein N3 (Foxn3), TEA domain family member 1 (Tead l ), Nuclear Factor Of Activated T Cells 5 (Nfat5), Forkhead box Q! (Foxq l ), Forkhead box K t (Foxkl ), Kruppel Like Factor 12 (KIP 2), and ETS domain-containing protein (Elk4) are among the top 50 genes that are significantly down-regulated genes in all three groups,
- FIG. 25 Shown in FIG. 25 are the top five canonical pathways that were identified In each dataset: exomere versus PBS (FIG. 25A); Exo-S versus PBS (FIG. 25B); Exo-L versus PBS (FIG. 25C); exomere versus Exo-S (FIG. 25D), and exomere versus Exo-L (FIG. 25 E).
- pathways including E2F signaling, rnTQR signaling, and regulation of el F4 and p70S6K signaling are identified to be remarkably changed in all three groups of exomeres, Exo-S, and Exo-L when compared to the PBS control indicating their Fundamental influence on the proliferation and metabolism of the liver.
- pathways of Molecular Mechanisms of Cancer and Glucocorticoid Receptor Signaling are specifically recognized among the top five canonical pathways in the exomere versus PBS group; pathways of
- FIG. 26A listed the number of metabolites whose abundance are significantly affected in each comparison group using unpaired t test.
- FIG. 26B illustrated all the metabolites identified with significant changes
- FIG, 26C showed the clustering analysis o the metabol tes that are uniquely a fleeted in each group.
Abstract
The present invention is directed to methods of diagnosing, prognosing, and managing treatment of cancer in a subject. These methods involve selecting a subject having cancer and obtaining, from the selected subject a population of either exomeres having a diameter less than 50 nm, small exosomes having a diameter of 60-80 nm, or large exosomes having a diameter of 90-120 nm, The exomeres, small exosomes, or large exosomes are recovered from the sample, and the exomeres, small exosomes, or large exosomes or portions thereof are contacted with one or more reagents suitable to detect: (1) higher or lower levels, relative to a standard for subjects not having cancer, or the presence or absence, of one or more proteins contained in said exomeres, small exosomes, or large exosomes, (2) higher or lower levels, relative to a standard for subjects not having cancer, or the presence or absence, of one or more N-giyeans contained In said exomeres, small exosomes, or large exosomes, (3) higher or lower levels, relative to a standard for subjects not having cancer, or the presence or absence, of one or more lipids contained in said exomeres, small exosomes, or large exosomes, (4) the presence or absence of one or more genetic mutations in nucleic acid molecules associated with cancer and contained in said exomeres, small exosomes, or large exosomes, or (5) combinations thereof. Cancer is then diagnosed, prognosed, or treatment Is modified based on this information.
Description
NANOPARTICLES AND DISTINCT EXOSOME SUBSETS FOR DETECTION AND
TREATMENT OF CANCER
|QQ6!) This application claims the priority benefit of U.S. Provisional Patent Application
Serial Nos. 62/623,992 and 62/593,504, filed January 30, 2018 and December 1 , 2017, respectively, which are hereby incorporated by reference in its entirety.
[0002] This invention was made with government support under R01 CA218513 and
R01 CA169416 awarded by National Institutes of Health; U01 CA 169538 awarded by National Cancer Institute; and W81XWH- 13- 10249 and W81 XWH~13~1 -0425 awarded by Department of Defense. The government has certain rights in the invention.
FIELD OF THE INVENTION
100031 The present invention relates to rmnoparticies and distinct exosome subsets for detection and treatment of cancer.
BACKGROUND OF THE INVENTION
[00041 Ceils secrete a wade variety of soluble factors and extracellular vesicles (EVs) to mediate intercellular communication (locally and systemically) under both physiological and pathological conditions, including cancers CThery et ah,“Exosomes: Composition, Biogenesis and Function” Nat Rev Immunoi 2:569-579 (2002); Andaloussi et a!.,“Extracellular Vesicles: Biology and Emerging Therapeutic Opportunities,” Na! Rev Drug Discov 12:347-357 (2013); Raposo & Sioorvogel,“Extracellular Vesicles: Exosomes, Microvesicles, and Friends,” J Cell Bio! 200:373-383 (2013)). EVs are heterogeneous and comprise various subclasses, including exosomes, which are small (50 ran to 150 nm) extracellular membrane vesicles of endosomal origin, and microvesicles, which are large (150 nm to 500 nm or even larger to >10gm) vesicles shed directly by budding from the cellular plasma membrane. Cancer cells shed atypical!y large vesicles, known as large oncosomes (0.5 p to 10 pm) which result from alterations in specific signaling pathways (e g. Ras Homolog Family Member A/Rho-associaied protein kinase (RhoA/Rock) signaling) (Di Vizio et al,“Oncosome Formation in Prostate Cancer: Association with a Region of Frequent Chromosomal Deletion in Metastatic Disease,” Cancer Res 69:5601- 5609 (2009); More!!o et a!.,“Large Oncosomes Mediate Intercellular Transfer of Functional MieroRNA,” Cell Cycle 12:3526-3536 (2013); Mineiacehi et ah,“MYC Mediates Large Oncosome- induced Fibroblast Reprogramming in Prostate Cancer,” Cancer Res 77:2306-2317 (2017)). Extensive research has shown that functional molecules, including proteins, genetic material, metabolites and lipids, are selectively recruited and packaged into EVs and horizontally
transferred to recipient cells, thereby acting as vehicles of intercellular communication (Balaj et ah, "Tumour Microvesicles Contain Retrotransposon Elements and Amplified Oncogene
Sequences." Nai Commun 2:180 (201 1 ); Choi et al.,“Proteomies, Transcriptomics and
Upidom ics of Exosomes and EctosomesT Praieomics 13: 1554- 1571 (20 i 3); Thakur et al., "Double-Stranded DNA in Exosomes: A Novel Biomarker in Cancer Detection,” Cell Res
24:766-769 (2014); Telia et ah, "Extracellular Vesicles as an Emerging Mechanism of Cell-to- Cell Communication," Endocrine 44:1 1-19 (2013)). In addition, through the work described herein, a novel population of non-membranous nanoparticles termed“exomeres’ (-35 n ) have been identified, which are indeed the predominant extracellular nanopasticles (ENPs) secreted by most types of cells,
|0005] Exosomes are narsosixed extracellular membrane vesicles of endosomal origin secreted by most cell types, including cancer cells (Thery et ah,‘'Exosomes: Composition, Biogenesis and Function,” Nature Reviews, Imnmmdog} 2:569-579 (2002); El Andaioussi et al, "Extracellular Vesicles: Biology and Emerging Therapeutic Opportunities;’ Nature Reviews. Drug Discovery 12:347-357 (2013); Raposo et al,, "Extracellular Vesicles: Exosomes,
Microvesicles, and Friends,” The Journal of Ceil Bio!og\> 200:373-383 (2013)). Proteins, genetic material (e.g., mRNAs, msRNAs, InRNAs, DNA), metabolites and lipids, are selectively recruited and packaged into exosomes, which horizontally transfer their cargo to recipient cells, thereby acting as vehicles of intercellular communication in both physiological and pathological conditions (Balaj et al,, "Tumour Microvesicles Contain Retrotransposon Elements and
Amplified Oncogene Sequences;’ Nature Commu catiom 2: i 80 (201 1 ); Choi et ah, “Proteomics, T anscripiom cs and Lipldomics of Exosomes and Ectosomes,” Proteomics
13: 1554-1571 (2013); Thakur et al.,“Double-Stranded DNA in Exosomes: a Novel Biomarker in Cancer Detection;’ Cell Research 24:766-769 (2014); Tetta et ah,“Extracellular Vesicles as an Emerging Mechanism of Cell-to-Cell Communication,” Endocrine 44: 1 1- 19 (20 S 3)), Hamcsmg this knowledge, translational researchers have focused on developing exosome-based
d!agnostic/prognostic biomarkers and therapeutic strategies.
(0006] The present invention Is directed to overcoming these and other deficiencies in the art.
SUMMARY OF THE INVENTION
|0007j A first aspect of the present invention is directed to a method of diagnosing cancer in a subject. This method involves selecting a subject having cancer and obtaining, from the selected subject, a population of either exomeres having a diameter of less than 50 nm, small exosomes having a diameter of 60-80 nm, or large exosomes having a diameter of 90- i 20 nm.
The exomeres, small exosomes, or large exosomes are recovered from the sample, and the exomeres, small exosomes, or large exosomes or portions thereof are contacted with one or more reagents suitable to detect: ( l ) higher or lower levels, relative to a standard for subjects not having cancer, or the presence or absence, of one or more proteins contained In said exomeres, small exosomes, or large exosomes, (2) higher or lower levels, relative to a standard for subjects not having cancer, or the presence or absence, of one or more N-g!yeans contained In said exomeres, small exosomes, or large exosomes, (3) higher or lower levels, relative to a standard for subjects not having cancer, or the presence or absence, of one or more lipids contained in said exomeres, small exosomes, or large exosomes, (4) the presence or absence of one or more genetic mutations in nucleic acid molecules associated with cancer and contained in said exomeres, small exosomes, or large exosomes, or (5) combinations thereof. Cancer is then diagnosed based on the contacting step.
|09O8| Another aspect of the present invention is directed to a method of prognosing cancer in a subject. This method involves selecting a subject having cancer and obtaining, from the selected subject, a population of either exomeres having a diameter of less than 50 nm, small exosomes having a diameter of 60-80 nm, or large exosomes having a diameter of 90- 120 nm. The exomeres, small exosomes, or large exosomes are recovered from the sample, and the exomeres, small exosomes, or large exosomes or portions thereof are contacted with one or more reagents suitable to detect: (I) higher or lower levels, relative to a standard or to the level in a prior sample obtained from the subject, or the presence or absence, of one or more proteins contained in said exomeres, small exosomes, or large exosomes, (2) higher or lower levels, relative to a standard or to the level in a prior sample obtained from the subject, or the presence or absence, of one or more N-glycans contained in said exomeres, small exosomes, or large exosomes, (3) higher or lower levels, relative to a standard or to the level in a prior sample obtained from the subject, or the presence or absence, of one or more lipids contained in said exomeres, small exosomes, or large exosomes, (4) the presence or absence of one or more genetic mutations in nucleic add molecules associated with cancer and contained in said exomeres, small exosomes, or large exosomes, or (5) combinations thereof Cancer is then prognosed based on the contacting step.
0009] Another aspect of the present invention is directed to a method of managing treatment in a subject. This method involves selecting a subject undergoing treatment for cancer and obtaining, from the selected subject, a population of either exomeres having a diameter of less than 50 nm, small exosomes having a diameter of 60-80 nm, or large exosomes having a diameter of 90-120 nm. The exomeres, small exosomes, or large exosomes are recovered from the sample and the exomeres, small exosomes, or large exosomes or portions thereof are
co tacted with one or more reagents suitable to detect: ( 1 ) higher or lower levels, relative to a standard or to the level in a prior sample obtained from the subject, or the presence or absence, of one or more proteins contained in said exomeres, small exosomes, or large exosomes, (2) higher or lower levels, relative to a standard or to the level in a prior sample obtained from the subject, or the presence or absence, of one or more N~giycans contained in said exomeres, small exosomes, or large exosomes, (3) higher or lower levels, relative to a standard or to the level in a prior sample obtained from the subject, or the presence or absence, of one or more lipids contained in said exomeres, small exosomes, or large exosomes, (4) the presence or absence of one or more genetic mutations in nucleic acid molecules associated with cancer and contained in said exomeres, small exosomes, or large exosomes, or (5) combinations thereof, Treatment is then modified based on the contacting step,
fOO!OJ Another aspect of the present invention relates to a kit suitable for diagnosing cancer. The kit includes one or more reagents suitable to detect: (1 ) higher or lower levels, relative to a standard or to a sample from a subject, or the presence or absence, of one or more proteins contained in exomeres, small exosomes, or large exosomes, {2} higher or lower levels, relative to a standard or to a sample from a subject, or the presence or absence, of one or more N- glycans contained in exomeres, small exosomes, or large exosomes, (3) higher or lower levels, relative to a standard or to a sample from a subject, or the presence or absence, of one or more lipids contained in exomeres, small exosomes, or large exosomes, (4) the presence or absence of one or more genetic mutations in nucleic acid molecules associated with cancer and contained in exomeres, small exosomes, or large exosomes, or (5) combinations thereof, wherein said exomeres have a diameter of less than SO nm, said small exosomes have a diameter of 60 to 80 nm and said large exosomes have a diameter of 90 to 120 nm,
[001 I | Through studies described herein, the influence of several key parameters of AF4 that were shown to be critical for high-resolution separation of distinct exosome subsets were evaluated. These influencing factors included cross-flow, channel height, sample focusing, type of membrane, and the amount of loaded sample. It should be noted that these factors collectively determine fractionation quality, and changing one parameter usually affects the influence of other factors on resolution power. Testing different combinations of these factors, however, can be expensive, time-consuming, and labor-intensive, and thus can be impractical. Understan ing the working principles of AF4 and determining the complexity of the analyzed samples will be useful to guide the method development process,
10012) The present Invention describes identification of a novel type of nanopartiele secreted by most cell types, including cancer cells, which are termed exomeres. Exomeres are a prominent and heterogeneous population of small (<50 n hydrodynamic diameter, with a peak
about 35 nm), weakly negatively charged (-2.7 mV to -9.7 mV), and highly stiff {- 145-SI 6 MPa) nanoparticles secreted by cells. Structural analysis reyealed the lack of external lipid-bilayer membrane structure of exomeres, and molecular characterization showed its composition of a variety of biologically functional molecules, including proteins, lipids, nucleic acids (DMA and IlNAs), metabolites, and glycans. Besides exomeres, two distinct subsets of exosomes, namely the small exosomes (Exo-S, 60-80 nm) and large exosomes (Exo-L, 90-120 nm) were separated, by employing the technique of asymmetric flow field-flow fractionation (AF4). In contrast to exomeres, both Exo-S and Exo-L have external lipid-bi layer membrane structures, carry more negative charges, and are softer than exomeres,
|00I3] The studies described herein reveal that each nanoparticle type, i.e. exomeres,
Exo-S and Bxo-L, contain unique molecular signatures In comparison to each other, These nanoparticles are secreted into both the surrounding environment of cells and the peripheral circulation system and other types of body fluids. Therefore, these nanopartides represent a reservoir of biomarkers for cancer diagnosis, prognosis and monitoring disease progression and recurrence post treatment.
|O014] Furthermore, both exomeres and exosome subsets can horizontally transfer their cargo to recipient cells, thereby acting as vehicles of lntercelluSar communication in both physiological and pathological conditions, thus representing targets of therapeutics development. Specifically, exomere proteomic profiling revealed an enrichment in metabolic enzymes and hypoxia, microtubule and coagulation proteins and specs fie pathways, such as glycolysis and mTOR signaling. Exo-S and Exo~L contained proteins involved In endosomal function and secretion pathways, and mitotic spindle and 1L-2/STAT5 signaling pathways, respectively . Biodistribution examination revealed that exomeres target organs such as liver, spleen, and bone marrow primarily, Implicating their potential function in systemic regulation during tumor progression. In distinction to the observation of exomeres, Exo-S demonstrated higher uptake by the lung and Exo-L by lymph nodes, suggesting their potential roles in mediating organ-specific metastasis and immune response during disease progression, respectively
[OOtSf Taken together, the newly identified exomeres, Exo-S and Exo-L present unique potential of serving as biomarkers and therapeutic targets for cancer patients,
BRIEF DESCRIPTION OF THE DRAWINGS
[0016J FIGs. I A- IG show the identification, via AF4 and EM imaging analysis, of exomeres and two distinct subpopulations of exosomes released by tumor cells, FIG, 1 A shows a representative AF4 fractionation profile of B 16-F 10-derived exosomes, x- axis, time (min); y- axis (scale) and black dots, hydrodynamic radius (nm); red and blue lines Illustrate the QELS
(DLS) intensity and UV absorbance (shown on a relative scale) respectively- P I-P5 marks the peaks detected based on UV absorbance. Fractions were pooled for exomeres (hydrodynamic diameter <50 n ,); Exo-8 (60-80 nm); and Exo-L (90-120 nm). FIG. 1 B shows a representative correlation function at peak 3 (P3), t - 25.1 min. For 1 A and 1 B the experiment was repeated independently 50 times with similar results, FIG, 1 C shows TEM imaging analysis of exosome Input mixture (pre-fractionation) and fractionated exomeres, Exo-S and Exo-L subpopulations. Arrows point to exomeres (red), Exo-S (blue) and Exo-L (green). Scale bar, 200 nm. This experiment was repeated 7 times Independently with similar results. FIG. i D shows Western blotting analysis of exosomal marker proteins in fractionated samples. ! 00 pg of whole cell extract (WCE) and ID pg of exosome and exomere mixture input and each subset were analyzed. This experiment was done once. FIG. I E shows measurement of hydrodynamic diameters of exomeres, Exo-S and Exo-L derived from representative cei 1 1 ines (/.<?. B 16~F 10 (FI 0), AsPC- 1 , Pan02, MDA-MB-4175 (4175) and 4TI ) In the batch mode using Zetasizer after pooling fractions collected for each subset of nanopartieles from an individual AF4 fractionation, Data are presented as ean SEM (standard error of the mean), in the order of exomere, Exo-S and Exo-L: BI 6-F10 { -lO, 9, and 8 independent measurements, respectively); Fan02 (p?~l f , 6, I I); AsPC- 1 (n 5, 5, 5); 4175 (> :3, 5, 3); 4ΊP (??~ 5, 5, 5)). FIG. I F shows TEM imaging analysis of fractions collected from explant culture of fresh human melanoma tissue, Scale bar, 200 nm. This experiment was performed with two independent specimens with similar results, FIG. IG shows a batch mode measurement of hydrodynamic diameters of fractions shown in FIG, 1 F, Data are presented as meaniSEM (exomeres and Exo-L, ?r~6: Exo-S, 7 independent measurements). Unprocessed blots are provided in FIG. 14.
|0t)I7j FIGs, 2A-2K shows characterization of AF4 fractions using TEM Imaging and
NT A analyses and examination of AF4 profiles of rsanopartides derived from cells under di ferent culture and storage conditions, FIG. 2 A shows TEM analysis of particles in AP4 peaks PI and P5 of B16-F10, The experiment was repeated independently 3 times with similar result. Scale bar, 500 nm. FIG, 2B shows a comparison of the hydrodynam c diameter of each fraction determined by AF4-QELS versus NTA, Individual fractions (time slice, 0,5 min/fraction) were taken every 2 minutes from 20 to 44 minutes during the AF4 time course, and subjected to NT A. Results shown are mean ± SEM (nO independent samples). Mode size from TA was utilized. X-axis, time course of AF4 (min); Y-axis, hydrodynamic diameter (nm), FIG, 2C shows the size distribution profiles of representative fractions by NTA (input, unfractionated samples; fractions at 20, 32, and 44 minutes). Multiple peaks were detected for fractions at 20 and 44 minutes by NTA. A mode size of 126 nm of input indicates that NTA cannot efficiently resolve
polydisperse samples and is biased towards large particles. This experiment was repeated 3
limes independently with similar results, FIG. 2D shows the particle concentration of each fraction measured by NT A. The hydrodynamic diameter of the peak fraction (28 minutes) was 77nm, Results shown are mean ± SEM (n 3 independent samples), FIGs, 2E-2I show AF4 profiles of BI6-FI0 sEVs collected from technical (blue lines, replicate # 1 ; red lines, replicate
#2) (FIG, 2E) and biological replicates (red lines, QELS; blue lines, UV; black (replicate if ) and green dots (replicate 2), hydrodynamic radius; Differences in UV and QELS signal Intensity is due to the different amount of input samples for two replicates) (FIG, 2F), kept at either 4 "C or - 80 aC for one week (red lines, QELS; blue lines, UV; black (fresh) and green dots (frozen), hydrodynamic radius) (FIG. 2G), cells of different passage numbers (blue and red lines, UV of cells at passage 10 and 18, respectively; black dots, hydrodynamic radius) (FIG, 2H), and under hypoxic versus norm ox ic conditions for 48 h (blue and red lines, UV for samples cultured with 20% and 1 % f¾5 respectively; black dots, hydrodynamic radius) (FIG. 21). Experiments were repeated independently 3 times for FIGs. 2E-2G and twice fo FIG, 2H with similar results. For FIG, 21, the experiment was repeated with 3 different cell lines independently with similar results. FIGs, 2i and 2k show AF4 (FIG, 2J) and TEM (FIG. 2K) analysis of nanoparticles isolated in parallel from the blank media control and CM of 3-day cultures of BI6-F 10 and yiDA MB 23 U4i ?5. This experiment was done once. (Red and Blue lines, UV; black dots, hydrodynamic radius; Scale bar, 200 nm.)
[0018f FIGs, 3A-3B show identification of exomeres and exoso e subpopulations released by multiple cancer cell lines. Shown are AF4 profiles (FIG, 3A) and representative TEM images (FIG, 3B) of m fractionated input samples and pooled fractions of exomeres, Exo S and Exo~L that derived from various cancer cell lines, including AsPG-L Pan02, MDA-MB- 231 -41 75, and 4TI . Multiple independent experiments were conducted with similar results for (FIG. 3 A) (repeated times: AsPC-1 , 9x; Pan02, I 6x; 4175, 17x; 4TL I Ox) and (FIG, 3B) (AsPC· 1, 3x; PanG2, 2x; 4175, lx; 4T1 , 4x), Scale bar, 200 nm, x- axis, time (minutes); y-axis (scale) and black dots, hydrodynamic radius (nm); Red and blue lines illustrate the QELS (DLS) intensity and UV absorbance (shown on a relative scale), respectively.
|G©t9) FIGs, 4A-4B show defection of exomeres, Exo-S and Exo-L In samples isolated from the tissue explant cultures. FIG. 4A is an AF4 profile of exosomes Isolated from explant culture of fresh human melanoma tissues. Red and blue lines illustrate the QELS (DLS) intensity and UV absorbance, respectively. This experiment was repeated with 4 Independent specimens with similar results. FIG. 4B shows TEM images of exosome samples isolated from the explant culture of normal mouse mammary fat pad and lung tissues, This experiment was repeated independently 2 times with similar results, Seale bar, 500 n .
|0020] FI (Is. 5A-5D show characterization of physical and mechanical properties of exomeres and exosome subpopulations. Zeia potential (FIG. 5 A) and stiffness (FIG. SB) of exomeres and exosome subpopulations derived from various cancer cells were measured using Zetasizer and AFM indentation, respectively. Young's modulus was used to express particle stiffness. At least 3 and 5 replicates for each group of particles was measured for zeta potential and stiffness, respectively. Data are presented as meaniSEM, For FIG. 5 A, in the order of exomere, Exo-S and Exo-L: B I 6-FI 0 (mi:8, 10, and 12 independent measurements, respectively); Pan02 (n 13, 1 1, 13); AsPC- 1 (mG2, 12, 12): 4175 ί«M 7, 9, 6); 4TΊ {n 13, 3, 9); for FIG, SB, BI 6 F! 0 («~6, 6, 6 particles measured); Pan02 (ffs:6, 6, 6): AsPC-l («“21 , 19, 16); 4175 (o;ί;:I I , 10, 5); 4TS («“9, 8, 9)). FIG. SC shows a representative AFM image of exomeres derived from B I 6F I 0. This experiment was repeated with samples derived from 3 different cell lines with similar results, FIG. 5D shows AFM imaging analysis of the height (z~dimension) of exomeres derived from B I 6F I 0 («—754 particles analyzed), AsPC l (« 475) and MDA-MB-4175 («“160). Mean±SEM Is depicted.
[00211 FIGs. 6A-6G show proteomic profiling of exomeres and exosome subpopulations derived from various cancer cells. FIG. 6A shows a Venn diagram of proteins identified in each subset of particles. FIG, 6B shows principal component analysis and FIG. 6C shows consensus clustering analysis of normalized proteomic mass spectrometry datasets from human (MDA-MB- 4175 and AsPC 1 ) and mouse ( B 16F 10, 4T I , and Pan02) cell lines. FIG. 6D shows a heat map illustration of unique proteins specifically associated with exomeres, Exo-S and Exo-L, Scale shown is intensity (area) subtracted by mean and divided by row standard deviation (i.e. D fatea- mean)/SD). FIG. 6E shows Western blot analysis of representative signature proteins in
fractionated samples. An equal amount ( 10 pg) of exosome and exomere input mixture and each subset were analyzed. This experiment was done once, FIG, 6F shows a heat map illustration of the relative abundance of conventional exosome markers in exomeres. Exo-S and Exo-L Seale shown is Intensity (area) subtracted by mean and divided by row standard deviation (i.e, A (area- mean)/SD). FIG. 6G shows identification of top candidate gene sets enriched in exomere, Exo-S and Exo-L populations by gene set enrichment analysis (GSEA). Proteins in each subset of nanopartlcles are ranked by GSEA based on their differential expression level, Whether a prespecified pathway is significantly overrepresented toward the top or bottom of the ranked gene list in each subset of nanoparticle is evaluated using the normalized enrichment score (the green Erse), Black vertical lines mark the positions where the members of a particular pathway appear in the ranked list of genes. Proteins that contributed most to the enrichment score are listed below the plot For all proteomic analysis (FIGs. 6B-6D, FIGs. 6F-6G), a total of 30 samples (3
nanoparticle subtypes derived from 5 different cell fines; and two independent biological replicates for each narsoparticle sample) were subjected to statistical analysis. Unprocessed blots are provided in FIG. 14.
|§Q22! FIGs. 7A-7E show preteomic profiling of exomeres and exosome subpopulations derived from multiple cancer cell lines. FIG. 7 A shows principal component analysis of normalized proteomic mass spectrometry data of exomeres, Exo-S and Exo-L derived from multiple cell lines, including DA-lVfB~23 i -41?5, AsPC~I , 4T1 , B16F-I0 and Pan02, Two independent biological replicates were analyzed for each nanoparticle sample. FIG. 7B is a heat map illustration of the relative abundance of the Rab family proteins in exomeres, Exo-S and Exo-t. Scale shown is intensity (area) subtracted by mean and divided by row standard deviation (Le., D (area-mean ) SD). FIG. ?C shows evaluation of the presence oi'Hpoprote - partic!e associated proteins (listed in Table 2) among the total proteins detected in the exomere, Exo-S and Exo-L derived from different cell lines. Results shown arc mean of 2 biologically independent experiments. FIG. 7D shows TE imaging analysis of MDL, LDL and VLDL. Scale bar, 200 n . This experiment was done once with multiple images showing similar results. FIG. 7E shows identification of specific association of signaling pathways including hypoxia (FDR, q value - 0,004), microtubule (FDR, q value ~ 0.002) and coagulation (FDR, q value - 0.013) with exomeres by GSEA (left panel) and the heat map illustration of the expression level of related proteins In different subsets of nanoparticles (right panel). A total of m-30 samples (3 nanoparticle subtypes derived front 5 different cell lines; and two independent biological replicates for each nanoparticle samples) were subjected for Kol ogorov-Smirnov statistical analysis.
[0023f FIGs. 8A-SC show characterization of L-glycosylation of proteins associated with exomere, Exo-S and Exo-L. FIG. 8A shows lectin blotting analysis of A;-glycan profile of proteins associated with exomeres versus exosome subpopulations Exo-S and Exo-L. Phaseolm vulgaris erythroagglutinin (E-PHA) and Phaseohis vulgari leucoaggiutinin (L-PHA) recognize bisected and branched A;-glycans, respectively. Akuvia aunmtia lectin (AAL) recognizes FucabGIc Ac and Fuec GlcNAc. Sambuc nigra lectin (SNA) recognizes a-2, 6-1 inked sialic acid. All experiments were repeated independently twice with similar results except for AAL and E-PHA blotting for B 16-FI D and 4175 which were done once. FIG. SB shows mass spectrometric analysis of A'-giyeans of glycoproteins present in exomeres, Exo-S and Exo-L subsets of B I 6F 10, One representative experiment of two biologically independent replicates is shown. FIG. 8C shows a comparison of the relative abundance of the top six most abundant A- glycan structures among exomere, Exo-S and Exo-L of BI 6F 10. The assignments ( /z) [charge; neutral exchange] for MALD!-MS and nanoLC-ESI-MS/MS are the following: (2015,8 [-H; 0];

1201 ,9* [-2H; 2K.-2H]), Data shown were quantified and normalized to the most abundant structure in the sample. Results are represented as average of three independent analytical measurements of one representative experiment. Unprocessed blots are provided in FIG. 14. Note; aThe product ion spectra for this species did not allow a complete structural assignment. Assignments admit neutral exchanges of protons with cations in sialoglycans, including the presence of potassium and sodium,
[0024] FIGs. 9A-9J show mass spectrometric analysis of/V'-glycans enriched in exomeres, Exo-S and Exo~L derived from AsPC- 1 and DA-M B-231-4175. FIG. 9A shows the total protein profile content of the isolated exomere, Exo-S and Exo-L subpopulations derived from AsPC-!, MDA~MB-23 I 4S 75 and B16-F SO assessed by silver staining. This experiment was repeated independently twice for B 16-F10 and 4175 with similar results and done once for AsPC-l , FIG, 9B shows the A-glycan mass spectra of particles derived from AsPC- 1 (left panel) and MDA-M B 231 -4 i 75 (right panel), respectively. This experiment was done once with 3 analytic replicates with similar results. FIG, 9C and FIG, 9D shows quantification of the top six most abundant A-glycan structures identified in the study of AsPC- 1 and MDA-MB-23 I-4 I 75 derived particles. Data shown were quantified and normalized to the most abundant structure in the sample. Results are represented as mean of 2 and 3 independent analytical measurements for AsPC- 1 for MDA- MB-231-4175. respectively, NanoHPLC-PGC-HRMS extracted ion chromatograms (EIC) and C ID-MS/MS spectra for FIGs. 9E-9G the ion at m/z 1007.38(2-)* corresponding to a core-fucosylated complex type Ar~glycan, characteristic of exomere, and FIGs. 9H-9J the ion at m/z 1 1 1 1.39(2-), corresponding to a disialylated complex-type A-glycan found in all fractions of B I6F10, Fragmentation analysis for extracted son chromatogram miz 1007.38 (2-) confirming the structure of this A-glycan in exomeres (FIG. 9E and FIG, 9G) and demonstrating the absence of this A-g!yean in Exo-S (FIG, 9F), According to the relative retention time on the PGC column, exomeres contain both a.2,3-linked and a2,6-!inked sialoglycofor s of the ions at m/z I I I ! ,39(2-) (FIG, 9H). The iV-glycan m/z I I I ! ,39(2-) from Exo-S showed A-giycans displaying exclusively a2,3-!ioked sialic acids based on PGC-LC relative retention time (FIG, 91), This experiment (FIGs, 9E-9J) was done once.
[0025] FIGs, 10A- 10C show' characterization of lipid composition in exomeres and exoso e subsets. FIG, 10A shows a comparison of total lipid content of each subset of nanopartides derived from different cell lines. Total signal intensity of each sample after normalization to sample weight and internal standards was compared to that f exomeres from the same set of samples (expressed as fold change). Data are presented as mean±SEM ( :;3
biologically independent samples). FIG, 10B shows the relative abundance of each lipid class present in each subset of nanopartides from different cell lines. Data are presented as rrsearrfcSEfVl (it-3 biologically independent samples). FIG. 10C shows a heat map illustration of lipid classes specifically associated with exomeres, Exo-S and Exo~L (ANOVA test, q G.05), Statistical analysis was performed on a total of 9 samples tor each cel! line (3 different nanoparticle subtypes and 3 independent biological repeats for each nanopartide sample).
Abbreviation: Car, ceram ide; CerGl -3, glucosylceraniides; CL, cardiolipin; DG, diglyceride; LPC lysophosphaiidylchoMne; LPE, lysopbosphatidyleihanolam e; LPG,
!ysophosphatidylglycerol; LP1, lysophosphatidylinositol; MG, monoglyceride; PC,
phosphatidylcholine; PE, phosphatidylethanolamine; PG, phosphatidylglycerol; PI,
phosphatidyl inositol; PS, phosphatidylserine; SM, sphingomyelin; TG, triglyceride,
f 0026f FIGs, 1 1 AG I D show characterization of nucleic add association with exomere and exosome subsets. FIG, ! 1 A shows the relative abundance of DMA associated with each sub population of particles from representative fractionations of B 16F 10, AsPC I and DA- B- 4175. FIG. I I B shows Agilent Bioanalyzer analysis of the size distribution of DNA associated with different subsets of particles. Data shown are the electropherograms (left) and
electrophoresis Images (right) from a representative of two independent experiments on AsPC I - derived particles. Black arrows, Internal standards (35bp and !038Obp). Red line, exomeres; blue line, Exo-S; green line, Exo-L. FIG. 1 1C shows the relative abundance of total RNA associated with each subpopulation of particles From representative fractionations of B16F10 and AsPC 1. FIG. 1 1 D shows the size distribution of RNA isolated from different fractions of B 16F \ 0. Shown are representative profiles from one of two independent experiments. For FIG.
1 i A and FIG, 1 IC„ date shown are mean (ίr·2 biologically independent samples),
|0027j FIG. 12 shows bioanalyzer analysis of the size distribution of DNA associated with exomere, Exo-S and Exo-L derived from B 16-FIG (top) and MDA-MB-231 -4175 (bottom). This experiment was repeated twice independently with similar results,
f 0028 j FIGs. 13AG3B show organ biodistribution of B 16F 10-derived exomeres and exosome subpopulations In syngeneic naive mice. FIG. I3A shows whole organ imaging of NIR dye-labeled exomeres, Exo-S and Exo-L from a representative experiment using the Odyssey imaging system (LI-CGR Biosciences;
 independent experiments). The dynamic range of signal intensity was adjusted for each organ so that the differences among these nanopartide subsets can be easily recognized. Scale bar, 2.5 mm, FIG. 13B shows quantification of the nanopartide uptake in different organs in one representative experiment. This experiment was repeated independently 4 times with similar results. Signal intensity In each organ was acquired using the Image Studio (LI-CGR Biosciences), and normalized to the brain from the same animal
due to undetectable uptake of nanoparticles in this organ. Fold changes (y axis) were then calculated for each organ between the experimental group U. . input, exomere, Exo-S and Bxo- L) versus the mock control, w: 3 animals per group, results shown are mean ± SEM. Statistical significance determined using one way A OVA (* p<0.G5; ** pO.O L unmarked, not significant). For lymph nodes, the p value for comparison between Input versus Exo-L, exomere versus 6xo~L and Exo-S versus Exo-L are 0.022, 0,001 and 0,01 respectively,
independent experiments). The dynamic range of signal intensity was adjusted for each organ so that the differences among these nanopartide subsets can be easily recognized. Scale bar, 2.5 mm, FIG. 13B shows quantification of the nanopartide uptake in different organs in one representative experiment. This experiment was repeated independently 4 times with similar results. Signal intensity In each organ was acquired using the Image Studio (LI-CGR Biosciences), and normalized to the brain from the same animal
due to undetectable uptake of nanoparticles in this organ. Fold changes (y axis) were then calculated for each organ between the experimental group U. . input, exomere, Exo-S and Bxo- L) versus the mock control, w: 3 animals per group, results shown are mean ± SEM. Statistical significance determined using one way A OVA (* p<0.G5; ** pO.O L unmarked, not significant). For lymph nodes, the p value for comparison between Input versus Exo-L, exomere versus 6xo~L and Exo-S versus Exo-L are 0.022, 0,001 and 0,01 respectively,
029I FIG. 14 shows unprocessed blots for related figures in FIG, I , FIG. 6 and FIG, 8.
|M30| FIGs. 15A-15C show a schematic illustration of the AF4 working principle,
FIGs, 15A-I 5C show the side views of the AF4 channel, whose height is usually several hundreds of pm. The part size shown in the figure is for illustration only and not drawn to scale. FIG. I 5L shows that in the Focus stage, two flows in opposing directions are pumped into the channel from the inlet and outlet posts and balanced near the injection port. Samples are Injected during the Focus stage and focused in a thin band. Particles reach level heights related to their diffusion coefficients. FIG, 15B shows that in the Elution stage of the normal mode, particles with small hydrodynamic size and high diffusion coefficient are eluted at an early time point, whereas particles with large hydrodynamic size and low diffusion coefficient elute late, FIG,
15€ shows that when the physical size of a particle Is too large to be considered as a point mass compared to the channel height, it elutes In the Steric mode. In contrast to the Normal model as shown in FIG, I 5B, large particles elute earlier than the smaller ones,
|0O31] FIGs. 16A-16C show the influence of cross-flow on AF4 fractionation, FIG. 16A shows a representative AF4 fractionation profile of B 16-F10 sEVs collected by applying a linear cross-flow gradient with an initial flow rate at 0.5 mL/min within 45 minutes (Peaks are marked as PG-P5; UV (red line), QELS (blue line), ¾ (black dots», or (FIG, 16B) with an Initial flow rate at 0.3 mL/min (blue line), 0,5 mL/min (red line) or 1 ,0 mL/min (black line) and dropping to 0 mL/min over 45 minutes, or (FIG, I 6C) with an initial flow rate at 0,5 mL/min and dropping to 0 mL/min over 15 minutes (blue), 30 minutes (black) or 45 minutes (red). Top, QELS at 100°; bottom, UV absorbance at 280nm. The other AF4 parameters arc: channel flow rate, 1 ,0 mL/min; channel height, 490 p ; sample focus time, 2 minutes; membrane, regenerated cellulose (RC), Input amount, 40 m§,
10032] FIG, 17 shows the effect of the channel height upon AF4 fractionation. Shown are AF4 fractionation profiles of B 16-F 10 sEVs collected using a channel with a spacer of 350 mhi (blue) and 490 pm (red), Top, QELS at 100°; bottom, UV absorbance at 280nm. The other AF4 parameters are: channel flow rate, 1 ,0 mL/min; a linear gradient of cross-flow decreasing
from 0,5 mL/min to 0 mL/min over 45 minutes; sample focus time, 2 minutes; membrane, regenerated cell is lose (RC), input amount, 40 pg,
f6033] FIG, 18 shows the effect of the focus time upon AF4 fractionation. Shown are
AF4 fractionation profiles of B16-F10 sEVs collected using a sample focus time of 2 minutes (red), 5 minutes (bine) or 10 minutes (black). Top, QELS at 100°; bottom, UV absorbance at 280nm. The other AF4 parameters are; channel flow rate, 1 ,0 mL/min; a linear gradient of cross flow decreasing from 0.5 mL/min to 0 mL/min over 45 minutes; channel height, 490 p ;
membrane, regenerated cellulose (RC), Input amount, 40 pg,
|0O34f FIG, ! 9 shows examination of the sample (B16-F 10 sEVs) loading capacity for
AF4 analysis. Shown are AF4 fractionation profiles of B16-F10 sEVs with an input of 15pg (black), 40 pg (red); 100 pg (blue), or 150 pg (green). Top, QELS at 100°; bottom, UV absorbance at 2S0nm. The other AF4 parameters are; channel flow rate, 1.0 mL/min; a linear gradient of cross-flow decreasing from 0.5 mL/ in to 0 mL/min over 45 minutes; channel height, 490 pm; sample focus time, 2 minutes; membrane, regenerated cellulose (RC).
ffKBSf FIG. 20 shows a comparison of the AF4 performance for separating EVs using different membranes: regenerated cellulose (RC, red) versus poly(ether)sulfone (FES, blue), B I6-F I0 sEVs were analyzed using the following AF4 parameters: channel flow rate, 1.0 mL/min; a linear gradient of cross-flow decreasing from 0,5 mL/min to 0 mL/min over 45 minutes; channel height, 490 p ; sample focus time, 2 minutes; input amount, 40 pg. Top,
QELS at 100°; bottom, UV absorbance at 2B0nm.
100361 FIGs, 21 A-21 B show a schematic illustration of the overall procedure and the flow route of AF4. FIG. 21 A shows the overview of experimental design for cell culture-derived sEV isolation and AF4 fractionation, FIG. 21 B is an illustration of the AF4 flow route and arrangement of online detectors.
pt)37) FIGs. 22A-22C shows representative AF4 fractionation analysis of B 16-F 10 sEVs, Shown are representative AF4 fractionation profile of B 16-F 10 sEVs (FIG, 22A) and autocorrelation functions at specific time points (FIG. 22B), FIG. 22C shows TEM imaging analysis of combined fractions for peaks P2 (exomere), P3 (Exo-S), and P4 (Exo-L), Seale bar, 200 nm. Colored arrows point to representative particles In each subpopulation.
(0038) FIGs. 23A-23B show gene expression analysis of the livers from mice 24 hours post injection of B! 6-F! 0 derived exomeres, Exo-S and F.xo-L, in comparison with PBS control. !Opg of exomeres, Exo-S. and Exo-L, and equal volume of PBS were intravenously Injected into C57BI/6 mice, respectively. The livers of the mice were collected for RNA extraction and sequencing analysis 24 hours post injection, The total numbers of genes that are differently
expressed in each comparison group are listed in FIG, 23A, and Clustering analysis of top 2000 genes that are significantly changed In comparison with the PBS control are shown In FIG, 23B.
3 per group.
|0039| FIGs. 24A-24B show a heatmap illustration of the top 50 upregulated genes (FIG.
24A) and top 50 downregulated genes (FIG. 24B) in the fivers of mice treated with exomere, Exo-S or Exo-L, compared with the PBS control group, m3 per group.
[0040] FIGs, 25A-25E show Ingenuity Pathway Analysis (IPA) of differently expressed genes in the livers of mice 24 hours post injection of B 16-F IG derived exomeres, Exo-S and Exo-L, in comparison with PBS control Shown are representative top pathways that are significantly affected between Exomere and PBS (FIG. 25A), Exo-S and PBS (FIG, 25B), Exo-L and PBS (FIG, 2SG), Exomere and Exo-S (FIG, 25D). and Exomere and Exo-L (FIG, 25 E).
[0041] FIGs. 2SA-26C show metabolic mass spectrometry' analysis of the livers from mice treated with B16-F IQ-derived exomeres, Exo-S and Exo-L, compared with PBS control Metabolites whose abundance were significantly changed are identified using unpaired t test (FIG. 26A) and one-way ANGVA analysis (FIGs, 26B-26C) (metabolites differently detected in each group via one-way ANOVA are shown as specific individual data points in (FIG, 26B), or as clusters highlighted in boxes in (FIG, 26C)}, rt~3 mice per group,
[0042| FIGs, 27A-27B shows that metabolites that are upregulated or downregubted in all three groups of exomeres, Exo-S and Exo-L-trea ted mouse livers in comparison with the PBS control were identified via one-way ANOVA analysis, and the changes in their abundance are displayed in FIG, 27A and FIG, 27 B, respectively, n 3 mice per group,
[0043] FIGs, 28A-28C show a demonstration of representative metabolites that are specifically upregulated in exomeres (FIG. 28A), Exo-S (FIG, 2SB), and Exo-L (FIG, 28C) respectively, compared with the PBS control group, n~:3 mice per group.
[0044] FIG. 29 shows an immunofluorescence colocalization study that revealed that kupffer cells, the liver resident macrophages, are the primary cell type that uptakes B 16-F IG melanoma-derived exomeres. Exomeres that are labeled with green fluorescent lipophilic PKH67 dye or the mock labeling reaction mixture were injected intravenously into naive, syngeneic C57BL/6 mice and 24 hours post injection, the livers were harvest and fixed for immunofluorescence colocalization analysis, n-3 mice per group, F4/80 was stained (in red) to Identify the macrophages in the liver.

\m45\ A first aspect of the present invention is directed to a method of diagnosing cancer in a subject This method involves selecting a subject having cancer and obtaining, from the
selected subject, a population of either exomeres having a diameter of less than 50 nni, small exosomes having a diameter of 60-80 nm, or large exosomes having a diameter of 90-120 nm, The exomeres, small exosomes, or large exosomes are recovered from the sample, and the exomeres, small exosomes, or large exosomes or portions thereof are contacted with one or more reagents suitable to detect: (1) higher or lower levels, relative to a standard for subjects not having cancer, or the presence or absence, of one or more proteins contained m said exomeres, small exosomes, or large exosomes, (2) higher or lower levels, relative to a standard for subjects not having cancer, or the presence or absence, of one or more N-g] eans contained in said exomeres, small exosomes, or large exosomes, (3) higher or lower levels, relative to a standard for subjects not having cancer, or the presence or absence, of one or more lipids contained in said exomeres, small exosomes, or large exosomes, (4) the presence or absence of one or more genetic mutations in nucleic acid molecules associated with cancer and contained In said exomeres, small exosomes, or large exosomes, or (5) combinations thereof. Cancer Is then diagnosed based on the contacting step.
10046) Another aspect of the present invention is directed to a method of prognosing cancer in a subject. This method involves selecting a subject having cancer and obtaining, from the selected subject a population of either exomeres having a diameter of iess than 50 nm, small exosomes having a diameter of 60-80 nm, or large exosomes having a diameter of 90- 120 n . The exomeres, small exosomes, or large exosomes are recovered from the sample, and the exomeres, small exosomes, or large exosomes or portions thereof are contacted with one or more reagents suitable to detect: { I } higher or lower levels, relative to a standard or to the level In a prior sample obtained from the subject, or the presence or absence, of one or more proteins contained In said exomeres, small exosomes, or large exosomes, (2) higher or lower levels, relative to a standard or to the level In a prior sample obtained from the subject, or the presence or absence, of one or more N-gl yeans contained m said exomeres, small exosomes, or large exosomes, (3) higher or lower levels, relative to a standard or to the level In a prior sample obtained from the subject, or the presence or absence, of one or more lipids contained in said exomeres, small exosomes, or large exosomes, (4) the presence or absence of one or more genetic mutations in nucleic add molecules associated with cancer and contained in said exomeres, small exosomes, or large exosomes, or (5) combinations thereof. Cancer is then prognosed based on the contacting step.
|0047| Another aspect of the present invention is directed to a method of managing treatment in a subject. This method Involves selecting a subject undergoing treatment for cancer and obtaining, from the selected subject, a population of either exomeres having a diameter of less than 50 nm, small exosomes having a diameter of 60 80 nm, or large exosomes having a
diameter of 90 120 nm. The exomeres, small exosomes, or large exosomes are recovered from the sample, and the exomeres, small exosomes, or large exosomes or portions thereof are contacted with one or more reagents suitable to detect: ( I } higher or lower levels, relative to a standard or to the level In a prior sample obtained from the subject, or the presence or absence, of one or more proteins contained In said exomeres, small exosomes, or large exosomes, (2) higher or lower levels, relative to a standard or to the level in a prior sample obtained from the subject, or the presence or absence, of one or more N-g!ycans contained In said exomeres, small exosomes, or large exosomes, (3) higher or lower levels, relative to a standard or to the level in a prior sample obtained from the subject, or the presence or absence, of one or more lipids
contained in said exomeres, small exosomes, or large exosomes, (4) the presence or absence of one or more genetic mutations in nucleic acid molecules associated with cancer and contained in said exomeres, small exosomes, or large exosomes, or (5) combinations thereof. Treatment is then modified based on the contacting step.
[0048 j Cancer prognosis as described herein includes determining the probable progression and course of the cancerous condition, and determining the chances of recovery and survival of a subject with the cancer, .g., a favorable prognosis indicates an increased probability of recovery and/or survival for the cancer patient, while an unfavorable prognosis indicates a decreased probability of recovery and/or survival for the cancer patient, A subject’s prognosis can be determined or modified by the availability of a suitable treatment {/ £?., a treatment that will increase the probability of recovery and survival of the subject with cancer). Accordingly, another aspect of the present invention includes selecting a suitable cancer therapeutic based on the determined prognosis and administering the selected therapeutic to the subject.
[0049] Prognosis also encompasses the metastatic potential of a cancer. For example, a favorable prognosis based on the presence or absence of a protein, N-giycan, lipid, and/or genetic phenotype can indicate that the cancer is a type of cancer having low metastatic potential, and the patient has an increased probability of long term recovery and/or survival. Alternatively, an unfavorable prognosis, based on the presence or absence of a protein, N-glycan, lipid, and/or genetic phenotype can indicate that the cancer is a type of cancer having a high metastatic potential, and the patient has a decreased probability of long term recovery and/or survival
[0050] Prognosis further encompasses prediction of sites of metastasis, determination of the stage of the cancer, or identifying the location of a primary tu or in a subject
[005! [ A change in the levels of certain proteins, N-glycans, lipids, and/or the mutational status of genes associated with cancer {e.g„ BRAF dhr EGFR ) indicates that a cancer is present or a change in the cancer phenotype has occurred with disease progression, For example,
detecting the presence of a genetic mutation in an exomere, small exosomal, or large exosomal dsDNA sample from a subject whereas no genetic mutation was detected in an earlier exomere, small exosomal, or large exosomal dsDNA sample obtained from the same subject, can be indicative of a particular site of metastasis or progression to a more advanced stage of the cancer. Therefore, periodic monitoring of exomere, small exosomal, or large exosomal dsDNA mutational status provides a means for detecting primary tumor progression, metastasis, and facilitating optimal targeted or personalized treatment of the cancerous condition,
[0052] The detection of certain proteins, N-glycans, lipids, and/or exomere, small exosomal, or large exosomal dsDNA mutations in a metastatic cancer sample can also identify the location of a primary tumor, For example, the detection of one or more BRAF mutations a metastatic tumor or cancer cell-derived exomere, small exosomal, or large exosomal sample can indicate that the primary tumor or cancer was melanoma or a form of brain cancer, e.g.
glioblastoma. The detection of one or more EGFR mutations in a metastatic tumor or cancer cell derived exomere. small exosomal, or large exosomal dsDNA sample indicates that the primary tumor originated in the lung, or alternatively the primary cancer was head and neck cancer, ovarian cancer, cervical cancer, bladder cancer, or esophageal cancer.
|(MtS3j As described above, another aspect of the present invention is directed to a method of managing treatment of a subject having cancer, in accordance with this aspect, cancer treatment is modified based on the contacting step,
[0054] In accordance with all aspects of the present invention, a "subject” or "patient" encompasses any animal, but preferably a mammal, e.g., human, non-human primate, a dog, a cat, a horse, a cow, or a rodent. More preferably, the subject or patient is a human. In some embodiments of the present invention, the subject has cancer, for example and without limitation, melanoma, breast cancer, or pancreatic cancer. In some embodiments, the cancer is a primary tumor, while in other embodiments, the cancer is a secondary or metastatic tumor.
[8055] ?,Exosomes" are mierovesides released from a variety of different cells, including cancer cells (i.e.,’’cancer-derived exosomes"). These small vesicles (50-1 QOnm in diameter) derive from large multi vesicular endosomes and are secreted into the extracellular milieu, The precise mechanisms of e osome release/shedding remain unclear; however, this release is an energy-requiring phenomenon, modulated by extracellular signals, They appear to form by invagination and budding from the limiting membrane of late endosomes, resulting in vesicles that contain cytosol and that expose the extracellular domain of membrane-bound cellular proteins on their surface. Using electron microscopy, studies have shown fusion profiles of multivesicular endosomes with the plasma membrane, leading to the secretion of the internal vesicles into the extracellular environment, The rate of exosome release is significantly
increased in most neoplastic cells and occurs continuously. Increased release of exosomes and their accumulation appear to be important in the malignant transformation process,
|00S6] As described herein, two exosome subpopulations (he , Exo-S and Exo-L) have been identified, "Exo-S”, as used herein, refers to a population of small exosomes having a diameter of 60 to 80 nm, an average surface charge of -9.0 mV to - 123 mV, and a particle stiffness of 70 to 420 mPa. Exo-S are also enriched in genes involved in membrane vesicle biogenesis and transport, protein secretion and receptor signaling“Exo~L”, as used herein, refers to a population of large exosomes having a diameter of 90 to 120 nm, an average surface charge of -123 to -16.0 mV, and a particle stiffness of 26 to 73 mPa. Exo-L are also enriched in genes involved in the mitotic spindle, !L-2/StatS signaling, multl-orgstrism organelfeorganization, and
G-pro ein signaling.
[0057] In addition to Exo-S and Exo-L subpopulations, a novel extracellular mmopariide has also been identified. As used herein, the term“exomere, refers to a nort-membranous nanoparticle having a diameter of less than 50 nm, often approximately 35 nm, an average surface charge of -2.7 mV to -9.7 mV, and a particle stillness of 145 to 81 mPa, Bxomeres are enriched in metabolic enzymes and hypoxia, microtubule and coagulation proteins as well as proteins involved in glycolysis and TOR signaling
[0058] In accordance with the methods of the present Invention, exomeres, small exosomes, and large exosomes can be isolated or obtained from most biological fluids Including, without limitation, blood, serum, plasma, ascites, cyst fluid pleural fluid, peritoneal fluid, cerebrospinal fluid, tears, urine, saliva, sputum, nipple aspirates, lymph fluid, fluid of the respiratory, intestinal, and genitourinary trances, breast milk, intra-organ system fluid, conditioned media from tissue explant culture, or combinations thereof,
[0059] A population of either exomeres. small exosomes or large exosomes can be obtained from a biological sample using methods described herein. For example, exomeres, small exosomes, or large exosomes may be concentrated or isolated from a biologicai sample asymmetric flow field- flow fractionation (AF4) (Fraunhofer et ah, ' he Use of Asymmetrical Flow Field-How Fractionation in Pharmaceutics and BiopharmaeeulicsA European Journal of Pharmaceutics and Biopharmaceutks 58:369-383 (2004); Yohannes et ah, "Asymmetrical Flow Field-Flow Fractionation Technique for Separation and Characterization of Biopolymers and

Exomeres. small exosomes, or large exosomes isolated from a bodily fluid (/.<?., peripheral blood, cerebrospinal fluid, urine) can be enriched for those originating from a specific cell type, for example, lung, pancreas, stomach, intestine, bladder, kidney, ovary, testis, skin, colorectal breast, prostate, brain, esophagus, liver, placenta, and fetal cells. Because the
exomeres, small exosomes, or large exosomes often carry surface molecules such as antigens from their donor cells, surface molecules may be used to identify, isolate or enrich for exomeres, small exosomes, or large exosomes from a specific donor cell type. In this way, exomeres, small exosomes, or large exosomes originating from distinct cell populations can be analyzed for their nucleic acid content, For example, tumor (malignant and nan-malignant) exosomes carry tumor- associated surface antigens and these exosomes can be isolated or enriched via these specific tumor-associated surface antigens. In one example, the tumor-associated surface antigen Is epithelial-ccli-adhesion-rnolecu!e (EpCAM), which is specific to exosomes from carcinomas of lung, colorectal, breast, prostate, head and neck, and hepatic origin, but not of hematological cell origin (Balzar et aL“The Biology of the 17- I A Antigen (Ep-CAM)T J Mol Med 77{ 10); 699- 712 ( 1 99); Wentef ah“Frequent EpCam Protein Expression in Human Carcinomas,” Hum Pathol 35(1 ): 122-8 (2004), which are hereby incorporated by reference in their entirety). In another example, the surface antigen is CD24, which is a glycoprotein specific to urine
mierovesicles (Keller et ah“CD24 is a Marker of Exosomes Secreted into Urine and Amniotlc Fluid,” Kidney Ini 72(9); 1095-102 (2007), which is hereby incorporated by reference in its entirety). In yet another example, the surface antigen is CD70, carcinoembryonic antigen
(CEA), EGFR, EGFRvII! and other variants. Fas ligand, TRAIL, tranferrin receptor, p38.5, p97 and HSP72. Alternatively, tumor specific exosomes may be characterized by the lack of surface markers, such as the lack of CD80 and CDS6 expression.
[0061] The isolation of exomeres, small exosomes, or large exosomes from specific cell types can he accomplished, for example, by using antibodies, apiamers, aptamer analogs, or moleeuiar!y imprinted polymers specific lor a desired surface antigen. In one embodiment, the surface antigen is specific for a cancer type. In another embodiment, the surface antigen Is specific for a ceil type which Is not necessarily cancerous. One example of a method of exosome separation based on cell surface antigen Is provided In U,S. Patent No. 7,198,923, which is hereby incorporated by reference in its entirety. As described in, e.g., U.S. Patent Nos.
5,840,867 to Toole and 5,582,981 to Toole, which are hereby Incorporated by reference in their entirety, apiamers and their analogs specifically bind surface molecules and can he used as a separation tool for retrieving cell type-sped He exosomes. Moleeularly Imprinted polymers also specifically recognize surface molecules as described In, e.g„ U.S, Patent Nos, 6,525,154, 7,332,553 and 7,384,589, which are hereby incorporated by reference in their entirety, and are a tool for retrieving and isolating cell type-sped lie exosomes. These methods can be adapted for use in Isolating exomeres, small exosomes, or large exosomes,
[1)062] In accordance with this aspect and other aspects of the invention, the recovered exomeres, small exosomes, or large exosomes are then contacted with one or more reagents
suitable to detect higher or lower levels, relative to a standard For subjects not having cancer or to a prior sample from a subject having cancer, or the presence or absence of one or more proteins in the exomere, small exosome, or large exosome sample.
f 00631 For purposes of prognosing or managing treatment of cancer, a subject Is selected that has or Is undergoing treatment for cancer,
|0iI64| In one embodiment, exomeres are recovered from the sample and the method is carried out by detecting, higher or lower levels, relative to a standard for subjects not having cancer, or the presence or absence, of one or more of the proteins selected from the group consisting of PPID, GANAB, MAT! A, CPYD, FAT4, GMPPB, ERP44, CALR, GPD1, BZW I , PFKL, OLFML3, HGD, LGALS3BP, GCLC, PEPD, MTHFDL PGB, ACTR3, XPNPEPi, UGP2, SNX2, ALDOC, SEPTI I, HSPA13, AAI1S, SERPINHI, GNDP2, PDE5A, AGE, EXT1, SDH 3, SERPI CI, RRMl.CKB, H GCSI, HPD, PSMC4, NPEPPS, CAT, EXT2, CORO 1C, B4GATL RACK.1, MAPRE1, PGM!, PDIA3, ADK, SHMTI, ACGI, G5N, ESD, PPP2RIA, ALDH III, OLA 1 , ACLY, EEF ! G, FLNB, PSMD 11 , ANGPTL3, FERMT3, PYGL, MDH I , and EIFA2.
10065] In another embodiment, small exoso es are recovered from the sample and the method Is carried out to by detecting, higher or lower levels, relative to a standard for subjects not having cancer, or the presence or absence, of one or more of the proteins selected from the group consisting ofTTYFB, PLOT!, FLOT2, TSPA 14, LAM Cl, CD63, MVBI2A,
ZDHHC20, VAMP3, VPS37B, ARRDC1, and TGFBR2,
[0O66f In a further embodiment, large exosomes are recovered from the sample and the method Is carried out by detecting, higher or lower levels, relative to a standard for subjects not having cancer, or the presence or absence, of one or more of the proteins selected from the group consisting of SQSTM I, STIFF, HINT!, WASF2, RASA3, EPB4IL2, G1PCS, SIGGA1G, MPP6, K.IF23, RACGAP1, ANXA5. CASK, DLG1, TJPI, BAGS, TXN, ABI!, A XAi, CAPG, DB1, SI00A6, CHMP2B, CHMP3» ANXA2, MYOIC, ANXA4, SNXI2, LIN7C, STXBP3, CEP55, ALCAM, VCL, CFhYIPIA, FARPI, ACSL4, BA1AP2, SH3GL1, DSTN, LGALS1, CYFIPi, CTN A 1 , RAB31, ARF6, SIC 1 AS, EPS8, FMNL2, PGAM I , CNP, CHMP4B, ANXA3.
VPS4B, GNGI2, PACS1N3, GLGL VTA I, LYN, VPS37C, CHMP5, F3, DNAJAL RHOC, GNA13, CHMP2A, ATP2BI, RDX, ATP!Bl, CAPZB, EF1D1, DNAJA2, and CTNNDI,
[11067] The methods described herein may be performed to diagnose, prognose, or manage treatment of specific types of cancer. For example, in some embodiments, meiattoma, breast cancer, or pancreatic cancer may be diagnosed or prognosed, in other embodiments, treatment of melanoma, breast cancer, or pancreatic cancer may be modified.
[0068] In one embodiment, the method is performed to diagnose, prognose, or manage treatment of melanoma, For purposes of prognosing or managing treatment of melanoma, a subject is selected that has or is undergoing treatment for melanoma,
[0069] According to this embodiment, exo meres are recovered from the sample and the method is carried out by detecting, higher or lower levels, relative to a standard for subjects not having melanoma or to a prior sample from the subject, or the presence or absence, of one or more of the proteins selected from the group consisting of GPH2, ITIH3, H2AFX, PM EL,
MAT! A, HPD, ALB, B4GATI , ARFL GCLC, HGD, PPP2CB, PAH, AGL, RNPEP, PP!D, BZW1, ME] , DP YD, CA6, OLFML3, NPEPPS, PREP, ERP44, RELN, GPD1 , GFPT1 , CNDP2, PERL, ALDH8A 1 , ATP6V I A, EN02, TM BS3, CORO 1 C. EXT i , CAT, XPNPEP I , P YGL, CALR, and LGALS3BP,
[0070] In another embodiment, small exosomes are recovered from the sample and the method Is carried by detecting, higher or lower levels, relative to a standard for subjects not having melanoma or to a prior sample from the subject, or the presence or absence, of one or more of the proteins selected from the group consisting of TYR I, SDCBP, SDCBP, CD63, IGSF8, HSPA8, MLANA, HBA1/HBA2, GPNMB, DCT, HSPA2, HSPAI L, HSPA5, Fv4, PDCD6IP, RAB7A, ENVI , CD8I, GNB I , SYT4, GNB2, HIST! H2AH, GNAI2, G PDH, APOE, BC035947, Histlh2al, ACTG1, ACTB, GNB4, GNAI3, SLC3A2, ACTC L GNAS, SLC38A2, HIST2H2BF, ATP 3 A t , TFRC, TMEM I 76B, VAMPS, TSPAN I0, ADGRG I , Hist! h4a , PM EL, UBL3, PPIA, ACTBL2, CD9, BACE2, and TSPAN4.
[00711 In a further embodiment, large exosomes are recovered from the sample and the method is carried out by detecting, higher or lower levels, relative to a standard for subjects not having melanoma, or the presence or absence, of one or more of the proteins selected from the group consisting of HSPA8, TYRP ) , SDCBP, HSPA2, RPS27A, HSPAI L, MLANA, HSPA5, CD63, IGSF8, GPNMB, Fv4, ENVi, PDCD6IP, HSPA! A/HSPA I B, DCT, ACTG t , ACTB, PPIA, SLC3A2, ACTOR CDS 1 , 1TM2C, RAB7A, GNBI, TSPAN4, D AJA I , GNB2, TFRC, HBA3 /HBA2, GNAI2, SYT4, GAPDH, APOE, PM EL, MFGES, GNB4, GNAI3, GNAO l , DNAJA2, ATPI A3 , ITGB! , TMEM59, SLC38A2, GNA I 2, 1TM2B, GNAS, Id 1ST I H2 AH, LAMP I , and EEP! Al .
|0072] In another embodiment, the method is performed to diagnose, prognose, or manage treatment of breast cancer. For purposes of prognosing or managing treatment of breast cancer, a subject is selected that has or is undergoing treatment for breast cancer,
[01)73] According to this embodiment, exo meres are recovered from the sample and the method is carded out to by detecting, higher or lower levels, relative to a standard for subjects not having breast cancer or to a prior sample from the subject, or the presence or absence, of one
or more of the proteins selected from the group consisting of FOB, H1ST2H2AB, COMP, H1ST1H2BJ, C7, GSTA5, ENQ3, ARF3, SULTIC4, E1F4A2, MAT! A, GWB2, UGDH, AKRIB10, MTHFDI, CISC, DPP3, RFSA, OTUBI, ALDH8A1, FU, CTPS2, MOATS,
HYHI, LGALSL, GSTM3, GSTM5, PSMCI, F8, PRKAR2B, RPLI0A, HNRNPK, SEMA6D, SNX5, SARS, LCF2, ARPC4, PPP6C, PSMD6, PTPRS, TIE!, PSMD8, PABPC4, RPS 18, CHAD, IPOS, FABP3, GALNT2, QPCT, STATS A, SEMA3A, NT5C2, IDE, STAT3, DPYSL3, PDXK. ARP’5, FSMD5, ONE, NBEAL2, FHL1, TIMP3, POSTN, MAPRE2, ITIH3* C3, EN02. PPID, OIT3, CANOE SEPT2, UBE2N, DPYSL2, CKB, PTGES3, DSTN, PKLR, THBS3,
RAP IB. HIST2H2AB, ACTBL2, TUBB2A, FiG, CNTN!, HPD, ACE, EML2, HSPAI3,
TNXB, HEXB, CALR, ADH5, GPXR CFL2, KRT76, TCP L COILS, DYNLL!, HGD, ALDOC, EP S, GLOI, MA 2A1. FLT4, NAPi L4, RARS, FIMGGSE GANAB, SEPT7, FKBP4, COL12A1, ADSL, AKRIC20, VASN, DDX39B, MEECOMT, ALDH1AI, EIF4A3, CDH! I, PRPSI13, PNPEP, NPEPPS, SEPTi !, CIV1BL, PSMDI, ACTRIB, PSMD3, GCLC, FAT4, LPL, GPD1L, GCLM, VARS, PHPTS, CAC A2DL SEPT9, GLRX3, AARS, GMPPB, SMX2, GLGD4, PTPRF, CSAD, PXDN, AGE, DPYD. PRK.ACB, LARS, PPID, LTA4H, PSMD7, CAPNSS, ETF1, IARS, VPS35, TKFC, HUOIP, PGM2, TKJ, BMCNR CYB5R3, GPS1, USV1PS, SNDR RTCB, RPL26, CARM!, PLCG2, P4HA2, CORG6, GMPS, IGSF8, PPP1R7, T1MP3, UXS!, DNM2, MEMOS, RPS3, ARHGDI A, PTGES3, NRP2, RAB!A, HBG2, and YWHAQ.
|0074| In another embodiment, small exosomes are recovered from the sample and the method is carried out to by delecting, higher or Sower levels, relative to a standard for subjects not having breast cancer or to a prior sample from the subject, or the presence or absence, of one or more of the proteins selected from the group consisting of SDCBP, HSSTSH2BN,
H1STIH2AH, HBAI/HBA2, ITGBS, Histlh4a , PDCD6IP, HIST3H2BB. H2AFX, CD9, CD63, STGA3, GTIH2, MFGE8, H2AF2, PTGFRN, Hist!h3b, HSPA8, ACTGS, ACTB, ARRDCS, ACTCS, 1TIH3, IGSF8, GSN, TUBA4A, HIST! HID, TUBA I A, HSSTIHIC, THBSi, HSPA2, ENOl, MVB12A, HTRAI, GAPDH, Hisilhle, VPS28, TSGiOI, TUBS, TUBB4A, RAPSB, PFN l . CDS S , VPS378, TUBB6, RAPS A, EPCAM, Hist!hlb, PP!A, ADAM 10, NBA I, HISTIH2BK, A2M, EDIL3, SDCBP, MFGE8, GSN, HIST2H2AC, HSST1 H2AC, H2AFX, ACTB, THBSI, ΪTIH4, TUBE , TUBB2A, IUBB4B, FIG, H2AFZ, TUBB4A, TUBB6,
TUBE 3, HSPA8, CD9, CDS I, GAPDH, PFN1, HSST1 H4A, HSP90AAI, HSP90ABI, HSPA2, HSST2H3A , PGKI, THBS2, EEFIA!,GPX3, ITGB!, PPIA, PDCD6SP, EEF3A2, FBLNS, AT1C, CPNE8, TINS, HSPA5, PKM, MISTI 11 SC, WD I, RAN, PYGL, and ITGA3,
|0075| In a further embodiment, large exosomes are recovered from the sample and the method is carried out to by delecting, higher or lower levels, relative to a standard lor subjects
not having breast cancer, or the presence or absence, of one or more of the proteins selected from the group consisting of PDCD6IP, SDCBP, BHD I, ITGB1, S10GA6, ITGA3,CD9, VPS37C, Hist! h4a , RAP IB, CTNNAL MSN, HISTIH2AH, ITGA2, PTGFRN, ACTG!, B!ST!BIBN, Calm 1 , EPCAM, 1TGA6, YWHAE, HSPA I A/HSPA I B, GNBI , SLC3A2, GNB2, EHD2, H2AFX, PPIA, NTSE, VPS4B, GNB4, Cdc42, SLCIA5, GNAI2, CFLL YWHAH, EEF1A1, YWHAB, His?lh3b, TSGIOI, YWHAG, ANXA5, GNA13, F5, H3F3A/H3F3B, CHMP4B, HSPA5, EZR, GAPDH, CDS I, EDIL3, HBAI/HBA2, UBC, SDCBP, HSPA8, ITGBL€D9, HSPA2, ACTCi, ACTS, ACTGI, PDCD6IP, AFP, HBG2, ANXA2, 1TGA3, HIST! H2BK, GAPDH, CDS I, SLC3A2, GNAI2, GRAB, GNAH, ATPIA!, HIST2M2AC, CPKE8, IST1, PFNI, TUBA4A, H2AFX, TUBA 1C, HSPA5, YWHAZ, ENOL ANXA5, GNAS, DNAJAI, GHMP5, EEFI AT, RHGA, KRT!, GEP5S, GNB i, AGTBL2, FTGA2, EPHA2, GNA13, PPIA, RAP1A, and CD59.
|0076] In another embodiment, the method is performed to diagnose, prognose, or manage treatment of pancreatic cancer. For purposes of prognosing or managing treatment of pancreatic cancer, a subject s selected that has or Is undergoing treatment for pancreatic cancer, [#©77] According to this embodiment, exomeres are recovered from the sample and the method is carried out to by detecting, higher or lower levels, relative to o standard for subjects not having pancreatic cancer, or the presence or absence, of one or more of the proteins selected from the group consisting of SULTI El, PKLR, EN02, AKRIBI, FH, MGAT2, GPXI, DPP3, SEMA4B, GPDI, CSAD, NCAfVft, PCMTi, MARS, THOPI, UMPS, PD ESA, CACNA2DI, TJE CDHS I, AOX!, FH, GLB1, RPLIGA, ACAP2, UXSI, ADSL, B P1, PSMD3, LANCE I, GLOI, PPP2CA, ESD, PSMD5, FARSB, PAFAHIBI, SNX5, XPGI, MAPREI, APRT, NEOl, GBA, THBSI, PYGL, THBS2, FAT4, CNTN1, AKRIC20, E1F4A2, ESD, BPGM VASN, MAT! A, MAΊ2A, PFKL, CLIC5, FIGD, GLOD4, AGE, PLE HB2, CLSTNl, STI3, CMBL AK 1E2, PRKAR2A, GPDI, LGALSL, GLA, ILiRAP, GMPFB, PCSK6, SEPT9, PSMC6, FYN, PAFAHIBI, VPS37C, GT NDi, RBP1, ERP44, SHMTL DARS, ADSL GGLM, ALDOC, EPHA4, PEPD, CKB, PCMTI, UGDH, PRKARIA, and GNAS.
|0078] In another embodiment, small exoso es are recovered from the sample and the method Is carried out to by detecting, higher or lower levels, relative to a standard for subjects not having pancreatic cancer, or the presence or absence, of one or more of the proteins selected from the group consisting of SDCBP, PDCD6IP, HSPA8, IGSF8, CD9, PTGFRN, ACTCI, LY6E, ACTB, iV!FGES, HSPA2, CDS I, ITGA3, ITGBL 1TIH2, VPS28, CD63, HTRAI, ENV1, Fv4, GSN, ENOl, EDIL3, MVBI2A, 1F1TM3, SERP1NC1, ACTBL2, TUBA4A, PPIA, HSPA I A/HSPA IB, HSPA5, GAPDH, TSGI0I, TUBS, PLEKHB2, TUBA 1C, TUBB4B, PFNLGPC!, GJAI, EHDL GNB2, TSPAN4, GNA12, SLC3A2, VPS37B, GNAI3, RAB7A,
EEF1AI, GNAS, ALB, HBA1/HBA2, CD9, UBC, SDCBF, F2t ACTG1 , ACTS, CD59, ACTC !, ACTA2, A2M, HISTI H2BK, HIST1 H2BJ, HSPA8, TSPAN3, HIST2B2AC, CD55, H3F3A/H3F3B, H1ST2H3PS2, PDCD6IP, GGOBI , POTEJ, SER1NC5, H2AFZ, ARRDC L CLDN3, NT5E, EPGAM, CDH I 7, ATP A I, ALPPL2, HIST2H2AB, ALPP, HSPA2, TSPAN8. MVP, ADAM 10, TBBSI , VNN I , ITGAV, IGSFS, MY OF, ATP1 A2, AHCY, GSN, TSPAN i , PP1A, SDCBP2, and HSPA5.
|0079 In a further embodiment large exosomes are recovered from the sample and the method is carried out to by detecting, higher or lower levels, relative to a standard for subjects not having pancreatic cancer, or the presence or absence, of one or more of the proteins selected from the group consisting of ACTC I, AGIO 1, ACTS, MFGE8, ITGB1 , HSPA8, 1TGA3,

GNA13, CFLI, Marcks, GNAS, EEF I Ai, ENO!, BSG, Calm I , S 100A4, MSN, EZR, RDX, PTGFRN, PKM, SLC3A2, HBA3/HBA2, EDIL3, ON A i 3, RHOA, RHOC, S I 00A6, YWHAE, ALDGA, PDCD61P, PF L HSP 0AB1, YWHAQ, ANXA l , ANXA2, ATP I Al, ITGA6, UBC, HBAI/HBA2, COP, AGIO I, AGTB, CD59. MVP, SDCBP, ACTC I , ACTA2, H1ST1 H2BK, HIST2B2AC, ALB, HSPA8, HIST1 H2BJ, CD55, H3F3A, TSPAN3, H1ST2H3PS2, POTEJ, DPP4, NT5E EPCAM, VNN L H2AF2, STGBI, ALPPL2, HIST2H2AB, ATPIA i , ALPP, ISTL PDCD61P, MUC I 3, ANXA 1 1, HSPA2, CDH 17, GPA33, ANXA2, S I 00A6, ATP I A2,
PPIA, EGFR, TSPANS, MYOF, GNAi L GNAI2, GNA13, SIGGA4, CLDN3, and A2M
|0080] The one or more protein levels arc compared to a "‘standard"5 level of the same one or more proteins to identify a subject as one that has cancer or is at risk for metastatic disease. In one embodiment, the standard level of a protein Is the average expression level of the protein in exomere, small exosomal, or large exosomal samples taken From a cohort of healthy individuals { .e„ the average level in non-eaneerous exomere, small exosomal, or large exosomal samples), in another embodiment, the standard level is the average level of the marker in exomere, small exosomal, or large exosomal samples taken from individuals having a primary tumor, e.g., a gastrointestinal tumor that never metastasized to the l ver or other organ of the body in another embodiment, the standard level of a protein is the level of the protein in an exomere, small exosomal, or large exosomal sample taken from the subject being tested, but at an earlier time point (e.g., a pre-caneerous time point),
[G08I] in accordance with all aspects of the present invention, a“higher level’’ refers to an expression level (Le., protein or gene expression level) that is higher than the standard level. For example, a higher expression level is at least 50% higher than the standard expression level. A“lower level” refers to an expression level (U , protein or gene expression level) that is lower
than the standard level. For example, a lower expression level Is at least 50% lower than the standard expression level.
|0Q82| In accordance with this aspect and other aspects of the Invention relating to detecting higher or lower levels or the presence or absence of one or more proteins in the sample, suitable methods for detecting proteins include, but are not limited to, measuring A expression level and measuring protein expression levels. These methods are commonly used in the art. For measuring protein expression levels, this method generally involve contacting the sample with one or more detectable reagents that is suitable for measuring protein expression, e.g,, a labeled antibody or a primary antibody used in conjunction with a secondary antibody, and measuring protein expression level based on the level of detectable reagent in the sample after normalizing to total protein in the sample. Suitable methods for detecting protein expression level in an exosome sample that are commonly employed in the art include, for example and without limitation, western blot, im unoprecipitation, enzyme-linked
immunosorbent assay (ELISA), radioimmunoassay (RIA), or fluorescent activated cell sorting (FACS). The measured protein expression level in the sample is compared to the protein expression level measured In a reference exosomal sample and the type of metastatic disease is identified based on this comparison.
(0083J Measuring gene expression by quantifying mRNA expression can be achieved using any commonly used method known in the art including northern blotting and in situ hybridization (Parker et al, " RNA; Detection by in Situ and Northern Hybridization,” Methods in Molecular Biology’ 106:247-283 ( 1999), which is hereby incorporated by reference in its entirety): RNAse protection assay (Hod et aL "A Simplified Ribonuelease Protection Assay,” Biotcchmques 13:852-854 (1992), which Is hereby incorporated b reference in its entirety); reverse transcription polymerase chain reaction (RT-PCR) (Weis et al.,“Defection of Rare mRNAs via Quantitative RT-PCR,” Trends in Genetics 8:263-264 (1992), which is hereby incorporated by reference in its entirety): and serial analysis of gene expression (SAGE)
(Ve!culescu et aL“Serial Analysis of Gene Expression,’ Science 270:484-487 ( 1995); and Yeiculescu et ah,“Characterization of the Yeast TrarsscriptomeT Cell 88:243-51 ( 1997), which is hereby Incorporated by reference in its entirety),
[0084] In other embodiments, the exomeres, small exosomes, or large exosomes are then contacted with one or more reagents suitable to detect higher or lower levels, relative to a standard for subjects not having cancer or to a prior sample from a subject having cancer, or the presence or absence of one or more N-glycans in the exomere, small exosome, or large exosome sample.
[0085] For purposes of prognosing or managing treatment of cancer, a subject is selected that has or is undergoing treatment for cancer.
[0086] In accordance with this embodiment, exomeres are recovered from the sample and the method is carried out by detecting N-giycans selected from the group consisting ofN-g!ycan (Fucose) + GlcNAcp I -6(GkNAcP ! -2)Mana I -6{GlcNA b 1 -4{G3cHAcp 1 -2)Mantx 1 -3)Manp I - 4Gk AcP l”4{Fuca 1 -6)GlcK Aep 1 ~ Asn and N-g!ycan (Fucose) + Neu5Acii2~8Neu5Aca2- 3Galp I -3/4Gic Acp 1 ~2Mana 1 ~3(Mana 1 ~3(Mana 1 -6))Mana I -ό)M¾hb I -4GScNAcp I - 4GIcNAcpi -Asn.
[0087] In another embodiment, small exosomes are recovered from the sample and the method Is carried out by detecting N-glycans.
10088] in a further embodiment, large exosomes are recovered from the sample and the method is carried out by detecting N-glycans.
|0089j Methods of analyzing glycoproteins are well known in the art, For example, as a first step, the nanoparticles are lysed and total protein is collected, which contains glycoproteins of interest The complex carbohydrate portion of the glycoproteins may be readily analyzed if desired, by conventional techniques of carbohydrate analysis. For example, techniques such as lectin bloting, which is well-known in the art, reveal proportions of ter inal mannose or other sugars such as galactose, Termination of mono-, bi~, tri , or tetra-antennary oligosaccharide by sialic adds can be confirmed by release of sugars from the protein using anhydrous hydrazine or enzymatic methods and fractionation of oligosaccharides by ion-exchange or size exclusion chromatography or other methods well-known in the art. The isoelectric point (pi) of the glycoprotein can also be measured, before and after treatment with neuraminidase to remove sialic acids. An increase in pi following neuraminidase treatment indicates the presence of sialic acids on the glycoprotein,
[0090] The carbohydrates can be analyzed by any method known in the art including those methods described herein. Several methods are known in the art for glycosylation analysis and are useful in the context of the present invention. Such methods provide information regarding the identity and the composition of the oligosaccharide. Methods for carbohydrate analysis useful in the present invention include but are not limited to lectin chromatography; HPAEC-PAD, which uses high pH anion exchange chromatography to separate oligosaccharides based on charge; NMR; Mass spectrometry; MFLC; GPC; monosaccharide compositional analysis; sequential enzymatic digestion,
[00911 In some embodiments, as described in the Examples herein, glycoproteins extracts are reduced, alkylated and digested with sequencing-grade, modified trypsin (Promega) using a standard proteo ics protocol (Ferreira et aL 'Synthesis and Optimization of Lectin
Functionalized Nanoprobes for the Selective Recovery of Glycoproteins from Human Body Fluids," Analytical Chemistry 83:7035 7043 (201 1), which is hereby incorporated by reference in its entirety). The l-glycans can then be analyzed based on a modification of Jensen et ai (Koianch et ah, "Isomer-Specific Analysis of Released N-Glycans by LC-ESI MS/MS with Porous Graphitized Carbon," Methods in Molecular Biology· 1321 :427~433 (2015), which is hereby incorporated by reference in its entirety). Briefly, A-LInked glycans are released with PNGase F {EUzahethkingia meningoseptica; Sigma), deaminated and partially purified using porous graphitized carbon solid-phase extraction cartridges (PGC-SPE, HyperSep-96-Hyperearb,
10 25 mg, Thermo Scientific) as described previously (Jensen et al., "Structural Analysis of N- and O-Glycans Released from Glycoproteins,” Nature Protocols 7: 1299-1310 (2012), which is
 incorporated by reference in its entirety). Glycan profiling and characterization may be performed by MALDi TOF/TOF mass spectrometry (4800 Plus, SC1EX) using alpha-cyano~4- hydroxycinnamic acid (CHCA; 10 mg/mL in 50% ACM), operated in reflector negative mode (mass range of m/z 1000 to 5000) with external calibration (TOF/TOF calibration mixture, SC1EX), NanoHPLC- High Resolution Mass Spectrometry (FIRMS) may be used to validate the presence of most discriminative ions in MALDI-MS spectra using a nanoHPLC system (Dionex, 3000 Ultimate RSLCnano) coupled on-line to a LTQ-Orbitrap XL mass spectrometer (Thermo Scientific) equipped with a nano-electrospray ion source (Thermo Scientific, EASY-Spray 0 source). ,Y~Giycan chromatographic separation using Porous Graphitized Carbon (PGC) may be adapted from a procedure previously described (Jensen et al., "Structural Analysis of N- and O- Gf yeans Released from Glycoproteins,” Nature Protocols 7:1299 1310 (2012), which is hereby incorporated by reference in its entirety), A nanoflow PGC column · HyperCard, 150 mm x 75 pm ID, 3 pm particle size, Thermo Scientific) followed by a reversed phase Cl 8 column (EASY-
•· V Spray C IS PepMap, 100 A, 150 mm x 75pm ID and 3 pm particle size, Thermo Scientific) can be combined in series. This allows a better separation of carbohydrates and remaining tryptic peptides, while minimizing salt precipitation events encountered when a nanospray emitter was utilized directly after the PGC column, The mass spectrometer Is operated In negative Ion mode, 100921 The monosaccharide compositions for the glycan precursors on MALDI-MS spectra may then be predicted using the GlycoMod tool considering mass accuracies below 10 ppm. The possibility of neutral exchanges with Na+ and KG was considered for slaloglycans,
The glycan structures are assigned based on nanoHPLC-PGC-HRMS analysis considering: i) molecular monolsoiopic mass; (ii) C1D-MS/ S de novo sequencing; and (Hi) PGC-LC relative retention times. In particular, a2s3-!mked and tx2,6-l hiked sialylaied A-glyeans were
35 differentiated based on retention time («2,6 < a2,3) (Koiarich et ah, 'Isomer-Specific Analysis of Released N-Glyeans by LC-ESI MS/MS with Porous Grap itized Carbon,” Methods in
Molecular Biology 1321 :427-435 (2015), which is hereby incorporated by reference in its entirety). For further validation, MS/MS fragmentation profiles are matched to giycosidic fragments calculated in silica on GiyeoWorkBench (Ceroni et ah, "Glyco Workbench: a Tool for the Computer-Assisted Annotation of Mass Spectra of Glyeans," Journal of Proteome Research 7:1650-1659 (2008), which is hereby incorporated by reference in its entirety). General understanding of mammalian iV-glyeosylation may be used to determine some structural aspects, A semiquanfitive approach may be used to compare glycan compositions based on MALDI-MS assignments, taking nto account the monoisotopic peak intensity,
|00931 In other embodiments, the exomeres, small exosomes, or large exosomes are then contacted with one or more reagents suitable to detect higher or lower levels, relative to a standard for subjects not having cancer or to a prior sample from a subject having cancer, or the presence or absence of one or more lipids in the exomere, small exosome, or large exosome sample,
|0094) The term "lipidomlcs”1 refers to the use of metabolomics as applied to the evaluation of lipid metabolites in biological samples. Lipid profiling generally involves an evaluation of lipid metabolites in one or more lipid classes (e.g., fatty acids, triglycerides, diglycerides, cholesterol esters, and the phospholipid classes including phosphatidylcholine, phosphatidylethanolamine, lysophosphatidylcholine, sphingomyelin, phosphatidylcholine, phosphatidylsenne, phosphatidylethanolamine and cardioiipm), As used herein, the term”Hpid" is intended broadly and encompasses a diverse range of molecules that are relatively water- insoluble or nonpolar compounds of biological origin, including waxes, triglycerides, free fatty acids, diaeylgiyereols, fatty-acid derived phospholipids, sphingoilpids, g!ycolipids and terpenoids, such as retinoids, cholesterol, cholesterol esters, and steroids. Some lipids are linear aliphatic molecules, while others have ring structures. Some are aromatic, while others are not. |0095] The lipid profile can be quantitative, semi-quantitative and/or qualitative. For example, the lipid profile can evaluate the presence or absence of a lipid, can evaluate the presence of a !ipid(s) above or below a particular threshold, and/or can evaluate the relative or absolute amount of a lipld(s). In some embodiments, a ratio among two, three, four or more lipids Is determined. Changes or perturbations in lipid ratios can be advantageous in indicating where there are metabolic blocks (or releases of such blocks) or other alterations in metabolic pathways associated with disease, response to treatment, development of side effects, and the like. Methods of evaluating ratios of lipid precursors and products to evaluate enzyme activities and flow through metabol c pathways are known in the art {see, e g,, A the et ah, (2002) J, Lipid Res, 43: 1899- 1907 and Pan et ah, (1995) J. Clin, Invest. 96:2802-2808, which are hereby incorporared by reference in their entirety).
|0096| Ratios of lipid metabolites can be used to reflect or assess changes in lipid metabolism. Generally, if the ratio is calculated from metabolites not present in the same lipid class, quantitative data are used to calculate the ratio lithe lipid metabolites reflected in the numerator and the deno inator belong to the same lipid class, then relational data can be used.
1(109?! In some embodiments, the level of a lipid metabolite is normalized against another lipid metabolite, For example, the ratio between two or more lipid metabolites can be normalized against an index associated with a pathway, enzymatic activity, class of metabolites, and/or status of certain metabolic activities,
|0098j Alternatively the level of a lipid metabolite can be normalized against a housekeeping lipid metabolite, e g. a lipid metabolite that is relatively stable in amount under a variety of conditions in the subject. Quantitative metabolomic data include molar quantitative data, mass quantitative data and relational data by either moles or mass (mole % or weight %, respectively) for individual lipid metabolites or subsets of metabolites. In some embodiments, quantitative aspects of iipidomie analysis can be provided and/or improved by including one or more quantitative Internal standards during the analysis, for instance, one standard for each lipid class, internal standards are described In more detail in U.S. Patent Publication No.
2004/01434612, which is hereby incorporated by reference in Its entirety,
fl)099| Truly quantitative data can be Integrated from multiple sources (e.g,, the data do not need to be generated with the same assay, In the same location and/or at the same time) into a single seamless database regardless of the number of metabolites measured In each, discrete, individual analysis,
[01001 As used herein the term "level” Is Intended broadly and can mean a quantitative amount (e.g,, weight or moles), a semi-quantitative amount, a relative amount (e,g,, weight % os- mole % within class or a ratio), a concentration, and the like,
|0!0! ] For purposes of prognosing or managing treatment of cancer, a subject is selected that has or is undergoing treatment for cancer,
[S102J In accordance with this embodiment, exomeres are recovered from the sample and the method Is carried out by detecting one or more lipids selected from the group consisting of phospholipids, sphingolipids, and glycerollpids. Exemplary specific lipids include, without limitation, TG, Cer, LPG, LPE, PC, PI, PE, LPI, PS, SM, MG, LPC, PG, DG, CerG3, and CerG l ,
10103} In another embodiment, small exosomes are recovered from the sample and the method Is carried out by detecting lipids selected from the group consisting of LPE, PC, PL PE, LPI, PS, PC, SM, and CerG3,
|Q1 ] In farther embodiment, large exosomes are recovered from the sample and the method Is carried out by detecting lipids selected from the group consisting of tPE, PC, PI, PE, IPS, PS, PC, SM, and CerG3,
[01(15) The hpld profile of the exomere, small exosomal, or large exosomal sample can be determined using any suitable method. The different classes o lipids and methods of detecting and optionally quantifying the same are well known in the art (e.g„ thin layer chromatography, gas chromatography, liquid chromatography, mass and NMR spectrometry, and any combination thereof (e.g. GC/MS), and the like). One suitable method of detecti g, and optionally quantifying, lipids in a biological sample employs stable isotope tracers to label the lipids. Methods of obtaining lipid profiles from biological samples have been described, see, e.«„ U.8. Patent Publication No, 2004/014346! to Watkins and Watkins e? oh (2002 ) J Lipid Res, 43(1 1 ): 1809- 17, which are hereby incorporated by reference in their entirety.
|0I06] In other aspects of the invention, the exomeres, small exosomes, or large exosomes are then contacted with one or more reagents suitable to detect higher or lower levels, relative to a standard for subjects not having cancer or to a prior sample from a subject having cancer, or the presence or absence of one or more genetic mutations in nucleic acid molecules associated with cancer In the exomere, small exosome, or large exosome sample,
id 107) For purposes of prognosing or managing treatment of cancer, a subject Is selected that has or is undergoing treatment for cancer.
IQ1Q81 In accordance with this aspect, the nucleic acid molecule may be DMA or RNA,
[flKI9f The exomere, small exosome, or large exosome fraction from a bodily fluid of a subject can be p re-treated wdth DNase to eliminate or substantially eliminate any DMA located on the surface or outside of the exosomes, Without DNAse pre-treatment short DMA fragments on the outside of the exosomes may remain and eo-isoiate with nucleic adds extracted from inside the exosomes. Thus, elimination of all or substantially all DNA associated wdth the outside or surface of the exosomes by pre-treatment of with DNase, has the ability to enrich for internal exomere, small exosome, or large exosome dsDNA. To distinguish DNA strandedness within exomeres, small exosomes, or large exosomes, Shrimp DNase specifically digests double- stranded DNA and SI nuclease specifically digests single-stranded DNA.
[OllOjj In accordance with this and all other apects of the present invention, DNA may be isolated by extracting the DNA from the exomeres, small exosomes, or large exosomes prior to or for analysis,
fill 11) The extracted DNA can be analyzed directly without an amplification step.
Direct analysis may be performed with different methods including, but not limited to, nanostring technology. NanoStrlng technology enables identification and quantification of
individual large! molecules in a biological sample by attaching a color coded fluorescent reporter to each target molecule. This approach Is similar to the concept of measuring inventory by scanning barcodes. Reporters can be made with hundreds or even thousands of different codes allowing for highly multiplexed analysis. The technology is described in a publication by Gdss el al.“Direct Multiplexed Measurement of Gene Expression with Color-Coded Probe Pairs," Nai Biotechml 26(3); 317-25 (2008), which is hereby incorporated by reference in Its entirety, fO! 12| In another embodiment, it may be beneficial or otherwise desirable to amplify the nucleic acid of the exomeres, small exosomes, or large exosomes prior lo analyzing it. Methods of nucleic acid amplification are commonly used and generally known in the art, if desired, the amplification can be performed such that it is quantitative. Quantitative amplification will allow quantitative determination of relative amounts of the various exosomai nucleic acids,
[01 Of Nucleic acid amplification methods include, without limitation, polymerase chain reaction (PCR) (U.S, Patent No. 5,219,727, which is hereby incorporated by reference In Its entirety) and its variants such as in situ polymerase chain reaction (U.S. Patent No, 5,538,871 , which is hereby incorporated by reference in Its entirety), quantitative polymerase chain reaction (U.S, Patent No. 5,219,727, which Is hereby Incorporated by reference in its entirely), nested polymerase chain reaction (U.S. Patent No. 5,556,773, which is hereby incorporated by reference In Its entirety), self sustained sequence replication and Its variants (Guateiii et ah Isothermal, in vitro Amplification of Nucleic Acids by a Multienzyme Reaction Modeled after Retroviral Replication,” Proc Nai! Acad Sci USA 87(5): 1874-8 (1990), which is hereby incorporated by reference in its entirely), transcriptional amplification system and its variants (Kwoh et al “Transcription-based Amplification System and Detection of Amplified Human
Immunodeficiency Virus type 1 with a Bead-Based Sandwich Hybridization Formal, Proc Nat! Acad Sci USA 86(4): 1 173-7 ( 1989), which Is hereby Incorporated by reference in Its entirety), Qb Rep!Icase and Its variants (MIele et al.“Autocatalytic Replication of a Recombinant RHATJ Mol Bio! 171 (3): 281 -95 (1983), which Is hereby incorporated by reference in its entirety), cold- PCR (Li et ah“Replacing PCR with COLD-PCR Enriches Variant DNA Sequences and Redefines the Sensitivity of Genetic Testing. ' Not M 14(5): 579-84 (2008), which is hereby Incorporated by reference in its entirety) or any other nucleic acid amplification and detection methods known to those of skill in the art. Especially useful are those detection schemes designed for the detection of nucleic add molecules if such molecules are present In very low numbers.
[0114] In one embodiment, the Isolated DNA is contacted with one or more reagents suitable to detect the presence or absence of one or more genetic imitations that are associated with cancer. Exemplary genetic mutations associated with cancer include, but are not limited to.
BRAF, EGER , APC, NOTCH l, HRAS, KRAS , NBAS, MET p53, PTEN, HER2, FITS , BBC AT BRCA2, PIK3CA , KIT, RET AKT, ABL, CDK4, MYC, RAF, PDGFR, BCR-ABL NPM1 , CEBPs!pha, and SRC.
[MIS] The one or mare mutations in the one or more identified genes cm be detected using a hybridization assay, in a hybridization assay, the presence or absence of a gene mutation is determined based on the hybridization of one or more allele-specific oligonucleotide probes to one or more nucleic acid molecules in the exomere, small exosomal, or large exosomal DNA sample from the subject, The oligonucleotide probe or probes comprise a nucleotide sequence that is complementary to at least the region of the gene that contains the mutation of Interest, The oligonucleotide probes are designed to be complementary to the wildtype, nonmutant nucleotide sequence and/or the mutant nucleotide sequence of the one or more genes to effectuate the detection of the presence or the absence of the mutation in the sample from the subject upon contacting the sample with the oligonucleotide probes, A variety of hybridization assays that are known in the art are suitable for use in the methods of the present invention.
These methods include, without limitation, direct hybridization assays, such as northern blot or Southern blot (sec e.g, Ausabe! et ah, Current Protocols in Molecular Biology, John Wiley & Sons, NY f 1991 ), which is hereby incorporated by reference in its entirety). Alternatively, direct hybridization can be carried out using an array based method where a series of oligonucleotide probes designed to be complementary to a particular non-mutant or mutant gene region are affixed to a solid support (glass, silicon, nylon membranes). A labeled exomere, small exosomal, or large exosoma DNA or cD A sample from the subject is contacted with the array containing the oligonucleotide probes, and hybridization of nucleic acid molecules from the sample to their complementary oligonucleotide probes on the array surface is detected.
Examples of direct hybridization array platforms include, without limitation, the Affymetrlx GeneChip or SNP arrays and tilumina’s Bead Array. Alternatively, the sample is bound to a solid support (often DNA or PCR. amplified DNA) and labeled with oligonucleotides in solution (either allele specific or short so as to allow' sequencing by hybridization).
|0I 16] Other common genotyping methods include, but are not limited to, restriction fragment length polymorphism assays; amplification based assays such as molecular beacon assays, nucleic acid arrays, high resolution melting curve analysis (Reed and Wittwer,
"'Sensitivity and Specificity of Single-Nucleotide Polymorphism Scanning by High Resolution Melting Analysis,7' Clinical Chem 50( 10): 1748-54 (2004), which is hereby incorporated by reference in its entirety); allele-specific PCR (Gaudet et a!.,“Allele-Specific PCR in SNP Genotyping," Methods Mol Biol 578: 415-24 (2009), which is hereby incorporated by reference in its entirety); primer extension assays, such as allele-specific primer extension {e.g., fllumina
Infinium* assay), arrayed primer extension (see Krjutskov cl a!., "Development of a Single Tube 640-pIex Genotyping Method for Detection of Nucleic Acid Variations on Microarrays,” Nucleic Acids Res. 36( 12) e75 (2008), which is hereby incorporated by reference In its entirety).
homogeneous primer extension assays, primer extension with detection by mass spec rometry (e.g., Sequenom iPLEX SNP genotyping assay) (see Zheng et al., "Cumulative Association of Five Genetic Variants with Prostate Cancer,” Eng. 1 Med . 358{9):910-919 (2008), which Is hereby incorporated by reference in its entirety), multiplex primer extension sorted on genetic arrays; flap endonuclease assays (e.g., the Invader'*' assay) (xee Olivier M,, "The Invader Assay for SNP Genotyping,” Mutat Res. 573 (1-2) 103- 10 (2005), which Is hereby incorporated by reference In its entirety); S' nuclease assays, such as the TaqMah assay (see ITS. Patent Nos. 5,210,015 to Gelfand et ah and 5,538,848 to Livak et al., which are hereby incorporated by reference in their entirety); and oligonucleotide ligation assays, such as ligation with rolling circle amplification, homogeneous ligation, OLA Gee II, S. Patent No, 4,988,617 to Lartdgrert et ah, which is hereby incorporated by reference In its entirety), multiplex ligation reactions followed by PCR, wherein zipcodes are Incorporated into ligation reaction probes, and amplified PCR products are determined by electrophoretic or universal zipeode array readout (see U.S. Patent Nos. 7,429,453 and 7,312,039 to Barany et aL, which are hereby incorporated by reference in their entirety). Such methods may be used in combination with detection mechanisms such as, for example, luminescence or chemiluminescence detection, fluorescence detection, time-resolved fluorescence detection, fluorescence resonance energy transfer, fluorescence polarization, mass spectrometry, and electrical detection. In general, the methods for analyzing genetic aberrations are reported in numerous publications, not limited to those cited herein, and are available to those skilled in the art. The appropriate method of analysis will depend upon the specific goals of the analysis, the condition/history of the patient, and the specific cancels), diseases or other medical conditions to be detected, monitored or treated. f0117| Alternatively, the presence or absence of one or more mutations identified supra cm be detected by direct sequencing of the genes, or preferably particular gene regions comprising the one or more identified mutations, from the patient sample. Direct sequencing assays typically Involve Isolating D A sample from the subject using any suitable method known in the art, and cloning the region of interest to be sequenced into a suitable vector for amplification by growth In a host ceil (e.g. bacteria) or direct amplification by PCR or other amplification assay. Following amplification, the DNA can be sequenced using any suitable method, A preferable sequencing method involves high-throughput next generation sequencing (NOS) to Identify genetic variation. Various NGS sequencing chemistries are available and suitable for use In carrying out the claimed Invention, Including pyrasequendng (Roche* 454),
sequencing by reversible dye terminators (lllumina* HiSeq, Genome Analyzer and MiSeq systems), sequencing by sequential ligation of oligonucleotide probes (Life Technologies*1 SOLID), and hydrogen ion semiconductor sequencing (Life Technologies1’, Ion Torrent™).
Alternatively, classic sequencing methods, such as the Sanger chain termination method or Maxam-Gilbert sequencing, which are well known to those of skill in the art, can be used to carry out the methods of the present invention.
[0118] In certain embodiments of the present invention, the selected subject has melanoma, breast cancer, or pancreatic cancer.
[0119] The methods described herein may further include selection of a suitable cancer therapeutic and administering the selected cancer therapeutic to a subject. In practicing the methods of the present invention, the administering step is carried out to treat the cancer, achieve inhibition of metastasis or metastatic disease progression. Such administration can be carried out sys!emieally or via direct or local administration to the tumor site. By way of example, suitable modes of systemic administration include, without limitation orally, topically, transderma! iy, parenteralfy, iotradermaily, intramuscularly, intraperitonealSy, intravenously, subcutaneously, or by intranasal instillation, by intracavitary or intravesical instillation, intraocularly, intraarteriaiy, intralcsiona!ly, or by application to mucous membranes. Suitable modes of local administration include, without limitation, catheterization, implantation, direct injection, dermai/transdermal application, or portal vein administration to relevant tissues, or by any other local administration technique, method or procedure generally known in the art. The mode of affecting delivery of agent will vary depending on the type of therapeutic agent (e.g,, an antibody or an inhibitory nucleic acid molecule) and the disease to be treated.
|0120] Effective doses for the treatment of a metastatic disease vary depending upon many different factors, including type and stage of cancer, means of administration, target site, physiological state of the patient, other medications or therapies administered, and physical state of the patient relative to other medical complications. Treatment dosages need to be titrated to optimize safety and efficacy,
[0121] Another aspect of the present invention Is directed to a kit suitable for diagnosing cancer. The kit includes one or more reagents suitable to defect: ( I ) higher or lower levels, relative to a standard or to a sample from a subject, or the presence or absence, of one or more proteins contained in exomeres, small exosomes, or large exosomes, (2) higher or lower levels, relative to a standard or to a sample from a subject, or the presence or absence, of one or more N~ gfyeans contained m exomeres, small exosomes, or large exosomes, (3) higher or lower levels, relative to a standard or to a sample from a subject, or the presence or absence, of one or more hpids contained in exomeres, small exosomes, or large exosomes, (4) the presence or absence of
one or more genetic mutations n nucleic acid molecules associated with cancer and contained in exomeres, small exosomes, or large exosomes, or (5) combinations thereof, wherein said small exosomes have a diameter of 60 to 80 nm and said large exosomes have a diameter of 90 to 120 nm.
|0!22f In one embodiment, the kit contains one or more reagents suitable for isolating exomeres, small exosomes, or large exosomes. By way of example, suitable markers for isolation of exomeres include, without limitation, HSP90AB I , MTHFDI, ACTIO, PBPD, !DH t , HMGCS i , EGALS3BP, CALR, HSPA 13, UGP2, MAT! A, GPDR PFKL, HGD, GCLC, GSN, CNDP2, FAT4, ERP44, 8ZW1, AGL B4GATI, EXT], CAT, X P PEP 1, CORG I C, RACK!, HPD, EXT2, ACLY, ADK, PSMC4, ACOi , RRM1, SERPINH 1 , PYGL., ALDH I L1, PGM I , EEFIG, and PPP2RI A, Suitable markers for isolation of small exosomes include, without limitation, PLOT I, FLOT2, TTY 10, TSPANI4, and VPS37B. Suitable markers for isolation of large exosomes include, without limitation, STIR I , MPP6, DLG I , ABP, ATP2B I , ANXA4, MYOI C, STXBP3, RDX, ANXA I, ANXA5, ON A 13, PACS1N3, VPS4B, CHMPI A, CHMP5, CHMP2A, SH3GLI, CHMP4B, GNG 12, and DNAJA ! ,
|©123| In some embodiments, the kit comprises one or more reagents suitable to detect higher or lower levels, relative to a standard or to a sample from a subject, or the presence or absence, of one or more proteins contained In exomeres. Exemplary proteins contained in exomeres are described above.
|0124| In some embodiments, the kit comprises one or more reagents suitable to detect higher or lower levels, relative to a standard or to a sample from a subject, or the presence or absence, of one or more proteins contained in small exosomes. Exemplary proteins contained in small exosomes are described above,
|0125f In some embodiments, the kit comprises one or more reagents suitable to detect higher or lower levels, relative to a standard or to a sample from a subject, or the presence or absence, of one or more proteins contained in large exosomes. Exemplary proteins contained in large exosomes are described above,
I0126| The kit of the present invention may also contain reagents suitable to determine if a subject has a particular type of cancer. In certain embodiments, the kit contains reagents suitable to determine if a subject has melanoma, breast cancer, and/or pancreatic cancer.
Exemplary proteins suitable for detection in exomeres, small exosomes, or large exosomes of melanoma, breast cancer, or pancreatic cancer subjects are described above,
[0127] A number of kits are contemplated to encompass a variety of methods. These kits optionally include reagents to process a tissue or cell sample for the technique employed by that particular kit. By example, a kit for PCR or PCR enhanced in situ hybridization cars include
reagents to process the sample and Isolate the RNA (for PCR), It will also contain suitable primers to amplify the target sequence and additional probes, If necessary, to detect the desired nucleic acid fragments as well as buffers and reagents for the polymerase chain reaction and the buffers and emulsions required for in situ hybridization methods. Other kits can alternatively include reagents for immunofluorescence or ELISA using antibodies or probes, primers and reagents for modifications of in situ or PCR in situ hybridization methods.
I0I28J For the purposes of the kits of the present invention, the isolation of nucleic adds from the exomere, small exosomaS, or large exosomal sample may be desirable. Accordingly, kits may contain reagents necessary to carry out such methods. Methods of isolating R A and ON A from biological samples for use in the methods of the present Invention are readily known in the art. These methods are described in detail In LABORATORY TECHNIQUES IN BIOCHEMISTRY AND MOLECULAR BIOLOGY: HYBRIDIZATION WITH NUCLEIC ACID PROBES, PART L THEORY AND NUCLEIC ACID PREPARATION (P. Tijssen ed., Elsevier 1993), which is hereby incorporated by reference in its entirety. Total RNA can be isolated from a given sample using, for example, an acid goanidinium-phenoi-ehloroform extraction, a guanidinium isothiocyanate- ultracentrifugation method, or lithium ch!oride-SDS-urea method. PolyA" mRNA can be isolated using oiigo(dT) column chromatography or (dT)n magnetic beads (See e.g,, SAMBROOK AND RUSSELL, MOLECULAR CLONING: A LABORATORY MANUAL (Cold Springs Laboratory Press, i 989) or CURREN T PROTOCOLS IN MOLECULAR BIOLOGY (Fred M. Ausubel et al, eds., 1992) which are hereby Incorporated by reference in their entirety). See also WO/2000024939 to Dong et ah, which is hereby incorporated by reference in its entirety, for complexity management and other nucleic acid sample preparation techniques.
(0129| It may be desirable to amplify the nucleic acid sample prior to detecting protein levels. One of skill in the art will appreciate that a method which maintains or controls for the relative frequencies of the amplified nucleic acids to achieve quantitative amplification should be used.
Of Typically, methods for amplifying nucleic acids employ a polymerase chain reaction (PCR) (See e.g., PCR TECHNOLOGY: PRINCIPLES AND APPLICATIONS TOR DNA
AMPLIFICATION (Henry Erlich ed., Freeman Press 1 92); PCR PROTOCOLS: A GLIDE TO
METHODS AND APPLICATIONS (Michael Innis ed,, Academic Press 1 90); Maltha et at,, '"Fidelity of DNA Synthesis by the Thermoeoccus litoralis DNA Potymerase—An Extremely Heat Stable Enzyme with Proofreading Activity," Nucleic Adds Res, 19:4967-73 (1991 ); Eckert et al.,“DNA Polymerase Fidelity and the Polymerase Chain Reaction,” PCR Methods and Applications 1 : 17- 24 (1991); and U.S. Patent Nos. 4,683.202, 4,683, 1 5, 4,800, 159, 4,965, 188, and 5,333,675 all to ul!is et al, which are hereby Incorporated by reference in their entireties for all purposes), The
sample can also be amplified on an array as described in U.S. Patent No. 6.300,070 to Boles, which is hereby incorporated by reference in its entirety,
[01311 Other suitable amplification methods include the ligase chain reaction (LCR) (e.g,
Wu et a!,, 'The Ligation Amplification Reaction (LAR)— -Amplification of Specific DMA Sequences Using Sequential Rounds of Template-Dependent Ligation,” Genomics 4:560-9
( 1989). Landegren et aL "A Ligase-Mediated Gene Detection Technique," Science 24 L 1077-80 ( 1988), and Barringer et af,,“Blunt-End and Single-Strand Ligations by Escherichia mil Ligase: Influence on an In Vitro Amplification Scheme," Gene 89: 1 1 7-22 ( 1 90), which are hereby incorporated by reference in their entirety); transcription amplification (Kwoh et ah,
"Transcription-Based Amplification System and Detection of Amplified Human
Immunodeficiency Virus Type I with Bead-Based Sandwich Hybridization Format," Pmc,
Nail. Acad Sci, USA 86: 1 173-7 ( 1989) and WO 88/10315 to Glngeras, which are hereby incorporated by reference in their entirety); self-sustained sequence repl cation (Guate!ii et aL, “Isothermal, In Vitro Amplification oFNucleic Acids by a Mufrienzyme Reaction Modeled After Retroviral Replication,” P c. Nad, Acad Sci. USA 87: 1874-8 ( 1990) and WO 90/06995 to Glngeras, which are hereby incorporated by reference in their entirety); selective amplification of target polynucleotide sequences (U.S, Patent No, 6,410,276 to Burg at aL, which is hereby Incorporated by reference in its entirety); consensus sequence primed polymerase chain reaction (CP-PCR) (U.S, Patent No. 5,437,975 to McClelland, which is hereby incorporated by reference in its entirety); arbitrarily primed polymerase chain reaction (AP-PC ) (U.S, Patent Nos.
5,41 3,909 to Bassam, and 5,861 ,245 to McClelland which are hereby incorporated by reference in their entirety); and nucleic acid based sequence amplification (NABSA) (See U.S. Patent Nos. 5,409,81 8. 5,554,51 7, and 6,063,603 all to Davey, which are hereby Incorporated by reference in their entirety). Other amplification methods that may be used are described in U.S. Patent Nos. 5,242,794 to Whiteley; 5,494,810 to Barany; and 4,988,617 to Landgren, which are hereby incorporated by reference in their entirety,
[0132f The kits may also contain probes or primers which hybridize to complementary nucleic acid molecules in the exomere. small e.xosomai, or large exosomal sample. The probes comprise nucleotide sequences that are complementary to at least a region of mRNA or corresponding cDNA of the desired proteins. As used herein, the term“hybridization” refers to the complementary base-pairing interaction of one nucleic acid with another nucleic add that results in formation of a duplex, triplex, or other higher-ordered structure. Typically, the primary interaction is base specific, e.g., A/T and Q/C, by Watson/Crick and Hoogsteen-type hydrogen bonding, Base-stacking and hydrophobic interactions can also contribute to duplex stability. Conditions for hybridizing detector probes to complementary and substantially complementary
target sequences ar well known in the art {see e.g., NUCLEIC ACID HYBRIDIZATION, A
PRACTICAL APPROACH, 8. Ha es and S. Higgins, eds., !RL Press, Washington, D.C. ( 1985), which Is hereby incorporated by reference in its entirety), in general, hybridization is influenced by, among other things, the length of the polynucleotides and their complements, the pH, the temperature, the presence of mono- and divalent cations, the proportion of G and C nucleotides in the hybridizing region, the viscosity of the medium, and the presence of denalurants, Such variables influence the time required for hybridization. Thus, the preferred hybridization conditions will depend upon the particular application. Such conditions, however, can be routinely determined by the person of ordinary skill In the art without undue experimentation. It will be appreciated that complementarity need not be perfect; there can be a small number of base pair mismatches that will minimally interfere with hybridization between the target sequence and single stranded nucleic add probe. Thus what is meant by complementarity herein Is that the probes are sufficiently complementary to the target sequence to hybridize under the selected reaction conditions to achieve selective detection and measurement,
[0133] Detection of hybridization between probes and corresponding target molecules from an exomere, small exosomal, or large exosoma! sample can be performed by several assays known in the art that permit detection of the expression level of the one or more proteins. As described herein, the“expression level'’ of a protein can be achieved by measuring any suitable value that is representative of the gene expression level. The measurement of gene expression levels can be direct or indirect A direct measurement involves measuring the level or quantity of RNA or protein. An indirect measurement may Involve measuring the level or quantity of cD A, amplified RNA, DNA, or protein; the activity level of RNA or protein; or the level or activity of other molecules (eg, a metabolite) that are indicative of the foregoing. The measurement of expression can be a measurement of the absolute quantity of a gene product.
The measurement can also be a value representative of the absolute quantity, a normalized value (e,g., a quantity of gene product normalized against the quantity of a reference gene product), an averaged value (e.g,, average quantity obtained at different time points or from different sample from a subject, or average quantity obtained using different probes, etc.), or a combination thereof,
|0I34| In a preferred embodiment, hybridization is detected by measuring RNA expression level. Measuring gene expression by quantifying RNA expression can he achieved using any commonly used method known hi the art Including northern blotting and In ska hybridization (Parker et ah,“rrsRNA: Detection by in Situ and Northern Hybridization,” Methods in Molecular Biolog y 106:247-283 (1999), which is hereby Incorporated by reference In Its entirety); RNAse protection assay (Hod et a!., viA Simplified Ribonue!ease Protection Assay,"’
Biotechniques 13:852-854 ( 1992), which Is hereby incorporated by reference in its entirety); reverse transcription polymerase chain reaction (RT-PCR) (Weis et ah, "Detection of Rare mRNAs via Quantitative RT-PCR," Trends in Genetics 8:263-264 (1992), which Is hereby incorporated by reference in its entirety); and serial analysis of gene expression (SAGE)
(Velcnleseu et ah, "Serial Analysis of Gene Expression,” Science 270:484-48? (1995); and Veiculescu et ah, "Characterization of the Yeast Transcriptome," Ceil 88:243-51 ( 1997), which is hereby incorporated by reference in its entirety).
| (11351 Irs a nucleic add hybridization assay, the expression level of nucleic acids corresponding to proteins cars be detected using an array-based technique. These arrays, also commonly referred to as "microarrays” or "chips*’ have been generally described in the art, see e.g., U, 5. Patent Nos. 5,143,854 to Riming et a!.; 5,445,934 to Fodor et ah; 5,744,305 to Fodor et ah; 5,677, 195 to Winkler et ah; 6,040, 193 to Winkler et ah; 5,424, 186 to Fodor et a!., which are all hereby Incorporated by reference in their entirety, A microarray comprises an assembly of distinct polynucleotide or oligonucleotide probes immobilized at defined positions on a substrate. Arrays are formed on substrates fabricated with materials such as paper, glass, plastic (e.g., polypropylene, nylon), polyacrylamide, nitrocellulose, silicon, optical fiber or any other suitable solid or semi-solid support, and configured in a planar (e.g,, glass plates, silicon chips) or three- dimensional (e.g., pins, fibers, beads, particles, microtiter wells, capillaries) configuration, Probes forming the arrays may be attached to the substrate by any number of ways including (i) in situ synthesis (e.g., high-density oligonucleotide arrays) using photolithographic techniques (see Fodor et ah,“Light-Directed, Spatially Addressable Parallel Chemical Synthesis,” Science 251 :76?~773 ( 1991 ); Pease et ah,“Light-Generated Oligonucleotide Arrays for Rapid DNA Sequence Analysis," Proe, Natl Acad ScL U.S.A. 9 ! :5G22-5026 { 1994): Lockhart et aL “Expression Monitoring by Hybridization to H gh-Density Oligonucleotide Arrays," Nature Biotechnology 14:1675 (1996); and U.S. Patent Nos. 5,578,832 to Trulson; 5,556,752 to
Lockhart; and 5,510,270 to Fodor, which are hereby incorporated by reference in their entirety); (ti) spotting/printing at medium to low-density (e.g·, cDNA probes) on glass, nylon or nitrocellulose (Schena et a!.,“Quantitative Monitoring of Gene Expression Patterns with a Complementary DNA Microarray,” Science 270:467-470 ( 1 95), DeRisi et a!, "Use of a ePMA Microarray to Analyse Gene Expression Patterns in Human Cancer” Nature Genetics 14:457- 460 (1996); Shalon et al.,“A D A Microarray System for Analyzing Complex DNA Samples Using Two-Color Fluorescent Probe Hybridization," Genome Res, 6:639-645 ( 1996); and Schena et al, ''Proc. Natl. Acad. Sol U.S.A. 93:10539-1 1286) ( 1995), which are hereby incorporated by reference in their entirety); (iii) masking (Maskos et ah, 'Oligonucleotide Hybridizations on Glass Supports: A Novel Linker for Oligonucleotide Synthesis and Hybridization Properties of
Oligonucleotides Synthesised in Situ * Nuc. Adds Res , 20: 1679-1684 (1992), which is hereby incorporated by reference in its entirety); and (iv) dot-blotting on a nylon or nitrocellulose hybridization membrane (see e.g., SAMBROOK AND RUSSELL, MOLECULAR CLONING: A
LABORATORY MANUAL (Cold Springs Laboratory Press, 1 89), which is hereby incorporated by reference in its entirety). Probes may also be noncovalently immobilized on the substrate by hybridization to anchors, by means of magnetic beads, or in a fluid phase such as In r crotiter wells or capillaries. The probe molecules are generally nucleic adds such as DMA, RNA, RNΆ, and cDNA,
|0!36| Fluorescenily labeled cDNA for hybridization to the array may be generated through incorporation of fluorescent nucleotides by reverse transcription of RNA extracted from exomere, small exosomaL or large exosomal samples. Labeled cDNA applied to the array hybridizes with specificity to each nucleic add probe spotted on the array. After stringent washing to remove non-specifically bound cDNA, the array is scanned by con!oeai laser microscopy or by another detection method, such as a CCD camera. Quantitation of
hybridization of each arrayed element allows for assessment of corresponding mRNA
abundance. With dual color fluorescence, separately labeled cDNA samples generated from two sources of R A are hybridized pairwise to the array. The relative abundance of the transcripts from the two sources corresponding to each spec fied gene is thus determined simultaneously. The miniaturized scale of the hybridization affords a convenient and rapid evaluation of the expression pattern for large numbers of genes. Such methods have been shown to have the sensitivity required to detect rare transcripts, which are expressed at a few copies per cell, and to reproducibly detect at least approximately two-fold differences in the expression levels (Sehena et ah,“Parallel Human Genome Analysis: jV!icroarray- Based Expression Monitoring of 1000 Genes/’“ Proc . Nail Acad. ScL USA 93(20): 10614-9 (1996), which is hereby incorporated by reference in Its entirety).
|0!37| A nucleic acid amplification assay that is a semi-quantitative or quantitative realtime polymerase chain reaction (RT-PCR) assay can also be performed. Because RNA cannot serve as a template for PCR, the first step in gene expression profiling by RT-PCR is the reverse transcription of the RNA template into cDNA, followed by Its exponential amplification in a PCR reaction. The two most commonly used reverse transcriptases are avian myeloblastosis virus reverse transcriptase (AMV-RT) and Moloney murine leukemia virus reverse transcriptase (MLV-RT), although others are also known and suitable for this purpose, The reverse transcription step is typically primed using specific primers, random hexamers, or oligo-dT primers, depending on the circumstances and the goal of expression profiling. For example, extracted RNA can be reverse-transcribed using a GeneAmp RNA PCR kit (Perkin Elmer, Calif,,
USA), following the manufacturer's instructions. The derived cDNA can then he used as a template in the subsequent PCR reaction.
[0138] Although the PCR step can use a variety of thermostable DNA-dependen DNA polymerases, it typically employs the Taq DNA polymerase, which has a 5'-3’ nuclease activity but lacks a 3 -5’ proofreading endonuclease activity. An exemplary PCR amplification system using Taq polymerase is TaqMan* PCR (Applied Biosystems, Foster City, CA), Taqnian* PCR typically utilizes the 5'mudease activity of Taq or Tth polymerase to hydrolyze & hybridization probe bound to its target amplicon, but any enzyme with equivalent 5' nuclease activity can be used. Two oligonucleotide primers are used to generate an amplicon typical of a PCR reaction.
A third oligonucleotide, or probe, Is designed to detect the nucleotide sequence located between the two PCR primers, The probe is non-extendible by Taq DNA polymerase enzyme, and is labeled with a reporter fluorescent dye and a quencher fluorescent dye. Any laser-induced emission fro the reporter dye is quenched by the quenching dye when the two dyes are located dose together as they are on the probe. During the amplification reaction, the Taq DNA polymerase enzyme cleaves the probe In a template-dependent manner. The resultant probe fragments disassociate in solution, and signal from the released reporter dye is free from the quenching effect of the second fluorophore, One molecule of reporter dye is liberated for each new molecule synthesized, and detection of the unquenched reporter dye provides the basis for quantitative interpretation of the data,
[0139] Taq Man” RT-PCR can be performed using commercially available equipment, such as, for example, the ABI PRISM 7700* Sequence Detection System5 (Perkin-Elmer- AppHed Biosystems, Foster City, Calif, USA), or the Lightcycler (Roche Molecular
Biochemicals, Mannheim, Germany).
[0140] In addition to the Taq Man* primer/probe system, other quantitative methods and reagents for real-time PCR detection that are known in the art (e,g. SYBR green, Molecular Beacons, Scorpion Probes, etc.) are suitable for use in the methods of the present invention.
[01411 To minimize errors and the effect of sample-to-sample variation, RT-PCR is usually performed using an internal standard or spike in control. The ideal internal standard is expressed at a constant level among different tissues, R As most frequently used to normalize patterns of gene expression are RNAs for the housekeeping genes glyceraidehyde-3-phosphate· dehydrogenase (GAPDH) and b-actin.
[0142] Real time PC is compatible both with quantitative competitive PCR, where internal competitor for each target sequence is used for normalization and quantitative comparative PCR using a normalization gene contained within the sample, or a housekeeping
gene for RT-PCR. For further details see, e\g„ Held et aL "Real Time Quantitative PCR " Genome Research 6:986-994 (1996), which is incorporated by reference in Its entirety.
[0143] When it Is desirable to measure the expression level of proteins by measuring the level of protein expression, the kit may contain reagents suitable for performing any protein hybridization or immunodetection based assay known in the art. In a protein hybridization based assay, an antibody or other agent that selectively binds to a protein is used to detect the amount of that protein expressed in a sample. For example, the level of expression of a protein can be measured using methods that include, but are not limited to, western blot, immunopreeipitation, enzyme-linked immunosorbent assay (ELISA), radioimmunoassay (R1A), fluorescent activated cell sorting (FACS), i m m u nob istochem istry, immunocytochemistry, or any combination thereof. Also, antibodies, aptamers, or other ligands that specifically bind to a protein can be affixed to so-called "protein chips" (protein microarrays) and used to measure the level of expression of a protein in a sample. Alternatively, assessing the level o protein expression can involve analyzing one or more proteins by two-dimensional gel electrophoresis, mass spectroscopy (MS), matrix-assisted laser desorption/ionizaf lon-tlme of flight- MS (MALDI- TOF), surface- enhanced laser desorption ionization-time of flight (SELDI-TOF), high performance liquid chromatography (HPLC), fast protein liquid chromatography (i-PLC), multidimensional liquid chromatography (LC) followed by tandem mass spectrometry (MS/ MS), protein chip expression analysis, gene chip expression analysis, and laser densitometry, or any combinations of these techniques.
|01 41 In certain embodiments, kits may contain an antibody that specifically binds a protein of interest, Optionally, the antibody can be fixed to a solid support to facilitate washing and subsequent isolation of the complex, prior to contacting the antibody with a sample.
Examples of solid supports include glass or plastic in the form of a microtiter plate, a stick, a bead, or a microbead. Examples of solid supports encompassed herein include those formed partially or entirely of glass (e.g.f controlled pore glass), polysaccharides (e,g„ agarose), polyacrylamides, silicones, and plastics such as polystyrene, polypropylene and polyvinyl alcohol. The sample can be diluted with a suitable diluent or eluant before contacting the sample to the antibody.
[0145] After incubating the sample with antibodies, the mixture can be washed and the antibody-antigen complex formed can be detected, This can be accomplished by Incubating the washed mixture with a detection reagent. This detection reagent may be a second antibody which is labeled with a detectable label, for example. Exemplary detectable labels include magnetic beads (e,g,, DYNABEADS™), fluorescent dyes, radiolabels, enzymes (for example, horse radish peroxidase, alkaline phosphatase and others commonly used in an ELISA), and
colorimetric labels such as colloidal gold or colored glass or plastic beads. Alternatively, the antigens in the sample can be detected using an indirect assay, wherein, for example, a second, labeled antibody is used to detect bound specific, primary antibody, and/or in a competition or inhibition assay wherein, for example, a monoclonal antibody which binds to a distinct epitope of the antigen (i.e., proteins uniquely associated with exomeres, small exosomes, or large exosomes) Is incubated simultaneously with the mixture.
[0146] immunoassays can be used to determine presence or absence of proteins in an exomere, small exosoma!, and/or large exosoma! sample as well as the quantity of the proteins in the sample. If a protein Is present in the sample, it will form an antibody-protein complex with an antibody that specifically binds the protein under suitable Incubation conditions described above. The amount of an antibody-protein complex can be determined by comparing to a standard. A standard can be a known compound or another protein known to be present in a sample, for example. As noted above, the test amount of antigen (i.e., proteins uniquely associated with exomeres, small exosomes, or large exosomes) need not be measured In absolute units, as long as the unit of measurement can be compared to a control
|§I47f In one embodiment, the kit contains one or more reagents suitable to detect higher or lower levels, or the presence or absence of one or more lipids contained in exomeres, small exosomes, or large exosomes.
[0148J Exemplary lipids to be detected are described above.
[01491 For the purposes of detecting the presence or absence or lipids, the kit comprises reagents and reference compounds suitable for detecting lipids, 'The reference compounds may be one or more of the following, but are not limited to, lipid standard(s), one or more control markers) that i s/a re regularly measured in & clinical setting, and positive and/ or negative controls, interna! and/ or external standards.
[01501 In one embodiment, the lipid coneentration(s), lipid ratio(s) or (a) lipid eomb ation(s) thereof In a sample from a subject is (are) determined by using mass
spectrometry. The sample may be subjected to purification and/or other sample pre-preparation step(s) before mass spectrometry analysis. The purification step may be, but is not limited to chromatography, for example, high performance liquid chromatography (HPLC), ultra performance liquid chromatography (UPLC) and/ or ultra high performance liquid
chromatography (UHPLC). The sample pre-preparation step may be, but is not limited to solid- phase extraction (SPE), derivatization, liquid-liquid extraction and/or lipoprotein fractionation. The said mass spectrometry determination may be done by tandem mass spectrometry.
fOISIJ n another embodiment, the kit contains one or more reagents suitable to detect higher or lower levels, or the presence or absence of one or more W-giyeans contained in exomeres, small exosomes, or large exosomes.
[0152] Exemplary N-gl yeans to be detected are described above,
[0153] In some embodiments, the kit contains one or more lectins for a specific gjyean structure, in addition to detection reagents and buffers. In some embodiments, the kit contains reagents for identifying glycosylated protein (e.g„ the glycosyiation detection reagents) in addition to reagents for identifying giycan structures. In some embodiments, the kit contains all of the components necessary and/or sufficient to perform at least one detection assay, Including all controls, directions for performing assays, and any necessary or desired software for analysis and presentation of results. In some embodiments, reagents (e. - lectins) are fluorescently labeled.
EXAMPLES [0154] The examples below are intended to exemplify the practice of the present invention but are by no means intended to limit the scope thereof.
Materials and Methods for Examples 1 7
[0155] Cell lines and cell culture. B I6-F I0, BI6~F1, 4TL MDA-MB-23 I series
(parental, -1833, -4175, and -831, gifts from Dr. J, Massague), LLC, SW62G, HCT1 16 (Horizon Discovery), PANC-1, AsPC-1 , Pan02 (purchased from the National Cancer Institute Tumor Repository), and N1H3T3 cells were cultured In DM EM Human melanoma cells (SK-Me! 103, A375M and A375P were obtained from MSfCCC), human prostatie carcinoma cell lines PC3 and DU 145, as well as BXPC-3, HPAF-II, PC-9, ET2B (gift from Dr, P, Gao and i, Bromberg), K- 562 (DSMZ) and B*4 (DSMZ) cells were cultured in R.PMI, supplemented with penicillin (100 U/mi) and streptomycin (100 pg/ml) and 10% FBS Ceil lines were obtained from American Type Culture Collection, If not otherwise mentioned, and authenticated using STR profiling by commercial providers, All cells were maintained in a humidified incubator with 5% CG at 37 °C and routinely tested and confirmed to he free of mycoplasma contamination. When collecting conditioned media for exosome isolation, FBS (Gibeo, Thermo Fisher Scientific) was first depleted of exosomes by isltraeenirifugation at 100,000 x g for 90 minutes, Cells were cultured for 3 days before supernatant collection.
[0156] Human specimens and processing, Fresh human tumor tissues were obtained from subjects with stage 1-3 melanoma at Memorial Sloan-Kettering Cancer Center (MSKCC) and had histologically confirmed melanoma. All Individuals provided Informed consent for
tissue donation according to a protocol approved by the institutional review board oFMSKCC (!RB# 1 1 -033 A, MSKCC; IRB#0604008488, WCM), and the study is compliant with all relevant ethical regulations regarding research involving human participants. Tissues were cut Into small pieces and cultured for 24 h in serum-free RPMf supplemented with
penicillin/streptomycin. Conditioned media was processed for exosome isolation and AF4 fractionation as described below,
[0157] Exomere an exosome isolation an mnmlght tracking analysis (NTA), SEV were prepared using differential ultracentrifugation methods (Peinado et a!,,“Melanoma
Exosomes Educate Bone Marrow Progenitor Cells Toward a Pro-Metastatic Phenotype through MET,” Nature Medicine 18:883-891 (2012), which is hereby incorporated by reference in its entirety) and resuspended in phosphate buffered saline (PBS, pH7.4) for subsequent analysis and AF4 fractionation. Isolated samples were quantified using BCA assay (Pierce, Thermo Fisher Scientific), NTA analysis of exosome size and particle number was performed using the LM 10 or DS500 NanoSight system (Malvern Instruments) equipped with a blue laser (405 nrrs) following manufacturers instructions,
|0!58| AF4 fractionation. The detailed step-by-step AF4 fractionation protocol including sample preparation, AF4 setting parameters and running method, data collection and analysis, and fraction collection and characterization) is provided on Protocol Exchange (Zhang et ah, "A Protocol for Asymmetric-Flow Field-Flow Fractionation (AF4) of Small Extracellular Vesicles,” Protocol Exchange (2018), which is hereby incorporated by reference in its entirety), [0159| Transmission electron microscopy (TEM) and atomic force microscopy
(ATM), For negative staining TEM analysis, 5 pi of sample solution was placed on a formvar/earbon coated grid and allowed to settle for 1 minute. The sample was blotted and negative stained with 4 successive drops of 1 ,5% (aqu) uranyl aetate, blotting between each drop. Following the last drop of stain, the grid was blotted and air-dried. Grids were imaged with a JEOL JSM 1400 (JBOL, USA, Ltd, Peabody, M A) transmission electron microscope operating at 100 Kv, Images were captured on a Veleta 2K. x 2K. CCD camera (O!ympus-SiS, Munich, Germany),
|1)1601 For AFM, dilutions were made for each sample and then plated on freshly cleaved mica substrate (SPI) for -2 inutes before washing with 10 L of Molecular Biology Grade f½0 (Fisher BR28 I9-G) and being blown dry with nitrogen gas. Imaging was performed using an MFP-3D-B10 AFM (Asylum Research), with an Olympus AC240TS-R3 AFM probe
(Asylum Research) in tapping mode at room temperature. Images were captured at 1 pm x I gm. Image analysis was performed using a custom-written Imagei/FIJI (N!H) code,
[0161! Zeta potential measurement. Fractionated samples were diluted in PBS
(Phosphate-buffered saline; 0.01 M phosphate buffer, 0,0027 M K.CL 0, 137 M NaCl; pH 7,4 tablets, Sigma) For z potential analysis using Zetasizer Nano ZS90 (Malvern Instruments), Samples were freshly prepared prior to loading onto the instrument at a 90° angle (respective to the light source). All experiments were performed at a constasrt temperature of 25°C.
[6162] Stiffness measurement Freshly cleaved mica coversllps were first coated with
Poiy-L-!ysine (0.1 %, w/v In FLO) for 30 minutes and then incubated with samples on the mica surface for 45 minutes. The samples were then rinsed with 1 ml of MllliPure water, washed three times with PBS buffer, then emerged in a drop of PBS on the mica surface. A stand-alone MFP-3D atomic force microscope (Asylum Research, Santa Barbara, CA) was utilized to perform the analysis. The spring constant of cantilever was determined as 559.73 pN/nm by the thermal noise method (Langlo s et aL "Spring Constant Calibration of Atomic Force Microscopy Cantilevers with a Piezosensor Transfer Standard,” The Review ofSe&miJk Insimmems 78:093705 (2007), which is hereby incorporated by reference in its entirety). The curvature radius of cantilever was -15 nm, and the resonant frequency of 325 kHz were used for the stiffness analysis (/,<?., indentation of cantilever) and imaging. Force measurements were performed with an approximate force distance of 300 nm and velocity of 500 n /s,
[0163] Western blot analysis. Whole cell extract (WCE) and exosome fractions were lysed directly with SDS sample buffer and lysates were cleared by centrifugation at 14,000 x g for 10 minutes. 100 pg of WCE and 10 pg of input and each nanoparticle subset were separated on a Novex 4-12% Bls-Tris Plus Gel (Life Technologies), and transferred onto a PVDF membrane (Millipore). Membranes were blocked for I hour at room temperature followed by primary antibody incubation overnight at 4®C. The following antibodies were used for western blot analysis: anii-TsgiOI (Santa Cruz se-7964); anti-Alix l (Cell Signaling 2171); anti Hsp90 (Stressgen ADLSPA-S30-F}, anti-MATi A I (Abeam ab 174687); anti-lDH I (Proteintech 23309- l -AP): anti-FLOTI (BD Biosekmces 610820); anti-TOLLIP (Abeam ah 117198); anti~VPS4B (Santa Cruz sc-32922); anli-DNAJA ! (Abeam ab 126774); anti-HSPA8/H5C70 (LifeSpan Biosciences LS-C3 I 2344-I 00). All primary antibodies were used at 1 : 1 ,000x dilution. !RDye 800 CW Goat-anti-mouse IgG (LI-COR Biosciences P N 926-32210, 1 : 15,GQ0x dilution), HRP- linked Sheep-anli-Mouse IgG (GE Healthcare Life Sciences NA93 1, l :2,50Gx dilution), and HRP-linked Donkey-anti-Rahhil IgG (GE Healthcare Life Sciences NA934, l :2,500x dilution) were used as secondary antibody. The blot was analyzed either using the Odyssey Imaging system (LI-COR Biosciences) or enhanced chemiluminescence substrates (Thermo Fisher Scientific).
[01641 Analysis of P mtmmk Profiling Bata. Protein mass spectrometry analyses of fractionated exosomes were performed at the Rockefeller University Proteomics Resource Center as described previously (Costa-SHva et ah, "Pancreatic Cancer Exosomes Initiate Pre- Metastatic Niche Formation in the Liver," Nature Ceil Biolog}> 17:816-826 (2015); Hoshino et ah, '‘Tu our Exosome Integrins Determine Organotropic Metastasis," Nature 527:329-335 (2015), which are hereby incorporated by reference in their entirety), and conducted on two independent biological replicates for each sample (exomere, Exo-S and Exo-L) derived from 5 different cell lines (B 16-FI G, 4ΊΊ , Pan02, AsPC and MDA-MB-4175).
[Ol&Sj For proteomic data processing and Principal Component Analysis (PCA), the proteomk expression data was processed using the *Lsmma’ package of the R program,
Proteomic expression data was imported and was normalized using‘ normal izeBetween Arrays function (method~quantile) (Bolstad et ah, "A Comparison of Normalization Methods For High Density Oligonucleotide Array Data Based on Variance and Bias," Bknnjhn tks 19: 185-193 (2003), which is hereby Incorporated by reference in its entirety), PCA was performed for data reduction, simplifying datasets to three dimensions for plotting purposes using‘princompQ' function with default options, and illustrated using the mgp package and "ploLldQ5 function.
[0166J For clustering and marker selection, Consensus clustering analysis, marker selection for each fraction, and heatmap generation were conducted using GBNE-E software. Consensus clustering was conducted to assess whether proteomic expression differs between fraction (Monti ei ak, "‘Consensus Clustering: A Resampling- Based Method for Class Discovery and Visualization of Gene Expression icroarray Data," Mach Leant 52:91 -1 18 (2003), which is hereby incorporated by reference In Its entirety). To identify fraction-specific markers, the probe (based on UniProt ID) values were collapsed to protein-level using maximum probe. Only proteins detected in both replicates of a sample were included for further analysis. Proteins were sorted by signal-to-noise statistic, (m^ - RB)7(KL *¾) where m and a represent the mean and standard deviation of proteomic expression, respectively, for each class (Golub et ah,“Molecular Classification of Cancer: Class Discovery and Class Prediction by Gene Expression
Monitoringnr Science 286:531 -537 (1999), which is hereby incorporated by reference in Its entirety). Next, the signal to noise marker selection too! from GBNE-E was used to Identify fraction-specific markers with L000 permutations. The cutoff to select fraction-specific markers was fold change >5. false discovery rate (FDR) <0.05, and mean protein expression >IG¾ with the positivity in >8054 (i.e. at least 4 out 5 samples from 5 cell lines for each nanoparticle subset) of the corresponding fraction. Heat maps for visual ization of differential protein expression patterns were generated for 65 markers (39 exomere-specifle markers; 5 Exo-S markers; 21 Exo-
L markers) using GENE-E with relative color scheme (by subtracting each mean protein expression, divide by each standard deviation for each row),
[0167] For Gene Set Enrichment Analysis (GSEA) the entire proteomic expression data set (Subramanian e ah,“Gene Set Enrichment Analysis: A Knowledge-Based Approach for Interpreting Genome-Wide Expression Profiles” Proc Nad Aca Sci USA 102:15545-15550 (2005), which is hereby incorporated by reference in its entirety) was used. Gene sets from Molecular signatures database v5.1 were used for GSE (H: 50 hallmark gene sets; C2:KEGG: i 86 canonical pathways from Kyoto Encyclopedia of Genes and Genomes [KEGGJ pathway database; C5: 825 gene sets based on Gene Ontology [GO] term) (Liberzon et ah,“Molecular Signatures Database (MSsgDB) 3.0,’’ Bmnformat s 27:1739-1740 (201 1), which is hereby Incorporated by reference In its entirety). The de ault parameters were used to identify significantly enriched gene-sets (FDR q <0,25)
j0168| Glycoprotein extraction nd lectin blotting. Nanoparticles were lysed with
RapiGest SF (Waters) containing 1 mM sodium orihovanadate and protease inhibitor cocktail (Roche), for 30 minutes on ice and centrifuged at 16,000 x g for 20 minutes, For lectin blotting O.Spg of total protein extracts were separated using 4-15% gradient gels (Biorad) and transferred onto nitrocellulose membranes. Samples were incubated at room temperature (RT) for i hour with the following biotinylated kcilns Aleurkt mmmtks Lectin (AAL; Fuca6Gic Ac and Fuea3GlcNAc), Sambucus nigra Lectin (SNA; Neu5Aca6(Gal or GalNAc)}, Phmeolm vulgaris Leueoagglutimn (L-PHA; Calp4GlcMAcp0(GlcNAcp2Mana3)Mana3), and Phaseolm vulgaris Eryihroaggiutimn (E-PHA; Galp4GlcNAcp2 ana6(Glc Acp4)(Glc Acp4!V!an 3)Manp4) (Vector Laboratories, 1 :2000 dilution except l ;1000 dilution for L-PHA), Vectastain Elite ABC HRP Kit (Vector Laboratories) was used for signal detection with ECL enhanced
chemiluminescence technique (GE Healthcare Life Sciences), The total protein profile of the samples was assessed In parallel on a silver-stained gel (FIG. 9A). (Abbreviations: Fuc, fucose; Glc Ac, N-aeetylglueosamme; Man, mannose; NeuSAc, neuraminic add; Gal, galactose;
GalNAc, M-ac ety I ga I actosam i ne ,)
[0169] Gly comics analysis. The glycoproteins extracts from the different fractions were reduced alkylated and digested with sequencing-grade, modified trypsin (Promega) using a standard proteo ies protocol (Ferreira et aL“Synthesis and Optimization of Lectin
Functionalized Nanoprobes for the Selective Recovery of Glycoproteins from Human Body Fluids " Analytical Chemistry 83:7035-7043 (201 1), which is hereby incorporated by reference in its entirety). The M-glyeans were analyzed based on a modification of Jensen et al (Kolarich et ai.,“Isomer-Specific Analysis of Released M~G!ycans by LC-ES1 MS/MS with Porous Graphitized Carbon," Methods in Molecular Biology 1321 :427-435 (2015 , which is hereby
incorporated by reference n its entirety). Briefly, L Linked glvcans were released with PNGase F {Ei tbethkmgia meningoseptica; Sigma), deami rated and partially purified using porous graphitized carbon solid-phase extraction cartridges (PGC-SPE, Hy pe rSep-96- H y percarb, 25 mg, Thermo Scientific) as described previously ( ensen et ah,‘"Structural Analysis of N- and 0- Glycans Released from Glycoproteins G Nature Protocols 7: 1299-1310 (2012), which is hereby Incorporated by reference in its entirety). Gl can profiling and characterization was performed by M.ALD1 TGF/TOF mass spectrometry (4800 Pius, 5GEX) using alpha-eyano-4- hydroxydnnamic acid (CMC A; 10 mg/mL in 50% ACN), operated in reflector negative mode (mass range of /z 1000 to 5000) with external calibration (TOF/TOF calibration mixture,
SCIEX). Three independent analytical measurements were performed, NanoHPLC- High Resolution Mass Spectrometry (FIRMS) was used to validate the presence of most discriminative ions MALDI-MS spectra using a nanoHPLC system (Dionex, 3000 Ultimate RSLCnano) coupled on-line to a LTQ-Orbitrap XL mass spectrometer (Thermo Scientific) equipped with a nano-electrospray Ion source (Thermo Scientific, EASY-Spray source), A lycan
chromatographic separation using Porous Graphltlzed Carbon (FGC) was adapted from a procedure previously described (Jensen et ah, "‘Structural Analysis of N- and O-Glyeans
Released from Glycoproteins,” Nature Protocols 7: 1299- 1310 (2012), which is hereby incorporated by reference in its entirety), A nanofiow FGC column (HyperCard, 150 mm x 75 pm ID, 3 p particle size. Thermo Scientific) followed by a reversed phase C I S column (EASY- Spray€18 PepMap. 100 A, 150 mm x 75pm ID and 3 pm particle size, Thermo Scientific) were combined in series. This allowed a better separation of carbohydrates and remaining tryptic peptides, while minimizing salt precipitation events encountered when a nanospray emitter was utilized directly after the FGC column. The mass spectrometer was operated in negative ion mode.
|0170| The monosaccharide compositions for the glycan precursors on MALDI-MS spectra were predicted using the GiycoMod tool considering mass accuracies bellow 10 ppm.
The possibility of neutral exchanges with Na+ and K+ was considered for sialoglyeans. The glycan structures were assigned based on nanoHPLC-PGG-H MS analysis considering: i) molecular monoisotopic mass; (ii) CID-MS/MS de novo sequencing; and (id) PGC-LC relative retention times, in particular, a2, 3-1 Inked and «2,64 inked sialylated /V-gl yeans were differentiated based on retention time (a2,6 < «2,3) (Kolarich et ah, "Isomer-Specific Analysis of Released N-Glycans by LC-ESI MS/MS with Porous Graphitized Carbon,” Methods m Molecular Biology 1321 :427-435 (2015), which is hereby Incorporated by reference in its entirety). For further validation, MS/MS fragmentation profiles were matched to glycosidic fragments calculated in si!ico on GlycoWork Bench (Cerorsi et ah,“GlycoWorkheneh: a Tool for
the Computer-Assisted Annotation of Mass Spectra of Glyearss,” journal of Proteome Research 7:1650-1659 (2008), which is hereby incorporated by reference in its entirety), General understanding of mammalian A-g!ycosylation was used to determine some structural aspects, yet some structural ambiguity remained in a subset of the reported V-glycans as indicated with brackets. A semiquantitlve approach was used to compare giycan compositions based on MALDI-MS assignments, taking Into account the monoisotopic peak intensity. Giycan standards and negative controls were analyzed in parallel. These results were validated based on the intensity of each specie on nanoHPLC-HRMS ion chromatograms (EIC) {m/z A 0.01).
[mil] Lipiclomks: sample preparation, mass spectrometry an data analysis. Equal amount of each sample (based on BCA quantification) was subjected to Hpidomic analysis. Samples were first sonicated with a Model Q700 QSonica sonicator equipped with an Oasis ISO Chiller (4°C; Amplitude, 95; process, 5 minutes: pulse-on 30 sec; plus-off 53 see), centrifuged at 14,800 rpm for 10 minutes at 4°C, and 50 isL of the extract supernatant was spiked with 2 pL 50 pg/mt infernal standard mixture (Cer 18:1/12:0; PC 12:0/12:0; PE 14:0/14:0; PG 14:0/14:0; PS 14:0/14:0), Subsequently, the samples were analyzed by using the Thermo Q-Exactive MS system (Bremen, Germany) in the Metabolomics Laboratory of Roy J. Carver Biotechnology Center, University of Illinois at Urbana-Champaign. Software Xcallbur 3,0.63 was used for data acquisition and analysis, The Dionex Ultimate 3000 series HPLC system (Thermo, Germering, Germany) was used, and the L€ separation was performed on a Thermo Aceucore C l 8 column (2.1 x 150 mm, 2.6 pm) with mobile phase A (60% acetonitrile: 40% HjG with 10 mM ammonium formate and 0, 1% formic acid) and mobile phase B (90% isopropanol: 10% aceont ile with 10 M ammonium formate and 0, 1% formic acid) and a flow rate of 0.4 mL/min. The linear gradient was as follows: 0 minutes, 70% A; 4 minutes, 55% A; 12 minutes, 35% A; 18 minutes, 15% A; 20 -25 minutes, 0% A; 26-33 minutes, 70% A, The autosampler was set to I 5°C and the column was kept at 45°C. The injection volume was 10 pL. Mass spectra were acquired under both positive (sheath gas flow rate, 50; aux gas flow rate: 13; sweep gas flow rate, 3; spray voltage, 3,5 kV; capillary temperature, 263 C; Aux gas heater temperature, 425 °C) and negative eleetrospray ionization (sheath gas flow rate, 50; aux gas flow rate: 13; sweep gas flow rate, 3; spray voltage, -2,5 kV; capillary temperature, 263 °C; Aux gas heater temperature, 425 °C). The full scan mass spectrum resolution was set to 70,000 with the scan range of /z 230 ~ m/z 1 ,600, and the AGC target was I E6 with a maximum injection time of 200 msec. For MS/MS scan, the mass spectrum resolution was set to 17,500, and the AGC target was 5E4 with a maximum injection time of 50 msec. Loop count was 10. Isolation window was 1 ,0 m/z with NCE of 25 and 30 eV. For data analysis, LipsdSearch (v.4, 1 ,30, Thermo) was used for lipid identification. The lipid signal responses were normalized to the
corresponding internal standard signal response, For those lipid classes without corresponding internal standard, positive lipid ion signals were normalized with the signal of lntemal standard Cer 18:1/12:0 and negative ion signals were normalized with the signal of intemal standard PG 14:0/14:0, The percentage of lipid classes within a sample was calculated by adding that of each of the individual molecular species quantified within a specific lipid class, and the relative abundance was represented by the mean percentage of 3 replicates for each group of samples. Differences among different subpopulations of particles derived from the same cell line were analyzed using A QVA test (q <0,05).
[0172] Nucleic acid analysis. DNA was extracted from rsanoparticles using the AM Pure
XP beads (Agenecurt) following the manufacturer’s protocol, An equal volume of nanopartides in PBS and lysis buffer At {QIAGEN) were mixed and incubated with Proteinase (20 pg /nil, QiAGEN) at 56“C for 10 minutes. The mixture was mixed with one volume of each, AM Pure beads, isopropanol and PEG solution (Beckman), and incubated for 5 minutes at RT, DNA bound to the beads was then separated from the solution/supernatant on magnet for 5 minutes at RT, The supernatant was removed by pipetting and bead-bound DNA was washed twice with freshly prepared 80% ethanol, then air dried for 5 minutes. Lastly, DNA was eluted from beads with nuclease free water and quantified using QuBit assay (Life Technology), DNA extraction was performed for two independent biological replicates of each sample,
f0!73f RNA was extracted using the Ambion mlrVama kit (Life techonology), following the manufacturer's protocol with one modification: one volume of nanoparticles in PBS was first lysed with 7 volumes of lysis buffer. The samples were analyzed using Agilent Total RNA Pico kits, RNA extraction was performed for two independent biological replicates of each sample. (0I74J Biodistribution assessment Fractionated nanoparticles were first labeled with the near infrared dye CellVue N IRS 15 (eBioscience) following manufacturers protocol- followed by washing with 20 ml of PBS and pelleting by ultracentrifugation at 100,000 x g for 70 minutes at 10 °C. 10 pg of labeled nanovasieles resuspended in 100 mI of PBS, or an equivalent volume of mock reaction mixture was retro-orbitally injected into naive mice (6- week-old female C57BL/6 mice purchased from Jackson Labs), 24 hours post injection, tissues were collected and analyzed using the Odyssey imaging system (LI-COR Bioselences), Two independent experiments with 3 animals per group were performed. No statistical method was used to predetermine sample size, The experiments were neither randomized, nor blinded. All animal experiments were performed in compliance with ethical regulations and in accordance with Weill Cornell Medicine institutional, IACUC and AAALAS guidelines, approved for animal protocol G7G9-666A,
/, Error bars in graphical data
SE . Statistical significance is determined using one way ANOVA. P < 0.05 was considered statistically significant. Statistical analyses were performed using Graph Pad Prism software.
For lipid class analysis ANOVA test (q <0.05} was performed using Qlucore Omies Explorer (Sweden). For proteomic analysis, proteins were sorted by signal-to-noise statistic, (mA - mB)/(aA + aB) where m and a represent the mean and standard deviation of proteomic expression, respectively. The cutoff to select fraction-specific markers was fold change >5, false discovery rate (FDR) <0,05, and mean protein expression >10* with the positivity in ¾8G% <i.e. at least 4 out 5 samples from 5 different cell lines for each subset of nanoparticles) of the corresponding fraction. For GSEA, Kolmogorov-Smimov statistic was calculated to evaluate whether proteins from a pre-determined pathway are significantly overrepresented towards the top or bottom of the ranked gene list (FDR q <0.25),
10176) Multiple AP4 analyses were performed for each cell line studied in this work: BI6-F I0, > 5 Ox (repeated times); AsPC-l, 9x; Pan02, I 6x; MDA-MB-4175 (4175), I 7x; and 4T L lOx. ΊΈM imaging analysis of fractionated particles were conducted for B16-F I0. 7x;
As PC- 1 , 3x; Pan02. 2x: 4175, l x; and 4T I , 4x. Four independent human melanoma specimens were analyzed using AF4 and two of them were analyzed by TESVf, Proteomic profiling of exomeres, Exo-S and Exo-L was performed on two biologically independent samples of each particle derived from five different cell lines (B 16-F IG; AsPC-i : Pan02; 4175: and 4TI). Western blotting validation of specific signature proteins of each particle subtype was done once (noted in the legend for FIG. I D). For /V-giycan study, lectin
 was repeated independently twice except for AAL and E-PHA bloting for B 16-FI G and 4175 which were done once (FIG. 8A). G!ycomic MS was performed on two biologically
independent BI 6-FI 0 samples and one sample of AsPC-l and 4175 (FIGs, 9B-9D).
Quantification of top 6 most abundant glycans was based on 3 independent analytical measurements of one experiment (FIG. 8C, FIGs. 9C and 9D). Silver stdned-PAGE analysis was repeated independently twice for BI6-FS0 and 4175 and once for AsPC-l (FIG. 9A).
NanoHPLC-PGC-HRMS was done once (FIGs. 9E-9I). Lipldomlc analysis was conducted on 3 biologically independent samples. DNA and RNA analyses of each particle subtype were repeated twice. Organ biodistribution analysis of each particle subtype was repeated 4x independently. NTA analysis was conducted using 3 biologically independent samples. TEM analysis as repeats d 3 times for AF4 peaks P I and P5 and once for HDL, IDL and VLDL

and samples kepi at e ther 4”C or i!C were repeated independently 3 times, cells of different passage numbers twice,
 versus nor oxic conditions was repeated with 3
different ceil lines independently AF4 and TEM analysis of particles isolated from the blank media control and CM of Bi 6-F 10 and 41 75 was done once (FIG. 2J and 2K),
versus nor oxic conditions was repeated with 3
different ceil lines independently AF4 and TEM analysis of particles isolated from the blank media control and CM of Bi 6-F 10 and 41 75 was done once (FIG. 2J and 2K),
|0177J Independent measurements of hydrodynamic diameters of exomeres, Exo-S and
Exo-L derived from different cell lines in batch mode were repeated (in the order of exomere, Exo-S and Exo-L): B 16- F 10 (n-lG, 9, and B independent measurements, respectively); Pan02 (ii 1 1, 6, 1 1); As PC ! ?:5i;S, 5, 5); 4175 (« 3, 5, 3); 4T! (« 5, 5, 5». Forzeta potential, independent measurements were repeated: B 1 -F 10 ( -8, 10, 12); Pan02 ( l 3, 1 1 , 13); AsPO l («*12, 12, 12); 4175 (^17, 9, 6); 4T1 (n 13, 3, 9). For stiffness, B! 6-F 10 (*R6, 6, 6); Pan02 ίq («~d, 6, 6); AsPC-1 (L*2 I , 1 , 16); 4175 P1 1, 10, 5); 4TI (H 9, 8, 9). For AFM imaging analysis of the height of exomeres: B 16F10 (ms?54 particles analyzed), AsPC ! («-475) and 4175 (m-160). AFM imaging of exomeres was repeated with samples derived from 3 different cell lines,
101781 For all experiments described above, ail attempts at replication were successful with similar results.
|0179| Data Availability, The datasets for proteomic analysis of exomeres, Exo-S and
Exo-L subpopulations derived from various cancer cell lines have been deposited,
(Q!8Q| Proteins that are uniquely associated with or among the top 50 most abundant proteins in exomere, Exo-S and Exo-L derived from different cancer cell lines are shown in Table ! below.


Gene set enrichment analysis (GSEA) of proteins associated with exomeres, Exo-S and ExoL derived from various cancer cell Hues are shown in Tables 3-5,


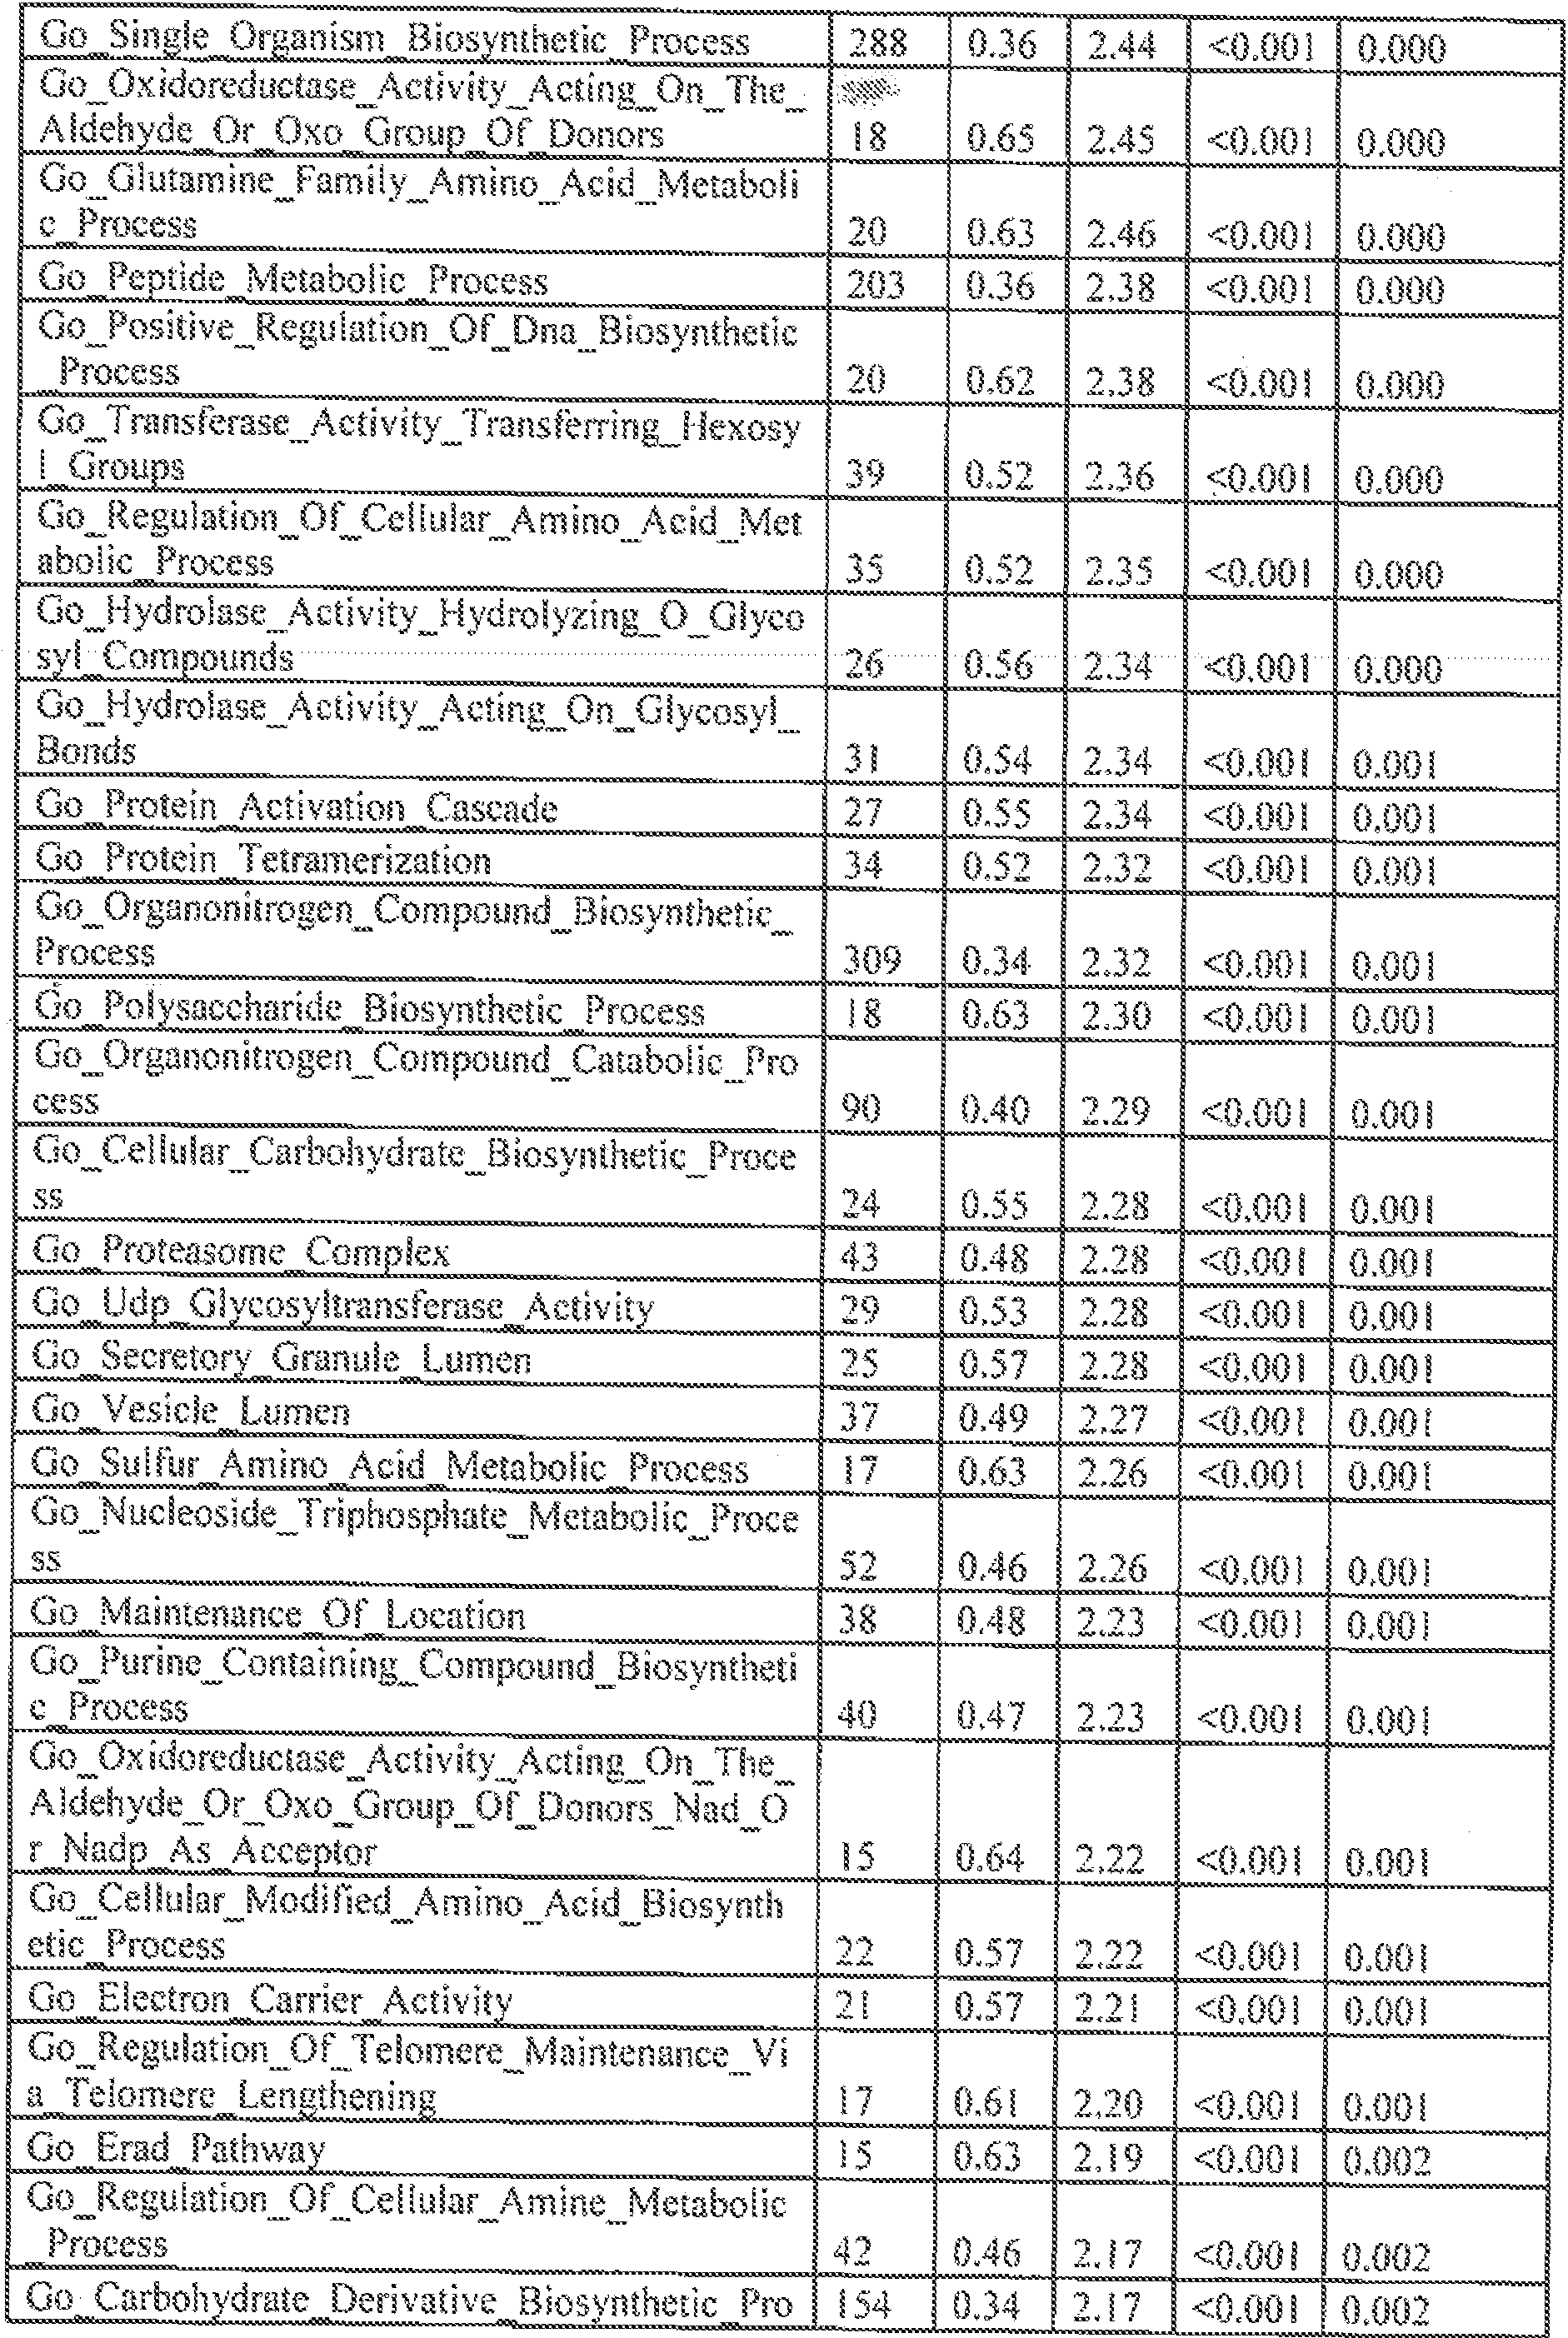


Table 4. GSEA for Exo-S


Lipid classes identified in exomeres and exosome subsets derived from different cell lines (raw data and normalized data) are shown in Tables 6-8.
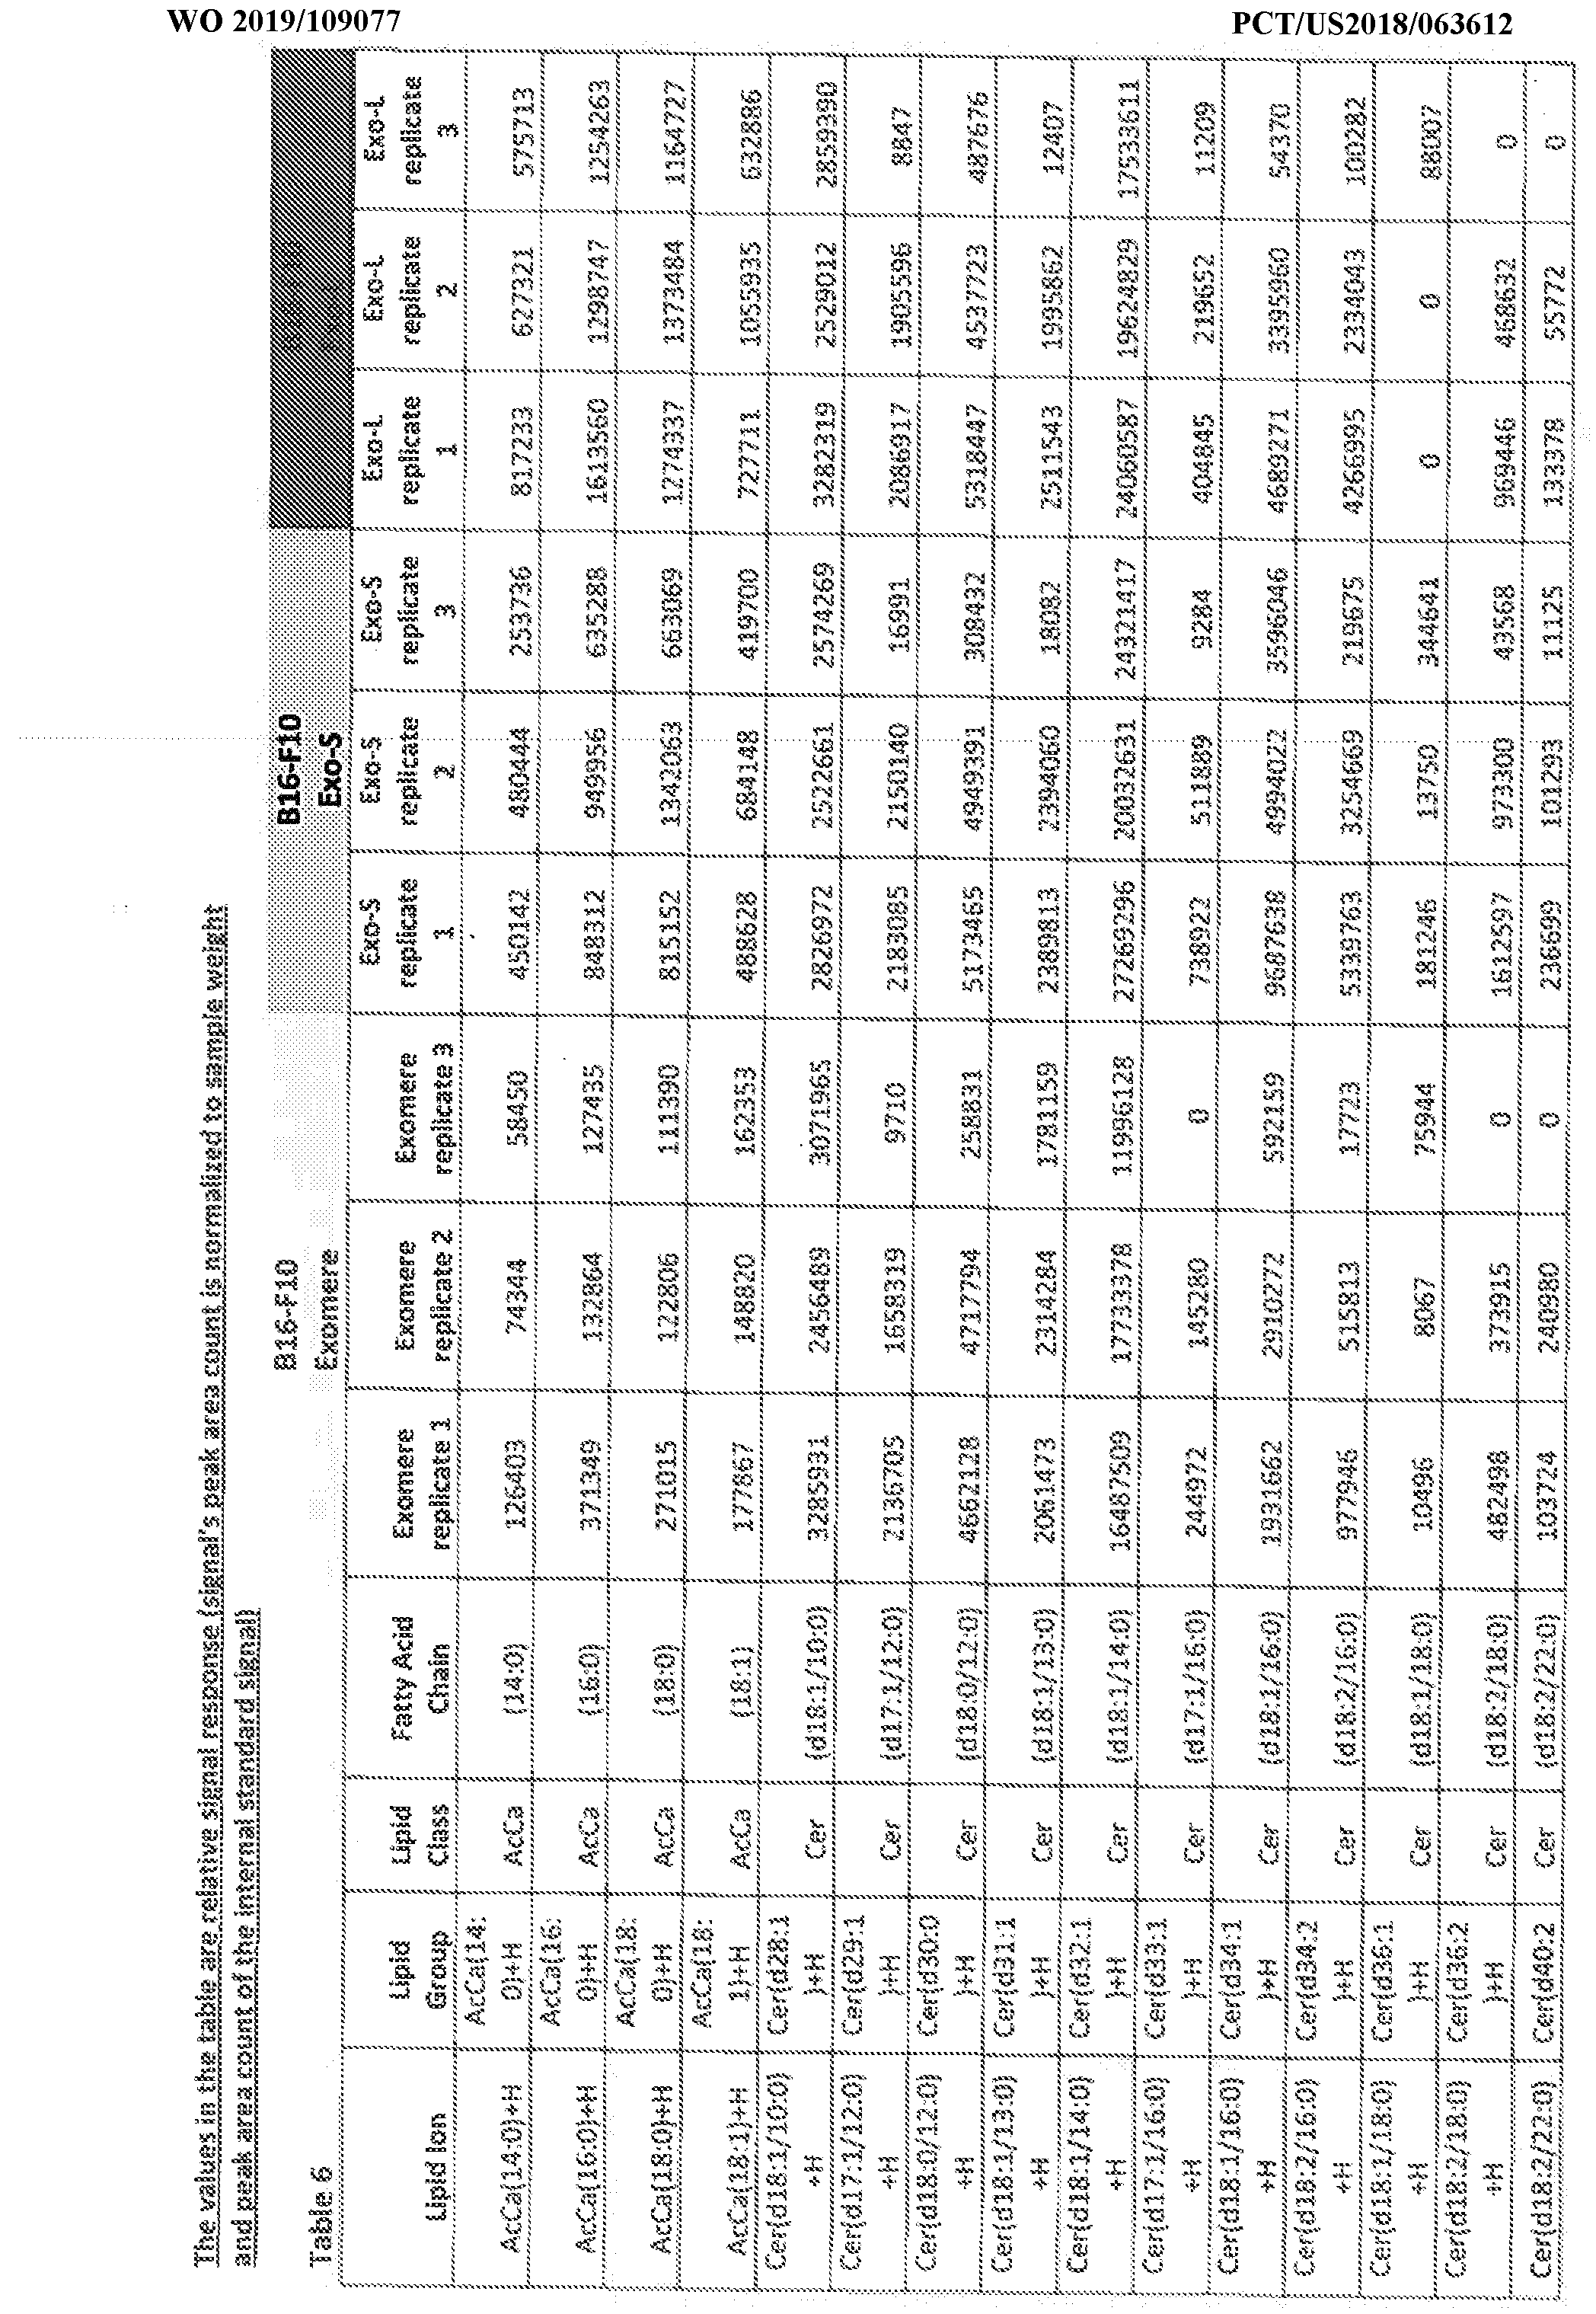
+
4·


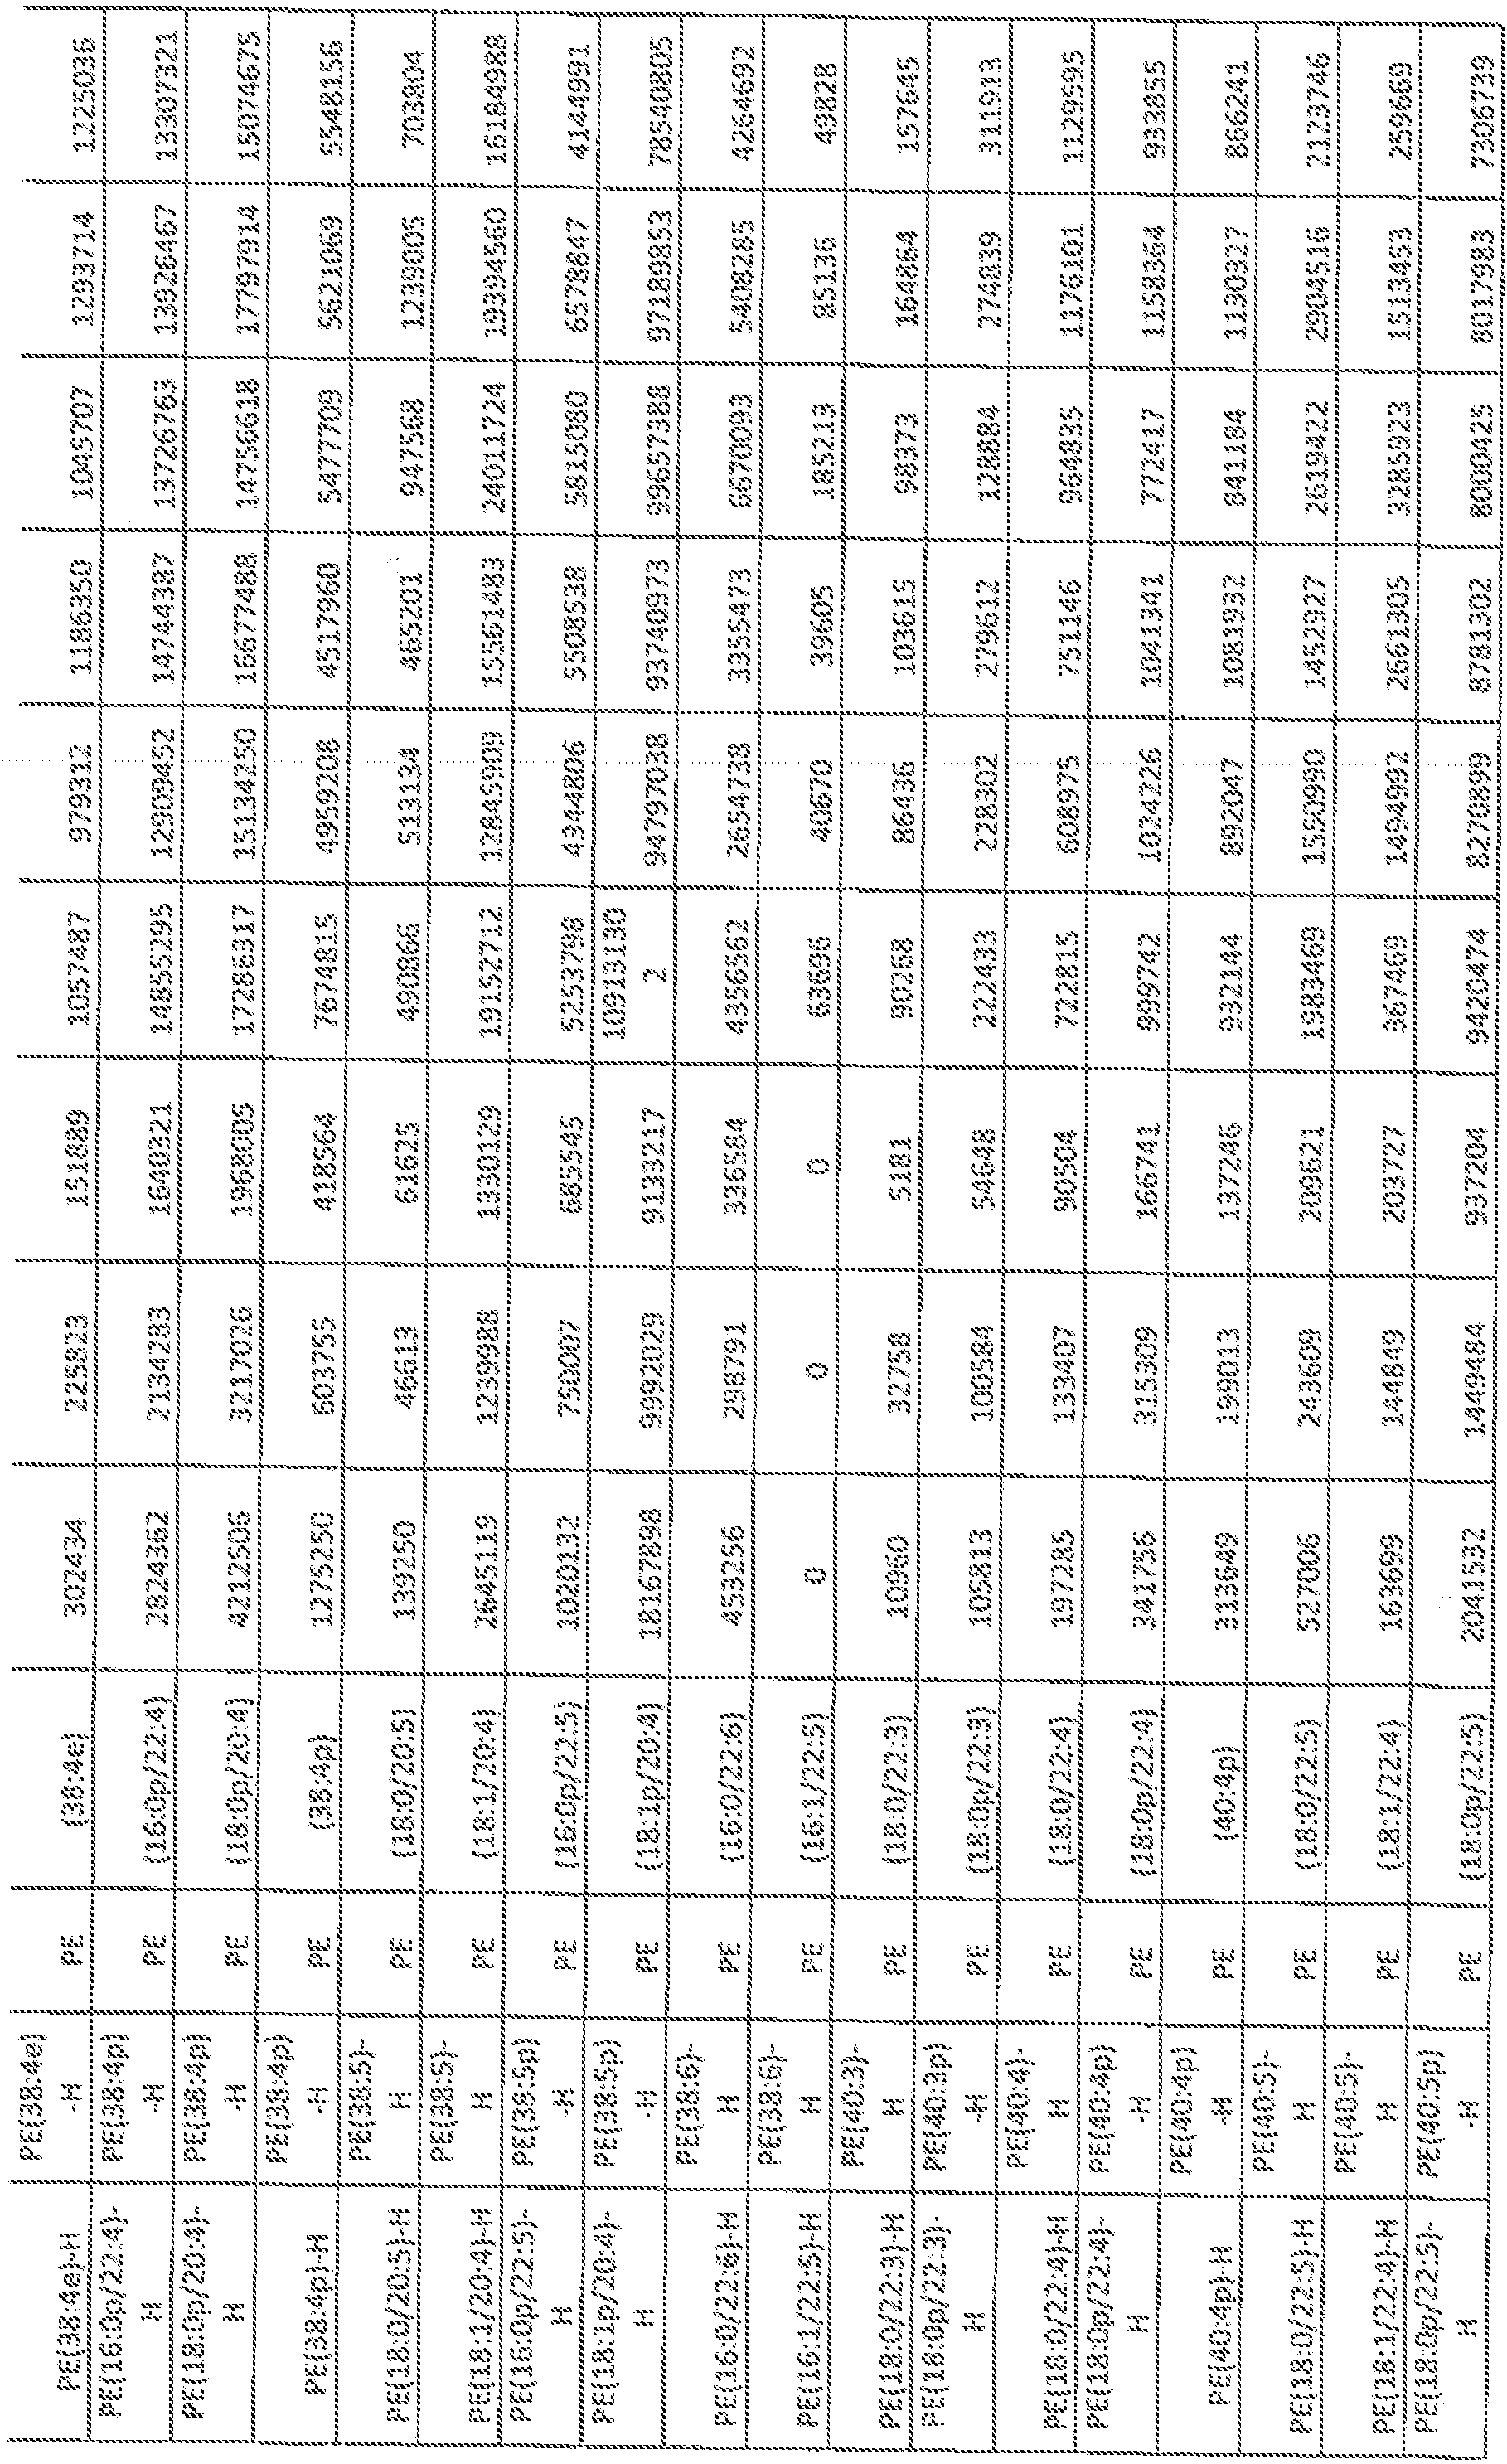


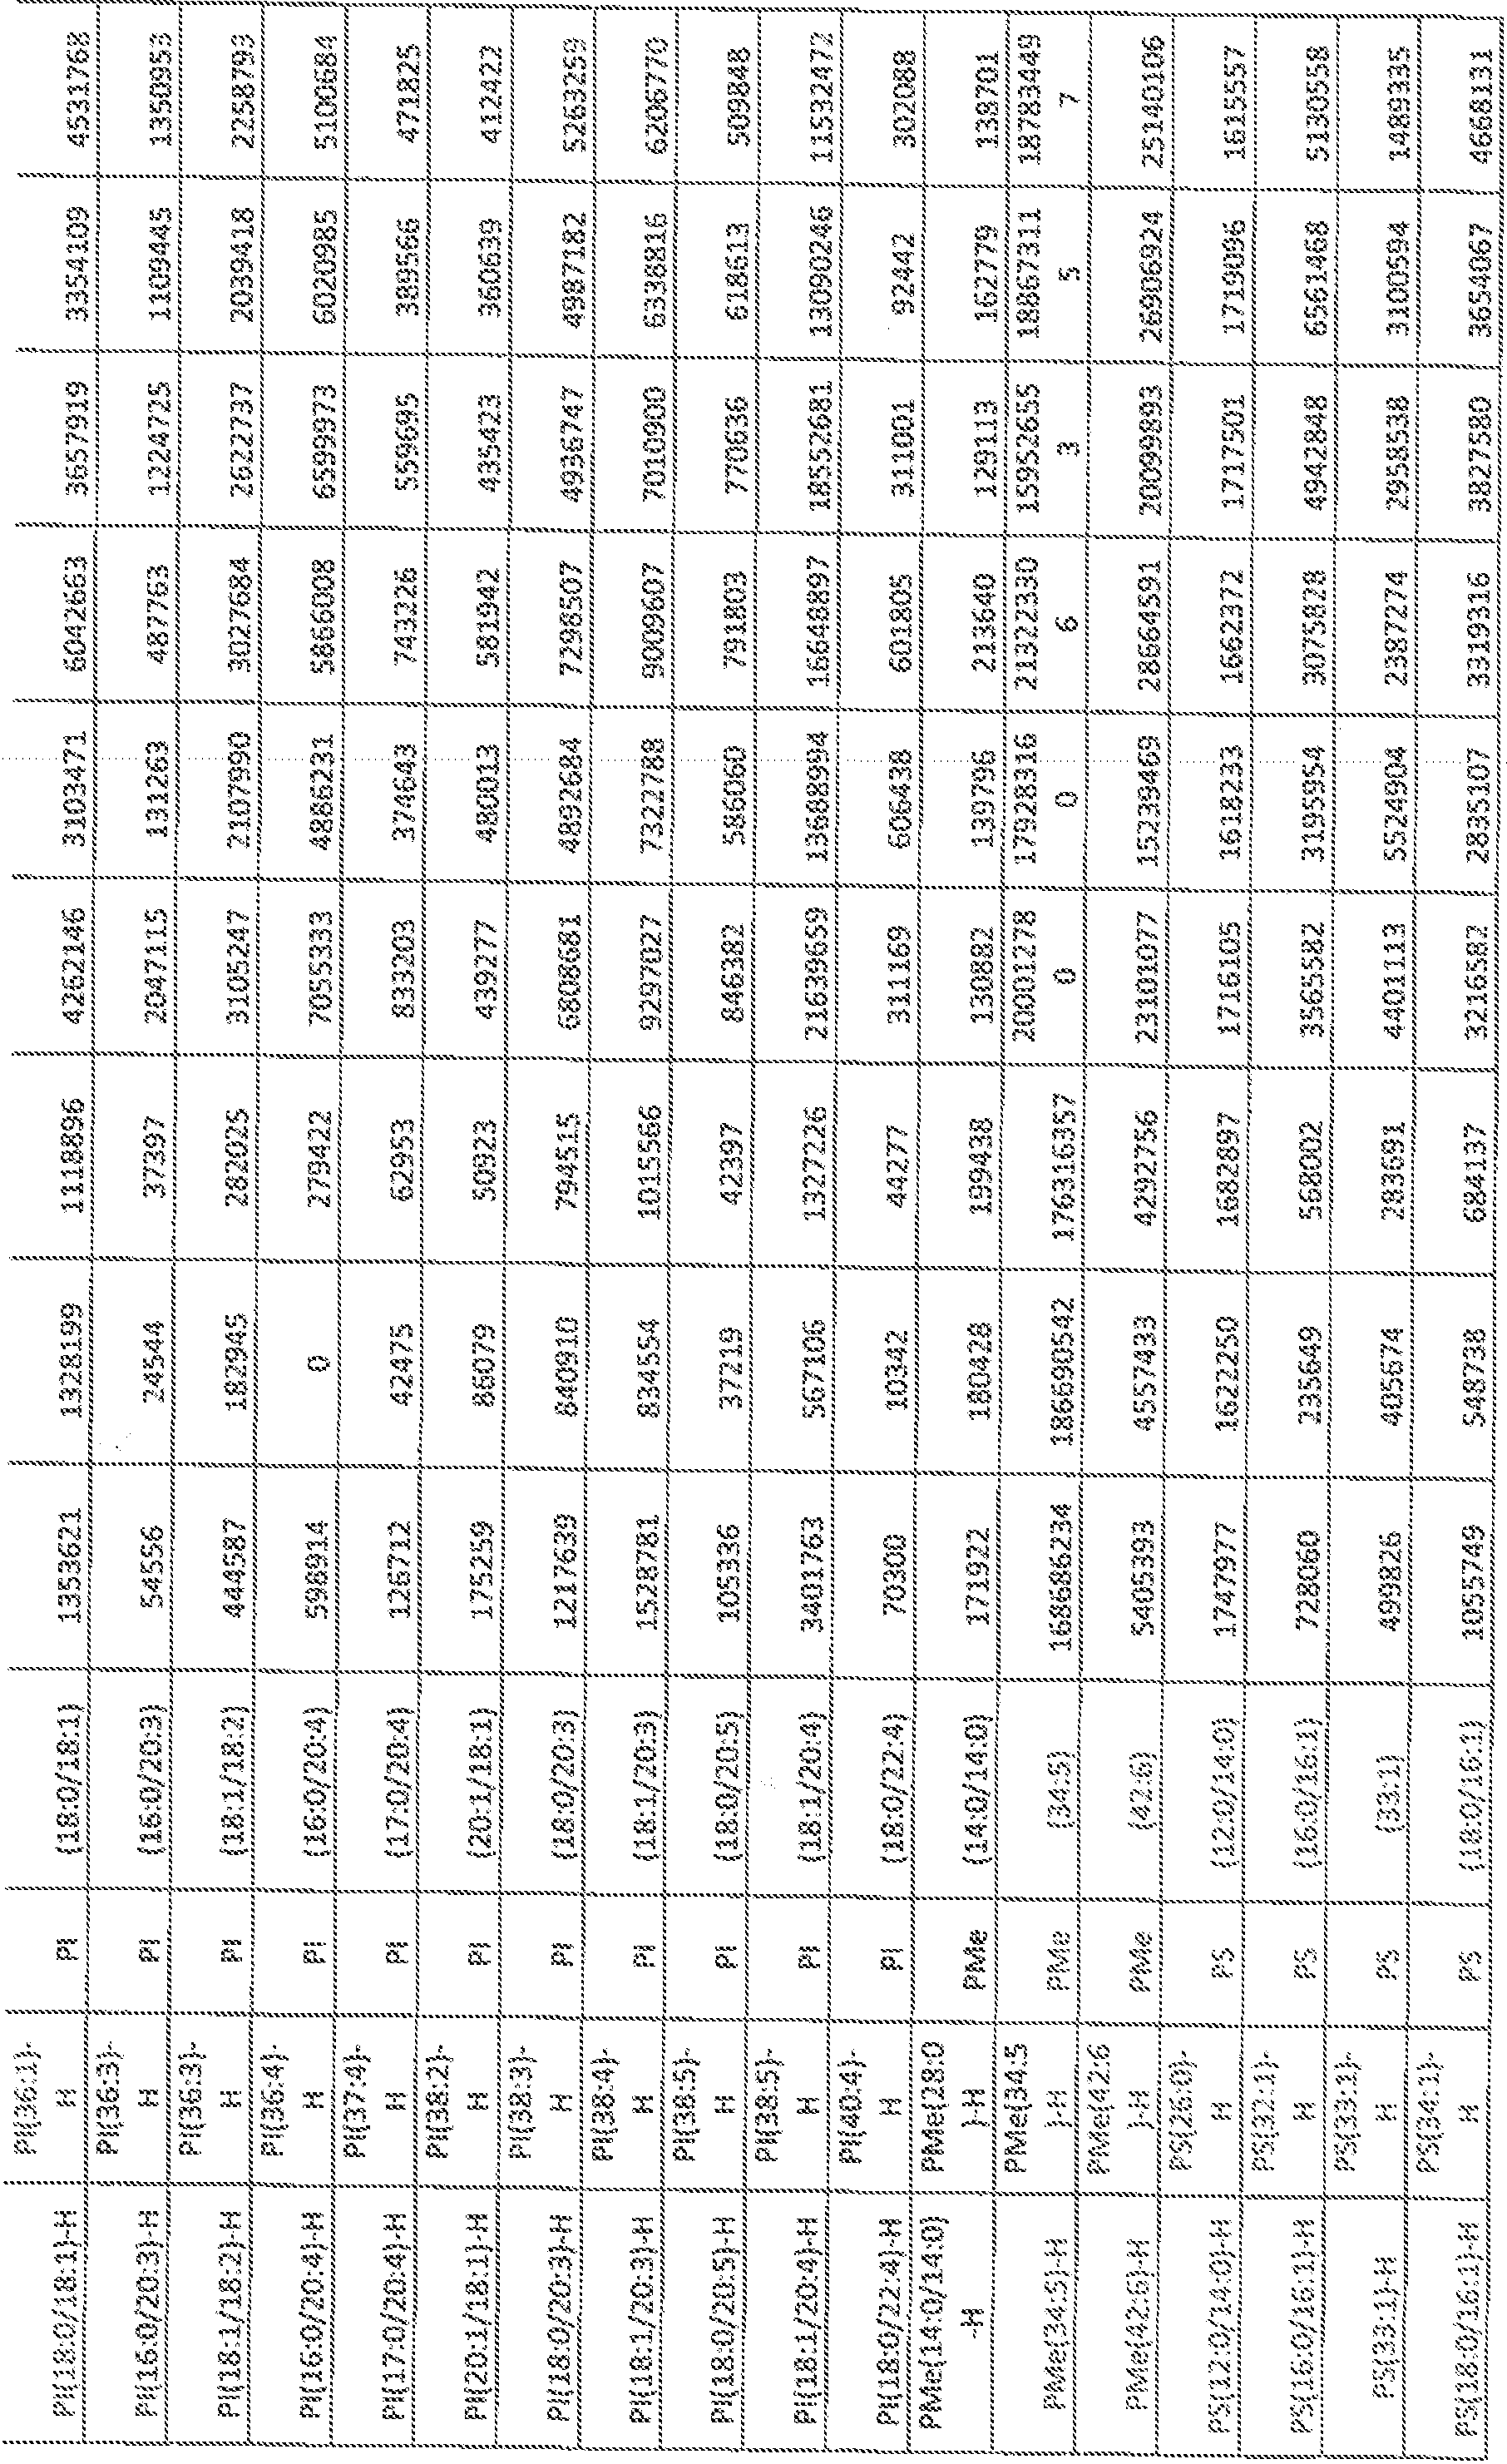


102


110


116


;


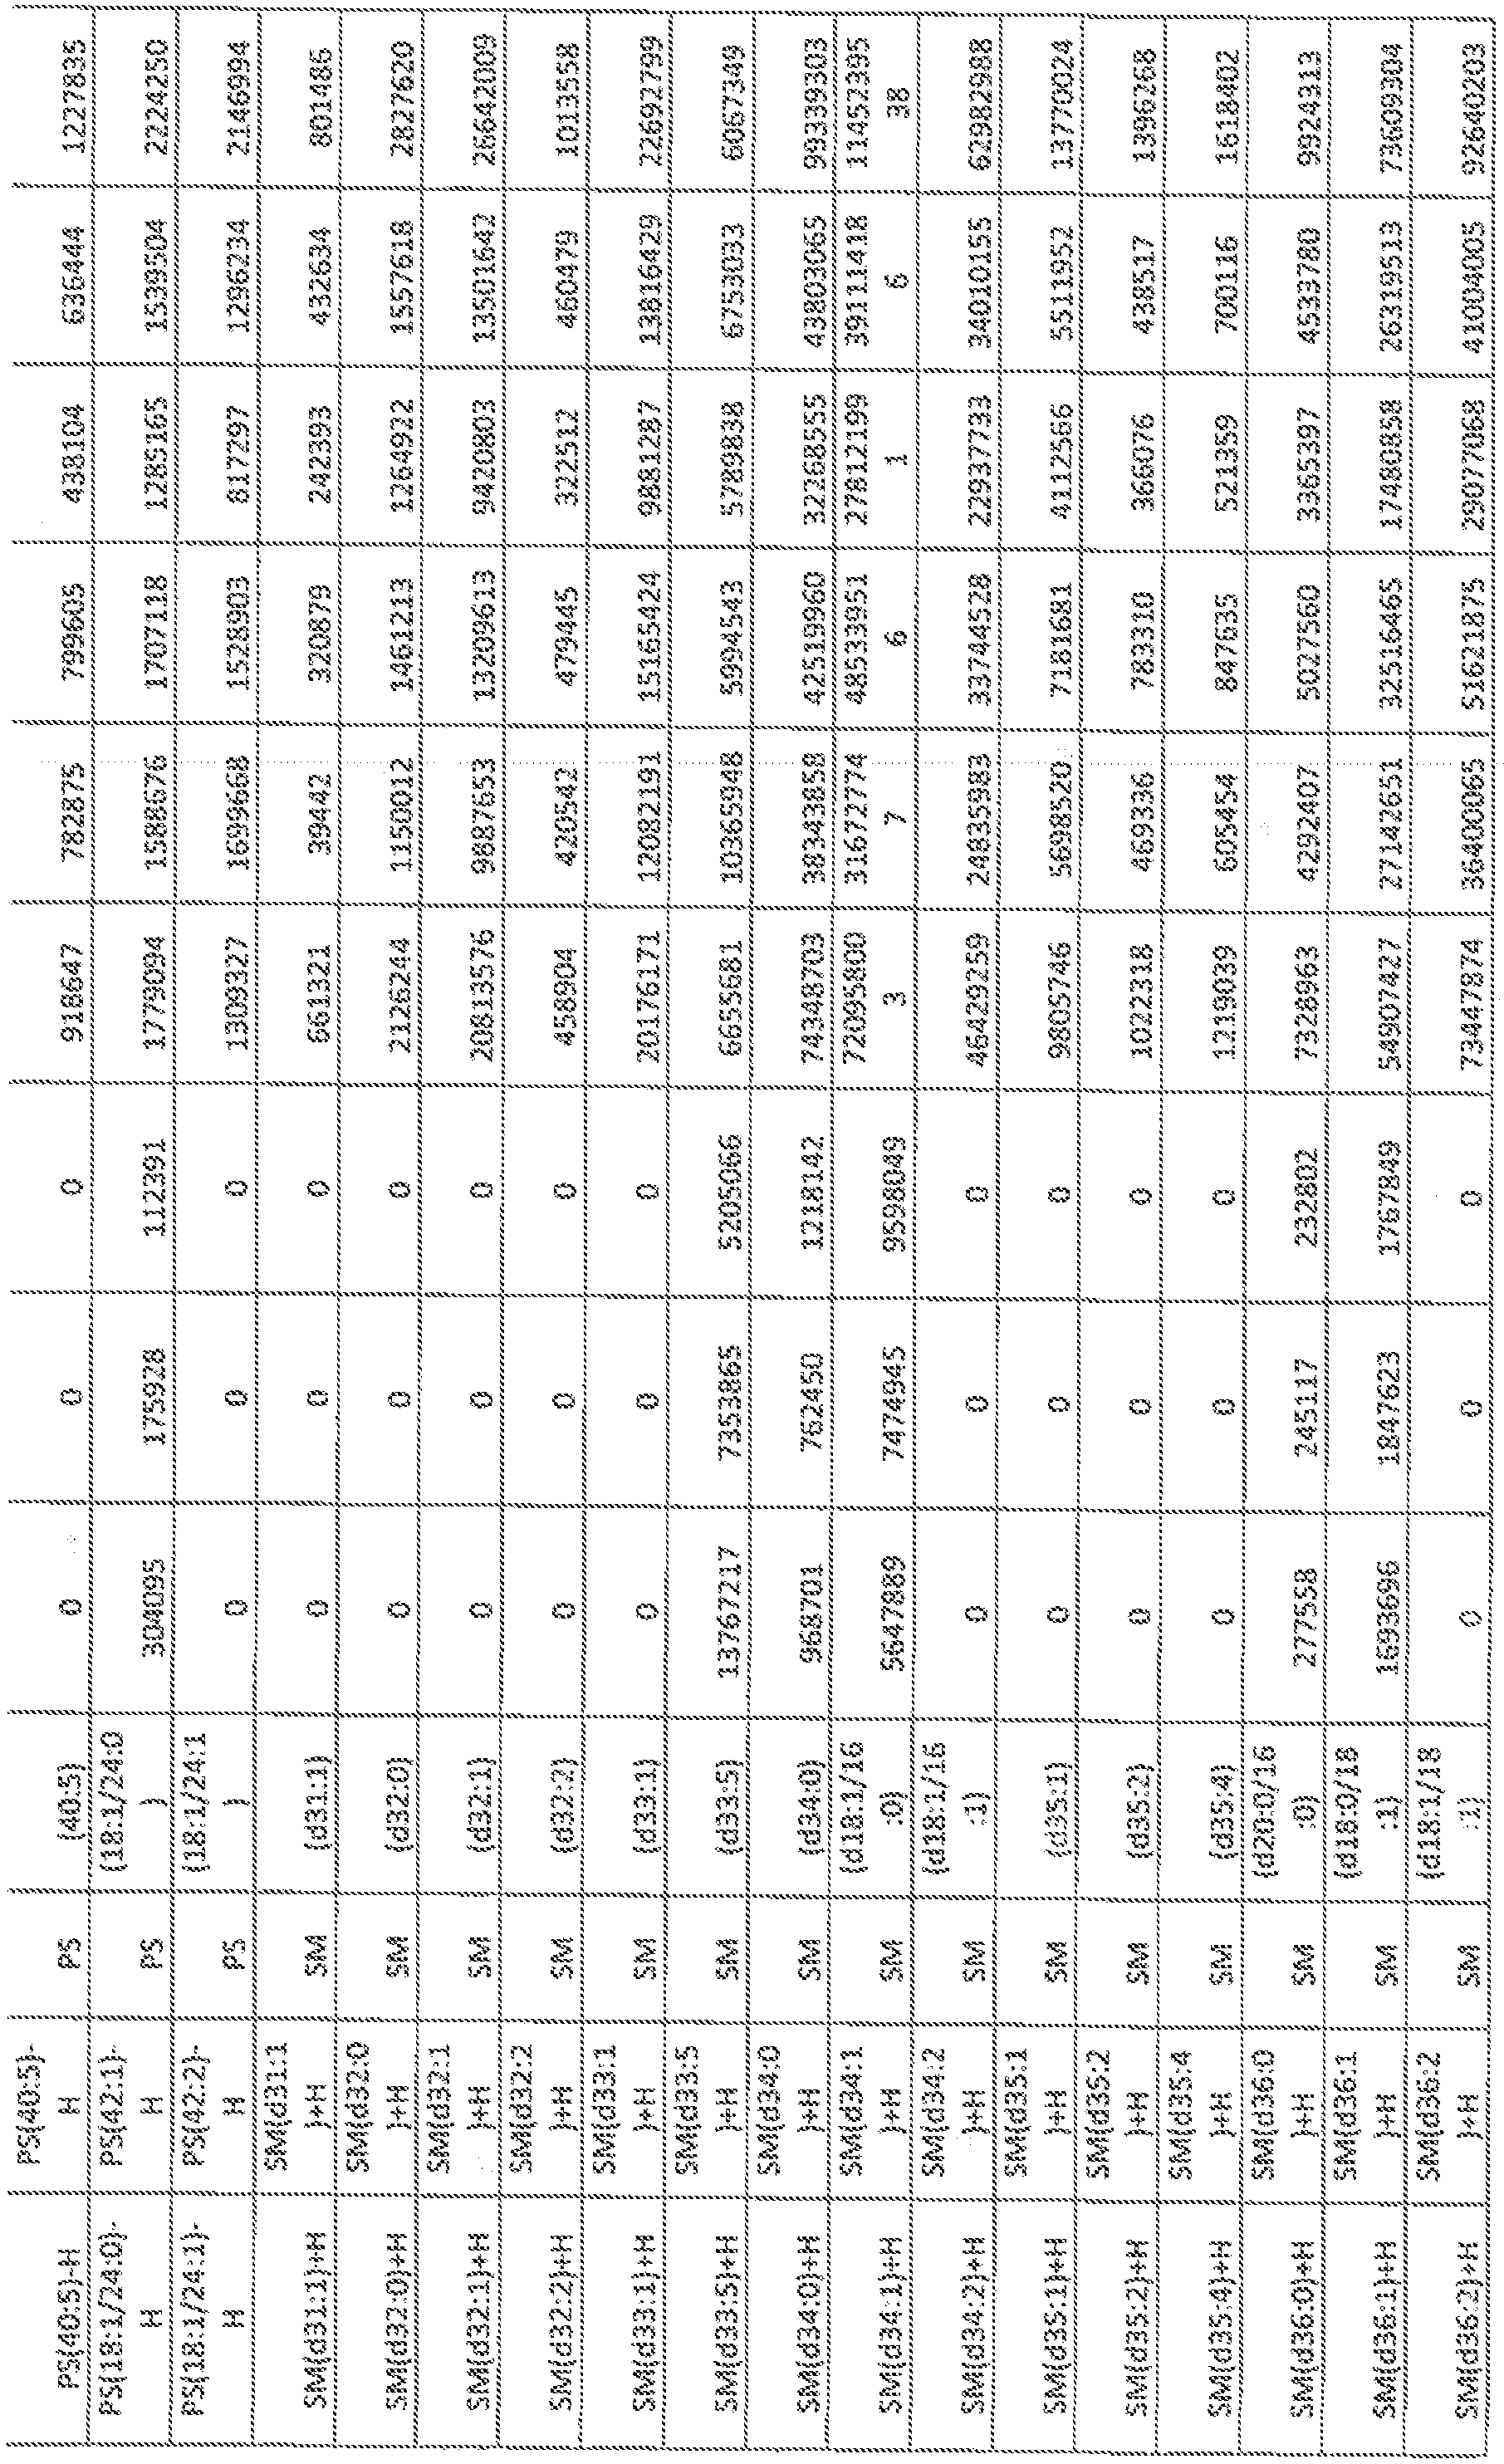


 1 - Identification of a Dist nct Manoparti c Population and Subsets of Exosomes
10182] B 16-F IG melanoma-derived sEVs were first fractionated by AF4 (see Methods).
5 A linear separation of the sEV mixture was achieved based on the hydrodynamic radius (black dots, Y axis) along the time course (X axis) (FIG. 1 A). The online QELS monitor for real-time dynamic light scattering (DLS) measurement (red trace) determined the hydrodynamic radius of particles. UV absorbance (blue trace) measured protein concentration and abundance of particles at specific time points for corresponding particle sizes. Particles with a 35-150 nm diameter
[0 were successfully separated by AF4 (FIG. I A). Five peaks (PI -PS) were identified,
corresponding to the time and particle size, at which most abundant particles were detected, PI represented the void peak, a mixture of all types of nanopartieles, PS was composed of individual or aggregated particles and protein aggregates with much larger sizes, which arc outside the separation range of the current AF4 protocol, and eluted when crossflow dropped to
15 zero (FIG. 2A), The hydrodynamic diameters of peaks P2, P3 and P4 were 47 n , 62 nm and 101 nm, respectively. To infer the hydrodynamic radius, correlation functions were fitted to single exponentials (FIG. 1 B, representative P3 fraction graph).
[CI183] Individual fractions were measured using Nanosight Tracking Analysis (NTA), validating consistent particle size for each fraction between 60 nm and 140 nm (FIG, 2B), DLS combined with AF4 showed a broader dynamic range than NTA for those particles with a smaller (-70 nm) or larger (-160 am) particle size (FIG, 2€), Moreover, NTA of each
Individual fraction in the range of 60- 160 nm revealed a monomodai profile with a peak of -77 nm (FIG, 2D).
[0184] Transmission electron microscopy (TEM) with negative staining of AF4 input and representative fractions across the full dynamic range revealed three populations of particles (P2, P3, P4; FIG, 1 A) with distinct morphology and size (FIG. 1C). P2 represented a distinct population of nanopartieles not previously described, which were smaller than 50 nm f-35nm) and clearly lacked an external membrane structure (FIG. 1C); these structures were therefore named“exomeresT The other two nanoparticle subpopulations are referred to as small
30 exosomes (Exo-S; 60-8Gnm [P3]) and large exosomes (Exo-L; 9G~! 20rtm [P4]) (FIG. !C), All three particle types were readily detected in the input TEM Image (FIG. 1C). Western blot analysis confirmed exosome markers Tsgl Oi and Alix for Exo-S and Exo-L, and heat shock protein 90 (Hsp9G) for exo ercs (FIG, 1 D), The sizes of each particle type measured In hatch mode showed consistent results (FIG. I E),
|®!8S| In summary, a single run of AF4 can efficiently discern exomeres and two distinct exosome subpopulations in a robust and highly reproducible manner (FIG, 2E, 2F). Freeze- thawing of samples led to inconsequential differences (FIG. 2G), However, changes In culture conditions led to differences in relative abundance of each particle type (FIG, 2H-2I),
|0!86] Importantly, only a minor peak eluted In the time range similar to exomeres in a blank media control compared to CM of B16-F10 and MDA-MB-4175 when processed in parallel (FIG, 2.1, 2K), thereby confirming that exomeres are indeed actively secreted by cultured cells and not mere aggregates present in media.
[0187] Using AF4, distinct particles were detected with diameters corresponding to exomeres and E o~S/L in more than 20 cell lines analyzed (Table 9, FIG, 3A), findings confirmed by TEM analysts of pooled fractions from selected cell lines (FIG, 3B),
Table 9


j Transformed Non-eancer cells | NIH3T3 I m j
1 1 ET2B J h j
Based o UV absorbance and TEM analysis, all cells secreted higher amounts of exomeres relative to Exo-S/L, except for BI 6-F10 and B16-FI where Exo-S were relatively more abundant (FIG, 3 A and FIG. 1 A, 1 B). Measurement of the hydrodynamic diameter of each of these particles using Zetasizer showed sizes similar to the B 16-FIQ preparations (FIG. 1 E).
(0188] Exomeres and Exo-S/L were also detected in AF4-fractlonated sEVs from CM of human melanoma tumor explants by TEM (FIG. I f, arrows; FIG. 4A). Exomere and Exo-S size, measured in batch mode using Zetasizer, was comparable to results from tumor cell lines (FIG, 1 G), AF4 profiling and TEM imaging analysis showed that the normal mouse tissue explants (mammary fat pad and lung) also secreted exomeres, and Exo-S/L nanoparticles (FIG, 4B).
Example 2 - Biophysical Characterization of Exomeres and Exosome Subpopalations [0189] Given the structural differences between exomeres and Exo-S/L, their biophysical properties, such as zefa potential and stiffness, were examined. Measuring zeta potential, an average surface charge, using Zetasizer, revealed all particles were negatively charged, with exomeres being the weakest negatively charged (-2.7 mV to -9.7 mV); Exo-L, the strongest (- 12.3 mV to -16.0 mV); and Exo-S, intermediate (-9.0 mV to -12.3 mV) (FIG, 5A).
[0190] For particle stiffness, atomic force microscopy (AFM) was performed in solution
(see Methods), Exomeres demonstrated the highest stiffness ( I4SMS16 mPa) and Exo-L the lowest (26-73 mPa), with Exo-S stiffness being intermediate (70-420 mPa),
[0191] AFM analysis of exomeres derived from B 16-F10, MDA-MB-4175, and AsFC-l cell lines demonstrated exomere structural heterogeneity and average exo ere heights of 5,9 nm, 7.0 n and 5.8 nm, respectively (FIG, 5C, 5D).
(0192] Collectively, these findings demonstrate the diverse biophysical properties exhibited by exomeres versus distinct exosome subpopulsiions. How size, charge, and mechanical properties influence the differential stability, trafficking and uptake of the nanopartides in vivo requires further investigation (Beningo et ak, "Fc-Receptor-Mediated Phagocytosis is Regulated by Mechanical Properties of the Target, 5‘ Journal ofCe!! Science 1 15:849-856 (2002); Key et ai., "Soft Discoidal Polymeric Nanoconstructs Resist Macrophage Uptake and Enhance Vascular Targeting in Tmwrs^ ACS Nam 9: 1 1628-1 1641 (2015), which are hereby incorporated by reference in their entirety).
Example 3 - Distinct Proteomk Content and Cellular Functions Among Exomeres and
Exosome Su bpopulntions
0193] To characterize the molecular composition of exomeres and distinct exosome subpopulations, proteomic profiling of nanoparticles derived from B 16-F ! 0, Pan02, 41' I , AsPC- 1, MDA-MB-4175 cells was conducted using label-free mass spectrometry, A range of 165-483 proteins were identified m exomeres, 433-1004 proteins in Exo-S, and 247-1 127 proteins in Exo- L. Moreover, unique proteins were detected In each nanoparticle subtype (FIG. 6A), suggesting exomeres are un que entities released by cells rather than debris or fragments of exosomes. |0I94] Examination of the subceliuiar localization annotation of proteins revealed the specific enrichment of Exo-S/L In membrane-associated proteins, which were relatively depleted in exomeres (Table 10), consistent with the structural studies identifying Exo-S/L as membrane- encapsulated particles and exomeres as non-encapsulated particles.


|0195] Principal component analysis (PCA) demonstrated closer correlation of protein expression for Exo-S and Exo-L compared to exomeres from the same cell-type (FIG, 7A). According to PCA and consensus clustering analysis, exomeres from different cell types exhibited a higher degree of similarity to each other than to Exo-S and Exo-L from the same cell type (FIG, 68, 6C).
[0196} To identify the signature proteins in each particle subset, statistical analysis was performed on the expression levels of proteins identified in these datasets. 64 proteins were pinpointed for exomeres and 99 proteins for Exo-S/L (Tables 1 1-14), with a false discovery rate (FD ) <0,05, positive enrichment in each particle subset of interest, and detection frequency of >80% (he., a particular protein was positively enriched in at least 4/5 samples for each subtype of nanoparticles derived from 5 different cell lines).


"inf stands for "infinity", indicating proteins that are absent in EXQ~5 or Exo-L

Table 12.


stands for“infinity”, indicating proteins that are absent in exomere.

Table 13


Remarkably, exomeres were significantly enriched in proteins involved in metabolism (see gene set enrichment analysis [GSEA] analysis below), including MAT! A, !DH I , GMPPB, UGP2, ECΊΊ , and PFKL. The sialog!ycoprote galect'm-3-bmding protein (LGALS3BP) and key proteins controlling glycan-mediated protein folding control (CALR) (Molinari et aL,
“Chaperone Selection During Glycoprotein Translocation into the Endoplasmic Reticulum,” Science 288:331-333 (2000), which is hereby incorporated by reference in its entirety) and giycan processing (MAN2AI, HEXB, GANAB) (Fukuda et ah,“Incomplete Synthesis ofN- Giyeans in Congenital Dyserythropoietic Anemia Type 11 Caused by a Defect in the Gene
Encoding Alpha-Mannosidase I !,” Proc Not cad Sci USA 87:7443-7447 ( 1990); Yang et ah, “An Intrinsic Mechanism of Secreted Protein Aging and Turnover," Proc Nail Acad Sci USA 1 12:13657-13662 (2015); Martiniuk et ah,“Identity of Neutral AIpha-Glucosidase AB and the Glycoprotein Processing Enzyme Glueosidase II. Biochemical and Genetic Studies,” The Journal of Biological Chemistry 260:1238-1242 (1985), which are hereby incorporated by reference in their entirety) re also enriched in exomeres, suggesting exomere cargo may mediate the targeting of recipient ceils through spec fic giycan recognition and modulate glycosyiation in recipient cells. Among proteins uniquely represented in Exo-S/ L were annexing, ESC T components (charged multivesieular body proteins/CHMPs, vacuolar protein-sorting proteins, HGS, Alix!/PDCD6IP, and Tsg!O! ), Hsp4G (DnaJ) fam ly proteins, signaling transducer G protein subunits, integrins, Rab proteins, and solute carrier family members. Members of key signaling pathways, such as JAK 1 , TGFBR2, and MET, were also enriched in Exo-S/L. To evaluate the unique markers of Exo-S and Exo-L suhpopu!atlons, protein expression was compared between these two sample sets and exomeres separately using t-test, A second set of filters (protein intensity /area > 10s and fold change >5.0} was applied to the identified signature for exomeres and Exo-L, but not for Exo-S (FIG. 6D), Fewer signature proteins were identified for Exo-S compared to exomeres and Exo-L, most likely due to similarity of Exo-S to the other particles. Representative signature proteins identified by proteomlcs in each subset were validated by western blot analysis (FIG. 6E).
|0I97| These profeomle datasets were further mined for conventional exosome markers, including flotillms, CD9, CD63, CDS1 , A!ix L TsglO L HSC70 (HSPA8) and Hsp90 (FIG, 6F), Among the five cell lines, flotillins (PLOT I and FLGT2) represented bona fide markers of Exo- S, while HSP90ABI was preferentially associated with exomeres. Although CD9, CD63 and CD8I all demonstrated specific association with Exo-S/L subsets, they all showed a cell type-
and particle-dependent preferential expression. Consistent with owa! et ah,’'Proteomic Comparison Defines Novel Markers to Characterize Heterogeneous Populations of Extracellular Vesicle Subtypes,” Free Nail Acad Sd USA 1 13:E968 977 (2016), which is hereby incorporated by reference in its entirety, combining CD63, CD9 or CD81 will be necessary to isolate/label exosomes,
|(H98] Numerous Rab proteins were found in Exo-S/L subsets, but few of them in exomeres (FIG. 7B), suggesting critical rales of Rab proteins for Exo~S/L formation and trafficking, but not for exomere biogenesis,
|01 9j Next, the most abundant proteins in each subset of nanoparticles were examined.
Hemoglobin, histones, xytosketeton proteins (actios and tubulins), peptldyipro!yl i some rase A (PPIA) and HSP ranked as the most abundant top 50 proteins in all three nanoparticle
subpopulations (Table !), Hsp40/DnaJ family (F13P7G co-chaperones) members were also found in the top 50 proteins for Bxo-L, Interestingly, HSP90AB I was preferentially packaged in exomeres, while HSP70 members (HSPA8, HSPA2 and HSPA5) were more abundant in Exo- S/L, Other proteins relatively enriched in exomeres included inter-alpha-trypsin inhibitor heavy chain family members (ITt!-i), gelsolin (GSN), talin 1 (TL ! ), WD repeat domain 1 (WDRI ), and proteins involved in metabolism, such as phosphoglycerate kinase I (PGK I ), pyruvate kinase muscle (PKM), and eno!ase 1 (ENOS ). Consistent with the analysis above, SDCBP, PDCD6IP/Alix, tetraspanins (CD9, CD63, CD81 and others), G protein family proteins and integrins were highly represented In both Exo-S and Exo-L, Tetraspanins were preferentially enriched in Exo-S while G proteins and integrins were more prominent in Exo-L, Eukaryotic translation elongation factor i alpha 1 (EEF ! A! ) was most often present in exomeres and Exo-L. Other proteins preferentially associated with Exo-S included immunoglobulin superfamily member 8 (IGSF8) and its para!og prostaglandin F2 receptor inhibitor (PTGFRN), milk fat globule-EGF factor 8 protein (MFGE8), and components of the ESCRT-l complex. Notably, annexins and SI 00 proteins were only represented in the top 50 proteins of Exo-L,
10200] Furthermore, to exclude the possibility of lipoprotein contamination in exomeres, proteins that are typically associated with purified lipoprotein particles (high-, low-, and very low-density lipoproteins, be,, HDL, LDL, and VLDL) were examined by proteomic MS analysis and then evaluated their presence in exomeres and Exo-S/L. Much fewer proteins were found in lipoproteins (Table 2) and only some of these proteins were detected m exomeres and Exo-S/L, suggesting most nanoparticle proteins are distinct from lipoproteins. A rough estimation showed that the lipoprotein-associated proteins account for 0-8% of total nanopamcle proteins (FIG. 7€), Moreover, EM analysis revealed that lipoprotein morphology/structure was clearly distinct from
exomeres and Exo-S/L (FIG, 7D). Taken together, these analyses ruled out the possibility that exomeres were mere lipoprotein contaminants.
|0201 ] The possible contamination of exomeres with other types of protein complexes with high molecular weights was also ruled out when ex o mere proteins were surveyed for subunits of known complexes. The co-existence of multiple subunits of protein complexes of similar size to exomeres were not detected (Table 2) except for 10 out of 59 subunits of Parvulin- associated prc-rRHP complex in 4TI exomeres, 17 subunits of ribosomes in AsPC-l exomeres, and 7 out of 16 subunits of Kinase maturation complex I in MDA-MB-4175 exomeres.
However, these proteins account for only 1 ,8%, 2, 1 % and 1.8% of total exomere proteins in each case, respectively, suggesting their contribution diminishes the purity of exomeres by -2%. (02021 To gain insight into the function of these particle subsets, GSEA was conducted utilizing gene ontology (GO), Kyoto Encyclopedia of Genes and Genomes (K.EGG) and hallmark databases (Tables 3-5). Strikingly, GSEA demonstrated that exomere-specific proteins were selectively enriched in metabolic processes, including carbohydrate metabolism, protein synthesis, and small-molecules. At least 36 of the top 50 "GO-biological processes’- pathways identified metabolic processes associated with exomeres in contrast to no metabolic processes associated with Exo-S/L (Tables 3-5), Genes encoding proteins involved in hypoxia, microtubule and coagulation were identified In exomeres (FIG. 7E), Exo-S were enriched in membrane vesicle biogenesis and transport, protein secretion and receptor signaling gene sets. For Exo-L, enriched gene sets included mitotic spindle, IL-2/StatS signaling, multi-organism organelle organization, and G-protein signaling. Profiles of top rank gene sets enriched in exomeres (glycolysis and rnTOIlC I signaling), Exo-S (endosome and protein secretion) and Exo-L (mitotic spindle and IL 2/Stat5 signaling) are displayed in FIG, 6G,
Example 4 - Distinct L'-glyean Profiles of Exomeres and Exososne Subpopulatious
(02031 Aberrant glycosylation is involved in pathological processes, including cancer
(Pinho et ah, "Glycosylation in Cancer: Mechanisms and Clinical implications,” Nature Reviews Cancer 15:540-555 (2015), which is hereby incorporated by reference in its entirety). Here, the aim was to determine the A-glycars profiles of each particle subset in three cell lines by conducting lectin blotting analysis (FIG, 8 A) and glycomic mass spectrometry,
[02041 E-PHA recognizing bisected iV-g!ycans detected a major band at approximately
75 kDa in both Exo-S and Exo-L of B 16-FI 0 and AsPC- i, with faint detection in exomeres across the three celi lines and Exo-S of MDA-MB-4175, E-PHA detected a high molecular- weight glycoprotein (240 kDa) in MDA-MB-4175 exomeres and a high molecular weight
glycoprotein ( 150 kDa) in AsPC- 1 and MDA-MB-4 175 exomeres, L-PHA recognizing branched A-glycans detected a predominant band at 75 kDa in both Exo-S and Exo-L of B ! 6F- 10 and AsPC-i . Multiple bands ranging from 50 to 70 kDa were also detected in ail exomeres (especially MDA-MB-4175), Using AAL, analysis of structures related to fucosylation (fucose linked a -1 ,6) to GlcNAc or fucose linked (a -1 ,3) to GlcNAc related structures revealed two abundant glycoproteins between 70 and 100 kDa in both Exo-S and Exo-L of B I 6-F10 and AsPC- 1 , Exomeres across all three cell lines and Exo-S of MDA-MB-4175 displayed strong fucosylation on high molecular-weight glycoproteins (200 -280 kDa). SNA, recognizing a-2,6- linked sialic acid, detected the presence of high molecular-weight a-2,6-$iaiylated glycoproteins (200- 250 kDa) in all exomeres. Moreover, a low molecular-weight protein (-60 kDa) displaying a-2,6~Unked sialic acid modification was uniquely detected In Exo-L (but not Exo-S) from B i 6-Fi 0. For AsPC- 1 , exomeres were the major carriers of sialylated glycoproteins, while these sialylated structures were almost absent in Exo-L. Lectin-binding profiles did not overlap with the most abundant proteins In the SDS-PAGE gel, indicating the specificity of lectin recognition independently of protein abundance (FIG, 9 A), Therefore, Exo-S and Exo-L versus exomeres display distinct /V-glycosy!ation patterns. Notably, exomere and Exo-S L-associated A'-glycan profiles vary by ceil type. Future studies will address the identity of these
glycoproteins via g!ycoproteomic approaches.
J02Q5j The next aim was to identify profiles of the gi can structures enriched in each particle subset by MALDl-TOF mass spectrometry (MS), Two independent, semi-quantitative MS analyses were conducted on B 16-F 10-derived exomeres and Exo S/L (FIG. SB). FIG. 8C depicts the quantification of the top six most abundant jV-glycan structures detected in one of the representat ve experiments. The ubiquitous expression of certain complex AAg!ycans was observed in ail subsets, corresponding to peaks at m/z 2209.8, 2223.7, 2237.7 and 2365.5, Specifically, a complex M-glyean at m/z 2015.7 and a hybrid Af-giycan at m¾ 2404.8 were enriched in exomeres. Moreover, four of these six N-gl yeans contained sialic acid, and three of six were fucosyiated. Similarly, the ions m/z 2015,7 and 2404, S were enriched in exomeres from MDA-MB-4175 (FIG, 9B, 9D), The ion m/z 2404,8 was slightly enriched in AsPC ! exomeres, but the lots at m/z 2015,7 was not detected in AsPC- 1 samples (FIG, 9B, 9C). Instead, the ion at m/z 2012,7 was strongly detected in AsPC I exomeres and Exo-S. Two other ions, at m/z 2 P 7,7 and 2389.9, demonstrating Exo-S enrichment, were detected in AsPC- 1 only (FIG. 9B, 9D), |02Q6| High-resolution MS analysis allowed further structural characterization of certain
L-glyeans (FIG, 9E-9J). This was the case of extracted ion chromatogram m/s P 1 1 ,39 (2-) and 1007,38 (2-) (corresponding to m/z 2223.7 and 2015.7 in Figure 4c, respectively), in addition,
the combination of OD-MS/MS de novo sequencing and PGC-LC relative retention times for extracted ion chromatogram 1 1 1 1.39 (2-) revealed that this A-giycan from exomeres contained both «2,3 -linked and a.2, 6-1 inked sialic acids, whereas the giycan from Exo~S contained exclusively «2,3-1 inked sialic adds. The unique presence of m/z S 007,38 (2-) in exomeres was also further confirmed.
|0207| Taken together, the giyeomics study demonstrated the prevalence of complex AA g! yeans in all particle subsets with relatively high levels of sialylation, consistent with previous findings of complex A-glycans and sialoglyeoproteins in tumor rmcrovesides/exosomes (Escrevenie et al, "‘Sialoglyeoproteins and -glycans from Secreted Exosomes of Ovarian Carcinoma Cells,” PbS One 8;e?8631 (2013); Batista et ah,“Identification of a Conserved Giycan Signature for MIcroveslclesA Journal of Prof some Research 10:4624-4633 (201 1); Saraswat et ah, *‘N-I inked (N-) G!ycoproteomics of Urinary Exosomes,5 Molecular & Cellular Proteomics 14:263-276 (2015), which are hereby incorporated by reference in their entirety), Furthermore, the study revealed differences in jY-glycan composition and structures among exomeres, Exo-S, and Exo~L.
Example 5 - Distinct Lipid Composition Among Exomeres and Exosome Stibpopwiaiiotss
|0208] To investigate the lipid composition of each subset of particles, quantitative lipldomics was performed on these nanopartieles derived from B16-F10, MDA-MB-4175 and AsPC-S . By lipid MS, it was found that Exo-S and Exo-L contained more lipids than exomeres for all cell lines (FIG, I DA, >5x fold in all subpopulations, except for Exo-S of MDA~MB~4 I 7S (>3x fold)).
j0209j Eighteen lipid classes were commonly identified in all samples (Tables 6-8, FIG,
10B), and their relative frequency in each sample was compared. Phosphatidylcholine (PC) was the predominant lipid component in all subpopulations (46% - 89%) except for As PC- 1 exomeres (13%) (FIG. 10B), which contained higher levels of d!g!yceride (DG, 38%) and triglyceride (TG, 26%) instead. Other phospholipids, including phosphatidySethanolamine (PE) and phosphatidylserine (PS), accounted for 2-6% of total lipids in Exo-S/L across all cell lines (FIG, 10B), However, PE and PS levels were lower in exomeres from MDA-MB-4175 and AsPC-l , but similar to Exo-S/L in 8 I6-F 10 (FIG. 10B, I OC). Phosphatidyl inositol (PI) levels were lower titan other phospholipids but had a pattern of distribution across nanoparticle subsets similar to that of PE and PS (FIG. 10B, 10C), Sphingomyelin (SM) accounts for 2-10% of the
total lipid in all samples except for AsPC-l Exo-S/L, which contained a higher level of SM (28%, FIG. 10B, 10C). Cholesterol data were not collected in this study,
(§210) The relative levels of ceramlde (Cer), TG and lysophosphatidyiglycerol (LPG) varied significantly between exomeres and Exo-S/L across cell lines (ANOVA test, q<0.05). Additionally, simple glycosphtngolipid CerG2 and mitochondrion-specific eardioiiplrs (CL) were more abundant in exomeres of B I6-F 10 and MDA-MB-4175 compared to exosome subsets. In contrast, CerG2 and CL were more abundant In Exo-S/L compared to exomeres isolated from AsPC-l cells. Monoglyceride (MG), phosphatidylglycerol (PG) and !ysophosphatidylcholine i I .PC) were more abundant In exomeres than in Exo-S/L from MDA-MB-4175 and AsPC-l , but present at equal levels in all three BI 6-F10 nanoparticle subsets. Lastly,
lysophosphatidy!ethanolamirte (LPE) was detected at higher levels in Exo-S/L from Bi 6-F IG and MDA-MB-4175, but not from AsPC-l . Thus, the study revealed cell type-dependent differences in the total lipid content and composition among distinct nanoparticle subsets.
|02!1| Collectively, these biomformatse analyses of the proteo ic content of each panicle subset revealed the predominant link between exomere-associated proteins and metabolism and the link between Exo-S/L-assoeiated proteins and multiple signaling
transduction pathways, including biogenesis-related ESCRT complexes,
Example 6 - Distinct Nucleic Add Content Among Exomeres an Exosome
|Q2!2| Since dsDNA was previously detected in tumor-derived exosomes (Thakur et ah,
“'Double-Stranded DMA in Exosomes; a Novel Biomarker m Cancer Detection,” Cell Research 24;766"769 (2014), which is hereby incorporated by reference in its entirety), the relative abundance of D A in exomeres and Exo-S/L was determined. DNA was detected In all three types of nanoparticles; however, relative abundance varied by cell-type (FIG, i 1 A). The relative amount of DNA was highest in exomeres derived from MDA-MB-4175 and In Exo~S from B 36- F10 ceils and AsPC-l , Bioanalyzer (Agilent) analysis revealed distinct size distribution of DNA associated with each subset of nanoparticles (FIG. I I B and FIG, 12), Exomere DNA was relatively evenly distributed in a broad range of sizes between 100 bp and 10 kb with a slight enrichment around 2 kb in several eases. In contrast, a strong enrichment between 2 kb to 4 kb was detected for Exo-S/L DNA, and the peak size of Exo-L DNA was slightly larger than that of Exo-S DNA. This phenomenon may be due to the structural capacity and different biogenesis mechanisms of each panicle subset.
| 213] RNA was preferentially associated with Exo-S/L in both B I 6-FI0 and AsPC-l
(FIG. 1 1 C), RNA associated with exomeres and Exo-S showed a monomodal distribution (peak at 400nt and 5G0nt, respectively), whereas Exo-L R A displayed a bi modal distribution (FIG. I I D) (additional peak >400Gnt). Specifically, 18S and 28S rRNAs were detected at very low levels in Exo-L, barely detected in Exo-S and absent in exomeres compared to cellular RNA, A strong small R A peak (corresponding to tRNAs, icroRNAs and other small R A ) was detected in Exo-S and Exo-L, but not in exomeres. Remarkably, a unique RNA peak of unknown identity, of ~3! 5nt in size, was detected only in Exo-L,

|02I4] Next the organ biodistribution of B 16~F I G~derived nanopartlcle subsets in naive mice was investigated. Twenty-four hours post intravenous injection of near infrared dye (NIR)~ labeled exomeres, Exo-S and Exo-L into mice, organs were collected and analyzed using the Odyssey imaging system (LI-COR Biosciences; FIG. 13), Interestingly, all nanoparticles were uptaken by hematopoietic organs, such as the liver (-84% of total signals), spleen (-14%) and bone marrow (-1.6%). The lungs (-0,23%), lymph nodes (-0.07%), and kidneys (-0.08%) showed less uptake of all nanopartide subtypes, Particle uptake was not detected in the brain, Subsequently, the dynamic range of signal intensity in each organ was adjusted to compare the uptake of each subset of nanoparticles in the same organ (FIG. 13A), Punctuated distribution patterns of nanoparticles were detected specifically in the lung and lymph nodes. This is in contrast to the homogenous distribution pattern found for all nanoparticle subsets in the liver, spleen, and bone marrow. Importantly, although exomeres and Eca-S/L were predominantly uptaken in the liver, Exo-L displayed lymph node tropism. in addition, though not statistically significant, a trend of higher uptake of exomeres In the liver was observed. Quantification is shown in FIG, I 3B, Distinct organ distributions indicate that nanoparticle subsets may be involved in different aspects of tumor progression and metastasis. Discussion of Examples 1-7
[0215] Dissecting the heterogeneity of EV populations by differential ultracentrifugation, immuno-affinity capture, ultrailltration and size-exclusion chromatography, polymer-based precipitation, and microfluidics {Thery et ah, 'Isolation and Characterization of Exosomes from Cell Culture Supernatants and Biological Fluids," Current Protocols Cell Biolog)· Chapter 3, Unit 3 22 (2006); Merchant et ah. "Micro filtration Isolation of Human Urinary Exosomes for
Characterization by MS,” Proieomlcs Clinical Applications 4:84-96 (2010); Lasser el al., "isolation and Characterization of RNA-Cantaining Exosomes,” Journal of Visualized
Experiments 59;e3G37 (2012); Chen et al, "Micro fluidic isolation and Trcmscriptome Analysis of Serum Microvesicles,” Lab on a Chip 10:505-51 1 (2010); Jorgensen et ai,5“Extracellular Vesicle (BY) Array: Mscroarray Capturing of Exosomes and Other Extracellular Vesicles for Multiplexed Phenotyping” Journal of Extracellular Vesicles 2 (2013); Tauro et al,
“Comparison of Ultracentrifugation, Density Gradient Separation, and Imnuinoaflfmity Capture Methods for Isolating Human Colors Cancer Cell Line L!M 1863-Derived Exosomes,” Methods 56:293-304 (2012), which are hereby incorporated by reference in their entirety) In an attempt to separate nanoparticle populations has proven daunting. By employing state-of-the-art A F4 technology two discernible exosome subpopulations, Exo-S and Exo-L, were separated and a distinct nanoparticle, named exomere, which differs in size and content from other repotted particles, was identified. Unlike labor-intensive and time-consuming gradient methods, AF4 is highly reproducible, fast, simple, label-free and gentle. Moreover, the exosome subpopulations and exomeres were able to be efficiently resolved In a single AF4 run with real-time
measurements of various physical parameters of individual particles.
|02I6j The analyses revealed that exomeres were selectively enriched in proteins involved In metabolism, especially "glycolysis” and“mTORC l” metabolic pathways, suggesting their potential roles in influencing the metabolic program in target organ cells, as well as in proteins associated with coagulation (e.g., Factors VIII and X) and hypoxia. The proteomic analysis also showed that exomeres were enriched In key proteins controlling glycan-mediated protein folding control (CALR) (Molinari et al, "Chaperone Selection During Glycoprotein Translocation into the Endoplasmic Kodmlnmf Science 288:331 -333 (2000), which is hereby incorporated by reference in its entirety) and g!ycan processing (MAN2A!, HEXB, GA AB) (Fukuda et ah,“Incomplete Synthesis of N-G!ycans in Congenital Dyserythropoietic Anemia Type II Caused by a Defect In the Gene Encoding Alpha-Mannosidase 11,” Five Nad Acad Sci U SA 87:7443-7447 (1990); Yang et al,.”An Intrinsic Mechanism of Secreted Protein Aging and T urnover,” Proc Nad Acad Sci USA 1 12: 13657- 13662 (2015 ); Martiniuk et ah, "Identity of Neutral Alpha-Glueosidase AB and the Glycoprotein Processing Enzyme Glucosldase II,
Biochemical and Genetic Studies,” The Journal of Biological Chemistry 260: 1238-1242 ( 1985), which are hereby incorporated by reference in their entirety), suggesting exomere cargo may modulate giycosylation In distant recipient cells, Suhcellular localization analysis of exomere- enriched proteins revealed their specific association with Ell, mitochondria and microtubules, demonstrating the potential roles of these proteins In exomere biogenesis and secretion.
[Q21?| Proteins unique to exosomes (Exo-L and Exo-S) versus exomeres were also identified, Multiple components of ESCRT complexes were specifically associated with Exo-$ and Exo-L, but not observed within exomeres, suggesting a major role for ESCRT complexes in Exo-S/L but not exomere production, Other exosome-enriched proteins included Rab proteins, annexing, Hsp4G members, and proteins involved in multiple signaling transduction pathways, such as integrins, G-proieins, JAK1 and TGFBRs.
[0 181 Further differences were found between Exo-S and Exo~L protein cargo, Flotillm
1 , flotillin 2, tweety family member 3, tetraspars [4, and ESCRT-1 subunit VPS37B were specifically enriched in Exo-S, In contrast, levels of such proteins as annex in AI/A4/A5, charged multlvesicular body protein 1 A/2A/4B/5, vacuolar protein sorting 4 homoiog B, DnaJ heat shock protein family (Hsp40) member A 1 , and myosin IC were relatively higher in Exo-L. Interestingly, tissue factor, a well-studied exosame protein (Gardiner et ai„ "Extracellular Vesicles, Tissue Factor, Cancer and Thrombosis - Discussion Themes of the 1SEV 2014 Educational Day,” Journal of Extracellular Ves ies 4:26901 (2015), which is hereby
Incorporated by reference in its entirety), was enriched in Exo-L. h is thus plausible that exomeres and Exo-L cooperate to optimize the coagulation cascade m vivo,
[0219] Exo-S were predominantly enriched in proteins associated with endosomes, multivesieular bodies, vacuoles, and phagocytic vesicles, while Exo-L were specifically enriched m plasma membrane, cell-cell contact/junction, iate-endosome, and trans Golgi network proteins. These data indicate that Exo-S are most likely bona fide/canonical exosomes (he., derived from intraluminal vesicles of endosomal compartments), whereas Exo-L may represent non-canonical exosomes or probably sEVs of different sub-cellular origin (he,, plasma membrane budding),
[Q22Q] Identifying specific exosonie and exomere markers to better isolate and characterize these nanoparticles is critical to advancing knowledge of EV biology. Since Flotillin 1 and 2 were specifically associated with Exo-S, these proteins may represent reliable markers of conventionally defined exosomes. Other previously reported exoso e markers, including CD9, CD63, CDS!, TsgI G l and A!ixl, were present in Exo-S and/or Exo-L in a cell type-dependent manner, and therefore would have to be combined with size exclusion to distinguish exosome subpopulations. Notably, Hsp9G~p, highly represented in exomeres, could be a potential exomere marker, whereas several Hsp7Q family members, such as HSC70/HSPA8 could serve as possible markers for Exo-S/L subpopulations,
[0221] The giycomie, hpido ie, and genomic studies also revealed additional distinct molecular signatures in exomeres and exosomes, Similar to the expression in metastatic tumor
cells, exoso e subsets were enriched with sialyiated glycoproteins, supporting the role of these structures in exosome-medkued cellular recognition. One predominant sialoglycoprotein previously identified in exosomes (Escrevenle et aL,‘'Siaioglycoproteins and N-glycans from Secreted Exosomes of Ovarian Carcinoma Cells,’ PloS One 8:e78631 (2013); Liang et af , "Complex N-iinked Gfycans Serve as a Determinant for Exosome/M icroveslde Cargo
Recruitment," The Journal of Biological Chemistry 289:32526-32537 (2014), which are hereby Incorporated by reference in their entirety), the galectin-3-bindmg protein (LGALS3BP), a modulator of cell communication and immune responses (White et aL,“Galee†In~3 Binding Protein Secreted by Breast Cancer Cells Inhibits Monocyte-Derived Fibrocyte Differentiation” Journal of Immunology 195: 1858-1867 (2015); Laubli et ah,“Lectin Galactoside-Binding Soluble 3 Binding Protein (LGALS3BP) Is a Tumor-Associated Immunomodulatory Ligand for CD33-Rciated Siglees,” The Journal of Biological Chemistry 289:33481 -3349 ! (2014), which are hereby incorporated by reference In their entirety), was highly enriched in exomercs, This ligand could mediate the specific Interaction of exomeres with target ceils through proteins, such as collagens, fibronectin, nidogen, gaIectin-3 and integrin beta- 1 (Hellstern et aL“Functional Studies on Recombinant Domains of Mac-2-B ding Protein,” The Journal of Biological Chemistry 277: 15690-15696 (2002); Sasaki et aL,“Mac-2 Binding Protein Is a Cell-Adhesive Protein of the Extracellular Matrix which Se!f-Assemb!es into Ring-L!ke Structures and Binds Beial Integrms, Collagens and Fibronectin " The EMBO Journal 17: 1606-1613 ( 1998), which are hereby incorporated by reference in their entirety)
(9222| Interestingly, the lipidomics analyses revealed tha exomeres contained fewer lipids compared to Exo-S and Exo-L, Phospholipids and SM, the major structural components of plasma lipid bilayer membrane (Van Meer et ah,“Membrane Lipids: Where They are and How They Behave,” Nat Rev Mol Cell Biol 9: 1 12-124 (2008), which is hereby incorporated by reference In its entirety) ranked top In all nanoparticles examined. Such an observation is expected for Exo-S/L subsets due to their vesicular membrane structure, however, exomeres seem to lack external membrane structures. Yet, differences in several lipid classes
distinguished exomeres from Exo-S and Exo-L, For instance, exomeres were found to contain higher levels of triglycerides and ceram Ides compared to exosome subpopu lotions and thus may serve to transport these metabolites to recipient cells. The study further revealed that DNA packaging in exomeres and exoso es varied by tumor-type, while RNA was packaged in Exo-S and Exo-L independent of tumor classification.
[ 223J Collectively, the findings demonstrate that proteins, glycans, lipids, and nucleic acids arc selectively packaged in exomeres, fi\o~S. and Exo-L, further supporting the idea that these are distinct nanoparticle subsets,
[0224J The observation that nanopartide subtypes have different organ biodistribution patterns suggests they mediate the pleiotropic effects of cancer. The punctate pattern of Exo-L uptake and its apparent tropism for lymph nodes implicate this nanopartide in facilitating metastasis of disseminated tumor cells, Exomeres, along with exosomes, were uptake n by hematopoietic organs, including the Over, spleen, and bone marrow. Interestingly, the predominant exomere uptake by the liver and the exo ere enrichment in protein cargo involved tn metabolism lead us to speculate that exomeres may specifically target the liver for metabolic reprogramming during tumor progression. The data indicate that the size of nanoparticles, in addition to their specific cargo, may influence metastatic patterning and systemic effects of cancer,
| 225| The identification of exomeres highlights the diversity of BVs and particles secreted by cells. Elucidating their biogenesis will be essential to unravel their roles in cellular and organ function. Target cells and the functional outcomes exerted by each nanopartide subset in organs need to be further delineated to advance the understanding of the collective, systemic effects of nanoparticles In the metastasis process. Undoubtedly, these discoveries will open avenues for translational studies of EVs and particles in diagnostic, prognostic, and therapeutic appl cations.
Materials and Methods for Exam les 8-12
1 2261 Preparation of small extracellular vesicles (sEVs) from cell culture. With the aim to separate distinct cellular nanoparti es, such as exomeres and exosome subsets, sEVs isolated using dUC as the input samples for AF4 were studied, Alternative methods, such as DOF, UF and SEC, can also be used for sEV Input sampling, EVs captured by 1AC cars be applied, as well, if the antibody can be removed from the EVs.
[f 227 This protocol has been developed and optimized using sEVs derived from cell culture model systems. Conditioned media was sequentially spun to remove cells, cell debris, and large EVs and finally pellet down the sEVs. It has been reported herein that fresh versus frozen sEV samples do not markedly differ in AF4 profiles, Indicating that the structural integrity of EVs is well preserved during the freeze-thaw process. Of note, the culture conditions, such as growing cells in hypoxic conditions, and the passage of cells can influence
EV production and composition (I.e, the percent of each particle type in a sample), Thus, these changes in ENP composition may require modifications of the AF4 methods for further optimization to achieve desired separation quality,
[0228] As described infra t this protocol could also be applied to sEVs prepared from other resources, such as bodily fluids, Including plasma, AF4 parameters, such as the cross-flow gradient, can be further adjusted to meet the specific requirements of particular samples (for example, existence of additional types of ENPs). However, for certain sample types, the EV composition is more complicated than that derived from conditioned media of ceil cultures. For example, the presence of lipoprotein particles in blood plasma may interfere with the separation of exosomes due to their partial overlap in size. In this case, other means of prior removal of lipoproteins from the plasma sample is desired before loading them onto the AF4 channel,
[0229] AF fractionation of sEVs and online data collection and analysis. The AF4 operative method for separation ofexomeres and exosome subsets (/.<?,, Exo-S and Exo-L) from cell culture-derived sEVs is illustrated in FIG. 21. Based on the complexity of the EV samples and the goal of each specific study, this running method can be further adjusted, as described infra,
[0230] For real-time monitoring and analysis of the fractionation of particles, several online detectors are usually Installed Immediately downstream of the AF4 channel. The laboratory has the DAWN HELEOS-!I (MALS detector) with QELS (DLS detector) Installed at the detector 12 { 100li) position (Wyatt Technology) and the Agilent 1260 Infinity Multiple Wavelength Detector (set at 280 nm for UV absorbance detection) in place. The DLS measurement is mainly used to determine the hydrodynamic size of the fractionated particles in real time, The primary data from a DLS measurement is the autocorrelation function, which plots the average overall changes In the scattered light intensity of molecules with time (see example in FIG. 22), The exponential decay rate of the autocorrelation function determines the translational diffusion coefficient (Dt) of molecules in solution based on the following equation:
Auto correlation function Gf t)= 1+ bkr{· 2 D,qzr)
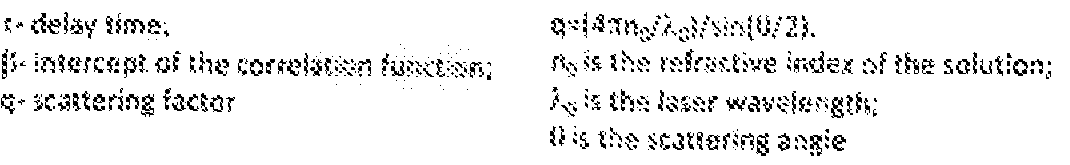
Based on the Stokes-Einstein relation,
 an effective hydrodynamic radius (!¾) can be further deduced from Dt. The assumption for this calculation is that the solute (EV, in the present case) is a sphere undergoing Brownian motion,
Rh is the radius of a sphere with the same translational diffusion coefficient as the analyzed solute. R¾, depends only on the physical size of the solute and its size-related behavior, such as diffusion and viscosity, but is not affected by its density or molecular weight. The measurement range of 0-5 nm to 1000 run radius makes DUS an effective tool to measure the size of sEVs. |023l] Combining AF4 with online DLS measurements is critical for accurate size determination, hi a polydlsperse sample. DLS measurement yields an average h and the specific information on each compositional species in a given sample is missing. However, fractionation results in the separation of solutes with different sizes and each fraction contains only a very small admixture of different ¾ particles. Thus, fractionation allows the size of each species to be more accurately measured. For such monodisperse samples, the resulting autocorrelation functions are single exponentials, which are simple to interpret. Fitting the data to a single exponential function is performed in the Astra software using the Cumulants model (Wyatt Technology Corporation. DYNAMICS Users Guide, Version 7.0 (M 1400 Rev, !) Appendix A-2 (2010), which is hereby incorporated by reference in its entirety), By examining the ideal fitting to a single exponential, one can further evaluate the separation quality.
(02321 One requirement for accurate DLS measurement of Rh is that the sample concentration must be sufficient so that the sample scatters at least three times more light than the solvent to obtain an acceptable signal/noise ratio. In particular, small molecules, such as exomeres, scatter less light and require even higher concentrations of analyte to optimize results, (0233 ! Besides DLS, static light scattering (SLS) detected by MALS measures the radius of gyration (Re), Rs is defined as the mass averaged distance of each point in a molecule from its gravity center and is generally different from R¾ Comparing Rg to Rs can further reveal the compactness of a solute (hi?., empty versus filled particles). In general, the MALS detector is more sensitive than DLS monitoring and thus it will be of specific use when only little amount of material available for analysis.
(1 2341 The UV detector Is used as part of the instrumentation for online concentration measurements, The intensity of UV absorbance can provide us an approximation of the relative abundance of different species in the sample, despite not having defined extinction coefficients for different species in the EV sample mixture. The peaks of UV absorbance are useful in guiding the choice of combining fractions of similar particles. However, the bicinchoninic add assay (BCA assay) and TA is often conducted after fraction collection for quantification purposes. Once pure EVs are obtained and further characterization can be performed, the
extinction coefficients of each species for improved interpretation of the UV absorbance data to concentration can then be determined.
|0235f One key consideration for online detectors is that it must have exceptional sensitivity due to the limited amount of material passing through the detector at each single time point Besides the detectors mentioned above, other sensors, such as differential refractive Index (dRl) and fluorescence detectors (FLDs), are often Included as standard parts of the
instrumentation for a variety of macromolecular characterization techniques. dRl, considered a universal concentration detector, is accurate and versatile in all types of solvents and independent of chromophores or fluorophores, FLDs are useful if autofluorescent molecules or artificial fluorescent labeling are present in specific subsets of EVs. It should be noted that, with additional detectors assembled online, the fractionated particles take a longer path and more time to reach the fraction collector. As a result, diffusion of molecules will lead to broadening of peaks, dilution of fractionated samples and reduction in separation resolution. Therefore, only- detectors considered essential for the real-time monitoring should be installed.
]0236| Fraction collection, concentrations and characterization. AF4 fractions can be collected automatically or manually for downstream offline characterization, The Agilent Fraction Collector (1260 series) has been installed to automatically collect fractions into 96~well plates, but similar fraction collectors can be utilized for accurate and reproducible fraction collections. Fractions can be collected either by volume or over time, and fractions of particles with the saute identity based on online and offline characterization can be further pooled together for downstream analysis. For example, as described supra, to identify e omeres and distinct subsets of exosomes, representative fractions were first examined across the whole time course of fractionation by online DLS and offline transmission electron microscopy analysis and then the fractions of particles with similar size and morphology were pooled together for further characterization. This step was also guided by the peaks of UV absorbance (indicating the most abundant fraction of each type of particles). To validate that the pooled fractions are relatively pure and not contaminated significantly by other types of adjacent particles, only fractions centered around the peaks were pooled together. Depending on the resolution of the
fractionation, this fraction combination step cars be empirically determined. Due to the different composition of EV subpopulations in a given sample, occasionally the UV peaks are not identifiable and thus the fraction combination will rely more on other properties, such as size and morphology,
|¾23? The individual or combined fractions can be directly utilized for downstream analysis or subjected to a concentration step before further characterization. The collected
fractions arc usually concentrated using the Amicon Ultra-series of centrifugal filter units with Ultracel-30 (30 KDa cutoff) membrane (Mlllipore). Other alternative means of concentration, such as tangential filtration centrifugation, direct UF, UC, or 1AC, can be applied depending on the need for the downstream analysis. A variety of analyses can be performed on fractionated EVs, including but not limited to: BCA assay, NTA, atomic force microscopy, electron microscopy, mass spectrometry of molecular contents (e.g„ proteins, lipids, glycan, and metabolites), western blotting or the enzyme-linked immunosorbent assay, sequencing of genetic material (DNA and RNAs), DLS measurement in batch mode, and zeta potential measurement The functional roles of the fractionated EV subpopulations can be further investigated in vitro or in vivo.
Reagents,
B 16-F 10 cell line (ATCC), Cell lines should be regularly checked to ensure that they are authentic and free of mycoplasma contamination,
DM EM (VWR, Catalog No, 45000-304}
Premium Grade Fetal Bovine Serum (FBS) (VWR, Catalog No, 97068-085)
L-Glutamine, lOOx (Coming, Catalog No, 25-005-0)
Penicillin-Streptomycin Solution, 50X (Corning, Catalog No, 30-001 -Cl)
Sterile PBS (VWR, Catalog No, 45000-446)
TrypLE (Thermo Fisher Scientific, Catalog No. 12604-039P)
Pierce BCA Protein Assay Kit (Thermo Fisher Scientific, Catalog No, 23225)
ATCC Universal Mycoplasma Detection kit (ATCC, Catalog No. 30-1012K)
Bovine serum albumin (BSA) (Sigma, Catalog No, A 1900)
Water filtered using the Mills Q system
Ethanol (Sigma, Catalog No. 459828)
Confrad 70 (Decors Labs, Inc Catalog No, 1003)
Sodium Dodeeyl Sulfate (SDS) (Omnipur, Catalog No, 7910)
Nitric Acid (Fisher Scientific, Catalog No. 7697-37-2)
Consumable Equipment,
150x25mm tissue culture dish with Grid (VWR, Catalog No, 25383-103)
5/l0/25mL Serological pipettes (VWR, Catalog No. 82050-478/82050-482/82051-182) Disposable Tips (Denvii!e, Catalog No, P1096-FR/P) 121/P I 122/P 1 1 6)
500 ml Supor machV PES Filter Units (VWR, Catalog No, 73520-984)
15ml../ 50m t conical tubes (VWR, Catalog No, 82050-276/ 82050-346)
* 1.7 ml icrocentrifuge Tubes (VWR, Catalog No, 53550-698)
* 96-we!I plate (VWR, Catalog No, 62406-081 )
Blue screw caps (Agilent, Catalog No. 5182-0717)
5 * Screw cap vials (Agilent, Catalog No, 5182-0714)
® vial insert, 250ul pulled point glass (Agilent, Catalog No. 5183-2085)
* 96- well plate, 1 ,0ml, polypropylene (Agilent, Catalog No, 8010-0534)
* Sealing tape, clear polyolefin (Thermo Fisher Scientific, Catalog No. 232701)
Ultracemrifuge tube (Beckman Coulter, Catalog No. 355628)
Hϊ ® Amicon Ultra-15 Centrifugal Filter Unit with Ultracel-30 membrane (Millipore, Catalog
. No. UFC903024) .
® Amicon Ultra-4 Centrifugal Filter Unit with Ultracel-30 membrane (Millipore, Catalog No. UFC803024)
Millipore Reg. Cellulose membrane I0KD SC (Wyatt technology, Catalog No. 4057)
5 ® Nadir Po!yethersu!fone membrane 10KD SC (Wyatt technology, Catalog No. 1903)
Inline filter membrane 0,1 pm (Wyatt Technology, Catalog No.1871 )
® Dry wipes (Kimteeh. Catalog No, 7552)
* 2L glass bottles (VWR, Catalog No.10754-822)
Hemacytometer (Weber Scientific, Catalog 3048- 12)
20 i240] Equipment.
® Labconco Purifier Class P biosafety cabinet
Tissue culture incubator
* EVOS FL Microscope (Thermo Fisher Scientific)
® Optima XPN-HK) Ultracentrifuge (Beckman Coulter, Catalog No. A94469)
·$ 5 ® Type 45 Ti Rotor, Fixed-Angle, Titanium (Beckman Coulter, Catalog No. 41 103909)
® Table-top Heraeus Multi uge V3R Centrifuge Series (Thermo Fisher Scientific, Catalog No, 75004501 )
« fvlicrocentrifuge (Eppendorf, 5424R)
* AccuSean GO UVVVis Microplate Spectrophotometer (Fisher Scientific, Catalog No, 14-
30 377-579)
® MUli Q system ( illipore)
* 4 °C Refrigerator (Thermo Fisher Scientific)
-20 °C freezer (Thermo Fisher Scientific)
-80 °C freezer (Thermo Fisher Scientific)
37 °C incubator (Thermo Fisher Scientific)
Autoclave (Tuttnauer)
Dishwasher (Steelco)
* Agilent 1260 Infinity Analytical- and Preparative-scale Fraction Collectors (G 1364C)
* Agilent ! 290 Thermostat (G 1330B)
® Agilent 1260 Infinity Standard Autosampler (G 1329B)
» Agilent 1260 infinity Multiple Wavelength Detector (G I 365D)
* Agilent 1260 Infinity Isoeratic Pump {013100}
® GASTORR TG-14 HPLC vacuum degasser
Wyatt Technology DAWN HELEOS-fl with QELS installed at detector 12 { 100°)
* W yatt T echno logy Ec I i pse A F 4
* Wyatt Technology short channel
Computer installed with Chemstation and Astra 6 softwares
421 Soft ar
Chemstation (Agilent Technologies) integrated with the Eclipse module (Wyatt Technology) to operate the AF4 flow
® Astra 6 (Wyatt Technology) for MALS, DLS and UV data acquisition and analysis eag mi Setu ,
* Exosome-depieted FBS FBS is depleted of exosomes by ultracentrifugation at
100,000# for 90 min and sterilized with a 0,22pm filter unit. Aliquots of exosome- depleted FBS can be stored at -20t!C for long term. To avoid contamination, the rotor needs to be first sterilized by wiping with 70% Ethanol and all tubes for
ultracentrifugation should be autoclaved. The entire FBS handling process should be carried out i a Bioloefca! Safe v Cabinet for tissue culture,
® 20% (vol/vol) Ethanol, Mills Q filtered water is used to make the dilution of ethanol.
The final solution is made freshly and filtered with a 0,22pm filter unit,
* 0.5 mg/mL BSA solution. Dissolve BSA powder in PBS at a concentration of 0.5 mg/mL and store aliquot at -20 °C for long term.
1% (vol/vol) Csmira 7Cb Dilute Contrad 70 with Mills Q water to a ftrsal concentration of 1% (vot/vol), and store at room temperature (RT, ^22 °C) for long term.
• 10% (wt/vol) SDS. Dissolve SDS powder in Mild Q water at a concentration of 10% (wt/vol) (Le.10 g per 100 mL) and store at RT for long term. This chemical is corrosive and toxic, and can cause severe skin and eye irritation. Wear protective gloves, mask, eyeshiekl, faeeshield, and protective clothing to handle.
® 10% (vol/vol) Nitric Add. Dilute nitric acid with Mills Q water to a final concentration of 10% (vol/vol), and store a RT for long term. This chemical is highly corrosive and can cause severe eye and skin burns, severe respiratory and digestive tract barns. Wear proper protect! ve equipment (glores/eyeshieid, Faeeshield, clothmg, respirators) and handle it in a chemical hood. The waste should be treated as a hazardous waste following state and local hazardous waste regulations.
102441 instrument setup. All the parts of the AF4 instrument should be installed, configured, calibrated and certified by the manufactures (Agilent and Wyatt Technology) before utilization,
|0245| Preparation of sEVs from the conditioned media of cell culture. B 16-F 10 murine melanoma is used as a model system in this protocol. A schematic flow diagram summarizing the key steps of the entire procedure and the flow route of AF4 is shown in FIG, 21.
1. Seed 2,25xi if B 16-F 10 cells per PS 50 tissue culture plate in 25 mL of the DM EM
complete medium supplemented with exosome-depSeted FBS, and seed a total of 12 plates. Cell lines should be regularly checked to ensure that they are authentic and free of mycoplasma contamination. The passage number of the B 16-F 10 cells influences sEV composition, reflected by the changes in the relative abundance of different subsets of sEVs (7). So, avoid comparing experimental data using B! 6-F 10 cells with a big difference in their passage numbers.
2. Keep cells in a humidified tissue culture incubator for 72 hours under standard conditions (5%€(¾, 37"C), The cell culture should just reach confluence without cell death and any abnormal phenotypical changes. Cells should be allowed to reach confluence to get highest sEV yield, but no cell death and stressed phenotype should be apparent by the harvesting time to ensure the purity of the sEVs.
, Collect the conditioned media into 50 mt conical tubes and centrifuge at 500 x g at KfC for 10 minutes in the table-top centrifuge. The supernatant can be spun at 3000 x g at 10°C for 20 minutes in the table-top centrifuge, transferred to new tubes and placed at - 80 °C for long term storage. , Transfer the supernatant to ultracentrifuge tubes (6 x 50 mL/tube) and centrifuge at
12,000 x g at 10°C for 20 minutes i Type 45-Ti ultracentrifuge rotor (pre-chilled at 4ftC). For ultracentnfugation, the opposing pair of tubes across the center of rotation need to be balanced with each other. Do not load more than 50 mL per tube to avoid sample spilling, The rotors should be kept at 4°G when no in use, , Transfer the supernatant to new ultracentrifuge tubes and centrifuge at 100,000 x g at
KfC for 70 minutes in the same rotor. At the end of each u!lracenirifugation step, make sure the supernatant is transferred immediately to avoid the loosening of the pellet and either contaminating the supernatant or losing the pelleted samples,
6, Discard the supernatant and resuspend the pellets in one milliliters of ice-cold PBS
gently. Avoid introducing air bubbles. Combine all the samples into one ultracentrifuge tube and bring the final volume to 50 mL with PBS.
7, Centrifuge at 100,000 x g at I0°C for another 70 minutes. Resuspend the final pellet in
-0,5 mL of PBS and transfer to 1.7 mL microcentrifuge tubes on Ice (the sEV sample for AF4 fraction in the next section). The pellet sometimes may be hard to break and resuspended into a homogeneous suspension. If so, the samples can be kept on ice for another 15 to 30 minutes or an extra volume of PBS can be added to the sample. Then gently pipette up and down to resuspend the samples and transfer to Eppendorf tubes for quantification. Avoid introducing air bubbles, 8. Quantify the sEV yield by measuring the protein concentration using the Pierce BCA
Protein Assay Kit. Follow the manufacturers instruction to mix the samples or B8A standards provided by the kit with the reagents in a 96-well plate and incubate at 37 °C for 30 minutes. Read the absorbance at 562 mn using the AccuScan GO UV Vis Microplate Spectrophotometer and calculate the concentration of the samples based on the BSA standards included.
9, The samples can be Immediately applied for AF4 fractionation, or kept on ice overnight to be processed further the next day. The samples can be frozen at -8(fC for long term storage,
of sEVs,
10 Before assembling the AF4 channel one should select the membrane type and cutoff size (e,g,t € membrane with 10 KDa cutoff size) and the spacer with desired thickness III (i,e, the channel height, preferably 490pm) first.
1 1. Rinse all parts with Mill Q water and assemble in the order of the top plate, spacer, membrane and botom plates with the frit/O-ring in place). Bolt the parts together using a torque wrench with 5 Mm and 7.5 Nm torques applied sequentially. Since the sample 15 specimen is positioned in the channel laminae very close to the membrane, it Is critical that the membrane should be smooth and unruffled. Wear gloves and do not bend the membrane during the assembly procedure. Since ethanol can cause the“membrane swelling’ phenomena and reduce the effective channel height for fractionation, avoid exposing the membrane to ethanol it is critical that the channel be tightly sealed and its 20 height be precise and even across the whole channel To assemble the AF4 channel, a metered wrench such as a torque wrench should be used to apply force precisely, A good practice is to tighten the two boils in the center first and then the ones at the corners in diagonal order,
25 12, Connect the tubing to the inlet, crossflow and injection ports but with the outlet post unconnected. Start to run water at a channel flow rate of I mt/min {program the flow rate settings and operate using ChemSlation) through the system for at least 30 minutes and let air in the channel run out from the outlet port first. Then connect the tubing from the outlet to the detectors. No air bubbles should be observed in the channel The 30 instrument can be operated In the Night Rinse mode with a constant channel flow of 0,2
L/rnsn overnight, up to a few days. For short term storage, keep the system running in the Night Rinse mode. Do not leave the system In still aqueous solvents for a long period. For long term storage, dissemble the membrane from the channel and maintain the system in 20% ethanol Keep the tubing from the channel to the detectors and the
fraction collector as short as possible to reduce the peak broadening and sample dilution effects and to avoid decreases in separation resolution, Equilibrate and amt the membrane with BSA
Change the aqueous solvent to PBS, and keep running at a channel How of 1 mL/min for at least 30 minutes to I hour, The instrument can be operated in the Night Rinse mode overnight, with a constant channel flow of 0,2 mL/min, I the system has been maintained in ethanol or isopropanol, it should be flushed completely with water first before switching to PBS. Mixing PBS with alcohol will cause salt precipitation. , Load 30 to 40 pg of BSA (0,5 mg/mL) onto AF4 and run the sample using the same AF4 method as for sEV fractionation except for the elution step, using a constant crossflow of 3 ml/min for 15 minutes for BSA instead. Repeat, by running BSA 1 -2 more times. The instrument can be operated in the Night Rinse mode overnight, up to a few days after membrane coating. The purpose of this step is to block non-specific binding of the samples to the membrane. The sample to be analyzed, if extra sample is available, can be used for this blocking step, too, This step Is only needed when a new membrane is installed. At the end of the day, after all samples have been processed, turn on the COMET of the DAWN HELEOS II detector for about 30 min to clean the flow cell.
AF4 fractionation of sEVs.
. Instrument initialization:
(a) Open Chemstation and load the AF4 running method as described in Table 15 (The running method is programmed, edited and saved in the "Method" module of Chemstation).

(h) Set both thermostats for the autosampler and the fraction col lector at 4"€; turn on the UV lamp for the MWD detector (280 nm) at least 30 minutes before sample analysis; turn on the laser for DAWN H EL BOS H (664 n ).
(c) Turn on the fraction collector and choose the collection mode (based on volume or time interval); install 96-well plates for fraction collection (Ensure plates are installed according to the configuration of the fraction collector). Fractions are collected based on time intervals of 0.5 minutes, so two plates are needed to collect the fractions from one sample). All operations should be done using the ChemStation software except for switching on the laser of DAWN HELEOS II using the instrument's front control panel 15. Open Astra 6 and start a new experiment f le for data collection:
(a) For Configuration, select "PBS, aqueous" as the system solvent; specify UV
wavelength at 280 nm" and enable "Baud Broadening" option; for HELEOS, enable "Band Broadening” and " emperature Control" options; and for QELS, select "Use QELS dithering”.
(b) For Procedure: specify the time interval for MALS data collection at I second and
QELS interval at 2 seconds; set the duration for data collection at 60 minutes; select "T igger on Auto-Inject”;
(c) Click the "Run” button and the data collection will automatically start once triggered by the signal from the autosampler.
, Prepare the AF4 input samples by adjusting the concentration of the sEVs isolated in Step 9 to 1 pg/pi with PBS. Spin at 12,000 x g at 4*’C for 5 minutes to remove insoluble aggregates right before loading onto AFT , Transfer the supernatant into a pre-chi lied screw cap glass vial (250ul pulled point glass vial insert can be used if the total volume of the sample Is small), and put it onto the autosampier platform at the designated position from which the autosampier is set to pick up the sample automatically. Pre-spinning of the sample before loading onto AF4 is critical to avoid analyzing artifacts of aggregates formed during the high-speed ukracentrifugation, . , In the Autosampier module of Chemstation, specify the sample volume to analyze (40 to 100 pi; Le, 40 to 100 pg at I pg/pl), and then click the "Single Sample" to start the fractionation, real time data collection (MALS, DLS, and UV absorption), and fraction collection (by time slice of 0,5 L), The pilot study has determined a range from 40 to 100 pg of B16-F10 sEVs is suitable for the current AE4 running method that has been developed. This can be further adjusted for specific samples due to their composition complexity, It is critical to avoid getting air bubbles into the system, Make sure that no air bubbles trapped in the sample vial and have a larger volume of sample in the vial than the volume to be analyzed. , During the running of the sample, check the real flow rates in the panel of“Wyatt Eclipse Status” and make sure they are close enough to the set flow rates, if the real How rates are quite different front the set ones, something is wrong with the flow control and repairing/maintenance by the manufacturer is needed to ensure the fractionation quality. It is critical to keep the channel flow rate (the detector flow) constant during the fractionation. Changes in the flow rate can cause artifact signal detection by the monitors. , Once the fractionation is finished, take the 96-well plates out of the fraction collector and seal them using adhesive tape. Keep the plates on ice or at 44IC for the next procedure.
21 . Clic "Reset the fraction collector' so that the starting position for fraction collection is reset to Its original position. Otherwise, the instrument will resume the fraction collection of the next sample from the last fraction position of the previous sample.)
22. Proceed to‘Online data analysis’’ described infra to evaluate the fractionation quality,
23. Proceed to "Fraction offline characterization" as described in ra or start the fractionation of the next sample (first install new 96-well fraction collection plates and then start fractioning the next sample by repeating steps 16-23), If multiple samples need to be analyzed but the collection of separated fractions is not required, a "Sequence” (a series of methods and samples programmed to be run sequentially) can be run instead of the method for a single sample, Users can refer to the manual from the manufacturer for details,
24. A good practice includes running a PBS blank control (or other types of running buffer used to analyze the samples) using the same AF4 running method for the samples on the same day. This blank control cars help evaluate the Instrument performance such as background noise level and identify systemic problems than may influence sample analysis.
25. After ail samples have been analyzed for the day, turn on the COMET of the DAWN HELEOS 11 for -30 minutes and switch off the laser, UV lamp, thermostat and fraction collector. Change the aqueous solvent to water and run in the Night Rinse mode overnight or tip to a few days. For long term storage, please refer to Step 12,
[0248] Online data analysis. Online data analysis is performed using Astra 6. First, select the experiment to be analyzed and
(a) adjust the baselines: set up the baseline for the MALS signal collected from the LS 1 1 (90°) detector first, and then apply it to all the other detectors, Make sure to check individual defectors to ensure the baselines are set up correctly,
(b) Select peak regions to analyze; a single or multiple regions can be selected to analyze simultaneously.
(c) Examine the fractionation quality by checking upon the fitting of the autocorrelation function al representative fractions to a single exponential model, The closer of R2 to i , the better purity of the separation,
5
26, Open a new window of EASI Graph, and plot Hydrodynamic Radius (RH), QELS (DLS) and UV signals versus time. The hydrodynamic radius (Rh) of particles is deduced solely from DLS signal using equations described above, The Hydrodynamic Radius (Rh) plot displays the size of particles eluted at each time point. The UV signal intensity Ifi can reveal the relative abundance of particles with different sizes. Based on these plots
(arid together with potential offline characterizations), one can Judge the AF4 separation quality and the sample composition (i.e. the relative abundance of particles with different sizes). Other types of analysis can be plotted as well by choosing different axes to display in EASI Graph according to the need. Besides online UV detection,
IS other means of quantification such as BCA assay and TA analysis can be used to
measure the concentration of the fractions, The sample concentration should be high enough to scatter enough light for accurate Rh deter ination, especially for small size particles as they scatter much less light.
20 102491 Fraction collection ant! concentration for offline characterization.
27, Depending on the characterization to be conducted, the Individual fractions can be
examined directly or further concentrated before examination, Adjacent fractions with similar properties (especially from the same peak region) can be combined and concentrated for downstream analysts, If a high amount of material is required for the
25 downstream characterization, multiple runs of the same sEV sample can be carried out following the same procedure and similar fractions from each run can be combined,
28. Individual fraction or pooled fractions are concentrated using Millipore centrifugal filter columns with Uitracel-30 membrane (30 kDa cutoff) in the following steps,
(a) The filter columns are first pre-rinsed by adding 5 ml- (for Ultra-4 filter column) or 15 mL (for Ultra- 15 filter column) of Ice-cold PBS followed by spinning at 3,700 x g at 4°C for 5 minutes. The flow-through and liquid remaining in the top filter columns are discarded,
(b) Pooled fractionated samples are then transferred into the top filter column and spun at 3,700 x g at 4 °C for ? 8 minutes. The concentrated samples are retained in the top
filler columns and buffer is collected at the bottom of the collection tubes (the flowthrough), Discard the flow-through.
(c) Repeat step 31 (b) until each sample is concentrated to the desired volume. For each sample, the same filter column can be repeatedly loaded and spun to concentrate the sample.
(d) Transfer the concentrated samples to 1.7 mL microcentnfuge tubes on ice. Record the volume and take an aliquot for BCA measurements to determine the protein concentration,
(e) The concentrated samples can be kept on ice for short-term storage (up to 2-3 days) or frozen at ~80°C for long term storage. Downstream molecular characterizations and functional study can be followed up on these concentrated fractionated samples. For an unknown sample that is analyzed using AF4 for the first time, check the morphology of representative individual fractions by TEM first before pooling fractions together for further analysis. It is possible that particles with same hydrodynamic size but different morphology are eluted together from AF4. Other means to separate these particles based on their distinct biophysieal/biochemicai properties (such as density, surface molecule expression, and charge) should be explored in combination with AF4 for further fractionation, Pool fractions together based on the hydrodynamic size, morphology and purity of representative fractions. If baseline separation of two adjacent, distinct populations of particles is not achieved, avoid collecting those fractions In the "valley'’ between the peaks of two populations for further characterization. f025(lf Troubleshooting, Table 16, Troubleshooting table,

H


L Step 1 -9, cell culture and isolation of sEVs: -·3 days,
11. Step 10- 12, the AF4 channel assembling; -I hour,
Step 13-14, Equilibration and coating the membrane with BSA: 2 - 3 hours.
(Step 10- 14 are only needed when a new membrane is installed )
Step 15-26, AF4 fractionation of sEVs: 1-2 hours per sample.
IP. Step 27-28, online data analysis -20 minutes per sample,
IV. Step 29-30, fraction collection and concentration for offline characterization: I -2 hours.

|0251] According to the AF4 theory, cross-flow is the driving force counteracting the
Brownian motion of particles to resolve particles with different hydrodynamic sizes at different channel-flow laminae at steady state, Thus, cross-flow is a defining factor In AF4 fractionation quality. To determine the optimal cross- flow for exosome fractionation, various cross- flow settings were evaluated. Exosome fractionation profiles (fractograms of UV absorbance and DLS) were devised from representative cross-flow settings, as shown in FIG. 16, Specifically, linear gradients of cross -flow with different starting flow rates (at 0.3, 0,5 and 1 ,0 mL/min) and slopes (U' how fast the cross-flow drops to 0 mL/min; tested conditions: a decrease in flow rate from 0.5 to 0 mL/min within 35, 30 and 45 min) were examined. Three major peaks (P2, P3 and P4) were observed when the cross-flow decreased from 0,5 to 0 mL/min within 45 min. These peaks represented the exomeres and two exosome subsets (/.<?., small exosomes [Exo-S] and large exosomes [Exo-L]), respectively, as reported supra (FIG, 16 A), Among the other peaks,
P0 Is the void peak, resulting from flow disturbance when switching from the focus/injection mode to the elution mode, PI is a very minor peak, generated by the concomitant elution of the void peak and species that were smaller than exomeres. Depending on the ENP preparation, P 1 was sometimes barely detected, P5 was generated due to loss of control on flow rate when it decreased be few -0,08 mL/min and afl retained sample components (larger microparticles and/or aggregates of small particles) were eluted out. As shown in FIG, 16B, when the initial cross- flow rate was increased to i .0 mL/min, no additional shoulder peaks were observed to separate further from peaks P2-P4, indicating the uniformity of these three populations of particles. A delay in the elution of all three peaks was observed. Moreover, a much higher P5 peak was observed and this is due to insufficient time for elution of large particles, including Exo-L, in the given time and based on the channel size. In contrast, when the initial cross-flow rate was set to
0,3 ml/min, the samples eluted much earlier, indicating that this flow rate was not fast enough to retain the sample constituents inside the channel and resolve them efficiently. Therefore, an initial cross- flow rate of 0,5 mL/m!n was used throughout the procedure,
f§2S2) Next, the impact of different slopes of the cross- flow .grad lent on separation quality was evaluated, A linear decrease of the cross-flow rate from 0.5 to 0 ml/min within a time span of 15, 30 and 45 minutes were compared. Clearly, the peaks became narrower and the separation quality was compromised when shorter time spans were used (PIG, I 6C), In addition, a larger PS peak was observed when a shorter time span was used, indicating insufficient time for elution of large particles,
10253] On the contrary, when longer time spans were used, the peaks broadened but with improved separation quality. This setting is desired when high-purity particles In discrete fractions need to be recovered for further offline characterization. However, when longer time spans are used, other practical issues, such as the dilution of samples and the sensitivity limit of online detectors for accurate measurement, have to be taken into account, Therefore, it was aimed to separate distinct subsets of exosomes (< 150 nm), which were clearly separated from each other when a time span of 45 minutes was applied (longer time spans were not tested), A linear gradient of the cross-flow decreasing from 0.5 to 0 mL/min for 45 minutes was chosen for the study.
Example 9 - Channel Height
|0254| Based on the working principle of AF4, the channel’s geometry, including Its width, height and shape, is critical for fractionation quality, The short channel utilized in this study is a product of Wyatt Technology (Santa Barbara, USA), which has a trapezoidal geometry (Co I fen Sc Antoruetti,“Field-Flow Fractionation Techniques for Polymer and Colloid Analysis,”
Adv. Palym. ScL 150:67-18? (2000); Litzen & WahSund,’’Zone Broadening and Dilution in Rectangular and Trapezoidal Asymmetrical Flow Field-Flow Fractionation Channels,”
Analytical Chemistry 63; 1001-1007 (1991 ), which are hereby incorporated by reference In their entirety) with a tip-to-tip length of 152 mm and a linear decrease of the channel width from 21.5 mm (dose to the injection port and about 12 m away from the inlet tip) to 3 . With the shape and width already opti ized and fixed, the height
 the thickness of the channel, determined by the spacer used between the upper wall and the bottom accumulation membrane) was the only parameter available for further optimization, A series of spacers with different thicknesses ( 190, 250, 350 and 490 pm) were provided by the manufacturer, The channel height
affects the parabolic laminar flow rate profile and thus the separation resolution, it also affects the channel capacity, with a thicker channel allowing for analysis of larger sample amounts. Since enough sample needed to be recovered for downstream analysis, the loading capacity is an important factor for the fractionation and so employing only spacers with a thickness of 350 pm and 490 pm were considered, As shown in FIG. 17, the channel with the 350-pm spacer eluted samples earlier but with narrower peaks and a reduced separation resolution compared to the channel with the 490-pm spacer. Therefore, the 490-pm spacer was chosen for the work.
the thickness of the channel, determined by the spacer used between the upper wall and the bottom accumulation membrane) was the only parameter available for further optimization, A series of spacers with different thicknesses ( 190, 250, 350 and 490 pm) were provided by the manufacturer, The channel height
affects the parabolic laminar flow rate profile and thus the separation resolution, it also affects the channel capacity, with a thicker channel allowing for analysis of larger sample amounts. Since enough sample needed to be recovered for downstream analysis, the loading capacity is an important factor for the fractionation and so employing only spacers with a thickness of 350 pm and 490 pm were considered, As shown in FIG. 17, the channel with the 350-pm spacer eluted samples earlier but with narrower peaks and a reduced separation resolution compared to the channel with the 490-pm spacer. Therefore, the 490-pm spacer was chosen for the work.

|0255| ATOO-pL sample loop was used in tl¾e instrume for sampleloading, It is a significant portion of the total channel capacity, which usually ranges from 200 pL to 1000 pL. Once injected into the channel, the sample would spread throughout the channel and lead to insufficient fractionation. To avoid this, a flow opposing the channel forward flow was introduced from the outlet and, together with the channel How, focused the sample into a narrow' band close to the injection port {? ., focus mode). First, the focus flow was established and then the samples were Injected in the focus mode and given enough time to reach stead y state equilibrium before elution. The focusing flow rate and focusing time determine foeusing efficiency. Here, the focusing flow rate was fixed at 0.5 mL mirs, the same as the initial cross- flow rate for elution, and then tested different time periods (2, 5, d 10 minutes) for focusing efficiency. As shown in FIG. 18, different focusing times did not significantly affect peak shape or resolution power. Moreover, before exomere elution occurred, the fractograms of both UV and DLS reached similar baselines, Notably, it was observed that the P5 signal Intensity increased as focusing time increased, suggesting potential particle aggregation caused by extensive focusing. Therefore, a focusing time of 2 minutes was chosen for the study.
Example I I - Membrane Choice
(02561 Since the sample fractionation is performed dose to the membrane, in addition io the pore size of the membrane, the compatibility of the membrane material with the samples also needs to be considered. For example, the sample may bind to the membrane non-speeifteally. Two different types of membranes that are commonly used for biological material concentration or nitration, regenerated cellulose (RC) and polyethersulfone (PBS), were tested for exosotrse fractionation. While keeping other AF4 parameters exactly the same, a delay of sample elution and broader peaks was observed in the channel with PES compared with RC, suggesting
potential non-specific interactions between samples and the membrane (FIG. 19). Therefore, the RC membrane was selected for the studies,
Example 12 - Amount of Input Sample
[0257] Once the key fractionation parameters were determined, the loading capacity of
AF4 was then examined. The minimal amount of material required for AF4 is determined primarily by the sensitivity limit of the online detectors, such as DLS and UV monitors. The signal/noise ratio must be adequate for accurate data collection and interpretation. The maximal amoun of material is determined by the required resolution of fractionation, which depends on the purpose of the experiment and the complexity of the sample to be analyzed. To efficiently separate exomeres and the two exosome subsets that are reposted herein from small (s)BVs prepared using UC, different amounts of Bf 6-F!G~derived sEV input samples ranging from 15 pg to 165 pg were tested. As shown in FIG, 20, 15 pg was the lower limit of material for this analysis, as a high level of noise began to be detected, especially at the low end of" hydrodynamic size, Inputs of 40 pg and 100 pg yielded almost identical fractionation profiles and
hydrodynamic size determinations, indicating comparable fractionation resolution and robust signal detection. However, when the amount of input increased to 165 pg, the elution of ail peaks was delayed significantly, resulting in incomplete elation of Exo-L. Bleed-through of each particle population to the adjacent populations increased (and thus poorer separation occurred), as indicated by the increased signal intensity at the valleys between peaks. Therefore, an Input ranging from 40 pg to 100 pg was used for this study.

[0258] As illustrated in the above assessments, AF4 technology provides unique capabilities io separate nanoparticles with high resolution within a large size range. Through the highly robust and straightforward means of AF4, distinct exosome subpopulations and exomeres were able to be efficiently separated, These findings exhibit AF4's potential usefulness in identifying other distinct E V subpopulations. Coupled with online monitoring (e.g., multi-angle light scattering [MALSj, DLS, UV absorbance and fluorescent detection) and offline analyses (e.g., microscopy, mass spectrometry of proteins, lipids, glyearss and metabolites, and DMA and RNA sequencing), AF4 can yield valuable data on E P analytes, including particle morphology and size, relative abundance, molecular composition, and other biophysical and biochemical
properties. A powerful tool, AF4 can help researchers decipher the complexities and
heterogeneity of ENPs that cannot be well addressed with other existing techniques,
10259] The AF4 protocol describes the fractionation of exonieres and exosome subsets from sEVs isolated from the conditioned media of B 16-F 10 celts and a panel of more than 20 different cancer cell lines and 5 normal cell lines. This AF4 method can be used to fractionate and characterize sEVs isolated from an array of bodily fluids (including blood plasma or serum, lymphatic fluid, bone marrow plasma, cerebrospinal fluid, urine, saliva, bronchoalveolar lavage, milk and amniotic fluid), given their similar particle compositional complexity. Since ah cells are capable of shedding EVs, this protocol can be employed to study the EV biology of any organism,
|Q26Q| Not only for biological discovery, this protocol can also be modified for use in the field of quality control in exosome~based pharmaceutical production. Exosomes have become atractive therapeutic delivery vehicles for treating cancer and other types of diseases (Batrakova & Ki ,“Using Exosomes, Naturally-Equipped Nanocarriers, for Drug Delivery," ./ Control Release 219:396-405 (2015), which is hereby incorporated by reference in its entirety). AF4 coupled with sensitive molecular assays can serve as an improved analytic tool to evaluate purity, drug loading efficiency, and the integrity of the exosome product by detecting debris or aggregates,
(0261 ] Last but not least, this protocol can serve as a reference to further develop and optimize methods for fractionating and characterizing other types of ENPs. Some unique advantages of AF4 are its high resolution and large size range of fractionation and that different conditions, such as cross-flow setting and focus time, can be easily tested by simply programing the settings into the software, with minimal handling of the channel. Besides their use in analyzing exosomes and other sEVs, fractionation protocols for large EVs, such as larger microparticles and oncosomes, can be further developed. Specific caution should be taken when fractionating large particles since they may be too large to elute in the normal mode (when the particle is small and considered as point-mass compared to the channel height) but in the steric model instead (FIG. 15). Moreover, other Helds, such as electric field, can also be applied to AF4 to stratify particles based on additional biophysical properties other than size, allowing even broader application of AF4 technology,
(0262] Taken together, the separation and characterization of distinct EV subpopulations by AF4 are critical to advancing knowledge of the biology of EVs and their functional roles in physiological and pathological conditions. By profiling the molecular cargo of EVs, signature proteins, lipids, glycans and genes as well as specific signaling pathways associated with disease
progression can be identified, facilitating the identification of potential diagnostic/prognostic hiomarkers, including those related to cancers. Such knowledge will also provide a rationale for developing BNP-based therapies in clinical trials.
Comparison with other methods
f0263f A multitude of technologies, in addition to AP4, have been developed to isolate pure exosomes and other EV subpopulations. The most commonly used technique makes use of diiC and separates the particles bused on their hydrodynamic size and density. Successive centrifugation at different centrifugal forces eliminates dead cells and cellular debris (500 x g, 10 min), large oncosomes and apoptotic bodies (200CK-3CXM) x g, 20 minutes) and larger
microparticles ( 10,000 - 12,000 x g, 20 minutes), and subsequently pellets sEVs ( 100,000 x g, 70 minutes) (Thery et ah, "Isolation and Characterization of Exosomcs from Ceil Culture
Supernatants and Biological Fluids/" Carr Proioe Cell Btoi Chapter 3, Unit 3.22 (2006);
Jeppesen et ah, "Comparative Analysis of Discrete Exosome Fractions Obtained by Differentia! Centrifugation,” J Extrace!l Vesicles 3:2501 1 (2014); Cvjetkovie et ah, "The Influence of Rotor Type and Centrifugation Time on the Yield and Purity of Extracellular Vesicles,” J Extracell Vesicles 3 (2014), which arc hereby incorporated by reference in their entirety). Centrifuge rotor type, centrifugal force and centrifugation time are key factors influencing the product yield and purify of this method. Its performance also varies depending on the cell types studied (Wi!lms et ah,“Cells Release Subpopulations of Exosomes with Distinct Molecular and Biological Properties,” Set Rep 6:2251 (2016), which is hereby incorporated by reference in its entirety), dUC can process large volumes and high amounts of sample, hut the purify of the material recovered is poor, it can only roughly partition particles Into groups, such as large vesicles, microparticles, and sEVs (enriched for exomeres and exosomes), with expected heterogeneity within each group and contamination for other groups. The high centrifugal force may also cause sample aggregation. With the present protocol, the advantage of dUC was used by first stratifying and concentrating the sBV population and then analyzing particles at much higher resolution to further fractionate exomeres and exosome subsets,
[0264] Density gradient floatation (DGF) Is often used to further purify sEVs first isolated using dUC, In DGF, EVs are overlaid upon a gradient of increasing dilutions of a viscous solution (sucrose or iodixanol are commonly used) and, upon centrifugation, they migrate to the equilibrium density determined by the EV's size, shape and density, DGF is often used to remove non-membranous particles from EVs and has also been employed in several studies to address exosome heterogeneity (Aal bests et ah, "Identification of Distinct Populations of Prostasomes that Differentially Express Prostate Stem Cell Antigen, Annexln A I , and
GLIPR2 in Humans,” Bioi Reprod 86:82 (2012); Bo brie et aL,‘‘Diverse Subpopuiatie s of Vesicles Secreted by Different Intracellular Mechanisms are Present in Exosome Preparations Obtained by Differentia] U itracentri fugation,” J Extracell Vesicles I (2012); Willms et al, "Cells Release Subpopulaiions of Exosomes with Distinct Molecular and Biological Properties” Set Rep 6:22519 (2016), which are hereby incorporated by reference in their entirety). The major drawbacks of DGP, when compared to the performance of AF4, include its time-consuming preparations, lack of automation, operator-dependent reproducibility and low yield, Long periods of incubation with high sucrose concentrations can also damage EV integrity, necessitating additional washing steps for its removal. In contrast, AF4 is rapid, fully automated, highly reproducible, robust, and compatible with many buffer choices that mimic physiological conditions. Resolution and size range in EV fractionation is far superior with AF4 than with DGF (Tauro et aL, "Comparison of U Itracentri fugation, Density Gradient Separation, and hnmunoaffinity Capture Methods for Isolating Human Colon Cancer Cell Line LIM S 863- Derived Exosomes/ Methods 56:293-304 (2012), which is hereby incorporated by reference in its entirety),
|0265| SEC, a gentle means of nanoparticle fractionation, has been extensively used for protein and protein complex analysis in biochemical and biophysical studies. Recently, it has been adopted to fractionate EVs (Mol et ah,“Higher Functionality of Extracellular Vesicles Isolated Using Size-Exelusion Chromatography Compared to Ultracentrifugation/'
NanometHcim 13:2061 -2065 (2017); ordin et ah,“Ultrafillration with Size-Exclusion Liquid Chromatography for High Yield Isolation of Extracellular Vesicles Preserving Intact Biophysical and Functional Properties,” Nammedidm 1 1 :8?9-883 (2015); Doing et aL,“Single-Step Isolation of Extracellular Vesicles by Size-Exclusion Chromatography,” ,/ ExtraceU Vesicles 3 (2014); Willis et al.,“Toward Exosome- Based Therapeutics: isolation, Heterogeneity, and Fit- for-Purpose Potency/ FnmS Cardkmisc Me 4:63 (2017), which are hereby incorporated by reference in their entirety), in SEC, particles are separated in a column filled with porous polymer beads (stationary phase) based on their size and shape. Smaller-sized particles with a globular shape can penetrate the porous beads more readily, taking a longer route and more time to elute, whereas the larger particles are excluded from penetrating the pores and subsequently elute more rapi ly. The elution of particles with abnormal shapes Is more complicated due to its potential steric interference with particle traveling through the pores. Compared to other technologies, SEC has a resolution most similar to that of AF4. Still, AF4 demonstrates superior resolution over a much wider size range (Fraunhofer et ah,“The Use of Asymmetrical Flow Field-Flow Fractionation in Pharmaceutics and Biopharmaceutics,” Ear J Pharm Biophann
58:369-383 (2004), which is hereby Incorporated by reference in its entirety). SEC resolution drops when particles are close to or larger than the upper limits of pore size. Furthermore, SEC is not as flexible as AF4 in changing separation parameters and its size range of separation is fixed for a given column with a specific solitary phase. Moreover, AF4 contains a hollow channel with only a membrane at the accumulation wall but, unlike SEC, requires no stationary phase. This stationary phase In SEC generates shear stress and renders a much larger surface area than AF4 for nonspecific binding of analytes. Similar to AF4 methods, the input sample loading volume for SEC must be restricted and there Is an upper limit for the sample capacity to compromise a balance between sufficient yield and exemplary fractionation quality. Sample stratification by dUC and concentration methodologies prior to separation greatly facilitates the separation power of SEC.
[0266] UF allows for straightforward Isolation of EV populations based on their size by filtering the sample through a series of sermpermeahle membranes with defined pore sizes (be., as reflected by molecular weight cutoffs) (Xu ef aL, "Highly-Purified Exo somes and Shed Mierovesicles Isolated from the Human Colon Cancer Cell Line LIM 1863 by Sequential Centrifugal Ultrafiltration are Biochemically and Functionally Distinct,” Methods 87:1 1 -25 (2015); Xu et ah,“A Protocol for Isolation and Proteomic Characterization of Distinct
Extracellular Vesicle Subtypes by Sequential Centrifugal Uitnifiitratlonw Methods Mol Biol 1545:9 M 16 (2017), which are hereby incorporated by reference in their entirety). Smaller particles below the cutoff size can penetrate through the pores while larger ones are retained, UF provides a crude separation of EVs due to limitations of membrane pore size availability. Most EVs are not rigid spheres but rather flexible particles and can transfigure to pass through the pores, especially when pressure is applied. Another concern is the uniformity of membrane pore size, which Is critical for separation purity. Though the separation power of UF is Inferior to AF4, UF can serve as a means to pre-strati fy and concentrate input samples for further analysis by AF4.
|0267| Distinguishable from methods which separate EVs mainly by their size, l AC relies on the antigenic recognition of EV surface molecules (primarily proteins), IAC Is highly selective, fast and flexible to scale for either preparation or analytic purpose. This separation principle has been adapted for different formats of analysis and preparation, Including precipitation using immunomagnetie beads, flow analysis, detection by microarray, microscopy, western or BLISA assay, and microfiuidic separation (Thery et aL“Isolation and
Characterization of Exosomes from Cell Culture Supernatants and Biological Fluids,” Cun- Protoc Cel! Biol Chapter 3, Unit 3,22 (2006); Chen et aL "Microfiuidic Isolation and
Transcriptome Analysis of Serum Microvesicles f Lab Chip 10:505 51 1 (2010); Jorgensen el al„ “Extracellular Vesicle (EV) Array: Microarray Capturing of Exosomes and Other Extracellular Vesicles for Multiplexed Phenotyping,” ,/ Extracell Vesicles· 2 (2013); Ko et aL“miRNA Profiling of Magnetic Nancpore-tsolated Extracellular Vesicles for the Diagnosis of Pancreatic Cancer,5' Cancer Res. 78:3688-3697 (2018), which are hereby incorporated by reference in their entirety). The inherent limitation of IAC Is that knowledge about the surface antigen is a prerequisite, The other concern is that the IAC antigen may be represented in multiple subpopulations of EVs with divergent sizes and/or origins. Thus, the application of AF4 may further necessitate EV separation based on size. EVs captured by IAC are ideal for molecular content characterization but not for further functional studies due to inefficient removal of the capturing antibody, which may interfere with the functional assay or targeting and uptake by recipient cells. In contrast, AF4 is label-free and enables these functional analyses feasible,
Level of expertise needed to implement the protocol
|8268| The AF4 instrument is commercially available (e,g., Wyatt Technology) and the manufacturer can perform the initial set-up. The method development for specific sample analysis, routine maintenance of instruments, and troubleshooti ng require a good understanding of the working principles of AF4 and installed detectors, training for handing the AF4 channel and detectors, and being familiar with software used for AF4 operation and data collection, Previous experience with chromatography and/or microfluidics is helpful in mastering the AF4 application. However, once the AF4 fractionation method training has been achieved, only minimal skills, such as familiarity with software Interface and proper instructions, are necessary to complete the fractionation process since nearly all the steps are automatic and programmed. Limitations
[0269] One inherent limitation of AF4 is that it fractionates samples based on their size.
As a consequence, particles with the same hydrodynamic size but with different morphologies, surface molecules and other biophysical properties cannot be separated from each other via AF4 alone, However, other fields, such as electric field, can also be applied in conjunction with AF4 to provide further separation according to additional characteristics such as particle surface charge. Special consideration is also required when developing a protocol for large particles whose sizes are too large to be considered as point-mass compared to the channel height. These large particles will elute in the steric mode rather than the normal mode, as illustrated in Figure i ,
[0270] A second inherent drawback is that AF4 cars accommodate only small amounts of sample ie.g., 40 pg to 100 pg in the present case), which is often not efficient for large-scale
preparations in more detailed assessments of nanoparticle properties. The sample instead can he divided into multiple fractionation analyses for improved characterization of specific
nanoparticle subsets, A third limitation of AF4 is that due to the loading capacity limitation, the input sample requires UC preparation or other means to first stratify and concentrate the analytes (i.e. sEVs in the present study) prior to fractionation.
[0271 J Furthermore, it has to be pointed out that no single formula can be universally applied for analysis of different types of samples. The fractionation method and key parameters discussed above in the protocol development section have to be developed and optimized based on the complexity (i.e, size and abundance of each component) of the sample o ('interest, In certain eases, different running methods and instrument settings may have to be combined sequentially to efficiently separate different components within a complex sample,
[0272] A detailed protocol has been described herein for optimal sEV preparation and fractionation via AF4, The key steps for successful of AF4 separation are: (1) the preparation of sEVs from conditioned media of cell culture; (II) development and optimization of the AF4 running methods; (iii) online data analysis and fraction collection for offline characterization, [0273] Pre-stratification of the sEVs using methods such as UC is critical to reduce the complexity of the samples to be analyzed in their particle composition. This allows enough material for each subpopuiation of sEVs present in the samples to be analyzed by a single run of AF4. Otherwise, a series of AF4 methods for best separation of particles within different size ranges have to be adapted. Another key factor for successful AF4 analysis and fractionation is the amount of Input samples loaded onto the AF4 system. Overloading the system will result in poor resolution and inefficient separation of narsopartseles; whereas loading too little a sample will lead to poor signal detection and inaccurate data deduction, as shown in FIG. 19.
[0274] Five major parameters for AF4 running method optimization have been discussed, including cross flow, channel height, focus time, loading amount, and membrane type (see FIGs. 16-19). A representative AF4 fractionation profile of B I6-F 10 derived sEVs is shown in FIG,
22, Based on the method described here, three major subpopulations of sEVs are identified (FIG, 22A, i.e, exomeres, Exo-S and Exo-L, corresponding to peaks P2, P3 and P4,
respectively). The autocorrelation function Is a key factor to determine the purity of each fraction (FIG, 22B), The separated particles can be further recovered and usuall need further concentration for a variety of offline analyses, such as TEM, NTA, BCA assay,
biophysical/biochemical property characterization, molecular composition determination, and functional studies. Shown in FIG. 22C is TEM imaging analysis of combined fractions for B l b- Fi O exomeres, Exo-S and Exo-L, revealing the distinct morphology of each sEV subset.
Exa le 13 - Examina ion of Systemic Functions of Exomeres, Exo-S, and Exo-L
11)275] To investigate their systemic functions, especially in liver, B 1 S-Ff 0 murine melanoma-derived ex o me res, Exo-S and Exo-L were intravenously injected into naive, syngeneic C57BL/6 mice. An equal volume of PBS was Injected as the control, 24 hours later, livers were harvested from each group of treated mice and subjected to total RNA extraction and RNA sequencing analysis. As shown in FIG. 23 A, a total of 5700, 5320, and 6291 genes were identified to be significantly (p<G,Q5) changed in their expression levels in the liver of mice treated with exomeres, Exo-S and Exo-L when compared with the PBS control group, respectively. Specifically, a list of 140 and 810 genes are uniquely changed in exomeres when compared with ExoS and Exo-L, respectively,
[0276] To further compare the changes in gene expression among each group, one-way
ANQVA analysis was performed and the result was illustrated in FIG, 23B for the top 2000 genes that are significantly changed- A large similarity was identified in ail three groups of exomeres, Exo-S, and Exo-L treated mice when compared to the PBS control group.
Specifically, shown in FIG. 24 are the top 50 gene lists that are up-regulated (FIG. 24A) or down-regulated (FIG, 24 B) in all three groups when compared to the PBS control group, respectively. These genes can therefore serve as potential biomarkers for detection of disease, monitoring liver dysfunction, and therapeutic targets to intervene with tumor progression in cancer patients. For example, the Serum Amyloid A family genes (Saal , Saa2 and Saa3), Si 00 calcium-binding protein A4 (S I 00A4), and a subset of rtfaosoma! protein subunits (Rp!4i , Kps24, Rp!36, Rpl35, Rpl21 , Rps 12, Rps 18, Rps 14, Rp! 12, RpL14. Rps 10, and Rpi 17) are specifically upregulated in the liver of mice treated with exomeres, Exo-S md Exo-L when compared to the FBS control, On the other hand, transcription factors such as Forkhead box protein N3 (Foxn3), TEA domain family member 1 (Tead l ), Nuclear Factor Of Activated T Cells 5 (Nfat5), Forkhead box Q! (Foxq l ), Forkhead box K t (Foxkl ), Kruppel Like Factor 12 (KIP 2), and ETS domain-containing protein (Elk4) are among the top 50 genes that are significantly down-regulated genes in all three groups,
|027?1 To further investigate the functional pathways that are remarkably influenced by exomeres, Exo-S, and Exo-L, Ingenuity Pathway Analysis was conducted upon each dataset. Shown in FIG. 25 are the top five canonical pathways that were identified In each dataset: exomere versus PBS (FIG. 25A); Exo-S versus PBS (FIG. 25B); Exo-L versus PBS (FIG. 25C); exomere versus Exo-S (FIG. 25D), and exomere versus Exo-L (FIG. 25 E). Importantly, pathways including E2F signaling, rnTQR signaling, and regulation of el F4 and p70S6K signaling are identified to be remarkably changed in all three groups of exomeres, Exo-S, and
Exo-L when compared to the PBS control indicating their Fundamental influence on the proliferation and metabolism of the liver. Beyond these findings, pathways of Molecular Mechanisms of Cancer and Glucocorticoid Receptor Signaling are specifically recognized among the top five canonical pathways in the exomere versus PBS group; pathways of
Mitochondrial Dysfunction and Oxidative Phosphorylation in the Exo-S versus PBS group; and pathways of Nerve Growth Factor Signaling and Insulin Receptor Signaling in the Exo~L versus PBS group. Furthermore, when the exomere-treated group was compared to the Exo-S or Exo- L-treated groups, the following pathways are specifically recognized: Acute Phase Response Signaling, FXR/RXR Activation, Toll-like Receptor Signaling, LPS/IL-1 Mediated inhibition of R R Function, and Aryl Hydrocarbon Receptor Signaling in the comparison of exomeres versus Exo-S; Superpathway of Cholesterol Biosynthesis, Cholesterol Biosynthesis I, Cholesterol Biosynthesis 11 (via 24,25-dihydrolanosterol), Cholesterol Biosynthesis HI (via Desmostero!), and IGF-! Signaling in exomere versus Exo-t. Collectively, detection of the alteration in these signaling pathways may assist in detecting and monitoring tumor progression in cancer patient. They also represent potential therapeutic targets.
[0278] Proieomic analysis of exomeres has indicated its potential role in the metabolism of the target cells. To specifically follow up on this hypothesis, the livers harvested from mice 24 hours post injection of BI6-F I0 derived exomeres, Exo-S and Exo-L in comparison with the FBS control were subjected for metabolite extraction and mass spectrometry analysis, FIG, 26A listed the number of metabolites whose abundance are significantly affected in each comparison group using unpaired t test. One-way ANOVA analysis was utilized to further identify metabolites that are changed in all three experimental groups and those are uniquely affected in each group, FIG, 26B illustrated all the metabolites identified with significant changes and FIG, 26C showed the clustering analysis o the metabol tes that are uniquely a fleeted in each group.
In particular, the abundance of metabolites including thymine, taurine, and adenylosuccinate are found increased in all three groups of exomeres, Exo-S and Exo-L-treated mouse livers (FIG. 27A); whereas the abundance of the following metabolites including glucose-S-phosphate, L- arginino-suce ate, methylcysteine, sn-glycerol-3-phosphate, and tyrosine decreased in all three groups when compared to the PBS control (FIG, 27B), Furthermore, representative metabolites that are uniquely affected in each group (FIG. 26C) are Illustrated in FIGs. 28A-28C, Besides the altered gene expression, the aberrant regulation of these metabolites can be utilized as biomarkers to detect and monitor tumor progression and serve as potential therapeutic targets as well for cancer patients.
|0279| To further dissect the functional roles of exomeres in liver, irnmunofiuorescent coloealization analysis was conducted and Kupffer cells, the resident macrophages in liver, were identified as the primary cell type that uptakes B 16-F 10 melanoma derived exomeres. When intravenously administrated into the naive and syngeneic CS7BL/6 mice, more than 95% of exomeres previously labeled with the PK.H67 fluorescent dye were observed co localized with the F4/B0 positive Kupffer cells in the liver (FIG. 29). This finding implicates that Kupffer cell function can potentially be manipulated by tumor-derived exomeres and initiate a cascade of systemic effect to favor the tumor growth in vivo, therefore representing a potential target to develop therapeutic strategy for blocking cancer development.
[0280] Although preferred embodiments have been depicted and described in detai herein, It will he apparent to those skilled in the relevant art that various modifications, additions, substitutions, and the like can be made without departing from the spirit of the invention and these are therefore considered to be within the scope of the invention as defined in the claims which follow.
Claims
WHAT IS CLAIMED;
1 A method of diagnosing cancer in a subject, said method comprising: selecting a subject having cancer;
obtaining, from the selected subject, a population of either exomeres having a diameter of less than 50 nm, small exosomes having a diameter of 60-80 n , or large exosomes having a diameter of 90- 120 nm;
recovering the exomeres, small exosomes, or large exosomes from the sample; contacting the exomeres, small exosomes, or large exosomes or portions thereof with one or more reagents suitable to detect: { I ) higher or lower levels, relative to a standard for subjects not having cancer, or the presence or absence, of one or more proteins contained in said exomeres, small exosomes, or large exosomes, (2) higher or lower levels, relative to a standard for subjects not having cancer, or the presence or absence, of one or more N-glycans contained in said exomeres, small exosomes, or large exosomes, (3) higher or lower levels, relative to a standard for subjects not having cancer, or the presence or absence, of one or more lipids contained in said exomeres, small exosomes, or large exosomes, (4) the presence or absence of one or more genetic mutations in nucleic acid molecules associated with cancer and contained in said exomeres, small exosomes, or large exosomes, or (5) combinations thereof; and
diagnosing the cancer based on said contacting,
2, The method of claim I , wherein said sample is blood, serum, plasma, ascites, cyst fluid, pleural fluid, peritoneal fluid, cerebrospinal fluid, tears, urine, saliva, sputum, nipple aspirates, lymph fluid, fluid of the respirator}', intestinal, and genitourinary trances, breast milk, Intra-organ system fluid, peritoneal fluid, conditioned media from tissue explant culture, or combinations thereof.
3, The method of claim I, wherein exomeres are recovered,
4, The method of claim !, wherein small exosomes are recovered.
5. The method of claim 1, wherein large exosomes are recovered.
6. The method of claim 3, wherein said contacting is carried out by detecting, higher or lower levels, relative to a standard for subjects not having cancer, or the presence or absence, of one or more proteins contained in said exomeres,
7. The method of claim 6, wherein said method is carried out to determine if the subject has cancer by detecting, higher or lower levels, relative to a standard for subjects not having cancer, or the presence or absence, of one or more of the proteins selected from the group consisting of PPID, GANAB, MAT I A, CPYD, FAT4, GMPPB, ERP44, CALR, GPD ! , BZW L PFK.L OLFML3, HGD, LGALS3BP, GCLC, PEPD, MTHFD1 , PGD, ACTR3, XPNPEP1 , UGP2, SNX2, ALDOC, SEPT! 1, HSPA B, AARS, SERP04H 1 , GMDP2, PDE5A, AGE, EXT!, 1DH 1 , SEIIPINCI, RRM 1, CKB, H GCS ! , HPD, PSMC4, NPEPP5. CAT, EXT2, CORO 1C, B4GATE RACK 1 , MAPRE K PGM 1, PDIA3, ADK, SHMT!, ACOl , GSN, ESD, PPP2RI A, ALDH I LI , OLA ! , ACLY, EEF 1G, FLNB, PSMP I 1, ANGPTL3, FERMT3, PYGL, MDH L and EIFA2.
8, The method of claim 4, wherein said contacting is carried out by detecting, higher or lower levels, relative to a standard for subjects not having cancer, or the presence or absence, of one or more proteins contained in said small exosomes. , The method of claim 8, wherein said method is carried out to determine if the subject has cancer by detecting, higher or lower levels, relative to a standard for subjects not having cancer, or the presence or absence, of one or more of the proteins selected from the group consisting ofTTY!-B, PLOT! , FLOT2, TSPA I4, LAMCi , CD63, VB12A, ZDHHC20, VAMPS, VPS37B, ARRDCi, and TGFBR2.
10, The method of claim 5, wherein said contacting is earned out by detecting, higher or lower levels, relative to a standard for subjects not having cancer, or the presence or absence, of one or more proteins contained in said large exosomes
1 1 , The method of claim 10, wherein said method is carried out to deter ne if the subject has cancer by detecting, higher or lower levels, relative to a standard for subjects not having cancer, or the presence or absence, of one or more of the proteins selected from the group consisting of SQSTM I , ST1PJ , HINT! , WASF2, RASA3, EPB4I L2, QIPC1, SI00A I0, PP6, KJF23, RACGAP !, ANXA5, CASK, DIG L UP I , BAGS, TXN, ABI L ANXA 1 ,
CAPCL DBI, S100A6, CHMP2B, CHMP3, ANXA2 MYG!C, ANXA4, SNXI2, LI 7C,
STXBP3, CEP55, ALCAM, VCL, CHMP1A, FARE I, ACSL4, BA1AP2, SH3GLL DSTN,
LGALS l , CYF!Pi, CTNNA i , RAB31, ARF6, SLC1A5, EPS8, FMNL2, PGAMI, CNF, CHMP4B, ANXA3, VPS4B, GNGI2, PACSIN3, GLG!, VTA I, LYN, VPS37C, CHMP5, F3, DNAJA1, RHOC, GNA13, CHMF2A, ATP2B1, RDX, ATP1BK CAPZB, END I, DNAJA2, and CTNND1.
12, The method of claim 6, wherein said method is carried out to determine if the subject has melanoma by detecting, higher or lower levels, relative to a standard for subjects not having melanoma, or the presence or absence, of one or more of the proteins selected from the group consisting of GPH2, PΊH3, H2AFX, P EL, MATIA, HPD, ALB, B4GAT1, ARFi, GCLC, HGD, PPP2CB, PAH, AGL, RNPEP, PPID, BZWi, MEL DP YD, CA6, OLFML.3, NPEPPS, PREP, ERP44, RBLN. GPDI, GFPT1, CNDP2, PFKL, ALDH8AI, ATP6VI A, EN02, TH8S3, COROIC, EXT!, CAT, XPNPEPI, PYGL, CALR, and LGALS3BP,
I 3. The method of claim 8, wherein said method is carried out to determine if the subject has melanoma by detecting, higher or lower levels, relative to a standard for subjects not having melanoma, or the presence or absence, of one or more of the proteins selected from the group consisting o TYRPl, SDCBP, SDCBP, CD63, IGSF8, HSPA8, MLANA,
HBAI/HBA2, GPNMB, DCT, HSPA2, HSPAiL, HSPA5, Fv4, PDCD61P, RAB7A, ENVL CD81, GNB!, SYT4, GNB2, HIST1H2AH, GNAI2, GAPDH, APOE, BC035947, Histlh2al, ACTGI. ACTB, GNB4, GNAI3, SLC3A2, ACTC!, GNAS, SLC38A2, HIST2H2BF, ATPIA1, TFRC, T E I76B, VAMPS, TSPA IO, ADGRGI, Hist!h4a , P EL UBL3, PPIA,
ACTBL2, CD9, BACE2, and TSPAN4. 14, The method of claim 10, wherein said method is carried out to determine if the subject has melanoma by detecting, higher or lower levels, relative to a standard for subjects not having melanoma, or the presence or absence, of one or more of the proteins selected from the group consisting of HS A8, TYRPi, SDCBP, HSPA2, RPS27A, HSPAiL, MLANA, HSPA5, CD63, IGSF8, GPNMB, Fv4, ENVL PDCD61P, HSPA!A/HSPAIB, DCT, ACTGI, ACTB, P PI A, SLC3A2, ACTC1, CDS 3, ITM2C, EL87L. GNBE TSPAN4, DNA3AI, GNB2, TFRC, HBA1/HBA2, G AI2, SYT4, GAPDH, APOE, PM EL, MFGES, GNB4, GNAI3, GNAOI, DNAJA2, ATPIA!, ITGBI, TME 59, SLC38A2, GNA 12, IT VLB, GNAS,
HIST1H2AH, LAMP1, and EEF 1 A L
15, The method of claim 6, wherein said method Is carried out to determine if the subject has breast cancer by detecting, higher or lower levels, relative to a standard for subjects not having breast cancer, or the presence or absence, of one or more of the proteins selected from the group consisting of FOB, HIST2H2AB, COMP, HISTIH2BJ, C7, GSTA5, EN03, ARF3, SULTIC4, EIF4A2, MAT I A, GNB2, UGDH, AKR1B1Q, MTHFD1, CISC, DPP3, RPSA, OTUB1, ALDH8A3, Fi I, CTPS2, MG ATI, HYHi, LGALSL, GSTM3, GSTM5, PSMC!, F8, PRKAR2B, RPL10A, H RNPK, SEMA6D, SNX5, IARS, LCP2, ARPC4, PPP6C, PSMD6, PTPRS, TIE), PSMD8, PABPC4, RPSI8, CHAD, IPOS, FABP3, GALNT2, QPCT, STATSA, SEMA3A, NT5C2, IDE, STAT3, DPYSL3, PDXK, ARF5, PSMD5, GNE, NBEAL2, FHLI, TIMP3, POSTN, MAPRE2, 1TIH3, C3, EN02, FIND, OIT3, CAND1, SEPT2, USE2N, DPYSL2, C B, PTGES3, DSTN, PiCLR, THBS3, RAP IB, HIST2H2AB. ACTBL2, TUBB2A, FIO, C TN!, HPD, ACE, EML2, HSPA13, TNXB, HEXB, CALR, ADH5, GPXi, CFL2, KRT76, TCP I, COTLL DYNttC HGD, A I DOC, EPRS, GLOl, MAN2AI, FLT4, APH4, R.ARS, HMGCS1, GANAB, SEPT?, FKBP4, COL12A1, ADSL, AKRIC2Q, VASN, DDX39B, ME 3, COMT, ALDHIA3, EIF4A3, CDHI I, PRPSII3, P PEP, NPEPPS, SEPT! I, CMBL, PSMDi, ACTRI B, PS D3, GCLC, FAT4, LPL, GPDIL, GCLM, VARS, PHPTI,
CACNA2DI, SEPT9, GLRX3, AARS, GMPPB, SNX2, GLOD4, PTPRF, CSAD, PXDN, AGL, DP YD, PRKACB, LARS, PPID, LTA4H, PSMD7, CAPNSI, ETFI, IARS, VPS35, TKFC, HYOU 1 , PGM2, TKT, HMCN I , CYB5R3, GPS I , LIMPS, SNDI , RTCB, RPL26, CARM I , PLCG2, P4HA2, COR06, GMPS, IGSF8, PPP1R7, TIMP3, UXS!, DNM2, MEMO!, RPS3, ARHGDI A, PTGES3, NRP2, RAB1A, HBG2, and YWHAQ.
16, The method of claim 8, wherein said method is carried out to determine If the subject has breast cancer by detecting, higher or lower levels, relative to a standard for subjects not having breast cancer, or the presence or absence, of one or more of the proteins selected from the group consisting of SDCBP, HISTIH2BN, HIST! H2AH, HBA1/HBA2, ITGBi, Hist! h4a , PDCD6IP, HIST3H2BB, H2AFX, CD9, CD63, ITGA3, 3TIH2, MFGE8, H2AF2, PTGFRN, Histlh3b, HSPA8, ACTGI, ACTB, ARRDC1, ACTCi, ITIH3, IGSF8, GSN, TUBA4A, H1ST1HID, TUBA I A, H1STI HIC, TUBS I, HSPA2, ENOI, MVBI2A, HTRA1, GAPDH, Hist! hie, VPS28, TSGI0I, TUBS, TUBB4A, RAP! B, PF ECD8I, VPS37B, TUBBS, RAP) A, EPCAM, Histlhlb, PPIA, ADAM 10, NBA I, H1ST1H2BK, A2M, ED 113, SDCBP, MFGE8, GSN, H1ST2H2AC, H1STIH2AC, H2AFX, ACTB, THBSL ΪTΪH4, TUBS , TUBB2A, TUBB4B, FIO. H2AFZ, TUBB4A, TUBBS, TUBS I, HSPA8, CD9, CDS I, GAPDH, PEN I, HIST1H4A, HSP9QAAL HSP90ABI, MSPA2, HSST2H3A , PGKI, THBS2,
EEFIAL GPX3, ITGBl. PPIA, PDCD61P, EEF1A2, FBLNL ATfC, CPNES, TINE HSP.A5, PKM, H1ST1HIC, WDRI, RAN, PYGL, and 1TGA3,
I?. The method of claim 10, wherein said method is carried out to determine if the subject has breast cancer by detecting, higher or lower levels, relative to a standard for subjects not having breast cancer, or the presence or absence, of one or more of the proteins selected from the group consisting of FDCD6IP, SDCBP, END I, ITGBl, S100A6, 1TGA3,
CD9, VPS37C, Hisilh4a , RAP IB, CTNMAI, MSN, HI5TIH2AH, 1TGA2, PTGFRN, ACTG1, H1STIH2BN, Calmi, EPCAM, 1TGA6, YWHAE, HSPA1 A/HSPAf B, GNBL SLC3A2, GNB2, EHD2, H2AFX, PPIA, NT5E, VPS4B, GNB4, Cdc42, SLCIA5, GNA12, CFLI, YWHAH,
EEF1AL YWHAB, Hisllh3b, TSGI0L YWHAG, AMXAS, GNAI3, F5, FDF3A/B3F3B, CHMP4B, HSPA5, EZR, GAPDH, CDS I, ED1L3, HBA1 HBA2, UBC, SDCBP, BSPA8,
ITGBl, CD9, HSPA2, ACTC1, ACTS, ACTG1, PDCD61P, AFP, HBG2, ANXA2, 1TGA3, H1STIH2BK, GAPDH, CDS! , SLC3A2, GNAI2, GNAI3, GNAil, ATP I Al, HIST2H2AC, CPNES, !STl, PENS, TUB A4A, H2AFX, TUBA1C, HSPA5, YWHAZ, ENO!, ANXA5, GNAS, DNAJA!, CHMP5, EEFiAl, RHOA, KRT!, CEP55, GNB1, ACTBL2, ITGA2, EPHA2, GNA 13, PPIA, RAP! A, and CD59.
! 8, The method of claim 6, wherein said method is carried out to determine if the subject has pancreatic cancer by detecting, higher or lower levels, relative to a standard for subjects not having pancreatic cancer, or the presence or absence, of one or more of the proteins selected from the group consisting of SUIT! El, PK.LR, EN02, AK I Bi, FH, MGAT2, GPXI, DFP3, SEMA4B, GPDLCSAD, NCAMi, PCMTI, NARS, THGP1, UMPS, PDE5A,
CACNA2D1, TIEI, CDH1 L AGX!, F8, GLB1, RPL!GA, ACAP2, UXS1, ADSL, BMPi, PSMD3, LANCLi, GLOl, PPP2CA, ESD, PSMD5, FARSB, PAFAH!BU SNX5, XPOL MAPRE1, APRT, NEOl, GBA, THBS1, PYGL, THBS2. FATA CNTNi, AKRIC2G, EIF4A2, ESD, BPGM, VASN, MAT! A, 1V1AT2A, PFKL, CLIC5, HOD, GLOD4, AGL, PLEKHB2, CLSTNI, STB, CMBL, AKRIE2, PRKAR2A, GPDl, LGALSL, GLA, !L!RAP, GMPPB, PCSK6, SEPT9, PSMC6, PYN, PAFAH!B!, VPS37C, GTNNDi, NRBPI, ERP44, SHMIL DARS, ADSL, GCLM, ALDOC, EPHA4, PEPD, CKB, PCMTI, UGDH, PRKA l A, and GNAS.
19, The method of claim 8, wherein said method is carried out to determine If the subject has pancreatic cancer by detecting, higher or lower levels; relative to a standard for subjects not having pancreatic cancer, or the presence or absence, of one or more of the proteins selected from the group consisting of SDCBP, PDCD6IP, HSPA8, IGSF8, CD9, PTGFRN,
ACTC1, LY6E, ACTB, MFGE8, HSPA2, CDS I, ITGA3, ITGBI, GPH2, VPS28, CD63, HTRAI, ENVI. Fv4, GSN, ENOL ED1L3, MVBI2A, IF1TM3, SERPINCi, ACTBL2,
TUBA 4 A, PPIA, HSPA1A/HSPA1B, HSPA5, GAPDH, T5G10 TUBB, PLEKHB2, TUBA!C,
5 TUBB4B, PPM I, GPCI, GJA1, EHDI GNB2, TSPAN4, G AI2, SLC3A2, VPS37B, GRAB, RA87A, EEFI A3, GNAS, ALB, HBA1/HBA2, CD9, UBC, SDCBP, F2, ACTG1, ACTB,
CD59, ACTC1, ACTA2, A2M, HIST1H2BK, HIST1H2B3, HSPA8, TSPAN3, HIST2H2AC, CD55, H3F3A/H3F3B, HIST2H3PS2, PDCD6IP, ITGBI, POTEJ, SER3NC5, H2AFZ,
ARRDC 1 , CLDN3, NT5E, EPCAM, CDH i 7, ATPIAI, ALPPL2, H1ST2H2AB, ALPP, HSPA2,
10 TSPAN8, MVP, ADAM 10, THBSI, VNN3, ITGAV, 1GSF8, MYOF, ATP1 A2, AHCY, GSN, TSPAN1, PPIA, SDCBP2, and HSPA5,
20 The method of claim 10, wherein said method is carried out to determine if the subject has pancreatic cancer by detecting, higher or lower levels, relative to a standard for subjects not having pancreatic cancer, or the presence or absence, of one or more of the proteins selected from the group consisting of ACTGI, ACTGI, ACTB, MFGE8, ITGBI, HSPA8, ITGA3, SDCBP, GAPDH, LGALSI, E VE Fv4, YWHA2, PPIA, GNB!, GNA32, GNB2, ACT8L2, GNAI3, CFL3, Marcks, GNAS, EEFI A I, ENOL BSG, Calml, SI00A4, MSN, EZR, RDX, PTGFRN, PK.M, SLC3A2, HBAI/HBA2, EDIL3, GNAI3, RHOA, RHOC, S1D0A6, YWHAE, ALDOA, PDCD6IP, PFN 3 , HSP90AB 1 , YWHAQ, ANXA I , ANXA2, ATP I A I, 0 1TGA6, UBC, HBA1/HBA2, CD9, ACTGI, ACTB, CD59, MVP, SDCBP, ACTCI, ACTA2, H1ST3H2BK, H1ST2H2AC, ALB, HSPA8, HIST! H2BJ, CD55, H3F3A, TSPAN3,
HIST2H3PS2, POTEJ, DPP4, NT5E, EPCAM, VNN!, H2AFZ, ITGBI, ALPPL2, HIST2H2AB, ATPIAI, ALPP, 1ST!, PDCD61P, MUC13, ANXA11, HSPA2, CDH)?, GPA33, ANXA2, S100A6, AΊΊRIA2, PPIA, EGFR, TSPA 8, MYOF, GNA11, GNA12, GNAI3, S100A4, CLDN3,
'!S and A2M
2! . The method ofclaim I , wherein said one or more reagents suitable for detecting, higher or lower levels, relative to a standard for subjects not having cancer, or the presence or absence, of one or more proteins contained in said exomeres, small exosomes, or large exosomes measure protein expression level,
30
22. The method of claim 3, wherein said contacting is carried out by detecting, higher or lower levels, relative to a standard for subjects not having cancer, or the presence or absence, of one or more N-glycans contained in said exomeres.
23, The method of claim 22, wherein said one or more N-glyeans are selected from the group consisting of N-glycan (Fucose) + GicN Acp 1 -6{GlcN Aob 1 ~2)Mana I 6{GlcN A b I -4(GieM Acp 1 ~2)Marsa 1 ~3)Manp I -4GIcN Acp 1 -4(Fuea I -6)GlcNAcp I -Asn and N-gl can (Fucose) + Neu5 Acu2-8Ney5 Aca2~3Gaip i -3/4GicN Aob 1 -2Mana I ~3(Mana 1 -3{Mana l -
6))Manct I ~d)M¾hb I -4GfcMAcj31 -4GlcNAcp I -Asn.
24, The method of claim 4, wherein said contacting is carried out by detecting, higher or lower levels, relative to a standard for subjects not having cancer, or the presence or absence, of one or more N~glycan$ contained in said small exosomes.
25, The method of claim 5, wherein said contacting is carried out by detecting, higher or lower levels relative to a standard for subjects not having cancer, or the presence or absence, of one or more N-g!yeans contained in said large exosomes,
26. The method of claim 3, wherein said contacting is carded out by detecting, higher or lower levels, relative to a standard for subjects not having cancer, or the presence or absence, of one or more lipids contained in said exomeres,
27, The method of claim 26, wherein said one or more lipids are selected from the group consisting of phospholipids, sphingohpids, and glyeerolipids.
28, The method of claim 27, wherein said one or more lipids are selected from the group consisting o TG, Cer, LPG, CL, CerG2, MG, LPC, FG, DO, and CerGI .
29, The method of claim 4, wherein said contacting is carried out by detecting, higher or lower levels, relative to a standard for subjects not having cancer, or the presence or absence, of one or more lipids contained In said small exosomes, 30, The method of claim 29, wherein said one or more lipids are selected from the group consisting of phospholipids, sphingolipkis, and g!yeerofipkfs,
31 , The method o claim 30, wherein said one or more lipids are selected from the group consisting of LPE, PC, PI, PE, LPE, PS, PC, SM, and CerG3.
32, The method of claim 5, wherein said contacting is carried out by detecting, higher or lower levels, relative to a standard for subjects not having cancer, or the presence or absence, of one or more lipids contained in said large exosomes.
33, The method of claim 32, wherein said one or more lipids are selected from the group consisting of phospholipids, sphingoiiplds, and glyeero!ipids.
34, The method of claim 33, wherein said one or more lipids are selected from the group consisting of LPE, PC, Pi, PE, LP1, PS, PC, SM, and CerG.l,
35. The method of claim I , wherein said contacting is carried out hv detect! ns the presence or absence, relative to a standard for subjects not having cancer, of one or more genetic mutations in nucleic acid molecules associated with cancer and contained in said exomeres, said small exosomes, or said large exosomes.
36. The method of claim 35, wherein the nucleic add molecule is DMA,
37. The method of claim 35. wherein the nucleic acid molecule is RNA.
38. The method of claim I further comprising:
selecting a suitable cancer therapeutic based on said diagnosing and administering the selected cancer therapeutic to said selected subject,
39. A method of prognosing cancer in a subject, said method comprising: selecting a subject having cancer;
obtaining, from the selected subject, a population of either exomeres having a diameter of less than 50 nm, small exosomes having a diameter of 60-80 nm, or large exosomes having a diameter of 90-120 nm;
recovering the exomeres, small exosomes, or large exosomes from the sample; contacting the exomeres, small exosomes, or large exosomes or portions thereof with one or more reagents suitable- o detect: (I ) higher or lower levels, relative to a standard or to the level in a prior sample obtained from the subject, or the presence or absence, of one or more proteins contained in said exomeres, small exosomes, or large exosomes, (2) higher or lower levels, relative to a standard or to the level in a prior sample obtained from the subject, or
the presence or absence, of one or more N-g!ycans contained in said exomeres, small exosomes, or large exosomes, (3) higher or lower levels, relative to a standard or to the level in a prior sample obtained from the subject, or the presence or absence, of one or more lipids contained in said exomeres, small exosomes, or large exosomes, (4) the presence or absence of one or more genetic mutations in nucleic acid molecules associated with cancer and contained in said exomeres, small exosomes, or large exosomes, or (5) combinations thereof; and
prognosing the cancer based on said contacting,
40. A method of managing treatment of a subject having cancer, said method comprising: . .
selecting a subject undergoing treatment for cancer;
obtaining, from the selected subject, a population of either exomeres having a diameter of less than 50 nm, small exosomes having a diameter of 60-80 nm, or large exosomes having a diameter of 90- 120 nm;
recovering the exomeres, small exosomes, or large exosomes from the sample; contacting the exomeres, small exosomes, or large exosomes or portions thereof with one or more reagents suitable to detect: (!) higher or lower levels, relative to a standard or to the level in a prior sample obtained from the subject, or the presence or absence, of one or more proteins contained In said exomeres, small exosomes, or large exosomes, (2) higher or lower levels, relative to standard or to the level in a prior sample obtained from the subject, or the presence or absence, of one or more N-glycans contained in said exomeres, small exosomes, or large exosomes, (3) higher or lower levels, relative to a standard or to the level in a prior sample obtained from the subject, or the presence or absence, of one or more lipids contained in said exomeres, small exosomes, or large exosomes, (4) the presence or absence of one or more genetic mutations in nucleic acid molecules associated with cancer and contained in exomeres, small exosomes, or large exosomes, or (5) combinations thereof; and
modifying said treatment, as necessary, based on said contacting.
41. The method of claims 39 or 40, wherein said sample is blood, serum, plasma, ascites, cyst fluid, pleural fluid, peritoneal fluid, cerebrospinal fluid, tears, urine, saliva, sputum, nipple aspirates, lymph fluid, fluid of the respiratory, intestinal, and genitourinary trances, breast milk, intra-organ system fluid, peritoneal fluid, conditioned media from tissue explant culture, or combinations thereof.
42, The method of claims 39 or 40, wherein exomeres are recovered.
43, The method of claims 39 or 40, wherein small exosomes are recovered.
44. The method of claims 39 or 40, wherein large exosomes are recovered.
45, The method of claim 42, wherein said contacting Is carried out by detectings higher or lower levels, relative to a standard or to the level in a prior sample obtained from the subject, or the presence or absence, of one or more proteins contained in said exomeres.
46, The method of claim 45, wherein said contacting is carried out by detecting, higher or lower levels, relative to a standard or to the level in a prior sample obtained from the subject, or the presence or absence, of one or more of the proteins selected from the group consisting of PPID, GANAB, MAΊΊA, CPYD, FAT4, G PPB, ERP44, CALK., GPDL BZW1, PFKL, OLFML3, HGD, LGALS3BP, GCLC, PBPD, MTHFD I , PGD, ACTR3, XPN EPi, UGP2, SNX2. ALDGC, SEPT! I , HSPA I 3, AARS, SERPINH I , CNDP2, PDE5A, AGL, EXT I, IDH 1, SERPINC I , RRM !, C B, HMGCS! , HPD, PSMC4, NPEPPS, CAT, EXT2, CORO 1 C, B4GATI , RACK ! , MAPRE!, PGM I , PD1A3, ADK, SHMTi , ACOl, GSN, BSD, PPP2RIA, ALDH I L! , OLA I , ACLY, EEFI G, FLNB, PSMD I I, ANGPTL3, FERMT3, PYGL, MDH1, and E1FA2.
47. The method of claim 43, wherein said contacting is carried out by detecting, higher or lower levels, relative to a standard or to the level in a prior sample obtained from the subject, or the presence or absence, of one or more proteins contained in said small exosomes,
48, The method of claim 47, wherein said contacting is carried out by detecting, higher or lower levels, relative to a standard or to the level in a prior sample obtained from the subject, or the presence or absence, of one or more of the proteins selected from the group consisting of TTYH3, PLOT! , PLOT2, TSPAN 14, LAMC I , CD63, MVB 12A,
ZDHHC20, VAMP3, VPS37B, A RE DC L and TGFBR2.
49. The method of claim 44, wherein said contacting is carried out by detecting, higher or lower levels, relative to a standard or to the level in a prior sample obtained
from the subject, or the presence or absence, of one or more proteins contained in said large etiosomes. 50. The method of claim 49, wherein said contacting is carried out by detecting, higher or lower levels, relative to a standard or to the level in a prior sample obtained from the subject, or the presence or absence, of one or more of the proteins selected from the group consisting of SQSTM I , STIP L HINT!, WASF2, RASA3, EPB4IL2, GiPCi, SIOOA!O, PP6, K1F23, RACGAPt, AMXA5, CASK, DLGI, TJPi, BAGS, TX , ABU, A XAL CAPO, DBS, S1QGA6, CH P2B, CHMP3, ANXA2, MYOIC, ANXA4, SNXI2, LS 7C, STXBP3, CEP55, ALCA , VCL, CHMPS A, FA P1, ACSL4, BASAP2, SH3GLI, DSTN, LGALSI, CYPIPi, CTNNAI, RAB3I, ARF6, SLCIA5, EPS8, FMNL2, PGAM1, CNP, CHMP4B, ANXA3. VPS4B, GNGI2, PACSIN3, GLGS, VTAS, LYN, VPS37C, CHMPS, F3, DNAJAi, RHOC, GNA13, CHMP2A, ATP2BI, RDX, ATPI Bl, CAPZB, EHD3, DNAJA2, and CTNNDI.
51. The method of claim 42, wherein said subject has, or is undergoing treatment for, melanoma and said contacting is carried out by detecting, higher or lower levels, relative to a standard or to the level in a prior sample obtained from the subject, or the presence or absence, of one or more of the proteins selected from the group consisting of ITIFI2, IT1H3, H2AFX, PM EL, MAT! A, HPD, ALB, B4GATI, ARFLGCLC, HGD, PPP2CB, PAH, AGL, R PEP, PPID, BZWI, ME I, DPYD, CA6, OLFML3, NPEPPS, PREP, ERP44, RELN, GPDL GFPTI, CNDP2, PFKL, ALDH8A 3 , ATP6V I A, EN02, THBS3, CORO 1C, EXT!, CAT, XPNPEP!, PYGL, CALR, and LGALS3BP.
52. The method of claim 43, wherein said subject has, or is undergoing treatment for, melanoma and said contacting is carried out by detecting, higher or lower levels, relative to a standard or to the level in a prior sample obtained from the subject, or the presence, of one or more of die proteins selected from the group consisting of TYRP! , SDCBP, SDCBP, CD63, 1GSF8, HSPA8, MLANA, HBA!/H BA2, GPNMB, DCT, HSPA2, HSPA1L, MS PAS, Fv4, PDCD6IP, RAB7A, ENVRCDSI, GNB!, SYT4, G B2, H1STIH2AH, GNAI2, GAPDH, APOE, BC035947, Histlh2al, ACTG!, ACTS, GNB4, GNAI3, SLC3A2, ACTCI, GNAS, SLC38A2, HIST2H2BP, AT I A!, TFRC, T EMI76B, VAMP8, TSPANI0, ADGRG1,
Hist 1 h4a , PM EL, UBL3, PP!A, ACTBL2, CD9, BACE2, and TSPAN4.
S3. The method of claim 44, wherein said subject has, or is undergoing treatment for, melanoma and said contacting is carried out by defecting, higher or lower levels, relative to a standard or to the level in a prior sample obtained from the subject, or the presence or absence, of one or more of the proteins selected from the group consisting of I-ISPA8, TYRPI, SDCBP, HSPA2, RPS27A, HSPA1L, MLANA, HSPA5, CD63, IGSF8, GPNMB, Fv4, ENV!, PDCD61P, HSPAt A/HSPAIB, DCT, ACTGI, ACTS, PPIA, SLC3A2, ACTC1, CDS!, ITM2C, RAB7A, GNB1, TSPAN4, DNAJA1, GNB2, TFRC, HBAI/HBA2, GNAI2, SYT4, GAPDH, APOE, PM EL, MFGE8, GNB4, GNA33, GNAOI, DNAJA2, ATPIA1, ITGB!, TMEM59, SLC38A2, GNAI2, IT 2B, G AS, HISTIH2AH, LAMP!, and EEFIA!.
54. The method oiclaim 42. wherein said subject has, or is undergoing treatment for, breast cancer and said contacting is carried out by defecting, higher or lower levels, relative to a standard or to the level in a prior sample obtained from the subject, or the presence or absence, of one or more of the proteins selected from the group consisting of FGB, H1ST2H2AB, COMP, HIST1H2BJ, C7, GSTA5, EN03, ARB, SULT1C4, E1F4A2, MAT! A, GNB2, UGDH, AKR!B!O, MTHFDI, CTSC, DPP3, RPSA, OTUB1, ALDHSA1, FI i, CTPS2, MG ATI, HYHI, LGAL8L, GSTM3, GST 5, PSMCU'8, PRKAR2B, RPL10A, H RMPK, SEMA6D, SNXS, LARS, LCP2, ARPC4, PPP6C, PSMD6, PTPRS, TIBI, PSMD8, PABPC4, RPSI8, CHAD, IPOS, FA8P3, GALNT2, QPCT. ST ATS A, S EM A3 A, T5C2, IDE, STAT3, PPYSL3, PDXK, ARF5, PSMDS, GNE, NBEAL2, FF!LI, TIMP3, PGSTN, APRE2, 1TIH3, C3, EN02, PP3D, 01T3, CANDI, SEPT 2, UBE2N, DPYSL2, CKB, PTGES3, DSTN, PKLR, THBS3, RAP1B, H1ST2H2AB, ACTBL2, TUBB2A, F10, CNTN1, HPD, ACE, EML2, HSPAI3, T XB, HEXB, CALR. ADH5, GPXI, CFL2, KRT76, TCPj, COTLI, DYNLLI, HGD, ALDOC, EPRS, GLOl, MAN2A], FLT4, NAP1L4, RARS, HMGCS! , GA AB, SEPT7, FKBP4, COL12A1, ADSL, AKR1C20, VASN, DDX39B, MEI, COMT, ALDH1 A), EIF4A3, CDHI I, PRPSI13, PNPEP, PEPPS, SEPTI I, CMBL, PSMDI, ACTR3 B, PSMD3, GCLC, FAT4, LPL, GPDIL, GCLM, VARS, PHPTI, CACNA2D!, SEPT9, GLR.X3, AARS, GMPPB, S X2, GLOD4, PTPRF, CSAD, PXDN, AGL, DP YD, PRKACB, LARS, PPfD, LTA4H, PSMD7, CAPNSI, ETFI, IARS, VPS35, TKFC, HYOU1, PGM2, TKT, FIMCN1. CYB5R3, GPS I, UMPS, SMDI, RTCB, RPL26, CARMI, PLCG2, P4HA2, C0R06, GMPS, IGSF8, PPPIR7, TI1VIP3, UXSL DNM2, MEMO!, RPS3, ARHGD!A, PTGES3, NRP2, RAB1A, HBG2, and YWHAQ.
55. The method of claim 43, wherein said subject has, or is undergoing treatment for, breast cancer and said contacting Is carried out by detecting, higher or lower levels, relative to a standard or to the level in a prior sample obtained from the subject, or the presence or absence, of one or more of the proteins selected from the group consisting of SDCBP, HISTSH2BN, H1STIH2AH, HBAS/HBA2, ITGBL Histlh4a , PDCD6IP,
H5ST3H2BB, H2AFX, CDS), CD63, ITGA3, 1TIH2, MFGE8, H2AFZ, PTGFRN, Histlh3b, HSPAS, ACTGI, ACTB, ARRDCi, ACTC!, 1T1H3, 1GSF8, GSM, TUBA4A, HIST! HID, TUBA! A, HfST!H!C, THBS!, HSFA2, ENOL MVBI2A, HTRAI, GAPDH, HisUhie,
VPS28, TSGI01, TUBE, TUBB4A, RAP IB, PFNI, CDS!, VPS37B, TUBBS, RAP I A,
EPCAM, Htsilhlb, PP1A, ADAM 10. HBAI, HIST! H2BK, A2AI, ED1L3, SDGBP, MFGE8, GSN, H1ST2H2AC, HISTIH2AC, H2AFX, ACTB, THBS1, 1TIH4, TUBE , TUBB2A,
TUBB4B, FiO, H2AFZ, TUBB4A, TUBB6, TUBBL HSPAS, CD 9, CDS!, GAPDH, PFNI, HIST1H4A, HSP90AAI, HSP90ABI, HSPA2, HIST2H3A , PGKL THBS2, EEFIAI, GPX3, ITGB I , PP!A, PDCD61P, EEF ! A2, FBLN I , ATC, CPNE8, TLN I , HSPAS, PKM, HIST! H ! C, WDRI, RAN, PYGL, and GGOA3.
56, The method of claim 44, wherein said subject has, or is undergoing treatment for, breast cancer and said contacting is carried out by detecting, higher or lower levels, relative to a standard or to the level in a prior sample obtained from the subject, or the presence or absence, of one or more of the proteins selected from the group consisting of PDCD61P, SDCBP, EHD1, ITGB1, S100A6, ITGA3, CD9, VPS37C, HistlhAa , RAP IB, CTN A 1 , MSN, HIST1H2AH, ITGA2, PTGFRN, ACTGi, HIST! H2BN, Calm 1, EPCAM, ITGA6, YWHAE, HSPAI A/HSPAI B, GMB3, SLC3A2, GNB2, EHD2, H2AFX, PP1A, NT5E, VPS4B, GNB4, Cdc42, SLC3A5, GNA12, CELL YWHAH, EEFIAI, YWHAB, Histlh3b, TSGI0I, YWHAG, A XA5, GNAI3, F5, H3F3A/H3F3B, CH P4B, HSPAS, EZR, GAPDH, CmL EDIL3, HBAI/HBA2, UBC, SDCBP, HSPAS, ITGBL CD9, HSPA2, ACTCS, ACTB, ACTGi, PDCD6IP, AFP, HBG2, ANXA2, ITGA3, H1STIH2BK, GAPDH, CDS I, SLC3A2, GNAI2, GNAB, GNAll, ATP ! A 1 , H5ST2H2 AC, CPNES, IST1, PFNI, TUBA4A, H2AFX, TUBA 1C, HSPAS, YWHAZ, ENOL ANXA5, GNAS, DNAJA1, CHMPS, EEFIAI, RHOA, KRTI, CEPS 5, GNB!, ACTBL2, ITGA2, EPHA2, G A13, PP1A, RAP I A, and CDS9,
57, The method of claim 42, wherein said subject has, or is undergoing treatment for, pancreatic cancer and said contacting is carried out by detecting, higher or lower levels, relative to a standard or to the level in a prior sample obtained from the subject, or the
presence or absence of, one or more of the proteins selected from the group consisting of SULT!EI, PKLR, ENG2, AKRIBl, FH, MGAT2, GPXL DPP3, SEMA4B, GPDI, CSAD, NCAM I , PCMTI, MARS, THOP I , UMPS, PDE5A, CACNA2D3 , TIE], CD 11 Ϊ 1, AOX 1 , FS, GLBi, RPLI0A, ACAP2, UXSi, ADSL BMP!, PSMD3, LANCL L GLOI, PPP2CA, ESD, PSMD5, FARSB, PAFAHIBi, SNX5, XPOl, MAPRE1, APRT, WEOL GBA, TBBS3, PYGL, THBS2, FAT4, CNTN1, AKR1C2Q, EIF4A2, ESD, BPGM, VASN, MAT] A, IV1AT2A, PFKL, CLIC5, HGD, GLOD4, AGL, PLEK.HB2, CLSTN1, ST 13, CMBL, AKR1E2, PRKAR2A, GPDI, LGALSL, GLA, III RAP, GMPPB, PCSK6, SEPT9, PSMC6, FYN, PAFAHIBI, VPS37C, CTNNDK NRBP1, ERP44, SHMT1, DARS, ADSL, GCLM, ALDOC, EPHA4,
PEPD, CK.B, PCMTI, UGDM, PRKA 1 A, and GNAS,
58, The method of claim 43, wherein said subject has, or is undergoing treatment for, pancreatic cancer and said contacting is carried out by detecting, higher or lower levels, relative to a standard or to the level in a prior sample obtained from the subject, or the presence or absence of, one or more of the proteins selected from the group consisting of SDCBP, PDCD6IF, HSPA8, 1GSF3, CD9, PTGFRN, ACTC1, LY6E, ACT B, MFGE8, HSPA2, CD81, 1TGA3, ITGB1, 1T1H2, YPS28, CD63, HTRAI, ENVI, Fv4, GSN, ENO!, EDIL3, MVBI2A, 1F3TM3, SERPiNC I , ACTBL2, TUBA4A, PPIA, HSPA1 A/HSPAiB, HSPA5, GA DF1, TSG!GS, TUBS, PLEK.HB2, TUBA I C, TUBB4B, PFN1, GPCL GJA!, EHDL GNB2, TSPAN4, GNAI2, SLC3A2, VPS37B, GNA13, RAB7A, EEF1 Al, GNAS, ALB, HBA1/HBA2, CD9, UBC, SDCBP, F2, ACTC1, ACTS, CDS 9, ACTC1, ACTA2, A2 , H1STJH2BK, HIST1H2BJ, HSPA8, TSPAN3, H1ST2H2AC, CD55, H3F3A/H3F3B,
HIST2H3PS2, PDCD6IP, !TGBl, POTEJ, SER1NC5, H2AFZ, ARRDC!, CLDN3, NT5E, EPCAM, CDH37, ATP! Ai, ALPPL2, H1ST2H2AB, ALPP, HSPA2, TSPAN8, MVP,
ADAM 10, TUBS I, VNNL ITGAV, IGSF8, MYOF, ATPIA2, AHCY, GSN, TSPA 3, PPIA, SDCBP2, and HS A5,
59, The method of claim 44, wherein said subject has, or is undergoing treatment for, pancreatic cancer and said contacting is carried out by detecting, higher or lower levels, relative to a standard or to the level in a prior sample obtained from the subject, or the presence or absence of, one or more of the proteins selected from the group consisting of ACTC ! , ACTG I , ACTB, MFGE8, !TGBi, HSPA8, ITGA3, SDCBP, GAPDH, LGALS1, ENVI, Fv4, YWHAZ, PPIA, GNBI, GNAI2, G B2, ACTBL2, ON A 13, CFLI, Marcks, GNAS, EEF1AI, ENOl, BSG, Ca!ml, SI00A4, MSN, EZR, RDX, PTGFRN, PKM, SLC3A2,
HBA I/HBA2, ED1L3, GNA 13, RHOA, RHOC, S I 00A6, YWHAE, ALDOA, PDCD61P, PF I , HSP90AB L YWHAQ, ANXA 1 , ANXA2, ATP 1 A 1 , ITGA6, UBC, HBA 1/HBA2, CD9,
AGIO I , ACTB, CD59, MVP, SDCBP, AGTC I , ACTA2, HIST! H2BK, HIST2H2AC, ALB, HSPA8, HIST! H2B3, CD55, H3F3A, TSPAN3, HIST2H3PS2, POTEJ, DPP4, T5E, EPCAM, VNN 1 , H2AFZ, 1TGB I , ALPPL2, HIST2H2AB, ATFI AI, ALPP, 1ST! , PDCD61P, MUG 13, ANXA f L HSPA2, CDH 17, GPA33, ANXA2, S I 00A6, ATP1 A2, PP1A, EGER, TSPAN8, MYOF, GNAI t , GNA12, GNA13, S 100A4, CLDN3, and A2M. 60. The method of claims 45, 47, or 49, wherein said contacting Is carried out by comparing the levels of the one or more proteins to that obtained in a prior sample from the selected subject.
61. The method of claims 45, 47, or 49, wherein said arse or more reagents suitable for detecting, higher or lower levels, relative to a standard or to the level in a prior sample obtained from the subject, or the presence or absence, of one or more proteins contained in said exomeres, said small exosomes, or said large exosomes measure protein expression level.
62. The method of claim 42, wherein said contacting is carried out by detecting, higher or lower levels, relative to a standard or to the level in a prior sample obtained from the subject, or the presence or absence, of one or more N-g!ycans contained in said exomeres.
63, The method of claim 62, wherein said one or more N-glyeans are selected from the group consisting of N-gSycan (Fucose) A GicNAcP 1 -6(GlcNAc|31 -2) ana ! ~6(G!cNA b 1 -4{GlcNAcp I ~2)Mana 1 -3 )Mahb 1 -4G IcN Aep 1 -4{Fuca I ~6)GlcNAcp I -Asn and N-glycan (F ucose) A NeuS Aca2-8Neu5 Aea2-3 alfi 1 ~3/4GkN Aob I -2Mana 1 ~3( arta I -3{Mana I ·· 6)}Man« I -6)Manfi I ~4GleNAcp I -4GlcN Acf l -Asn. 64. The method of claim 43, wherein said contacting Is carried out by detecting, higher or lower levels, relative to a standard or to the level in a prior sample obtained from the subject, or the presence or absence, of one or more N-glycans contained In said small exosomes.
65. The method of claim 44, wherein said contacting is carried out by detecting, higher or lower levels, relative to a standard or to the level in a prior sample obtained from the subject, or the presence or absence, of one or more N-glycans contained in said large exosomes.
66, The method of claim 42, wherein said contacting is carried out by detecting, higher or lower levels, relative to a standard or to the level in a prior sample obtained from the subject, or the presence or absence, of one or more lipids contained in said exomeres,
67. The method of claim 66, wherein said one or more lipids are selected from the group consisting of phospholipids, sphingolipids, and glycerohpids.
68, The method of claim 67, wherein said one or more lipids are selected from the group consisting of TO, Cer, LPG, CL, CerG2, MG, LPC, PG, DG, and CerG I .
69. The method of claim 43, wherein said contacting is carried out by detecting, higher or lower levels, relative to a standard or to the level in a prior sample obtained from the subject, or the presence or absence, of one or more lipids contained in said small exosomes.
70. The method of claim 69, wherein said one or more lipids are selected from the group consisting of phospholipids, sphingolipids, and glycerohpids. 71 , The method of claim 70, wherein said one or more l pids are selected from the group consisting of LPE, PC, PI, PE, LP1, PS, PC, SM, and CerG3,
72. The method of claim 44, wherein said contacting is carried out by detecting, higher or lower levels, relative to a standard or to the level In a prior sample obtained from the subject, or the presence or absence, of one or more lipids contained in said large exosomes.
73. The method of claim 72, wherein said one or more lipids are selected from the group consisting of phospholipids, sphingolipids, and glycerohpids,
74. The method of claim 73, wherein said one or more lipids are selected front the group consisting of LPE, PC, PI, PH, LPf, PS, PC, 5M, and CerG3,
75. The method of claims 66, 69, or 72, wherein said contacting is earned out by comparing the levels of the one or more lipids to that obtained in a prior sample from the selected subject.
76. The method of claims 39 or 40, wherein said contacting is carried out by detecting the presence or absence of one or more genetic mutations in nucleic acid molecules associated with cancer and contained in said exomeres, said small exosomes, or said large exosomes.
77. The method of claim 76, wherein the nucleic acid molecule is DNA.
78. The method of claim 76. wherein the nucleic acid molecule is RNA.
79, A kit suitable for diagnosing cancer, said kit comprising: one or more reagents suitable to detect: (1 ) higher or lower levels, relative to a standard or to a sample from a subject, or the presence or absence, of one or more proteins contained in exomeres, small exosomes, or large exosomes, (2) higher or lower levels, relative to a standard or to a sample from a subject, or the presence or absence, of one or more N-glycans contained in exomeres, small exosomes, or large exosomes, (3) higher or lower levels, relative to a standard or to a sample from a subject, or the presence or absence, of one or more lipids contained in exomeres, small exosomes, or large exosomes, (4) the presence or absence of one or more genetic mtuatlons in nucleic add molecules associated with cancer and contained In exomeres. small exosomes, or large exosomes, or (5) combinations thereof, wherein said exomeres have a diameter of less than 50 nm. small exosomes have a diameter of 60 to 80 nm and said large exosomes have a diameter of 90 to 120 nm.
80. The kit of claim 79 further comprising:
one or more reagents suitable for isolating exomeres, small exosomes, or large exosomes.
81 , The kit of claim 79, wherein said kit comprises one or more reagents suitable to detect higher or lower levels, relative to a standard or to a sample from a subject, or the presence or absence, of one or more proteins contained in said exomeres.
82. The kit of claim 81 , wherein said kit comprises one or more reagents suitable to detect higher or lower levels, relative to a standard or to a sample from a subject, or the presence or absence, of one or more of the proteins selected from the group consisting of PPID, GA AB, MAT I A, CP YD, FAT4, GMPPB, ERP44, CALR, GPD i , BZW 1, PFKL, OLFML3, HGD, LGALS3BP, GCLC, PEPD, MTHFD1, PGD, ACTR3, XPNPEP1 , UGP2,

SERPING I , RRM i , CKB, HMGCS1 , HPD, PSMC4, NPEPPS, CAT, EXT2, CORO 1 C,
B4GAT1 , RACK!, MAPREI , PGM S , PD1A3, ADK, 5HMTL ACOl , GSN, BSD, PPP2RI A, ALDM 1 L1 , OLAI, ACLY, EEF!G, FLMB, PSMD I 1 , ANGPTL3, FERMT3, PYGL MDH !, and EIFA2-
83 The kit of claim 79, whereto said kit comprises one or more reagents suitable to detect higher or lower levels, relative to a standard or to a sample from a subject, or the presence or absence, of one or more proteins contained In said small exosomes.
84, The kit of claim 83, wherein said kit comprises one or more reagents suitable to detect higher or lower levels, relative to a standard or to a sample from a subject, or the presence or absence, of one or more of the proteins selected from the group consisting of TΊΎH3, PLOT!, FLOT2, TSPA 14, LAMC L CD63, MYB I2A, ZDHHC2G, VAMP3,
VPS37B, ARRDC1 , and TGFBR2.
85, The kit of claim 79, wherein said kit comprises one or more reagents suitable to detect higher or lower levels, relative to a standard or to a sample from a subject, or the presence or absence, of one or more proteins contained in said large exosomes,
86, The kit of claim 85, wherein said kit comprises one or more reagents suitable to detect higher or lower levels, relative to a standard or to a sample from a subject, or the presence or absence, of one or more of the proteins in selected from the group consisting o SQSTM 3 , STIP1 , HINT I , WASF2, RASA3, EPB4 I L2, GSPC I , S ! 00 A 30, MPP6, KIF23, RACGAP I, A XA5, CASK, DIG I, TJPI , BAGS, TXN, ABI I, ANXA I , CAPG, DB1, S 100A6,
CHMP2B, CH P3, ANXA2, MYOIC, ANXA4, SNXI2, LIN7C, STXBP3, CEP55, ALCAM, VCL, CHMPi A, FARP!, ACSL4, BAIAP2, SH3GLI, DSTN, LGALSI, CYFIP!, CTNNA i , RAB3I, ARF6, SLC1A5, EPS8, FMNL2, PGAM I, CNF, CHMP4B, ANXA3. VPS4B, GNGI2, PACSIN3, GLGL VTA I, LYN, VPS37C, CHMP5, F3, DNAJAI, RHOC, GNAI3, CHMP2A, ATP2B 1 , RDX, ATP 1 B L CAPZB, EHD1 , DN AJ A2, and CTN D1.
87. The kit of claim 81. wherein said kit comprises one or more reagents suitable to determine If the subject has melanoma, wherein said one or more reagents are suitable to detect higher or lower levels, relative to a standard or to a sample from a subject, or the presence or absence, of one or more of the proteins GPH2, 3TIH3, H2AFX, PMEL, MAT! A, HPD, ALB, B4GAT1, ARFI, GCLC, HGD, PPP2CB, PAH, AGL, RNPEP, PPID, BZWI, ME!, DPYD, CA6, OLFML3, NPEPPS, PREP, ERP44, RELN, GPDI, GFPTI, CNDP2, PFK.L, ALDH8AI, ATP6V1 A, EN02, THBS3, CORO I C, EXT I, CAT, XPNPEPI, PYGL, CALR, and LGALS3BP,
88. The kit of claim 83, wherein said kit comprises one or more reagents suitable to determine if the subject has melanoma, wherein said one or more reagents are suitable to detect higher or lower levels, relative to a standard or to a sample from a subject, or the presence or absence, of one or more of the proteins selected from the group consisting of TYRPf, SDCBP, SDCBP,€063, 1GSF8, HSPA8, MIAN A, HBA3/HBA2, GPNMB, DCT, HSPA2, HSPA1 L, HSPA5, Fv4, PDCD6IP, RAB7A, ENV!, CD8I, ONBi, SVT4, GNB2,
HIST! H2 AH, GNAI2, GAPDH, APOE, BC035947, Histlh2ai, ACTGL ACTB, GNB4, GNAI3, SLC3A2, ACTC!, G AS, 5LC38A2, HIST2H2BF, ATP! A3, TFRC, TMEM176B, VAMPS, TSPANIO, ADGRGi, Hist!h4a , PM EL, UBL3, PP1A, ACTBL2, CD9, BACE2, and TSPAN4.
89. The kit of claim 85, wherein said kit comprises one or more reagents suitable to determine if the subject has melanoma, wherein said one or more reagents are suitable to detect higher or lower levels, relative to a standard or to a sample from a subject, or the presence or absence, of one or more of the proteins selected from the group consisting of HSPAS, TYRPI, SDCBP, HSPA2, RPS27A, HSPA!L, MLAMA, H5PA5, CD63, IGSF8, GPNMB, Fv4, ENVI, PDCD6IP, HSPA1A/HSPAIB, DCT, ACTG!, ACTB, PPIA, SLC3A2, ACTCS, CD81, 3TM2C, RAB7A, GNBI, TSPAN4, DNAJAI, GNB2, TFRC, HBA1/HBA2, GNAI2, SYT4, GAPDH, APOE, PM EL, MFGE8, GNB4, GRAB, G AOI, DNAJA2,
ATP I At, ITGBI, TMEM59, SLC38A2, GNAI2, ITM2B, GNAS, HIST! H2 AH, LAMP I, and EEFIAL
90, The kit of claim 81 , wherein said kit comprises one or more reagents suitable to determine if the subject has breast cancer, wherein said one or more reagents are suitable to detect higher or lower levels, relative to a standard or to a sample from a subject, or the presence or absence, of one or more of the proteins selected from the group consisting of FOB, HIST2M2AB, COMP, HISTIH2BJ, C7, GSTA5, EN03, ARF3, SULTIC4, EIF4A2, MAT! A, GNB2, UGDH, AK.RIBI0, MTHFDI, CISC, DPP3, RPSA, OTUBI, ALDHBAi,
PI 1, CTPS2, MG AT I, HYH I , LGALSL, GSTM3, GSTM5, PSMGI , F8, PRKAR2B, RPLI 0A, H RNPK, SE A6D, SNX5, !ARS, LCP2, ARPC4, PPP6C, PSMD6, PTPRS, TIER PSMD8, PABPC4, RPSI8, CHAD, IPOS, FABP3, GALNT2, QPCT, STAT5A, SEMA3A, NTSC2, IDE, STAT3, DPYSL3, PDXK, ARF5, PSMD5, ONE, NBEAL2, FHLI, TIMP3, POSTN, MAPRE2, 1TSH3, C3, EN02, PPID, OIT3, CANDI, SEPT2, UBE2N, DPY5L2, CKB, PTGES3, DSTN, PKLR, TH9S3, RAP!B, HIST2H2AB, ACTBL2, TUBB2A, FH), CNT 1, HPD, ACE, EML2, HSPAI3, TNXB, HEXB, CALR, ADH5, GPXI, CFL2, KRT76, TCP!, COTLI, DYNLLI, HGD, ALDOC, EPRS, GLOI, MAN2AI, FLT4, NAP! W, RARS, HMGCSi, GA AB, SEPT7, FK8P4, COL12AI, ADSL, AK 1C20, VASN, DDX39B, ME I, COMT, ALDHIAI, EIF4A3, CDHI1, PRPSII3, PNPEP, NPEPPS, SEPT 11, CM BE, PSMDI, ACTRIB, PSMD3, GCLC, FAT4, LPL, GPD!L, GCLM, VARS, PHPTI, CACNA2D1, SEPT9, GLRX3, AARS, G PPB, SNX2, GLOD4, PTPRF, CSAD, PXDN, AGL, DPYD, PRKACB, LARS, PPID, LTA4H, PSMD7, CAPNSI, ETFI, IARS, VPS35, TICFC, HYOUL PG 2, TKT, HMC i, CYB5R3, GPS1, UMPS, SNDi, RTCB, RPL26, CARMI, PLCG2, P4HA2, C0R06, GMPS, IGSFS, PPPIR7, TIMP3, UXS1, DNM2, MEMO!, RPS3, ARHGDI A, PTGES3, NRP2, RABIA, HBG2, and YWHAQ.
91 , The kit of claim 83, wherein said kit comprises one or more reagents suitable to determine If a subject has breast cancer, wherein sad one or more reagents are suitable to detect higher levels, relative to a standard or to a sample from a subject, or the presence, of one or more of the proteins selected from the group consisting of SDCBP,
HISTIH2BN, HISTIH2AH, HBAI/HBA2, ITGBI, Hist!h4a , PDCD6IP, HIST3H2BB,
H2AFX, CD9, CD63, 1TGA3, ITIH2, MFGE8, H2AFZ, PTGFRN, Hist lb 3b, HSPAS, ACTGI, ACTB, ARRDC!, ACTCi, ITIH3, 1GSF8, GSM, TUBA4A, HISTIHI D, TUBA! A, HiST!HIC, TUBS I, HSPA2, ENOi, MVB12A, HT A1, GAPDH, Hist! hie, VPS28, TSGIOI, TUBB,
TUBB4A, RAP IB, PFNi,CD8l, VPS37B, TUBB6, RAP I A, EPCAM, Histlh!b, PPIA,
ADAM 10, HBAl, HIST1H2BK, A2M, EDIL3, SDCBP, MFGE8, GSN, HIST2H2AC,
HIST! H2 AC, H2AFX, ACTB, THBSI, 1ΉH4, TUBB , TUBB2A, TUBB4B,' F10, H2AFZ, TUBB4A, TUBBS, TUBBI, HSPA8, CD9, CD8I, GAPDH, PFN!, HJST1H4A, HSP90AAI, HSP90ABI, HSPA2, HIST2H3A , PGKi, THBS2, EEF1 Al, GPX3, !TGBi, PPIA, PDCD6IP, EEF1A2, FBLN1, ATIC, CPNE8, TEN I, HSPA5, PKM, HIST1HIC, WD I, RAN, PYGL, and 1TGA3.
92. The kit of claim 85, wherein said kit comprises one or more reagents suitable to determine if the subject hasbreast cancer, wherein said one or more reagents are suitable to detect higher or lower levels, relative to a standard or to a sample from a subject, or the presence or absence of one or more of the proteins selected from the group consisting of PDCD6IP, SDCBP, Eh!Dl, ITGB!, SIGQA6, ITGA3, CD9, VPS37C, Histfh4a , RAP IB, CTNNAI, MSN, H1ST1H2AH, ITGA2, PTGFRN, ACTGi, HSSTIH2B , Calm!, EPCA , ITGA6, YWHAE, HSPA1A/MSPA1 B, GNB1, SLC3A2, G 82, EHD2, H2AFX, PflA,NT5E, VPS4B, GNB4, Cdc42, SLC! A5, ON A 12, CFL-3, YWHAH, EEF Ϊ A K YWHAB, Histlh3b, TSGIO!, YWHAG, A XA5, GNAI3, F5, H3F3A/H3F3B, CHMP4B, HSPA5, EZR, GAPDH, CDS I, EDIL3, HBAI/HBA2, UBC, SDCBP, HSPA8, !TQBS, CD9, HSPA2, ACTC 1 , ACTB, ACTGI, PDCD6IP, AFP, HBG2, ANXA2, ITGA3, HIST1H2BK, GAPDH, CDS I , SLC3A2, GNAI2, GNAI3, G AII, ATP! Al, HIST2H2AC, CPNE8, 1ST!, PFN!, TUBA4A, H2AFX, TUBA 1C, HSPA5, YWHAZ, ENO!, ANXA5, G AS, DNAJA1, CHMP5, EEF!AI, RHGA, KRTS, CEP55, GNB 1 , ACTBL2, ITGA2, EPHA2, GNAI3, PPIA, RAP1 A, and CD59, 93, The kit of claim 8 I , wherein said kit comprises one or more reagents suitable to determine if the subjec has pancreatic cancer, wherein said one or more reagents are suitable to detect higher or lower levels, relative to a standard or to a sample from a subject, or the presence or absence, of one or more of the proteins selected from the group consisting of SULTIEI, PKLR, EN02, AKRIBI, PH, MGAT2, GPXl, DPP3, SEMA4B, GPDL CSAD, NCAM 1 , PCMT I , NARS, THOP ! , UMPS, PDE5A, CACNA2D 1 , TIE I , CDH 11 , AOX i , F8,
GLBI, RPLIOA, ACAP2, UXSI, ADSL, BMP!,PSMD3. LANCLL GLOI, PPP2CA, PSD, PSMD5, FARSB, PAFAH1BI, SNX5, XPOl, MAPREI, APRT, NEOI, GBA, THBSI, PYGL, THBS2, FATA, CNTN!, AKRIC20, BIF4A2, ESD, BPGM, VASN, MAT I A, MAT2A, PFKL, CL1C5, HOD, GLOD4, AGP, PLEKHB2, CLSTNK STB, CMBL, AKR1E2, PRKAR2A, GPD I , LGALSL, GL-A, IL I RAP, GMPPB, PCSK6, SEPT9, PSMC6, FYR PAFAH IBS,
VPS37C, CTNND 1 , NRBP 1 , ER.P44, SHMTf , DARS, ADSL, GCLM, ALDOC, EPHA4, PEPD, CKB, PCMT1, UGDH, PRKAR! A, and GNAS.
94, The kit of claim 83, wherein said kit comprises one or more reagents suitable to determine if the subject has pancreatic cancer, wherein said one or more reagents are suitable to detect higher or lower levels, relative to a standard or to a sample from a subject, or the presence or absence, of one or more of the proteins selected from the group consisting of SDCBP, PDCD6IP, HSPA8, IGSF8, CD9, PTGFRN, ACTCi, LY6E, ACTB, MFGE8, HSPA2, GD8I, 1TGA3, ITGBI, ST1H2, VPS28, CD63, HTRA!, ENVi, Fv4, GSN, ENOI, ED1L3,
MYBI2A,JFITM3, 5ERPINCI, ACTBL2, TUBA4A, PPIA, HSPAIA/HSPAI B, HSPA5 GAPDH, TSG101, TUBS, PLEKHB2, TUBA 1C, TUBB4B, PF 1, GPCL GJAi, EHD!,
GNB2, TSPAN4, GNAI2, SLC3A2, VPS37B, GNAI3, RAB7A, EEFI A I, GNAS, ALB,
HBAI/HBA2, CD9, 1IBC, SDCBP, F2, ACTCI, ACTB, CD59, ACTCI, ACTA2, A2 ,
HISTIH2BK., HIST1H2BJ, HSPA8,TSPAN3, HIST2H2 C, CD55, H3F3A/H3F3B,
HIST2H3PS2, PDCD6IP, ITGBI, POTEJ, SERINC5, H2AF2, ARRDCI, CLDN3, NT5E,
EPCAM, CDHI7, ATPIAI, ALPPL2, HJST2H2AB, ALPP, HSPA2, TSPAN8, MVP,
ADAM 10, TUBS 1 , VWN 1 , 1TGAV, IGSFS, MYOF, ATP i A2, AHCY, GSN, TSPA I , PPIA,
SDCBP2, and HSPA5,
95, The kit of claim 85, wherein said kit comprises one or more reagents suitable to determine if the subject has pancreatic cancer, wherein said one or more reagents are suitable to detect higher or lower levels, relative to a standard or to a sample from a subject, or the presence or absence, of one or more of the proteins selected from the group consisting of ACTCI, ACTG1, ACTB, MFGE8, ITGBI, HSPA8, ITGA3, SDCBP, GAPDH, LGALS!, ENVI, Fv4, YWHAZ, PPIA, GNBI, GNAI2, GNB2, ACTBL2, GNAI3, CFLI, Mareks, GNAS, EEF! AΪ, ENOI, BSG, Calm 15 SI00A4, MSN, EZR, RDX, PTGFRN, PKM, SLG3A2,
HBA1/HBA2, ED 113, GN 13, RHGA, RHOC, SI00A6, YWHAE, ALDOA, PDCD6IP, PEN I, HSP90ABI, YWHAQ, A XAI, ANXA2, ATPIAI, ITGA6, UBC, HBAI HBA2, CD9,
AGIO I, ACTB, CD59, MVP, SDCBP, ACTCI, ACTA2, HISTIH2BK, HIST2H2AC, ALB, HSPA8, HIST3H2BJ, CD55, H3F3A, TSPAN3, HIST2H3PS2, POTEJ, DPP4, NT5E, EPCAM, V NI, H2AF2, ITGBI, ALPPL2, HIST2H2AB, ATPIAI, ALPP, IST1, PDCD6IP, MUG 13, ANXAI I, HSPA2, CDH17, GPA33, ANXA2, SI00A6, ATPIA2, PPIA, EGFR, TSPAN8, MYOF, GNAI 1 , GNAI2, GNA13, S 100A4, CLDN3, and A2M,
96, The kit of claim 79, wherein said kit comprises one or more reagents suitable to detect higher or lower levels, relative to a standard or to a sample from a subject, or the presence or absence, of one or more N-glycans contained in said exomeres.
97, The kit of claim 96, wherein said one or more reagents are suitable to detect one or more N-glycans selected from the group consisting of -gfycan (Fucose) + G!cNAcpl-6{G!cNAcp 1 -2)Manal-6(GlcNA b 1 -4(GlcNAeP 1 -2)Mana 1 -3)Manp 1 MGIcNAcp I - 4(Fuca 1 -6)G!c AcP 1 ~Asn and N-glycan (Fucose) A Neu5 Aca2-8Neu5 Aca2-3Gaip i - 3/4GScNAcpl 2Manal 3(Manal -3( anal~6))Manal~6)iVianpl-4GlcNAepi-4Gic Aepi Asn.
98, The kit of claim 79, wherein said kit comprises one or more reagents suitable to detect higher or lower levels, relative to a standard or to a sample from a subject, or the presence or absence, of one or more N-glycans contained in said small exosomes, 99, The kit of claim 79, wherein said kit comprises one or more reagents suitable to detect higher or lower levels, relative to a standard or to a sample from a subject, or the presence or absence, of one or more N-glycans contained in said large exosomes,
100. The kit of claim 79, wherein said kit comprises one or more reagents suitable to detect higher or lower levels, relative to a standard or to a sample from a subject, or the presence or absence, of one or more lipids contained In said exomeres.
101 , The kit of claim 100. wherein said one or more reagents are suitable to detect one or more lipids selected from the group consisting of phospholipids, sphingoiipids, and glycerolipids.
102. The kit of claim 101 , wherein said one or more reagents are suitable to detect one or more lipids selected from the group consisting of TG, Cer, LPG, CL, CerG2, G, LPC, PG, DG, and CerGl .
103. The kit of claim ? 9. wherein said kit comprises one or more reagents suitable to detect higher or lower levels, relative to a standard or to a sample from a subject, or the presence or absence, of one or more lipids contained in said small exosomes.
104, The kit of claim 103, wherein said one or more reagents are suitable to detect one or more lipids selected from the group consisting f phospholipids, sphingoiipids, and giycerolipids,
105, The kit of claim 1 4, wherein said one or more reagents are suitable to detect one or more lipids selected from the group consisting of LPE, PC, PI, PE, LPI, PS, PC,
SM, and CerG3.
106. The kit of claim 79, wherein said kit comprises one or more reagents suitable to detect higher or lower levels, relative to a standard or to a sample from a subject, or the presence or absence, of one or more lipids contained in said large exosomes.
! 07, The kit of claim ! 06, wherein said one or more reagents are suitable to detect one or more lipids selected from the group consisting of phospholipids, sphingoiipids, and giycerolipids.
108, The kit of claim 107, wherein said one or more reagents are suitable to detect one or more lipids selected from the group consisting of LPE, PC, PI, PE, LPI, PS, PC, SM, and CerG3.
109, The kit of claim 79, wherein said kit comprises one or more reagents suitable to detect the presence or absence of one or more genetic mutations in nucleic add molecules associated with cancer and contained in said exo eres, said small exosomes, or said large exosomes. i 10. The kit of claim 109, wherein the nucleic acid molecule is DNA. H I , The kit of claim 109, wherein the nucleic add molecule is RHA.
Priority Applications (4)
| Application Number | Priority Date | Filing Date | Title |
|---|---|---|---|
| US16/873,700 US20210285952A1 (en) | 2017-12-01 | 2018-12-03 | Nanoparticles and distinct exosome subsets for detection and treatment of cancer |
| CN201880088472.3A CN111971560A (en) | 2017-12-01 | 2018-12-03 | Nanoparticles and different exosome subsets for detecting and treating cancer |
| EP18882781.0A EP3716986A4 (en) | 2017-12-01 | 2018-12-03 | Nanoparticles and distinct exosome subsets for detection and treatment of cancer |
| US18/082,368 US20230266329A1 (en) | 2017-12-01 | 2022-12-15 | Nanoparticles and distinct exosome subsets for detection and treatment of cancer |
Applications Claiming Priority (4)
| Application Number | Priority Date | Filing Date | Title |
|---|---|---|---|
| US201762593504P | 2017-12-01 | 2017-12-01 | |
| US62/593,504 | 2017-12-01 | ||
| US201862623992P | 2018-01-30 | 2018-01-30 | |
| US62/623,992 | 2018-01-30 |
Related Child Applications (2)
| Application Number | Title | Priority Date | Filing Date |
|---|---|---|---|
| US16/873,700 A-371-Of-International US20210285952A1 (en) | 2017-12-01 | 2018-12-03 | Nanoparticles and distinct exosome subsets for detection and treatment of cancer |
| US18/082,368 Continuation US20230266329A1 (en) | 2017-12-01 | 2022-12-15 | Nanoparticles and distinct exosome subsets for detection and treatment of cancer |
Publications (1)
| Publication Number | Publication Date |
|---|---|
| WO2019109077A1 true WO2019109077A1 (en) | 2019-06-06 |
Family
ID=66665267
Family Applications (1)
| Application Number | Title | Priority Date | Filing Date |
|---|---|---|---|
| PCT/US2018/063612 WO2019109077A1 (en) | 2017-12-01 | 2018-12-03 | Nanoparticles and distinct exosome subsets for detection and treatment of cancer |
Country Status (4)
| Country | Link |
|---|---|
| US (2) | US20210285952A1 (en) |
| EP (1) | EP3716986A4 (en) |
| CN (1) | CN111971560A (en) |
| WO (1) | WO2019109077A1 (en) |
Cited By (7)
| Publication number | Priority date | Publication date | Assignee | Title |
|---|---|---|---|---|
| CN110592213A (en) * | 2019-09-02 | 2019-12-20 | 深圳市新合生物医疗科技有限公司 | Gene panel for prediction of neoantigen load and detection of genomic mutations |
| CN111304319A (en) * | 2020-04-10 | 2020-06-19 | 北京瑞康我科技有限公司 | Diagnostic marker for diseases and application |
| WO2020256640A1 (en) * | 2019-06-21 | 2020-12-24 | National University Of Singapore | Methods for determining the likelihood of lung cancer |
| WO2021077181A1 (en) * | 2019-10-24 | 2021-04-29 | The Council Of The Queensland Institute Of Medical Research | A cancer diagnostic |
| WO2022010919A3 (en) * | 2020-07-06 | 2022-03-24 | Cornell University | Exosomal tumor biomarkers and collections thereof |
| US11752175B2 (en) | 2018-09-21 | 2023-09-12 | Cornell University | Compositions and methods for glaucoma |
| CN117034110A (en) * | 2023-08-08 | 2023-11-10 | 海南省细胞医疗科技有限公司 | Stem cell exosome detection method based on deep learning |
Families Citing this family (8)
| Publication number | Priority date | Publication date | Assignee | Title |
|---|---|---|---|---|
| CN112433053A (en) * | 2020-11-20 | 2021-03-02 | 四川大学华西医院 | Application of Tetraspin-14 protein detection reagent in preparation of lung cancer screening kit |
| CN113655142B (en) * | 2021-08-09 | 2023-11-10 | 大连医科大学附属第一医院 | Early warning severe acute pancreatitis model based on phosphatidylserine and phosphatidylethanolamine and application of early warning severe acute pancreatitis model |
| WO2023060066A2 (en) * | 2021-10-08 | 2023-04-13 | Vanderbilt University | Supermere nanoparticles and methods of isolation and use thereof |
| CN113976195B (en) * | 2021-10-19 | 2023-07-14 | 华东理工大学 | Microfluidic chip for exosome separation and enrichment and exosome surface protein analysis method |
| WO2023133299A1 (en) * | 2022-01-07 | 2023-07-13 | Mercy Bioanalytics, Inc. | Compositions and methods for detection of lung cancer |
| CN115047186B (en) * | 2022-06-15 | 2023-02-14 | 暨南大学 | Exosome detection method |
| CN115074445B (en) * | 2022-08-09 | 2023-08-08 | 河北医科大学第二医院 | Application of ENO3 in diagnosis and treatment of kidney cancer |
| CN117054670A (en) * | 2023-10-12 | 2023-11-14 | 北京豪迈生物工程股份有限公司 | Kit for determining content of melanoma glycoprotein B and preparation method thereof |
Citations (5)
| Publication number | Priority date | Publication date | Assignee | Title |
|---|---|---|---|---|
| US20120295286A1 (en) * | 2011-04-21 | 2012-11-22 | The George Washington University | Methods for the Diagnosis, Prognosis and Monitoring of Cancer Therapy Using BP1 |
| US20140038901A1 (en) * | 2011-04-01 | 2014-02-06 | Cornell University | Circulating exosomes as diagnostic/prognostic indicators and therapeutic targets of melanoma and other cancers |
| US20140045915A1 (en) * | 2010-08-31 | 2014-02-13 | The General Hospital Corporation | Cancer-related biological materials in microvesicles |
| WO2016172710A2 (en) * | 2015-04-24 | 2016-10-27 | Cornell University | Methods and reagents for determination and treatment of organotropic metastasis |
| US20170227550A1 (en) * | 2013-03-15 | 2017-08-10 | Somalogic, Inc. | Nonalcoholic fatty liver disease (nafld) and nonalcoholic steatohepatitis (nash) biomarkers and uses thereof |
Family Cites Families (22)
| Publication number | Priority date | Publication date | Assignee | Title |
|---|---|---|---|---|
| EP1062515B1 (en) * | 1998-02-12 | 2009-11-25 | Immunivest Corporation | Methods and reagents for the rapid and efficient isolation of circulating cancer cells |
| US20020172987A1 (en) * | 1998-02-12 | 2002-11-21 | Terstappen Leon W.M.M. | Methods and reagents for the rapid and efficient isolation of circulating cancer cells |
| EP1614461A3 (en) * | 2000-09-25 | 2007-11-28 | Picoliter, Inc. | Acoustic ejection of fluids from reservoirs |
| DE102004019751A1 (en) * | 2004-04-23 | 2005-11-17 | Henkel Kgaa | Novel Alkaline Proteases and Detergents Containing These Novel Alkaline Proteases |
| EP1642887A1 (en) * | 2004-09-18 | 2006-04-05 | Cognis IP Management GmbH | Quaternised fatty acid amidoamines |
| CA2634818A1 (en) * | 2005-12-23 | 2007-06-28 | Sienna Cancer Diagnostics Ltd | Assay for detection of telomerase activity |
| CN107254538A (en) * | 2008-11-12 | 2017-10-17 | 卡里斯生命科学瑞士控股有限责任公司 | The method and system of phenotype is determined using allochthon |
| US20160041153A1 (en) * | 2008-11-12 | 2016-02-11 | Kirk Brown | Biomarker compositions and markers |
| KR20120034593A (en) * | 2009-03-09 | 2012-04-12 | 유니버시티 오브 조지아 리서치 파운데이션 인코퍼레이티드 | Protein markers identification for gastric cancer diagnosis |
| KR101112113B1 (en) * | 2009-06-18 | 2012-02-22 | 인하대학교 산학협력단 | Secretory Granules and Granulogenic Factors as a Target for Cancer Treatment |
| EP2616538A4 (en) * | 2010-09-16 | 2014-03-05 | Univ Cornell | Use of adenosine receptor signaling to modulate permeability of blood-brain barrier |
| AU2011316477A1 (en) * | 2010-10-11 | 2013-05-02 | Medsaic Pty Ltd | Assay for disease detection |
| SG11201407800SA (en) * | 2012-05-31 | 2014-12-30 | Agency Science Tech & Res | Selective binding of biological targets to solid phase ureides |
| US20140094383A1 (en) * | 2012-10-02 | 2014-04-03 | Ohio State Innovation Foundation | Tethered Lipoplex nanoparticle Biochips And Methods Of Use |
| LT3076949T (en) * | 2013-12-04 | 2019-12-10 | Univ Texas | Method for isolating cancer cell-derived exoxomes |
| MX2016008978A (en) * | 2014-01-09 | 2016-10-04 | Sanofi Sa | Stabilized glycerol free pharmaceutical formulations of insulin analogues and/or insulin derivatives. |
| KR101452730B1 (en) * | 2014-02-19 | 2014-10-23 | 한국과학기술원 | Novel diagnostic method for gastric cancer |
| WO2016036949A1 (en) * | 2014-09-03 | 2016-03-10 | The Regents Of The University Of California | Methods to determine the distribution profiles of circulating rnas |
| SG11201707398WA (en) * | 2015-03-12 | 2017-10-30 | Mitsui Chemicals Inc | Method for destroying exosomes, kit for destroying exosomes, and method for isolating exosomes derived from normal cells |
| CN105505772B (en) * | 2015-12-07 | 2018-07-10 | 中国科学院苏州生物医学工程技术研究所 | The device cracked to single excretion body |
| WO2017149206A1 (en) * | 2016-03-04 | 2017-09-08 | Evexys Biotech Oy | Method and a kit for detecting a combination of markers from liver-derived plasma extracellular vesicles (pev) |
| EP3455371B1 (en) * | 2016-05-09 | 2023-01-18 | Helmholtz Zentrum München - Deutsches Forschungszentrum für Gesundheit und Umwelt (GmbH) | Tissue-specific exosomes as biomarkers |
-
2018
- 2018-12-03 WO PCT/US2018/063612 patent/WO2019109077A1/en unknown
- 2018-12-03 US US16/873,700 patent/US20210285952A1/en not_active Abandoned
- 2018-12-03 EP EP18882781.0A patent/EP3716986A4/en active Pending
- 2018-12-03 CN CN201880088472.3A patent/CN111971560A/en active Pending
-
2022
- 2022-12-15 US US18/082,368 patent/US20230266329A1/en active Pending
Patent Citations (5)
| Publication number | Priority date | Publication date | Assignee | Title |
|---|---|---|---|---|
| US20140045915A1 (en) * | 2010-08-31 | 2014-02-13 | The General Hospital Corporation | Cancer-related biological materials in microvesicles |
| US20140038901A1 (en) * | 2011-04-01 | 2014-02-06 | Cornell University | Circulating exosomes as diagnostic/prognostic indicators and therapeutic targets of melanoma and other cancers |
| US20120295286A1 (en) * | 2011-04-21 | 2012-11-22 | The George Washington University | Methods for the Diagnosis, Prognosis and Monitoring of Cancer Therapy Using BP1 |
| US20170227550A1 (en) * | 2013-03-15 | 2017-08-10 | Somalogic, Inc. | Nonalcoholic fatty liver disease (nafld) and nonalcoholic steatohepatitis (nash) biomarkers and uses thereof |
| WO2016172710A2 (en) * | 2015-04-24 | 2016-10-27 | Cornell University | Methods and reagents for determination and treatment of organotropic metastasis |
Non-Patent Citations (1)
| Title |
|---|
| ZHANG ET AL.: "Identification of distinct nanoparticles and subsets of extracellular vesicles by asymmetric flow field-flow fractionation", NAT CELL BIOL, vol. 20, 19 February 2018 (2018-02-19), XP036709197, DOI: doi:10.1038/s41556-018-0040-4 * |
Cited By (9)
| Publication number | Priority date | Publication date | Assignee | Title |
|---|---|---|---|---|
| US11752175B2 (en) | 2018-09-21 | 2023-09-12 | Cornell University | Compositions and methods for glaucoma |
| WO2020256640A1 (en) * | 2019-06-21 | 2020-12-24 | National University Of Singapore | Methods for determining the likelihood of lung cancer |
| CN110592213A (en) * | 2019-09-02 | 2019-12-20 | 深圳市新合生物医疗科技有限公司 | Gene panel for prediction of neoantigen load and detection of genomic mutations |
| WO2021077181A1 (en) * | 2019-10-24 | 2021-04-29 | The Council Of The Queensland Institute Of Medical Research | A cancer diagnostic |
| EP4049027A4 (en) * | 2019-10-24 | 2024-02-07 | Council Queensland Inst Medical Res | A cancer diagnostic |
| CN111304319A (en) * | 2020-04-10 | 2020-06-19 | 北京瑞康我科技有限公司 | Diagnostic marker for diseases and application |
| CN111304319B (en) * | 2020-04-10 | 2023-07-25 | 北京瑞康我科技有限公司 | Diagnostic marker for diseases and application thereof |
| WO2022010919A3 (en) * | 2020-07-06 | 2022-03-24 | Cornell University | Exosomal tumor biomarkers and collections thereof |
| CN117034110A (en) * | 2023-08-08 | 2023-11-10 | 海南省细胞医疗科技有限公司 | Stem cell exosome detection method based on deep learning |
Also Published As
| Publication number | Publication date |
|---|---|
| EP3716986A4 (en) | 2022-02-09 |
| US20230266329A1 (en) | 2023-08-24 |
| CN111971560A (en) | 2020-11-20 |
| US20210285952A1 (en) | 2021-09-16 |
| EP3716986A1 (en) | 2020-10-07 |
Similar Documents
| Publication | Publication Date | Title |
|---|---|---|
| WO2019109077A1 (en) | Nanoparticles and distinct exosome subsets for detection and treatment of cancer | |
| JP2023101574A (en) | Methods for detecting signatures of disease or conditions in bodily fluids | |
| AU2010324594B2 (en) | Methods and systems for isolating, storing, and analyzing vesicles | |
| EP3077823B1 (en) | Compositions and methods for identifying and treating cachexia or pre-cachexia | |
| JP2017051193A (en) | Method for detecting diseases or conditions using phagocytic cells | |
| KR20150035821A (en) | Methods of detecting diseases or conditions | |
| AU2016202885A1 (en) | Methods of detecting kidney-associated diseases or conditions | |
| US9140687B2 (en) | Renal cell carcinoma biomarkers | |
| AU2016202956A1 (en) | Methods of detecting autoimmune or immune-related diseases or conditions | |
| KR20150035818A (en) | Methods of detecting diseases or conditions using circulating diseased cells | |
| AU2015314813B2 (en) | Methods of detecting prostate cancer | |
| EP2965077A1 (en) | Methods of detecting cancer | |
| Bosque et al. | Molecular tools for the characterization of seizure susceptibility in genetic rodent models of epilepsy | |
| US20150050274A1 (en) | Methods and biomarkers for detection and treatment of mature t-cell leukemia | |
| US20200278353A1 (en) | Protein Expression Analysis For Breast Cancer Prognosis And Treatment | |
| WO2023201348A1 (en) | Methods for predicting responsiveness of lymphoma to drug and methods for treating lymphoma | |
| Chyra | Genomické studie u monoklonálních gamapatií | |
| NZ771630B2 (en) | Methods of detecting prostate cancer |
Legal Events
| Date | Code | Title | Description |
|---|---|---|---|
| 121 | Ep: the epo has been informed by wipo that ep was designated in this application |
Ref document number: 18882781 Country of ref document: EP Kind code of ref document: A1 |
|
| NENP | Non-entry into the national phase |
Ref country code: DE |
|
| ENP | Entry into the national phase |
Ref document number: 2018882781 Country of ref document: EP Effective date: 20200701 |