WO2015130968A2 - T cell balance gene expression, compositions of matters and methods of use thereof - Google Patents
T cell balance gene expression, compositions of matters and methods of use thereof Download PDFInfo
- Publication number
- WO2015130968A2 WO2015130968A2 PCT/US2015/017826 US2015017826W WO2015130968A2 WO 2015130968 A2 WO2015130968 A2 WO 2015130968A2 US 2015017826 W US2015017826 W US 2015017826W WO 2015130968 A2 WO2015130968 A2 WO 2015130968A2
- Authority
- WO
- WIPO (PCT)
- Prior art keywords
- cells
- cell
- expression
- thl
- thl7
- Prior art date
Links
Classifications
-
- G—PHYSICS
- G01—MEASURING; TESTING
- G01N—INVESTIGATING OR ANALYSING MATERIALS BY DETERMINING THEIR CHEMICAL OR PHYSICAL PROPERTIES
- G01N33/00—Investigating or analysing materials by specific methods not covered by groups G01N1/00 - G01N31/00
- G01N33/48—Biological material, e.g. blood, urine; Haemocytometers
- G01N33/50—Chemical analysis of biological material, e.g. blood, urine; Testing involving biospecific ligand binding methods; Immunological testing
- G01N33/68—Chemical analysis of biological material, e.g. blood, urine; Testing involving biospecific ligand binding methods; Immunological testing involving proteins, peptides or amino acids
- G01N33/6863—Cytokines, i.e. immune system proteins modifying a biological response such as cell growth proliferation or differentiation, e.g. TNF, CNF, GM-CSF, lymphotoxin, MIF or their receptors
-
- C—CHEMISTRY; METALLURGY
- C12—BIOCHEMISTRY; BEER; SPIRITS; WINE; VINEGAR; MICROBIOLOGY; ENZYMOLOGY; MUTATION OR GENETIC ENGINEERING
- C12Q—MEASURING OR TESTING PROCESSES INVOLVING ENZYMES, NUCLEIC ACIDS OR MICROORGANISMS; COMPOSITIONS OR TEST PAPERS THEREFOR; PROCESSES OF PREPARING SUCH COMPOSITIONS; CONDITION-RESPONSIVE CONTROL IN MICROBIOLOGICAL OR ENZYMOLOGICAL PROCESSES
- C12Q1/00—Measuring or testing processes involving enzymes, nucleic acids or microorganisms; Compositions therefor; Processes of preparing such compositions
- C12Q1/68—Measuring or testing processes involving enzymes, nucleic acids or microorganisms; Compositions therefor; Processes of preparing such compositions involving nucleic acids
- C12Q1/6876—Nucleic acid products used in the analysis of nucleic acids, e.g. primers or probes
- C12Q1/6883—Nucleic acid products used in the analysis of nucleic acids, e.g. primers or probes for diseases caused by alterations of genetic material
-
- A—HUMAN NECESSITIES
- A61—MEDICAL OR VETERINARY SCIENCE; HYGIENE
- A61K—PREPARATIONS FOR MEDICAL, DENTAL OR TOILETRY PURPOSES
- A61K48/00—Medicinal preparations containing genetic material which is inserted into cells of the living body to treat genetic diseases; Gene therapy
-
- A—HUMAN NECESSITIES
- A61—MEDICAL OR VETERINARY SCIENCE; HYGIENE
- A61P—SPECIFIC THERAPEUTIC ACTIVITY OF CHEMICAL COMPOUNDS OR MEDICINAL PREPARATIONS
- A61P37/00—Drugs for immunological or allergic disorders
- A61P37/02—Immunomodulators
-
- C—CHEMISTRY; METALLURGY
- C07—ORGANIC CHEMISTRY
- C07K—PEPTIDES
- C07K16/00—Immunoglobulins [IGs], e.g. monoclonal or polyclonal antibodies
- C07K16/18—Immunoglobulins [IGs], e.g. monoclonal or polyclonal antibodies against material from animals or humans
- C07K16/28—Immunoglobulins [IGs], e.g. monoclonal or polyclonal antibodies against material from animals or humans against receptors, cell surface antigens or cell surface determinants
- C07K16/2866—Immunoglobulins [IGs], e.g. monoclonal or polyclonal antibodies against material from animals or humans against receptors, cell surface antigens or cell surface determinants against receptors for cytokines, lymphokines, interferons
-
- C—CHEMISTRY; METALLURGY
- C07—ORGANIC CHEMISTRY
- C07K—PEPTIDES
- C07K16/00—Immunoglobulins [IGs], e.g. monoclonal or polyclonal antibodies
- C07K16/18—Immunoglobulins [IGs], e.g. monoclonal or polyclonal antibodies against material from animals or humans
- C07K16/28—Immunoglobulins [IGs], e.g. monoclonal or polyclonal antibodies against material from animals or humans against receptors, cell surface antigens or cell surface determinants
- C07K16/2896—Immunoglobulins [IGs], e.g. monoclonal or polyclonal antibodies against material from animals or humans against receptors, cell surface antigens or cell surface determinants against molecules with a "CD"-designation, not provided for elsewhere
-
- C—CHEMISTRY; METALLURGY
- C12—BIOCHEMISTRY; BEER; SPIRITS; WINE; VINEGAR; MICROBIOLOGY; ENZYMOLOGY; MUTATION OR GENETIC ENGINEERING
- C12N—MICROORGANISMS OR ENZYMES; COMPOSITIONS THEREOF; PROPAGATING, PRESERVING, OR MAINTAINING MICROORGANISMS; MUTATION OR GENETIC ENGINEERING; CULTURE MEDIA
- C12N15/00—Mutation or genetic engineering; DNA or RNA concerning genetic engineering, vectors, e.g. plasmids, or their isolation, preparation or purification; Use of hosts therefor
- C12N15/09—Recombinant DNA-technology
- C12N15/63—Introduction of foreign genetic material using vectors; Vectors; Use of hosts therefor; Regulation of expression
- C12N15/67—General methods for enhancing the expression
- C12N15/68—Stabilisation of the vector
-
- C—CHEMISTRY; METALLURGY
- C12—BIOCHEMISTRY; BEER; SPIRITS; WINE; VINEGAR; MICROBIOLOGY; ENZYMOLOGY; MUTATION OR GENETIC ENGINEERING
- C12N—MICROORGANISMS OR ENZYMES; COMPOSITIONS THEREOF; PROPAGATING, PRESERVING, OR MAINTAINING MICROORGANISMS; MUTATION OR GENETIC ENGINEERING; CULTURE MEDIA
- C12N15/00—Mutation or genetic engineering; DNA or RNA concerning genetic engineering, vectors, e.g. plasmids, or their isolation, preparation or purification; Use of hosts therefor
- C12N15/09—Recombinant DNA-technology
- C12N15/63—Introduction of foreign genetic material using vectors; Vectors; Use of hosts therefor; Regulation of expression
- C12N15/79—Vectors or expression systems specially adapted for eukaryotic hosts
- C12N15/85—Vectors or expression systems specially adapted for eukaryotic hosts for animal cells
- C12N15/86—Viral vectors
-
- C—CHEMISTRY; METALLURGY
- C07—ORGANIC CHEMISTRY
- C07K—PEPTIDES
- C07K2317/00—Immunoglobulins specific features
- C07K2317/20—Immunoglobulins specific features characterized by taxonomic origin
- C07K2317/21—Immunoglobulins specific features characterized by taxonomic origin from primates, e.g. man
-
- C—CHEMISTRY; METALLURGY
- C07—ORGANIC CHEMISTRY
- C07K—PEPTIDES
- C07K2317/00—Immunoglobulins specific features
- C07K2317/20—Immunoglobulins specific features characterized by taxonomic origin
- C07K2317/24—Immunoglobulins specific features characterized by taxonomic origin containing regions, domains or residues from different species, e.g. chimeric, humanized or veneered
-
- C—CHEMISTRY; METALLURGY
- C07—ORGANIC CHEMISTRY
- C07K—PEPTIDES
- C07K2317/00—Immunoglobulins specific features
- C07K2317/70—Immunoglobulins specific features characterized by effect upon binding to a cell or to an antigen
- C07K2317/75—Agonist effect on antigen
-
- C—CHEMISTRY; METALLURGY
- C07—ORGANIC CHEMISTRY
- C07K—PEPTIDES
- C07K2317/00—Immunoglobulins specific features
- C07K2317/70—Immunoglobulins specific features characterized by effect upon binding to a cell or to an antigen
- C07K2317/76—Antagonist effect on antigen, e.g. neutralization or inhibition of binding
-
- C—CHEMISTRY; METALLURGY
- C12—BIOCHEMISTRY; BEER; SPIRITS; WINE; VINEGAR; MICROBIOLOGY; ENZYMOLOGY; MUTATION OR GENETIC ENGINEERING
- C12Q—MEASURING OR TESTING PROCESSES INVOLVING ENZYMES, NUCLEIC ACIDS OR MICROORGANISMS; COMPOSITIONS OR TEST PAPERS THEREFOR; PROCESSES OF PREPARING SUCH COMPOSITIONS; CONDITION-RESPONSIVE CONTROL IN MICROBIOLOGICAL OR ENZYMOLOGICAL PROCESSES
- C12Q2600/00—Oligonucleotides characterized by their use
- C12Q2600/112—Disease subtyping, staging or classification
-
- C—CHEMISTRY; METALLURGY
- C12—BIOCHEMISTRY; BEER; SPIRITS; WINE; VINEGAR; MICROBIOLOGY; ENZYMOLOGY; MUTATION OR GENETIC ENGINEERING
- C12Q—MEASURING OR TESTING PROCESSES INVOLVING ENZYMES, NUCLEIC ACIDS OR MICROORGANISMS; COMPOSITIONS OR TEST PAPERS THEREFOR; PROCESSES OF PREPARING SUCH COMPOSITIONS; CONDITION-RESPONSIVE CONTROL IN MICROBIOLOGICAL OR ENZYMOLOGICAL PROCESSES
- C12Q2600/00—Oligonucleotides characterized by their use
- C12Q2600/118—Prognosis of disease development
-
- C—CHEMISTRY; METALLURGY
- C12—BIOCHEMISTRY; BEER; SPIRITS; WINE; VINEGAR; MICROBIOLOGY; ENZYMOLOGY; MUTATION OR GENETIC ENGINEERING
- C12Q—MEASURING OR TESTING PROCESSES INVOLVING ENZYMES, NUCLEIC ACIDS OR MICROORGANISMS; COMPOSITIONS OR TEST PAPERS THEREFOR; PROCESSES OF PREPARING SUCH COMPOSITIONS; CONDITION-RESPONSIVE CONTROL IN MICROBIOLOGICAL OR ENZYMOLOGICAL PROCESSES
- C12Q2600/00—Oligonucleotides characterized by their use
- C12Q2600/158—Expression markers
-
- G—PHYSICS
- G01—MEASURING; TESTING
- G01N—INVESTIGATING OR ANALYSING MATERIALS BY DETERMINING THEIR CHEMICAL OR PHYSICAL PROPERTIES
- G01N2800/00—Detection or diagnosis of diseases
- G01N2800/50—Determining the risk of developing a disease
-
- G—PHYSICS
- G01—MEASURING; TESTING
- G01N—INVESTIGATING OR ANALYSING MATERIALS BY DETERMINING THEIR CHEMICAL OR PHYSICAL PROPERTIES
- G01N2800/00—Detection or diagnosis of diseases
- G01N2800/52—Predicting or monitoring the response to treatment, e.g. for selection of therapy based on assay results in personalised medicine; Prognosis
-
- G—PHYSICS
- G01—MEASURING; TESTING
- G01N—INVESTIGATING OR ANALYSING MATERIALS BY DETERMINING THEIR CHEMICAL OR PHYSICAL PROPERTIES
- G01N2800/00—Detection or diagnosis of diseases
- G01N2800/56—Staging of a disease; Further complications associated with the disease
Definitions
- This invention relates generally to compositions and methods for identifying the regulatory network that modulates, controls or otherwise influences T cell balance, for example, Thl 7 ceil differentiation, maintenance and/or function, as well compositions and methods for exploiting the regulatory network that modulates, controls or otherwise influences T cell balance in a variety of therapeutic and/or diagnostic indications.
- This invention also relates generally to identifying and exploiting target genes and/or target gene products that modulate, control or otherwise influence T cell balance in a variety of therapeutic and/or diagnostic indications.
- the invention has many utilities.
- the invention pertains to and includes methods and compositions therefrom of Drug Discovery, as well as for detecting patients or subjects who may or may not respond or be responding to a particular treatment, therapy, compound, drug or combination of drugs or compounds; and accordingly ascertaining which drug or combination of drugs may provide a particular treatment or therapy as to a condition or disease or infection or infectious state, as well as methods and compositions for selecting patient populations (e.g., by detecting those who may or may not respond or be responding), or methods and compositions involving personalized treatment a combination of Drug Discovery and detecting patients or subjects who may not respond or be responding to a particular treatment, therapy, compound, drug or combination of drugs or compounds (e.g., by as to individuals), so detecting response, nor responding, potential to respond or not, and adjusting particular treatment, therapy, compound, drug or combination of drugs or compounds to be administered or administering a treatment, therapy, compound, drug or combination of drugs or compounds indicated from the detecting),
- the invention provides compositions and methods for modulating T cell balance, e.g., Thl7 cell differentiation, maintenance and function, and means for exploiting this network in a variety of therapeutic and diagnostic methods.
- modulating includes up-regulation of, or otherwise increasing, the expression of one or more genes, down-regulation of, or otherwise decreasing, the expression of one or more genes, inhibiting or otherwise decreasing the expression, activity and/or function of one or more gene products, and/or enhancing or otherwise increasing the expression, activity and/or function of one or more gene products.
- the term "modulating T cell balance" includes the modulation of any of a variety of T cell-related functions and/or activities, including by way of non-limiting example, controlling or otherwise influencing the networks that regulate T cell differentiation; controlling or otherwise influencing the networks that regulate T cell maintenance, for example, over the lifespan of a T cell; controlling or otherwise influencing the networks that regulate T cell function; controlling or otherwise influencing the networks that regulate helper T cell (Th ceil) differentiation; controlling or otlienvise influencing the networks that regulate Th cell maintenance, for example, over the lifespan of a Th eel 1; controlling or otherwise influencing the networks that regulate Th ceil function; controlling or otlienvise influencing the networks that regulate Thl7 cell differentiation; controlling or otherwise influencing the networks that regulate Thl7 celi maintenance, for example, over the lifespan of a Thl7 cell; controlling or otlienvise influencing the networks that regulate Thl7 cell function; controlling or otherwise influencing the networks that regulate regulatory T cell i'Treg
- the invention provides T cell modulating agents that modulate T cell balance.
- the invention provides T cell modulating agents and methods of using these T cell modulating agents to regulate, influence or otherwise impact the level(s) of and/or balance between T ceil types, e.g., between Thl7 and other T cell types, for example, regulatory T cells (Tregs), and/or Thl 7 activity and inflammatory potential.
- T ceil types e.g., between Thl7 and other T cell types, for example, regulatory T cells (Tregs), and/or Thl 7 activity and inflammatory potential.
- Tregs regulatory T cells
- Thl7 cell and/or “Thl7 phenotype” and all grammatical variations thereof refer to a differentiated T helper cell that expresses one or more cytokines selected from the group the consisting of mterleukin 17A (TL-17A), interleukin 17F (IL-17F), and interleukin 17A ' 'F heterodimer (IL17-AF).
- cytokines selected from the group the consisting of mterleukin 17A (TL-17A), interleukin 17F (IL-17F), and interleukin 17A ' 'F heterodimer (IL17-AF).
- Thl cell and/or “Th! phenotype” and all grammatical variations thereof refer to a differentiated T helper cell that expresses mterferon gamma (IFNy).
- IFNy mterferon gamma
- Th2 ceil and/or “Tii2 phenotype” and all grammatical variations thereof refer to a differentiated T helper cell that expresses one or more cytokines selected from the group the consisting of interleukin 4 (IL-4), interleukin 5 (IL-5) and interleukin 13 (JL-13).
- IL-4 interleukin 4
- IL-5 interleukin 5
- JL-13 interleukin 13
- the invention provides T cell modulating agents and methods of using these T cell modulating agents to regulate, influence or otherwise impact the level of and/or balance between Thl 7 phenotypes, and/or Thl 7 activity and inflammatory potential.
- Suitable T cell modulating agents include an antibody, a soluble polypeptide, a polypeptide agent, a peptide agent, a nucleic acid agent, a nucleic acid ligand, or a small molecule agent.
- the invention provides T cell modulating agents and methods of using these T cell modulating agents to regulate, influence or otherwise impact the level of and/or balance between Thl 7 cell types, e.g., between pathogenic and nonpathogenic Thl 7 cells.
- the invention provides T cell modulating agents and methods of using these T cell modulating agents to regulate, influence or otherwise impact the level of and'Or balance between pathogenic and non-pathogenic Thl 7 activity.
- the invention provides T cell modulating agents and m ethods of using th ese T cel l modul ating agents to influence or otherwise impact the differentiation of a population of T cells, for example toward Thl7 cells, with or without a specific pathogenic distinction, or away from Thl7 cel ls, with or without a specific pathogenic distinction
- the invention provides T ceil modulating agents and methods of using these T cell modulating agents to influence or otherwise impact the differentiation of a population of T cells, for example toward a non-Thl7 T cell subset or away from a non-Thl 7 cell subset.
- the invention provides T cell modulating agents and methods of using these T ceil modulating agents to induce T-ceil plasticity, i.e., converting Thl.7 cells into a different subtype, or into a new state.
- the invention provides T cell modulating agents and methods of using these T cell modulating agents to induce T cell plasticity, e.g., converting Thl7 cells into a different subtype, or into a new state.
- the invention provides T cell modulating agents and methods of using these T ceil modulating agents to achieve any combination of the above.
- the T cells are naive T ceils. In some embodiments, the T cells are differentiated T cells. In some embodiments, the T cells are partially differentiated T cel ls. In some embodiments, the T cells are a mixture of naive T cells and differentiated T cells. In some embodiments, the T cells are mixture of naive T cells and partially differentiated T cells. In some embodiments, the T cells are mixture of partially differentiated T cells and differentiated T cells. In some embodiments, the T cells are mixture of naive T cells, partially differentiated T cells, and differentiated T cells.
- the T cell modulating agents are used to modulate the expression of one or more target genes or one or more products of one or more target genes that have been identified as genes responsive to Thl7-related perturbations.
- These target genes are identified, for example, contacting a T cell, e.g., naive T cells, partially differentiated T cells, differentiated T cells and/or combinations thereof, with a T cell modulating agent and monitoring the effect, if any, on the expression of one or more signature genes or one or more products of one or more signature genes.
- the one or more signature genes are selected from those listed in Table 1 or Table 2 of the specification.
- the target gene is one or more Thl7-associated cytokine(s) or receptor molecule(s) selected from those listed in Table 3 of the specification. In some embodiments, the target gene is one or more Thl 7-associated transcription regulator(s) selected from those shown in Table 4 of the specification.
- the target gene is one or more Thl7-associated transcription regulators) selected from those shown in Table 5 of the specification. In some embodiments, the target gene is one or more ThJ 7 ⁇ associated receptor molecule(s) selected from those listed in Table 6 of the specification. In some embodiments, the target gene is one or more Thl7- associated kinase(s) selected f om those listed in Table 7 of the specification. In some embodiments, the target gene is one or more Thl7-associated signaling molecule(s) selected from those listed in Table 8 of the specification. In some embodiments, the target gene is one or more Thl7-associated receptor molecule(s) selected from those listed in Table 9 of the specification.
- the target gene is one or more target genes involved in induction of Thl7 differentiation such as, for example, IRFl, IRF8, IRF9, STAT2, STATS, IRF7, STAT1, ZFP281, IFI35, REL, TB.X21, FLU, BATF, IRF4, one or more of the target- genes listed in Table 5 as being associated with the early stage of Thl7 differentiation, maintenance and/or function, e.g., AES, AHR, ARJD5A, BATF, BCL11B, BCL3, CBFB, CBX4, CHD7, CITED2, CREB1, E2F4, EGR1, EGR2, ELL2, ETS1 , ETS2, ETV6, EZH1, FLU, FOXOI, GAT A3, GATAD2B, HIFIA, ID2, IFI35, IKZF4, IRFL IRF2, IRF3, IRF4, IRF7, 1RF9, JMJD1C, JUN, L
- the target gene is one or more target genes involved in onset of Thl7 phenotype and amplification of Thl7 T cells such as, for example, IRF8, STAT2, STAT3, IRF7, JUN, STAT5B, ZPF2981, CHD7, TBX21, FLU, SATBl, RUNXl, BATF, RORC, SP4, one or more of the target genes listed in Table 5 as being associated with the intermediate stage of ThI7 differentiation, maintenance and/or function, e.g., AES, AHR, ARID3A, ARID5A, ARM 1..
- target genes involved in onset of Thl7 phenotype and amplification of Thl7 T cells such as, for example, IRF8, STAT2, STAT3, IRF7, JUN, STAT5B, ZPF2981, CHD7, TBX21, FLU, SATBl, RUNXl, BATF, RORC, SP4, one or more of the target genes listed in Table 5 as being associated with the intermediate stage of
- the target gene is one or more target genes involved in stabilization of Thl7 cells and/or modulating Thl7-associated interleukin 23 (IL-23) signaling such as, for example, STAT2, ST.AT3, JUN, STATS B, CHD7, SATBl, RUNXl , BATF, RORC, SP4 IRF4, one or more of the target genes listed in Table 5 as being associated with the late stage of Th17 differentiation, maintenance and/or function, e.g., AES, AFIR, ARJJD3A, ARID5A, ARNTL, ASXLl, ATF3, ATF4, BATF, BATF3, BCL11B, BCL3, BCL6, C210RF66, CBFB, CBX4, CDC5L, CDYL, CEBPB, CHD7, CHMPIB, CIC, CITED 2, CREB1, CREB3L2, CREM, CSDA, DDIT3, E2F1, E2F4, E2F8, E
- IL-23 Thl
- STATl STAT3, STAT4, STA.T5A, STATS B, STAT6, SUZl 2, TBX21, TFEB, TGIF1, TLE1 , TP53, TRIM24, TRPS1, TSC22D3, UBE2B, VAV1, VAX2, XBP1, ZEB1, ZEB2, ZFP161, ZFP36L1, ZFP36L2, ZNF238, ZNF281, ZNF703, ZNRFI, and/or ZNRF2, or any combination thereof.
- the target gene is one or more of the target genes listed in Table 6 as being associated with the early stage of Th l 7 differentiation, maintenance and/or function, e.g., FAS, CCR5, IL6ST, IL17RA, IL2RA, MYD88, CXCR5, PVR, IL15RA, IL12RB 1 , or any combination thereof.
- the target gene is one or more of the target genes listed in Table 6 as being associated with the intermediate stage of Thl 7 differentiation, maintenance and/or function, e.g., IL7R, 1TGA3, IL1 R1 , CCR5, CCR6, ACVR2A, IL6ST, IL17RA, CCR8, DDR1 , PROCR, IL2RA, IL12RB2, MYD88, PTPRJ, TNFRSF13B, CXCR3, IL1RN, CXCR5, CCR4, W R. IL2RB, TNFR8F12A, CXCR4, KLRD1 , IR AK ! BP I , PVR, IL12RB1 , H . I HR i . TRAF3, or any combination thereof.
- IL7R 1TGA3, IL1 R1 , CCR5, CCR6, ACVR2A, IL6ST, IL17RA, CCR8, DDR1 , PROCR, IL2RA, IL12RB2,
- the target gene is one or more of the target genes listed in Table 6 as being associated with the late stage of Thl 7 differentiation, maintenance and/or function, e.g., IL7R, ITGA3, ILiRl , FAS, CCR5, CCR6, ACVR2A, IL6ST, IL17RA, DDR1, PROCR, IL2RA, IL12RB2, MYD88, BMPRI A, PTPRJ, TNFRSF13B, CXCR3, IL1 RN, CXCR5, CCR4, IL4R, IL2RB, TNFRSF12A, CXCR4, KLRD1 , IRAKI BP 1, PVR, IL15RA, TLR1 , ACVR1 B, IL12RB1 , IL18R] , TRAF3, IFNGR1 , PLAUR, IL21R, IL23R, or any combination thereof.
- IL7R e.g., ITGA3, ILiRl , FAS, CCR5,
- the target gene is one or more of the target genes listed in Table 7 as being associated with the early stage of Thl 7 differentiation, maintenance and/or function, e.g., EIF2AK2, DUSP22, HK2, RIPK1 , RNASEL, TEC, MAP3K8, SGK1 , PRKCQ, DUSP16, BMP2K, PIM2, or any combination thereof.
- the target gene is one or more of the target genes listed in Table 7 as being associated with the intermediate stage of Th l 7 differentiation, maintenance and/or function, e.g. , PSTPIPL PTPNl , ACP5, TXK, R1PK3, PTPRF, NEK4, PPMEI, PHACTR2, HK2, GMFG, DAPP1 , TEC, GMFB, PIM1 , NEK6, ACVR2A, FES, CDK6, ZAK, DUSP14, SGK1 , JAK3, ULK2, PTPRJ, SPHK1 , TNK2, PCTK 1, MAP4K3, TGFBR1, HK1, DDR1 , BMP2K, DUSP10, ALPK2, or any combination thereof.
- PSTPIPL PTPNl ACP5, TXK, R1PK3, PTPRF, NEK4, PPMEI, PHACTR2, HK2, GMFG, DAPP1 , TEC, GMFB, PIM1 ,
- the target gene is one or more of the target genes listed in Table 7 as being associated with the late stage of Thl 7 differentiation, maintenance and/or function, e.g., PIP LA, PSTPIP1 , TKl , PTEN, BPGM, DCK, PTPRS, PT Nl 8, MKNK2, PTPNl , PTPRE,, SH2DIA, PLK2, DUSP6, CDC25B, SLK, MAP3K5, BMPRIA, ACP5, TXK, RIPK3, PPP3CA, PTPRF, PACSINl, E 4, PIP4K2A, PPMEl, SRPK2, DU8P2, PHACTR2, DCLK l , PPP2R5A, RIPK1, GK, RNASEL, GMFG, STK4, HINTS, DAPP1, TEC, GMFB, PTPN6, RIPK2, ⁇ 1, NEK6, ACVR2A, AURKB, FES, ACVR1B
- the target gene is one or more of the target genes listed in Table 8 as being associated with the early stage of Thl7 differentiation, maintenance and/or function, e.g., HK2, CDK A, DUT, DUSPl, NADK, LIMK2, DUSP11 , TAOK3, S' PS L PPP2R4, MK K2, SGK1 , BPGM, TEC, MAPK6, PTP4A2, PRPF4B, ACPI, CCRN4L, or any combination thereof.
- the target gene is one or more of the target genes listed in Table 8 as being associated with the intermediate stage of Thl7 differentiation, maintenance and/or function, e.g., HK2, ZAP70, NEK6, DUSPl 4, SH2D1A, ITK, DUT, PPP1R11, DUSPl, PMVK, T 1, TAOK3, GMFG, PRPS1, SGKl , TXK, WNK1 , DUS l 9, TEC, RPS6 A1, PKM2, PRPF4B, ADRBKl, CKB, ULK2, PLKl , PPP2R5A, PLK2, or any combination thereof.
- the target gene is one or more of the target genes listed in Table 8 as being associated with the late stage of Thl7 differentiation, maintenance and/or function, e.g., ZAP70, PFKP, NEK6, DUSPl 4, SH2D1 A, INPP5B, ITK, PF L, PG 1, CDKN1A, DUT, PPP1R11, DUSPl, PMVK, PTPN22, PSPH, TK1, PGAM1, LIMK2, CLK1, DUSPl 1, TAOK3, RIOK2, GMFG, UCKLI , PRPS1, PPP2R4, MKNK2, DGKA, SGKl , TXK, WNK1 , DUSPl 9, CHP, BPGM, PIP5K1A, TEC, MAP2K1, MAPK6, RPS6KA1, PTP4A2, PKM2, PRPF4B, ADRBKl, CKB, ACPI, ULK2, CCR.N4L
- the target gene is one or more of the target genes listed in Table 9 as being associated with the early stage of Thl7 differentiation, maintenance and/or function, e.g., CD200, CD40LG, CD24, CCND2, ADAM 17, BSG, ITGAL, FAS, GPR65, SIGMAR! , CAP1, PLAUR, SRPRB, TRPV2, IL2RA, KDELR2, TNFRSF9, or any combination thereof.
- the target gene is one or more of the target genes listed in Table 9 as being associated with the intermediate stage of Thl 7 differentiation, maintenance and/or function, e.g., CTLA4, CD200, CD24, CD5L, CD9, IL2RB, CD53, CD74, CAST, CCR6, IL2RG, ITGAV, FAS, IL4R, PROCR, GPR65, TNFRSF18, RORA, ILIRN, RORC, CYSLTR] , P RC2, LOC390243, ADAM 10, TNFSF9, CD96, CD82, SLAMF7, CD27, PGRMC1, TRPV2, ADRBK1, TRAF6, IL2RA, THY1, IL12RB2, TNFRSF9, or any combination thereof.
- the target gene is one or more of the target genes listed in Table 9 as being associated with the late stage of Thl 7 differentiation, maintenance and/or function, e.g., CTLA4, TNFRSF4, CD44, PDCD 1 , (1)200.
- the target gene is one or more target genes that is a promoter of Th l 7 cell differentiation.
- the target gene is GPR65.
- the target gene is also a promoter of pathogenic Thl 7 ceil differentiation and is selected from the group consisting of CDS L, DEC] , PLZP and TCF4.
- the target gene is one or more target genes that is a promoter of pathogenic Thl 7 cell differentiation.
- the target gene is selected from the group consisting of CD5L, DEC1, PLZP and TCF4.
- the desired gene or combination of target genes is selected, and after determining whether the selected target gene(s) is overexpressed or under-expressed during Thl 7 differentiation and/or Thl 7 maintenance, a suitable antagonist or agonist is used depending on the desired differentiation, maintenance and/or function outcome. For example, for target genes that are identified as positive regulators of Thl 7 differentiation, use of an antagonist that interacts with those target genes will shift differentiation away from the Thl 7 phenotype, while use of an agonist that interacts with those target genes will shift differentiation toward the Thl7 phenotype. For target genes that are identified as negative regulators of Thl 7 differentiation.
- use of an antagonist that interacts with those target genes will shift differentiation toward from the Thl 7 phenotype, while use of an agonist that interacts with those target genes will shift differentiation away the Thl7 phenotype.
- use of an antagonist that interacts with those target genes will reduce the number of cells with the Th l7 phenotype, whi le use of an agonist that interacts with those target genes will increase the number of cells with the Thl 7 phenotype.
- Suitable T cell modulating agents include an antibody, a soluble polypeptide, a polypeptide agent, a peptide agent, a nucleic acid agent, a nucleic acid ligand, or a small molecule agent,
- the positive regulator of T l7 differentiation is a target gene selected from MINA, TRPS 1 , MY C, ⁇ 1 , NOTCH, PML, POU2AF1 , PRC M R.. R BP.I, SMARCA4, ZEB1 , BATF, CCR5, CCR6, EGR1 , EGR2, ETV6, FAS, ILI2RB1 , IL17RA, IL21 , IRF4, 1 RF8, 1TGA3, and combinations thereof.
- the positive regulator of Thl7 differentiation is a target gene selected from MINA, PML, POU2AF1 , PRQCR, SMARCA4, ZEB1 , EGR2, CCR.6, FAS and combinations thereof.
- the negative regulator of Thl 7 differentiation is a target gene selected from SP4, ETS2, 1KZF4, TSC22D3, IRF1 and combinations thereof.
- the negative regulator of Th! 7 d fferentiation is a target gene selected from SIM, IKZF4, TSC22D3 and combinations thereof.
- the T cell modulating agent is a soluble Fas polypeptide or a polypeptide derived from FAS.
- the T cell modulating agent is an agent that enhances or otherwise increases the expression, activity, and/or function of FAS in Thl7 ceils. As shown herein, expression of FAS in T cell populations induced or otherwise influenced differentiation toward Thl 7 cells.
- these T cell modulating agents are useful in the treatment of an immune response, for example, an autoimmune response or an inflammatory response. In some embodiments, these T cell modulating agents are useful in the treatment of an infectious disease or other pathogen-based disorders.
- the T ceil modulating agent is an antibody, a soluble polypeptide, a polypeptide agonist, a peptide agonist, a nucleic acid agonist, a nucleic acid Iigand, or a small molecule agonist.
- the T cells are naive T cells.
- the T cells are differentiated T ceils.
- the T ceils are partially differentiated T cells.
- the T cells are a mixture of naive T cel ls and differentiated T cells.
- the T cells are mixture of naive T cells and parti ally differentiated T cells.
- the T cells are mixture of partially differentiated T cells and differentiated T cells.
- the T ceils are mixture of naive T cells, partially differentiated T cel ls, and differentiated T cells.
- the T cell modulating agent is an agent that inhibits the expression, activity and/or function of FAS. Inhibition of FAS expression, activity and/or function in T cell populations repressed or otherwise influenced differentiation away from Thl 7 ceils and/or induced or otherwise influenced differentiation toward regulatory T cells (Tregs) and towards Thl cells.
- these T cell modulating agents are useful in the treatment of an immune response, for example, an autoimmune response or an mfiammatory response.
- these T cell modulating agents are useful in the treatment of autoimmune diseases such as psoriasis, inflammatory bowel disease (1BD), ankylosing spondylitis, multiple sclerosis, Sjogren's syndrome, uveitis, and rheumatoid arthritis, asthma, systemic lupus erythematosus, transplant rejection including allograft rejection, and combinations thereof.
- autoimmune diseases such as psoriasis, inflammatory bowel disease (1BD), ankylosing spondylitis, multiple sclerosis, Sjogren's syndrome, uveitis, and rheumatoid arthritis
- asthma systemic lupus erythematosus
- transplant rejection including allograft rejection
- combinations thereof transplant rejection including allograft rejection
- the T cell modulating agent is an antibody, a soluble polypeptide, a polypeptide antagonist, a peptide antagonist, a nucleic acid antagonist, a nucleic acid Iigand, or a small molecule antagonist.
- the T cells are naive T cells.
- the T cells are differentiated T cells.
- the T cells are partially differentiated T cells that express additional cytokines.
- the T cells are a mixture of naive T cells and differentiated T cells.
- the T cells are mixture of naive T cells and partially differentiated T cells.
- the T cells are mixture of partially differentiated T cells and differentiated T cells.
- the T cells are mixture of naive T cells, partially differentiated T cells.
- the T cells are mixture of naive T cells, partially differentiated T cells, and differentiated T cells.
- the T cell modulating agent is an agent that inhibits the expression, activity and/or function of CCR5. Inhibition of CCR5 expression, activity and/or function in T cell populations repressed or otherwise influenced differentiation away from Thl7 cells and/or mduced or otherwise influenced differentiation toward regulatory T cells (Tregs) and towards Thl cells.
- these T cell modulating agents are useful in the treatment of an immune response, for example, an autoimmune response or an inflammatory response.
- the T ceil modulating agent is an inhibitor or neutralizing agent.
- the T cell modulating agent is an antibody, a soluble polypeptide, a polypeptide antagonist, a peptide antagonist, a nucleic acid antagonist, a nucle c acid ligand, or a small molecule antagonist.
- the T ceils are na ' ive T cells.
- the T cells are differentiated T cells.
- the T cells are partially differentiated T cells.
- the T cells are a mixture of na ' ive T cells and differentiated T cells.
- the T cells are mixture of na ' ive T cells and partially differentiated T cells.
- the T cells are mixture of partially differentiated T cells and differentiated T cells.
- the T cells are mixture of naive T cells, partially differentiated T cells, and differentiated T cells.
- the T cell modulating agent is an agent that inhibits the expression, activity and/or function of CCR6. Inhibition of CCR6 expression, activity and/or function in T cell populations repressed or otherwise influenced differentiation away from Thl 7 cells and/or induced or otherwise influenced differentiation toward regulatory T cells (Tregs) and towards Thl cells.
- these T cell modulating agents are useful in the treatment of an immune response, for example, an autoimmune response or an inflammatory response.
- the T cell modulating agent is an antibody, a soluble polypeptide, a polypeptide antagonist, a peptide antagonist, a nucleic acid antagonist, a nucleic acid ligand, or a small molecule antagonist.
- the T cells are naive T cells. In some embodiments, the T cells are differentiated T cells. In some embodiments, the T cells are partially differentiated T cells. In some embodiments, the T cells are a mixture of naive T cells and differentiated T cells. In some embodiments, the T cells are mixture of na ' ive T cells and partially differentiated T cells. In some embodiments, the T cells are mixture of partially differentiated T cells and differentiated T cells. In some embodiments, the T cells are mixture of na ' ive T cells, partially differentiated T cells, and differentiated T cells.
- the T cell modulating agent is an agent that inhibits the expression, activity and/or function of EGRl . Inhibition of EGRl expression, activity and/or function in T cell populations repressed or otherwise influenced differentiation away from Till? cells and/or induced or otherwise influenced differentiation toward regulatory T ceils (Tregs) and towards Thl cells.
- these T cell modulating agents are useful in the treatment of an immune response, for example, an autoimmune response or an inflammatory response.
- the T cell modulating agent is an antibody, a soluble polypeptide, a polypeptide antagonist, a peptide antagonist, a nucleic acid antagonist, a nucleic acid ligand, or a small molecule antagonist.
- the T cells are naive T cells. In some embodiments, the T cells are differentiated T cells. In some embodiments, the T cells are partially differentiated T cells. In some embodiments, the T ceils are a mixture of naive T ceils and differentiated T cells. In some embodiments, the T cells are mixture of naive T cells and partially differentiated T ceils. In some embodiments, the T cells are mixture of partially differentiated T cells and differentiated T cells. In some embodiments, the T cells are mixture of naive T cells, partially differentiated T cells, and differentiated T cells.
- the T cell modulating agent is an agent that inhibits the expression, activity and/or function of EGR2. Inhibition of EGR2 expression, activity and/or function in T ceil populations repressed or otherwise influenced differentiation away from Thl7 cells and/or induced or otherwise influenced differentiation toward regulatory T cells (Tregs) and towards Thl cells.
- these T cell modulating agents are useful in the treatment of an immune response, for example, an autoimmune response or an inflammatory response.
- the T cell modulating agent is an antibody, a soluble polypeptide, a polypeptide antagonist, a peptide antagonist, a nucleic acid antagonist, a nucleic acid ligand, or a small molecule antagonist.
- the T cells are naive T cells. In some embodiments, the T cells are differentiated T cells. In some embodiments, the T cells are partially differentiated T cells. In some embodiments, the T cells are a mixture of naive T cells and differentiated T cel ls. In some embodiments, the T cells are mixture of naive T cells and partially differentiated T cells. In some embodiments, the T cells are mixture of partially differentiated T cells and differentiated T cells. In some embodiments, the T cells are mixture of naive T cells, partially differentiated T cells, and differentiated T cells.
- the invention provides T cell modulating agents and methods of using these T cell modulating agents to regulate, influence or otherwise impact the phenotype of a Thl 7 cell or population of cells, for example, by influencing a naive T ceil or population of cells to differentiate to a pathogenic or non-pathogenic Thl7 cell or population of cells, by causing a pathogenic Thl7 cell or population of cells to switch to a non-pathogenic Thl7 cell or population of T cells (e.g., populations of naive T ceils, partially differentiated T cells, differentiated T cells and combinations thereof), or by causing a non-pathogenic Thl7 cell or population of T ceils (e.g., populations of naive T cells, partially differentiated T cells, differentiated T cells and combinations thereof) to switch to a pathogenic Thl7 cell or popul ation of cells.
- a non-pathogenic Thl7 cell or population of T cells e.g., populations of naive T cells, partially differentiated T cells, differentiated T cells
- the invention comprises a method of drag discovery for the treatment of a disease or condition involving an immune response involving T cell balance in a population of cells or tissue of a target gene comprising the steps of providing a compound or plurality of compounds to be screened for their efficacy in the treatment of said disease or condition, contacting said compound or plurality of compounds with said population of cells or tissue, detecting a first level of expression, activity and/or function of a target gene, comparing the detected level to a control of level of a target gene, and evaluating the difference between the detected level and the control level to determine the immune response elicited by said compound or plurality of compounds.
- the method contemplates comparing tissue samples which can be inter alia infected tissue, inflamed tissue, healthy tissue, or combinations of tissue samples thereof.
- the reductase null animals of the present invention may advantageously be used to modulate T cell balance in a tissue or cell specific manner.
- Such animals may be used for the applications hereinbefore described, where the role of T cell balance in product/drug metabolism, detoxification, normal homeostasis or in disease etiology is to be studied. It is envisaged that this embodiment will also allow other effects, such as drug transporter-mediated effects, to be studied in those tissues or cells in the absence of metabolism, e.g., carbon metabolism.
- the animals of the present invention in a further aspect of the invention may be used to modulate the functions and antibodies in any of the above cell types to generate a disease model or a model for product/drug discovery or a model to verify or assess functions of T cell balance
- the method contemplates use of animal tissues and/or a population of cel ls derived therefrom of the present invention as an in vitro assay for the study of any one or more of the following events/parameters: (i) role of transporters in product uptake and efflux; (ii) identification of product metabolites produced by T ceils; (iii) evaluate whether candidate products are T cells; or (iv) assess drug/drug interactions due to T cell balance.
- pathogenic or “non-pathogenic” as used herein are not to be construed as implying that one Thl 7 cell phenotype is more desirable than the other. As described herein, there are instances in which inhibiting the induction of pathogenic Thl 7 ceils or modulating the Thl7 phenotype towards the non-pathogenic Thl 7 phenotype is desirable. Likewise, there are instances where inhibiting the induction of non-pathogenic Thl7 cells or modulating the Thl 7 phenotype towards the pathogenic Thl 7 phenotype is desirable.
- Thl 7 cell and/or “pathogenic Thl 7 phenotype” and all grammatical variations thereof refer to Thl 7 cells that, when induced in the presence of TGF-p3, express an elevated level of one or more genes selected from Cxcl3, 11.22. IL3, Ccl4, Gzmb, Lrmp, Ccl5, Caspl, Csf2, CcB, Tbx21, Icos, IL17r, Stat4, Lgais3 and Lag, as compared to the level of expression in a TGF-p3-induced Thl 7 cells.
- non-pathogenic Thl 7 cell and/or “non-pathogenic Thl 7 phenotype” and all grammatical variations thereof refer to Thl 7 cells that, when induced in the presence of TGF- ⁇ 3, express a decreased level of one or more genes selected from IL6st, ILlrn, IkzO, Maf, Ahr, IL9 and ILIO, as compared to the level of expression in a TGF-p3-indueed Thl7 cells.
- the T cell modulating agent is an agent that enhances or otherwise increases the expression, activity and/or function of Protein C Receptor (PROCR, also called EPCR or CD201) in Thl 7 cells.
- PROCR Protein C Receptor
- EPCR Protein C Receptor
- CD201 Protein C Receptor
- expression of PROCR in Thl 7 cells reduced the pathogenicity of the Thl 7 cells, for example, by switching Thl 7 ceils from a pathogenic to non-pathogenic signature.
- PROCR and/or these agonists of PROCR are useful in the treatment of a variety of indications, particularly in the treatment of aberrant immune response, for example in autoimmune diseases and/or inflammatory disorders.
- the T cell modulating agent is an antibody, a soluble polypeptide, a polypeptide agonist, a peptide agonist, a nucleic acid agonist, a nucleic acid ligand, or a small molecule agonist.
- the T ceil modulating agent is an agent that inhibits the expression, activity and/or function of the Protein C Receptor (PROCR, also called EPCR or CD201).
- PROCR Protein C Receptor
- the T cell modulating agent is an antibody, a soluble polypeptide, a polypeptide antagonist, a peptide antagonist, a nucleic acid antagonist, a nucleic acid ligand, or a small molecule antagonist.
- the T cell modulating agent is a soluble Protein C Receptor (PROCR, also called EPCR or CD201) polypeptide or a polypeptide derived from PROCR.
- the invention provides a method of inhibiting Thl7 differentiation, maintenance and/or function in a cell population and/or increasing expression, activity and/or function of one or more non ⁇ Thl7 ⁇ associated cytokines, one or more non-Thl7 associated receptor molecules, or non-Thl7-associated transcription regulators selected from FQXP3, interferon gamma (IFN- ⁇ ), GATA3, STAT4 and TBX21, comprising contacting a T cell with an agent that inhibits expression, activity and/or function of MINA, MYC, NKFB1, NOTCH, PML, POU2AF1, PROCR, RBPJ, SMARCA4, ZEBl, BATF, CCR5, CCR6, EGRl, EGR2, ETV6, FAS, IL12RB1, IL17RA, IL21 R, IRF4, IRF8, JTGA3 or combinations thereof.
- FQXP3, interferon gamma IFN- ⁇
- GATA3, STAT4 and TBX21 comprising contacting a T
- the agent inhibits expression, activity and/or function of at least one of MINA, PML, POU2AF1 , PROCR, SMARCA4, ZEBl , EGR2, C ' ( ' R6. FAS or combinations thereof, in some embodiments, the agent is an antibody, a soluble polypeptide, a polypeptide antagonist, a peptide antagonist, a nucleic acid antagonist, a nucleic acid ligand, or a small molecule antagonist. In some embodiments, the antibody is a monoclonal antibody. In some embodiments, the antibody is a chimeric, humanized or fully human monoclonal antibody.
- the T cell is a naive T cell, and wherein the agent is administered in an amount that is sufficient to modulate the phenotype of the T cell to become and/or produce a desired non-Thl 7 T cell phenotype, for example, a regulatory T cell (Treg) phenotype or another CD4+ T cell phenotype.
- the T cell is a partially differentiated T ceil, and wherein the agent is administered in an amount that is sufficient to modulate the phenotype of the partially differentiated T cell to become and/or produce a desired non-Thl7 T cell phenotype, for example, a regulatory T cell (Treg) phenotype or another CD4+ T cell phenotype.
- the T cell is a Thl7 T cell, and wherein the agent is administered in an amount that is sufficient to modulate the phenotype of the Thl7 T cell to become and/or produce a CD4+ T cell phenotype other than a Thl 7 T cell phenotype.
- the T cell is a Thl 7 T cell, and wherein the agent is administered in an amount that is sufficient to modulate the phenotype of the Thl7 T cell to become and/or produce a shift in the Thl 7 T cell phenotype, e.g., between pathogenic or non-pathogenic Thl.7 cell phenotype.
- the invention provides a method of inhibiting Thl7 differentiation in a ceil population and/or increasing expression, activity and/or function of one or more non-Th! 7-associated cytokines, one or more non ⁇ Thl 7 ⁇ associated receptor molecules, or non-Tii 17-associated transcription factor selected from FGXP3, interferon gamma (IFN- ⁇ ), GAT A3, STAT4 and TBX21 , comprising contacting a T cell with an agent that enhances expression, activity and/or function of SP4, ETS2, IKZF4, TSC22D3, IRF1 or combinations thereof.
- IFN- ⁇ interferon gamma
- the agent enhances expression, activity and/or function of at least one of SP4, IKZF4, TSC22D3 or combinations thereof.
- the agent is an antibody, a soluble polypeptide, a polypeptide agonist, a peptide agonist, a nucleic acid agonist, a nucleic acid ligand, or a small molecule agonist.
- the antibody is a monoclonal antibody.
- the T cell is a naive T cell, and wherein the agent is administered in an amount that is sufficient to modulate the phenotype of the T cell to become and/or produce a desired non-Thl7 T cell phenotype, for example, a regulator ⁇ ' T cell (Treg) phenotype or another CD4+ T cell phenotype.
- the T cell is a partially differentiated T cell, and wherein the agent is administered in an amount that is sufficient to modulate the phenotype of the partially differentiated T cell to become and/or produce a desired non-Thl7 T ceil phenotype, for example, a regulatory T cell (Treg) phenotype or another CD4+ T cell phenotype.
- the T cell is a Thl7 T cell, and wherein the agent is administered in an amount that is sufficient to modulate the phenotype of the Thl7 T cell to become and/or produce a CD4+ T cell phenotype other than a ThI7 T cell phenotype.
- the T cell is a Thl 7 T cell, and wherein the agent is administered in an amount that is sufficient to modulate the phenotype of the Thl7 T ceil to become and/or produce a shift in the Thl 7 T ceil phenotype, e.g., between pathogenic or non-pathogenic Thl 7 cell phenotype.
- the invention provides a method of enhancing Thl 7 differentiation in a ceil population increasing expression, activity and/or function of one or more Th 17-associated cytokines, one or more Thl7-associated receptor molecules, or one or more Thl7-associated transcription regulators selected from interleukin 17F (IL-17F), interleukin 17A (IL-17A), STAT3, interleukin 21 (IL-2.1) and RAR-related orphan receptor C (I ORC), a d/or decreasing expression, activity and/or function of one or more non-Th 17-associated cytokines, one or more Thl7-associated receptor molecules, or one or more non-Thl 7-associated transcription regulators selected from FOXP3, interferon gamma (!FN- ⁇ ), GATA3, STAT4 and TBX21, comprising contacting a T cell with an agent that inhibits expression, activity and/or function of SP4, ETS2, I ZF4, TSC22D3, I F1 or combinations thereof.
- Thl7-associated transcription regulators selected from
- the agent inhibits expression, activity and/or function of at least one of SP4, I ZF4, TSC22D3 or combinations thereof.
- the agent is an antibody, a soluble polypeptide, a polypeptide antagonist, a peptide antagonist, a nucleic acid antagonist, a nucle c acid ligand, or a small molecule antagonist.
- the antibody is a monoclonal antibody. In some embodiments, the antibody is a chimeric, humanized or fully human monoclonal antibody.
- the T cell is a naive T cell, and wherein the agent is administered in an amount that is sufficient to modulate the phenotype of the T cell to become and/or produce a desired Thl7 T cell phenotype.
- the T cell is a partially differentiated T cell, and wherein the agent is administered in an amount that is sufficient to modulate the phenotype of the partially differentiated T cell to become and/or produce a desired Thl 7 T cell phenotype.
- the T cell is a CD4+ T cell other than a Thl7 T cell, and wherein the agent is administered in an amount that is sufficient to modulate the phenotype of the non-Thl 7 T cell to become and/or produce a Thl7 T cell phenotype.
- the T cell is a Thl7 T cell, and wherein the agent is administered in an amount that is sufficient to modulate the phenotype of the Thl7 T cell to become and/or produce a shift in the Thl7 T cell phenotype, e.g., between pathogenic or non-pathogenic Thl 7 cell phenotype.
- the invention provides a method of enhancing Thl 7 differentiation in a cell population, increasing expression, activity and/or function of one or more Thl 7-associated cytokines, one or more Thl 7-associated receptor molecules, and/or one or more Thl 7-associated transcription regulators selected from inteiieukiii 17F (IL-17F), interleukin 17A (IL-17A), STAT3, interleukin 21 (IL-21) and RAR-related orphan receptor C (R.ORC), and/or decreasing expression, activity and/or function of one or more non-Thl 7-associated cytokines, one or more Thl 7-associated receptor molecules, or one or more non-Thl 7-associated transcription regulators selected from FOXP3, interferon gamma (IFN- ⁇ ), GAT A3, STAT4 and TBX21, comprising contacting a T cell with an agent that enhances expression, activity and/or function of VI IN A.
- IL-17F inteiieukiii 17F
- the agent enhances expression, activity and/or function of at least one of MINA, PML, PQU2AF.1, PROCR, 8MARCA4, ZEBl, EGR2, CCR6, FAS or combinations thereof.
- the agent is an antibody, a soluble polypeptide, a polypeptide agonist, a peptide agonist, a nucleic acid agonist, a nucleic acid ligand, or a small molecule agonist.
- the antibody is a monoclonal antibody.
- the antibody is a chimeric, humanized or fully human monoclonal antibody, in some embodiments, the agent is administered in an amount sufficient to inhibit Foxp3, IFN- ⁇ , GAT A3, STAT4 and/or TBX21 expression, activity and/or function.
- the T cell is a naive T cell, and wherein the agent is administered in an amount that is sufficient to modulate the phenotype of the T cell to become and/or produce a desired Th l 7 T cell phenotype.
- the T cell is a partially differentiated T cell, and wherein the agent is administered in an amount that is sufficient to modulate the phenotype of the partially differentiated T ceil to become and/or produce a desired Thl 7 T cell phenotype.
- the T cell is a CD4+ T ceil other than a Thl 7 T cell, and wherein the agent is administered in an amount that is sufficient to modulate the phenotype of the non-Thl7 T ceil to become and/or produce a Thl 7 T cell phenotype.
- the T cell is a Thl 7 T cell, and wherein the agent is administered in an amount that is sufficient to modulate the phenotype of the Thl.7 T ceil to become and/or produce a shift in the Th.17 T cell phenotype, e.g., between pathogenic or non-pathogenic Thl 7 ceil phenotype.
- the invention provides a method of identifying genes or genetic elements associated with Thl 7 d fferentiation comprising: a) contacting a T cell with an inhibitor of Thl 7 differentiation or an agent that enhances Thl 7 differentiation; and b) identifying a gene or genetic element whose expression is modulated by step (a).
- the method also comprises c) perturbing expression of the gene or genetic element, identified in step b) in a T cell that has been in contact with an inhibitor of Th.17 differentiation or an agent that enhances Thl 7 differentiation; and d) identifying a gene whose expression is modulated by step c).
- the inhibitor of Thl 7 differentiation is an agent that inhibits the expression, activity and/or function of MINA, MYC, NKFB1, NOTCH, PML, POU2AF1, PROCR, RBPJ, SMARCA4, ZEBl, BATF, CCR5, CCR6, EGR1, EGR2, ETV6, FAS, IL12RB1 , IL17RA, IL21R, IRF4, IRF8, ITGA3 or combinations thereof.
- the agent inhibits expression, activity and/or function of at least one of ⁇ , PML, POU2AF1, PROCR, SMARCA4, ZEB1 , EGR2, CCR6, FAS or combinations thereof.
- the inhibitor of Thl7 differentiation is an agent that enhances expression, activity and/or function of SP4, ETS2, IKZF4, TSC22D3, IRFl or combinations thereof.
- the agent enhances expression, activity and/or function of at least one of SP4, 1KZF4 or TSC22D3.
- the agent that enhances Thl 7 differentiation is an agent that inhibits expression, activity and/or function of SP4, ETS2, IKZF4, TSC22D3, IRFl or combinations thereof.
- the agent that enhances Till 7 differentiation is an agent that enhances expression, activity and/or function of ⁇ , MYC, NKFB1, NOTCH, PML, POU2AF1 , PROCR, RBPJ, SMARCA4, ZEBI, BATF, CCR5, CCR6, EGR1, EGR2, ETV6, FAS, IL12RB1, IL17RA, IL21R, IRF4, IRF8, ITGA3 or combinations thereof.
- the agent is an antibody, a soluble polypeptide, a polypeptide antagonist, a peptide antagonist, a nucleic acid antagonist, a nucleic acid ligand, or a small molecule antagonist.
- the invention provides a method of modulating induction of Thl7 differentiation comprising contacting a T cell with an agent that modulates expression, activity and/or function of one or more target genes or one or more products of one or more target genes selected from IRFl , IRF8, IRF9, STAT2, STATS, IRF7, STAT1 , ZFP281, IFI35, REL, TBX21, FLU, BATF, IRF4, one or more of the target genes listed in Table 5 as being associated with the early stage of Thl7 differentiation, maintenance and/or function, e.g., AES, AHR, ARID5A, BATF, BCL11B, BCL3, CBFB, CBX4, CHD7, CI TED 2, CREB1, E2F4, EGR1, EGR2, ELL2, ETSI , ETS2, ETV6, EZH1 , FLU , FOXOl, GAT A3, GATAD2B, HIF1A, ID2, IFI35
- the invention provides a method of modulating onset of Thl7 phenotype and amplification of Thl7 T cells comprising contacting a T cell with an agent that modulates expression, activity and/or function of one or more target genes or one or more products of one or more target genes selected from IRF8, STAT2, STAT3, IRF7, JUN, STAT5B, ZPF298I, CHD7, TBX21, FLU, SATB1, RUNX1, BATF, RORC, SP4, one or more of the target genes listed in Table 5 as being associated with the intermediate stage of Thl7 differentiation, maintenance and/or function, e.g., AES, AHR, ARXD3A., ARID5A, AR TL, ASXL1, BATF, BCL1 IB, BCL3, BCL6, CBFB, CBX4, CDC5L, CEBPB, CHD7, CREB1, CREB3L2, CREM, E2F4, E2F8, EGRl,
- an agent that modulates expression
- the invention provides a method of modulating stabilization of Thl7 cells and/or modulating Thl7-associated interleukin 23 (IL-23) signaling comprising contacting a T cell with an agent that modulates expression, activity and/or function of one or more target genes or one or more products of one or more target genes selected from STAT2, STAT3, JUN, STATS B, CHD7, SATBl, RUNXl, BATF, RORC, SP4 IRF4, one or more of the target genes listed in Table 5 as being associated with the late stage of Thl7 differentiation, maintenance and/or function, e.g., AES, AHR, ARID3A, ARID5A, ARNTL, ASXL1 , ATF3, ATF4, BATF, BATF3, i " L i I B.
- IL-23 Thl7-associated interleukin 23
- the invention provides a method of modulating one or more of the target genes listed in Table 6 as being associated with the early stage of Thl7 differentiation, maintenance and/or function, e.g., FAS, CCR5, IL6ST, IL17RA, IL2RA, MYD88, CXCR5, PVR, IL15RA, IL12RB1, or any combination thereof.
- the invention provides a method of modulating one or more of the target genes listed in Table 6 as being associated with the intermediate stage of Till 7 differentiation, maintenance and/or function, e.g., IL7R, ITGA3, IL1R1 , CCR5, CCR6, ACVR2A, IL6ST, ll . ! 7RA.
- the invention provides a method of modulating one or more of the target genes listed in Table 6 as being associated with the late stage of Thl7 differentiation, maintenance and/or function, e.g., IL7R, ITGA3, IL1R1, FAS, CCR5, CCR6, ACVR2A, IL6ST, IL17RA, DDRl, PROCR, IL2RA, IL12RB2, MYD88, BMPR1A, PTPRJ, TNFRSF13B, CXCR3, IL1RN, CXCR5, CCR4, IL4R, IL2RB, TNFRSF12A, CXCR4, KLRD 1, IRAKIBPI, PVR, 1L15RA, TLR1, ACVR1B, IL12RB1 , 1L18R1 , TRAF3, IFNGR1 , PLAUR, IL21 , IL23R, or any combination thereof.
- IL7R ITGA3, IL1R1, FAS, CCR5, CCR6, ACVR2A,
- the invention provides a method of modulating one or more of the target genes listed in Table 7 as being associated with the early stage of Thl7 differentiation, maintenance and/or function, e.g., EIF2AK2, DUSP22, HK2, RIPKL RNASEL, TEC, MAP3K8, SG l, PRKCQ, DUSP16, BMP2K, PIM2, or any combination thereof.
- the invention provides a method of modulating one or more of the target genes listed in Table 7 as being associated with the intermediate stage of Thl7 differentiation, maintenance and/or function, e.g., PSTPIP1 , PTPNl , ACP5, TXK, RIPK3, PTPRF, NEK4, PPME1, Pi:IACTR2, HK2, GMFG, DAPP1, TEC, GMFB, PIM1 , NEK6, ACVR2A, FES, CDK6, ZAK, DUSP14, SGKl, JAK3, ULK2, PTPRJ, SPHK1, TNK2, PCTKl, MAP4K3, TGFBRl, HKI, DDRl, BMP2K, DUSPIO, ALPK2, or any combination thereof.
- PSTPIP1 e.g., PSTPIP1 , PTPNl , ACP5, TXK, RIPK3, PTPRF, NEK4, PPME1, Pi:IACTR2, HK2, GMFG, DAPP
- the invention provi des a method of modulating one or more of the target genes listed in Table 7 as being associated with the late stage of Thl7 differentiation, maintenance and/or function, e.g., PTPLA, PSTPIP l , TKl, PTEN, BPGM, DCK, PTPRS, PTPN18, MK.NK2, PTPN1 , FTP RE, SH2D1A, PLK2, DUSP6, CDC25B, SLK, MAP3K5, BMPR1A, ACP5, TXK, RIPK3, PPP3CA, PTPRF, PACSIN1, ⁇ 4, ⁇ 4 ⁇ 2 ⁇ , PPMEl, SRPK2, DUSP2, PHACTR2, DCLK1 , PPP2R5A, R1PK1, GK, RNASEL, GMFG, STK4, HINT3, DAPP1 , TEC, GMFB, PTPN6, RIPK2, PIMl , NEK6, ACVR2
- PTPLA Prolifert
- the invention provides a method of modulating is one or more of the target genes listed in Table 8 as being associated with, the early stage of TbJ7 differentiation, maintenance and/or function, e.g., HK2, CDKNIA, DUT, DUSPl, NADK, LIMK2, DUSPl 1, TAOK3, PRPSl, PPP2R4, MKNK2, SGKl, BPGM, TEC, MAPK6, PTP4A2, PRPF4B, ACPI, CCRN4L, or any combination thereof.
- the target genes listed in Table 8 as being associated with, the early stage of TbJ7 differentiation, maintenance and/or function, e.g., HK2, CDKNIA, DUT, DUSPl, NADK, LIMK2, DUSPl 1, TAOK3, PRPSl, PPP2R4, MKNK2, SGKl, BPGM, TEC, MAPK6, PTP4A2, PRPF4B, ACPI, CCRN4L, or any combination thereof.
- the invention provides a method of modulating one or more of the target genes listed in Table 8 as being associated with the intermediate stage of Thl7 differentiation, maintenance and/or function, e.g., HK2, ZAP70, NEK6, DUSP 14, SH2D1A, ITK, DUT, PPPl Rl l , DUSPl, PMVK, TKl, TAOK3, GMFG, PRPSl, SGKl, TXK, WNK1, DUSP l 9, TEC, RPS6KA1, PKM2, I' Pl-U ADRBK1, CKB, ULK2, PLK1, PPP2R5A, PLK2, or any combination thereof.
- the invention provi des a method of modulating one or more of the target genes listed in Table 8 as being associated with the late stage of Thl7 differentiation, maintenance and/or function, e.g., ZAP70, PFKP, NEK6, DUSPl 4, SH2D1A, ⁇ ⁇ 5 ⁇ , ITK, PFKL, PGKI, CDKNIA, DUT, PPPlRl l, DUSPl, PMVK, PTPN22, PSPH, TKl, PGAM l, LIMK2, CLK1, DUSPl l, TAOK3, RIOK2, GMFG, UCKLl , PRPSl , PPP2R4, MKNK2, DGKA, SGKl, TXK, WNK1, DUSPl 9, CHP, BPGM:, PIP5K1A, TEC, MAP2K1, MAPK6, RPS6KA1, PTP4A2, PKM2, PRPF4B, ADRB
- the invention provides a method of modulating one or more of the target genes listed in Table 9 as being associated with the early stage of Thl7 differentiation, maintenance and/or function, e.g., CD200, CD40LG, CD24, CCND2, ADAM 17, BSC, i'TGAL, FAS, GPR65, SIGMARl, CAPl , PLAUR, SRPRB, TRPV2, IL2RA, KDELR2, TNFRSF9, or any combination thereof,
- the invention provides a method of modulating one or more of the target genes listed in Table 9 as being associated with the intermediate stage of Thl.7 differentiation, maintenance and/or function, e.g., CTLA4, CD200, CD24, CD5L, CD9, IL2RB, CD53, CD74, CAST, CCR6, IL2RG, ITGAV, FAS, IL4R, PROCR, GPR65, TNFRSF18, RORA, IL1RN, RORC, CYSLTR1 , PNRC2, LOC390243, AD AM 10, TNFSF9, CD96, CD82, SLAMF7, CD27, PGRMC1, TRPV2, ADRBK1, TRAF6, IL2RA, THY1, IL12RB2, TNFRSF9, or any combination thereof.
- the invention provides a method of modulating one or more of the target genes listed in Table 9 as being associated with the late stage of Thl7 differentiation, maintenance and/or function, e.g., CTLA4, TNFRSF4, CD44, PDCD1 , CD200, CD247, CD24, CD5L, CCND2, CD9, IL2RB, CD53, CD74, ADAM 17, BSG, CAST, CCR6, IL2RG, CD81 , CD6, CD48, ITGAV, TFR.C, ICAM2, ATP1B3, FAS, IL4R, CCR7, CD52, PROCR, GPR65, TNFRSFI8, FCRL1, RORA, IL1RN, RORC, P2RX4, SSR2, PTPN22, SIGMARl , CYSLTR1, LOC390243, AD AM 10, TNFSF9, CD96, CAPl, CD82, SLAMF7, PLAUR, CD27, SIVAl, PGRMC1, S
- the invention provides a method of inhibiting tumor growth in a subject in need thereof by administering to the subject a therapeutically effective amount of an inhibitor of Protein C Receptor (PROCR).
- the inhibitor of PROCR is an antibody, a soluble polypeptide, a polypeptide agent, a peptide agent, a nucleic acid agent, a nucleic acid ligand, or a small molecule agent.
- the inhibitor of PROCR is one or more agents selected from the group consisting of lipopolysaccharide; cisplatin; fibrinogen; 1, 10-phenanthroline; 5-N-ethylcarboxamido adenosine; cystathionine; hirudin; phospholipid; Drotrecogin a!fa; VEGF; Phosphatidyiethanolamine; serine; gamma- carboxyglutamic acid; calcium; warfarin; endotoxin; curcumin; lipid; and nitric oxide.
- the invention provides a method of diagnosing an immune response in a subject, comprising detecting a level of expression, acti vity and/or function of one or more signature genes or one or more products of one or more signature genes selected from 5 those listed in Table 1 or Table 2 and comparing the detected level to a control of level of signature gene or gene product expression, activity and/or function, wherein a difference between the detected level and the control level indicates that the presence of an immune response in the subject.
- the immune response is an autoimmune response.
- the immune response is an inflammator response, including inflammatory response(s) associated with an autoimmune response and/or inflammatory response! s) associated with an infectious disease or other pathogen-based disorder.
- the invention provides a method of monitoring an immune response in a subject, comprising detecting a level of expression, activity and/or function of one or more signature genes or one or more products of one or more signature genes, e.g., one or more signature genes selected from those listed in Table 1 or Table 2 at a first time point, detecting a level of expression, activity and/or function of one or more signature genes or one or more products of one or more signature genes, e.g., one or more signature genes selected from those listed in Table 1 or Table 2 at a second time point, and comparing the first detected level of expression, activity and/or function with the second detected level of expression, activity and/or function, wherein a change between the first and second detected levels indicates a change in the immune response in the subject.
- the immune response is an autoimmune response.
- the immune response is an inflammatory response.
- the invention provides a method of monitoring an immune response in a subject, comprising isolating a population of T cells from the subject at a first time point, determining a first ratio of T ceil subtypes within the T cell population at a first time point, isolating a population of T ceils from the subject at a second time point, determining a second ratio of T cell subtypes within the T cell population at a second time point, and comparing the first and second ratio of T cell subtypes, wherein a change in the first and second detected ratios indicates a change in the immune response in the subject.
- the immune response is an autoimmune response.
- the immune response is an inflammatory response.
- the invention provides a method of activating therapeutic immunity by exploiting the blockade of immune checkpoints.
- the progression of a productive immune response requires that a number of immunological checkpoints be passed.
- Immunity response is regulated by the counterbalancing of stimulatory and inhibitory signal
- the immunoglobulin superfamily occupies a central importance in this coordination of immune responses, and the CD28/cyto toxic T-lymphocyte antigen-4 (CTLA-4):B7.1/B7.2 receptor/ligand grouping represents the archetypal example of these immune regulators (see e.g., orman AJ, Peggs S, Allison JP, "Checkpoint blockade in cancer immunotherapy.” Adv Immunol.
- the present invention relates to a method of engineering T-eells, especially for immunotherapy, comprising modulating T cell balance to inactivate or othenvise inhibit at least one gene or gene product involved in the immune check-point.
- Suitable T cell modulating agent(s) for use in any of the compositions and methods provided herein include an antibody, a soluble polypeptide, a polypeptide agent, a peptide agent, a nucleic acid agent, a nucleic acid ligand, or a small molecule agent.
- suitable T cell modulating agents or agents for use in combination with one or more T cell modulating agents are shown in Table 10 of the specification.
- the T cell modulating agents have a variety of uses.
- the T ceil modulating agents are used as therapeutic agents as described herein.
- the T cell modulating agents can be used as reagents in screening assays, diagnostic kits or as diagnostic tools, or these T cell modulating agents can be used in competition assays to generate therapeutic reagents.
- the invention relates to a method of diagnosing, prognosing and/or staging an immune response involving T ceil balance, which may comprise detecting a first level of expression, activity and/or function of one or more signature genes or one or more products of one or more signature genes selected from the genes of Table 1 or Table 2 and comparing the detected level to a control of level of signature gene or gene product expression, activity and/or function, wherein a difference in the detected level and the control level indicates that the presence of an immune response in the subject.
- the invention relates to a method of monitoring an immune response in a subject comprising detecting a level of expression, activity and/or function of one or more signature genes or one or more products of one or more signature genes of Table 1 or Table 2 at a first time point, detecting a level of expression, activity and/or function of one or more signature genes or one or more products of one or more signature genes of Table 1 or Table 2 at a second time point, and comparing the first detected level of expression, activity and/or function with the second detected level of expression, activity and/or function, wherein a change in the first and second detected levels indicates a change in the immune response in the subject,
- the invention relates to a method of identifying a patient population at risk or suffering from an immune response which may comprise detecting a level of expression, activity and/or function of one or more signature genes or one or more products of one or more signature genes of Table 1 or Table 2 in the patient population and comparing the l evel of expression, acti vity and/or function of one or more signature genes or one or more products of one or more signature genes of Table 1 or Table 2 in a patient population not at risk or suffering from an immune response, wherein a difference in the level of expression, activity and/or function of one or more signature genes or one or more products of one or more signature genes of Table 1 or Table 2 in the patient populations identifies the patient population as at risk or suffering from an immune response.
- the invention relates to a method for monitoring subjects undergoing a treatment or therapy for an aberrant immune response to determine whether the patient is responsive to the treatment or therapy which may comprise detecting a level of expression, activity and/or function of one or more signature genes or one or more products of one or more signature genes of Table 1 or Table 2 in the absence of the treatment or therapy and comparing the level of expression, activity and/or function of one or more signature genes or one or more products of one or more signature genes of Table 1 or Table 2 in the presence of the treatment or therapy, wherein a difference in the level of expression, activity and/or function of one or more signature genes or one or more products of one or more signature genes of Table 1 or Table 2 in the presence of the treatment or therapy indicates whether the patient is responsive to the treatment or therapy,
- the invention may also involve a method of modulating T cell balance, the method which may comprise contacting a T cell or a population of T ceils with a T cell modulating agent in an amount sufficient to modify differentiation, maintenance and/or function of the T cell or population of T ceils by altering balance between Thl 7 cells, regulatory T ceils (Tregs) and other T cell subsets as compared to differentiation, maintenance and/or function of the T cell or population of T cells in the absence of the T cell modulating agent.
- a method of modulating T cell balance the method which may comprise contacting a T cell or a population of T ceils with a T cell modulating agent in an amount sufficient to modify differentiation, maintenance and/or function of the T cell or population of T ceils by altering balance between Thl 7 cells, regulatory T ceils (Tregs) and other T cell subsets as compared to differentiation, maintenance and/or function of the T cell or population of T cells in the absence of the T cell modulating agent.
- the immune response may be an autoimmune response or an inflammatory response.
- the inflammatory response may be associated with an autoimmune response, an infectious disease and/or a pathogen-based disorder.
- the signature genes may be Thl7-associated genes.
- the treatment or therapy may be an antagonist for GPR65 in an amount sufficient to induce differentiation toward regulatory T cells (Tregs), Thl cells, or a combination of Tregs and Thl cells.
- the treatment or therapy may be an agonist that enhances or increases the expression of GPR65 in an amount sufficient to induce T cell differentiation toward Thl 7 cells.
- the treatment or therapy may be specific for a target gene selected from the group consisting of DEC1, PZLP, TCF4 and CD5L,
- the treatment or therapy may be an antagonist of a target gene selected from the group consisting of DEC 1, PZLP, TCF4 and CD5L in an amount sufficient to switch Thl 7 cells from a pathogenic to non-pathogenic signature.
- the treatment or therapy may be an agonist that enhances or increases the expression of a target gene selected from the group consisting of DEC 1 , PZLP, TCF4 and CD5L in an amount sufficient to switch Thl 7 cells from a non-pathogenic to a pathogenic signature.
- the T ceil modulating agent may be an antibody, a soluble polypeptide, a polypeptide agent, a peptide agent, a nucleic acid agent, a nucleic acid ligand, or a small molecule agent.
- the T ceils may be naive T cells, partially differentiated T ceils, differentiated T ceils, a combination of naive T cells and partially differentiated T cells, a combination of naive T cells and differentiated T cells, a combination of partially differentiated T cells and differentiated T cells, or a combination of naive T cells, partially differentiated T cells and differentiated T cells.
- the invention also involves a method of enhancing Thl 7 differentiation in a cell population, increasing expression, activity and/or function of one or more Thl7-assoeiated cytokines or one or more Thl 7- associated transcription regulators selected from interleukin 17F (1L-17F), interleukin 17 A ( 11. ⁇ 17A), STATS, interleukin 21 (IL-21) and RAR-reiated orphan receptor C (RORC), and/or decreasing expression, activity and/or function of one or more non- Tlil7-associated cytokines or non-Thl 7-associated transcription regulators selected from FOXP3, interferon gamma (IFN- ⁇ ), GAT A3, STAT4 and TBX21, comprising contacting a T ceil with an agent that enhances expression, activity and/or function of CD5L, DECl, PLZP, TCF4 or combinations thereof.
- Thl7-assoeiated cytokines or one or more Thl 7- associated transcription regulators selected
- the agent may enhance expression, activity and/or function of at least one of CD5L, DECl, PLZP, or TCF4.
- Thw agent may be an antibody, a soluble polypeptide, a polypeptide agonist, a peptide agonist, a nucleic acid agonist, a nucleic acid ligand, or a small molecule agonist.
- the antibody may be a monoclonal antibody or a chimeric, humanized or fully human monoclonal antibody.
- the present invention also involves the use of an antagonist for GPR65 in an amount sufficient to induce differentiation toward regulatory T cells (Tregs), Thl cells, or a combination of Tregs and Th l cel ls, use of an agonist that enhances or increases the expression of GPR65 in an amount sufficient to induce T cell differentiation toward Thl 7 ceils, use of an antagonist of a target gene selected from the group consisting of DEC 1, PZLP, TCF4 and CD5L in an amount sufficient to switch Thl 7 cells from a pathogenic to non-pathogenic signature, use of an agonist that enhances or increases the expression of a target gene selected from the group consisting of DECl, PZLP, TCF4 and CD5L in an amount sufficient to switch Thl 7 cells from a nonpathogenic to a pathogenic signature and Use of T cell modulating agent for treating an aberrant immune response in a patient.
- Figures 1A through IE are a series of graphs and illustrations depicting genome wide temporal expression profiles of Till 7 differentiation.
- Figure 1A depicts an overview of approach.
- Figures IB-l and 1 B-2 depict gene expression profiles during Thl7 differentiation. Shown are the differential expression levels for genes (rows) at 18 time points (columns) in Thl7 polarizing conditions (TGF- ⁇ and IL-6; left panel, Z-normalized per row) or Thl7 polarizing conditions relative to control activated ThO ceils (right panel, log2(ratio)).
- the genes are partitioned into 20 clusters (C1-C20, color bars, right).
- Figure 1 C depicts three major transcriptional phases. Shown is a correlation matrix (red (right side of correlation scale): high; blue (left side of correlation scale): low) between eve ' pair of time points.
- Figure I D depicts transcriptional profiles of key cytokines and receptor molecules.
- Figures 2A through 2G are a series of graphs and illustrations depicting a model of the dynamic regulatory network of Till 7 differentiation.
- Figure 2A depicts an overview of computational analysis.
- Figure 2B depicts a schematic of temporal network 'snapshots'. Shown are three consecutive cartoon networks (top and matrix columns), with three possible interactions from regulator (A) to targets (B, C & D), shown as edges (top) and matrix rows (A— * B - top row; A ⁇ C - middle row; A ⁇ D - bottom row).
- Figure 2C depicts 18 network 'snapshots'. Left: each row corresponds to a TF-target interaction that occurs in at least one network; columns correspond to the network at each time point. A purple entry: interaction is active in that network.
- the networks are clustered by similarity of active interactions (dendrogram, top), forming three temporally consecutive clusters (early, intermediate, late, bottom).
- Figure 2D depicts dynamic regulator activity. Shown is, for each regulator (rows), the number of target genes (normalized by its maximum number of targets) in each of the 18 networks (columns, left), and in each of the three canonical networks (middle) obtained by collapsing (arrows).
- regulators chosen for perturbation pink:
- known Thl7 regulators grey
- the maximal number of target genes across the three canonical networks green, ranging from 0 to 250 targets).
- Figures 2E-1, 2E-2, and 2E-3 depict that at the heart of each network is its 'transcriptional circuit', connecting active TFs to target genes that themselves encode TFs.
- the transcription factor circuits shown are the portions of each of the inferred networks associating transcription regulators to targets that themselves encode transcription regulators.
- Yel low nodes denote transcription factor genes that are over-expressed (compared to ThO) during the respective time segment.
- Edge color reflects the data type supporting the regulatory interaction (legend).
- Figures 3A, 3B, 3C ami 3D are a series of graphs and illustrations depicting knockdown screen in Thl7 differentiation using silicon nanowires.
- Figure 3 A depicts unbiased ranking of perturbation candidates. Shown are the genes ordered from left to right based on their ranking for perturbation (columns, top ranking is leftmost).
- Two top matrices criteria for ranking by 'Network Information' (topmost) and 'Gene Expression Information'. Purple entry: gene has the feature (intensity proportional to feature strength; top five features are binary).
- Bar chart ranking score.
- FIG. 10A, 10B depicts scanning electron micrograph of primary T cells (false colored purple) cultured on vertical silicon nanowires.
- Figure 3C depicts delivery by silicon nanowire neither activates nor induces differentiation of naive T cells and does not affect their response to conventional TCR stimulation with anti- CD3/CD28.
- the candidate regulators shown are those listed in Table 5.
- the candidate regulators are listed on the x axis and are, in order from left to right, RORC, SATBl, TRPSl, SMOX, RORA, ARID5A, ETV 6, ARNTL, ETSl, UBE2B, BATF, STAT3, STATl , STAT5A, NR3C1, STAT6, TRIM24, HIFIA, IRF4, IRF8, ETS2, JUN, RUNX1 , FLU , REL, SP4, EGR2, NFKB1, ZFP281, STAT4, RELA, TBX21 , STAT5B, IRF7, STAT2, IRF3, XBPl, FOXOl , PRDM i, ATF4, IRF1, GAT A3, EGR.1, MYC, CREBl , IRF9, IRF2, FOXJ2, SMARCA4, TRP53, SUZ12, POU2AF1, CEBPB, ID2, CREM, MYST4, MXI1, RBPJ
- Figures 4A, 4B, 4C and 4D are a series of graphs and illustrations depicting coupled and mutually-antagonistic modules in the Thl 7 network. A color version of these figures can be found in Yosef et al., "Dynamic regulatory network controlling Thl 7 cell differentiation, Nature, vol, 496: 461 -468 (2013)/doi: 10.1038/naturel 1981.
- Figure 4A depicts the impact of perturbed genes on a 275-gene signature. Shown are changes in the expression of 275 signature genes (rows) following knockdown or knockout (KG) of 39 factors (columns) at 48hr (as well as IL-21r and IL-17ra KO at 60 hours).
- Light grey ha!os regulators not previously associated with Thl 7 differentiation.
- Figure 4C depicts how knockdown effects validate edges in network model.
- Figure 4D depicts how global knockdown effects are consistent across clusters.
- Venn diagram compare the set of genes that respond to a factor's knockdown in an RNA-Seq experiment (yellow circle) to each of the 20 clusters of Fig. lb (purple circle).
- the knockdown of a 'Thl 7 positive' regulator was expected to repress genes in induced clusters, and induce genes in repressed clusters (and vice versa for 'Thl 7 negative' regulators).
- Heat map For each regulator knockdown (rows) and each cluster (columns) shown are the significant overlaps (non grey entries) by the test above. Red (right side of Fold enrichment scale): fold enrichment for up- regulation upon knockdown; Blue (left side of Fold enrichment scale): fold enrichment for down regulation upon knockdown. Orange entries in the top row indicate induced clusters.
- FIGS 5A, 5B, 5C, and 5D are a series of graphs and illustrations depicting that Mina, Fas, Pou2afl , and Tsc22d3 are key novel regulators affecting the Thl 7 differentiat on programs.
- a color version of these figures can be found in Yosef et al., "Dynamic regulatory network controlling Thl 7 cell differentiation, Nature, vol. 496: 461 -468 (2013)/doi: 10.1038/naturel 1981.
- Figures 5A-5D, left Shown are regulatory network models centered on different pivotal regulators (square nodes): (Fig. 5A) Mina, (Fig. 5B) Fas, (Fig. 5C) Pou2afl, and (Fig.
- Figures 6A, 6B, 6C, and 6D are a series of graphs and illustrations depicting treatment of Naive CD4+ T-cells with TGF- ⁇ and IL-6 for three days induces the differentiation of Till 7 ceils.
- a color version of these figures can be found in Yosef et al., "Dynamic regulator ⁇ ' network controlling Thl7 cell differentiation, Nature, vol. 496: 461- 468 (2013)/doi: 10.1038/nature 11981.
- Figure 6A depicts an overview of the time course experiments. Naive T cells were isolated from WT mice, and treated with IL-6 and TGF- ⁇ .
- Microarrays were then used to measure global mRNA levels at 18 different time points (0.5hr-721ir, see Methods in Example 1).
- the same WT naive T ceils under ThO conditions harvested at the same 18 time points were used.
- the last four time points 48hr - 72hr
- cells treated with IL-6, TGF- ⁇ , and IL-23 were also profiled.
- Figure 6B depicts generation of Th17 cells by IL-6 and TGF- ⁇ polarizing conditions.
- FACS analysis of naive T cells differentiated with TGF- ⁇ and IL-6 shows enrichment for IL-17 producing Thl7 T cells; these cells are not observed in the ThO controls.
- Figure 6C depicts comparison of the obtained microarray profiles to published data from naive T-cells and differentiated Thl7 cells (Wei et. al, 2009; Langmead, B., Trapnell, C, Pop, M. & Salzberg, S. L. in Genome Biol Vol. 10 R25 (2009)). Shown is the Pearson correlation coefficient (Y axis) between each of the 18 profiles (ordered by time point, X axis) and either the naive T cell profiles (blue) or the differentiated Thl7 profiles (green).
- FIG. 6D depicts expression of key cytokines. Shown are the mRNA. levels (Y axis) as measured at each of the 18 time points (X axis) in the Thl7 polarizing (blue) and ThO control (red) conditions for the key Thl 7 genes RORc (left) and IL-17a (middle), both induced, and for the cytokine IFN- ⁇ , unchanged in the time course.
- Figure 7 is a series of graphs depicting clusters of differentially expressed genes in the Thl.7 time course data, A color version of these figures can be found in Yosef et ah, "Dynamic regulatory network controlling Thl7 cell differentiation, Nature, vol. 496: 461-468 (2013)/doi: 10.1038/nature 11981.
- For each of the 20 clusters in Fig. lb shown are the average expression levels (Y axis, ⁇ standard deviation, error bars) at each time point (X axis) under Thl7 polarizing (blue) and ThO (red) conditions.
- the cluster size (“n"), enriched functional annotations ("F”), and representative member genes (" ”) are denoted on top.
- Figures 8A and 8B are a series of graphs depicting transcriptional effects of IL-23.
- Figure 8A depicts transcriptional profi les of key genes.
- a color version of these figures can be found in Yosef et al., "Dynamic regulatory network controlling Thl 7 cell differentiation, Nature, vol. 496: 461-468 (2013)/doi: 10.1038/nature 11981. Shown are the expression levels (Y axis) of three key genes (IL-22, RORc, IL-4) at each time point (X axis) in Thl7 polarizing conditions (blue), ThO controls (red), and following the addition of IL-23 (beginning at 48hr post differentiation) to the Thl7 polarizing conditions (green).
- Figure 8B depicts IL-23-dependent transcriptional clusters. Shown are clusters of differentially expressed genes in the IL-23r ' " time course data (blue) compared to WT ceils, both treated with Thl 7 polarizing cytokines and IL23 (red). For each cluster, shown are the average expression levels (Y axis, ⁇ standard deviation, error bars) at each time point (X axis) in the knockout (blue) and wildtype (red) cells. The cluster size (“n”), enriched functional annotations ("F”), and representative member genes ("M”) are denoted on top.
- Figures 9 A smd 9B are a series of graphs depicting predicted and validated protein levels of ROR-yt during Thl7 differentiation. A color version of these figures can be found in Yosef et al., "Dynamic regulatory network controlling Thl7 cell differentiation, Nature, vol. 496: 461-468 (2013)/doi: 10.1038/naturel l981.
- Figure 9A shows RORyt niRNA levels along the original time course under Thl 7 polarizing conditions, as measured with microarrays (blue).
- a sigmoidal fit for the niRNA levels (green) is used as an input for a model (based on Schwanrier, B. et al. Global quantification of mammalian gene expression control.
- Figure 9B depicts distribution of measured ROR-yt protein levels (x axis) as determined by FACS analysis in Thl7 polarizing conditions (blue) and ThO conditions (red) at 4, 12, 24, and 48hr post stimulation.
- Figures lOA & d 10B are a series of graphs depicting predictive features for ranking candidates for knockdown. Shown is the fold enrichment (Y axis, in all cases, p ⁇ K) ⁇ 1 , hypergeometric test) in a curated list of known Thl7 factors for different (Fig. I OA) network- based features and (Fig. 10B) expression-base features (as used in Fig. 3A).
- Figures 11 A, 11B, asid 11C are a series of graphs depicting Nanowire activation on T-celis, knockdown at lOh, and consistency of NW-based knockdowns and resulting phenotypes.
- Figure 1 1 A depicts how Nanowires do not activate T ceils and do not interfere with physiological stimuli.
- the genes presented are a superset of the 39 genes selected for transcriptional profiling.
- Figure 1 1C Consistency of NW-based knockdowns and resulting phenotypes. Shown are average target transcript reductions and phenotypic changes (as measured by IL-17f and IL- 17a expression) for three different experiments of NW-based knockdown (from at least 2 different cultures) of 9 genes at 48 hours post stimulation.
- Light blue bars knockdown level (%remaining relative to siRNA controls); dark grey and light green bars: mRNAs of 1L-I7f and IL-17a, respectively, relative to siRNA controls.
- Figures 12A and I 2B are a series of graphs depicting cross-validation of the Nanostring expression profiles for each nanowire-delivered knockdown using Fluidigm 96x96 gene expression chips.
- Figure 12A depicts a comparison of expression levels measured by Fluidigm (Y axis) and Nanostring (X axis) for the same gene under the same perturbation. Expression values were normalized to control genes as described in Example 1.
- Figure 12B depicts how analysis of Fluidigm data recapitulates the partitioning of targeted factors into two modules of positive and negative Thl7 regulators. Shown are the changes in transcription of the 82 genes out of the 85 gene signature (rows) that significantly responded to at least one factor knockdown (columns).
- Figure 13 is a graph depicting rewiring of the Thl 7 "functional" network between lOhr to 48hr post stimulation.
- the percentage of "edges" i.e., gene A is affected by perturbation of gene B
- the percentage of "edges" that either appear in the two time points with the same activation/repression logic (Sustained); appear only in one time point (Transient); or appear in both networks but with a different activation/repression logic (Flipped) were calculated.
- the perturbation effect has to be significant in at least one of the time point (see Methods in Example 1), and consistent (in terms of activation/repression) in the other time point (using a more permissive cutoff of 1.25 ibid).
- FIG 14 is an illustration depicting "chromatic” network motifs.
- a color version of these figures can be found in Yosef et al., "Dynamic regulatory network controlling ThI7 cell differentiation, Nature, vol. 496: 461-468 (2013)/doi: 10.1038/naturel l981.
- a 'chromatic' network motif analysis was used to find recurring sub networks with the same topology and the same node and edge colors. Shown are the four significantly enriched motifs (p ⁇ 0.05). Red nodes: positive regulators; blue nodes: negative regulator; red edges from A to B: knockdown of A downregulates B; blue edge: knockdown of A upregulates B.
- Motifs were found using the FANMOD software (Wernicke, S. & Rasche, F. FANMOD: a tool for fast network motif detection. Biomformatics 22, 1 152-1153, doi:10.1093/bioinforma ⁇ ics/3 ⁇ 4tl038 (2006)).
- Figures 15A, 15B, and 15C are a series of graphs depicting RNA-seq analysis of nanowire-delivered knockdowns.
- A. color version of these figures can be found in Yosef et al., "Dynamic regulator ⁇ ' network controlling Thl7 cell differentiation, Nature, vol. 496: 461-468 (2013)/doi: 10.1038/naturel l981.
- Figure 15A depicts a correlation matrix of knockdown profiles. Shown is the Spearman rank correlation coefficient between the RNA-Seq profiles (fold change relative to NT siRNA controls) of regulators perturbed by knockdowns. Genes that were not significantly differentially expressed in any of the samples were excluded from the profiles.
- Figure 15B depicts knockdown effects on known marker genes of different CD4+ T cell lineages. Shown are the expression levels for canonical genes (rows) of different T cell lineages (labeled on right) following knockdown of each of 12 regulators (columns). Red/Blue: increase/decrease in gene expression in knockdown compared to non-targeting control (see Methods in Example 1). Shown are only genes that are significantly differentially expressed in at least one knockdown condition. The experiments are hierarchically clustered, forming distinct clusters for Th 17-positive regulators (left) and Thl7-negative regulators (right).
- FIG. 15C depicts knockdown effects on two subclusters of the T-reguiatory cell signature, as defined by Hill et al., Foxp3 transcription- factor-dependent and -independent regulation of the regulatory T cell transcriptional signature, immunity 27, 786-800, doi: SI 074-7613(07)00492-X [pii] 10.1016/j.immuni.2007.09.010 (2007).
- Each cluster (annotated in Hill et al as Clusters 1 and 5) includes genes that are over expressed in Tregs ceils compared to conventional T cells. However, genes in Cluster 1 are more correlated to Foxp3 and responsive to Foxp3 transduction. Conversely, genes in cluster 1 are more directly responsive to TCR and IL-2 and less responsive to Foxp3 in Treg cells.
- the knockdown profiles are hierarchically clustered, forming distinct clusters for Thl7-positive regulators (left) and Thl 7 ⁇ neagtive regulators (right).
- Red/Blue increase/decrease in gene expression in knockdown compared to non-targeting control (see Methods in Example 1). Shown are only genes that are significantly differentially expressed in at least one knockdown condition.
- Figures 16 A, 16B, 16C, and 16D are a series of graphs depicting quantification of cytokine production in knockout cells at 72h of in-vitro d fferentiation using Flow cytometry and Enzyme-linked immunosorbent assay (ELISA).
- AH flow cytometry figures shown, except for Octl are representative of at least 3 repeats, and all ELISA data has at least 3 replicates.
- Octl only a limited amount of cells were available from reconstituted mice, allowing for only 2 repeats of the Octl deficient mouse for flow cytometry and ELISA.
- Mina " '" T cells activated under ThO controls are controls for the graphs shown in Fig.
- FIG. 16A right TNF secretion by Mina "' " and WT cells, as measured bv cvtometric bead assay showing that Mina " ' " T ceils produce more TNF when compared to control.
- Figure 16B depicts intracellular cytokine staining of Pou2afl ⁇ ' ⁇ and WT cells for IFN- ⁇ and IL-17a as measured by flow cytometry.
- FIG. 16C, left Flow cytometric analysis of Fas " ' " and WT cells for Foxp3 and 11-17 expression.
- Figisres 17A asid 17B are a series of illustrations depicting that Zebl, Smarca4, and Sp4 are key novel regulators affecting the Thl7 differentiation programs.
- a color version of these figures can be found in Yosef et a!, "Dynamic regulatory network controlling Thl7 cell differentiation, Nature, vol. 496: 461-468 (2013)/doi: 10.1038/naturel l981. Shown are regulatory network models centered on different pivotal regulators (square nodes): (Fig. 17A) Zebl and Smarca4, and (Fig. 17B) Sp4.
- targets and regulators round nodes connected to the pivotal nodes based on perturbation (red and blue dashed edges), TF binding (black solid edges), or both (red and blue solid edges).
- perturbation red and blue dashed edges
- TF binding black solid edges
- red and blue solid edges Genes affected by perturbing the pivotal nodes are colored (red: target is up-regulated by knockdown of pivotal node; blue: target is down-regulated).
- Figure 18 is a graph depicting the overlap with ChlP-seq and RNA-seq data from Ciofani et al (Cell, 2012). Fold enrichment is shown for the four TF that were studied by Ciofani et ai using ChlP-seq and RNA-seq and are predicted as regulators in the three network models (early, intermediate (denoted as "mid"), and late). The results are compared to the ChlP-seq based network of Ciofani et al. (blue) and to their combined ChlP-seq/RNA-seq network (taking a score cutoff of 1.5, as described by the authors; red).
- Figures 1 A, 19B, 19C, and 19D are a series of graphs depicting that PROCR is specifically induced in Thl7 cells induced by TGF- ⁇ with IL-6.
- Figure 19A depicts how PROCR expression level was assessed by the microarray analysis under ThO and Thl7 conditions at 18 different time points.
- Figure I9B depicts how kinetic expression of PROCR mRNA was measured by quantitative RT-PCR analysis in Thl7 cells differentiated with TGF- ⁇ and IL-6.
- Figure 19C depicts how PROCR mRNA expression was measured by quantitative RT- PCR analysis in different T cell subsets 72hr after stimulation by each cytokine.
- Figure 19D depicts how PROCR protein expression was examined by flow cytometry in different T cell subsets 72hr after stimulation with each cytokine.
- Figures 2 ⁇ , 2 ⁇ , 20C, smd 2 ⁇ are a series of graphs depicting that PROCR stimulation and expression is not essential for cytokine production from Th.17 cells.
- Figure 20A depicts how naive CD4+ T cells were differentiated into Thl7 ceils by anti-CD3/anti-CD28 stimulation in the presence of activated protein C (aPC, 300nM), the ligand of PROCR. On day 3, cells were stimulated with PMA and lonomycin for 4hr, stained intracellularly for IFN-yand IL-17 and analyzed by flow cytometry.
- FIG 20B depicts IL-17 production from Thl7 cells (TGF- ⁇ + ⁇ IL-6) differentiated with, or without activated protein C (aPC and Ctl, respectively) was assessed by ELISA on Day 3 and 5.
- Figure 20C depicts how naive CD4+ T cells were polarized under Thl7 conditions (TGF- ⁇ + IL-6), transduced with either GFP control retrovirus (Ctl RV) or PROCR-expressing retroviras (PROCR RV). Intracellular expression of IFN-yand IL-17 in GFP + cells were assessed by flow cytometry.
- Figure 20D depicts how naive CD4+ T cells from EPCR ⁇ / ⁇ mice and control mice were polarized under Th.17 conditions with TGF- ⁇ and IL-6. Intracellular expression of IFN-yand IL-17 were assessed by flow cytometry.
- Figures 21 A and 21B are a series of graphs depicting that PROCR expression only induces minor changes in the expression of co-stimulatory molecules on Thl7 cells.
- Figure 21 A depicts how naive CD4 " T cells were polarized under Thl7 conditions (TGF- ⁇ + IL-6), transduced with either GFP control retrovirus (Ctl GFP) or PROCR-expressing retrovirus (PROCR RV) and expression of ICOS, CTLA-4, PD-1 , Pdp and Tim-3 was analyzed by flow cytometry.
- FIG. 2 IB depicts how aive wild type (WT) or EPCR ⁇ / ⁇ CD4 " T cells were differentiated into Thl7 cells by anti-CD3/anti-CD28 stimulation in the presence of TGF- ⁇ and IL-6.
- WT wild type
- EPCR ⁇ / ⁇ CD4 EPCR ⁇ / ⁇ CD4 " T cells were differentiated into Thl7 cells by anti-CD3/anti-CD28 stimulation in the presence of TGF- ⁇ and IL-6.
- Expression of ICOS, CTLA-4, PD-1 , Pdp and Tim-3 was assessed by flow cytometry,
- Figures 22 A, 22B, and 22C are a series of graphs depicting that PROCR is expressed in non-pathogenic Thl7 cells.
- Figure 22 A depicts genes for Thl7 cells differentiated with ⁇ - ⁇ 3 + IL-6 (pathogenic) or TGF- ⁇ ⁇ + IL-6 (non-pathogenic) and comparison of their expression levels in these two subsets.
- Figures 22B and 22C depict how naive CD4 " T cells were differentiated with TGF- ⁇ and IL-6, ⁇ - ⁇ 3 and IL-6 or IL- ⁇ and IL-6 and PROCR expression was assessed by (Fig. 22B) quantitative RT-PCR analysis (Fig, 22C) and protein expression was determined by flow cytometry.
- Figures 23 A, 23B, and 23C are a series of graphs depicting that PROCR stimulation or expression impairs some pathogenic signature genes in Thl 7 cells.
- Figure 23A depicts quantitative RT-PCR analysis of mRNA expression of several pathogenic signature genes in Thl 7 cells differentiated with TGFp! and IL ⁇ 6 in the presence of activated protein C (aPC) for 3 days in vitro.
- Figure 23B depicts quantitative RT-PCR analysis of mRNA expression of several pathogenic signature genes in naive CD4 " T cells polarized under Thl 7 conditions, transduced with either GFP control retrovirus (Control RV) or PRQCR-expressing retrovirus (PROCR RV) for 3 days.
- Figure 23 C depicts quantitative RT-PCR analysis of mRNA expression of several pathogenic signature genes in Thl 7 cells from EPCi? ⁇ / ⁇ mice and control mice differentiated with TGF l and IL-6 for 3 days in vitro.
- Figures 24A, 24B, 24C, and 24D are a series of graphs depicting that Roryt induces PROCR expression under Thl 7 conditions polarized with TGF- ⁇ 1 and IL-6.
- Figure 24A depicts ChlP-Seq of Roryt. The PROCR genomic region is depicted.
- Figure 24B depicts how the binding of Roryt to the Procr promoter in Thl 7 cells was assessed by chromati immunoprecipitation (ChIP). ChiP was performed using digested chromatin from Thl 7 cells and anti-Roryt antibody. DNA was analyzed by quantitative RT-PCR analysis.
- Figure 24C depicts how naive CD4+ T cells from Roryt-/- mice and control mice were polarized under Thl 7 conditions with TGF- ⁇ ⁇ and IL-6 and under ThO conditions (no cytokines) and PROCR expression was analyzed on day 3 by flow cytometry.
- Figure 24 D depicts how naive CD4+ T cells polarized under Thl 7 conditions were transduced with either GFP control retrovirus (Ctl RV) or Roryt -expressing retrovirus (Roryt RV) for 3 days.
- Ctl RV GFP control retrovirus
- Roryt -expressing retrovirus Rosryt -expressing retrovirus
- Figures 25A, 25B, and 25C are a series of graphs depicting that 1RF4 and STAT3 bind to the Procr promoter and induce PROCR expression.
- Figure 25A depicts how binding of IRF4 or STAT3 to the Procr promoter was assessed by chromatin immunoprecipitation (ChlP)- PCR. ChIP was performed using digested chromatin from Thl 7 cells and anti-IRF4 or anti- STAT3 antibody. DNA was analyzed by quantitative RT-PCR. analysis.
- Figure 25B depicts how naive CD4+ T cells from Cd ⁇ STAT 31 mice (STAT3 KO) and control mice (WT) were polarized under Thl 7 conditions with TGF- ⁇ with IL-6 and under ThO condition with no cytokines. On day 3, PROCR expression was determined by quantitative PGR.
- Figure 25C depicts how naive CD4+ T cells from Cd4 u"e IRF4' hjl mice and control mice were polarized under Thl 7 conditions with TGF- ⁇ and IL-6 and under ThO condition with no cytokines. On day 3, PROCR expression was determined by flow cytometry.
- Figures 26 A, 26B, 26C, and 26D are a series of graphs and illustrations depicting that PROCR deficiency exacerbates EAE severity.
- Figure 26A depicts frequency of CD4+ T ceils expressing IL-17 and PROCR isolated from EAE mice 21d after immunization with MOG35-55.
- Figure 2613 depicts how EAE was induced by adoptive transfer of MOGss-ss-specific 2D2 cells transduced with a control retrovirus (Ctl GFP) or a PROCR-expression retrovirus (PROCRJRV) and differentiated into Thl 7 cells. Mean clinical scores and summaries for each group are shown. Results are representati ve of one of two experiments.
- Figure 26C depicts how Ragl-/- mice were reconstituted with either PROCR-deficient (EPCR & ⁇ ⁇ ⁇ Ragl -/-) or WT T cells (WT ⁇ Ragl-/-) and immunized with MOG35-55 to induce EAE. The mean clinical score of each group is shown. Results are representative of one of two experiments.
- Figure 26D depicts a schematic representation of PROCR. regulation. Ror t, IRF4, and STAT3 induce PROCR expression. PROCR ligation by activated protein C induces a downregulation of the pathogenic signature genes IL-3, CXCL3, CCL4 and Pdp and reduced pathogenicity in EAE.
- FIGs 27A, 27B, and 27C are a series of graphs depicting that FAS promotes Thl7 differentiation.
- Naive CD4 ' T cells from wild type (WT) or FAS-deficient (LPR) mice were differentiated into Thl 7 cells by anti-CD 3/anti-CD28 stimulation in the presence of IL- ⁇ , IL-6 and IL-23.
- WT wild type
- LPR FAS-deficient mice
- Fig. 27 A stimulated with PMA and Ionomycin for 4hr, stained intraceltuiarly for IFN-yand IL-17 and analyzed by flow cytometry and
- Fig. 27B IL- 17 production was assessed by ELISA
- Figure 27C depicts how RNA was extracted and expression of ILl 7a and Il23r mRNA was determined by quantitative PCR.
- FIGs 28A, 28B, and 28C are a series of graphs depicting that FAS inhibits Thl differentiation.
- Naive CD4 ⁇ T cells from wild type (WT) or FAS-deficient (LPR) mice were differentiated into Thl cells by anti-CD3/anti-CD28 stimulation in the presence of IL-12 and anti-IL-4.
- WT wild type
- LPR FAS-deficient mice
- Fig. 28A stimulated with PMA and Ionomycin for 4hr, stained intracellular! y for IFN-yand IL-17 and analyzed by flow cytometry and
- Fig. 28B IFN-y production was assessed by ELISA.
- Figure 28C depicts how RNA was extracted and expression oflfng RNA was determined by quantitative PGR.
- Figures 29A and 29B are a series of graphs depicting that FAS inhibits Treg differentiation.
- Naive CD4 f T cells from wild type (WT) or FAS-deficient (LPR) mice were differentiated into Tregs by anti-CD3/anti-CD28 stimulation in the presence of TGF- ⁇ .
- WT wild type
- LPR FAS-deficient mice
- Fig. 29A stimulated with PMA and lonomycin for 4hr, stained intraceliularly for IL- 17 and Foxp3 and analyzed by flow cytometry and
- Fig. 29B IL-1G production was assessed by ELISA.
- FIGs 30A and SOB are a series of graphs depicting that FAS-deficient mice are resistant to EAE.
- Wild type (WT) or FAS-deficient (LPR) mice were immunized with lOOug MOG35-55 in CFA s.c. and received pertussis toxin i.v. to induce EAE.
- Figure 30A depicts mean clinical score ⁇ s.e.m. of each group as shown.
- Figure 30B depicts how on day 14 CNS infiltrating lymphocytes were isolated, re-stimulated with PMA and lonomycin for 4 hours and stained intraceliularly for ⁇ L- 17, lF - ⁇ , and Foxp3. Cells were analyzed by flow cytometry.
- Figures 31 A, 3 IB, 31C and 31D are a series of graphs and illustrations depicting that PROCR is expressed on Thl7 cells.
- Figure 31A depicts a schematic representation of PROCR, its ligand activated protein C and the signaling adapter PARI .
- Figure 3 IB depicts how naive CD4+ T cells were differentiated under polarizing conditions for the indicated T helper cell lineages. Expression of PROCR was determined by quantitative PGR on day 3.
- Figure 31 C depicts how mice were immunized for EAE, cells were isolated at peak of disease, and cytokine production (IL-17) and PROCR expression were analyzed by flow cytometry.
- IL-17 cytokine production
- Figure 3 ID depicts how naive and memory cells were isolated from WT and PROCRd/d mice and stimulated with anti-CD3/CD28.
- Naive cells were cultured under Thl 7 polarizing conditions as indicated; memory cells were cultured in the presence or absence of IL-23. After 3 days IL- 17A levels in supernatants were analyzed by ELISA.
- Figures 32A, 32B, 32C and 32D are a series of graphs depicting how PROCR and PD-1 expression affects Thl7 pathogenicity.
- Figure 32A depicts signature genes of pathogenic and non-pathogenic Thl7 cells.
- Naive CD4+ T cells were differentiated into non-pathogenic (TGFpl -i-(L-6) or pathogenic (TGFp3+IL-6 or I I . -(J I ⁇ I E. -6 ⁇ Th l 7 cells and PROCR. expression was determined by quantitative PGR.
- Figure 32B depicts how naive WT or PROCRd/d CD4+ T cells were stimulated under Thl7 polarizing conditions (TGFpl+IL-6) in the presence or absence of aPC.
- TGFpl+IL-6 Thl7 polarizing conditions
- Figure 32C depicts how naive 2D2 T cells were transduced with a retrovirus encoding for PROCR or a control (GFP), differentiated into Thl7 cells in vitro, and transferred into naive recipients. Mice were monitored for EAE.
- Figure 32D depicts how naive 2D2 T cells were differentiated into Thl7 cells in vitro with TGFpl + iL-iS + 1L-23 and transferred into WT or PD- LI-/- recipients. Mice were monitored for EAE,
- Figures 33A and 33B are a series of graphs depicting that PROCR expression is enriched in exhausted T cells.
- Figure 33A depicts how C57BL/6 or BalbC mice were implanted with B16 melanoma or CT26 colon cancer cells respectively. Tumor Infiltrating Lymphocytes were isolated 3 weeks after tumor implantation, sorted based on PD- 1 and Tim3 expression and analyzed for PROCR expression using real time PGR. Effector memory (CD44hiCD62Llo) CDS T cells were sorted from naive mice.
- Figure 33B) depicts how PROCR, PD-1 and Tim3 expression on antigen-specific CDS T cells were measured by FACS from acute (Armstrong) and chronic (Clone 13) LC V infection at different times points as indicated.
- Figures 34A, 34B and 34C are a series of graphs demonstrating the expression of CD5L on Thl7 cells.
- Figures 35A, 35B and 35C are a series of illustrations and graphs depicting how CD5L deficiency does not alter ThJ 7 differentiation.
- Figures 36A and 36B are a series of illustrations and graphs depicting how CD5L deficiency alters Thl7 memory by affecting survival or stability.
- Figures 37A and 37B are a series of graphs depicting how CD5L deficiency results in more severe and prolonged EAE with higher Thl7 responses.
- Figures 38.4, 3SB and 38C are a series of il lustrations and graphs depicting how loss of CD5L converts non-pathogenic Thl7 cells into pathogenic effector Thl7 cells.
- Figures 39A and 39B are a series of graphs depicting how CD5L-deficient Thl7 ceils (TGF- ⁇ + IL-6) develop a pathogenic phenotype.
- Figures 4 ⁇ and 40B are a series of graphs depicting IL17A expression was reduced in GPR65 knock out cells exposed to various T cell conditions (ThO, T16, T36, B623 and T).
- Figures 41 A, 41B, 41C, and 411) are a series of graphs depicting that IL17A expression in DEC1 knock out cells exposed to various T ceil conditions (ThO, T16, T36, B623 and T) was unchanged in the non-pathogenic condition (T 16), but was reduced in the pathogenic conditions (T36, B623).
- Figures 42A and 42B are a series of graphs depicting that IL17A expression in PLZP knock out cells exposed to various T cell conditions (ThO, T16, T36, B623 and T) was unchanged in the non-pathogenic condition (T16), but was reduced in the pathogenic conditions (T36, B623).
- FIG. 43 is a graph depicting IL17A expression in TCF4 knock out cells exposed to various T cell conditions (ThO, T16, T36, B623 and T) was reduced in the pathogenic condition B623,
- Figure 44 is a graph depicting B16 tumor inoculation of PROCR mutant mice. 7 week old wild type or PROCR mutant (EPCR delta) C57BL/6 mice were inoculated with 5x10 "' B 16F 10 melanoma cells.
- FIG. 45A through 45H show Single-cell RNAseq identifies Cd5l as a novel regulator associated with Thl 7 cell pathogenicity and expressed only by non-pathogenic Thl7 cells.
- Single-cells were sorted from in-vitro Thl7 cells differentiated with TGFpHTL-6 (A,B), IL-l p+IL-6+IL-23 (C), TGFp3+IL-6 (D) and in-vivo Thl7 cells from CNS of mice at the peak of EAE (score - 3) (D).
- IL-17A.GFP ' CD4 + T cells were sorted in all panels in D.
- CD5L expression was measured by qPCR at 48h (E) and 72h (F) and intraceliularly by flow cytometry at 48h (G); (F) A 48h, cells were lifted f om plate, washed and replated in f esh media with IL-23 or PBS and cultured for additional 24h.
- Figure 45H shows validation of CD5L expression in vivo.
- IL-17A.GFP reporter mice were immunized by MOG/CFA (s.c, dl) with pertussis toxin (i.v., dl and d3).
- FIG. 46A through Figure 46H shows CD5L regulates Thl7 cell effector function.
- WT and CD5L' " mice were immunized with 40 ⁇ MOG/CFA with pertussis toxin injection (iv) on day 1 and day 3. EAE was scored as previously published (Jager, Dardalhon et al. 2009).
- Upper panel is pooled results from 3 independent mice experiments;
- Lower panel is representative FACS plot showing cytokine production from CD4 T cells isolated from CNS at day 15 post immunization after 4 hours of restimuiation with PMA-'ionomycm. Summary data is shown in Fig. SOB.
- Figure 46B, C, D shows naive T ceils (CD4 + CD62L + CD44 " CD25 " ) were sorted, activated with plate-bound anti-CD3/anti-CD28 antibodies in the presence of TGFp l and IL-6 for 48h.
- Cells were restimulated with PMA/ionomycine for 4 hours in the presence of Brefeldin A and cytokine production was measured using FACS (B); Supernatant were used for ELI8A analysis of IL-17 and I L-10 (C); and RNA were purified from cells directly and subject to qPCR (D).
- Figure 46E F shows cells were sorted and cultured as in B, at 48 hours, cells were lifted, washed and resuspended in fresh media with no cytokines for an additional 72h and restimulated. Cytokine production was measured by FACS (E) and mRNA was quantified by qPCR (F).
- Figure 46G, H show effector memory T cells (CD4 '!' CD62L " CD44 + ) (G) or Effector memory Thl7 ceils (CD4 + CD62L " CD44 ⁇ RorytGFP ⁇ ) (H) were sorted directly ex vivo and activated with plate-bound anti-CD3/anti-CD28 antibodies for 48 hours. Cells were harvested and cultured with PMA/ionomycine for 4 hours in the presence of Brefeldin A and subject to FACS. Data are representative of at least 3 independent mouse experiments.
- FIG. 47A through 47F shows CD5L is a major switch that regulates the pathogenicity of Thl7 ceils.
- Naive WT or CD5L " ' "' 2D2 T cells were sorted and differentiated with TGFpi+IL-6 in the presence of irradiated APC (Jager, Dardalhon et al. 2009). Cells were rested and reactivated with plate-bound anti-CD3 and anti-CD28 antibodies for 48h and intravenously injected into WT host.
- A Representative FACS plot are shown of cytokine profile of 2D2 T cells after differentiation and prior to in vivo transfer.
- D Representative cytokine profile of WT and CD5L " ' " 2D2 lymphocytes isolated from CNS at day 27 post transfer. Cells were gated on Va3.2 ' CD4 4 , All data are representative of 3 independent mouse experiments.
- T cells were isolated from the draining LN on day 10 following immunization and restimulated with PMA/ionomycin as described in Fig. 46. Representative FACS plots are gated on CD45.2 CD4 cells and are of 2 independent experiments each with four mice.
- Naive T cells were differentiated with TGFpi+IL-6 as in Fig. 46E and subject to RNA purification and qPCR. Data are summary of at least three independent mouse experiments.
- Figure 48A through 48J shows CD5L shifts Thl7 ceil lipidome balance from saturated to unsaturated lipid, modulating Roryt ligand availability and function.
- Figure 48 A, B shows. Lipidome analysis of Thl7 cells.
- WT and CD5L " ' " naive T cells were differentiated as in Fig. 46B in the presence of cytokines as indicated. Ceils and supernatant were harvested at 96 hours and subjected to MS/LC. Three independent mouse experiments were performed. Data shown are median expression of each metabolite identified that have at least 1.5 fold differences between and WT and CD5L " ' " under the ⁇ 1+ ⁇ -6 condition.
- FIG. 48 C, D, E, F-J show as follows:
- C Metabolomic analysis of independent mouse experiments where T ceils were differentiated under various cytokine conditions as indicated and harvested at 48h and 96h. Summary metabolomics analysis is shown in Fig. 52A.
- D,E Roryt ChIP from Thl 7 cells differentiated as described in A. under various conditions as indicated.
- F-K Dual luciferase reporter assay was performed in EL4 cells stably transfected with a control vector or Ror't vector.
- (F, G) CD5L retroviral vector was cotransfected in F and G at 0, 25, 50 and lOQng / well.
- Figure 49 CD5L expression follows the pro-inflammatory / regulatory module dichotomy across single cells.
- FIG. 50A through 50E PUFA and SFA can regulate Thl7 cell function and contribute to CD5L-dependent regulation of Thl7 cells.
- Naive T cells were sorted from either WT or IL-23RGFP reporter mice, activated with plate-bound anti-CD3/anti-CD28 and differentiated with ⁇ + 11,-6 for 48 hours. At 48h, cells were cultured with IL-23 in fresh media in the presence of either IQuM arachidonic acid (PUFA) or 20uM of palmitic acid (SFA) for another 48 hours and harvested for PMA/ionomycin restimulation and FACS. The concentration of FFA was predetermined in titration experiments (data not shown).
- PUFA IQuM arachidonic acid
- SFA 20uM of palmitic acid
- Figure 51A through 51C Model for action of PUFA and CD5L.
- differentiation A
- abundant Roryt ligand are synthesized, limiting the specific impact of PUFA/SFA; once Thl 7 cells are differentiated (B,C), however, ligand synthesis is substantially reduced due to decreased glucose metabolism, allowing PUFA to have a more pronounced effect.
- the extent of this effect depends on whether CD5L is present (B) or absent (C), resulting in less or more pathogenic ceils, respectively.
- Figure 52A through 52D shows characterization of WT and CD5L-/- mice with EAE. Mice were immunized as in Fig. 46A.
- A 15 days post immunization, lymphocytes from CNS were isolated and directly stained and analyzed with flow cytometry for the expression of FoxP3.
- B Cells from CNS as in A were restirnulated with PMA/ionomycin with Brefeidin A for 4 hours and profiled for cytokine production by flow cytometry .
- C Cells were isolated from Inguinal L of mice 10 days after immunization.
- This invention relates generally to compositions and methods for identifying the regulatory networks that control T cell balance, T cell differentiation, T cell maintenance and/or T cell function, as well compositions and methods for exploiting the regulatory networks that control T cell balance, T cell differentiation, T cell maintenance and/or T cell function in a variety of therapeutic and'Or diagnostic indications.
- the invention provides compositions and methods for modulating T cell balance.
- the invention provides T cell modulating agents that modulate T cell balance.
- the invention provides T ceil modulating agents and methods of using these T cell modulating agents to regulate, influence or otherwise impact the level of and/or balance between T ceil types, e.g., between Thl7 and other T cell types, for example, regulatory T cells (Tregs).
- the invention provides T ceil modulating agents and methods of using these T cel l modulating agents to regulate, influence or otherwise impact the level of and/or balance between Thl 7 activity and inflammatory potential.
- Tbl7 ceil and/or “Thl 7 phenotype” and all gramma tical variations thereof refer to a differentiated T helper cell that expresses one or more cytokines selected from the group the consisting of interleukin 17A (XL- 17 A), interleukin 17F (IL-17F), and interleukin 17A/F heterodimer (IL17-AF).
- cytokines selected from the group the consisting of interleukin 17A (XL- 17 A), interleukin 17F (IL-17F), and interleukin 17A/F heterodimer (IL17-AF).
- Thl cell and/or “Thl phenotype” and all grammatical variations thereof refer to a differentiated T helper cell that expresses interferon gamma (IFNy).
- IFNy interferon gamma
- Th2 cell and/or “Th2 phenotype” and all grammatical variations thereof refer to a differentiated T helper cell that expresses one or more cytokines selected from the group the consisting of interleukin 4 (IL-4), interleukin 5 (IL-5) and interleukin 13 (IL-13).
- IL-4 interleukin 4
- IL-5 interleukin 5
- IL-13 interleukin 13
- terms such as “Treg cell” and/or “Treg phenotype” and all grammatical variations thereof refer to a differentiated T cell tha expresses Foxp3.
- compositions and methods use T cell modulating agents to regulate, influence or otherwise impact the level and/or balance between T cell types, e.g., between Thl 7 and other T cell types, for example, regulatory T cells (Tregs).
- T cell modulating agents to regulate, influence or otherwise impact the level and/or balance between T cell types, e.g., between Thl 7 and other T cell types, for example, regulatory T cells (Tregs).
- the invention provides methods and compositions for modulating T ceil differentiation, for example, helper T cell (Th cell) differentiation.
- the invention provides methods and compositions for modulating T cell maintenance, for example, helper T cell (Th ceil) maintenance.
- the invention provides methods and compositions for modulating T cell function, for example, helper T cell (Th cell) function.
- T cell modulating agents to regulate, influence or otherwise impact the level and/or balance between Thl 7 cell types, e.g., between pathogenic and non-pathogenic Thl 7 cells.
- compositions and methods use T cell modulating agents to influence or otherwise impact the differentiation of a population of T cells, for example toward the Thl 7 cell phenotype, with or without a specific pathogenic distinction, or away from the Thl 7 cell phenotype, with or without a specific pathogenic distinction.
- T ceil modulating agents to influence or otherwise impact the maintenance of a population of T cells, for example toward the Thl 7 cell phenotype, with or without a specific pathogenic distinction, or away from the Thl7 cell phenotype, with or without a specific pathogenic distinction.
- compositions and methods use T cell modulating agents to influence or otherwise impact the differentiation of a population of Thl 7 cells, for example toward the pathogenic Thl7 cell phenotype or away from the pathogenic Thl7 ceil phenotype, or toward the non-pathogenic Thl7 cell phenotype or away from the non-pathogenic Thl 7 cell phenotype.
- T cell modulating agents to influence or otherwise impact the maintenance of a population of Thl7 cells, for example toward the pathogenic Thl 7 ceil phenotype or away from the pathogenic Thl7 ceil phenotype, or toward the non-pathogenic Thl7 cell phenotype or away from the non- pathogenic Thl.7 cell phenotype.
- compositions and methods use T cell modulating agents to influence or otherwise impact the differentiation of a population of T cells, for example toward a non-Thl 7 T cell subset or away from a non-Thl 7 cell subset.
- T ceil modulating agents to influence or otherwise impact the maintenance of a population of T cells, for example toward a non-Thl 7 T cell subset or away from a non-Thl 7 cell subset.
- Thl7 cell and/or “pathogenic Thl7 phenotype” and ail grammati cal variations thereof refer to Thl 7 cells that, when induced in the presence of ⁇ - ⁇ 3, express an elevated level of one or more genes selected from CxcB, IL22, IL3, Ccl4, Gzmb, Lrmp, Ccl5, Caspl, Csf2, Cci3, Tbx21 , Icos, ]L17r, Stat4, Lgals3 and Lag, as compared to the level of expression in a TGF-P3-induced Thl 7 cells.
- non-pathogenic Thl7 cell and/or “non-pathogenic Th.17 phenotype” and ail grammatical variations thereof refer to Th! 7 cells that, when induced in the presence of TGF- ⁇ 3, express a decreased level of one or more genes selected from IL6st, ILlrn, IkzfB, Maf, Ahr, IL9 and IL10, as compared to the level of expression in a TGF-P3-induced Thl7 cel ls.
- compositions and methods use T cell modulating agents to influence or otherwise impact the function and/or biological activity of a T cell or T cell population. These compositions and methods use T cell modulating agents to influence or otherwise impact the function and/or biological activity of a helper T cell or helper T cell population. These compositions and methods use T cell modulating agents to influence or otherwise impact the function and/or biological activity of a Thl7 ceil or Thl7 cell population. These compositions and methods use T cell modulating agents to influence or otherwise impact the function and/or biological activity of a non-Thl 7 T cell or non-Thl 7 T cell population, such as, for example, a Treg cell or Treg cell population, or another CD4+ T cell or CD4+ T cell population. These compositions and methods use T cell modulating agents to influence or otherwise impact the plasticity of a T ceil or T cell population, e.g., by converting Thl7 cells into a different subtype, or into a new state.
- the methods provided herein combine transcriptional profiling at high temporal resolution, novel computational algorithms, and innovative nanowire-based tools for performing perturbations in primary T cells to systematically derive and experimental ly validate a model of the dynamic regulatory network that controls Thl7 differentiation. See e.g., Yosef et ai., "Dynamic regulatory network controlling Thl 7 cell differentiation, Nature, vol.. 496: 461-468 (2013)/doi: 10.1038/naturel 1981 , the contents of which are hereby mcorporated by reference in their entirety.
- the network consists of two self-remforcmg, but mutually antagonistic, modules, with novel regulators, whose coupled action may be essential for maintaining the level and/or balance between Till 7 and other CD4+ T ceil subsets.
- 9,159 interactions between 71 regulators and 1 ,266 genes were active in at least one network; 46 of the 71 are novel.
- the examples provided herein identify and validate 39 regulatory factors, embedding them within a comprehensive temporal network and reveals its organizational principles, and highlights novel drug targets for controlling Thl7 differentiation.
- a “Thl7-negative” module includes regulators such as SP4, ETS2, IKZF4, TSC22D3 and/or, I F1. It was found that the transcription factor Tsc22d3, which acts as a negative regulator of a defined subtype of Thl7 cells, co-localizes on the genome with key Thl 7 regulators.
- the "Thl 7 positive” module includes regulators such as MI A, PML, POU2AF1, PROCR, SMARCA4, ZEB1, EGR2, CCR6, and/or FAS.
- Perturbation of the chromatin regulator Mina was found to up-regulate Foxp3 expression
- perturbation of the co- activator Pou2afl was found to up-regulate IFN- ⁇ production in stimulated naive cells
- perturbation of the TNF receptor Fas was found to up-regulate IL-2 production in stimulated naive cells. All three factors also control IL-17 production in Thl7 cells. Effective coordination of the immune system requires careful balancing of distinct pro- inflammatory and regulatory CD4+ helper T cell populations.
- Thl7 cells play a key role in the defense against extracellular pathogens and have also been implicated in the induction of several autoimmune diseases (see e.g., Bettelli, E., Oukka, M. & Kuchroo, V. . T(H)-17 cells in the circle of immunity and autoimmunity. Nat Immunol 8, 345-350, doi: 10.1038/ni0407-345 (2007)), including for example, psoriasis, ankylosing spondylitis, multiple sclerosis and inflammatory bowel disease. Thl7 differentiation from naive T-cells can be triggered in vitro by the cytokines TGF- ⁇ ⁇ and IL-6.
- TGF- ⁇ alone induces Foxp3+ regulatory T cells (iTreg)
- iTreg Foxp3+ regulatory T cells
- the presence of IL-6 inhibits iTreg and induces Thl 7 differentiation (Bettelli et al., Nat Immunol 2007).
- cytokine combinations have also been shown to induce ROR-yt and differentiation into Thl 7 cells, in particular TGF- ⁇ and IL-21 or IL- ⁇ ⁇ , ⁇ - ⁇ 3 + IL-6, IL-6, and IL-23 (Ghoreschi, K. et al. Generation of pathogenic T(H)17 cells in the absence of TGF-beta signaling. Nature 467, 967-971 , doi: 10.1038/nature09447 (201 0)), Finally, although a number of cytokine combinations can induce Thl7 cells, exposure to IL-23 is critical for both stabilizing the Thl 7 phenotype and the induction of pathogenic effector functions in Thl 7 cells.
- Thl7 cells are held in check by the immunosuppressive cytokine IL-10 (O'Shea et al, Microbes Infect 2009; Zhou & Littman, Curr Opin Immunol 2009).
- cytokine IL-10 O'Shea et al, Microbes Infect 2009; Zhou & Littman, Curr Opin Immunol 2009.
- many of the key regulators and interactions that drive development of Thl7 remain unknown ( orn, T., Bettelli, E., Oukka, M. & uchroo, V. K. IL- 17 and Thl7 Cells.
- the reconstructed model is organized into two coupled, antagonistic, and densely intra-connected modules, one promoting and the other suppressing the Thl7 program.
- the model highlights 12 novel regulators, whose function was further characterized by their effects on global gene expression, DNA binding profiles, or Thl7 differentiation in knockout mice.
- the studies provided herein demonstrate an unbiased systematic and functional approach to understanding the development of the ThI7 T cell subset.
- the methods provided herein combine a high-resolution transcriptional time course, novel methods to reconstruct regulatory networks, and innovative nanotechnologv to perturb T cells, to construct and validate a network model for Thl7 differentiation.
- the model consists of three consecutive, densely intra-connected networks, implicates 71 regulators (46 novel), and suggests substantial rewiring in 3 phases.
- the 71 regulators significantly overlap with genes genetically associated with inflammatory bowel disease (Jostins, L. et al. Host- microbe interactions have shaped the genetic architecture of inflammatory bowel disease. Nature 491, 1 19-124, doi: 10.1038/naturel l 582 (2012)) (11 of 71, p ⁇ 10 "9 ).
- 127 putative regulators 80 novel were systematically ranked, and top ranking ones were tested experimentally.
- Thl7 regulators are organized into two tightly coupled, self- reinforcing but mutually antagonistic modules, whose coordinated action may explain how r the balance between Till 7, Treg, and other effector T ceil subsets is maintained, and how progressive directional differentiation of Thl7 cells is achieved.
- 12 novel factors Fig. 4 and 5
- Fig. 17A, 17B This validated model highlights at least 12 novel regulators that either positively or negatively impact the Thl7 program (Fig. 4 and 5).
- these and known regulators are organized in two tightly coupled, self-reinforcing and mutually antagonistic modules, whose coordinated action may explain how the balance between Thl7, Treg, and other effector T cells is maintained, and how progressive directional differentiation of Thl 7 cells is achieved while repressing differentiation of other T cell subsets.
- the function of four of the 12 regulators - Mina, Fas, Pou2afl, and Tsc22d3 - was further validated and characterized by undertaking Th l 7 differentiation of T ceils from corresponding knockout mice or with ChlP-Seq binding profiles.
- the T cell modulating agents are used to modulate the expression of one or more target genes or one or more products of one or more target genes that have been identified as genes responsive to Thl7-reiated perturbations.
- These target genes are identified, for example, by contacting a T ceil, e.g., na ' ive T cells, partially differentiated T cells, differentiated T cells and/or combinations thereof, with a T cell modulating agent and monitoring the effect, if any, on the expression of one or more signature genes or one or more products of one or more signature genes.
- the one or more signature genes are selected from those listed in Table 1 or Table 2 shown below.
- the target gene is one or more Thl7-associated cytokine(s) or receptor molecule(s) selected from those listed in Table 3, In some embodiments, the target gene is one or more Thl7-assoeiated transcription regulators) selected from those shown in Table 4,
- the target gene is one or more Thl 7-associated transcription regulator(s) selected from those shown in Table 5, In some embodiments, the target gene is one or more Thl7-associated receptor molecule(s) selected from those listed in Table 6. In some embodiments, the target gene is one or more Thl7-assoeiated kinase(s) selected from those listed in Table 7, In some embodiments, the target gene is one or more Thl7-associated signaling molecule(s) selected from those listed in Table 8. In some embodiments, the target gene is one or more Thl7-associated receptor moiecule(s) selected from those listed in Table 9.
- ARID3A OVER-EXPR OVER-EXPR UNDER-EXPR
- Fig. 17a the zinc finger E-box binding homeobox 1 Zebl, which is early-induced and sustained in the Thl7 time course (Fig. 17a), analogous to the expression of many known key Thl7 factors.
- Zebl knockdown decreases the expression of Thl7 signature cytokines (including IL-17A, IL-17F, and IL-21) and TFs (including Rbpj, Maff, and Mina) and of late induced cytokine and receptor molecule genes -4
- Smarca4 is a regulator in ail three network models (Fig. 2d,e) and a member of the 'positive module' (Fig. 4b), Although it is not differentially expressed in the Thl7 time course, it is bound by Batf, Irf4 and Stat3 (positive regulators of Th] 7), but also by Gata3 and Stat.5 (positive regulators of other lineages, Fig. 17a). Chromatin remodeling complexes that contain Smarca4 are known to displace nucleosoraes and remodel chromatin at the IFN- ⁇ promoter and promote its expression in Th.1 cells (Zhang, F. & Boothby, M.
- T helper type 1 -specific Brgl recruitment and remodeling of nucleosomes positioned at the IFN-gamma promoter are Stat4 dependent. J. Exp. Med. 203, 1493-1505, doi: 10.1084/jem.20060066 (2006)).
- Smarca4 binding DNA sequences within the vicinity of the IL-17a promoter (Matys, V. et al. TRANSFAC: transcriptional regulation, from patterns to profiles. Nucleic Acids Res. 31 , 374-378 (2003)).
- chromatin remodeling by Smarca4 possibly in interaction with Zebl, positive regulates Thl7 cells and is essential for IL-17 expression.
- Sp4 knockdown results in an increase in ROR-yt expression at 48h, and an overall stronger and "cleaner" Thl7 differentiation as reflected by an increase in the expression of Thl7 signature genes, including IL-17, IL-21 and Irf4, and decrease in the expression of signature genes of other CD4+ cells, including Gata3, Foxp3 and Stat4.
- Ciofani et al. (Ciofani, M. et al. A Validated Regulatory Network for Thl7 Cell Specification. Cell, doi: 10.1016/j.cell.2012.09.016 (2012)) systematically ranked Thl7 regulators based on ChlPSeq data for known key factors and transcriptional profiles in wild type and knockout cells. While their network centered on known core Thl 7 TFs, the complementary approach presented herein perturbed many genes in a physiologically meaningful setting. Reassuringly, their core Thl7 network significantly overlaps with the computationally inferred model (Fig. 18).
- the wiring of the positive and negative modules uncovers some of the functional logic of the Th.l 7 program, but likely involve both direct and indirect interactions.
- the functional model provides an excellent starting point for deciphering the underlying physical interactions with DNA binding profiles (Glasmacher, E. et al. A Genomic Regulatory Element That Directs Assembly and Function of Immune-Specific AP-l-IRF Complexes. Science, dok l O. l 126/science.1228309 (2012)) or protein-protein interactions (Wu, C, Yosef, N. & Thalhamer, T. SG 1 kinase regulates Till? cells maintenance through IL-23 signaling pathway).
- the regulators identified are compelling new targets for regulating the Thl7/"Tregs balance and for switching pathogenic Thl7 into non-pathogenic ones.
- the invention also provides methods of determining gene signatures that are useful in various therapeutic and/or diagnostic indications.
- the goal of these methods is to select a smal l signature of genes that will be informative with respect to a process of interest.
- the basic concept is that different types of information can entail different partitions of the "space" of the entire genome (>20k genes) into subsets of associated genes. This strategy is designed to have the best coverage of these partitions, given the constraint on the signature size. For instance, in some embodiments of this strategy, there are two types of mformation: (i) temporal expression profiles; and (ii) functional annotations.
- the first information source partitions the genes into sets of co-expressed genes.
- the information source partitions the genes into sets of co- functional genes.
- a smal l set of genes is then selected such that there are a desired number of representatives from each set, for example, at least 10 representatives from each co-expression set and at least 10 representatives from each co-functional set.
- the problem of working with multiple sources of information is known in the (henry of computer science as Set-Cover. While this problem cannot be solved to o tim.ali.ty (due to its NP -hardness) it can be approximated to within a small factor.
- the desired number of representatives from each set is one or more, at least 2, 5 or more, 10 or more, .15 or more, 20 or more, 25 or more, 30 or more, 35 or more, 40 or more, 50 or more, 60 or more, 70 or more, 80 or more, 90 or more, or 100 or more.
- An important feature of this approach is that it can be given either the size of the signature (and then find the best coverage it can under this constraint); or the desired level of coverage (and then select the minimal signature size that can satisfy the coverage demand).
- An exemplary embodiment of this procedure is the selection of the 275-gene signature (Table 1), which combined several criteria to reflect as many aspect of the differentiation program as was possible. The following requirements were defined: (1) the signature must include all of the TFs that belong to a Thl7 niicroarray signature (comparing to other CD4+ T cells, see e.g., Wei et al, in Immunity vol.
- the invention provides T cell related gene signatures for use in a variety of diagnostic and/or therapeutic indications.
- the invention provides Th! 7 related signatures that are useful in a variety of diagnostic and/or therapeutic indications.
- Signatures in the context of the present invention encompasses, without limitation nucleic acids, together with their polymorphisms, mutations, variants, modifications, subunits, fragments, and other analytes or sample-derived measures.
- Exemplary signatures are shown in Tables 1 and 2 and are collectively referred to herein as, inter alia, "Thl7-associated genes,” “Thl7-associated nucleic acids,” “signature genes,” or “signature nucleic acids.”
- These signatures are useful in methods of diagnosing, prognosing and/or staging an immune response in a subject by detecting a first level of expression, activity and/or function of one or more signature genes or one or more products of one or more signature genes selected from those listed in Table 1 or Table 2 and comparing the detected level to a control of level of signature gene or gene product expression, activity and/or function, wherem a difference in the detected level and the control level indicates that the presence of an immune response in the subject,
- signatures are useful in methods of monitoring an immune response in a subject by detecting a level of expression, activity and/or function of one or more signature genes or one or more products of one or more signature genes selected from those listed in Table 1 or Table 2 at a first time point, detecting a level of expression, activity and/or function of one or more signature genes or one or more products of one or more signature genes selected from those listed in Table 1 or Table 2 at a second time point, and comparing the first detected level of expression, activity and/or function with the second detected level of expression, activity and/or function, wherein a change in the first and second detected levels indicates a change in the immune response in the subject,
- signatures are useful in methods of identifying patient populations at risk or suffering from an immune response based on a detected level of expression, activity and/or function of one or more signature genes or one or more products of one or more signature genes selected from those listed in Table 1 or Table 2. These signatures are also useful in monitoring subjects undergoing treatments and therapies for aberrant immune response(s) to determine efficaciousness of the treatment or therapy. These signatures are also useful in monitoring subjects undergoing treatments and therapies for aberrant immune response(s) to determine whether the patient is responsive to the treatment or therapy. These signatures are also useful for selecting or modifying therapies and treatments that would be efficacious in treating, delaying the progression of or otherwise ameliorating a symptom of an aberrant immune response. The signatures provided herein are useful for selecting a group of patients at a specific state of a disease with accuracy that facilitates selection of treatments.
- the present invention also comprises a kit with a detection reagent that binds to one or more signature nucleic acids.
- a detection reagent that binds to one or more signature nucleic acids.
- an array of detection reagents e.g., oligonucleotides that can bind to one or more signature nucleic acids.
- Suitable detection reagents include nucleic acids that specifically identify one or more signature nucleic acids by having homologous nucleic acid sequences, such as oligonucleotide sequences, complementary to a portion of the signature nucleic acids packaged together in the form of a kit.
- the oligonucleotides can be fragments of the signature genes.
- the oligonucleotides can be 200, 150, 100, 50, 25, 10 or fewer nucleotides in length.
- the kit may contain in separate container or packaged separately with reagents for binding them to the matrix), control formulations (positive and/or negative), and/or a detectable label such as fluorescein, green fluorescent protein, rhodamine, cyanine dyes, Alexa dyes, lueiferase, radiolabels, among others. Instructions (e written, tape, VCR, CD-ROM, etc.) for carrying out the assay may be included in the kit.
- the assay may for example be in the form of a Northern hybridization or DNA chips or a sandwich ELISA or any other method as known in the art.
- the kit contains a nucleic acid substrate array comprising one or more nucleic acid sequences.
- Suitable T cell modulating agent(s) for use in any of the compositions and methods provided herein include an antibody, a soluble polypeptide, a polypeptide agent, a peptide agent, a nucleic acid agent, a nucleic acid ligand, or a small molecule agent.
- suitable T cell modulating agents or agents for use in combination with one or more T cell modulating agents are shown below in Table 10.
- mdms dextran sulfate, dexamethasone, arginine, ivig, mcp 2, cyclic amp, U 50488H, N-methyl-D-aspartate, hydrogen peroxide, 8- carboxamidocyclazocine, latex, groalpha, xanthine, ccl3, retinoic acid,
- Maraviroc Maraviroc, sdf 1 , opiate, efavirenz, estrogen, bicyciam, enfuvirtide, filipin, bleomycin, polysaccharide, tare, pentoxifylline, E. coli B5 lipopolysaccharide, methylcelluiose, maraviroc
- IRF4 prostaglandin E2 phorbol myristate acetate, lipopolysaccharide, A23187,
- tacrolimus trichostatin A, stallimycin, imatinib, cyclosporin A, tretinoin, bromodeoxyuridine, ATP-gamma-S, ionomycin
- tetrodotoxin threonine, cyclopiazonic acid, urea, quercetin, ionomycin, 12-o- tetradecanoylphorbol 13-acetate, fulvestrant, phenylephrine, formaldehyde, cysteine, leukotriene C4, prazosin, LY379196, vegf, rapamycm, ieupe tm, pd 98, 059, ruboxistaurin, pCPT- cAMP, methamphetamine, iiitroprusside, H-7, Ro31 -8220, phosphoinositide, lysophosphatidylcholine, bufalin, calcitriol, le prolide, isobutylrnethylxanthine, potassium ch loride, acetic acid,
- cyclothiazide quinolinic acid, tyrosine, adenylate, resveratrol, topotecan, geni stein, thymidine, D-glucose, mifepristone, lysophosphatidic acid, leukotriene D4, carbon monoxide, poly rI:rC-RNA, sp 600125, agar, cocaine, 4- nitroquinolme-1 -oxide, tamoxifen, lead, fibrinogen, tretinoin, atropine, mithramycin, +, epigaliocatechin-gallate, ethylenediaminetetraacetic acid, h2o2, carbachol, sphingosine-1 -phosphate, iron, 5- hydroxytryptamine, amphetamine, SP600125, actinomycin d, SB203580, cyclosporin A,
- selenomethyiselenocysteme ropinirole, saralasin, methylphenidate, gentarmcin, reserpme, triamcinolone acetonide, methyl metiiaiiesulfonate, wortmamiiii, thapsigargin, deferoxamine, calyculin A, peptidoglycan, dihydrotestosterone, calcium, phorbol- 12-myristate, ceramide, nmda, 6-cyano-7-nitroqumoxalme ⁇ 2, 3-dione, hydrogen peroxide, carrageenan, sch 23390, Imsidomine, oxygen, elonidine, fluoxetine, retinoid, troglitazone, retinoic acid, epinephrine, n acetylcysteine, KN-62, carbamylcholine, 2-amino-5-phosphono valeric acid, oligonucleo
- ETV6 lipopolysaccharide retinoic acid, prednisolone, valproic acid, tyrosine,
- IL17RA rant lipopolysaccharide, 17-alpha-ethinylestradiol, camptothecin, E. coli B5 lipopolysaccharide
- IRF8 oligonucleotide chloramphenicol, lipopolysaccharide, estrogen, wortmai nii , piriiiixic acid, carbon monoxide, retinoic acid, tyrosine
- TSC22D3 phorbol myristate acetate, prednisolone, sodium, dsip, tretinoin, 3- deazaneplanocin, gaba, PD98059, leucine, triamcinolone acetonide,
- prostaglandin E2 steroid, norepinephrine, U0126, actli, calcium, ethanol, beta estradiol, lipid, chloropromazine, arginine, dexamethasone TARGET AGENT
- PML lipopolysaccharide glutamine, thyroid hormone, cadmium, lysine, tretinoin, brom.odeoxyuridi.ne, etoposi.de, retinoid, pic 1, arsenite, arsenic trioxide, butyrate, retinoic acid, alpha-retinoic acid, ii2o2, camptothecin, cysteine, leucine, zinc, actinomycin d, proline, stallimycin, U0126
- IL12 B1 prostaglandin E2 phorbol myristate acetate, lipopolysaccharide, buciadesine, 8- bromo-cAMP, gp .130, AGN194204, galactosylceramide- alpha, tyrosine, ionomyein, dexamethasone, 11-12
- interferon beta- la lipopolysaccharide, cisp!atin, tretinoin, ox)3 ⁇ 4en, vitamin B.12, epigallocatechin-gailate, isobutylmethylxanthine, threonine, apomorphine, matrigel, trichostatin A, vegf, 2-acetyiaminofluorene, rapamycin, dihydrotestosterone, poly rI:rC-RNA, hesperetin, valproic acid, asparagine, lipid, curcumin, dexamethasone, glycogen, CpG oligonucleotide, nitric oxide
- SMARCA4 cyclic amp, cadmium, lysine, tretinoin, latex, androstane, testosterone, sucrose, tyrosine, cysteine, zinc, oligonucleotide, estrogen, steroid, trichostatin A, tpmp, progesterone, histidine, atp, trypsinogen, glucose, agar, lipid, arginine, vancomycin, dihydrofolate
- tetrodotoxin cyclopiazonic acid, arsenic trioxide, phosphatidylserme, niflumic acid, gliadin, ionomyein, safrole oxide, methotrexate, rubitecan, cysteine, propentofylime, vegf, boswellic acids, rapamycin, pd 98, 059, captopril, methamphetamine, vesiiarinone, tetrapeptide, oridonin, raititrexed, pirinixic acid, nitroprusside, H-7, heta-boswellic acid, adriamycin, concanamycin a, etoposide, trastuzumab, cyclophosphamide, ifn-alpha, tyrosine, rituximab, selenodiglutathione, chitosan, omega-N- methy
- giycochenodeoxychoiic acid ceramides, actinomycin d, SB203580, cyclosporin A, morphine, LY294002, n(g)-nitro-l-arginine methyl ester, 4-hydroxynonenal, piceatannol, valproic acid, beta-estradiol, 1 -alpha, 25-dihydroxy vitamin D3, arginine, dexamethasone, suifadoxine, phorbol myristate acetate, beta-lapachone, nitrofurantoin, chlorambucil, methylnitronitrosoguanidine, CD 437, opiate, egcg, mitomycin C, estrogen, ribonucleic acid, fontolizumab, tanshinone iia, recombinant human endostatin, fluoride, L-triiodothyronine, bleomycin, forskolin, nonylphenol, zymosan A
- prostaglandin E2 toremifene, depsipeptide, ochratoxin A, (glc)4, phosphatidylinositol, mitomycin c, rant.es, sphingosine, indomethacin,
- doxorubicin S-nitroso-N- acetylpeniciilamine, adpribose, sulforaphane, vitamin d, armexin-v, lactate, reactive oxygen species, sb 203580, serine, N -acetyl- L- cysteine, dutp, infliximab, ethanol, curcumin, cytarabine, tpck, calyculin a, dopamine, gp .130, bromocriptine, apicidin, fatty acid, citrate, glucocorticoid, arsenite, butyrate, peplomycin, oxalipiatin, camptothecin, benzyloxycarbonyl- Leu-Leu-Leu aldehyde, ciofibrate, carbon, wortmannin, fludarabine, N-(3- (ammomethyl)benzyl)acetamidme, sirolimus,
- IRF1 tamoxifen chloramphenicol, poiyinosinic-poiycytidylic acid, inosine
- MYC cd 437 1, 25 dihydroxy vitamin d3, phenethyi isothiocyanate, threonine, arsenic trioxide, salicylic acid, quercetm, prostaglandin El, ionomycin, 12-o- tetradecanoylphorbol 13-acetate, fulvestrant, phenylephrine, fisetin, 4-coumaric acid, dihydroartemisinin, 3-deazaadenositie, tiitroprusside, pregna-4, 17-diene-3, 16-dione, adriamycin, brom.odeoxyuridi.ne, AGN 194204, STA-9090,
- phosphatidylinositol U0126, dichlororibofuranosylbenzir dazole, fiavopindol, 5-fluorouracil, verapamil, cyclopamine, nitric oxide, cisplatin, hrgbetal , 5, 6- dichloro-1- beta-d-ribofuranosylbenzimidazole, amsacrine, gemcitabine, aristeromycin, medroxyprogesterone acetate, gambogic acid, leucine, alpha- naphthyl acetate, cyclic AMP, reactive oxygen species, PD 180970, curcumin, chloramphenicol, A23187, crocidolite asbestos, 6- hydroxydopamine, cb 33, arsenite, gentamicin, benzyloxycarbonyl-Leu- Leu-Leu aldehyde, ciofibrate, wortmannin, sirolimus, ceramide
- formulations include, for example, powders, pastes, ointments, jellies, waxes, oils, lipids, lipid (cationic or anionic) containing vesicles (such as LipofectinTM), DNA conjugates, anhydrous absorption pastes, oil-in- water and water-in-oil emulsions, emulsions carbowax (polyethylene glycols of various molecular weights), semi-solid gels, and semi-solid mixtures containing carbowax.
- Therapeutic formulations of the invention which include a T cell modulating agent, are used to treat or alleviate a symptom associated with an immune-related disorder or an aberrant immune response.
- the present invention also provides methods of treating or alleviating a symptom associated with an immune-related disorder or an aberrant immune response.
- a therapeutic regimen is carried out by identifying a subject, e.g., a human patient suffering from (or at risk of developing) an immune-related disorder or aberrant immune response, using standard methods.
- T ceil modulating agents are useful therapeutic tools in the treatment of autoimmune diseases and/or inflammatory disorders.
- T cell modulating agents that modulate, e.g., inhibit, neutralize, or interfere with, Thl7 T ceil differentiation is contemplated for treating autoimmune diseases and/or inflammatory disorders.
- the use of T cell modulating agents that modulate, e.g., enhance or promote, Thl7 T cell differentiation is contemplated for augmenting Thl7 responses, for example, against certain pathogens and other infectious diseases.
- the T ceil modulating agents are also useful therapeutic tools in various transplant indications, for example, to prevent, delay or otherwise mitigate transplant rejection and/or prolong survival of a transplant, as it has also been shown that in some cases of transplant rejection, Thl7 cells might also play an important role.
- T cell modulating agents are also useful therapeutic tools in cancers and/or anti-tumor immunity, as Thl7/Treg balance has also been implicated in these indications.
- Thl7/Treg balance has also been implicated in these indications.
- some studies have suggested that IL- 23 and Thl7 cells play a role in some cancers, such as, by way of non-limiting example, colorectal cancers. (See e.g., Ye J, Livergood RS, Peng G.
- T cell modulating agents are also useful in patients who have genetic defects that exhibit aberrant Till 7 cell production, for example, patients that do not produce Thl.7 cells naturally.
- the T cell modulating agents are also useful in vaccines and/or as vaccine adjuvants against autoimmune disorders, inflammatory diseases, etc.
- the combination of adjuvants for treatment of these types of disorders are suitable for use in combination with a wide variety of antigens from targeted self-antigens, i.e., autoantigens, involved in autoimmunity, e.g., myelin basic protein; inflammatory self-antigens, e.g., amyloid peptide protein, or transplant antigens, e.g., alloantigeiis.
- the antigen may comprise peptides or polypeptides derived from proteins, as well as fragments of any of the following: saccharides, proteins, polynucleotides or oligonucleotides, autoantigens, amyloid peptide protein, transplant antigens, allergens, or other macromolecular components. In some instances, more than one antigen is included in the antigenic composition.
- Autoimmune diseases include, for example. Acquired Immunodeficiency Syndrome (AIDS, which is a viral disease with an autoimmune component), alopecia areata, ankylosing spondylitis, antiphospiiolipid syndrome, autoimmune Addison's disease, autoimmune hemolytic anemia, autoimmune hepatitis, autoimmune inner ear disease (AIED), autoimmune lymp oproliferative syndrome (ALPS), autoimmune thrombocytopenic purpura (ATP), Behcet's disease, cardiomyopathy, celiac sprue-dermatitis hepetiformis; chronic fatigue immune dysfunction syndrome (CFIDS), chronic inflammatory demyelinating polyneuropathy (C1PD), cicatricial pemphigoid, cold agglutinin disease, crest syndrome, Crohn's disease, Degos' disease, dermatomyositis-juvenile, discoid lupus, essential mixed cryoglobulinemia, fibro
- AIDS
- T cell modulating agents are useful in treating, delaying the progression of, or otherwise ameliorating a symptom of an autoimmune disease having an inflammatory component such as an aberrant inflammatory response in a subject.
- T cell modulating agents are useful in treating an autoimmune disease that is known to be associated with an aberrant Till 7 response, e.g., aberrant IL-17 production, such as, for example, multiple sclerosis (MS), psoriasis, inflammatory bowel disease, ulcerative colitis, Crohn's disease, uveitis, lupus, ankylosing spondylitis, and rheumatoid arthritis,
- Inflammatory disorders include, for example, chronic and acute inflammatory disorders.
- inflammatory disorders include Alzheimer's disease, asthma, atopic allergy, allergy, atherosclerosis, bronchial asthma, eczema, glomerulonephritis, graft vs. host disease, hemolytic anemias, osteoarthritis, sepsis, stroke, transplantation of tissue and organs, vasculitis, diabetic retinopathy and ventilator induced lung injury.
- Symptoms associated with these immune -related disorders include, for example, inflammation, fever, general malaise, fever, pain, often localized to the inflamed area, rapid pulse rate, joint pain or aches (arthralgia), rapid breathing or other abnormal breathing patterns, chills, confusion, disorientation, agitation, dizziness, cough, dyspnea, pulmonary infections, cardiac failure, respiratory failure, edema, weight gain, mucopurulent relapses, cachexia, wheezing, headache, and abdominal symptoms such as, for example, abdominal pain, diarrhea or constipation,
- Efficaciousness of treatment is determined in association with any known method for diagnosing or treating the particular immune-reiated disorder. Alleviation of one or more symptoms of the immune-related disorder indicates that the T cell modulating agent confers a clinical benefit.
- T cell modulating agent administered to a patient suffering from an immune- related disorder or aberrant immune response is considered successful if any of a variety of laboratory or clinical objectives is achieved.
- administration of a T cell modulating agent to a patient is considered successful if one or more of the symptoms associated with the immune-related disorder or aberrant immune response is alleviated, reduced, inhibited or does not progress to a further, i.e., worse, state.
- Administration of T cell modulating agent to apatient is considered successful if the immune-related disorder or aberrant immune response enters remission or does not progress to a further, i.e., worse, state.
- a therapeutically effective amount of a T cell modulating agent relates generally to the amount needed to achieve a therapeutic objective.
- the amount required to be administered will furthermore depend on the specificity of the T cell modulating agent for its specific target, and wil l also depend on the rate at which an administered T cell modulating agent is depleted from the free volume other subject to which it is administered.
- T cell modulating agents can be administered for the treatment of a variety of diseases and disorders in the form of pharmaceutical compositions. Principles and considerations involved in preparing such compositions, as well as guidance in the choice of components are provided, for example, in Remington: The Science And Practice Of Pharmacy 19th ed. (Alfonso R. Germaro, et al., editors) Mack Pub. Co., Easton, Pa.: 1995; Drug Absorption Enhancement: Concepts, Possibilities, Limitations, And Trends, Harwood Academic Publishers, Langhome, Pa,, 1994; and Peptide And Protein Drug Delivery (Advances in Parenteral Sciences, Vol. 4), 1991 , . Dekker, New York.
- polypeptide-based T cell modulating agents are used, the smallest fragment that specifically binds to the target and retains therapeutic function is preferred.
- fragments can be synthesized chemically and/or produced by recombinant DNA technology.
- the formulation can also contain more than one active compound as necessary for the particular indication being treated, preferably those with complementary activities that do not adversely affect each other.
- the composition can comprise an agent that enhances its function, such as, for example, a cytotoxic agent, cytokine, chemotherapeutic agent, or growth-inhibitory agent.
- Such molecules are suitably present in combination in amounts that are effective for the purpose intended.
- the invention comprehends a treatment method or Drug Discovery method or method of formulating or preparing a treatment comprising any one of the methods or uses herein discussed.
- the present invention also relates to identifying molecules, advantageously small molecules or biologies, that may be involved in inhibiting one or more of the mutations in one or more genes selected from the group consisting of DECl, PZLP, TCF4 and CD5L.
- the invention contemplates screening libraries of smal l molecules or biologies to identify compounds involved in suppressing or inhibiting expression of somatic mutations or alter the cells phenotypically so that the cells with mutations behave more normally in one or more of DECl , PZLP, TCF4 and CD5L.
- High-throughput screening il ITS ⁇ is contemplated for identifying small molecules or biologies involved in suppressing or inhibiting expression of somatic mutations in one or more of DECl , PZLP, TCF4 and CD5L.
- the flexibility of the process has allowed numerous and disparate areas of biology to engage with an equally diverse palate of chemistry (see, e.g., mglese et al., Nature Chemical Biology 3, 438 ⁇ 441 (2007)).
- Diverse sets of chemical libraries, containing more than 200,000 unique small molecules, as well as natural product libraries, can be screened.
- Prest vick library (1,120 chemicals) of off-patent compounds selected for structural diversity, collective coverage of multiple therapeutic areas, and known safety and bioavailability in humans, as well as the NTNDS Custom Collection 2 consisting of a 1,040 compound- library of mostly FDA-approved dr gs (see, e.g., US Patent No. 8,557,746) are also contemplated.
- NTNDS Custom Collection 2 consisting of a 1,040 compound- library of mostly FDA-approved dr gs (see, e.g., US Patent No. 8,557,746) are also contemplated.
- Ml I s Molecular Libraries Probe Production Centers Network offers access to thousands of small molecules - chemical compounds that can be used as tools to probe basic biology and advance our understanding of disease. Small molecules can help researchers understand the intricacies of a biological pathway or be starting points for novel therapeutics.
- the Broad Institute's Probe Development Center (BIPDeC) is part of the MLPCN and offers access to a growing library of over 330,000 compounds for large scale screening and medicinal chemistry. Any of these compounds may be utilized for screening compounds involved in suppressing or inhibiting expression of somatic mutations in one or more of DECl, PZLP, TCF4 and CDS L.
- terapéuticaally effective amount refers to a nontoxic but sufficient amount of a drug, agent, or compound to provide a desired therapeutic effect
- patient refers to any human being receiving or who may receive medical treatment.
- a "polymorphic site” refers to a polynucleotide that differs from another polynucleotide by one or more single nucleotide changes.
- a "somatic mutation” refers to a change in the genetic structure that is not inherited from a parent, and also not passed to offspring.
- Treatment or treatment according to the invention may be performed alone or in conjunction with another therapy, and may be provided at home, the doctor's office, a clinic, a hospital's outpatient department, or a hospital. Treatment generally begins at a hospital so that the doctor can observe the therapy's effects closely and make any adjustments that are needed. The duration of the therapy depends on the age and condition of the patient, the stage of the a cardiovascular disease, and how the patient responds to the treatment. Additionally, a person having a greater risk of developing a cardiovascular disease (e.g., a person who is genetically predisposed) may receive prophylactic treatment to inhibit or delay symptoms of the disease.
- a cardiovascular disease e.g., a person who is genetically predisposed
- the medicaments of the invention are prepared in a manner known to those skilled in the art, for example, by means of conventional dissolving, iyophilizing, mixing, granulating or confectioning processes. Methods well known in the art for making formulations are found, for example, in Remington: The Science and Practice of Pharmacy, 20th ed., ed. A. R. Gennaro, 2000, Lippincott Williams & Wilkins, Philadelphia, and Encyclopedia of Pharmaceutical Technology, eds. J. Swarbrick and J. C. Boyla , 1988-1999, Marcel Dekker, New York.
- Administration of medicaments of the invention may be by any suitable means that results in a compound concentration that is effective for treating or inhibiting (e.g., by delaying) the development of a cardiovascular disease.
- the compound is admixed with a suitable carrier substance, e.g., a pharmaceutically acceptable excipient that preserves the therapeutic properties of the compound with which it is administered.
- a suitable carrier substance e.g., a pharmaceutically acceptable excipient that preserves the therapeutic properties of the compound with which it is administered.
- One exemplary pharmaceutically acceptable excipient is physiological saline.
- the suitable carrier substance is generally present in an amount of 1-95% by weight of the total weight of the medicament.
- the medicament may be provided in a dosage form that is suitable for oral, rectal, intravenous, intramuscular, subcutaneous, inhalation, nasal, topical or transdermal, vaginal, or ophthalmic administration.
- the medicament may be in form of, e.g., tablets, capsules, pills, powders, granulates, suspensions, emulsions, solutions, gels including hydrogels, pastes, ointments, creams, plasters, drenches, delivery devices, suppositories, enemas, injectables, implants, sprays, or aerosols,
- genomic DNA may be obtained from a sample of tissue or cells taken from that patient.
- the tissue sample may comprise but is not limited to hair (including roots), skin, buccal swabs, blood, or saliva.
- the tissue sample may be marked with an identifying number or other indicia that relates the sample to the individual patient from which the sample was taken.
- the identity of the sample advantageously remams constant throughout the methods of the invention thereby guaranteeing the integrity and continuity of the sample during extraction and analysis.
- the indicia may be changed in a regular fashion that ensures that the data, and any other associated data, can be related back to the patient from whom the data was obtained.
- the amount/size of sample required is known to those skilled in the art.
- the tissue sample may be placed in a container that is labeled using a numbering system bearing a code corresponding to the patient. Accordingly, the genotype of a particular patient is easily traceable.
- a sampling device and/or container may be supplied to the physician.
- the sampling device advantageously takes a consistent and reproducible sample from individual patients while simultaneous!)' avoiding any cross- contamination of tissue. Accordingly, the size and volume of sample tissues derived from individual patients would be consistent.
- a sample of DNA is obtained from the tissue sample of the patient of interest. Whatever source of cells or tissue is used, a sufficient amount of cells must be obtained to provide a sufficient amount of DNA for analysis. This amount will be known or readily determinable by those skilled in the art.
- DNA is isolated from the tissue/cells by techniques known to those skilled in the art (see, e.g., U.S. Pat. Nos. 6,548,256 and 5,989,431 , Hi rota et al., Jinrai Mengaku Zasshi, September 1989; 34(3):217-23 and John et al., Nucleic Acids Res. Jan. 25. 1991 ;19(2):408; the disclosures of which are incorporated by reference in their entireties).
- high molecular weight DNA may be purified from cells or tissue using proteinase K extraction and ethanol precipitation.
- DNA may be extracted from a patient specimen using any other suitable methods known in the art.
- the kit may have primers or other DNA markers for identifying particular mutations such as, but not limited to, one or more genes selected from the group consisting of DEC1, PZLP, TCF4 and CD5 L.
- any method for determining genotype can be used for determining genotypes in the present invention.
- Such methods include, but are not limited to, amplimer sequencing, DNA sequencing, fluorescence spectroscopy, fluorescence resonance energy transfer (or "FRET")- based hybridization analysis, high throughput screening, mass spectroscopy, nucleic acid hybridization, polymerase chain reaction (PCR), RFLP analysis and size chromatography (e.g., capill ary or gel chromatography), all of which are well known to one of skil l in the art.
- test kit may comprise any of the materials necessary for whole exome sequencing and targeted amplicon sequencing, for example, according to the invention.
- a diagnostic for the present invention may comprise testing for any of the genes in disclosed herein.
- the kit further comprises additional means, such as reagents, for detecting or measuring the sequences of the present invention, and also ideally a positive and negative control.
- the present invention further encompasses probes according to the present invention that are immobilized on a solid or flexible support, such as paper, nylon or other type of membrane, filter, chip, glass slide, microchips, mierobeads, or any other such matrix, all of which are within the scope of this invention.
- the probe of this form is now called a "DNA chip”. These DNA chips can be used for analyzing the somatic mutations of the present invention.
- the present invention further encompasses arrays or microarrays of nucleic acid molecules that are based on one or more of the sequences described herein.
- arrays or “microarrays” refers to an array of distinct polynucleotides or oligonucleotides synthesized on a solid or flexible support, such as paper, nylon or other type of membrane, filter, chip, glass slide, or any other suitable solid support.
- the microarray is prepared and used according to the methods and devices described in U.S. Pat. Nos. 5,446,603; 5,545,531 ; 5,807,522; 5,837,832; 5,874,219; 6,1 14,122; 6,238,910; 6,365,418; 6,410,229; 6,420,1 14; 6,432,696; 6,475,808 and 6,489,159 and PCT Publication No. WO 01/45843 A2, the disclosures of which are incorporated by reference in their entireties.
- mutations in cells and also mutated mice for use in or as to the invention can be by way of the CRISPR-Cas system or a Cas9-expressing eukaryotic cell or Cas-9 expressing eukaryote, such as a mouse.
- the Cas9-expressing eukaryotic cell or eukaryote, e.g., mouse can have guide RNA delivered or administered thereto, whereby the RNA targets a loci and induces a desired mutation for use in or as to the invention.
- the invention involves a high-throughput single-cell RNA-Seq and/or targeted nucleic acid profiling (for example, sequencing, quantitative reverse transcription polymerase chain reaction, and the like) where the RNAs from different ceils are tagged individually, allowing a single library to be created while retaining the cell identity of each read.
- RNA-Seq and/or targeted nucleic acid profiling for example, sequencing, quantitative reverse transcription polymerase chain reaction, and the like
- technology of US provi sional patent application serial no. 62/048,227 filed September 9, 2014, the disclosure of which is incorporated by reference, may be used in or as to the invention.
- a combination of molecular barcoding and emulsion-based microfluidics to isolate, lyse, barcode, and prepare nucleic acids from individual cells in high-throughput is used.
- Micro flui die devices for example, fabricated in polydimethylsiloxane
- sub-nanoliter reverse emulsion droplets are used to co-encapsulate nucleic acids with a barcoded capture bead.
- Each bead for example, is uniquely barcoded so that each drop and its contents are distinguishable.
- the nucleic acids may come from any source known in the art, such as for example, those which come from a single cell, a pair of cells, a cellular iysate, or a solution.
- the cell is lysed as it is encapsulated in the droplet.
- a single-cell sequencing library which may comprise: merging one uniquely barcoded mRNA capture microbead with a single-cell in an emulsion droplet having a diameter of 75-125 ⁇ ; lysing the cell to make its RNA accessible for capturing by hybridization onto RNA capture microbead; performing a reverse transcription either inside or outside the emulsion droplet to convert the cell's mRNA to a first strand cDNA that is covalently linked to the mRNA capture microbead; pooling the cDNA-attached microbeads from all cells; and preparing and sequencing a single composite RNA-Seq library.
- a method for preparing uniquely barcoded mRNA capture microbeads which has a unique barcode and diameter suitable for microfluidic devices which may comprise: 1 ) performing reverse phosphoramidite synthesis on the surface of the bead in a pool-and-split fashion, such that in each cycle of synthesis the beads are split into four reactions with one of the four canonical nucleotides (T, C, G, or A) or unique oligonucleotides of length two or more bases; 2) repeating this process a large number of times, at least six, and optimally more than twelve, such that, in the latter, there are more than 16 million unique barcodes on the surface of each bead in the pool.
- an apparatus for creating a single-cell sequencing library via a microfluidic system may comprise: an oil-surfactant inlet which may comprise a filter and a carrier fluid channel, wherein said carrier fluid channel further may comprise a resistor; an inlet for an analyte which may comprise a filter and a carrier fluid channel, wherein said carrier fluid channel may further comprise a resistor; an inlet for mRNA capture microbeads and l ysis reagent which may comprise a filter and a earner fluid channel, wherem said carrier fluid channel may further comprise a resistor; said carrier fluid channels have a carrier fluid flowing therein at an adjustable or predetermined flow rate; wherein each said carrier fluid channels merge at a junction; and said junction being connected to a mixer, which contains an outlet
- a method for creating a single-cell sequencing library may comprise: merging one uniquely barcoded RNA capture microbead with a single-cell in an emulsion droplet having a diameter of 125 ⁇ lysing the cell thereby capturing the RNA on the RNA capture microbead; performing a reverse transcription either after breakage of the droplets and collection of the microbeads; or inside the emulsion droplet to convert the cell's RNA to a first strand cDNA that is covalently linked to the RNA capture microbead; pooling the cDNA-attached microbeads from all cells; and preparing and sequencing a single composite RNA-Seq library; and, the emulsion droplet can be between 50-210 urn.
- the method wherem the diameter of the mRNA capture microbeads is from 10 ,um to 95 ⁇
- the practice of the instant invention comprehends preparing uniquely barcoded mRNA capture microbeads, which has a unique barcode and diameter suitable for microfluidie devices which may comprise: 1) performing reverse phosphoram.id.ite synthesis on the surface of the bead in a pool-and-spl.it fashion, such that in each cycle of synthesis the beads are split into four reactions with one of the four canonical nucleotides (T,C,G,or A); 2) repeating this process a large number of times, at least six, and optimally more than twelve, such that, in the latter, there are more than 16 million unique barcodes on the surface of each bead in the pool.
- the covending bond can be polyethylene glycol.
- the diameter of the mRNA capture microbeads can be from 10 ⁇ to 95 ⁇ . Accordingly, it is also envisioned as to or in the practice of the invention that there can be a method for preparing uniquely barcoded mRNA capture microbeads, which has a unique barcode and diameter suitable for microfluidie devices which may comprise: 1) performing reverse phosphoramidite synthesis on the surface of the bead in a pool-and-split fashion, such that in each cycle of synthesis the beads are split into four reactions with one of the four canonical nucleotides (T, C, G, or A); 2) repeating this process a large number of times, at least six, and optimally more than twelve, such that, in the latter, there are more than 16 million unique barcodes on the surface of each bead in the pool.
- the diameter of the mRNA capture microbeads can be from 10 ⁇ to 95 ⁇ .
- an apparatus for creating a composite single-cell sequencing library via a microfluidie system which may comprise: an oil- surfactant inlet which may comprise a filter and two carrier fluid channels, wherein said carrier fluid channel further may comprise a resistor; an inlet for an analyte which may comprise a filter and two earner fluid channels, wherem said carrier fluid channel further may comprise a resistor; an inlet for mRNA capture microbeads and lysis reagent which may comprise a carrier fluid channel; said carrier fluid channels have a carrier fluid flowing therein at an adjustable and predetermined flow rate; wherem each said carrier fluid channels merge at a junction; and said junction being connected to a constriction for droplet pinch-off followed by a mixer, which connects to an outlet for drops.
- the analyte may comprise a chemical reagent, a genetically perturbed cell, a protein, a drug, an antibody, an enzyme, a nucleic acid, an organelle like the mitochondrion or nucleus, a cell or any combination thereof.
- the analyte is a cell.
- the cell is a brain cell
- the lysis reagent may comprise an anionic surfactant such as sodium iauroyi sarcosinate, or a chaotropic salt such as guanidinium thiocyanate.
- the filter can involve square PDMS posts; e.g., with the filter on the cell channel of such posts with sides ranging between 125-135 ⁇ with a separation of 70-100 mm between the posts.
- the filter on the oil -surfactant inlet may comprise square posts of two sizes; one with sides ranging between 75-100 ⁇ and a separation of 25-30 ⁇ between them and the other with sides ranging between 40-50 ⁇ and a separation of 10-15 ⁇ ,
- the apparatus can involve a resistor, e.g., a resistor that is serpentine having a length of 7000 - 9000 ⁇ , width of 50 - 75 ⁇ and depth of 100 - 150 mm.
- the apparatus can have channels having a length of 8000 - 12,000 ⁇ for oil-surfactant inlet, 5000- 7000 for analyte (cell) inlet, and 900 - 1200 ⁇ for the inlet for microbead and lysis agent; and/or all channels having a width of 125 - 250 mm, and depth of 100 - 150 mm.
- the width of the cell channel can be 125-250 ⁇ and the depth 100-150 ⁇ .
- the apparatus can include a mixer having a length of 7000-9000 ⁇ , and a width of 110-140 ⁇ with 35-45o zig-zigs every 150 ⁇ .
- the width of the mixer can be about 125 ⁇ .
- the oil-surfactant can be a PEG Block Polymer, such as BIORADTM QX200 Droplet Generation Oil.
- the carrier fluid can be a water- glycerol mixture.
- a mixture may comprise a plurality of microbeads adorned with combinations of the following elements: bead-specific oligonucleotide barcodes; additional oligonucleotide barcode sequences which vary among the oligonucleot des on an indvidual bead and can therefore be used to differentiate or help identify those individual oligonucleotide molecules; additional oligonucleotide sequences that create substrates for downstream molecular-biological reactions, such as oligo-dT (for reverse transcription of mature mRNAs), specific sequences (for capturing specific portions of the transcriptome, or priming for DNA polymerases and similar enzymes), or random sequences (for priming throughout the transcriptome or genome).
- oligo-dT for reverse transcription of mature mRNAs
- the individual oligonucleotide molecules on the surface of any individual microbead may contain all three of these elements, and the third element may include both oligo-dT and a primer sequence.
- a mixture may comprise a plurality of microbeads, wherein said microbeads may comprise the following elements: at least one bead- specific oligonucleotide barcode; at least one additional identifier oligonucleotide barcode sequence, which varies among the oligonucleotides on an individual bead, and thereby assisting in the identification and of the bead specific oligonucleotide molecules; optionally at least one additional oligonucleotide sequences, which provide substrates for downstream molecular- biological reactions.
- a mixture may comprise at least one oligonucleotide sequence(s), which provide for substrates for downstream molecular-biological reactions.
- the downstream molecular biological reactions are for reverse transcription of mature mRNAs; capturing specific portions of the transcriptome, priming for DNA polymerases and/or similar enzymes; or priming throughout the transcriptome or genome.
- the mixture may involve additional oligonucleotide sequence(s) which may comprise a oligio-dT sequence.
- the mixture further may comprise the additional oligonucleotide sequence which may comprise a primer sequence.
- the mixture may further comprise the additional oligonucleotide sequence which may comprise a oligo-dT sequence and a primer sequence.
- labeling substance examples include labeling substances known to those skilled in the art, such as fluorescent dyes, enzymes, coenzymes, chemiiuminescent substances, and radioactive substances. Specific examples include radioisotopes (e.g., 32P, 14C, 1251, 3H, and 1311), fluorescein, rhodamine, dansyl chloride, umbelliferone, luciferase, peroxidase, alkaline phosphatase, ⁇ -galactosidase, ⁇ -glucosidase, horseradish peroxidase, giucoamylase, lysozyme, saccharide oxidase, microperoxidase, biotin, and ruthenium.
- radioisotopes e.g., 32P, 14C, 1251, 3H, and 1311
- fluorescein e.g., 32P, 14C, 1251, 3H, and 1311
- fluorescein r
- biotin is employed as a labeling substance
- a biotin-iabeled antibody streptavidin bound to an enzyme (e.g., peroxidase) is further added.
- an enzyme e.g., peroxidase
- the label is a fluorescent label.
- fluorescent labels include, but are not limited to, Atto dyes, 4-acetamido-4 - isothiocyanatostilbene-2,2'disulfonic acid; acridine and derivatives: acridine, acridine isothiocyanate; 5-(2'-aminoethyl)aminonaphthalene-l-sulfonic acid (EDANS); 4-amino-N-[3- vinylsulfbnyl)phenyl]naphthalimide-3,5 disuifonate; N-(4-anilino-l-naphthyl)raaieim.ide; anthranil amide; BODIPY; Brilliant Yellow; coumarin and derivatives; coumarin, 7-amino-4- rnethyicoumarin (AMC, Coumarin 120), 7 ⁇ ammo-4 ⁇ trifiuoromethylcouiuarin (Coumaran 151); cyanine dyes; cyan,
- DAS [dirnethyiarninojnaphthalene-l -sulfonyl chloride (DNS, dansylchloride); 4- dimethylaminophenylazophenyl-4'-isothiocyanate (DABITC); eosin and derivatives; eosin, eosin isothiocyanate, erythrosm and derivatives; erythrosm B, erythrosm, isothiocyanate; ethidium; fluorescein and derivatives; 5-carboxyfluorescein (FAM), 5 -(4,6-dichlorotriazin-2- yi)aminofluorescein (DTAF), 2',7'-dimethoxy-4'5'-dic-hloro-6-carboxyfluorescein, fluorescein, fluorescein isothiocyanate, QFITC, (XRJTC); fluorescamine; 1R144; IR1446; Malachite Green
- a fluorescent label may be a fluorescent protein, such as blue fluorescent protein, cyan fluorescent protein, green fluorescent protein, red fluorescent protein, yellow fluorescent protein or any photoconvertible protein. Colormetric l abeling, bio lum inescent labeling and/or chemiluminescent label ing may further accomplish labeling. Labeling further may include energy transfer between molecules in the hybridization complex by perturbation analysis, quenching, or electron transport between donor and acceptor molecules, the latter of which may be facilitated by double stranded match hybridization complexes.
- the fluorescent label may be a peryiene or a terrylen. In the alternative, the fluorescent label may be a fluorescent bar code.
- the label may be light sensitive, wherein the label is light-activated and/or light cleaves the one or more linkers to release the molecular cargo.
- the light-activated molecular cargo may be a major light-harvesting complex (LHC!I).
- the fluorescent label may induce free radical formation.
- agents may be uniquely labeled in a dynamic manner (see, e.g., US provisional patent application serial no. 61/703,884 filed September 21, 2012).
- the unique labels are, at least in part, nucleic acid in nature, and may be generated by sequential ly attaching two or more detectable oligonucleotide tags to each other and each imique label may be associated with a separate agent.
- a detectable oligonucleotide tag may be an oligonucleotide that may be detected by sequencing of its nucleotide sequence and/or by detecting non-nucleic acid detectable moieties to which it may be attached. Oligonucleotide tags may be detectable by virtue of their nucleotide sequence, or by virtue of a non-nucleic acid detectable moiety that is attached to the oligonucleotide such as but not limited to a fluorophore, or by virtue of a combination of their nucleotide sequence and the nonnucleic acid detectable moiety.
- a detectable oligonucleotide tag may comprise one or more nonoiigonucleotide detectable moieties.
- detectable moieties may include, but are not limited to, fluorophores, rmcroparticles including quantum dots (Empodocles, et al., Nature 399: 126-130, 1999), gold nanoparticies (Reichert et al, Anal. Chem. 72:6025-6029, 2000), microbeads (Lacoste et al., Proc. Natl Acad. Sci. USA 97(! 7):9461 ⁇ 9466, 2000), biotiti, DNP (dmitrophenyl), fucose, digoxigenin, haptens, and other detectable moieties known to those skilled in the art.
- the detectable moieties may be quantum dots.
- detectable oligonucleotide tags may be, but are not limited to, oligonucleotides which may comprise unique nucleotide sequences, oligonucleotides which may comprise detectable moieties, and oligonucleotides which may comprise both unique nucleotide sequences and detectable moieties.
- a unique label may be produced by sequentially attaching two or more detectable oligonucleotide tags to each other.
- the detectable tags may be present or provided in a plurality of detectable tags. The same or a different plurality of tags may be used as the source of each detectable tag may be part of a unique label.
- a plurality of tags may be subdivided into subsets and single subsets may be used as the source for each tag.
- One or more other species may be associated with the tags.
- nucleic acids released by a lysed cell may be ligated to one or more tags. These may include, for example, chromosomal DNA, RNA transcripts, tRNA, mRNA, mitochondrial DNA, or the like. Such nucleic acids may be sequenced, in addition to sequencing the tags themselves, which may yield information about the nucleic acid profile of the cells, which can be associated with the tags, or the conditions that the corresponding droplet or cell was exposed to.
- the invention accordingly may involve or be practiced as to high throughput and high resolution delivery of reagents to individual emulsion droplets that may contain ceils, organelles, nucleic acids, proteins, etc. through the use of monodisperse aqueous droplets that are generated by a microfluidic device as a water-in-oil emulsion.
- the droplets are carried in a flowing oil phase and stabilized by a surfactant.
- single ceils or single organellesor single molecules proteins, RNA, DNA
- multiple cells or multiple molecules may take the place of single cells or single molecules.
- aqueous droplets of volume ranging from 1 pL to 10 nL work as individual reactors.
- 104 to 105 single cells in droplets may be processed and analyzed in a single run.
- different species of microdroplets, each containing the specific chemical compounds or biological probes cells or molecular barcodes of interest have to be generated and combined at the preferred conditions, e.g., mixing ratio, concentration, and order of combination.
- Each species of droplet is introduced at a confluence point in a main microfluidic channel from separate inlet microfluidic channels.
- droplet volumes are chosen by design such that one species is larger than others and moves at a different speed, usually slower than the other species, in the carrier fluid, as disclosed in U.S. Publication No. US 2007/0195127 and International Publication No. WO 2007/089541, each of which are incorporated herein by reference in their entirety.
- the channel width and length is selected such that faster species of droplets catch up to the slowest species. Size constraints of the channel prevent the faster moving droplets from passing the slower moving droplets resulting in a train of droplets entering a merge zone. Multi-step chemical reactions, biochemical reactions, or assay detection chemistries often require a fixed reaction time before species of different type are added to a reaction.
- Multi-step reactions are achieved by repeating the process multiple times with a second, third or more confluence points each with a separate merge point.
- Highly efficient and precise reactions and analysis of reactions are achieved when the frequencies of droplets from the inlet channels are matched to an optimized ratio and the volumes of the species are matched to provide optimized reaction conditions in the combined droplets.
- Fluidic droplets may be screened or sorted within a fluidic system of the invention by altering the flow of the liquid containing the droplets. For instance, in one set of embodiments, a fluidic droplet may be steered or soiled by directing the liquid surrounding the fluidic droplet into a first channel, a second channel, etc.
- pressure within a fluidic system for example, within different channels or within different portions of a channel, can be control led to direct the flow of fluidic droplets.
- a droplet can be directed toward a channel junction including multiple options for further direction of flow (e.g., directed toward a branch, or fork, in a channel defining optional downstream flow channels).
- Pressure within one or more of the optional downstream flow channels can be controlled to direct the droplet selectively into one of the channel s, and changes in pressure can be effected on the order of the time required for successive droplets to reach the junction, such that the downstream flow path of each successive droplet can be independently controlled.
- the expansion and/or contraction of liquid reservoirs may be used to steer or sort a fluidic droplet into a channel, e.g., by causing directed movement of the liquid containing the fluidic droplet.
- the expansion and/or contraction of the liquid reservoir may be combined with other flow-controlling devices and methods, e.g., as described herein.
- Non-limiting examples of devices able to cause the expansion and/or contraction of a liquid reservoir include pistons.
- Key elements for using microfluidic channels to process droplets include: (1 ) producing droplet of the correct volume, (2) producing droplets at the correct frequency and (3) bringing together a first stream of sample droplets with a second stream of sample droplets in such a way that the frequency of the first stream of sample droplets matches the frequency of the second stream of sample droplets.
- bringing together a stream of sample droplets wit a stream of premade library droplets in such a way that the frequency of the library droplets matches the frequency of the sample droplets.
- Methods for producing droplets of a uniform volume at a regular frequency are well known in the art.
- One method is to generate droplets using hydrodynamic focusing of a dispersed phase fluid and immiscible carrier fluid, such as disclosed in U.S.
- one of the species introduced at the confluence is a pre-made library of droplets where the library contains a plurality of reaction conditions, e.g., a library may contain plurality of different compounds at a range of concentrations encapsulated as separate library elements for screening their effect on cells or enzymes, alternatively a library could be composed of a plurality of different primer pairs encapsulated as different library elements for targeted amplification of a collection of loci, alternatively a library could contain a plurality of different antibody species encapsulated as different library elements to perform a plurality of binding assays.
- a library may contain plurality of different compounds at a range of concentrations encapsulated as separate library elements for screening their effect on cells or enzymes
- a library could be composed of a plurality of different primer pairs encapsulated as different library elements for targeted amplification of a collection of loci
- a library could contain a plurality of different antibody species encapsulated as different library elements to perform a plurality of binding assays.
- the introduction of a library of reaction conditions onto a substrate is achieved by pushing a premade collection of library droplets out of a vial with a drive fluid.
- the drive fluid is a continuous fluid.
- the drive fluid may comprise the same substance as the carrier fluid (e.g., a fluorocarbon oil).
- the carrier fluid e.g., a fluorocarbon oil.
- the nominal droplet volume is expected to be 10 pi co-liters in the library, but varies from 9 to 11 pico-liters from library-to-library then a 10,000 pico-liter/second infusion rate will nominally produce a range in frequencies from 900 to 1,100 droplet per second.
- sample to sample variation in the composition of dispersed phase for droplets made on chip a tendency for the number density of library droplets to increase over time and library-to- library variations in mean droplet volume severely limit the extent to which frequencies of droplets may be reliably matched at a confluence by simply using fixed infusion rates.
- these limitations also have an impact on the extent to which volumes may be reproducibly combined.
- the surfactant and oil combination must (1) stabilize droplets against uncontrolled coalescence during the drop forming process and subsequent collection and storage, (2) minimize transport of any droplet contents to the oil phase and/or between droplets, and (3) maintain chemical and biological inertness with contents of each droplet (e.g., no adsorption or reaction of encapsulated contents at the oil-water interface, and no adverse effects on biological or chemical constituents in the droplets).
- the surfactant-in-oil solution must be coupled with the fluid physics and materials associated with the platform.
- the oil solution must not swell, dissolve, or degrade the materials used to construct the microfluidic chip, and the physical properties of the oil (e.g., viscosity, boiling point, etc.) must be suited for the flow and operating conditions of the platform.
- Droplets formed in oil without surfactant are not stable to permit coalescence, so surfactants must be dissolved in the oil that is used as the continuous phase for the emulsion library.
- Surfactant molecules are amphiphilic— part of the molecule is oil soluble, and part of the molecule is water soluble.
- surfactant molecules that are dissolved in the oil phase adsorb to the interface.
- the hydrophilic portion of the molecule resides inside the droplet and the fiuorophiiic portion of th e molecule decorates the exterior of the droplet.
- the surface tension of a droplet is reduced when the interface is popuiated with surfactant, so the stability of an emulsion is improved.
- the surfactant should be inert to the contents of each droplet and the surfactant should not promote transport of encapsulated components to the oil or other droplets.
- a droplet library may be made up of a number of library elements that are pooled together in a single collection (see, e.g., US Patent Publication No. 2010002241). Libraries may vary in complexity from a single library element to 1015 library elements or more. Each library element may be one or more given components at a fixed concentration. The element may be, but is not limited to, cells, organelles, virus, bacteria, yeast, beads, amino acids, proteins, polypeptides, nucleic acids, polynucleotides or small molecule chemical compounds. The element may contain an identifier such as a label.
- the terms "droplet library” or “droplet libraries” are also referred to herein as an "emulsion library” or “emulsion libraries.” These terms are used interchangeably throughout the specification.
- a cell library element may include, but is not limited to, hybridomas, B-eeils, primary cells, cultured cell lines, cancer cells, stem cells, cells obtained from tissue, or any other cell type.
- Cellular library elements are prepared by encapsulating a number of cells from one to hundreds of thousands in individual droplets. The number of cells encapsulated is usually given by Poisson statistics from the number density of cells and volume of the droplet. Ho wever, in some cases the number deviates from Poisson statistics as described in Edd et al, "Controlled encapsulation of single-cells into monodisperse picoiitre drops.” Lab Chip, 8(8): 1262-1264, 2008.
- a bead based library element may contain one or more beads, of a given type and may also contain other reagents, such as antibodies, enzymes or other proteins, in the case where ail library elements contain different types of beads, but the same surrounding media, the library elements may all be prepared from a single starting fluid or have a variety of starting fluids.
- the library elements will be prepared from a variety of starting fluids. Often it is desirable to have exactly one cell per droplet with only a few droplets containing more than one cell when starting with a plurality of cells or yeast or bacteria, engineered to produce variants on a protein. In some cases, variations from Poisson statistics may be achieved to provide an enhanced loading of droplets such that there are more droplets with exactly one cell per droplet and few exceptions of empty droplets or droplets containing more than one cell. Examples of droplet libraries are collections of droplets that have different contents, ranging from beads, cells, small molecules, DNA, primers, antibodies.
- Smaller droplets may be in the order of femtoliter (fL) volume drops, which are especially contemplated with the droplet dispensers.
- the volume may range from about 5 to about 600 fL.
- the larger droplets range in size from roughly 0.5 micron to 500 micron in diameter, which corresponds to about 1 pico liter to I nano liter.
- droplets may be as small as 5 microns and as large as 500 microns.
- the droplets are at less than 100 microns, about 1 micron to about 100 microns in diameter.
- the most preferred size is about 20 to 40 microns in diameter (10 to 100 picoliters).
- the preferred properties examined of droplet libraries include osmotic pressure balance, uniform size, and size ranges.
- the droplets within the emulsion libraries of the present invention may be contained within an immiscible oil which may comprise at least one fluorosurfactant.
- the fluorosurfactant within the immiscible fluorocarbon oil may be a block copolymer consisting of one or more perfiuormated poiyether (PFPE) blocks and one or more polyethylene glycol (PEG) blocks.
- PFPE perfiuormated poiyether
- PEG polyethylene glycol
- the fluorosurfactant is a tribloek copolymer consisting of a PEG center block covalently bound to two PFPE blocks by amide linking groups.
- fluorosurfactant similar to uniform size of the droplets in the library
- the presence of the fluorosurfactant is critical to maintain the stability and integrity of the droplets and is also essential for the subsequent use of the droplets within the library for the various biological and chemical assays described herein.
- Fluids e.g., aqueous fluids, immiscible oils, etc.
- other surfactants that may be utilized in the droplet libraries of the present invention are described in greater detail herein.
- the present invention can accordingly involve an emulsion library which may comprise a plurality of aqueous droplets within an immiscible oil (e.g., fluorocarbon oil) which may comprise at least one fluorosurfactant, wherein each droplet is imiform in size and may comprise the same aqueous fluid and may comprise a different library element.
- an immiscible oil e.g., fluorocarbon oil
- fluorosurfactant e.g., fluorocarbon oil
- each droplet is imiform in size and may comprise the same aqueous fluid and may comprise a different library element.
- the present invention also provides a method for forming the emulsion library which may comprise providing a single aqueous fluid which may comprise different library elements, encapsulating each library element into an aqueous droplet within an immiscible fluorocarbon oil which may comprise at least one fluorosurfactant, wherein each droplet is uniform in size and may comprise the same aqueous fluid and may comprise a different library element, and pooling the aqueous droplets within an immiscible fluorocarbon oil which may comprise at least one fluorosurfactant, thereby forming an emulsion library.
- all different types of elements may be pooled in a single source contained in the same medium.
- the cells or beads are then encapsulated in droplets to generate a library of droplets wherem each droplet with a different type of bead or cell is a different library element.
- the dilution of the initial solution enables the encapsulation process.
- the droplets formed will either contain a single cell or bead or will not contain anything, i.e., be empty. In other embodiments, the droplets formed will contain multiple copies of a librar element.
- the cells or beads being encapsulated are generally variants on the same type of cell or bead.
- the emulsion library may comprise a plurality of aqueous droplets within an immiscible fluorocarbon oil, wherein a single molecule may be encapsulated, such that there is a single molecule contained within a droplet for every 20-60 droplets produced (e.g., 20, 25, 30, 35, 40, 45, 50, 55, 60 droplets, or any integer in between).
- Single molecules may be encapsulated by diluting the solution containing the molecules to such a low concentration that the encapsulation of single molecules is enabled.
- a LacZ plasmid UNA was encapsulated at a concentration of 20 fM after two hours of incubation such that there was about one gene in 40 droplets, where 10 ,um droplets were made at 10 kHz per second. Formation of these libraries rely on limiting dilutions.
- the present invention also provides an emulsion library which may comprise at least a first aqueous droplet and at least a second aqueous droplet within a fluorocarbon oil which may comprise at least one fluorosurfactant, wherein the at least first and the at least second droplets are uniform in size and comprise a different aqueous fluid and a different library element.
- the present invention also provides a method for forming the emulsion library which may comprise providing at least a first aqueous fluid which may comprise at least a first library of elements, providing at least a second aqueous fluid which may comprise at least a second library of elements, encapsulating each element of said at least first library into at least a first aqueous droplet within an immiscible fluorocarbon oil which may comprise at least one fluorosurfactant, encapsulating each element of said at least second library into at least a second aqueous droplet within an immiscible fluorocarbon oil which may comprise at least one fluorosurfactant, wherein the at least first and the at least second droplets are uniform in size and may comprise a different aqueous fluid and a different library element, and pooling the at least first aqueous droplet and the at least second aqueous droplet within an immiscible fluorocarbon oil which may comprise at least one fluorosurfactant thereby forming an e
- the sample may include nucleic acid target molecules.
- Nucleic acid molecules may be synthetic or derived from naturally occurring sources.
- nucleic acid molecules may be isolated from a biological sample containing a variety of other components, such as proteins, lipids and non-template nucleic acids.
- Nucleic acid target molecules may be obtained from any cellular material, obtained from an animal, plant, bacterium, fungus, or any other cellular organism. In certain embodiments, the nucleic acid target molecules may be obtained from a single cell. Biological samples for use in the present invention may include viral particles or preparations. Nucleic acid target molecules may be obtained directly from an organism or from a biological sample obtained from an organism, e.g., from blood, urine, cerebrospinal fluid, seminal fluid, saliva, sputum, stool and tissue. Any tissue or body fluid specimen may be used as a source for nucleic acid for use in the invention. Nucleic acid target molecules may also be isolated from cultured cells, such as a primary cell culture or a cell line.
- the cells or tissues from which target nucleic acids are obtained may be infected with a virus or other intracellular pathogen.
- a sample may also be total RNA extracted from a biological specimen, a cDNA library, viral, or genomic DNA.
- nucleic acid may be extracted from a biological sample by a variety of techniques such as those described by Maniatis, et al, Molecular Cloning: A Laboratory Manual, Cold Spring Harbor, N.Y., pp. 280- 281 (1982).
- Nucleic acid molecules may be single-stranded, double-stranded, or double-stranded with single-stranded regions (for example, stem- and loop-structures).
- Nucleic acid obtained from biological samples typically may be fragmented to produce suitable fragments for analysis.
- Target nucleic acids may be fragmented or sheared to desired length, using a variety of mechanical, chemical and/or enzymatic methods.
- DNA may be randomly sheared via sonication, e.g. Covaris method, brief exposure to a DNase, or using a mixture of one or more restriction enzymes, or a transposase or nicking enzyme.
- RNA may be fragmented by brief exposure to an RNase, heat plus magnesium, or by shearing. The RNA may be converted to cDNA. If fragmentation is employed, the RNA may be converted to cDNA before or after fragmentation.
- nucleic acid from a biological sample is fragmented by sonication.
- nucleic acid is fragmented by a hydroshear instrument.
- individual nucleic acid target molecules may be from about 40 bases to about 40 kb.
- Nucleic acid molecules may be single-stranded, double-stranded, or double-stranded with single-stranded regions (for example, stem- and loop-structures).
- a biological sample as described herein may be homogenized or fractionated in the presence of a detergent or surfactant.
- the concentration of the detergent in the buffer may be about 0.05% to about 10.0%.
- the concentration of the detergent may be up to an amount where the detergent remains soluble in the solution. In one embodiment, the concentration of the detergent is between 0.1% to about 2%.
- the detergent may act to solubilize the sample.
- Detergents may be ionic or nonionic.
- ionic detergents examples include deoxycholate, sodium dodecyl sulfate (SDS), -lauro Isarcosine, and cetyltrimethylammoniumbromide (CTAB).
- a zwitterionic reagent may also be used in the purification schemes of the present invention, such as Chaps, zwitterion 3-14, and 3-[(3- cholamidopropyi)dimethylammonio]-l-propanesulf-onate. It is contemplated also that urea may be added with or without another detergent or surfactant. Lysis or homogenization solutions may further contain other agents, such as reducing agents.
- reducing agents include dithiothreitoi (DTT), ⁇ -mercaptoethanol, DTE, GSH, cysteine, cysteamine, tricarboxyethyi phosphine (TCEP), or salts of sulfurous acid.
- Size selection of the nucleic acids may he performed to remove very short fragments or very long fragments.
- the nucleic acid fragments may be partitioned into fractions which may comprise a desired number of fragments using any suitable method known in the art. Suitable methods to limit the fragment size in each fragment are known in the art. In various embodiments of the invention, the fragment size is limited to between about 10 and about 100 Kb or longer.
- a sample in or as to the instant invention may include individual target proteins, protein complexes, proteins with translational modifications, and protein/nucleic acid complexes.
- Protein targets include peptides, and also include enzymes, hormones, structural components such as viral capsid proteins, and antibodies. Protein targets may be synthetic or derived from naturally-occurring sources.
- the invention protein targets may be isolated from biological samples containing a variety of other components including lipids, non-template nucleic acids, and nucleic acids. Protein targets may be obtained from an animal, bacterium, fungus, cellular organism, and single cells.
- Protein targets may be obtained directly from an organism or from a biological sample obtained from the organism, including bodily fluids such as blood, urine, cerebrospinal fluid, seminal fluid, saliva, sputum, stool and tissue. Protein targets may also be obtained from cell and tissue lysates and biochemical fractions.
- An individual protein is an isolated polypeptide chain.
- a protein complex includes two or polypeptide chains. Samples may include proteins with post translational modifications including but not limited to phosphorylation, methionine oxidation, deamidation, glycosylation, ubiquitination, carbamylation, s-carboxymethylation, acetylation, and methylation. Protein/nucleic acid complexes include cross-linked or stable protein-nucleic acid complexes. Extraction or isolation of individual proteins, protein complexes, proteins with translational modifications, and protein/nucleic acid complexes is performed using methods known in the art.
- the invention can thus involve forming sample droplets.
- the droplets are aqueous droplets that are surrounded by an immiscible carrier fluid.
- Methods of forming such droplets are shown for example in Link et al. (U.S. patent application numbers 2008/0014589, 2008/0003142, and 2010/0137163), Stone et al. (U.S. Pat. No. 7,708,949 and U.S. patent application number 2010/0172803), Anderson et al. (U.S. Pat. No. 7,041,481 and which reissued as RE41,780) and European publication number EP2047910 to Raindance Technologies Inc. The content of each of which is incorporated by reference herein in its entirety.
- the present invention may relates to systems and methods for manipulating droplets within a high throughput microfluidic system.
- a microfluid droplet encapsulates a differentiated ceil The ceil is lysed and its mRNA is hybridized onto a capture bead containing barcoded oligo dT primers on the surface, all inside the droplet.
- the barcode is covalently attached to the capture bead via a flexible multi-atom linker like PEG.
- the droplets are broken by addition of a fluorosurfactant (like perfiuorooctanol), washed, and collected.
- a reverse transcription (RT) reaction is then performed to convert each cell's mRNA into a first strand cDNA that is both uniquely barcoded and covalently linked to the mRNA capture bead.
- a universal primer via a template switching reaction is amended using conventional library preparation protocols to prepare an RNA-Seq library. Since all of the mRNA from any given cell is uniquely barcoded, a single library is sequenced and then computationally resolved to determine which mRNAs came from which cells. In this way, through a single sequencing run, tens of thousands (or more) of distinguishable transcriptomes can be simultaneously obtained.
- the oligonucleotide sequence may be generated on the bead surface.
- beads were removed from the synthesis column, pooled, and aliquoted into four equal portions by mass; these bead aliquots were then placed in a separate synthesis column and reacted with either dG, dC, dT, or dA phosphoramidite.
- degenerate oligonucleotide synthesis Upon completion of these cycles, 8 cycles of degenerate oligonucleotide synthesis were performed on all the beads, followed by 30 cycles of dT addition. In other embodiments, the degenerate synthesis is omitted, shortened (less than 8 cycles), or extended (more than 8 cycles); in others, the 30 cycles of dT addition are replaced with gene specific primers (single target or many targets) or a degenerate sequence.
- the aforementioned microfluidic system is regarded as the reagent deliveiy system microfluidic library printer or droplet library printing system of the present invention. Droplets are formed as sample fluid flows from droplet generator which contains lysis reagent and barcodes through microfluidic outlet channel which contains oil, towards junction.
- the sample fluid may typically comprise an aqueous buffer solution, such as ultrapure water (e.g., 18 mega- ohm resistivity, obtained, for example by column chromatography), 10 mM Tris HCl and 1 mM EDTA (TE) buffer, phosphate buffer saline (PBS) or acetate buffer. Any liquid or buffer that is physiologically compatible with nucleic acid molecules can be used.
- the carrier fluid may include one that is immiscible with the sample fluid.
- the earlier fluid can be a non-polar solvent, decane (e.g., tetradecane or hexadecane), fluorocarbon oil, silicone oil, an inert oil such as hydrocarbon, or another oil (for example, mineral oil).
- the carrier fluid may contain one or more additives, such as agents which reduce surface tensions (surfactants).
- Surfactants can include Tween, Span, fluorosurfactants, and other agents that are soluble in oil relative to water. In some applications, performance is improved by adding a second surfactant to the sample fluid.
- Surfactants can aid in controlling or optimizing droplet size, flow and uniformity, for example by reducing the shear force needed to extrude or inject droplets into an intersecting channel.
- the surfactant can serve to stabilize aqueous emulsions in fluorinated oils from coalescing. Droplets may be surrounded by a surfactant which stabilizes the droplets by reducing the surface tension at the aqueous oil interface.
- Preferred surfactants that may be added to the carrier fluid include, but are not limited to, surfactants such as sorbitan- based carboxylic acid esters (e.g., the "Span” surfactants, Fluka Chemika), including sorbitan monolaurate (Span 20), sorbitan monopalmitate (Span 40), sorbitan monostearate (Span 60) and sorbitan monooleate (Span 80), and perfluorinated polyethers (e.g., DuPont Krytox 157 FSL, FSM, and/or FSH).
- surfactants such as sorbitan- based carboxylic acid esters (e.g., the "Span” surfactants, Fluka Chemika), including sorbitan monolaurate (Span 20), sorbitan monopalmitate (Span 40), sorbitan monostearate (Span 60) and sorbitan monooleate (Span 80), and perfluorinated polyethers (e.g., DuPont K
- non-ionic surfactants which may be used include polyoxyethylenated alkylphenols (for example, nortyl-, ⁇ -dodecyl-, and dinonylphenols), polyoxyethylenated straight chain alcohols, polyoxyethylenated polyoxypropylene glycols, polyoxyethylenated mercaptans, long chain carboxylic acid esters (for example, glyceryl and polyglyceryl esters of natural fatty acids, propylene glycol, sorbitol, polyoxyethylenated sorbitol esters, polyoxyethylene glycol esters, etc.) and alkanolamines (e.g., diethanolamine-fatty acid condensates and isopropanolamine-fatty acid condensates).
- alkylphenols for example, nortyl-, ⁇ -dodecyl-, and dinonylphenols
- an apparatus for creating a single-cell sequencing library via a microfluidic system provides for volume-driven flow, wherein constant volumes are injected over time.
- the pressure in fluidic cnannels is a function of injection rate and channel dimensions.
- the device provides an oil/surfactant inlet; an inlet for an analyte; a filter, an inlet for for mRNA capture microbeads and lysis reagent; a carrier fluid channel which connects the inlets; a resistor; a constriction for droplet pinch-off; a mixer; and an outlet for drops.
- the invention provides apparatus for creating a single-cell sequencing library via a microfluidic system, which may comprise: an oil-surfactant inlet which may comprise a filter and a carrier fluid channel, wherein said carrier fluid channel may further comprise a resistor; an inlet for a analyte which may comprise a filter and a carrier fluid channel, wherein said carrier fluid channel may further comprise a resistor; an inlet for mRNA capture microbeads and lysis reagent which may comprise a filter and a carrier fluid channel, wherein said earner fluid channel further may comprise a resistor; said carrier fluid channels have a carrier fluid flowing therein at an adjustable or predetermined flow rate; wherein each said carrier fluid channels merge at a junction; and said junction being connected to a mixer, which contains an outlet for drops.
- TWO channels one carrymg cell suspensions, and the other carrying uniquely barcoded mRNA capture bead, lysis buffer and library preparation reagents meet at a junction and is immediately co-encapsulated in an inert carrier oil, at the rate of one cell and one bead per drop.
- each drop using the bead's barcode tagged oligonucleotides as cDNA template, each mRNA is tagged with a unique, cell-specific identifier.
- the invention also encompasses use of a Drop-Seq library of a mixture of mouse and human cells.
- the carrier fluid may be caused to flow through the outlet channel so that the surfactant in the carrier fluid coats the channel walls.
- the fluorosurfactant can be prepared by reacting the perflouriiiated poiyether DuPont Krytox 157 FSL, FSM, or FSH with aqueous ammonium hydroxide in a volatile fluorinated solvent. The solvent and residual w r ater and ammonia can be removed with a rotary evaporator. The surfactant can then be dissolved (e.g., 2.5 wt %) in a fluorinated oil (e.g., Flourinert (3M)), which then serves as the carrier fluid.
- a fluorinated oil e.g., Flourinert (3M)
- Activation of sample fluid reservoirs to produce regent droplets is based on the concept of dynamic reagent delivery (e.g., combinatorial barcoding) via an on demand capability.
- the on demand feature may be provided by one of a variety of technical capabilities for releasing delivery droplets to a primary droplet, as described herein. From this disclosure and herein cited documents and knowledge in the art, it is within the ambit of the skilled person to develop flow rates, channel lengths, and channel geometries; and establish droplets containing random or specified reagent combinations can be generated on demand and merged with the "reaction chamber" droplets containing the samples/ceils/substrates of interest.
- nucleic acid tags can be sequentially ligated to create a sequence reflecting conditions and order of same.
- the tags can be added independently appended to solid support.
- two or more droplets may be exposed to a variety of different conditions, where each time a droplet is exposed to a condition, a nucleic acid encoding the condition is added to the droplet each ligated together or to a unique solid support associated with the droplet such that, even if the droplets with different histories are later combined, the conditions of each of the droplets are remain available through the different nucleic acids.
- a nucleic acid encoding the condition is added to the droplet each ligated together or to a unique solid support associated with the droplet such that, even if the droplets with different histories are later combined, the conditions of each of the droplets are remain available through the different nucleic acids.
- molecular barcodes e.g., DNA oligonucleotides, flurophores, etc.
- compounds of interest drugs, small molecules, siRNA, CRISPR guide RNAs, reagents, etc.
- unique molecular barcodes can be created in one array of nozzles while individual compounds or combinations of compounds can be generated by another nozzle array. Barcodes/compounds of interest can then be merged with cell-containing droplets.
- An electronic record in the form of a computer log file is kept to associate the barcode delivered with the downstream reagent(s) delivered.
- the device and techniques of the disclosed invention facilitate efforts to perform studies that require data resolution at the single cell (or single molecule) level and in a cost effective manner.
- the invention envisions a high throughput and high resolution delivery of reagents to individual emulsion droplets that may contain cells, nucleic acids, proteins, etc. through the use of monodisperse aqueous droplets that are generated one by one in a microfluidic chip as a water-in-oil emulsion.
- Droplet generation and deployment is produced via a dynamic indexing strategy and in a controlled fashion in accordance with disclosed embodiments of the present invention
- Microdroplets can be processed, analyzed and sorted at a highly efficient rate of several thousand droplets per second, providing a powerful platform which allows rapid screening of millions of distinct compounds, biological probes, protems or cells either in cellular model s of biological mechanisms of disease, or in biochemical, or pharmacological assays.
- a plurality of biological assays as well as biological synthesis are contemplated.
- Polymerase chain reactions (PCR) are contemplated (see, e.g., US Patent Publication No. 20120219947).
- Methods of the invention may be used for merging sample fluids for conducting any type of chemical reaction or any type of biological assay.
- Amplification refers to production of additional copies of a nucleic acid sequence and is generally carried out using polymerase chain reaction or other technologies well known in the art (e.g., Dieffenbach and Dveksler, PCR Primer, a Laboratory Manual, Cold Spring Harbor Press, Plainview, N.Y. [1995]).
- the amplification reaction may be any amplification reaction known in the art that amplifies nucleic acid molecules, such as polymerase chain reaction, nested polymerase chain reaction, polymerase chain reaction-single strand conformation polymorphism, ligase chain reaction (Barany F. (1991) PNAS 88: 189-193; Barany F.
- PCR Polymerase chain reaction
- K. B. Mullis U.S. Pat. Nos. 4,683,195 and 4,683,202, hereby incorporated by reference
- the process for amplifying the target sequence includes introducing an excess of oligonucleotide primers to a DNA mixture containing a desired target sequence, followed by a precise sequence of thermal cycling in the presence of a DNA polymerase.
- the primers are complementary to their respective strands of the double stranded target sequence.
- primers are annealed to their complementary sequence within the target molecule.
- the primers are extended with a polymerase so as to form a new pair of complementary strands.
- the steps of denaturation, primer annealing and polymerase extension may be repeated many times (i.e., denaturation, annealing and extension constitute one cycle; there may be numerous cycles) to obtain a high concentration of an amplified segment of a desired target sequence.
- the length of the amplified segment of the desired target sequence is determined by relative positions of the primers with respect to each other, and therefore, this length is a controllable parameter.
- the first sample fluid contains nucleic acid templates. Droplets of the first sample fluid are formed as described above. Those droplets will include the nucleic acid templates. In certain embodiments, the droplets will include only a single nucleic acid template, and thus digital PCR. may be conducted.
- the second sample fluid contains reagents for the PCR reaction. Such reagents generally include Taq polymerase, deoxynucleotides of type A, C, G and T, magnesium chloride, and forward and reverse primers, ail suspended within an aqueous buffer.
- the second fluid also includes detectabfy labeled probes for detection of the amplified target nucleic acid, the details of which are discussed below.
- This type of partitioning of the reagents between the two sample fluids is not the only possibility.
- the first sample fluid will include some or ail of the reagents necessary for the PCR.
- the second sample fluid will contain the balance of the reagents necessary for the PCR together with the detection probes.
- Primers may be prepared by a variety of methods including but not limited to cloning of appropriate sequences and direct chemical synthesis using methods well known in the art (Narang et al., Methods EnzymoL, 68:90 (1979); Brown et al., Methods EnzymoL, 68: 109 (1979)). Primers may also be obtained from commercial sources such as Operon Technologies, Amersham Pharmacia Biotech, Sigma, and Life Technologies, The primers may have an identical melting temperature. The lengths of the primers may be extended or shortened at the 5' end or the 3' end to produce primers with desired melting temperatures. Also, the annealing position of each primer pair may be designed such that the sequence and, length of the primer pairs yield the desired melting temperature.
- Computer programs may also be used to design primers, including but not limited to Array Designer Software (Arrayit Inc.), Oligonucleotide Probe Sequence Design Software for Genetic Analysis (Olympus Optical Co.), NetPrimer, and DNAsis from Hitachi Software Engineering,
- the TM (melting or annealing temperature) of each primer is calculated using software programs such as Oligo Design, available from Invitrogen Corp.
- a droplet containing the nucleic acid is then caused to merge with the PCR reagents in the second fluid according to methods of the invention described above, producing a droplet that includes Taq polymerase, deoxynucleotides of type A, C, G and T, magnesium chloride, forward and reverse primers, detectably labeled probes, and the target nucleic acid.
- the droplets are thermal cycled, resulting in amplification of the target nucleic acid in each droplet.
- Droplets may be flowed through a channel in a serpentine path between heating and cooling lines to amplify the nucleic acid in the droplet.
- the width and depth of the channel may be adjusted to set the residence time at each temperature, which may be controlled to anywhere between less than a second and minutes.
- the three temperature zones may be used for the amplification reaction.
- the three temperature zones are controlled to result in denaturation of double stranded nucleic acid (high temperature zone), annealing of primers (low temperature zones), and amplification of single stranded nucleic acid to produce double stranded nucleic acids (intermediate temperature zones).
- the temperatures within these zones fall within ranges well known in the art for conducting PCR reactions. See for example, Sambrook et al. (Molecular Cloning, A Laboratory Manual, 3rd edition, Cold Spring Harbor Laboratory Press, Cold Spring Harbor, N.Y., 2001 ).
- the three temperature zones can be controlled to have temperatures as follows: 95° C. ( ⁇ ), 55° C. (TL), 72° C. (TM).
- the prepared sample droplets flow through the channel at a controlled rate.
- the sample droplets first pass the initial denaturation zone ( ⁇ ) before thermal cycling.
- the initial preheat is an extended zone to ensure that nucleic acids within the sample droplet have denatured successfully before thermal cycling.
- the requirement for a preheat zone and the length of denaturation time required is dependent on the chemistry being used in the reaction.
- the samples pass into the high temperature zone, of approximately 95° €., where the sample is first separated into single stranded DNA in a process called denaturation.
- the sample then flows to the low temperature, of approximately 55° C, where the hybridization process takes place, during which the primers anneal to the complementary sequences of the sample.
- the third medium temperature of approximately 72° C
- the polymerase process occurs when the primers are extended along the single strand of DNA with a thermostable enzyme.
- the nucleic acids undergo the same thermal cycling and chemical reaction as the droplets pass through each thermal cycle as they flow through the channel. The total number of cycles in the device is easily altered by an extension of thermal zones.
- the sample undergoes the same thermal cycling and chemical reaction as it passes through N amplification cycles of the compl ete thermal device.
- the temperature zones are controlled to achieve two individual temperature zones for a PGR reaction.
- the two temperature zones are controlled to have temperatures as follows: 95° C. (TH) and 60° C. (TL).
- the sample droplet optionally flows through an initial preheat zone before entering thermal cycling.
- the preheat zone may be important for some chemistry for activation and also to ensure that double stranded nucleic acid in the droplets is fully denatured before the thermal cycling reaction begins.
- the preheat dwell length results in approximately 10 minutes preheat of the droplets at the higher temperature.
- the sample droplet continues into the high temperature zone, of approximately 95° €., where the sample is first separated into single stranded DNA in a process called denaturation.
- the sample then flows through the device to the low temperature zone, of approximately 60° C, where the hybridization process takes place, during which the primers anneal to the complementary sequences of the sample. Finally the polymerase process occurs when the primers are extended along the single strand of DNA with a thermostable enzyme.
- the sample undergoes the same thermal cycling and chemical reaction as it passes through each thermal cycle of the complete device. The total number of cycles in the device is easily altered by an extension of block length and tubing.
- droplets may be flowed to a detection module for detection of amplification products. The droplets may be individually analyzed and detected using any methods known in the art, such as detecting for the presence or amount of a reporter.
- a detection module is in communication with one or more detection apparatuses.
- Detection apparatuses may be optical or electrical detectors or combinations thereof.
- suitable detection apparatuses include optical waveguides. microscopes, diodes, light stimulating devices, (e.g., lasers), photo multiplier tubes, and processors (e.g., computers and software), and combinations thereof, which cooperate to detect a signal representative of a characteristic, marker, or reporter, and to determine and direct the measurement or the sorting action at a sorting module.
- Further description of detection modules and methods of detecting amplification products in droplets are shown in Link et al, (U.S. patent application numbers 2008/0014589, 2008/0003142, and 2010/0137163) and European publication number EP2047910 to Raindance Technologies inc.
- the present invention provides another emulsion library which may comprise a plurality of aqueous droplets within an immiscible fluorocarbon oil which may comprise at least one fluorosurfactant, wherein each droplet is uniform in size and may comprise at least a first antibody, and a single element linked to at least a second antibody, wherein said first and second antibodies are different.
- each library element may comprise a different bead, wherein each bead is attached to a number of antibodies and the bead is encapsulated within a droplet that contains a different antibody in solution.
- Single-cell assays are also contemplated as part of the present invention (see, e.g., Ryan et al., Biomicrofluidics 5, 021501 (201 1) for an overview of applications of micro fluidics to assay individual cells).
- a single-cell assay may be contemplated as an experiment that quantifies a function or property of an individual cell when the interactions of that cell with its environment may be controlled precisely or may be isolated from the function or property under examination.
- EXAMPLE 1 Materials and Methods [00234] Briefly, gene expression profiles were measured at 18 time points (G.5hr to 72 days) under Th.17 conditions (IL-6, TGF- ⁇ ) or control (ThO) using Affymetrix microarrays HT_MG-430A. Differentially expressed genes were detected using a consensus over four inference methods, and cluster the genes using k-means, with an automatically derived k.
- Temporal regulatory interactions were inferred by looking for significant (p ⁇ 5* 10 " and fold enrichment > 1 ,5) overlaps between the regulator's putative targets (e.g., based on ChlPseq) and the target gene's cluster (using four clustering schemes).
- Candidates for perturbation were ordered lexicographically using network-based and expression-based features. Perturbations were done using SiNW for siRNA deliver ⁇ '. These methods are described in more detail below.
- mice C57BL/6 wild-type (wt), Mt _/" , M ⁇ , Fas "7” , irf4 fl7fl , and Cd4 Cre mice were obtained from Jackson Laboratory (Bar Harbor, ME).
- Statl ' and 129/Sv control mice were purchased from Taconic (Hudson, NY).
- IL- 12 ⁇ ' ⁇ 1 ' mice were provided by Dr. Pahan
- mice were provided by
- mice were crossed to Cd4 re mice to generate Cd4 Cre x]rf4 fl/fl and Cd4 re xIrf8 fl7fl mice. All animals were housed and maintained in a conventional pathogen- free facility at the Harvard Institute of Medicine in Boston, MA (IUCAC protocols: 031 1-031-14 (VKK.) and 0609- 058015 (AR)). All experiments were performed in accordance to the guidelines outlined by the Harvard Medical Area Standing Committee on Animals at the Harvard Medical School (Boston, MA). In addition, spleens fromMma " ' " mice were provided by Dr. Mark Bix from St. Jude Children's
- mice were obtained from the laboratory of Dr. Robert Roeder (Kim, U. et al.
- the B-cell-speeific transcription coactivator OCA-B/OBF- 1/Bob- 1 is essential for normal production of immunoglobulin isotypes. Nature
- Cd4+ T cells were purified from spleen and lymph nodes using atiti ⁇ CD4 microbeads (Miltenyi Biotech) then stained in PBS with 1% PCS for 20 min at room temperature with anti-Cd4-PerCP, anti-Cd621- APC, and anti-Cd44-PE antibodies (all Biolegend, CA).
- Naive Cd4 + Cd621 hlgh Cd44 iow T cells were sorted using the BD FACSAria cell sorter. Sorted cells were activated wit plate bound anti-Cd3
- cytokines For Thl 7 differentiation: 2ng/mL rhTGF- ⁇ (Miltenyi Biotec), 25ng/mL rmIi-6 (Miltenyi Biotec), 20ng/mi rmIl-23 (Miltenyi Biotec), and 20ng/ml rmIL- ⁇ (Miltenyi Biotec).
- Cells were cultured for 0.5 - 72 hours and harvested for A, intracellular cytokine staining, and flow cytometry.
- ICC Flow cytometry and intracellular cytokine staining
- a phycoerythrin-conjugated anti- Retinoid-Reiated Orphan Receptor gamma was used (B2D), also from eBioscience (Fig 16).
- FOXP3 staining for cells from knockout mice was performed with the FOXP3 staining kit by eBioscience (00-5523-00) in accordance with their "Onestep protocol for intracellular (nuclear) proteins".
- Data was collected using either a FACS Caiibur or LSR II (Both BD Biosciences), then analyzed using Flow Jo software (Treestar) (Awasthi, A, et al.
- cytokine secretion using Enzyme-Linked Immunosorbent Assay Naive T cells from knockout mice and their wild type controls were cultured as described above, their supernatants were collected after 72 h, and cytokine concentrations were determined by ELISA (antibodies for IL-17 and IL-10 from BD Bioscience) or by cytometric bead array for the indicated cytokines (BD Bioscience), according to the manufacturers' instructions (Fig. 5, Fig. 16).
- Microarray data Naive T cells were isolated from WT mice, and treated with IL ⁇ 6 and TGF- ⁇ .
- Affymetrix microarrays HT_MG-430A were used to measure the resulting rnRNA levels at 18 different time points (0.5 - 72 h; Fig. lb).
- cells treated initially with IL-6, TGF- ⁇ and with addition of IL-23 after 48hr were profiled at five time points (50 - 72 h).
- time- and culture-matched WT naive T cells stimulated under ThO conditions were used.
- Biological replicates were measured in eight of the eighteen time points (I hr, 2hr, l Ohr, 20hr, 30hr, 42hr, 52hr, 60hr) with high reproducibility (r ⁇ >0.98).
- the differentiation time course was compared to published microarray data of Th l7 ceils and naive T cells (Wei, G. et al. in Immunity Vol. 30 155-167 (2009)) (Fig. 6c).
- naive T cells were isolated from WT and I123r ' mice, and treated with IL-6, TGF- ⁇ and IL-23 and profiled at four different time points (49hr, 54hr, 65hr, 72hr).
- Expression data was preprocessed using the RMA algorithm followed by quantile normalization (Reich, M. et al. GenePattern 2.0. Nature genetics 38, 500-501 , doi: 10.1038/ng0506-500 (2006)).
- Detecting differentially expressed genes Differentially expressed genes (comparing to the ThO control) were found using four methods: (1) Fold change. Requiring a 2- fold change (up or down) during at least two time points. (2) Polynomial fit.
- the EDGE software Storey, J., Xiao, W., Leek, J., Tompkins, R. & Davis, R. in Proc. Natl. Acad. Sci. U.S.A. vol. 102 12837 (2005); Leek, J. T., Monsen, E., Dabney, A. R. & Storey, J. D. EDGE: extraction and analysis of differential gene expression.
- Gene expression is modeled by: time (using only time points for which there was more than one replicate) and treatment ("TGF- ⁇ + IL-6" or "ThO").
- TGF- ⁇ + IL-6 or "ThO”
- the model takes into account each variable independently, as well as their interaction. Cases in which the p-value assigned with the treatment parameter or the interaction parameter passed an FDR threshold of 0.01 were reported.
- Clustering several ways for grouping the differentially expressed genes were considered, based on their time course expression data: (1) For each time point, two groups were defined: (a) all the genes that are over-expressed and (b) ail the genes that are under- expressed relative to ThO cells (see below); (2) For each time point, two groups were defined: (a) all the genes that are induced and (b) all the genes that are repressed, comparing to the previous time point; (3 ) -means clustering using only the Th l7 polarizing conditions.
- the minimal k was used, such that the within-cluster similarity (average Pearson correlation with the cluster's centroid) was higher than 0.75 for all clusters; and, (4) K-means clustering using a concatenation of the ThO and Till 7 profiles.
- the fold change levels (compared to ThO (method 1) or to the previous time point (method 2)) were required to pass a cutoff defined as the minimum of the following three values: (1) 1.7; (2) mean + std of the histogram of fold changes across all time points; or (3) the maximum fold change across ail time points.
- the clusters presented in Fig. lb were obtained with method 4.
- Regulatory network inference potential regulators of Thl 7 differentiation were identified by computing overlaps between their putative targets and sets of differentially expressed genes grouped according to methods 1 -4 above, regulator-target associations from several sources were assembled: (1) in vivo DNA binding profiles (typically measured in other cells) of 298 transcriptional regulators (Linhart, C, Halperin, Y. & Shamir, R. Transcription factor and microRNA motif discovery: the Amadeus platform and a compendium of metazoan target sets. Genome research 18, 1180-1 189, doi: 10.1101 /gr.076117.108 (2008); Zheng, G. et al. ITFP: an integrated platfomi of mammalian transcription factors.
- H1F1 alpha-dependent glycolytic pathway orchestrates a metabolic checkpoint for the differentiation of TH17 and Treg cel ls.
- Retinoic acid increases Foxp3+ regulatory T ceils and inhibits development of Thl7 cells by enhancing TGF-beta-driven Smad3 signaling and inhibiting 1L-6 and IL-23 receptor expression.
- Each edge in the regulatory network was assigned a time stamp based on the expression profiles of its respective regulator and target nodes.
- the time points at which a gene was either differentially expressed or significantly induced or repressed with respect to the previous time point were considered.
- a regulator node was defined as 'absent' at a given time point if: (i) it was under expressed compared to ThO; or (ii) the expression is low ( ⁇ 20% of the maximum value in time) and the gene was not over-expressed compared to ThO; or, (iii) up to this point in time the gene was not expressed above a minimal expression value of 100.
- protein expression levels were estimated using the model from Schwanmericr, B. et al. (Global quantification of mammalian gene expression control. Nature 473, 337-342, doi:10.1038/naturel 0098 (2011)) and using a sigmoidai fit (Chechik & Koller, J Comput Biol 2009) for a continuous representation of the temporal expression profiles, and the ProtParam software (Wilkins, M. R. et al. Protein identification and analysis tools in the ExPASy server. Methods Mol. Biol.
- the 85-gene signature (used for the Fluidigm BioMark qPCR assay) is a subset of the 275-gene signature, selected to include all the key regulators and cytokines discussed. To thislist 10 control genes (2900064A13RI , API5, CAND1, CSN 1A1 , EIF3E, EIF3H, FIP1L1, GOLGA3, HSBPL KHDRBS1, MED24, MKLN1, PCBP2, SLC6A6, SUFU, TMED7, UBE3A, ZFP410) were added. [00250] Selection of perturbation targets: an unbiased approach was used to rank candidate regulators - transcription factor or chromatin modifier genes - of Thl7 differentiation.
- the ranking was based on the following features: (a) whether the gene encoding the regulator belonged to the Thl7 microarray signature (comparing to other CD4+ T cells (Wei et al,, in Immunity vol. 30 155-167 (2009)), see Methods described herein); (b) whether the regulator was predicted to target key Thl7 molecules (IL-17, 1L-21, IL23r, and ROR-yt); (c) whether the regulator was detected based on both perturbation and physical binding data from the IPA software; (d) whether the regulator was included in the network using a cutoff of at least 10 target genes; (e) whether the gene encoding for the regulator was significantly induced in the Thl7 time course.
- the regulators were ordered lexicographically by the above features according to the order: a, b, c, d, (sum of e and f), g - that is, first sort according to a then break ties according to b, and so on. Genes that are not over-expressed during at least one time point were excluded. As an exception, predicted regulators (feature d) that had additional external validation (feature f) were retained. To validate this ranking, a supervised test was used: 74 regulators that were previously associated with Thl7 differentiation were manually annotated.
- ST A Nanostring- CodeSet specific, 14 cycle Specific Target Amplification
- Nanostring nCounter data analysis For each sample, the count values were divided by the sum of counts that were assigned to a set of control genes that showed no change (in time or between treatments) in the microarray data (18 genes altogether). For each condition, a change fold ratio was computed, comparing to at least three different control samples treated with non-targeting (NT) siRNAs. The results of all pairwise comparisons (i.e. AxB pairs for A repeats of the condition and B control (NT) samples) were then pooled together: a substantial fold change (above a threshold value t) in the same direction (up/ down regulation) in more than half of the pairwise comparisons was required.
- NT non-targeting
- the threshold t was determined as max ⁇ dl, d2 ⁇ , where dl is the mean+std in the absolute log fold change between all pairs of matching NT samples (i.e., form the same batch and the same time point; dl ::: T .66), and where d ' 2 is the mean + 1.645 times the standard deviation in the absolute log fold change shown by the 18 control genes (determined, separately for every comparison by taking all the I SxAxB values; corresponding to p ⁇ 0.05, under assumption of normality). All pairwise comparisons in whic both NT and knockdown samples had low counts before normalization ( ⁇ 100) were ignored.
- mRNA measurements on the Fluidigm BioMark HD cDNA from validated knockdowns was prepared for quantification on the Fluidigm BioMark HD. Briefly, 5 ⁇ , ⁇ of TaqMan PreAmp Master Mix (Iiivitrogen), 1 ⁇ of pooled mixed primers (500 nM each, see Table S6.1 for primers), and .1.5 ⁇ . ⁇ of water were added to 2.5 ⁇ , of knockdown validated cDNA and 14 cycles of STA were performed according to the manufacturer's recommendations.
- an Exonuclease I digestion (New England Biosystems) was performed to remove unincorporated primers by adding 0.8 ( iiL Exonuclease I, 0.4 ⁇ Exonuclease I Reaction Buffer and 2.8 ⁇ water to each sample, followed by vortexing, centrifuging and heating the sample to 37°C for 30 minutes. After a 15 minute 80°C heat inactivation, the amplified sample was diluted 1 :5 in Buffer TE.
- Fluidigm data analysis For each sample, the Ct values were subtracted from the geometric mean of the Ct values assigned to a set of four housekeeping genes. For each condition, a fold change ratio was computed, comparing to at least three different control samples treated with non-targeting (NT) siRNAs. The results of all pairwise comparisons ⁇ i.e. AxB pairs for A repeats of the condition and B control (NT) samples) were then pooled together: a substantial difference between the normalized Ct values (above a threshold value) in the same direction (up/ down regulation) in more tha half of the pairwise comparisons was required.
- NT non-targeting
- RNA-Seq Validated single stranded cDNAs from the NW-mediated knockdowns were converted to double stranded DNA using the NEBNext mRNA Second Strand Synthesis Module (New England BioLabs) according to the manufacturer's recommendations. The samples were then cleaned using 0.9x SPRI beads (Beckman Coulter). Libraries were prepared using the Nextera XT DNA Sample Prep Kit (Illimiina), quantified, pooled, and then sequenced on the HiSeq 2500 (Iilimmia) to an average depth 20M reads.
- RNA-seq data analysis a Bowtie index based on the UCSC known Gene transcriptome (Fujita, P. A. et al. The UCSC Genome Browser database: update 201 1. Nucleic Acids Res. 39, D876-882, doi: 10.1093/nar/gkq963 (2011)) was created, and paired-end reads were aligned directly to this index using Bowtie (Langmead, B,, Trapnell, C, Pop, M. & Salzberg, S. L. Ultrafast and memory-efficient alignment of short DN A sequences to the human genome. Genome Biol 10, R25, doi: 10.1186/gb-2009-10-3-r25 (2009)).
- RSEM vl .l l
- BMC Bioinformatics 12, 323, doi: 10.1186/147.1-2105-12-323 (201 1) was ran with default parameters on these alignments to estimate expression levels.
- RSEM's gene level expression estimates (tau) were multiplied by 1 ,000,000 to obtain transcript per million (TPM) estimates for each gene.
- TPM transcript per million
- Quantile normalization was used to further normalize the TPM values within each batch of samples. For each condition, a fold change ratio was computed, comparing to at least two different control samples treated with nontargeting (NT) siRNAs.
- RNA-seq A hypergeometric test was used to evaluate the overlap between the predicted network model (Fig. 2) and the knockdown effects measured by RNA-seq (Fig. 4d). As background, all of the genes that appeared in the microarray data (and hence 20 have the potential to be included in the network) were used. As an additional test, the Wilcoxon -Mann- Whitney rank-sum test was used, comparing the absolute log fold-changes of genes in the annotated set to the entire set of genes (using the same background as before). The rank-sum test does not require setting a significance threshold; instead, it considers the fold change values of all the genes. The p-values produced by the rank-sum test were lower (i.e., more significant) than in the hypergeometric test, and therefore, in Fig. 4c, only the more stringent (hypergeometric) p- values were reported.
- ChlP-seq reads were aligned to the NCBI Build 37 (UCSC mm9) of the mouse genome using Bowtie (Langmead, B., Traptiell, C, Pop, M & Salzberg, S. L. in Genome Biol Vol. 10 R25 (2009)). Enriched binding regions (peaks) were detected using MACS (Zhang, Y. et al. in Genome Biol Vol. 9 R.137 (2008)) with a pvalue cutoff of 10 " . A peak was associated with a gene if it falls in proximity to its 5' end (! Okb upstream and lkb downstream from transcription start site) or within the gene's body. The RefSeq transcript annotations for gene's coordinates were used.
- the background probability in sets (i)— (vii) is set to the overall length of the region (in bp) divided by the overall length of the genome.
- the background probability in sets (viii)— (ix) is set to the overall length of the region divided by the overall length of annotated genomic regions: this includes annotated regulator ⁇ ?
- regions (as defined in sets i, and ii), regions annotated as proximal to genes (using the definitions from set v-vii), carry a histone mark in Thl7 cells (using the definition from set viii), or bound by transcription regulators in Thl7 ceils (using the definitions from set ix).
- Thl7 signatures genes Using literature microarray data for deriving a Thl 7 signature and for identifying genes responsive to Th 17 -related perturbations: To define the Thl7 signatures genes, the gene expression data from Wei et al., in Immunity, vol. 30 155-167 (2009) was downloaded and analyzed, and the data was preprocessed using the RMA algorithm, followed by quantile normalization using the default parameters in the ExpressionFileCreator module of the 23 GenePattero suite (Reich, M. et al. GenePatte n 2.0. Nat. Genet. 38, 500-501, doi:10.1Q38/ng0506-500 (2006)).
- ADAM 10 102 a disintegrin and metallopeptidase domain 10
- ADAM 17 6868 a disintegrin and metailopeptidase domain 17
- ANKHD1 54882 ankyrin repeat and KH domain containing 1
- ARJD3A 1820 AT rich interactive domain 3A (BRIGHT-like)
- ARL5A 26225 ADP-ribosylation factor-like 5A
- B4GALT1 2683 UDP-Gal:betaGlcNAc beta 1,4- galactouSyltransferase, polypeptide 1
- BCL6 604 B-cell leukemia/lwnphoma 6
- CD3D 915 CD3 antigen, delta polypeptide CD3G 917 CD3 antigen, gamma polypeptide
- CD74 972 CD74 antigen (invari ant polypeptide of major
- CDK5 1020 cyclin-dependent kinase 5
- CDKN3 1033 cyclin-dependent kinase inhibitor 3
- CEBPB 1051 CCAAT/enhancer binding protein (C/EBP), beta
- CHMP2A 27243 charged multivesicular body protein 2A
- CSF2 1437 colony stimulating factor 2 (granulocyte-macrophage)
- DAPP1 27071 dual adaptor for phosphotyrosine and 3-phosph.oinositides
- DCLK1 9201 doublecortm-like kinase 1
- DDR 1 780 discoidin domain receptor family, member 1
- EIF2AK2 5610 eukaryotic translation initiation factor 2-aipha kinase 2 EL 3 2004 ELK3, member of ETS oncogene fami ly
- ETS1 21 13 E26 avian leukemia oncogene 1 , 5' domain
- ETV6 2120 ets variant gene 6 (TEL oncogene)
- FES 2242 feline sarcoma oncogene
- FUS 2521 fusion derived from t(12;16) malignant liposarcoma
- GAP43 2596 growth associated protein 43
- GEM 2669 GTP binding protein (gene overexpressed in skeletal muscle)
- HINT 3 135114 histidine triad nucleotide binding protein 3
- HLA-A 3105 major histocompatibility complex, class I, A
- IFIH1 64135 interferon induced with helicase C domain 1
- IL10RA 3587 interleukin 10 receptor, alpha
- IL12RB1 3594 interleukin 12 receptor, beta 1
- IL15RA 3601 interleukin 15 receptor, alpha chain
- IL1R1 3554 interleukin 1 receptor, type I
- IL27RA 9466 interleukin 27 receptor, alpha
- IL2RA 3559 interleukin 2 receptor, alpha chain
- IL2RB 3560 interleukin 2 receptor, beta chain
- IL2RG 3561 interleukin 2 receptor, gamma chain
- IL4R 3566 interleukin 4 receptor, alpha
- IRF3 3661 interferon regulatory factor 3
- ITGB1 3688 integrin beta 1 (fibronectm receptor beta)
- LILRB3, 1 1025, 11006 leukocyte immunoglobulin-like receptor, subfamily B (with
- MAP4 2 5871 mitogen-activated protem kinase kinase kinase kinase kinase 2
- MAP4K3 8491 mitogen-activated protein kinase kinase kinase kinase kinase 3
- MBNL1 41 54 muscieblind-Iike 1 (Drosophila)
- MEN1 4221 multiple endocrine neoplasia 1
- MOLL 1 1343 monoglyceride lipase
Landscapes
- Health & Medical Sciences (AREA)
- Life Sciences & Earth Sciences (AREA)
- Chemical & Material Sciences (AREA)
- Organic Chemistry (AREA)
- Engineering & Computer Science (AREA)
- Genetics & Genomics (AREA)
- Immunology (AREA)
- Proteomics, Peptides & Aminoacids (AREA)
- Molecular Biology (AREA)
- General Health & Medical Sciences (AREA)
- Zoology (AREA)
- Wood Science & Technology (AREA)
- Biotechnology (AREA)
- Biochemistry (AREA)
- Bioinformatics & Cheminformatics (AREA)
- Biophysics (AREA)
- Analytical Chemistry (AREA)
- General Engineering & Computer Science (AREA)
- Biomedical Technology (AREA)
- Physics & Mathematics (AREA)
- Microbiology (AREA)
- Medicinal Chemistry (AREA)
- Pathology (AREA)
- Urology & Nephrology (AREA)
- Hematology (AREA)
- Cell Biology (AREA)
- Plant Pathology (AREA)
- Animal Behavior & Ethology (AREA)
- Pharmacology & Pharmacy (AREA)
- Veterinary Medicine (AREA)
- Public Health (AREA)
- General Physics & Mathematics (AREA)
- Food Science & Technology (AREA)
- Virology (AREA)
- Epidemiology (AREA)
- Nuclear Medicine, Radiotherapy & Molecular Imaging (AREA)
- General Chemical & Material Sciences (AREA)
- Chemical Kinetics & Catalysis (AREA)
- Measuring Or Testing Involving Enzymes Or Micro-Organisms (AREA)
- Medicines That Contain Protein Lipid Enzymes And Other Medicines (AREA)
Abstract
Description


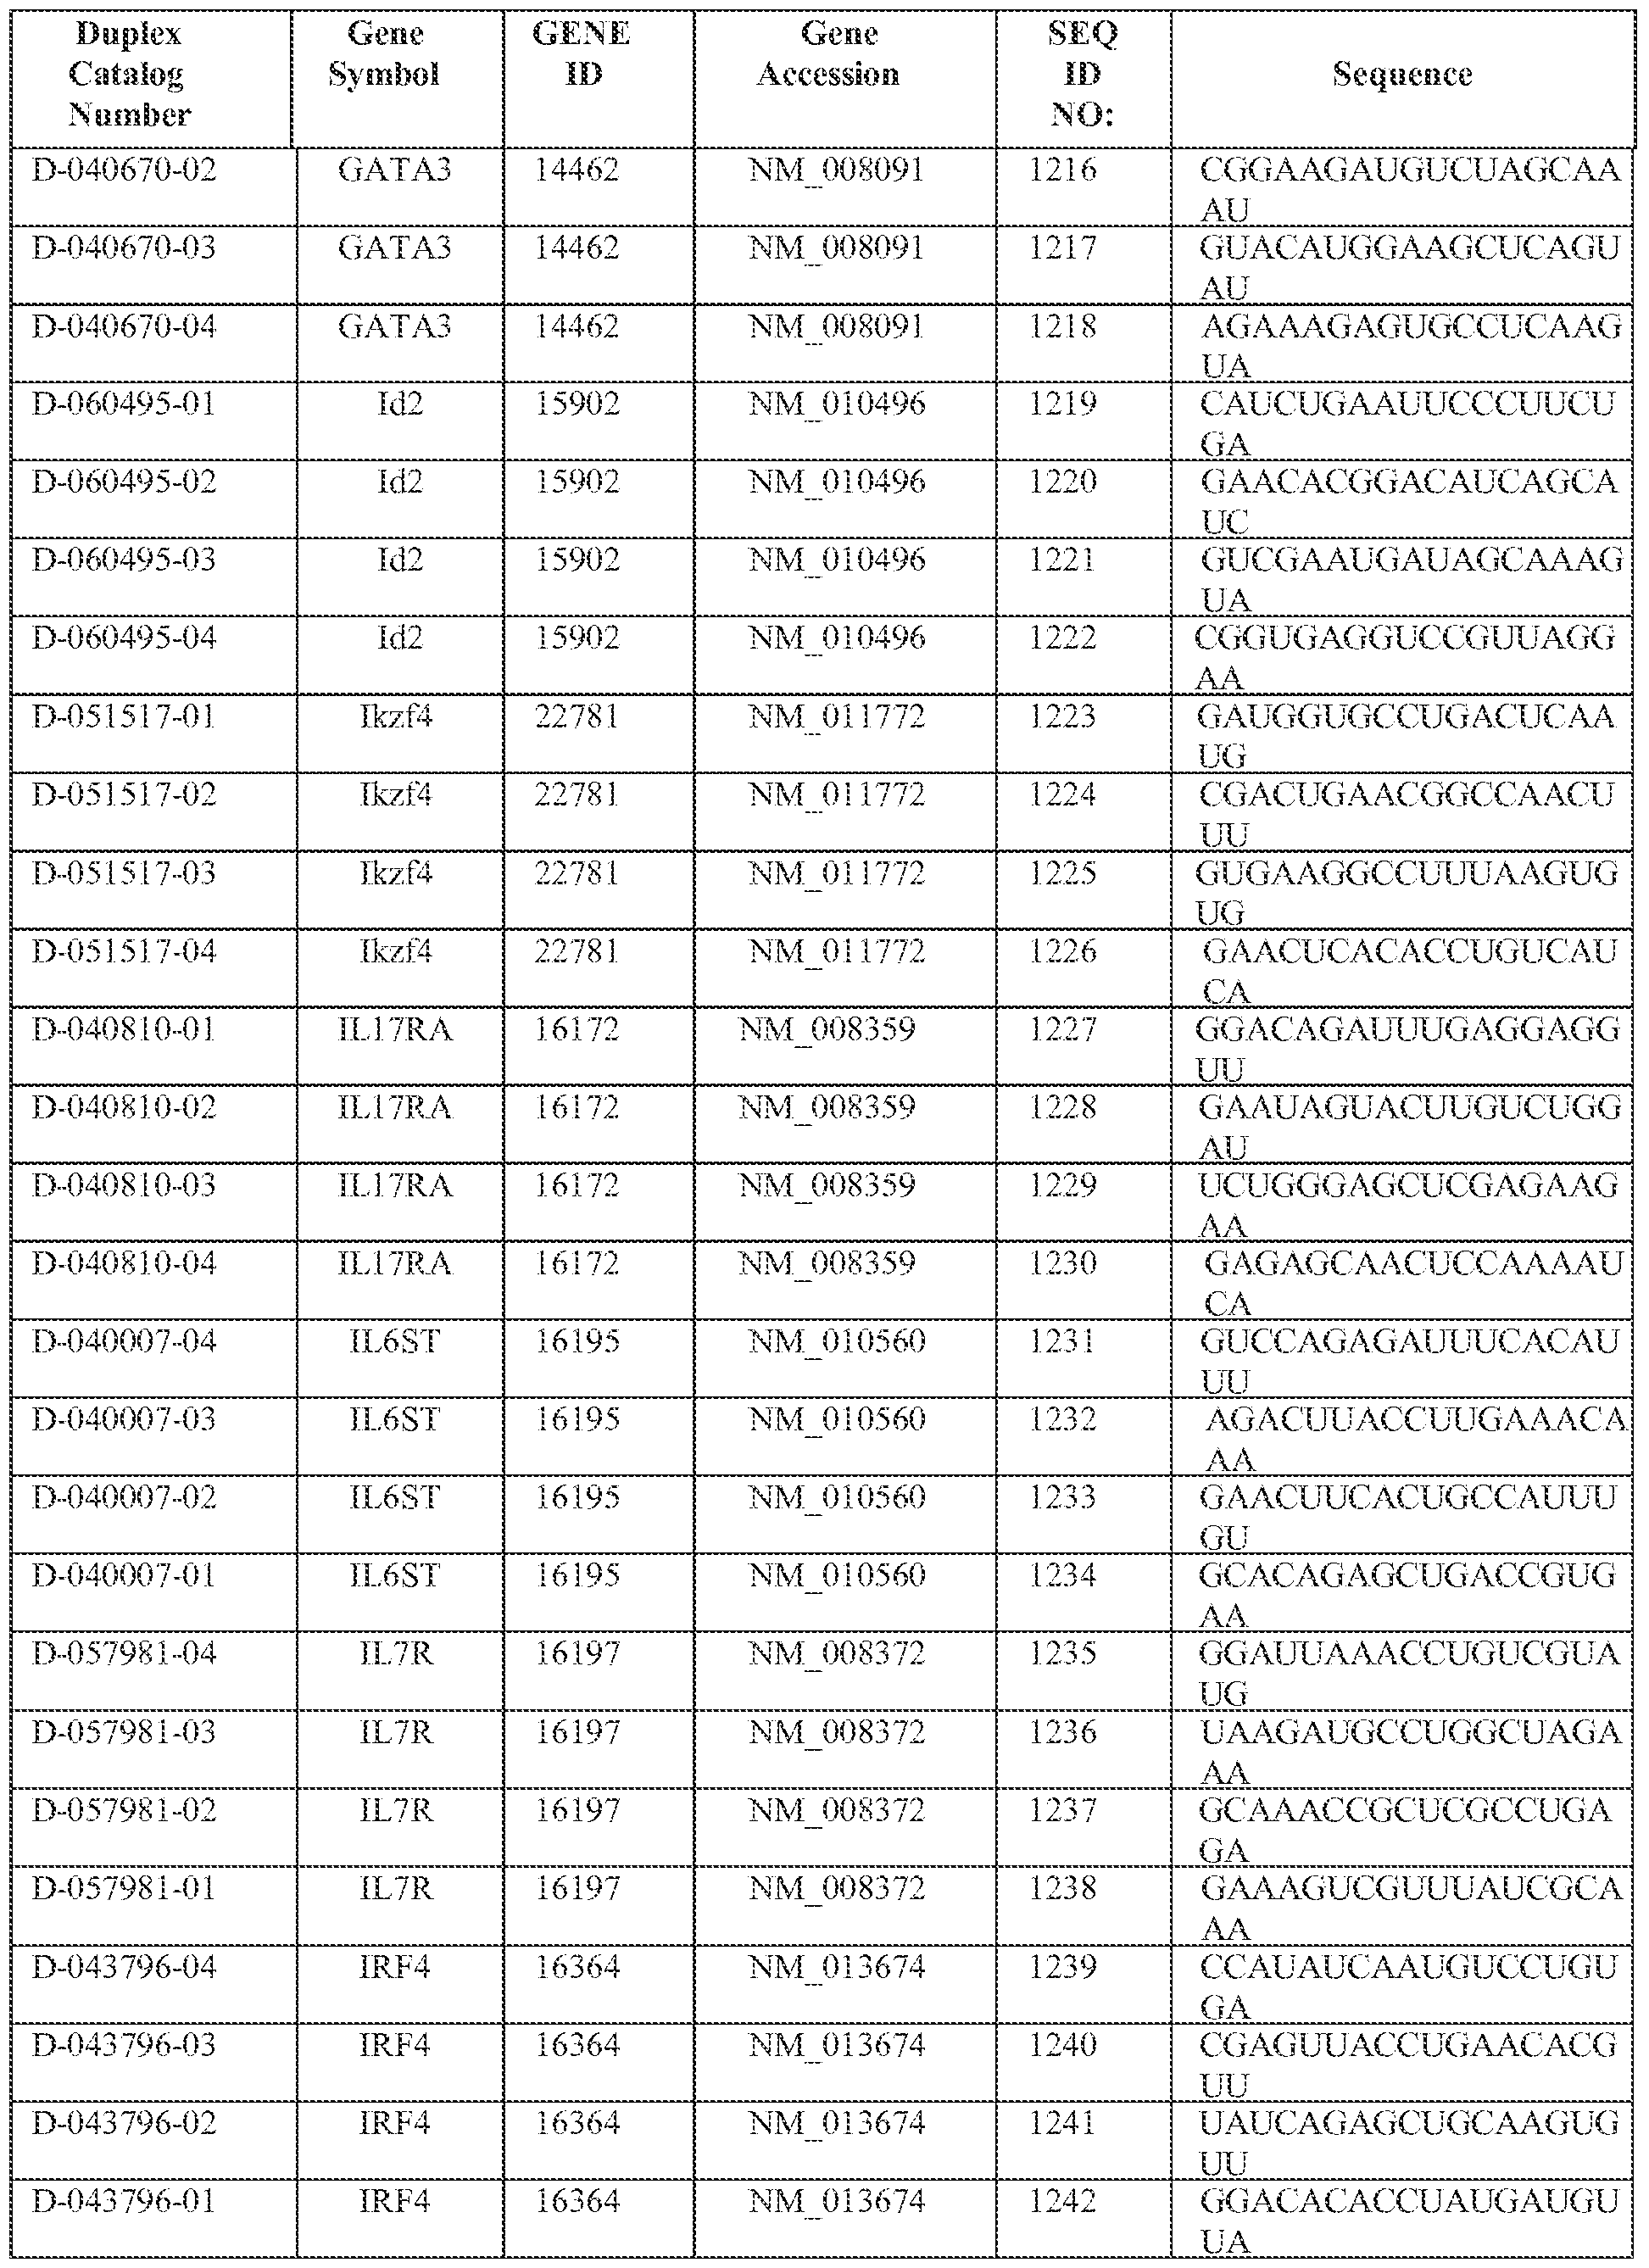


Claims
Priority Applications (8)
| Application Number | Priority Date | Filing Date | Title |
|---|---|---|---|
| CN201580020348.XA CN106817904A (en) | 2014-02-27 | 2015-02-26 | T cell balance gene expression, composition of matter and its application method |
| AU2015222944A AU2015222944A1 (en) | 2014-02-27 | 2015-02-26 | T cell balance gene expression, compositions of matters and methods of use thereof |
| EP15709048.1A EP3110971B1 (en) | 2014-02-27 | 2015-02-26 | T cell balance gene expression and methods of use thereof |
| EP18212362.0A EP3514246B1 (en) | 2014-02-27 | 2015-02-26 | T cell balance gene expression and methods of use thereof |
| CA2940653A CA2940653A1 (en) | 2014-02-27 | 2015-02-26 | T cell balance gene expression, compositions of matters and methods of use thereof |
| JP2016554339A JP2017508457A (en) | 2014-02-27 | 2015-02-26 | T cell balance gene expression, composition and method of use thereof |
| US15/245,748 US11209440B2 (en) | 2014-02-27 | 2016-08-24 | T cell balance gene expression, compositions of matters and methods of use thereof |
| US16/675,398 US20200081017A1 (en) | 2014-02-27 | 2019-11-06 | T cell balance gene expression, compositions of matters and methods of use thereof |
Applications Claiming Priority (2)
| Application Number | Priority Date | Filing Date | Title |
|---|---|---|---|
| US201461945641P | 2014-02-27 | 2014-02-27 | |
| US61/945,641 | 2014-02-27 |
Related Child Applications (1)
| Application Number | Title | Priority Date | Filing Date |
|---|---|---|---|
| US15/245,748 Continuation-In-Part US11209440B2 (en) | 2014-02-27 | 2016-08-24 | T cell balance gene expression, compositions of matters and methods of use thereof |
Publications (2)
| Publication Number | Publication Date |
|---|---|
| WO2015130968A2 true WO2015130968A2 (en) | 2015-09-03 |
| WO2015130968A3 WO2015130968A3 (en) | 2015-10-15 |
Family
ID=52633704
Family Applications (1)
| Application Number | Title | Priority Date | Filing Date |
|---|---|---|---|
| PCT/US2015/017826 WO2015130968A2 (en) | 2014-02-27 | 2015-02-26 | T cell balance gene expression, compositions of matters and methods of use thereof |
Country Status (7)
| Country | Link |
|---|---|
| US (2) | US11209440B2 (en) |
| EP (2) | EP3514246B1 (en) |
| JP (1) | JP2017508457A (en) |
| CN (1) | CN106817904A (en) |
| AU (1) | AU2015222944A1 (en) |
| CA (1) | CA2940653A1 (en) |
| WO (1) | WO2015130968A2 (en) |
Cited By (21)
| Publication number | Priority date | Publication date | Assignee | Title |
|---|---|---|---|---|
| WO2016138488A2 (en) | 2015-02-26 | 2016-09-01 | The Broad Institute Inc. | T cell balance gene expression, compositions of matters and methods of use thereof |
| WO2017075465A1 (en) | 2015-10-28 | 2017-05-04 | The Broad Institute Inc. | Compositions and methods for evaluating and modulating immune responses by detecting and targeting gata3 |
| WO2017075294A1 (en) * | 2015-10-28 | 2017-05-04 | The Board Institute Inc. | Assays for massively combinatorial perturbation profiling and cellular circuit reconstruction |
| WO2017075451A1 (en) | 2015-10-28 | 2017-05-04 | The Broad Institute Inc. | Compositions and methods for evaluating and modulating immune responses by detecting and targeting pou2af1 |
| WO2017075478A2 (en) | 2015-10-28 | 2017-05-04 | The Broad Institute Inc. | Compositions and methods for evaluating and modulating immune responses by use of immune cell gene signatures |
| WO2017087708A1 (en) | 2015-11-19 | 2017-05-26 | The Brigham And Women's Hospital, Inc. | Lymphocyte antigen cd5-like (cd5l)-interleukin 12b (p40) heterodimers in immunity |
| US20180016314A1 (en) * | 2016-07-12 | 2018-01-18 | Children's Hospital Medical Center | Treatment of disease via transcription factor modulation |
| WO2018049025A2 (en) | 2016-09-07 | 2018-03-15 | The Broad Institute Inc. | Compositions and methods for evaluating and modulating immune responses |
| WO2018067991A1 (en) | 2016-10-07 | 2018-04-12 | The Brigham And Women's Hospital, Inc. | Modulation of novel immune checkpoint targets |
| WO2018132518A1 (en) | 2017-01-10 | 2018-07-19 | Juno Therapeutics, Inc. | Epigenetic analysis of cell therapy and related methods |
| CN108535492A (en) * | 2018-03-27 | 2018-09-14 | 重庆医科大学 | Purposes of the AIM as biomarker in diagnosis, prognosis or monitoring pyemia |
| WO2018195486A1 (en) | 2017-04-21 | 2018-10-25 | The Broad Institute, Inc. | Targeted delivery to beta cells |
| WO2020102721A1 (en) * | 2018-11-16 | 2020-05-22 | Rapa Therapeutics, Llc | Immune monitoring of neuro-inflammatory amyotrophic lateral sclerosis (als) |
| WO2020191079A1 (en) | 2019-03-18 | 2020-09-24 | The Broad Institute, Inc. | Compositions and methods for modulating metabolic regulators of t cell pathogenicity |
| EP3634465A4 (en) * | 2017-05-25 | 2021-01-20 | The Broad Institute, Inc. | Lymphocyte antigen cd5like (cd5l) monomer, homodimer, and interleukin 12b (p40) heterodimer antagonists and methods of use thereof |
| EP3630156A4 (en) * | 2017-05-25 | 2021-03-31 | The Broad Institute, Inc. | Lymphocyte antigen cd5-like (cd5l) monomer, homodimer, and interleukin 12b (p40) heterodimer agonists and methods of use thereof |
| US11209440B2 (en) | 2014-02-27 | 2021-12-28 | The Broad Institute, Inc. | T cell balance gene expression, compositions of matters and methods of use thereof |
| US11332736B2 (en) | 2017-12-07 | 2022-05-17 | The Broad Institute, Inc. | Methods and compositions for multiplexing single cell and single nuclei sequencing |
| CN115181736A (en) * | 2022-01-07 | 2022-10-14 | 中国科学院海洋研究所 | Proteinase PCK capable of combining lipopolysaccharide and preparation and application thereof |
| US11732257B2 (en) | 2017-10-23 | 2023-08-22 | Massachusetts Institute Of Technology | Single cell sequencing libraries of genomic transcript regions of interest in proximity to barcodes, and genotyping of said libraries |
| US11981922B2 (en) | 2019-10-03 | 2024-05-14 | Dana-Farber Cancer Institute, Inc. | Methods and compositions for the modulation of cell interactions and signaling in the tumor microenvironment |
Families Citing this family (17)
| Publication number | Priority date | Publication date | Assignee | Title |
|---|---|---|---|---|
| SG11201702060VA (en) * | 2014-09-15 | 2017-04-27 | Abvitro Inc | High-throughput nucleotide library sequencing |
| TW201930340A (en) | 2017-12-18 | 2019-08-01 | 美商尼恩醫療公司 | Neoantigens and uses thereof |
| EP3502279A1 (en) * | 2017-12-20 | 2019-06-26 | Koninklijke Philips N.V. | Assessment of mapk-ap 1 cellular signaling pathway activity using mathematical modelling of target gene expression |
| WO2019133874A1 (en) * | 2017-12-31 | 2019-07-04 | Berkeley Lights, Inc. | General functional assay |
| CN109710959B (en) * | 2018-08-23 | 2023-08-18 | 上海市水利工程设计研究院有限公司 | Numerical simulation method for water resource drainage scheduling water body replacement effect |
| EP3942097A4 (en) * | 2019-03-22 | 2024-03-27 | Univ California | Chmp2a as a regulator of natural killer cell-mediated activity |
| CN113924119A (en) * | 2019-05-31 | 2022-01-11 | 国立大学法人大阪大学 | Novel therapeutic agent for digestive organ cancer and method for screening same |
| CN110161547B (en) * | 2019-06-26 | 2022-09-16 | 哈尔滨工程大学 | Medium-long baseline ambiguity resolution method of adaptive ionosphere estimation model |
| CN110412639B (en) * | 2019-07-29 | 2020-12-01 | 中国科学院近代物理研究所 | Method for obtaining ion beam irradiation scheme based on nano-dosimetry |
| CN110473591B (en) * | 2019-08-20 | 2022-09-27 | 西南林业大学 | Gene network function module mining and analyzing method based on quantum computing |
| WO2021076744A1 (en) * | 2019-10-15 | 2021-04-22 | The Regents Of The University Of California | Gene targets for manipulating t cell behavior |
| CN111849866B (en) * | 2020-07-15 | 2022-06-24 | 华南农业大学 | Application of H3K27me3 in regulation of FoxO1 gene expression in porcine ovarian granulosa cells |
| CN112294946B (en) * | 2020-10-28 | 2023-02-10 | 中国人民解放军空军军医大学 | Pharmaceutical application of soluble recombinant protein CD226-ECD in inhibition of allergic rhinitis asthma syndrome |
| WO2023023587A2 (en) * | 2021-08-18 | 2023-02-23 | The Board Of Trustees Of The Leland Stanford Junior University | Targeting gpr65 for the treatment of cancer in overweight and obese individuals |
| CN114672460B (en) * | 2021-12-21 | 2023-06-23 | 中国人民解放军军事科学院军事医学研究院 | Preparation method and application of CD 44-targeted heterogeneous CIC cell model |
| CN114410778B (en) * | 2021-12-29 | 2024-03-19 | 中南大学湘雅医院 | Application of PF543 in preparation of PD-L1/PD-1 monoclonal antibody tumor immunotherapy medicament |
| WO2023225629A2 (en) * | 2022-05-20 | 2023-11-23 | The Children's Medical Center Corporation | Methods of generating natural killer cells from pluripotent stem cells and compositions thereof |
Family Cites Families (51)
| Publication number | Priority date | Publication date | Assignee | Title |
|---|---|---|---|---|
| US4683195A (en) | 1986-01-30 | 1987-07-28 | Cetus Corporation | Process for amplifying, detecting, and/or-cloning nucleic acid sequences |
| US4683202A (en) | 1985-03-28 | 1987-07-28 | Cetus Corporation | Process for amplifying nucleic acid sequences |
| US6040138A (en) | 1995-09-15 | 2000-03-21 | Affymetrix, Inc. | Expression monitoring by hybridization to high density oligonucleotide arrays |
| US5837832A (en) | 1993-06-25 | 1998-11-17 | Affymetrix, Inc. | Arrays of nucleic acid probes on biological chips |
| US5446603A (en) | 1993-12-21 | 1995-08-29 | Dictaphone Corporation | Method of retrieving messages at selected times from a digital audio tape |
| US5807522A (en) | 1994-06-17 | 1998-09-15 | The Board Of Trustees Of The Leland Stanford Junior University | Methods for fabricating microarrays of biological samples |
| US5545531A (en) | 1995-06-07 | 1996-08-13 | Affymax Technologies N.V. | Methods for making a device for concurrently processing multiple biological chip assays |
| KR19990022612A (en) | 1995-06-08 | 1999-03-25 | 퍼니스 챨스 엠 | DNA Extraction Method and Extraction Apparatus |
| US6114122A (en) | 1996-03-26 | 2000-09-05 | Affymetrix, Inc. | Fluidics station with a mounting system and method of using |
| US6087102A (en) | 1998-01-07 | 2000-07-11 | Clontech Laboratories, Inc. | Polymeric arrays and methods for their use in binding assays |
| US6406921B1 (en) | 1998-07-14 | 2002-06-18 | Zyomyx, Incorporated | Protein arrays for high-throughput screening |
| EP1105458B1 (en) | 1998-08-10 | 2007-02-21 | Genomic Solutions, Inc. | A thermal/fluidic cycling device for the purpose of nucleic acid hybridization |
| US6420114B1 (en) | 1999-12-06 | 2002-07-16 | Incyte Genomics, Inc. | Microarray hybridization chamber |
| WO2001045843A2 (en) | 1999-12-22 | 2001-06-28 | Gene Logic, Inc. | Flow-thru chip cartridge, chip holder, system and method thereof |
| US6548256B2 (en) | 2000-07-14 | 2003-04-15 | Eppendorf 5 Prime, Inc. | DNA isolation method and kit |
| WO2003065045A2 (en) * | 2002-02-01 | 2003-08-07 | Bayer Healthcare Ag | Diagnostics and therapeutics for diseases associated with the gpr65 receptor |
| JP2006507921A (en) | 2002-06-28 | 2006-03-09 | プレジデント・アンド・フェロウズ・オブ・ハーバード・カレッジ | Method and apparatus for fluid dispersion |
| US7041481B2 (en) | 2003-03-14 | 2006-05-09 | The Regents Of The University Of California | Chemical amplification based on fluid partitioning |
| US20100022414A1 (en) | 2008-07-18 | 2010-01-28 | Raindance Technologies, Inc. | Droplet Libraries |
| US20100137163A1 (en) | 2006-01-11 | 2010-06-03 | Link Darren R | Microfluidic Devices and Methods of Use in The Formation and Control of Nanoreactors |
| WO2007089541A2 (en) | 2006-01-27 | 2007-08-09 | President And Fellows Of Harvard College | Fluidic droplet coalescence |
| WO2008063227A2 (en) | 2006-05-11 | 2008-05-29 | Raindance Technologies, Inc. | Microfluidic devices |
| WO2008101354A1 (en) * | 2007-02-22 | 2008-08-28 | Merck Frosst Canada Ltd | Gpr65 as a therapeutic target in allergic airway inflammation |
| JP5546112B2 (en) | 2008-07-07 | 2014-07-09 | キヤノン株式会社 | Ophthalmic imaging apparatus and ophthalmic imaging method |
| US8557746B2 (en) | 2009-04-01 | 2013-10-15 | The General Hospital Corporation | High throughput screens for small-molecule inhibitors of the nuclear receptor-like pathway regulating multidrug resistance in fungi |
| US20130225427A1 (en) * | 2010-09-08 | 2013-08-29 | Sanford-Burnham Medical Research Institute | Method for prediction of response to immune mediated disease therapeutics |
| EP2622103B2 (en) | 2010-09-30 | 2022-11-16 | Bio-Rad Laboratories, Inc. | Sandwich assays in droplets |
| EP3859011A1 (en) | 2011-02-11 | 2021-08-04 | Bio-Rad Laboratories, Inc. | Methods for forming mixed droplets |
| US20140221648A1 (en) * | 2011-06-27 | 2014-08-07 | Galderma Research & Developement | Th17 differentiation markers for acne and uses thereof |
| WO2013000871A1 (en) * | 2011-06-27 | 2013-01-03 | Galderma Research & Development | New th-17 differentiation markers for rosacea and uses thereof |
| KR20230065381A (en) | 2012-07-25 | 2023-05-11 | 더 브로드 인스티튜트, 인코퍼레이티드 | Inducible dna binding proteins and genome perturbation tools and applications thereof |
| DK2931898T3 (en) | 2012-12-12 | 2016-06-20 | Massachusetts Inst Technology | CONSTRUCTION AND OPTIMIZATION OF SYSTEMS, PROCEDURES AND COMPOSITIONS FOR SEQUENCE MANIPULATION WITH FUNCTIONAL DOMAINS |
| EP2931899A1 (en) | 2012-12-12 | 2015-10-21 | The Broad Institute, Inc. | Functional genomics using crispr-cas systems, compositions, methods, knock out libraries and applications thereof |
| DK2898075T3 (en) | 2012-12-12 | 2016-06-27 | Broad Inst Inc | CONSTRUCTION AND OPTIMIZATION OF IMPROVED SYSTEMS, PROCEDURES AND ENZYME COMPOSITIONS FOR SEQUENCE MANIPULATION |
| PL2771468T3 (en) | 2012-12-12 | 2015-07-31 | Broad Inst Inc | Engineering of systems, methods and optimized guide compositions for sequence manipulation |
| IL293526A (en) | 2012-12-12 | 2022-08-01 | Harvard College | C delivery, engineering and optimization of systems, methods and compositions for sequence manipulation and therapeutic applications |
| US8697359B1 (en) | 2012-12-12 | 2014-04-15 | The Broad Institute, Inc. | CRISPR-Cas systems and methods for altering expression of gene products |
| WO2014093694A1 (en) | 2012-12-12 | 2014-06-19 | The Broad Institute, Inc. | Crispr-cas nickase systems, methods and compositions for sequence manipulation in eukaryotes |
| EP2940140B1 (en) | 2012-12-12 | 2019-03-27 | The Broad Institute, Inc. | Engineering of systems, methods and optimized guide compositions for sequence manipulation |
| EP2840140B2 (en) | 2012-12-12 | 2023-02-22 | The Broad Institute, Inc. | Crispr-Cas based method for mutation of prokaryotic cells |
| EP3434776A1 (en) | 2012-12-12 | 2019-01-30 | The Broad Institute, Inc. | Methods, models, systems, and apparatus for identifying target sequences for cas enzymes or crispr-cas systems for target sequences and conveying results thereof |
| KR20150126882A (en) * | 2013-02-27 | 2015-11-13 | 더 브로드 인스티튜트, 인코퍼레이티드 | T cell balance gene expression, compositions of matters and methods of use thereof |
| US11332719B2 (en) | 2013-03-15 | 2022-05-17 | The Broad Institute, Inc. | Recombinant virus and preparations thereof |
| CN105492611A (en) | 2013-06-17 | 2016-04-13 | 布罗德研究所有限公司 | Optimized CRISPR-CAS double nickase systems, methods and compositions for sequence manipulation |
| EP3011031B1 (en) | 2013-06-17 | 2020-09-30 | The Broad Institute Inc. | Delivery and use of the crispr-cas systems, vectors and compositions for hepatic targeting and therapy |
| EP3011032B1 (en) | 2013-06-17 | 2019-10-16 | The Broad Institute, Inc. | Delivery, engineering and optimization of systems, methods and compositions for targeting and modeling diseases and disorders of post mitotic cells |
| WO2014204727A1 (en) | 2013-06-17 | 2014-12-24 | The Broad Institute Inc. | Functional genomics using crispr-cas systems, compositions methods, screens and applications thereof |
| EP3011029B1 (en) | 2013-06-17 | 2019-12-11 | The Broad Institute, Inc. | Delivery, engineering and optimization of tandem guide systems, methods and compositions for sequence manipulation |
| AU2014281031B2 (en) | 2013-06-17 | 2020-05-21 | Massachusetts Institute Of Technology | Delivery, use and therapeutic applications of the CRISPR-Cas systems and compositions for targeting disorders and diseases using viral components |
| EP3011035B1 (en) | 2013-06-17 | 2020-05-13 | The Broad Institute, Inc. | Assay for quantitative evaluation of target site cleavage by one or more crispr-cas guide sequences |
| AU2015222944A1 (en) | 2014-02-27 | 2016-09-08 | Massachusetts Institute Of Technology | T cell balance gene expression, compositions of matters and methods of use thereof |
-
2015
- 2015-02-26 AU AU2015222944A patent/AU2015222944A1/en not_active Abandoned
- 2015-02-26 JP JP2016554339A patent/JP2017508457A/en active Pending
- 2015-02-26 CA CA2940653A patent/CA2940653A1/en not_active Abandoned
- 2015-02-26 EP EP18212362.0A patent/EP3514246B1/en active Active
- 2015-02-26 CN CN201580020348.XA patent/CN106817904A/en active Pending
- 2015-02-26 EP EP15709048.1A patent/EP3110971B1/en active Active
- 2015-02-26 WO PCT/US2015/017826 patent/WO2015130968A2/en active Application Filing
-
2016
- 2016-08-24 US US15/245,748 patent/US11209440B2/en active Active
-
2019
- 2019-11-06 US US16/675,398 patent/US20200081017A1/en active Pending
Cited By (29)
| Publication number | Priority date | Publication date | Assignee | Title |
|---|---|---|---|---|
| US11209440B2 (en) | 2014-02-27 | 2021-12-28 | The Broad Institute, Inc. | T cell balance gene expression, compositions of matters and methods of use thereof |
| WO2016138488A2 (en) | 2015-02-26 | 2016-09-01 | The Broad Institute Inc. | T cell balance gene expression, compositions of matters and methods of use thereof |
| US11427869B2 (en) | 2015-02-26 | 2022-08-30 | The Broad Institute, Inc. | T cell balance gene expression, compositions of matters and methods of use thereof |
| WO2017075451A1 (en) | 2015-10-28 | 2017-05-04 | The Broad Institute Inc. | Compositions and methods for evaluating and modulating immune responses by detecting and targeting pou2af1 |
| WO2017075478A2 (en) | 2015-10-28 | 2017-05-04 | The Broad Institute Inc. | Compositions and methods for evaluating and modulating immune responses by use of immune cell gene signatures |
| WO2017075294A1 (en) * | 2015-10-28 | 2017-05-04 | The Board Institute Inc. | Assays for massively combinatorial perturbation profiling and cellular circuit reconstruction |
| US11214797B2 (en) | 2015-10-28 | 2022-01-04 | The Broad Institute, Inc. | Assays for massively combinatorial perturbation profiling and cellular circuit reconstruction |
| WO2017075465A1 (en) | 2015-10-28 | 2017-05-04 | The Broad Institute Inc. | Compositions and methods for evaluating and modulating immune responses by detecting and targeting gata3 |
| US11186825B2 (en) | 2015-10-28 | 2021-11-30 | The Broad Institute, Inc. | Compositions and methods for evaluating and modulating immune responses by detecting and targeting POU2AF1 |
| US11180730B2 (en) | 2015-10-28 | 2021-11-23 | The Broad Institute, Inc. | Compositions and methods for evaluating and modulating immune responses by detecting and targeting GATA3 |
| WO2017087708A1 (en) | 2015-11-19 | 2017-05-26 | The Brigham And Women's Hospital, Inc. | Lymphocyte antigen cd5-like (cd5l)-interleukin 12b (p40) heterodimers in immunity |
| US11001622B2 (en) | 2015-11-19 | 2021-05-11 | The Brigham And Women's Hospital, Inc. | Method of treating autoimmune disease with lymphocyte antigen CD5-like (CD5L) protein |
| US11884717B2 (en) | 2015-11-19 | 2024-01-30 | The Brigham And Women's Hospital, Inc. | Method of treating autoimmune disease with lymphocyte antigen CD5-like (CD5L) protein |
| US20180016314A1 (en) * | 2016-07-12 | 2018-01-18 | Children's Hospital Medical Center | Treatment of disease via transcription factor modulation |
| WO2018049025A2 (en) | 2016-09-07 | 2018-03-15 | The Broad Institute Inc. | Compositions and methods for evaluating and modulating immune responses |
| WO2018067991A1 (en) | 2016-10-07 | 2018-04-12 | The Brigham And Women's Hospital, Inc. | Modulation of novel immune checkpoint targets |
| WO2018132518A1 (en) | 2017-01-10 | 2018-07-19 | Juno Therapeutics, Inc. | Epigenetic analysis of cell therapy and related methods |
| US11821027B2 (en) | 2017-01-10 | 2023-11-21 | Juno Therapeutics, Inc. | Epigenetic analysis of cell therapy and related methods |
| WO2018195486A1 (en) | 2017-04-21 | 2018-10-25 | The Broad Institute, Inc. | Targeted delivery to beta cells |
| EP3630156A4 (en) * | 2017-05-25 | 2021-03-31 | The Broad Institute, Inc. | Lymphocyte antigen cd5-like (cd5l) monomer, homodimer, and interleukin 12b (p40) heterodimer agonists and methods of use thereof |
| EP3634465A4 (en) * | 2017-05-25 | 2021-01-20 | The Broad Institute, Inc. | Lymphocyte antigen cd5like (cd5l) monomer, homodimer, and interleukin 12b (p40) heterodimer antagonists and methods of use thereof |
| US11732257B2 (en) | 2017-10-23 | 2023-08-22 | Massachusetts Institute Of Technology | Single cell sequencing libraries of genomic transcript regions of interest in proximity to barcodes, and genotyping of said libraries |
| US11332736B2 (en) | 2017-12-07 | 2022-05-17 | The Broad Institute, Inc. | Methods and compositions for multiplexing single cell and single nuclei sequencing |
| CN108535492B (en) * | 2018-03-27 | 2019-02-12 | 重庆医科大学 | Purposes of the AIM as biomarker in diagnosis, prognosis or monitoring pyemia |
| CN108535492A (en) * | 2018-03-27 | 2018-09-14 | 重庆医科大学 | Purposes of the AIM as biomarker in diagnosis, prognosis or monitoring pyemia |
| WO2020102721A1 (en) * | 2018-11-16 | 2020-05-22 | Rapa Therapeutics, Llc | Immune monitoring of neuro-inflammatory amyotrophic lateral sclerosis (als) |
| WO2020191079A1 (en) | 2019-03-18 | 2020-09-24 | The Broad Institute, Inc. | Compositions and methods for modulating metabolic regulators of t cell pathogenicity |
| US11981922B2 (en) | 2019-10-03 | 2024-05-14 | Dana-Farber Cancer Institute, Inc. | Methods and compositions for the modulation of cell interactions and signaling in the tumor microenvironment |
| CN115181736A (en) * | 2022-01-07 | 2022-10-14 | 中国科学院海洋研究所 | Proteinase PCK capable of combining lipopolysaccharide and preparation and application thereof |
Also Published As
| Publication number | Publication date |
|---|---|
| US20160377631A1 (en) | 2016-12-29 |
| JP2017508457A (en) | 2017-03-30 |
| EP3110971B1 (en) | 2019-05-08 |
| US11209440B2 (en) | 2021-12-28 |
| AU2015222944A1 (en) | 2016-09-08 |
| EP3514246B1 (en) | 2021-11-17 |
| EP3514246A1 (en) | 2019-07-24 |
| CN106817904A (en) | 2017-06-09 |
| WO2015130968A3 (en) | 2015-10-15 |
| EP3110971A2 (en) | 2017-01-04 |
| CA2940653A1 (en) | 2015-09-03 |
| US20200081017A1 (en) | 2020-03-12 |
Similar Documents
| Publication | Publication Date | Title |
|---|---|---|
| US11209440B2 (en) | T cell balance gene expression, compositions of matters and methods of use thereof | |
| US10822587B2 (en) | T cell balance gene expression, compositions of matters and methods of use thereof | |
| US20210172020A1 (en) | Biomarkers predictive of therapeutic responsiveness to chimeric antigen receptor therapy and uses thereof | |
| US11427869B2 (en) | T cell balance gene expression, compositions of matters and methods of use thereof | |
| US10870885B2 (en) | Dendritic cell response gene expression, compositions of matters and methods of use thereof | |
| JP2021007406A (en) | High-throughput process for T-cell receptor target identification of natively paired T-cell receptor sequences | |
| Minervina et al. | Primary and secondary anti-viral response captured by the dynamics and phenotype of individual T cell clones | |
| Sato et al. | CD153/CD30 signaling promotes age-dependent tertiary lymphoid tissue expansion and kidney injury | |
| Li et al. | Single-cell transcriptomic analysis reveals BCMA CAR-T cell dynamics in a patient with refractory primary plasma cell leukemia | |
| TW201905201A (en) | Method for knocking out target genes in t cells in vitro and crrna used in the method | |
| US20220062394A1 (en) | Methods for identifying neoantigens | |
| Sharma et al. | Mucosal-associated invariant T cells develop an innate-like transcriptomic program in anti-mycobacterial responses | |
| US20220290247A1 (en) | Compositions and methods for diagnosis and treatment of bladder cancer | |
| US20210015866A1 (en) | Tissue resident memory cell profiles, and uses thereof | |
| US20210100897A1 (en) | Methods for the stimulation of dendritic cell (dc) precursor population "pre-dc" and their uses thereof | |
| Louie et al. | CAR+ and CAR-T cells differentiate into an NK-like subset that is associated with increased inflammatory cytokines following infusion | |
| Cvetkovski | Transcriptional control of tissue-resident memory T cell generation | |
| Leeansyah et al. | Mucosal-Associated Invariant T Cells Develop an Innate-Like Transcriptomic Program in Anti-mycobacterial Responses | |
| Zhang | Characterization of the host macrophage response to intracellular protozoan pathogens |
Legal Events
| Date | Code | Title | Description |
|---|---|---|---|
| 121 | Ep: the epo has been informed by wipo that ep was designated in this application |
Ref document number: 15709048 Country of ref document: EP Kind code of ref document: A2 |
|
| ENP | Entry into the national phase |
Ref document number: 2940653 Country of ref document: CA |
|
| ENP | Entry into the national phase |
Ref document number: 2016554339 Country of ref document: JP Kind code of ref document: A |
|
| NENP | Non-entry into the national phase |
Ref country code: DE |
|
| REEP | Request for entry into the european phase |
Ref document number: 2015709048 Country of ref document: EP |
|
| WWE | Wipo information: entry into national phase |
Ref document number: 2015709048 Country of ref document: EP |
|
| ENP | Entry into the national phase |
Ref document number: 2015222944 Country of ref document: AU Date of ref document: 20150226 Kind code of ref document: A |