WO2012162660A2 - Methods using dna methylation for identifying a cell or a mixture of cells for prognosis and diagnosis of diseases, and for cell remediation therapies - Google Patents
Methods using dna methylation for identifying a cell or a mixture of cells for prognosis and diagnosis of diseases, and for cell remediation therapies Download PDFInfo
- Publication number
- WO2012162660A2 WO2012162660A2 PCT/US2012/039699 US2012039699W WO2012162660A2 WO 2012162660 A2 WO2012162660 A2 WO 2012162660A2 US 2012039699 W US2012039699 W US 2012039699W WO 2012162660 A2 WO2012162660 A2 WO 2012162660A2
- Authority
- WO
- WIPO (PCT)
- Prior art keywords
- methylation
- dna
- cells
- cpg
- cell
- Prior art date
Links
Classifications
-
- C—CHEMISTRY; METALLURGY
- C12—BIOCHEMISTRY; BEER; SPIRITS; WINE; VINEGAR; MICROBIOLOGY; ENZYMOLOGY; MUTATION OR GENETIC ENGINEERING
- C12Q—MEASURING OR TESTING PROCESSES INVOLVING ENZYMES, NUCLEIC ACIDS OR MICROORGANISMS; COMPOSITIONS OR TEST PAPERS THEREFOR; PROCESSES OF PREPARING SUCH COMPOSITIONS; CONDITION-RESPONSIVE CONTROL IN MICROBIOLOGICAL OR ENZYMOLOGICAL PROCESSES
- C12Q1/00—Measuring or testing processes involving enzymes, nucleic acids or microorganisms; Compositions therefor; Processes of preparing such compositions
- C12Q1/68—Measuring or testing processes involving enzymes, nucleic acids or microorganisms; Compositions therefor; Processes of preparing such compositions involving nucleic acids
- C12Q1/6876—Nucleic acid products used in the analysis of nucleic acids, e.g. primers or probes
- C12Q1/6883—Nucleic acid products used in the analysis of nucleic acids, e.g. primers or probes for diseases caused by alterations of genetic material
-
- G—PHYSICS
- G16—INFORMATION AND COMMUNICATION TECHNOLOGY [ICT] SPECIALLY ADAPTED FOR SPECIFIC APPLICATION FIELDS
- G16B—BIOINFORMATICS, i.e. INFORMATION AND COMMUNICATION TECHNOLOGY [ICT] SPECIALLY ADAPTED FOR GENETIC OR PROTEIN-RELATED DATA PROCESSING IN COMPUTATIONAL MOLECULAR BIOLOGY
- G16B20/00—ICT specially adapted for functional genomics or proteomics, e.g. genotype-phenotype associations
- G16B20/10—Ploidy or copy number detection
-
- G—PHYSICS
- G16—INFORMATION AND COMMUNICATION TECHNOLOGY [ICT] SPECIALLY ADAPTED FOR SPECIFIC APPLICATION FIELDS
- G16B—BIOINFORMATICS, i.e. INFORMATION AND COMMUNICATION TECHNOLOGY [ICT] SPECIALLY ADAPTED FOR GENETIC OR PROTEIN-RELATED DATA PROCESSING IN COMPUTATIONAL MOLECULAR BIOLOGY
- G16B20/00—ICT specially adapted for functional genomics or proteomics, e.g. genotype-phenotype associations
- G16B20/20—Allele or variant detection, e.g. single nucleotide polymorphism [SNP] detection
-
- G—PHYSICS
- G16—INFORMATION AND COMMUNICATION TECHNOLOGY [ICT] SPECIALLY ADAPTED FOR SPECIFIC APPLICATION FIELDS
- G16B—BIOINFORMATICS, i.e. INFORMATION AND COMMUNICATION TECHNOLOGY [ICT] SPECIALLY ADAPTED FOR GENETIC OR PROTEIN-RELATED DATA PROCESSING IN COMPUTATIONAL MOLECULAR BIOLOGY
- G16B40/00—ICT specially adapted for biostatistics; ICT specially adapted for bioinformatics-related machine learning or data mining, e.g. knowledge discovery or pattern finding
- G16B40/30—Unsupervised data analysis
-
- C—CHEMISTRY; METALLURGY
- C12—BIOCHEMISTRY; BEER; SPIRITS; WINE; VINEGAR; MICROBIOLOGY; ENZYMOLOGY; MUTATION OR GENETIC ENGINEERING
- C12Q—MEASURING OR TESTING PROCESSES INVOLVING ENZYMES, NUCLEIC ACIDS OR MICROORGANISMS; COMPOSITIONS OR TEST PAPERS THEREFOR; PROCESSES OF PREPARING SUCH COMPOSITIONS; CONDITION-RESPONSIVE CONTROL IN MICROBIOLOGICAL OR ENZYMOLOGICAL PROCESSES
- C12Q2600/00—Oligonucleotides characterized by their use
- C12Q2600/154—Methylation markers
-
- G—PHYSICS
- G16—INFORMATION AND COMMUNICATION TECHNOLOGY [ICT] SPECIALLY ADAPTED FOR SPECIFIC APPLICATION FIELDS
- G16B—BIOINFORMATICS, i.e. INFORMATION AND COMMUNICATION TECHNOLOGY [ICT] SPECIALLY ADAPTED FOR GENETIC OR PROTEIN-RELATED DATA PROCESSING IN COMPUTATIONAL MOLECULAR BIOLOGY
- G16B20/00—ICT specially adapted for functional genomics or proteomics, e.g. genotype-phenotype associations
-
- G—PHYSICS
- G16—INFORMATION AND COMMUNICATION TECHNOLOGY [ICT] SPECIALLY ADAPTED FOR SPECIFIC APPLICATION FIELDS
- G16B—BIOINFORMATICS, i.e. INFORMATION AND COMMUNICATION TECHNOLOGY [ICT] SPECIALLY ADAPTED FOR GENETIC OR PROTEIN-RELATED DATA PROCESSING IN COMPUTATIONAL MOLECULAR BIOLOGY
- G16B40/00—ICT specially adapted for biostatistics; ICT specially adapted for bioinformatics-related machine learning or data mining, e.g. knowledge discovery or pattern finding
- G16B40/20—Supervised data analysis
Definitions
- Methylation arrays as surrogate measures of the identity of a cell or a mixture of cells
- Methylation arrays as surrogate measures of the identity of a cell or a mixture of cells for prognosis and diagnosis of diseases
- 61/585,892 filed January 12, 2012 entitled, “Methods of Immunodiagnostics using DNA Methylation arrays as surrogate measures of the identity of a cell or a mixture of cells for prognosis and diagnosis of diseases”
- Kelsey K Houseman EA, Wiencke J, Accomando W and Marsit C, which applications are hereby incorporated herein by reference in their entireties.
- Methods of determining altered immune cell distribution to diagnose or prognose a disease condition based on determining DNA methylation signatures of specific immune cell type of or mixture of immune cells types are provided.
- Leukocytes commonly called white blood cells, are cells that are primarily responsible for mounting an immune response by a host to pathogens and to foreign antigens. Leukocyte distribution is currently determined by simple histologic or flow cytometric assessments. These methods have significant limitations. In particular, flow cytometry is limited by the following: availability of fluorescent antibody tags, laborious nature of the antibody tagging process, and needs for separation of cells requiring large volumes of fresh cells, expensive technology as well as equipment for detection of cells, and maintaining the integrity of the outer membrane of the cells to preserve labile protein epitopes. Further limitation of methods requiring fresh cells is that the methods are not useful in situations in which prospective studies are impractical, such as in the case of rare diseases, in which large numbers of disease subjects are not available.
- retrospective studies are needed to correlate disease outcome with disease parameters.
- retrospective studies can be performed only if archival samples derived from archived cohort populations could be used to analyze the disease parameters.
- archived samples from patients and normal subjects could be used to provide a quantitative estimate of leukocyte distributions in disease conditions.
- an embodiment of the invention provides a method a method for assessing a disease condition in a subject, including: measuring a CD3Z positive T lymphocyte cell number in a sample from the subject by analyzing methylation in the sample of at least one CpG dinucleotide (CpG) in gene CD3Z or in an orthologous or a paralogous gene thereof, such that an amount of a demethylated C of the at least one CpG in the sample is a measure of CD3+ T lymphocyte cell number; and comparing the amount of the demethylated C in the sample from the subject with that in positive control samples from patients with the disease condition, and with that in negative control samples from healthy subjects, such that the disease condition is selected from: an autoimmune disease, an allergy, a transplant
- subject refers to any animal, for example, a mammal that is healthy or that has a disease condition for example a human, or a high value agricultural animal or a zoo animal.
- a “patient” is a subject that either has a disease condition or is in need of obtaining a diagnosis of a disease condition.
- a related embodiment of the method includes at least one of: monitoring, diagnosing, prognosing, and measuring response to therapy by comparing the measured CD3+ T lymphocyte cell numbers in the subject after therapy to that in the patients with the disease condition and in the healthy subjects.
- an embodiment of the method provides that the inherited disease is an aneuploidy.
- aneuploidy is selected from trisomy 21 , Turner's syndrome, and Klinefelter's syndrome.
- the sample used in the method is a fresh sample.
- the fresh sample is freshly drawn blood, a tumor infiltrate or cells obtained from a lymph node puncture.
- the sample is an archival sample.
- the archival sample is archival blood collected and stored on filter paper cards such as a Guthrie card, frozen blood specimens or frozen tissue.
- Demethylation of DNA is a stable chemical modification of DNA, and archival samples are used to measure cell numbers.
- Flow cytometry in contrast, requires fresh cells, for detection of cells depends on the availability of protein epitopes, which are labile and not well preserved in archival samples.
- the amount of the demethylated C of the at least one CpG in the CD3Z gene in the sample is at least about 80%, at least about 90%, or at least about 95% of the total amount of the CpG in CD3Z genes in the sample.
- An embodiment of the method further involves analyzing the methylation of the CD3Z gene further by amplifying by Polymerase Chain Reaction (PCR) using primer pairs specific for amplification of specific demethylated CpG loci.
- PCR Polymerase Chain Reaction
- amplification by PCR involves monitoring quantitative PCR in real time using a MethyLight assay or using digital PCR.
- An embodiment of the method further involves analyzing the methylation of the CD3Z gene by a method selected from the group of: Pyrosequencing, Methylation-sensitive single- nucleotide primer extension (Ms-SNuPE), Methylation-sensitive single stranded conformation analysis (MS-SSCA), and High resolution melting analysis (HRM) and digital PCR methods comprising emulsion and nanofluidic partitioning.
- a method selected from the group of: Pyrosequencing, Methylation-sensitive single- nucleotide primer extension (Ms-SNuPE), Methylation-sensitive single stranded conformation analysis (MS-SSCA), and High resolution melting analysis (HRM) and digital PCR methods comprising emulsion and nanofluidic partitioning.
- Methylation-sensitive single-nucleotide primer extension further includes: chemically converting the lymphocyte derived whole genomic DNA with bisulfite; amplifying chemically converted whole genomic DNA; enzymatically fragmenting resulting amplified DNA;
- Another embodiment of the method further provides steps for analyzing methylation of differentially methylated regions (DMRs) of gene FOXP3, using primer pairs for amplification of specific loci of demethylated CpG in the FOXP3 gene.
- loci refers to locations of all CpG dinucleotide containing sequences present in that gene, and only one or a few may be differentially demethylated in a specific cell.
- a related embodiment of the method further includes: determining a ratio of CpG demethylation of FOXP3 gene DMR to the CpG demethylation of CD3Z gene DMR in a sample of tumor infiltrate, such that the ratio involves an index of T regulatory cell number to the total T cell number in the infiltrate; and the method further involves diagnosing of a pathological grade of the cancer, so that the index of T regulatory cell number to the total T cell number in the tumor infiltrate correlates with the grade of the cancer.
- the cancer is selected from: a glioma; an ovarian cancer; a head and neck squamous cell cancer (HNSCC), breast cancer, lung cancer, prostate cancer, colon cancer, pancreatic cancer, bladder cancer, cervical cancer and liver cancer.
- HNSCC head and neck squamous cell cancer
- the method further includes prognosing survival of a patient having or needing a diagnosis of glioma or HNSCC, in which amount of demethylation of CD3Z gene DMR in the patient as a percent of total DNA greater than a median value in a sample population of subjects correlates with a prognosis of poor survival.
- An embodiment of the invention provides a kit for measuring CD3+ T lymphocyte and FOXP3+ T regulatory cell numbers by analyzing methylation of CpG positions in CD3Z and FOXP3 genes, the kit having sequencing and PCR primers specific for the CD3Z and the FOXP3 gene DMRs and instructions for analyzing and comparing the CpG methylation between healthy subjects and a patient.
- An embodiment provides a method for assessing a disease condition by estimating an alteration in proportions of types of leukocytes in a sample from a subject, the method including the steps of: measuring a DNA methylation profile for each type of leukocyte and for unfractionated cells, such that DNA methylation profiles are obtained for a plurality of CpG loci, and obtaining the status of an individual CpG locus by amplifying DNA from each of the types of leukocyte and from the unfractionated cells, such that amplifying comprises hybridizing methylation sensitive locus-specific DNA oligomers corresponding to each CpG locus; ordering CpG loci by ability to distinguish types of leukocytes, such that the ordering of the CpG loci determines differentially methylated DNA regions (DMRs), such that obtaining DMRs comprises statistically minimizing introduction of bias in amount of total methylation status of a large number of CpG loci obtained from the unfractionated cells by employing a Bayesian treatment of prior probabilities of the methyl
- the locus- specific DNA oligomers are linked to an array selected from the group of: a glass slide array; a quartz slide array; a fiber optic bundle array, a planar slide array, a micro-well array; a multi- well dish array; a digital PCR array; and a bead array having beads located at known addressable locations on the array.
- a related embodiment of the method further provides at least one of steps of: monitoring, diagnosing, prognosing and measuring response to therapy of the disease condition.
- the method in a related embodiment further includes analyzing sensitivity for correcting bias, such that correcting bias is unrelated to measurement error and is related to errors arising from unprofiled cell types and non-cell mediated profile differences.
- fractionated leukocyte types include at least one selected from: CD19+ B lymphocytes, CD15+ granulocytes, CD14+ monocytes, CD56+ Natural Killer cells, and CD3+ T lymphocytes.
- the disease condition is Head and Neck Squamous Cell Carcinoma (HNSCC).
- HNSCC Head and Neck Squamous Cell Carcinoma
- control sample is taken from the subject at a different point in time for prognosis of the course of the disease condition in the subject.
- the method of assessing disease condition further includes after employing the measurement model, comparing the distribution of leukocytes to the relative amounts in the control sample as a normal standard, such that the normal standard is a statistical measure obtained from a plurality of disease-free subjects.
- the method provides a diagnosis of immunosuppression due to smoking in a currently smoking subject by: determining a ratio of CpG demethylation of FOXP3 gene DMR to the CpG demethylation of CD3Z gene DMR in blood in the currently smoking subject, such that the ratio is an index of T regulatory cell number to the total T cell number; and providing a diagnosis of immunosuppression in the currently smoking subject, such that the value of the index of T regulatory cell number to the total T cell number in the currently smoking subject, greater than the average value in a sample population of currently non- smoking subjects correlates with immunosuppression due to smoking.
- the subject with the currently-smoking or currently non-smoking status is a patient having a cancer, an infection or in need of a transplant.
- An embodiment provides a method of predicting a methylation class membership in a bodily fluid sample of a subject for assessing disease status of the subject, in which the methylation class membership corresponds to an epigenetic signature of a plurality of leukocyte types, the method including: measuring amounts of DNA methylation in each of a plurality of leukocyte type populations to determine differentially methylated regions (DMRs);
- DMRs differentially methylated regions
- leukocyte DMRs for each leukocyte type according to statistical strength of association of the DMR with each leukocyte type; randomly dividing a data set of control subjects and subjects with a disease into groups having substantially the same numbers of control subjects and subjects with the disease to obtain a training set and a testing set; clustering samples in the training set using a defined number of highest ranked leukocyte DMRs to determine clustering solutions, in which a clustering solution corresponds to the methylation class membership; and predicting methylation class membership for subjects within the testing set by applying the clustering solutions obtained from the training set to the highest ranked leukocyte DMRs in the testing set, such that clinical utility of the predicted methylation class membership is determined by testing association of the predicted methylation class membership with the disease status of the subject.
- the highest ranked leukocyte DMRs are as shown in Table 21 , in which each DMR is identified by chromosomal location and gene name , and the defined number of highest ranked leukocyte DMRs is selected from: least 10, at least 20, at least 30, at least 40 and is 50.
- the methylation class membership of the subject in the testing set is predicted for example using a naiVe Bayes classifier. Testing the association of the predicted methylation class with disease status includes for example using receiver operating characteristic curves
- the bodily fluid sample in some embodiments is a fresh sample, for example freshly collected blood or a blood derivative.
- the bodily fluid is an archival sample, for example stored frozen blood or archival blood collected and stored on a filter paper card such as a Guthrie card.
- the method in a related embodiment includes at least one of: diagnosing, monitoring, prognosing and measuring response to therapy of the disease status.
- the leukocyte types are selected from the group of: natural killer cells, B Cells, CD4+ T cells, CD8+ T cells, granulocytes and monocytes.
- the disease according to an embodiment of the method is exemplified by one of: head and neck squamous cell carcinoma (HNSCC), ovarian cancer, and bladder cancer.
- HNSCC head and neck squamous cell carcinoma
- ovarian cancer ovarian cancer
- bladder cancer bladder cancer
- An array is provided as another embodiment for estimating proportions of leukocyte types in a sample from a mammal for assessing a disease condition of the mammal by analyzing differential methylation of CpG dinucleotides in a plurality of genes of the sample, the array including: a plurality of DNA probes attached to a plurality of surfaces at known addressable locations on the array, such that the surface at each location is attached to a DNA probe having a specific nucleotide sequence, such that the DNA probe having the specific nucleotide sequence hybridizes to a nucleotide sequence of a methylated form or an ummethylated form of a CpG dinucleotide in a sequence of a gene of the plurality of genes in the sample, such that the array is selected from having: at least 16 probes, at least 64 probes, at least 96 probes, and at least 384 probes.
- the plurality of probes in a related embodiment of the array, has nucleotide sequences that hybridize with a respective plurality of 96 different nucleotide sequences which are found in nature occurring in the plurality of genes.
- the 96 nucleotide sequences have SEQ ID NO: 1 to SEQ ID NO: 96.
- the addressable locations are wells of a substrate, such that the substrate is selected from: glass slide; quartz slide; fiber optic bundle and planar silica slides.
- the surfaces included in the array are particles added to the wells.
- the addressable locations of the array are defined spots on a glass slide or are microbeads or particles labeled with a code.
- the particles are microbeads in the form of glass cylinders identifiable with inscribed holographic code.
- the disease condition is selected from: an autoimmune disease, an allergy, a transplant rejection, obesity, an inherited disease, immunosuppression and a cancer.
- Another embodiment provides a method for estimating proportions of types of leukocytes in a sample from a subject for assessing a disease condition of the subject by analyzing differential methylation of CpG dinucleotides in a plurality of genes of the sample, the method including: providing an array having a plurality of DNA probes attached to a plurality of surfaces at known addressable locations on the array, such that the surface at each location is attached to a DNA probe having a specific nucleotide sequence; reacting genomic DNA in the sample with a bisulfite reagent to convert unmethylated cytosine residues to uracil; hybridizing resulting bisulfite treated genomic DNA with the array to obtain resulting hybridized probes on the array, such that the DNA probes hybridize to a DNA sequence of each of a methylated form and an ummethylated form of a sequence having a CpG dinucleotide in a gene for each of the plurality of genes; and detecting the methylation status of each of the CpG
- detecting the methylation status of the CpG dinucleotide sequence includes: extending each hybridized probe of the resulting hybridized probes on the array by primer extension to obtain a resulting primer extension product; ligating the resulting primer extension product to an oligonucleotide complementary to the DNA sequence of a 3' region of the gene to obtain a resulting template for PCR on the array; and amplifying by PCR and measuring amount of resulting PCR product, thereby detecting the methylation status of the CpG dinucleotide containing nucleotide sequence.
- amplifying by PCR further includes: amplifying the resulting template on the array using primers pairs including a 5' primer specific to each of the methylated or the unmethylated form of the CpG dinucleotide containing gene, and a 3 'primer specific to the gene containing the CpG dinucleotide, thereby resulting in a first PCR product; amplifying the resulting first PCR product with differentially labeled 5' primers that specifically amplify either the methylated or the unmethylated form of the CpG dinucleotide containing nucleotide sequence containing gene, and a common 3 ' primer, resulting in a differentially labeled second PCR product, and hybridizing the second PCR product to the CpG dinucleotide containing gene for measuring amount of the second PCR product, thereby detecting the methylation status of the CpG dinucleotide sequence.
- Detecting the methylation status of the CpG dinucleotide sequence includes extending the resulting hybridized probes on the array by single base primer extension with a labeled nucleotide.
- the array used in the method includes at least 16 probes, at least 64, at least 96 probes or at least 384 probes.
- the plurality of probes on the array hybridizes with a plurality of 96 different nucleotide sequences occurring in the plurality of genes.
- each probe on the array is complementary to nucleotide sequences having SEQ ID NO: 1 to SEQ ID NO: 96.
- the disease condition assessed is selected from: an autoimmune disease, an allergy, a transplant rejection, obesity, an inherited disease, and a cancer.
- Assessing the disease condition using the array includes at least one of: monitoring, diagnosing, prognosing, and measuring response to therapy by comparing estimated proportions of types of leukocytes of the subject after therapy to proportions of leukocytes from a healthy subject.
- the sample containing the genomic DNA used to hybridize with the probes on the array is fresh i.e., obtained in real time prior to performing the method.
- the sample is archival.
- the leukocyte types include at least one selected from: CD 19+ B lymphocytes, CD! 5+ granulocytes, CD 14+ monocytes, CD56+ natural Killer cells, and CD3+ T lymphocytes.
- kits for estimating proportions of leukocyte types in a sample by analyzing differential methylation of CpG dinucleotides in a plurality of genes of the sample including: an array having: a plurality of DNA probes attached to a plurality of surfaces at known addressable locations on the array, such that the surface at each location is attached to a DNA probe having a specific nucleotide sequence, such that the DNA probe having the specific nucleotide sequence hybridizes to a DNA sequence of a methylated form or an ummethylated form of a CpG dinucleotide in a sequence of a gene of the plurality of genes in the sample, such that the array is selected from having: at least 16 probes, at least 64 probes, at least 96 probes, and at least 384 probes; primers and reagents for detecting the hybridized probes and for detecting the reaction products derived from the hybridized probes; and instructions for using the array with a bisulfite reagent
- the probes hybridize with a respective plurality of 96 different DNA sequences occurring in the plurality of genes.
- the probes have nucleotide sequences complementary to 96 nucleotide sequences having SEQ ID NO: 1 to SEQ ID NO: 96.
- the instructions in a related embodiment of the kit include methods for: reacting genomic DNA in the sample with the bisulfite reagent to convert unmethylated cytosine residues to uracil; hybridizing resulting bisulfite treated genomic DNA with probes immobilized to the surfaces to obtain resulting hybridized probes on the array, such that the DNA probes hybridize to a DNA sequence of each of a methylated form and an ummethylated form of a CpG dinucleotide sequence in a gene of the plurality of genes; and detecting the methylation status of the CpG dinucleotide sequence, thereby estimating proportions of leukocyte types in the sample from the subject for assessing the disease condition of the subject.
- the instructions for detecting the methylation status of the CpG dinucleotide sequence include methods for: extending each hybridized probe of the resulting hybridized probes on the array by primer extension to obtain a resulting primer extension product; ligating the resulting primer extension product to an oligonucleotide complementary to the DNA sequence of a 3' region of the gene to obtain a resulting template for PCR on the array; and amplifying by PCR and measuring amount of resulting PCR product, thereby detecting the methylation status of the CpG dinucleotide sequence.
- kits amplifying by PCR include methods for: amplifying the resulting template on the array using primers pairs having a 5' primer specific to each of the methylated or the unmethylated form of the CpG dinucleotide containing gene, and a 3'primer specific to the gene containing the CpG dinucleotide, thereby- resulting in a first PCR product; amplifying the resulting first PCR product with differentially labeled 5' primers that specifically amplify each of the methylated and unmethylated form of the CpG dinucleotide sequence containing gene, and a common 3' primer, resulting in a differentially labeled second PCR product, and hybridizing the second PCR product to the CpG dinucleotide containing gene for measuring amount of the second PCR product, to detect the methylation status of the CpG dinucleotide sequence.
- Instructions for detecting the methylation status of the CpG dinucleotide sequence include methods for extending the resulting hybridized probes on the array by single base primer extension with a labeled nucleotide.
- Another embodiment of the invention is a method of treating a subject for a disease condition, such that the subject is a human patient and, such that the disease condition is a cancer, the method comprising: obtaining signatures comprising differentially methylated regions (DMRs) from types of leukocytes in a blood sample of the patient, the types of leukocytes comprising at least one selected from: CD 19+ B lymphocyte, CD 15+ granulocyte, CD 14+ monocyte, CD56 dim Natural Killer cell, CD56 br,ght Natural Killer cell, and CD3+ T lymphocyte, and from a healthy control human subject not having the cancer; comparing a signature specific for the type of leukocyte in the patient with that in the healthy subject, such that the type of leukocyte specific signature is an indication of amount of cells of the type of leukocyte circulating in blood, and such that a decreased amount of the cells of the type of leukocyte circulating in the blood of the patient compared to the healthy subject is an ind icium of the cancer; and, administering
- the leukocyte type cell is the CD56 dim Natural
- the cancer in related embodiments of the method is head and neck squamous cell carcinoma (HNSCC).
- HNSCC head and neck squamous cell carcinoma
- Natural Killer cells includes at least one CpG dinucleotide in a region near the promoter of gene NKp46.
- the DMR signature specific for CD56 d m Natural Killer cells is a CpG dinucleotide in a region near the promoter of the gene NKp46, such the methylation status of the CpG dinucleotide is quantified by methylation specific quantitative polymerase chain reaction (MS-qPCR) using primers and probes having SEQ ID NOs: 1 16-1 18 and 97-99.
- MS-qPCR methylation specific quantitative polymerase chain reaction
- the DMR signature specific for CD56 dim Natural Killer cells is a CpG dinucleotide in a region near the promoter of the gene NKp46, such that the methylation status of the CpG dinucleotide is quantified by digital PCR involving emulsion and nanofluidic partitioning using primers and probes having SEQ ID NOs: 1 16-1 18 and 97-99.
- the blood sample is archival.
- the blood sample is fresh.
- Figure 1 is a photograph showing a clustering heatmap for External Validation White Blood Cell Data (So)-
- the data were obtained by applying the measurement error formulation described in Examples 1-3.
- the method delineates effects resulting from immune cell distribution as compared to those resulting from other "non-cell type" alterations in DNA methylation.
- Methylation array procedure was carried out using Infinium HumanMethylation27 Beadchip Microarrays from Illumina, inc. (San Diego, CA).
- Figure 2 is a chart showing the results of cell mixture reconstruction experiments validating prediction of individual sample profiles.
- the reconstruction experiments involved six known mixtures of monocytes and B cells and six known mixtures of granulocytes and T cells.
- FIG. 3 is a photograph showing a clustering heatmap for Target HNSCC data (Si).
- the target data set Si consisted of arrays applied to whole blood specimens collected in a random subset of individuals involved in an ongoing population-based case-control study (Peters et al.,
- HNSCC head and neck cancer
- Figure 4 is a graphical representation of bias sensitivity analysis for HNSCC Data. Bias was assessed by resampling the case coefficients of Bj, a procedure that assumes maximum bias. The abscissa shows the number of assumed non-zero alterations. The dark filled diamond shapes (red in color) indicate median, the thick vertical lines (blue in color) indicates interquartile range, the thin lines (blue in color) represent 95% probability ranges, and the outer dots (black in color) represent 99% probability ranges.
- FIG. 5 panels A-B are graphs showing Rate-of-Convergence of the Hessian matrix H m which allows the determination of the optimal number of CpG sites whose combined methylation status measurements most accurately reflect the exact distribution of different cells in a mixture.
- the x-axis represents increasing m, the number of CpG sites (ordered by F- statistic) included in the model space, on a logarithmic scale.
- Figure 5 panel A shows convergence by correlating the Hessian Matrix with the number of CpG sites included in the measurement.
- the dotted line in (A) shows the tangent at low values of m.
- Figure 5 panel B shows the Rate of convergence which was calculated by smoothing the first differences of logio(trH m ).
- the dotted line (red in color) in (B) corresponds to linear convergence.
- the annotation track above the heatmap indicates case-control status (cancer case or control).
- Figure 7 is a photograph showing a clustering heatmap for Target Down Syndrome Data.
- the method herein was applied to a trisomy 21 (Down syndrome) data set (Kerkel et al.,. PLoS Genet 2010, 6(1 l):el001212) consisting of 29 total peripheral blood leukocyte samples from Down syndrome cases and 21 controls, as well as six T cell samples from cases and four T cell samples from controls (GEO Accession number GSE25395).
- the annotation track above the heatmap indicates case-control and cell type status [Down syndrome case (whole blood), control (whole blood), T cell (pooled cases and controls)].
- the annotation track above the heatmap indicates case-control status (obese and lean).
- Figure 9 is a photograph (heatmap) of the methylation profiles of white blood cells obtained from a DNA methylation array analysis described in Example 9. Methylation array procedure was carried out using Infinium HumanMethylation27 Beadchip Microarrays from Illumina, Inc. (San Diego, CA). The number of individual leukocyte samples in each methylation class is shown in the table to the right. The DNA methylation profile distinguishes Lymphocytes from Myeloid Derived Leukocytes. The highest 5000 most variable CpG loci are plotted on the left. Less methylated loci are grey and more methylated loci are black.
- RPMM Recursively partitioned mixture model
- FIGS. 10 panels A-B are graphical representations of the DNA methylation status of regions in CD3E and CD3Z genes.
- Figure 10 panel A shows DNA methylation status of a region in CD3E that was identified from the DNA methylation array analysis (the results of which are shown in Figure 9) as one of the two candidate DMRs with specificity towards CD3+ T cells.
- the DNA methylation status was measured by pyrosequencing bisulfite converted DNA from different sorted, human, peripheral blood leukocytes.
- Figure 10 panel B shows DNA methylation status of a region in CD3Z gene that was identified from the DN A methylation array analysis (the results of which are shown in Figure 9) as one of the two candidate DMRs with specificity towards CD3+ T cells.
- the DNA methylation status of the region in CD3Z gene in different sorted, human, peripheral blood leukocytes was measured by MethyLight® qPCR.
- Figure 11 is a drawing showing the genomic region containing CD3Z gene, based on information available from the public databases UniProt, RefSeq and GenBank.
- UniProt is a freely accessible universal protein resource of protein sequence and functional information.
- RefSeq is a collection that provides integrated and annotated set of sequences including genomic DNA, transcripts and protein.
- GenBank ® is the genetic sequence database of the National Institutes of Health which contains an annotated collection of all publicly available DNA sequences.
- Figure 12 is a list of genomic regions used for measuring methylation of CD3Z and FOXP3 gene, for quantitating genome copy numbers, and a list of the corresponding primer and probe sequences. Underlined letters are "C” in CpG motifs.
- Figure 13 panels A-C are graphical representations of standard calibration curves which show the relationship between copy numbers of genomic DNA and the signal obtained from quantitaive real time methylation specific PCR.
- the calibration curves are used for quantifying CD3+ T cells, Tregs (FOXP3 demethylated) and ratios of Tregs/CD3+ T cells.
- DNA isolated from purified cell types was bisulfite converted and serially diluted into a background of fully methylated commercial DNA standard (Qiagen). The total genomic copy numbers of each sample within a dilution series remained constant. Log dilutions were performed in the appropriate range of Ct values corresponding to test samples (whole blood, tumor specimens). Using cytosine-less: C-less primers genome copy numbers for each test standard were measured to ensure adequate input DNA and to normalize the CD3+ and Treg assay values.
- Figure 14 is a drawing and a set of graphical representations showing detection of CD3+ T cell numbers by measuring differential demethylation using MS-qPCR.
- Figure 14 panel A is a schematic diagram showing methylation specific primers and probe targeting six CpGs (lollipops) in a region of the CD3Z gene identified herein as demethylated in CD3+ T cells.
- Figure 14 panel B shows results of real time PCR. The real time PCR Ct values decreased linearly with a ten-fold increase in bisulfite converted CD3+ T cell DNA
- Figure 14 panel C shows correlation between T cell levels determined by flow cytometry and CD3Z MS-qPCR. Evaluation of CD3+ T cell level by flow cytometry was observed to be highly correlated with T cell quantification by CD3Z MS-qPCR in whole blood specimens from glioma patients and healthy donors.
- FIG. 14 shows correlation between T cell counts obtained using by imunohistochemical staining and CD3Z MS-qPCR.
- CD3+ T cell count by imunohistochemical staining correlates with T cell quantification by CD3Z MS-qPCR in excised tumors across histological subtypes. Pearson correlations and F-test p-values are shown in panels B-D.
- FIGS. 15 panels A-C are graphical representations showing T cells and Tregs in the peripheral blood of glioblastoma multiform (GBM) patients and healthy donors determined by MS-qPCR for demethylation of specific CpG loci.
- GBM glioblastoma multiform
- Figure 15 panel A shows comparison of T cell numbers in blood between GBM patients and control subjects measured using CD3Z demethylation assay.
- Figure 15 panel B shows comparison of Tregs between GBM patients and control subjects measured using FOXP3 demethylation assay.
- Figure 15 panel C is a graph showing comparison of Treg percent of T cells between GBM patients and control subjects determined by the ratio of FOXP3ICD3Z demethylation. Wilcoxon rank sum p-values are shown.
- Figure 16 panels A-C are graphical representations showing association between cigarette smoking and peripheral blood T cells and Tregs in glioma patients and healthy donors determined by MS-qPCR for demethylation of specific CpG loci.
- Figure 16 panel A shows a comparison of peripheral blood T cell levels, determined by CD3Z demethylation, among never, former and current cigarette smokers stratified by glioma case status (indicated “cases” on the abscissa).
- Figure 16 panel B shows a comparison of peripheral blood Treg levels, determined by FOXP3 demethylation, among never, former and current cigarette smokers stratified by glioma case status.
- Figure 16 panel C shows a comparison of peripheral blood Treg percent of T cells, determined by ratio of FOXP3 to CD3Z demethylation, among never, former and current cigarette smokers stratified by glioma case status. Wilcoxon rank sum p-values are shown.
- Figure 17 panels A-C are graphical representations showing levels of T cell and Treg infiltrates in excised glioma tumors determined by MS-qPCR for demethylation of specific CpG loci.
- Figure 17 panel A shows T cell levels, determined by CD3Z demethyation, in solid glioma samples stratified by tumor grade.
- Figure 17 panel B shows Treg levels, determined by FOXP3 demethyation, in solid glioma samples stratified by tumor grade.
- Figure 17 panel C shows Treg percent of T cells, determined by ratio of FOXP3 to CD3Z demethylation, in solid glioma samples stratified by tumor grade. Wilcoxon rank sum p-values are shown.
- Figure 18 panels A-C are graphical representations of flow cytometry analysis of CD3+ T cells and total leukocytes in whole blood from glioma cases and controls.
- Figure 18 panel A shows a forward and side scatter plot of a representative blood sample showing gating for lymphocytes and counting beads.
- Figure 18 panel B shows lymphocyte subpopulation observed using gating for CD3 expression.
- Figure 18 panel C shows CD45 gating on all non-bead events. CD45+ low and high cells were added in order to count total CD45+ cells.
- Figure 19 panels A-C are photomicrographs and a lie graph that show
- IHC immunohistochemical
- Figure 9 panel A shows CD3 staining. Average number of cells positive for staining was 418.
- Figure 19 panel B shows CD8 staining. Average number of cells positive for staining was 296.
- Figure 20 is a set of two heatmaps showing results of MS-qPCR and bisulfite pyrosequencing of Magnetic activated cell sorting (MACS) sorted human leukocyte subsets.
- MCS Magnetic activated cell sorting
- B B lymphocytes
- Gran Granulocytes
- Neut Neutrophils
- Mono Monocytes
- NK CD56+ Natural killer cells
- Nkdim CD16+CD56dim natural killer cells
- NKbr CD16-CD56bright natural killer cells
- NK8+ CD8+CD56+ natural killer cells
- NK8- CD8-CD56+ natural killer cells
- NKT CD3+CD56+ natural killer T cells
- T CD3+ T lymphocytes
- CD8 CD3+CD8+ T lymphocytes (cytotoxic T cells)
- CD4 CD3+CD4+ T lymphocytes (helper T cells)
- Treg CD3+CD4+CD25+FOXP3+ regulatory T cells.
- Figure 20 panel A is a heatmap of DNA methylation in FOXP3 and CD3Z gene regions assessed by MS-qPCR.
- Figure 20 panel B is a heatmap of DNA methylation at three CpG loci in the CD3Z gene assessed by bisulfite pyrosequencing.
- FIGS. 21 panels A-C are graphical representations showing levels of T cell and Treg infiltrates in glioma tissues stratified by histological subtype detennined by MS-qPCR for demethylation of specific CpG loci.
- PA Pilocytic Astrocytoma
- EP Pilocytic Astrocytoma
- Ependymoma Oligodendroglioma
- OA Oligoastrocytoma
- AS Astrocytoma
- GBM Glioblastoma multiforme. Kruskal-Wallis one-way analysis of variance by rank test p-values shown.
- Figure 21 panel A shows T cell levels determined by CD3Z demethylation in solid glioma samples stratified by tumor histology.
- Figure 21 panel B shows Treg levels determined by FOXP3 demethylation in solid glioma samples stratified by tumor histology.
- Figure 21 panel C shows Treg percent of T cells, determined by ratio of FOXP3 to CD3Z demethylation in solid glioma samples stratified by histology.
- Figure 22 panels A-C are graphical representations showing Kaplan Meier analysis of time of survival of glioma patients stratified according to whether the level of T cells or Tregs in the tumor infiltrates of the patients are above or below the median level of T cells or Tregs, respectively. Log Rank p-values shown.
- Figure 22 panel A shows survival (ordinate) of glioma patients as a function of time (abscissa) in relation to T cell levels as determined by CD3Z demethylation.
- Figure 22 panel B shows survival of glioma patients in relation to Treg levels as determined by FOXP3 demethylation.
- FIG 22 shows survival of glioma patients in relation to Treg percent of T cells as determined by ratio of FOXP3 to CD3Z demethylation.
- Figure 23 panels A-B are representations of results obtained from analysis of DMRs of leukocyte subtypes.
- Figure 23 panel A shows a heat map of the methylation status for the highest ranked 50 leukocyte DMRs by leukocyte subtype.
- Figure 23 panel B shows a Plot depicting the -loglO(P-values) for the highest ranked 50 leukocyte DMRs across three cancer data sets (HNSCC; Ovarian; Bladder).
- P-values (ordinate) show methylation differences between cancer cases and non-cancer controls and were obtained from individual unconditional logistic regression models fit to each of the 50 leukocyte DMRs.
- HNSCC data set logistic regression models were adjusted for patient age, gender, smoking status (never, former, current), smoking pack years, weekly alcohol consumption, and HPV serology status.
- the bladder cancer data set was adjusted for patient age, gender, smoking status, smoking pack years, and family history of bladder cancer.
- the ovarian cancer data set was adjusted for patient age group (55-60, 60-65, 65-70, 70-75 and >75 years).
- FIG. 24 panels A-B shows results obtained from the DMR profile analysis of the HNSCC data set determining methylation class membership.
- Figure 24 panel A left column shows a heat map of the HNSCC testing data set. Rows represent subjects, which are grouped by predicted methylation class membership. Columns represent the highest ranked 50 leukocyte DMRs that were used to generate the methylation classes for the HNSCC testing set. Panel A right column is a bar-plot depicting the percent cancer case/control across the predicted methylation classes in the HNSCC testing set.
- Figure 24 panel B shows receiver operating characteristic (ROC) curves based on the predicted methylation classes only in the HNSCC testing set and methylation classes including patient age, gender, smoking status (never, former, current), smoking pack years, weekly alcohol consumption, and HPV serostatus.
- ROC receiver operating characteristic
- Figure 25 shows results obtained from the DMR profile analysis of the Ovarian data set for determining methylation class membership.
- Figure 25 panel A is a heat map of the ovarian testing data set. Rows represent subjects which are grouped by predicted methylation class membership. Columns represent the highest ranked ten leukocyte DMRs that were used to generate the methylation classes for the ovarian testing set. Panel A right column is a bar-plot depicting the percent cancer case/control across the predicted methylation classes in the ovarian testing set.
- Figure 25 panel B shows ROC curves based on the predicted methylation classes alone in the ovarian testing set and methylation classes plus patient age group (55-60, 60-65, 65-70, 70-75 and >75 years).
- Figure 26 shows results obtained from the DMR profile analysis of the bladder data set for determining methylation class membership.
- Figure 26 is a heat map of the bladder testing data set. Rows represent subjects, which are grouped by predicted methylation class membership. Columns represent the highest ranked 56 leukocyte DMRs that were used to generate the methylation classes for the bladder testing set. Panel A right column represents a bar-plot depicting the percent cancer case/control across the predicted methylation classes in the bladder testing set.
- Figure 26 panel B shows ROC curves based on the predicted methylation classes alone in the bladder testing set and methylation classes plus patient age, gender, smoking status (never, former, current), smoking pack years, and family history of bladder cancer.
- Figure 27 panels A-C are graphical representations showing image plots representing the pairwise spearman correlation coefficients.
- Figure 27 panel A shows the six CpG loci identified by HNSCC analysis (Langevin SM et al., Epigenetics. 2012 Mar; 7(3):291-9) and the highest ranked 50 leukocyte DMRs used in the present analysis.
- Figure 27 panel B shows the seven CpG loci identified by the alternative ovarian analysis and the highest ranked ten leukocyte DMRs used in the present analysis
- Figure 27 panel C shows the nine CpG loci identified by the bladder analysis reported in
- Figure 28 is a schematic diagram showing hierarchy of leukocyte subtypes and sample sizes for each of the leukocyte subtypes used in the analysis for determination of methylation class membership.
- FIG. 30 is a diagram representing the analytic workflow the ovarian cancer data set
- the full ovarian cancer data set was divided into equally sized training and testing sets.
- the training sets were used in the development of a classifier based on leukocyte DMRs.
- the resulting classifiers were then used to predict methylation class membership for the observations in the respective independent testing sets.
- the phenotypic importance of the predicted methylation classes in the testing data was then examined.
- the full bladder cancer data set was divided into equally sized training and testing sets.
- the training sets were used in the development of a classifier based on leukocyte DMRs.
- the resulting classifiers were then used to predict methylation class membership for the observations in the respective independent testing sets.
- the phenotypic importance of the predicted methylation classes in the testing data was then examined.
- Figure 32 is a diagram illustrating Semi-Supervised Recursively Partitioned Mixture Models (SS-RPMM) for predicting methylation class membership.
- SS-RPMM Semi-Supervised Recursively Partitioned Mixture Models
- Figure 33 panels A-D show results obtained from SS-RPMM analysis (see Figure 30) of the ovarian cancer data set for determination of methylation class membership.
- Figure 33 panel A is a heatmap of the testing set obtained by predicted methylation class using the SS-RPMM procedure. Rows represent subjects and columns represent the seven CpG loci identified by this analysis. Figure 33 panel B represents percentage of cases/controls obtained by predicted methylation class membership in the testing set.
- Figure 33 panel C sows information regarding the seven CpG loci identified by the SS- RPMM analysis.
- Figure 33 panel D shows a ROC/AUC (area under the curve) analysis based on the predicted methylation class memberships in the testing set. Dark represents the ROC/AUC based on the predicted methylation classes along and light represents the ROC/AUC using the predicted methylation classes and patient age group.
- Figure 34 is a graphical representation showing loci in the gene NKp46 chosen from candidate NK cell-specific differential DNA methylation markers, selected by DNA methylation and mRNA expression criteria.
- Linear mixed effects modeling of DNA methylation microarray data from MACS isolated human leukocytes generated a coefficient estimating differential methylation in NK cells relative to other cell subtypes, shown on the avscissa.
- Linear modeling of mRNA microarray data from the same isolated cells determined log-fold change in expression between N K cells and each of the following subtypes: T cells, B cells, granulocytes and monocytes. The average of these four log-fold change values is shown on the ordinate. Significance for a particular gene region was achieved when q ⁇ 0.1 for four mRNA expression linear models as well as the DNA methylation mixed effects model.
- Candidates for NK cell-specific DNA methylation biomarkers were limited to significant gene loci exhibiting decreased methylation in NK cells (methylation estimate ⁇ 0) and within genes that exhibited increased RNA expression (log fold change > 1).
- the candidate loci are marked with asterisks in the top left quadrant, and NKp46 loci are marked with grey asterisks.
- Figure 35 is a heatmap showing demethylation status of NKp46 determined by methylation specific quantitative PCR (MS-qPCR) of isolated human leukocyte populations. Individual samples of (MACS) purified white blood cell subtypes were subjected to a MS-qPCR assay that detects demethylated copies of NKp46 DNA. Extent of NKp46 methylation is illustrated in this heatmap in which light indicates that all copies of DNA in particular sample were demethylated in the targeted region of NKp46, and dark indicates that all copies were methylated.
- MS-qPCR methylation specific quantitative PCR
- Figure 36 is a line graph showing linearity of NKp46 MS-qPCR calibration. Bisulfite converted universal methylated DNA was used to standardize total amount of DNA in all samples at a constant amount. At least three replicates of each standard are plotted. Real time PCR Ct values decrease linearly with ten-fold increase in bisulfite converted NK cell DNA concentration.
- Figure 37 is a bar graph showing prevalence of HNSCC by normal NKp46
- NKp46 demethylation tertile Normal NKp46 demethylation tertile cutoffs were determined from control blood samples only. Higher tertiles indicate higher NK cell levels. HNSCC prevalence
- Figure 38 is a heatmap showing methylation status of selected NKp46 CpG loci measured by bisulfite pyrosequencing of isolated human leukocytes. The methylation status of eight individual CpG loci near the promoter region of NKp46 were interrogated by
- FIG. 39 is a graph showing percent demethylation (ordinate) of a DNA region in
- NKp46 in control and HNSCC patient blood samples assessed by MS-qPCR.
- the NKp46 MS-qPCR assay measures the extent of DNA demethylation. A higher level of demethylation indicates a higher level of NK cells within a sample. Wilcoxon rank sum p-value is displayed.
- Figure 40 is a listing of DNA sequences of regions in 96 different genes, each sequence having one CpG dinucleotide shown within square brackets and used to determine methylation status of the gene.
- the DNA sequence surrounding the CpG dinucleotides was used to design probes for the array and for primers for performing the methods for analyzing differential methylation.
- Also included are the names of the genes, chromosome number indicating the chromosome in which each genes is located, the source of the DNA sequences, Genebank accession numbers, and the coordinate of the CpG dinucleotide in each respective gene.
- Figure 41 is a schematic diagram showing different ways of representing effects on measured DNA methylation due to an exposure or a specific phenotype.
- Figure 41 panel A depicts the marginal effects ( ⁇ ) on measured DNA methylation.
- the marginal effects are effects which are not adjusted for white blood cell (WBC) distribution.
- Figure 41 panel B depicts the effects on measured DNA methylation adjusted for WBC distribution resulting from exposure or a specific phenotype.
- Figure 42 is a set of graphical representations showing the relationship between a and ⁇ , the effect on measured DNA methylation not adjusted or adjusted for WBC distribution, for the covariate (e.g. age, current smoker status, toe Arsenic concentration and Dye use) of interest over all autosomal CpGs.
- the curve depicts a loess fit to the scatter plot.
- Figure 43 is a graphical representation showing fluorescence intensities of CD3Z gene amplified by digital droplet PCR, and a graphical representation showing concentration of CD3Z gene in PCR samples.
- Figure 43 panel A shows a fluorescence intensity dot plot for amplification of CD3Z gene by detection of intensities of 6 FAM (6-Carboxyfluorescein). Positive and negative droplets are distinguished by a horizontal line.
- Figure 43 panel B shows a correlation of the concentration of copy numbers of CD3Z gene obtained by measuring 6 FAM fluorescence intensities and the expected copy numbers of CD3Z gene obtained by dilution of a known amount of DNA from CD3+ T cells.
- Figure 44 is a graphical representation showing fluorescence intensities of FoxP3 gene amplified by digital droplet PCR, and a graphical representation showing concentration of FoxP3 gene in PCR samples.
- Figure 44 panel A shows a fluorescence intensity dot plot for amplification of FoxP3 gene by detection of intensities of 6 FAM (6-Carboxyfluorescein). Positive and negative droplets are distinguished by a horizontal line.
- Figure 44 panel B shows a correlation of the concentration of copy numbers of FoxP3 gene obtained by measuring 6 FAM fluorescence intensities and the expected copy numbers of FoxP3 gene obtained by dilution of a known amount of DNA from CD3+ T cells.
- Figure 45 is a graphical representation showing fluorescence intensities of NKp46 gene amplified by digital droplet PCR, and a table showing concentration of NKp46 gene in the PCR samples amplified under different conditions.
- Figure 45 panel A shows a fluorescence intensity dot plot for amplification of NKp46 gene under different conditions by detection of intensities of 6 FAM (6-Carboxyfluorescein). Positive and negative droplets are distinguished by a horizontal line.
- Figure 45 panel B is a table showing concentration of NKp46 gene in copies/ ⁇ determined under different PCR conditions as fractions of methylated control DNA.
- Figure 46 is a graphical representation showing fluorescence intensities of NKp46 gene amplified by digital droplet PCR, and a table showing concentration of NKp46 gene in the PCR samples amplified under different conditions.
- Figure 46 panel A shows a fluorescence intensity dot plot for amplification of NKp46 gene by detection of intensities of 6 FAM (6-Carboxyfiuorescein).
- the amplification of demethylated NKp46 locus was performed using C-less and NKp46 DMR specific primers and probes, and results compared. Positive and negative droplets are distinguished by a horizontal line.
- Figure 46 panel B is a table showing concentration of NKp46 gene in copies/ ⁇ determined with whole blood DNA, Neutrophil DNA, CD 16+CD56 dim NK cell DNA and CD16+CD56 bright NK cell DNA.
- a model of hematopoiesis includes an early restriction point at which multipotent progenitor cells become committed to either lymphoid or myeloid lineages.
- the standard methods of distinguishing immune cell lineages are inadequate for fully distinguishing lineage commitment and the process of hematopoiesis.
- Epigenetics refers to heritable control of gene expression that occurs without changing the sequence of DNA. Chromatin packaging is a mechanism of epigenetic gene regulation which has been implicated in cell lineage commitment and lineage-specific gene expression.
- DNA methylation is a marker of chromatin packaging. DNA methylation is largely confined to cytosine residues in CpG dinucleotides which, though underrepresented in the genome, are frequently found in high concentrations called CpG islands. Less methylated CpG islands are highly associated with transcriptional activity and subsequent gene expression, and more methylated CpG islands are highly associated with transcriptional inactivity and gene silencing. Methylation of CpG dinucleotides causes chromatin to become more compact and inaccessible to transcription machinery by moving histones and altering the organization of chromatin and nucleosomes.(Christensen, B.C., et al. 2009, PLoS Genet S, el 000602; Schmidl, C, et al. 2009, Genome Res 19, 1165-1 174).
- the overall balance of leukocyte subclasses in circulation or in tissue most prominently influences pathogenesis.
- incipient cancer cells are recognized and eliminated by cytotoxic T cells (CTLs) and natural killer (NK) cells, and tumorigenesis is also promoted by certain other inflammatory cells, including B-lymphocytes, mast cells, neutrophils, regulatory T cells (Tregs), and others.
- CTLs cytotoxic T cells
- NK natural killer cells
- Tugenesis is also promoted by certain other inflammatory cells, including B-lymphocytes, mast cells, neutrophils, regulatory T cells (Tregs), and others.
- NK cells and CTLs circulating in the blood and residing in adipose tissues are associated with lower incidence of metabolic diseases such as type II diabetes (Lynch et al., 2009, Obesity, 17, 601-5), and higher levels of Ml macrophages in adipose tissue can induce inflammation and insulin resistance (Anderson et al, 201 1, Curr Opin Lipidol. 21, 172-177).
- Methods of quantifying the composition of lymphocyte populations can be informative regarding the underlying immuno-biology of disease states as well as the immune response to almost all chronic medical conditions. (Chua et al., 201 1, Brit J Cancer 104, 1288-1295).
- the methods described herein provide a measurement of individual human or animal immune cell numbers or immune cell ratios and in diverse biologic media without the requirement for viable cells or cell sorting or the use of any antibodies or protein markers.
- the methods are applicable to blood including samples of unsorted blood that is fresh, or is frozen or unfrozen anticoagulant treated peripheral whole blood, finger stick blood, non-anticoagulant treated whole blood, blood clots, isolated mononuclear cells, buffy coat, archival Guthrie card neonatal blood, and to a sample that is a spot, fresh, frozen or is from a tumor such as a formalin-fixed tumor biopsy, and to urine sediment, CNS fluid, fat or other tissue biopsy.
- the methods described herein are provided as diagnostic kits for testing laboratories in the form of immune cell specific detection reagents, premixed and optimized plate formatted multiplex assays for immune profiling compatible with specific instrument platforms, applications for in vitro diagnostics of blood, CNS, urine or
- bronchoalveolar lavage and point of care blood sampling kits for mail-in immune testing and immune monitoring.
- the simplified DNA based immuno-diagnostic approach provided herein uses samples that are much smaller volumes of blood than required for earlier methods and that require no processing. These samples can be simply 'spotted' onto a solid phase carrier and transported through the mail or delivered using courier.
- the methods described include development of software that can process the output data of immune specific methylation assays to create immune parameter reports by comparison to different reference and control values.
- the methods herein describe a discovery platform which is a bioinformatic integration of empirically derived genome wide methylation analyses with publically available differential gene expression analyses. The merged datasets are then sorted to produce candidates for further examination. The discovery platform is useful to discover clinically useful gene biomarkers.
- the methods described herein include a proof-of-principal test of the discovery platform.
- the goal set was to discover a gene or gene set that provides a marker of CD3+ T cells.
- the method is applicable to finding a biomarker for any cell.
- the platform identifies gene regions that are 'demethylated' within the target cell population (CD3+ T cell) and completely methylated in non-target cells.
- DNA from the leukocytes was extracted according to manufacturer's protocol using the DNeasy Blood & Tissue kit (Qiagen), and subjected to Bisulfite conversion by treatment with sodium bisulfite using the EZ DNA ethylation Kit (Zymo) following the manufacturer's protocol, thereby converting unmethylated cytosine residues to uracil and leaving methylated cytosine residues intact.
- DNA methylation is measured using a DNA methylation microarray as described in Example 13.
- Huehn et al. (U.S. patent publication number 2007/0269823 Al) describes a method for identifying FoxP3-positive regulatory T cells by analyzing the methylation status of CpG positions in the FOXP3 gene, and further describes a method for diagnosing immune status of a mammal by measuring amounts of regulatory T cells thus identified.
- CpG methylation analysis of FoxP3 gene is also used to determine the quality of in vitro generated T regulatory cells and for identifying chemical or biological substances that modulate the expression of the FOXP3 gene in T cells.
- Specific CpG positions in the mouse FoxP3 gene are identified for analyzing methylation status and primers for amplifying mouse and human CpG dense regions in FOXP3 gene are described.
- Olek U.S. patent publication number 2007/0243161 Al describes a method for pan-cancer diagnostics involving identification of an amount and/or proportion of stable regulatory T cells in a patient suspected of having cancer by analyzing methylation status of CpG positions in the FOXP3 and/or camtal genes. Increased amount proportion of stable regulatory T cells in the patient is indicative of an unspecified cancerous disease.
- a method of treating cancer by reducing the amount or proportion of stable regulatory T cells and a method for diagnosing survival of a cancer patient by measuring T regulator ⁇ ' cell amounts and/or proportions in patients suspected of having cancer using CpG methylation analysis of FoxP3 and/or camtal genes are described. Increased amounts and/or proportions of stable regulatory T cells in the cancer patient is indicative of a shorter survival.
- Olek et al. (International publication number WO 2010/069499 A2) describes a method of identifying T-lymphocytes, in particular CD3+CD4+ and/or CD3+CD8+ cells by analyzing the methylation status of CpG positions in one or more of genes for CD3 multi-protein complex CD3 ⁇ , - ⁇ and - ⁇ , or in other genes. Demethylation is indicative of a CD3+ cell.
- Olek further describes methods for methylation analysis of CpG positions in CD4+ and/or CD8+ genes, in particular CDS beta gene, or in other genes, and for determining immune status based on T- lymphocytes identified by methylation analyses, and for monitoring amounts of T-lymphocytes in response to chemical and/or biological substance exposure, in particular CD4+ or CD8+ T lymphocytes.
- Shen-Orr et al. 2010, Nature Methods Vol. 7:4, 287-289 describes a cell-type specific significance analysis of microarrays for analyzing differential gene expression for each cell type in a biological sample from microarray data and relative cell type frequencies.
- Shen-Orr's method relative abundance of each cell type in a mix tissue sample is first quantified, and this information is used in combination with microarray gene expression data to deconvolve and compare cell type-specific average expression profiles for groups of mixed tissue samples.
- a method similar to regression calibration is provided herein for determining changes in the distribution of white blood cells between different subpopulations (e.g. cases and controls) using DNA methylation signatures ro DNA methylation profiles, in combination with an external validation set having methylation signatures from purified leukocyte samples.
- the method is demonstrated with Head and Neck Squamous Cell Carcinoma (HNSCC) cases and matched controls, showing that DNA methylation signatures register known changes in CD4+ and granulocyte populations.
- HNSCC Head and Neck Squamous Cell Carcinoma
- DMRs as markers of immune cell identity
- a high density methylation platform and a set of analytical tools for estimating the proportions of immune cells in unfractionated whole blood to determine the DNA methylation signature of each of the principal immune components of whole blood (B cells, granulocytes, monocytes, NK cells, and T cells subsets).
- a form of regression calibration was determined that considers a methylation signature as a high-dimensional multivariate surrogate for the distribution of white blood cells. This distribution was used to predict or model disease states.
- the DNA methylation signature was assumed to be a highly correlated measure of leukocyte distribution, and thus fits into the framework of measurement error models, in which the use of a noisy surrogate marker to investigate an association with a disease outcome of interest results in biased estimates, unless internal or external validation data are obtained to "calibrate” the model and correct the bias (Carroll et al., 2006, Measurement error in nonlinear models. Chapman & Hall, Boca Raton, Florida, 2 nd edition).
- Measurement error problems are formulated as a set of relationships between z, the disease outcome (e.g. case/control status), ⁇ , the gold standard (e.g. leukocyte distribution), and y, the surrogate (e.g. DNA methylation).
- ⁇ ) was difficult to estimate due to the cost or logistical complications involved in obtaining ⁇ in a large number of samples.
- Examples herein include methods for an estimation technique, theoretical treatment of bias, and a demonstration of the approach through an application to whole blood specimens collected in an example of head and neck squamous cell carcinoma (HNSCC). See Figure 3. Also provided are methods for a sensitivity analysis, demonstrating the impact of possible biases. Simulation study results are shown in examples herein based on the biology in the samples used.
- HNSCC head and neck squamous cell carcinoma
- Examples 1-3 herein show a method for determining changes in distribution of white blood cells between different subpopulations (e.g. cases and controls) from DNA methylation signatures, assuming an external validation set consisting of methylation signatures from purified white blood cell (WBC) samples exists.
- Examples 4, 10 andl 1 herein demonstrate the methodology using a data set of HNSCC cases and matched controls, inferring from DNA methylation assays alone known changes in CD4+ and granulocyte populations between cases and controls and change in CD4+ populations due to aging. Using previous methods flow cytometry would have been necessary to obtain the same results. A method for assessing the sensitivity of the magnitude estimates to possible biases is also provided.
- Example 12 validates the method through simulation.
- Methods are provide herein for determining changes in the distribution of white blood cell types between different human populations (e.g. cases and controls) using DNA methylation signatures; by using an external validation set having methylation profiles from purified white blood cell components.
- DNA methylation in peripheral blood was accordingly shown to be a biomarker for clinical and epidemiological investigation.
- a solution to partition this component of variation in methylation from other determinants employs multivariate analytic tools including regression coefficients, associated inference, and coefficients of determination measures. These tools were used to evaluate whether the observed DNA methylation differences were due to an immunologically mediated response.
- Prior measurement error formulations (Thurston et al., 2003, J Stat Plan Inf, 1 13, 527-34; Li and Yin, 2007, Ann Stat, 35, 2143-2172) require specification of a logistic regression model for case/control status, conditional on DNA methylation signature, a computationally difficult task that is vulnerabe to model mis-specifications.
- a reverse formulation was used herein that naturally models the relationship of DNA methylation conditional on known phenotypes.
- the formulation respects the protocol (DNA methylation assay data collected after sampling from phenotype groups).
- Other strategies to formulate errors were found to be unsuccessful.
- the strategy utilizing Expectation-Maxinlization (EM) algorithm to integrate over the missing data ⁇ (Little and Rubin, 2002, Statistical Analysis with Missing Data. Wiley, Hoboken, NJ, 2 nd edition) is outside the measurement error literature and within the larger missing-data literature.
- EM Expectation-Maxinlization
- the distribution of ⁇ varied substantially between the data sets S 0 and S 1 , severely complicating the approach, with side- effect of introducing feedback from S 1 to S 0 , contaminating the gold-standard status of S 0 .
- Another alternative that was found to be unsuccessful was the simpler approach of an empirical Bayes procedure, similar to existing mixture-model approaches (Koestler et al., 2010,
- Examples herein show that group level comparisons of blood cell DNA methylation revealed significant immune alterations. Methods for individual level immune cell profiling are applicable also, since methods herein are useful also to clinical and detailed analytical epidemiologic applications that examine individual risk factor information.
- Zn involves an orthogonal (e.g. one-way ANOVA) parameterization and ordinary least squares (OLS) is used to obtain Bi
- projections ⁇ serve as estimates of individual profiles.
- There is interest in minor immune cell fractions and their role in disease though the signal strength of cell types comprising ⁇ 5% of the total white cell compartment is difficult to quantitate. Examples of such cell types include the regulatory T cell or NK cell fractions, which are implicated in autoimmune and malignant diseases. Optimization of platforms for technical sensitivity to minor subtypes combined with statistical optimization of signature recognition are needed to enhance the approach for testing highly targeted immune hypotheses.
- immune cell profiling at the individual level is important for examining individual risk factors in clinical and detailed analytical epidemiologic applications. As shown in Examples herein, individual immune profiles are theoretically achievable and require extensive validation with a wide array of mixture combinations.
- the methods herein have potentially far reaching implications for rapid, simple and complete assessment of the composition of human white blood cell populations, i.e. the immune profile.
- assessment of the cellular composition of peripheral blood cannot be accomplished without the use of freshly drawn venous blood that is immediately prepared in a specially equipped laboratory.
- a complete assessment of the entire immune profile requires extensive flow cytometric measurements based on protein epitopes on leukocyte membranes that distinguishes subtypes of immune cells that are either too rare or too similar in appearance to be distinguished using simple microscopic approaches.
- flow cytometry is limited by the following: cells must be separated, requiring large volumes of fresh cells; detection can be accomplished only by the fluorescent antibody tags available, which require expensive technology to read; the outer cell membrane must be intact, mandating limited utility in many instances.
- the methods herein obviate the need for fresh blood and the preservation of labile protein epitopes.
- the methods herein are able to also simultaneously assess all of the individual components of the peripheral blood using a highly multiplexed molecular platform and therefore logistically straightforward.
- the statistical methodology used here is implemented easily with the instrumental output of the methylation arrays, which simplifies the interpretation of the immune profile data from the operator's point of view.
- the methods herein are immediately deployed in a research framework to cost effectively assess human immune profiles (in fresh or archival samples), to explore the potential of the immune profiles to function as biomarkers, and to address key questions regarding disease pathogenesis. Furthermore, the approach used in the methods herein is readily suited for rapid translation to a broad base of clinical applications such as disease monitoring, diagnosis, prognosis, and response to therapy.
- the methods herein are applied to tumor biopsies for immune characterization of cancer patients.
- Other notable applications exist including the application of the test to urine sediments in patients with autoimmune and diabetic kidney disease or in patients undergoing kidney transplantation. Positive detection of T cells in urine sediment is indicative of immune activation and potential kidney disease progression or acute rejection in the context of kidney transplantation.
- Populations of blood lymphocytes can be distinguished morphologically on the basis of size and the presence of a granular cytoplasm.
- Small lymphocytes including all subsets of T- and B cells, are responsible for adaptive immune responses. Sublineages of small lymphocytes are morphologically indistinguishable and are distinguished by cell surface receptors and cellular function. B cells are typically distinguished by expression of the surface molecule CD19. They express immunoglobulins, which are surface receptors for pathogens. In addition, B cells are capable of further differentiating into effector cells called plasma cells. (Parham, P. The Immune System, Garland Science, New York, NY, 2005). Differentiated T cells exhibit a complex of surface molecules which function as antigen receptors, referred to as the T cell receptor (TCR) complex.
- TCR T cell receptor
- This complex includes the TCR a plus ⁇ , or ⁇ plus ⁇ antigen recognition chains, which are associated with invariant chain subunits CD3y, ⁇ , ⁇ , and ⁇ .
- T cells are distinguished from other cell lineages by expression of CD3 molecules on the cell surface.
- the genes that encode CD3 ⁇ , ⁇ , ⁇ , and ⁇ subunits are CD3G, CD3D, CD3E and CD3Z respectively.
- the former three genes are tightly clustered on chromosome 1 1, whereas CD3Z is located on chromosome 1.
- Differentiated T cells are further divided into two lineages depending on their expression of either CD4 or CD8.
- CD8+- T cells also known as cytotoxic T cells
- the main function of CD4+ T cells is to help other immune cells respond appropriately to sources of infection or malignancy.
- CD4+ T cells There are several subsets of CD4+ T cells, including Thl, Th2, Th l 7 and regulatory T cells. (Parham, P. The Immune System, Garland Science, New York, NY, 2005).
- Regulatory T cells suppress an immune response by influencing the activity of other cell types. They act primarily in the periphery on mature lymphocytes that have exited the main lymphoid tissues and serve as a means of preventing autoimmunity during protective immune responses.
- Exemplary regulatory T cells are thymus-derived CD4+CD25+Foxp3+ T cells, commonly referred to as Tregs.
- Tregs thymus-derived CD4+CD25+Foxp3+ T cells
- These cells primarily function to maintain peripheral self-tolerance.
- Forkhead Box P3 (FOXP3) a transcription factor expressed by Tregs, is an important developmental and functional factor that regulates Treg immunosuppressive functions.
- NK cells Natural killer cells are large CD56+ lymphocytes with a granular cytoplasm. They enter infected or malignant tissue to kill damaged cells and secrete cytokines aimed at preventing the spread of disease to other cells or tissues. Thus, NK cells act as effector cells of innate immunity. A subset of CD56+ NK cells that express CD3 surface molecules are NKT cells.
- RPMM recursively partitioned mixture modeling
- Resultant t- values from each comparison were converted to p-values in R version 2.11.1 of Illumina's software which provides convenient mechanisms for loading and analyzing the results of methylation status, and for quality control and basic visualization tasks.
- a negative t-value indicates the locus putatively represents a DMR that is unmethylated in group 1 leukocyte lineage(s) and methylated in group 2 leukocyte lineage(s).
- a positive t-value indicates that the locus putatively represents a DMR that is methylated in group 1 leukocyte lineages and unmethylated in group 2 leukocyte lineages.
- a DMR that is unmethylated in the leukocyte lineage(s) of interest and methylated in other leukocyte lineages would make the best epigenetic biomarker, since unmethylation is associated with transcriptional activity whereas methylation is associated with transcriptional silencing. Therefore, significant CpG loci exhibiting negative t-values are preferred.
- results of locus by locus comparisons were merged with cell type specific gene expression data.
- Palmer et al., 2006, BMC Genomics 7, 1 15; Du et al, 2006, Genomics 87, 693-703; and Hashimoto et al, 2003, Blood 101, 3509-3513 to identify putative DMRs that are in genes associated with altered expression by Group 1 leukocyte lineages compared to Group 2 leukocyte lineages.
- An exemplary candidate epigenetic biomarker of a specific leukocyte lineage is an unmethylated region of a gene that is highly expressed by the leukocyte lineage, and not expressed by other cell types such as lineage-specific surface molecules,obligate differentiation proteins, and secreted factors.
- a further candidate is a methylated region of a gene that is not expressed by the leukocyte lineage and is expressed by all other cell types. Without being limited by any theory or mechanism of action scenarios correlate with chromatin packaging, so that differential DNA methylation plays a large role in regulating leukocyte lineage specific expression of the gene. If no leukocyte lineage specific difference in expression of the gene containing a putative DMR were observed, other modes of gene regulation such as activators, repressors, and enhancers overshadow the role of chromatin packaging in regulating expression of the gene. Alternatively, such a gene is expressed in a temporally or environmentally specific manner that was not elucidated by the gene expression candidate data. Such a putative DMR would not be an ideal target to explore as an epigenetic biomarker of that leukocyte lineage.
- DMR validation is performed for each putative DMR identified from array data using bisulfite pyrosequencing and/or MethyLight quantitative real time PCR assays that measure DNA methylation of the gene region in all sorted human leukocyte samples shown in Table 15, Example 13.
- Bisulfite pyrosequencing assays were designed using Pyromark Assay Design 2.0 (Qiagen), and carried out on a Pyromark MD pyrosequencer running Pyromark qCpG software (Qiagen). Oligonucleotide primers were obtained from InvitrogenTM by Life TechnologiesTM.
- the gene region of interest were PCR amplified from bisulfite converted DNA using a biotinylated reverse primer and an unlabelled forward primer.
- the biotinylated PCR product was complexed with sequencing primers that anneal upstream from the target region, and was then incubated with enzymes and substrates.
- dNTPs were dispensed in a specific order and light emitted with the incorporation of each nucleotide is measured with a CCD camera. Methylation was quantified by calculating the ratio of cytosine (methylated) to thymine (unmethylated) at each CpG locus.
- MethyLight® qPCR to be unmethylated in group 1 leukocytes and in some group 2 leukocytes, was not confirmed as an epigenetic biomarker specific to the group 1 leukocyte lineage(s). Instead that DMR represents an epigenetic biomarker of several different human leukocyte lineages including the group 1 lineage(s).
- a DMR that is partially unmethylated by bisulfite pyrosequencing or MethyLight® qPCR in group 1 leukocytes and methylated in group 2 leukocytes, is a weak epigenetic biomarker of the group 1 leukocyte lineage(s). That DMR is heterogeneously unmethylated in group 1 leukocytes and is homogeneously methylated in group 2 leukocytes and is therefore not useful for distinguishing group 1 from group 2 leukocyte lineages.
- Gliomas are a histologically diverse cancer with few established risk factors and poor prognoses (Kleihues et al. 1993, Brain Pathol 3(3): 255-68; Ohgaki and Kleihues 2005, Acta Neuropathol 109(1): 93-108: Louis et al. 2007, Acta Neuropathol 114(2): 97-109; Ohgaki, and Kleihues 2007, Am J Pathol 170(5): 1445-53).
- immune factors are associated with increased glioma risk and are also thought to play a role in patient outcomes (Wiemels et al. 2009, Int J Cancer. 2009 Aug 1 ; 125(3):680-7; Yang et al.
- TILs tumor infiltrating lymphocytes
- CD3Z CD247
- Examples herein show the validity of CD3Z demethylation as a CD3+ T cell marker and illustrate its application in patients with glioma that demonstrate the high discriminating value of CD3Z demethylation in glioma case-control subject comparisons, histopathological characterization of tumors and patient prognosis.
- CD3+ T cells and Tregs in peripheral blood from GBM patients were observed to be reduced about two-fold in GBM patients, which was highly statistically significant.
- Validation studies herein support the notion that the CD3Z MS-qPCR assay using unprocessed archival whole blood is an accurate reflection of T cells as measured by conventional flow cytometry.
- Previous studies have validated the FOXP3 demethylation assay as a measure of Tregs in blood and tissues (Baron et al., 2007, Eur J Immunol 37(9): 2378-89).
- Treg/T cell ratios were herein observed to be higher in current smokers versus former smokers ( Figure 16). It was subsequently confirmed in an independent population that current but not former cigarette smoking exhibit higher Treg/T cell ratios. Results herein illustrate the need for examination of patient characteristics to include cigarette smoking in diseases that affect Treg levels. New epigenetic methods described herein are useful in promoting these types of studies.
- CD3Z and FOXP3 demethylation in brain tumor cells lines and in human GBM xenografts which cannot contain human T cells were assessed. These samples contained non-detectable levels of CD3Z or FOXP3 demethylation.
- Some subtypes of NK cells (CD56 dim CDl 6 bright ) utilize CD3Z in NK receptor signaling (Lanier, 2006, Trends Cell Biol 16(8): 388-90). The contribution of CD3Z expressing and demethylated NK cells to the overall CD3Z demethylated signal in peripheral white blood cells is estimated to be very small. Furthermore, NK cells have not been observed in glioma tissues.
- the fundamental innovation in the epigenetic analyses described herein is a shift in immunodiagnostics away from proteomic-based approaches to one that is based on quantifying cell type specific DNA methylation events.
- This new approach produces gains in versatility, sensitivity, feasibility and throughput compared with conventional flow cytometry or IHC and does so at a lower cost.
- the high chemical stability of cytosine methylation marks within genomic DNA and the fact that differentiation within the immune system is tightly linked with gene specific DNA methylation events makes quantification of immune cells through epigenetic analyses a unique approach.
- the method combines the intrinsic chemical stability of DNA with the high sensitivity of qPCR methods. Automation and liquid robotic handling in processing and analysis add further to the power of the methodology and open avenues for investigations in the immunoepidemiology of glioma and many other diseases.
- Methods herein show that blood-based DNA methylation signatures across a complex cellular mixture of WBCs are useful for distinguishing solid tumor cancer cases in which there are well-defined immune-mediated responses and controls.
- tumorigenesis elicits a distinct immune response (Camilleri-Brot S et al, 2004, Ann Oncol 15: 104-112; Wang Y et al, 2005, Am J Clin Pathol 124:392 ⁇ 01 ; Rui L et al, 201 1 Nat Immunol 12:933-940)
- the result is a hematopoietic shift in WBC populations, which can be precisely discerned by applying the unique epigenetic signature of differing lineages.
- the aggregate methylation signature in blood that distinguishes cancer cases from controls corresponds to the epigenetic signatures that define leukocyte subtypes.
- the epigenetic landscape of WBCs was obtained by identifying DMRs among leukocyte subtypes. This analysis revealed that nearly all of the highest ranking 50 leukocyte DMRs (Example 25) were differentially methylated between disease cases and normal controls for HNSCC and ovarian cancers, with a smaller fraction differentially methylation between bladder cancer cases and controls. Among the eight overlapping CpG loci that were found to be significantly differentially methylated between cancer cases and controls across the three data sets, the direction of the relationships was similar for HNSCC and ovarian cancer cases compared to controls. These findings show that HNSCC and ovarian cancer elicit similar shifts in leukocyte compositions in the hematopoietic system.
- NFE2, ASGR2 several are located within genes with either established or alleged involvement in immune differentiation or function, viz., CD72, PACAP and FGD2 (Kumanogoh and ikutani, 2001, Trends Immunol 22:670-676; Parnes and Pan, 2000, Immunol Rev 176:75-85; Tan et al., 2009, Proc Natl Acad Sci 106:2012- 2017; Huber C et al., 2008, J Biol Chem 283:34002-34012).
- CD72 a member of the C-type lectin superfamily, negatively regulates B cell coreceptor signaling (Kumanogoh and Kikutani, 2001) and has been shown to act as a unique inhibitoiy receptor on NK cells regulating cytokine production (Alcon VL et al., 2009, Eur J Immunol 39:826-832).
- PACAP has been implicated as an intrinsic regulator of regulatory T cell abundance after inflammation36 and FGD2 has been shown to play a role in leukocyte signaling and vesicle trafficking in cells specialized to present antigen in the immune system (Huber C et al., 2008, J Biol Chem 283:34002-34012).
- HNSCC cancer was predicted with high degree of sensitivity and specificity. Similarly high prediction performance was obtained for ovarian cancer using the DNA methylation profile for the highest ranking ten leukocyte OMRs and patient age group. Prediction performance for bladder cancer, based on the methylation profile of the highest ranking 56 DMRs, patient age, gender, smoking status, smoking pack years, and family history of bladder cancer, was lower than that observed for HNSCC and ovarian cancer.
- the 56 leukocyte DMRs used in the bladder profile analysis were less correlated with the nine CpG loci identified via the previously reported SSRPMM analysis of this data set (Marsit CJ et al., 201 1, J Clin Oncol 29: 1 133-1 139).
- Alternative biological epigenetic mechanisms may be operative in bladder cancer in addition to the epigenetic signatures characteristic of leukocyte subtypes, and contribute independently to the blood-derived differences in DNA methylation between bladder cancer cases and controls.
- Examples herein provide evidence that observed differences in blood-derived DNA methylation in cancer cases are largely explained by systematic differences in the methylation signatures of leukocyte sub-populations. These findings signify that different cancers elicit a discernible, unique immune response evident in peripheral blood. These results have important implications for research into the immunology of cancer. Further, the approach of observing differences in blood derived DNA methylation provides a completely novel tool for the study of the immune profiles of diseases where only DNA can be accessed; that is, this approach has utility not only in cancer diagnostics and risk-prediction, but can also be applied to future research (including stored specimens) for any disease where the immune profile holds medical information. The approach represents an extremely simple, yet truly powerful and important new tool for medical research and may serve as a catalyst for future non-invasive disease diagnostics.
- NK cells Natural kil ler cells are a key element of the innate immune system implicated in human cancer.
- HNSCC head and neck squamous cell carcinoma
- FTNSCC Head and neck squamous cell carcinoma
- Natural killer (NK) cells are of particular interest in the context of HNSCC and other cancers, since they are able to recognize and destroy pre-cancerous and malignant cells (Kim R et al., 2007, Immunology, 121 : 1-14; Ostrand-Rosenberg S. 2008, Curr Opin Genet Dev, 18: 1 1-8; Whiteside TL, 2006, Cancer Treat Res, 130: 103-24; Parham P. The Immune System. 2nd ed. New York, NY: Garland Science; 2005).
- NKT natural killer T
- Gastrointestinal and liver physiology 300:G516-25) Gastrointestinal and liver physiology 300:G516-25). Unlike previous studies, data shown herein evaluates the effects of these factors on the depression in NK immune profile. Patient risk factors and disease characteristics (e.g. tumor location) are evaluated herein in relationship to NK cells to determine the independent associations of HNSCC with innate immune parameters.
- NK cell-specific DNA methylation was identified by analyzing DNA methylation and mRNA array data from purified blood leukocyte subtypes (NK, T, B, monocytes, granulocytes), and confirmed via pyrosequencing and methylation specific quantitative PGR (MS-qPCR).
- NK cell levels in archived whole blood DNA from 122 HNSCC patients and 122 controls from a study population were assessed by MS-qPCR. Details of this study population have been previously described (Applebaum KM et al., 2007, Journal of the National Cancer Institute, 99: 1801-10). Briefly, peripheral blood from 122 control donors and 122 HNSCC patients was collected between December 1999 and December 2003 in the greater Boston area.
- DNA methylation biomarkers of NK cells represent an alternative to conventional flow cytometry that can be applied in a wide variety of clinical and epidemiologic settings including archival blood specimens.
- Described herein is a new method for measuring NK cell levels in human blood and tissue based on cell- lineage specific DNA methylation that can be applied to samples regardless of handling and storage procedures. This is a step forward in immune cell detection and quantification that is applicable to many types of clinical samples.
- Applying the method to a case-control study of HNSCC revealed a case-associated decrease in circulating NK cells that is independent of known risk factors and treatments. This shows that it is important to monitor NK cell levels in patients with HNSCC, and that it may be worthwhile to pursue future immune therapies may be designed aimed at restoring circulating NK cells in patients with HNSCC.
- methylation hot-spots or methylated CpG islands in the genome may also be identified by several of the recently developed genome-wide screen methods such as Restriction Landmark Genomic Scanning for Methylation (RLGS-M), and CpG island microarray.
- RGS-M Restriction Landmark Genomic Scanning for Methylation
- MethyLight is a highly sensitive high-throughput quantitative methylation assay, capable of detecting methylated alleles in the presence of a 10000-fold excess of unmethylated alleles using fluorescence-based real-time PCR technology that requires few or minor further manipulations after the PCR step.
- a MethylLight assay is commercially available from Q1AGEN, Inc. Valencia, CA.
- analyzing the methylation of any gene e.g., the
- CD3Z gene through amplification by Polymerase Chain Reaction is performed using digital PCR.
- Digital PCR is an improved method of PCR useful to overcome difficulties associated with conventional PCR.
- Conventional PCR assumes that amplification of nucleic acid is exponential and nucleic acids are quantified by comparing the number of amplification cycles and amount of PCR end-product to those of a reference sample. In practice however, several factors interfere with this calculation, making measurements uncertainties and inaccurate and hence unsuitable for highly sensitive measurements.
- a sample is partitioned so that individual nucleic acid molecules within the sample are localized and concentrated within many separate regions. Molecules can be counted by estimating by using a Poisson distribution. Each partition contains "0" or " 1 " molecules, or a negative or positive reaction, respectively.
- nucleic acids are quantified by counting the regions that contain PCR end-product, which is a count of positive reactions.
- a system for digital PCR based on integrated fluidic circuits (chips) having integrated chambers and valves for partitioning samples is commercially available. For example a digital PCR system is available from Life Technologies (Grand Island, NY 140721JSA) and QuantaLife QuantaLife Pleasanton, CA USA).
- Example 1 Statistical methods for using DNA methylation arrays as surrogate measures of cell mixture distribution
- Y oh represents an m x 1 vector of methylation assay values, e.g. average beta values from an
- Infinium bead-array product corresponding to a purified blood sample consisting of a homogenous cellular population (e.g. monocytes or granulocytes), with the qualitative characterization of the cell type indicated by a d Q x 1 covariate vector w,, .
- h e ⁇ 1,..., n 0 ⁇ and the m individual values correspond to CpG sites on a DNA methylation microarray, possibly pre-selected to correspond to putative DMRs for distinguishing different cellular types.
- Y .
- m x 1 represents an m x 1 vector of methylation assay values for the same CpG sites (in the same order) as ⁇ 0 ⁇ , but corresponding to a heterogeneous mixture of cells (e.g. peripheral whole blood) from a human subject.
- i e ⁇ 1 ,..., «, ⁇ , « is the number of target specimens
- the goal is to understand the associations between Y tract.
- a reasonable regression parameterization for z is also assumed, including an intercept, and for convenience, the first column of B 0 is denoted as ⁇ , , the m x l intercept.
- the error vectors e 0 and e l may reflect independence among arrays h and / , or else may have more complex random effects structure accounting for technical effects or biological replication; however, their substructures are incidental to this analysis, with the exception of the fine details of the bootstrap procedure proposed below.
- ⁇ is a d 0 ⁇ d x matrix that summarizes associations between the rows of B 0j and B 1( and
- SS V measures variability explained by mixtures of profiles in the set S 0
- SS measures variability in systematic biological heterogeneity that nevertheless remains unexplained by mixtures of profiles in S 0 , presumably due to some process other than differences in mixtures of cell types.
- R, 2 0 SS SS a , which represents the proportion of total variation in S 1 explained by S 0
- SS (SS 0 - SS e ) which represents the proportion of systematic variation in S 1 explained by S 0
- R, 2 is poorly defined when SS a * SS e .
- Estimation proceeds by applying an appropriate linear model, e.g. ordinary least squares, linear mixed effects models (Wang and Petronis, 2008, DNA Methylation Microarrays:
- B 0 (l m , B 0 ) , as described in detail in the Example 3.
- Standard errors can be obtained in one of three ways.
- the simplest estimator, SE 0 is the "naive" estimator from simple least squares theory, ignoring the fact that B 0 and B 1 are estimates, i.e. potentially variable. To account for variation in estimating B. , a simple alternative is to use a nonparametric bootstrap procedure.
- Example 2 provides a detailed analysis of such biases, and proposes a sensitivity analysis procedure for assessing the magnitude of possible bias in a given data set.
- DNA methylation arrays are typically focused on the comparison of methylated to unmethylated CpG dinucleotides, not quantifying actual amounts of DNA.
- Example 2 General designs for the treatment of methylation assay data obtained from purified cells S 0
- one sample is purified CD4+ T cells
- another sample is purified CD8+ T cells
- yet another sample is T-lymphocyte cells that have not been purified to more specific lineages.
- S 0 in the examples.
- the CD4+ sample may be identified as
- a two-stage estimation procedure is here introduced.
- the first stage of analysis involves estimation of B 0 and Bi by appropriate linear models, e.g. ordinary least squares (OLS) regression estimator and a similar estimator for ( ⁇ ,,B,) T ; a procedure such as limma; or else locus-by-locus linear mixed effects models that
- Naive standard error estimates for the (r, s)' h element of ( 0 , f T ) can be obtained by computing (m ⁇ v ⁇ a ⁇ ) 1 ' 2 .
- the naive standard error estimates fail to account for the variability in estimating B 0 and B j , and are consequently biased, as demonstrated in the simulations, Example 12.
- ⁇ be the variance-covariance matrix for the j"' row of B 0 .
- a resampled matrix B, 3 is formed by adding, to each row j of B 0 , a zero-mean multivariate normal vector with variance-covariance ⁇ ; , or a corresponding multivariate t-distribution with n 0 - d 0 degrees of freedom. Then ⁇ ⁇ and ⁇ ( are computed from (SI) by replacing B 0 with Bp (in addition to the previously mentioned replacement). This method is referred to as the
- double bootstrap ignores correlation between CpG sites within a single validation sample, and given the relative purity assumed for these samples and adequate correction for technical effects, this is reasonable to first order. As is demonstrated in Examples 6-9 and simulations (Example 10), there is negligible difference between the single and double bootstrap, so the incorporation of additional complexity to model cross-CpG correlations is unlikely to produce much benefit. However, the double-bootstrap has the additional benefit over the single-bootstrap, in that it can be used to assess bias due to measurement error (variability) in B 0 .
- ⁇ » ⁇ °'_ [ ⁇ ⁇ .
- Biases induced by biological non-orthogonality are more insidious.
- Non-orthogonal ⁇ may arise from two distinct sources. One occurs when some cell types have not been profiled in S 0 , so that ⁇ 3 ⁇ 4) ⁇ ⁇ 1 . The other may arise when some non- cell-mediated biological process (i.e. distinct from a change in cellular mixtures) nevertheless results in methylation profiles that appear similar to those that distinguish cell types profiled in S 0 ,.
- model represented by equation (4) is elaborated follows:
- the first term on the right hand side of (6) is the target quantity, identifying the desired mixture weights.
- the second term will be negligible if all profiles ⁇ are approximately orthogonal to the columns ofB 0 , or else the differences A > q are all small. This condition will be satisfied if S 0 is exhaustive in the sense that !-Li ⁇ is negligible.
- a key consideration is whether P annihilates the methylation signature corresponding to a given non-cell-mediated biological process.
- a Bayesian view is adopted to characterize a prior expectation of bias as a function of prior probabilities for individual CpG sites. The goal, in part, is to understand the potential for bias, given the number m of CpG sites chosen to be measured in S 0 , with the goal of selecting m in a manner consistent with minimizing bias.
- ⁇ kl as at most k nonzero values.
- a prior probability ⁇ ⁇ is assumed that the subset J kl could correspond to one or more biological processes that distinguish cases from controls. It follows from this view that the prior expectation of ⁇ is m C(m,k) ( m C(m,k) ( m C(m,k)
- ⁇ 0 ) theoretically independent of m , it does so at the cost of including many potentially noninformative CpGs, early on at low values of m , and these may be possible sources of bias in practice, without offering any modeling benefit in return. If the CpG sites are ordered by level of informativeness, then potentially H, submit 0( ⁇ ⁇ ) , and there will be a small increasing prior expectation of bias, motivating judicious choice of m .
- Example 4 Proof of concept of Measurement Error Model for determining changes in distribution of white blood cells between different subpopulations
- S 0 consisted of 46 white blood cell samples; the sorted, normal, human, peripheral blood leukocyte subtypes were purchased from AllCells®, LLC (Emeryville, CA) and were isolated from whole blood using a combination of negative and positive selection with highly specific cell surface antibodies conjugated to magnetic beads; materials and protocols were obtained from Miltenyi Biotec, Inc. (Auburn, CA). These 46 samples are summarized in Table 2 and depicted by the clustering heatmap in Figure 1. T lymphocytes that express CD4 or CD8 constitute over 95% of the T cell class. The pan-T cell type was further refined to CD4+, CD8+, and "other" Pan-T cells subtypes.
- the covariate vector w h consisted of indicators for five cell types and another two indicators for CD4+ and CD8+ T cell subtypes.
- a linear mixed effects model with a random intercept for bead chip was used to estimate B 0 ; 27 additional whole blood control samples (replicates from the same individual) were used to assist in estimating chip effects, since otherwise the data set would have been sufficiently sparse to risk confounding between cell type and chip. These "array controls" were indicated with an additional term in wo 3 ⁇ 4 .
- a linear mixed effects model with a random intercept for bead chip was used to estimate the corresponding row of B render and B j .
- Figure 5A depicts the relationship log 10 trH m by log 10 (m) for increasing array sizes.
- Figure 5B depicts the relationship dlogw tr(H m )/ dlog(m) by logi 0 (m) for increasing array sizes, obtained by smoothing the first differences of the curve depicted in Figure 5 panel A via loess smoother.
- Figure 5 panel A also shows the tangent (obtained from the loess curve) at low values of m. For 0(m) convergence, Figure 5 panel A should show a linear association with slope equal to one, and the curve in Figure 5 panel B should show a curve close to the value of 1.0.
- Example 5 Cell mixture experiment for validating the method for determining changes in distribution of white blood cells between different subpopulations
- Example 6 Application of the methods herein to the subpopulations of head and neck cancer patients and controls
- This example describes the application of the method herein for detennining changes in the distribution of white blood cells between different subpopulations to patients having head and neck squamous cell carcinoma (FINSCC).
- the target data set Si was obtained from arrays applied to whole blood specimens collected in a random subset of individuals involved in an ongoing population-based case-control study (Peters et al, 2005, Cancer Epidemiol Biomarkers Prev, 14(2), 476-82) of head and neck cancer (HNSCC): 92 cases and 92 age and sex matched controls. Blood was drawn at enrollment (prior to treatment in 85% of the cases).
- the clustering heatmap in Figure 3 depicts the raw DNA methylation data in Si.
- Table 4 presents coefficient case status, double-bootstrap bias estimates (estimates of bias arising from measurement error), as well as naive, single-bootstrap, and double-bootstrap standard error estimates. Each of these quantities is measured in percentage points (%). Estimates of bias arising from measurement error (i.e. substituting estimated quantities for known ones in a two- stage statistical procedure) were almost always less than half a percentage point, and for significant coefficient estimates, always towards the null.
- CD4+ T-lymphocytes decreased in cases compared with controls, with a bias-corrected estimate of -10:4 percentage points and approximate 95% confidence interval (- 13: l %;-3:3%); the proportion of NK cells decreased, with a bias-corrected estimate of -1.5 percentage points and 95% confidence interval (-2:2%;-0:75%); and the proportion of granulocytes increased, with a bias-corrected estimate of 7.6 percentage points and 95% confidence interval (4:2%; 10:9%). There was also some evidence of an increase in CD8+ T- lymphocytes, with an estimate of 4.5 percentage points and 95% confidence interval (4:5%; 7:0%).
- CD4+ T-lymphocytes decreased by 3.3 percentage points (-4:4%;-2:2%) per decade of age, and CD8+ T-lymphocytes increased by 2.0 percentage point (1 :0%; 3:0%) per decade. All other coefficients were insignificant.
- Treg cells a subclass of CD4+ T cells
- the bias estimates obtained from the double-bootstrap procedure allow the correction of bias arising from measurement error.
- there is no statistical procedure for correcting the other possible sources of bias those arising from changes in distribution among unprofiled cell types as well as non-immune-mediated methylation differences.
- Example 7 presents a detailed sensitivity analysis which shows that the magnitude of the resulting bias is likely to be small, less than a percentage point.
- Bias 2 Double-bootstrap bias estimate (x 100%).
- Bias 2 Double-bootstrap bias estimate ( x 100%)
- z consisted of case-control status, age (categorized in five-year increments), and two bisulfite conversion efficiency measures.
- Tables 6-8 presents result for case-control status and estimated regression coefficients for age in ovarian cancer data set. R (l was estimated at 17.8%, and was estimated at 86: 1 %.
- Bias 2 Double-bootstrap bias estimate (x 1 00%).
- Bias 2 Double-bootstrap bias estimate (x 100%).
- SE 2 Double-bootstrap standard error (x 100%). P-values were computed using SE 2 .
- CD4+ T cells there were significant systematic decreases in CD4+ T cells with increasing age, with a gradient consistent in direction and somewhat consistent in magnitude with the corresponding effect found in the HNSCC data set.
- the CD8+ T cell coefficients for were all positive, with gradient consistent in direction and somewhat consistent in magnitude with the corresponding effect found in the HNSCC data set. No bisulfite conversion coefficient was significant, and all coefficients were of small magnitude (Table 8; generally less than 1 percentage point per standard deviation).
- Example 8 Application of the methods herein to subpopulations of Down Syndrome patients and controls
- Rf Q was estimated at 4.5%, and was estimated at 67:6%.
- Rf fi was estimated at 81.4%, and R ⁇ was estimated at 98:9%.
- Example 9 Application of the methods herein to obesity in an African American population
- FIG. 8 shows a clustering heatmap displaying the DNA methylation data.
- z consisted of obesity status.
- Obese subjects had an estimated increase of 12 percentage points in granulocytes, bias-corrected 95% confidence interval (3:4%; 20%) and an estimated decrease of 4 percentage points in NK cells, bias-corrected 95% confidence interval (-7:7%;- 0:9%) (Table 10). No significant differences were found for other blood cell types.
- Bias 2 Double -bootstrap bias estimate ( x 100%).
- Table 1 1 White Blood Cell Distribution in HNSCC Controls
- Est Regression coefficient estimate ( x 100%), normalized so that estimates sum to
- Bias 2 Double-bootstrap bias estimate (x 100%).
- BC-Est bias-corrected estimate. If the coefficients represented a complete profiling of blood cell types, the estimates should sum approximately to one, even though the model does not explicitly constrain them so. In this case, the original bias corrected estimates (of leukocyte distribution in HNSCC controls) summed to 133%. The table shows the values re-normalized to 90%, the anticipated proportion of the cell types. The resulting estimated distribution of leukocytes is consistent with the literature (Alberts B et al, 2008, Molecular Biology of the cell. New York, NY: Taylor and Francis, 5 th edition)
- bias estimates evident from the double-bootstrap procedure admit the possibility of correcting the bias arising from measurement error.
- There is no statistical procedure for correcting the other possible sources of bias those arising from unprofiled cell types and non- cell-mediated profile differences, i.e. methylation difference signatures ⁇ with nonzero projection onto the space spanned by the WBC signatures.
- the magnitude of the bias was small: for the more likely low values of k, the bias was 0.1 to 0.25 of a percentage point. In addition, this analysis was conservative in that it assumed all of the effect in B l was due to non-cell -mediated processes, a strongly conservative assumption.
- the expected bias over the uniform posterior implied by ⁇ 0 was computed by iterated expectation, first by computing the mean bias for each choice of k, then forming the expectation over the binomial distribution j5/ «(100, ⁇ ), As noted in details described under "Bias" in Example 3 the result scaled linearly with ⁇ . The constant of proportionality was estimated to be 2.08 percentage points. In summary, if the prior expectation is of even moderate size ( ⁇ 0.1) that any one CpG among the 100 selected for this application will show systematic differentiation between cases and controls, then the implied bias would be expected to be less than a percentage point.
- Example 12 Simulations
- ni/2 cases and nJ2 controls were specified, no e ⁇ 100, 200, 500 ⁇ .
- methylation profiles were generated by a white blood cell population of 7% B cells, 62% granulocytes, 6% monocytes, 2% NK cells, and 13% were T cells, of which 65% were CD4+ cells and 35% were CD8+ cells, and the remaining 5% were unspecified (and assumed to have mean equal to the unsorted T-lymphocytes).
- Residual effects ⁇ 0) for controls were set equal to 0.1 times estimated intercept ⁇ ⁇ and residual effects plus multiples 10$ of the column of U corresponding to case.
- the constants of proportionality 0.1, 0.08, and 0.09 were chosen to correspond to assumed contributions of ⁇ to an overall methylation signature presumed to be dominated by profiled populations of white blood cells in specified proportions, with 0.08 used for the strong alternatives and 0.09 used for the Mixed Alternative.
- the constant 10 was used to amplify the scale of ⁇ so that its effect could be detected in simulation; it is noted that U was orthogonal to the white blood cell profiles, by construction.
- Estimates were biased towards the null, on the order of about a percentage point.
- Table 15 were purchased from AllCells®, LLC (Emeryville, CA). These leukocytes were sorted in a column with antibody-conjugated magnetic beads using a combination of positive and negative selection. Genomic DNA from the leukocytes was extracted according to
- the array was fluorescently stained, scanned, and fluorescent intensities of each of the unmethylated and methylated bead types were measured.
- the ratio of fluorescent signals is computed from both alleles using the following equation: + 100.
- the ⁇ -value is a continuous variable ranging from 0 (unmethylated) to 1 (completely methylated) that represents the methylation at each CpG site and is used in subsequent statistical analyses.
- Data were assembled with BeadStudio methylation software from lllumina, Inc. (San Diego, CA). Bibikova, M., et al , Epigenomics 1, 177-200 (2009).
- a comparison of methylation in sorted normal human immune cells was observed to produce distinct profiles of methylation markers for further consideration.
- DMA Methylation profiles distinguished lymphocytes from myeloid derived leukocytes.
- RPMM Recursively partitioned mixture model
- Candidate DNA regions with high potential to discriminate CD3+ T cells from non-T cells were chosen based on the criteria of being differentially demethylated and differentially overexpressed in CD3+ T cells compared with other cell types (monocytes, granulocytes, NK cells, and B cells). Two quantitative methylation methods, bisulfite pyrosequencing and MS- qPCR, were used to confirm array methylation.
- Example 14 Patient characteristics and biological samples for determining CD3+ T cell distribution in glioma cases and controls
- Pertinent data for this analysis included age at histological diagnosis, gender, vital status, and survival time between diagnosis date and date of death for those deceased or between diagnosis date and date of last contact for those alive, and any of cigarette smoking history and exposure to steroids, chemotherapy and radiation therapy.
- Tumor samples were defined as secondary GBM if the patients had prior histological diagnosis of a low-grade glioma. All ages are given at the time of surgery, which occurred at UCSF between 1990 and 2003.
- This tumor set contained the following histological subtypes: 2 pilocytic astrocytoma (PA), 15 ependymoma grade II (EPII), 20 oligodendroglioma grade II (ODII), 16 oligoastroglioma grade II (OAII), 3 oligoastroglioma grade III (OAIII), 23 astrocytoma grade II (ASII), 4 astrocytoma grade III (ASIII) and 37 astrocytoma grade IV, also called glioblastoma multiforme grade IV (GBM), ten of which were recurrent and five of which were secondary.
- PA pilocytic astrocytoma
- EPII 15 ependymoma grade II
- ODII oligodendroglioma grade II
- OAII oligoastroglioma grade II
- OAIII oligoastroglioma grade III
- ASII astrocyto
- Sorted, normal, human, peripheral blood leukocyte subtypes were isolated from different non-diseased individuals' whole blood by MACS using a combination of negative and positive selection with highly specific cell surface antibodies conjugated to magnetic beads. The purity of separated cells was determined with flow cytometry to be >97%.
- Example 15 Bisulfite pyrosequencing and MS-qPCR assays for validating CD3Z, CD3E and FOXP3 specific DMRs
- the latter procedure mimics the conditions of detection that exist in differentiating different relative numbers of CD3+ T cells and Tregs within a mixture of cells in a complex biological sample.
- CD3Z the four-point standard curve used 10,000, 1,000, 100, and 10 bisulfite converted CD3+ T cell DNA copies; absolute quantification of FOXP3 used, 5,000, 500, 50 and 5 bisulfite converted Treg cell DNA copies.
- CD3Z Probe 6FAM CCAACCACCACTACCTCAA (MGB,NFQ) (SEQ ID NO: 102)
- the CD3E specific DMR DNA methylation status of the DMR in CD3E gene was measured by pyrosequencing bisulfite converted DNA from sorted, human, peripheral blood leukocytes.
- Figure 10 panel A The CD3Z specific DMR, DNA methylation status of the DMR in CD3Z gene was measured by MethyLight® qPCR. of converted DNA from sorted, human, peripheral blood leukocytes ( Figure 10 panel B).
- the genomic region containing the CD3Z DMR is shown in Figure 1 1.
- Standard calibration curves were used to determine if the newly identified CD3Z DMR was useful to quantify CD3+ T cells, Tregs (FOXP3 demethylated) and ratios of Tregs/CD3+ T cells in biological specimens such as whole or separated blood or other tissues.
- quantitative real time methylation specific PCR was performed. DNA isolated from purified cell types was bisulfite converted and serially diluted into a background of fully methylated commercial DNA standard (Qiagen). This method is referred to herein as "CS-DM assay" or assays.
- Example 16 Flow cytometry of blood lymphocytes in whole blood for quantification of CD3+ T cells
- Cells were labeled by direct staining with the appropriate fluorochrome-conjugated antibodies (eBioscience Inc, San Diego, CA), and were incubated for 20 minutes in the dark at 4 °C; CD3-fluorescein isothiocyanate (FITC, cat # 1 1 - 0038-41), anti-CD4-allophycocyanin (APC, cat # 17-0048-41 ), anti-CD8-phycoerythrin (PE, cat #12-0086-41), and anti-CD45-PerCP-Cy5.5 (cat #45-0459-41). Isotype control mAbs were used as negative controls.
- FITC CD3-fluorescein isothiocyanate
- APC anti-CD4-allophycocyanin
- PE anti-CD8-phycoerythrin
- PE anti-CD45-PerCP-Cy5.5
- Isotype control mAbs were used as negative controls.
- Example 17 Tumor immunohistochemistry (IHC) for measuring levels of tumor infiltrating lymphocytes (TIL) in glioma tumors
- Example 18 Statistical analysis of differential methylation in CD3+ T cells for identification of cell-specific OMRs
- MACS sorted leukocyte DNA methyation data consisting of un-normalized average beta values from the Illumina HumanMethyation27 microrray were calculated from probe intensities using Illumina GenomeStudio.
- Locus by locus comparisons of DNA methyation between the sorted cell types were performed using a linear mixed effects model (controlling for beadchip) in SAS version 9.2, thereby generating estimates and p-values for differential methyation in CD3+ T cells compared to other cell types.
- Resultant p-values were adjusted for multiple comparisons using the qValue package in the software program R project for statistical computing, version 2.13 available for downloading from the internet, and q-values of less than 0.05 were considered significant. All correlations, F-tests, Wicoxon rank sum and Kruskal-Wallis one-way analysis of variance by ranks tests were carried out in R version 2.1 1.1 and survival analysis was performing using the survival pack in R version 2.1 1.1.
- Example 19 Discovery and validation of CD3Z demethylation as a marker of CD3+ T cells
- the search for genes containing DMRs specific for CD3+ T cells using methods herein revealed candidate CpG sites within the genes encoding several components of the T cell receptor (TCR) complex; namely, CD3D, CD3E, CD3G, and CD3Z.
- TCR T cell receptor
- Myeloid derived blood cells (granulocytes, neutrophils, monocytes) and B-lymphocytes contained methylated CpG sites within CD3D, CD3E, CD3G and CD3Z loci compared with T cells, which were demethylated.
- CD3Z was also unmethylated in CD16+ NK cells, but was methylated in CD 16- NK cells.
- CD3D, CD3E and CD3G genes are CpG sparse compared with CD3Z, which contains a CpG island that is optimally suited for designing MS-qPCR assays (Fig. 1 panel A).
- CD3Z locus was analyzed for the development of a CD3+ T cell epigenetic marker.
- Pyrosequencing of CD3Z showed the extent of differences in demethylation among immune cell lineages, which approaches complete demethylation in CD3+ T cells and nearly complete methylation in other cell lineages ( Figure 20 panels A-B).
- Example 20 Determination of T cells and Tregs levels in peripheral blood by CD3Z and FOXP3 MS-qPCR assays in glioma cases and controls
- Use of dexamethasone or chemotherapy was not associated with T cell measures.
- Non-GBM (n 6) 18.5 (3.5-26.6) 0.9 (0.2-1.6) 6.0 (3.8-7.1)
- Example 21 Determination of T cells and Tregs levels in tumor infiltrates by CD3Z and FOXP3 MS-qPCR assays in excised glioma tumors.
- Tregs as measured by CD3Z demethylation assays were divided into two groups. In each panel the top trace represents survival data of the group of patients for whom the measured variable (methylation status of CD3+ T cells, or of Tregs, or a ratio Tregs/T cells) was below the median observed for that variable, and the bottom trace represents survival data of the group of patients for whom the measured variable was above the median observed for that variable.
- the measured variable methylation status of CD3+ T cells, or of Tregs, or a ratio Tregs/T cells
- Example 23 Cells, and cancer patient and control datasets for determining DNA methylation based epigenetic signatures for differentiating patients and controls
- Sorted, normal, human peripheral blood leukocyte subtypes were isolated from whole blood by magnetic activated cell sorting (MACS) (AllCells LLC, Emeryville, CA). The purity of separated cells was confirmed with flow cytometry to be >97%. Genomic DNA was extracted and purified from cell pellets using a commercially available method (Qiagen, Valencia, CA), treated with sodium bisulfite (Zymo Research, Irvine, CA) and subjected to methylation profiling using the Infinium HumanMethyation27 BeadArray (Illumina, San Diego, CA). This same platform was used for the analysis of samples from the case-control studies described below.
- MCS magnetic activated cell sorting
- the ITNSCC data set consists (Table 19) of 92 incident cases from the greater Boston area and 92 cancer-free population-based control subjects from the same region (Applebaum
- PLoS One 4:e8274, 2009 is publicly available from Gene Expression Omnibus (GEO, http://www.ncbi.nlm.nih.gov/geo/, Accession number GSE1971 1), and consists of 266 postmenopausal women diagnosed with primary epithelial ovarian cancer (131 pre-treatment and 135 post-treatment cases) from the UK Ovarian Cancer Population Study (UKOPS).
- GEO Gene Expression Omnibus
- Controls were cancer-free postmenopausal women for which annual serum samples were available. To avoid potential biases due to therapy, only pre-treatment ovarian cases were included in the analysis.
- the bladder cancer data set (Marsit CJ et al., 201 1, J Clin Oncol 29: 1133-1 139) consists of 223 incident bladder cancer cases identified from the New Hampshire state cancer registry and 237 population controls from the same region (Karagas MR et al., 1998, Environ Health Perspect 106: 1047-1050; Wallace K et al., 2009, Cancer Prev Res 2:70- 73). Table 20 provides a summary of the participant characteristics.
- Table 20 Characteristics of the study population in the Bladder cancer data set.
- Example 24 Statistical analysis of differences in methylation status in leucocyte subsets for determining signatures based on leukocyte DMRs
- the analytic strategy was aimed toward examining the extent to which peripheral blood DNA methylation of non-hematopoietic cancers is driven by the epigenetic signatures that define leukocyte subtypes.
- Linear mixed-effects models were used to assess differences in methylation across the leukocyte subtypes and controlled for the large number of comparisons using false discovery rate (fdr) estimation.
- Leukocyte DMRs were subsequently ranked based on their strength of association and the highest ranking 50 DMRs were examined across the three cancer data sets between cancer cases and cancer-free controls.
- Example 25 Prediction of methylation class membership based on epigenetic signatures from leukocyte derived DMRs
- Genome-wide DNA methylation was profiled in 46 samples of magnetic antibody sorted, normal human peripheral blood leukocyte subtypes (including B cells, granulocytes, monocytes, NK-cells, CD4+ T cells, CD8+ T cells, and Pan-T cells; Figure 28) using the Infinium
- DMRs (M) for subsequent clustering analysis of the training sets.
- the highest ranking 50, 10, and 56 leukocyte DMRs from the respective cross-validation procedures using the 10,370 putative DMRs initially identified were selected to cluster the observations in the HNSCC, ovarian cancer, and bladder cancer training sets respectively.
- the resultant clustering solutions were used to predict methylation class membership for the subjects within the respective independent testing sets.
- Figures 24 panel A, 25 panel A and 26 panel A depict heat maps of the respective testing sets by predicted methylation class for each cancer data set.
- Methylation classes derived from leukocyte subtype DMRs were significantly associated with cancer case status within each cancer type (permutation ⁇ 2 p-values ⁇ 0.0001, ⁇ 0.0001, 0.03, HNSCC, ovarian cancer, and bladder cancer data sets respectively), supporting the phenotypic relevance of predicted methylation classes based on leukocyte DMRs.
- OR 1.94 95% CI [0.95, 3.98], adjusted for age, gender, smoking and family history of bladder cancer.
- Mean delta-beta refers to the difference in mean methylation between cancer cases and controls (i.e. peases - controls).
- Example 26 Statistical analysis of methylation differences in leukocyte DMRs between cancer cases and cancer-free controls for determining epigenetic signatures specific to each group
- Linear mixed-effects models were used to assess differences in methylation across the leukocyte subtypes, modeling arcsine square-root transformed methylation as the response 1, leukocyte subtype as a fixed effect covariate, and a random effect term for plate/BeadChip.
- False discovery rate (fdr) estimation was used to control for the large number of comparisons and putative leukocyte DMRs were defined as those with fdr q-value ⁇ 0.05. Leukocyte DMRs were then ranked based on their strength of association using the F-statistics that resulted from the respective linear mixed-effects models.
- Methylation differences among the highest ranking 50 leukocyte DMRs were examined between cancer cases and cancer-free controls using a series of unconditional logistic regression models that were adjusted using available and relevant covariate information.
- a leukocyte DMR was considered differentially methylated if the nominal p-value from the unconditional logistic regression model was less than 0.05.
- Permutation tests were then applied to each of the three data sets to determine if the number of differentially methylated leukocyte DMRs was significantly greater than expected by chance. Specifically, samples were randomly permuted (same permutation across the highest ranking 50 DMRs) and an unconditional logistic regression model was fit to the resampled data.
- the leukocyte DMR profile analysis involved splitting the full cancer data sets into equally sized training and testing sets ( Figures 29-32). Samples in the training set were clustered using the highest ranking M leukocyte DMRs, where M was determined from the total pool of putative DMRs using the previously described cross-validation procedure (Sincic N and Herceg Z, 2011, Curr Opin Oncol 23:69-76).
- RPMM Recursively Partitioned Mixture ModeB
- SS-RPMM semi-supervised RPMM2
- Methylation analysis was performed using The Infinium® HumanMethylation27 Beadchip Microarray (lilumina Inc., San Diego, CA), which quantifies the methylation status of 27,578 CpG loci from 14,495 genes, with a redundancy of 15-18 fold.
- the resultant ⁇ -value is a continuous variable ranging from 0 (unmethylated) to 1 (completely methylated) that represents the methylation at each CpG site and is used in subsequent statistical analyses. Data were assembled with the methylation module of
- GenomeStudio software (lilumina, Inc., San Diego, CA; Bibikova M et al, 2009, Epigenomics 2009; 1 : 177-200)
- Example 28 Validation of DNA Methylation Microarray results for identifying NK cell-specific DMRs by pyrosequencing Pyrosequencing assays to validate microarray results were designed using Pyromark Assay Design 2.0 (Qiagen Inc., Valencia, CA), and carried out on a Pyromark
- MD pyrosequencer running Pyromark qCpG 1.1.11 software (Qiagen Inc., Valencia, CA).
- Oligonucleotide primers were obtained from Life TechnologiesTM (Grand Island, NY).
- Example 29 Protein expression analysis by mRNA expression array for identifying NK cell-specific DMRs
- the Whole-Genome DASL HT Assay Kit (Illumina Inc., San Diego, CA) was used to obtain simultaneous profiles of more than 29,000 mRNA transcripts. Data were assembled with the expression module of GenomeStudio software (Illumina Inc., San Diego, CA). The mRNA expression array data was used in combination with DNA methylation array data to identify NK cell-specific DNA methylation.
- Example 30 Methylation specific quantitative polymerase chain reaction (MS-qPCR) analysis for quantification of NKp46 demethylation
- MS-qPCR was performed using solutions and conditions according to Campan M et al., 2009, Methods Mol Biol, 507:325-37 with the following modifications.
- a solution of 10X TaqMan® Stabilizer containing 0.1% Tween-20, 0.5% gelatin was prepared weekly. Each reaction of 20 ⁇ contained 5 ⁇ DNA, 11.9 ⁇ preMix, 3 ⁇ oligoMix, and 0.1 ⁇ Taq DNA polymerase. Cycling was performed using a 7900HT Fast Real- Time PCR System (Applied Biosystems, Foster City, CA); 50 cycles at 95 °C for 15 sec and 60 °C for 1 min after 10 min at 95 °C preheat. All samples were run in triplicate using the absolute quantification method.
- NKp46 reverse primer CCCATTCCCCTTCCACA (SEQ ID NO: 117)
- NKp46 probe (6FAM) CTCACCAACACAAAACAA (MGB, NFQ) (SEQ ID NO: 118 ) C-less forward primer TTGTATGTATGTGAGTGTGGGAGAGA (SEQ ID NO: 97)
- a conversion factor was used for a diploid human cell, which is 6.6 picograms (pg) of DNA ( 3.3 pg per copy) to calculate copy number.
- Normal human blood DNA quantified by UV absorption (Nanodrop, Inc) was used to generate a four point standard curve with 30,000 copies, 3,000 copies, 300 copies and 30 copies of genomic DNA. This standard curve was included on each sample plate to obtain
- NK cell DNA in known copy numbers was spiked into universal methylated DNA in ratios that maintained a constant total number of DNA copies (10,000 copies) in each reaction across the dilution scheme. This mimics conditions for detecting different relative numbers of NK cells within a complex mixture of cells in a biological sample.
- the four- point standard curve used 10,000 copies, 1,000 copies, 100 copies, and 10 copies of bisulfite converted NK cell DNA.
- Example 31 Statistical modeling of the DNA methylation microarray data for estimation of differential methylation
- NK cells and non-NK cells which included pan T lymphocytes, CD4+ T- lymphocytes, Tregs, CD8+ T-lymphocytes, B-lymphocytes, granulocytes and monocytes.
- Example 32 Statistical modeling of the RNA expression array for estimation of differential RNA expression
- RNA expression for MACS isolated NK cells was compared to each of the following MACS isolated leukocytes: pan T-lymphocytes, CD4+ T-lymphocytes, Tregs, CD8+ T-lymphocytes, B lymphocytes, ganulocytes and monocytes.
- NKp46 demethylation is a biomarker of NK cells
- Example 35 Samples from F1NSCC patients have diminished circulating NK cells
- the calibrated NKp46 MS-qPCR assay was used to measure the level of circulating NK cells in the peripheral blood of patients with FTNSCC and cancer free controls.
- NKp46 MS-qPCR measurements from cancer-free control blood samples were used to determine suitable cutoffs for NKp46 demethylation tertiles.
- the proportion of total HNSCC cases decreased significantly with increasing demethylation tertile (p> 0.001, Figure 37), indicating that HNSCC patients are more likely to have depressed levels of NK cells in their peripheral blood.
- Multivariate logistic regression controlling for age, gender, cigarette smoking, alcohol consumption, BMI, and HPV16 (E6 and/or E7) serology confirmed increased HNSCC risk for individuals in the lower two normal NKp46 demethylation tertiles (Table 25), strongly indicating that lower levels of NK cells in the peripheral blood are significantly associated with HNSCC.
- Example 36 Application of the methodology to mRNA data
- the statistical methods described herein for determining changes the distribution of white blood cells among different subpopulations are applicable to mRNA expression profiles with the following considerations.
- a mathematical consideration is that mRNA is typically analyzed on a logarithmic scale, yet the assumptions of the methods herein involve linearity on an arithmetic scale, since the mixing coefficients are assumed to act linearly on absolute numbers of nucleic acid molecules; thus, the proposed methods would require analysis of untransformed fluorescence intensities, for which skewed distributions would result in numerical instabilities.
- a biological consideration is absence of a linear relationship between cell number and mRNA copies, since proteins may be translated as a consequence of an initial burst of mRNA transcription upon cellular development, followed by significant mRNA degradation. In contrast, one would expect the average beta value provided by Illumina bead-array products, as well as similarly constructed quantities from other platforms to scale in proportion to the actual fraction of methylated nucleic acids with a biologically reasonable assumption of two DNA molecules per cell.
- the validation data set S 0 was obtained from Watkins NA et al., 2009, Blood 113: e l-e9, in which the illumina Human-6 v2 Expression BeadChip was used to characterize the mRNA expresion profile of eigt types of blood cells: B cells, granulocytes, erythroblasts, megakaryocytes, monocytes, natural killer cells, CD4+ T cells, and CD8+ T cells.
- erythroblasts nucleated progenitors of red blood cells
- megakaryocytes progenitors of platelets
- the target data set S l was obtained from Showe MK et al, 2009, Cancer Res 69: 9202-10, in which the same mRNA expression platform was used to characterize expression differences in isolated mononuclear cells between nonsmall cell lung cancer (NSCLC) cases and controls having non-cancer lung disease, adjusting for age, sex and smoking.
- NSCLC nonsmall cell lung cancer
- data was presented from 18 matched case samples, pre- and post-operative.
- the same methodology was used as for the DNA methylation data sets herein, ordering the 46,693 transcripts by F statistic according to their ability to distinguish six types of leukocytes. Of the 100 transcripts having the largest F statistics it was observed that 86 overlapped with the transcripts in Showe MK et al, 2009, Cancer Res 69: 9202-10.
- Table 26 presents results from 137 NSCLC cases and 91 controls, adjusted for age, sex, and smoking status.
- Table 27 presents results from 18 matched pre-operative and post-operative samples from NSCLC cases, where the analyzed outcome was the difference in untransformed expression (post-operative expression minus pre-operative expression), and coefficients displayed correspond to the intercept of l (analogous to a paired t-test). Perturbations in T cell distribution were consistent with known immunological changes resulting from NSCLC (Ginns LC et al, 1982, Am Rev Respir Dis 23: 265—9; Mazzoccoli G et al., 1999, In Vivo 13: 205-9), as well as with age and smoking.
- Table 27 White blood cell distribution comparing matched pre-operative and post-operative cases in SCLC mRNA data set
- Example 37 An array for high-throughput DNA methylation analysis
- VeraCode microbeads Illumina, San Diego, CA USA
- DNA sequences of regions in 96 different genes each sequence having one CpG dinucleotide shown within square brackets ( Figure 40) and used to determine methylation status of the gene.
- Veracode beads are cylindrical glass microbeads 240 microns in length by 28 microns in diameter with a surface suitable for attaching DNA, RNA, protein, antibody and other ligands for performing bioassays. For performing DNA methylation analysis various CpG specific DNA oligomers were attached to these beads.
- a microbead is inscribed with a high-density holographic code (24-bit), allowing development of very large numbers of bead types.
- a laser is shone at the high density codes of the beads they emit a signal specific to the code and the signal is detected by a CCD camera.
- the fluorescence of the bead indicates whether the particular CpG site carried by the bead is demethylated.
- the result is compared with the fluorescence readout obtained from DNA from a purified leukocyte sample.
- a VeraCode array is a collection of beads, each carrying a DNA oligomer specific for either the methylated or the unmethylated form of a particular CpG locus, distributed into different wells of a micro titer plate.
- a user selects all or a subset of nucleotide sequences containing CpG sites in a gene or genes of interest for attaching to VeraCode beads to have a custom designed VeraCode array particularly advantageous for the user's analysis.
- the Infmium HumanMethylation 27K data corresponding to all of the Magnetic activated cell sorting (MACS sorted leukocyte DNA were assembled in the methylation module of GenomeStudio, and the quality of the data was assessed by calculating Mahalanobis distances. All 47 samples yielded acceptable data.
- a matrix of ⁇ - values was generated with rows defined by microarray CpG locus and columns defined by sample identification.
- a corresponding matrix indicating cellular phenotypes was also generated, with rows defined by sample identification (in precisely the same order as the columns in the corresponding matrix) and columns defining the cell lineage(s) to which each cell lineage belongs.
- LME linear mixed effects
- the fixed effect groups were: Pan-T cell, CD4+ T cell, CD8+ T cell, Pan-NK cell, CD56 dim NK cell, CD56 bnght NK cell, B cell, granulocyte, neutrophil, eosinophil, and monocyte. Across all gene loci, this model generated coefficients for each fixed effect group indicating relative estimates of DNA methylation for each of the different cell types.
- Collapsing categories accounted for the hierarchical relationships among cell lineages and a linear transformation was applied to convert coefficient estimates to estimated mean value per cell type, resulting in a matrix B 0 of mean values, each row corresponding to a CpG locus and each column corresponding to a cell type.
- the model also generated an F-statistic for each locus that indicates how significantly different DNA methylation was between the cell types.
- DMRs differentially methylated regions
- the stochastic search algorithm was designed to maximize precision of estimated cellular fractions, under the assumption that the variance-covariance of the fraction estimates is proportional to (BjB 0 ) ⁇ ' .
- the corresponding diagonal element of (BjB,,) '1 was minimized; to optimize a set of cell types, the sum of the corresponding diagonal elements was minimized.
- the general strategy was as follows.
- the engine is a stochastic search algorithm that starts with an initial set of CpGs, which is the beginning choice for the "current" set. On each iteration a randomly chosen CpG from the current set is switched out with a randomly chosen CpG from the remaining (unselected) CpGs, and precision is compared between the current set and the "candidate" set. If the candidate set gives better precision then the switch is accepted. Otherwise it is rejected. Ideally, by the end of the algorithm, the acceptance rate should be 0%.
- Most Epigenome-wide association scans (EWAS) have attempted to estimate the marginal effect ( ⁇ , depicted in Figure 41, panel A) on measured DNA methylation, which are effects not adjusted for WBC distribution.
- ⁇ depicted in Figure 41, panel A
- a significant portion of the effect on DNA methylation is mediated through changes in WBC distribution as shown in Figure 41, panel B.
- the direct effect adjusted for WBC distribution is a , the direct effect adjusted for WBC distribution.
- ⁇ the effect of exposure or phenotype on WBC distribution
- ⁇ , ⁇ + u ( , where u ( is a zero-mean error vector.
- a is a p x 1 vector
- K cell types are assumed, so that ⁇ , is &K x 1 vector, ⁇ is a K x p matrix, and ⁇ is a K x 1 vector.
- Statistical inference is achieved by permutation. Specifically, the null distributions of a and ⁇ are obtained by permuting the exposure or phenotype of interest within z (only the components representing the covariate to be tested), and the null distribution of ⁇ is obtained by permuting the subject assignments corresponding to o) t . Adjustments for multiple comparisons are achieved by nesting within each permutation a loop that estimates ⁇ . , ⁇ ; , and ⁇ 7 for each individual CpG , with adjusted p-values obtained by comparing the maximum absolute values of a j , T j , and ⁇ . (over all CpGs ) to the corresponding statistics computed from each individual permutation. For comparison purposes, a similar permutation test can be applied for the marginal coefficient ⁇ .
- Table 28 shows the multiple-comparisons adjusted p- values for each coefficient corresponding to the covariate of interest ( ⁇ , a , ⁇ ) and overall WBC distribution effect on DNA methylation ( ⁇ ), obtained by permutation test using 5000 permutations.
- significance of a may be greater than, less than, or equal to the significance of ⁇ .
- the covariate of interest shows a strongly significant association with WBC distribution. It is noted that WBC shows significant overall association with DNA methylation.
- Example 39 Comparison of methods herein for estimating fractions of blood cell types with non-negative matrix factorization (NNMF)
- ⁇ ⁇ are the fractions of each blood cell type corresponding to subject i
- b is the vector of methylation fractions corresponding to blood cell type /; the methods herein provide techniques for estimating the fractions ⁇ ⁇ assuming the values of b, have been obtained from an external validation data set.
- non-negative matrix factorization could be used to estimate o a and b, simultaneously in absence of an external validation set.
- the do vectors ⁇ admiration are considered “factors”, and the o vectors (assumed to represent individual methylation profiles) are considered “basis vectors” and the number of factors d 0 must be provided to the NNMF algorithm.
- Example 5 NNMF was compared to methods herein (Examples 1-3). Highest ranking 100 and 500 pseudo-DMRs were selected on the basis of informativeness as in Example 4; for each choice, the constrained projection described in Examples 1 and 5 was used to impute specific cell distributions, then NNMF was performed assuming four, five, and six factors (i.e. factor values assumed to represent the fractions ⁇ note for one cell type I). The nmf function in the R package NMF was used with default settings. Since NNMF requires random inputs, NNMF was applied 100 times, each with different randomly generated starting values according to the default settings of the nmf function.
- Example 40 Quantitation of T cell Treg and CD16+CD56 d " n NK cell numbers by CD3Z.
- a droplet digital PCR technique was used to quantitate T cell, Treg and CD16+CD56 dim NK cell numbers using CD3Z, FoxP3 and NKp46 methylation assays described in Examples 15 and 30.
- Digital PCR is a refinement of conventional PCR methods and is used to directly quantify and clonally amplify nucleic acids.
- dPCR and traditional PCR differ in method of measuring nucleic acid amounts, as dPCR is more precise.
- the two PCR methods differ in that the sample is separated into a large number of partitions in dPCR, and the reaction in each partition is carried out individually. This separation produces a more reliable collection and sensitive measurement of nucleic acid amounts.
- T cells and Tregs were serially diluted, and copies of each of the targets were quantified as measures of cell numbers.
- Bisulfite converted DNA from whole blood, isolated human T-cells and Treg cells and from N cells was quantified using the emulsion partitioning method of BioRad QX100TM Droplet DigitalTM PGR (ddPCRTM) system. This system creates portioned PCR reaction using water-in-oil droplets for performing high- throughput digital PCR.
- the QX100 droplet generator partitions samples into 20,000 nanoliter- sized droplets. After PCR using a thermal cycler, droplets from the samples were streamed in single file on a reader (QX100 droplet reader).
- Figures 43 and 44 show that successful amplification and detection of CD3Z and Foxp3
- DMRs DMRs, respectively were obtained.
- Panel A of Figures 43 and 44 show dot plots indicating distinguishing of positive droplets and negative droplets.
- Panel B of Figures 43 and 44 show the calculated absolute numbers of positive PCR droplets.
- Results obtained from dilution of standard purified T cells shows correspondence of quantities of CD3Z and FoxP3 genes with extent of dilution and hence validity of dPCR as a detection method for methylation based assay of immune cell identity.
- Other partitioning approaches have been developed that employ microfluidic manipulation and results similar to the data obtained herein are expected from the use of such other methods of partitioning.
- Figure 45 shows quantitation of purified NK cells under different conditions and
- Figure 46 shows quantitation of whole blood and of purified leukocyte subsets by measuring demethylated NKp46 DMR described in Example 30.
Abstract
Methods using DNA Methylation arrays are provided for identifying a cell or mixture of cells and for quantification of alterations in distribution of cells in blood or in tissues, and for diagnosing, prognosing and treating disease conditions, particularly cancer. The methods use fresh and archival samples.
Description
Methods using DNA Methylation for identifying a cell or a mixture of cells for prognosis and diagnosis of diseases, and for cell remediation therapies Related applications
This application claims the benefit of provisional applications having serial numbers 61 /489,883 filed May 25, 201 1 entitled, "Methods of Immunodiagnostics using DNA
Methylation arrays as surrogate measures of the identity of a cell or a mixture of cells";
61 /509,644, filed July 20, 201 1 entitled "Methods of Immunodiagnostics using DNA
Methylation arrays as surrogate measures of the identity of a cell or a mixture of cells for prognosis and diagnosis of diseases,"; 61/585,892 filed January 12, 2012 entitled, "Methods of Immunodiagnostics using DNA Methylation arrays as surrogate measures of the identity of a cell or a mixture of cells for prognosis and diagnosis of diseases,"; and 61/619,663, filed April 3, 2012 entitled "Methods using DNA Methylation arrays for identifying a cell or a mixture of cells for prognosis and diagnosis of diseases, and for cell remediation therapies" inventors Kelsey K, Houseman EA, Wiencke J, Accomando W and Marsit C, which applications are hereby incorporated herein by reference in their entireties.
Technical field
Methods of determining altered immune cell distribution to diagnose or prognose a disease condition based on determining DNA methylation signatures of specific immune cell type of or mixture of immune cells types are provided.
Background
Leukocytes, commonly called white blood cells, are cells that are primarily responsible for mounting an immune response by a host to pathogens and to foreign antigens. Leukocyte distribution is currently determined by simple histologic or flow cytometric assessments. These methods have significant limitations. In particular, flow cytometry is limited by the following: availability of fluorescent antibody tags, laborious nature of the antibody tagging process, and needs for separation of cells requiring large volumes of fresh cells, expensive technology as well as equipment for detection of cells, and maintaining the integrity of the outer membrane of the cells to preserve labile protein epitopes. Further limitation of methods requiring fresh cells is that the methods are not useful in situations in which prospective studies are impractical, such as in the case of rare diseases, in which large numbers of disease subjects are not available. In these
cases retrospective studies are needed to correlate disease outcome with disease parameters. However, retrospective studies can be performed only if archival samples derived from archived cohort populations could be used to analyze the disease parameters. Currently there are no known methods in which archived samples from patients and normal subjects could be used to provide a quantitative estimate of leukocyte distributions in disease conditions.
Thus there is a need for methods that provide quantification of alterations in distribution of leukocytes in blood or tissues in disease conditions that do not rely upon fresh samples, that are not labor intensive and that do not use expensive technology or equipment. Summary
In diverse medical conditions such as in disease or in instances of immune-toxic exposure, the leukocyte distribution in blood or tissues contains information about the underlying immune- biology of the medical condition which is useful for diagnosis, prognosis or treatment of the medical condition, or for monitoring response to therapy. Accordingly, an embodiment of the invention provides a method a method for assessing a disease condition in a subject, including: measuring a CD3Z positive T lymphocyte cell number in a sample from the subject by analyzing methylation in the sample of at least one CpG dinucleotide (CpG) in gene CD3Z or in an orthologous or a paralogous gene thereof, such that an amount of a demethylated C of the at least one CpG in the sample is a measure of CD3+ T lymphocyte cell number; and comparing the amount of the demethylated C in the sample from the subject with that in positive control samples from patients with the disease condition, and with that in negative control samples from healthy subjects, such that the disease condition is selected from: an autoimmune disease, an allergy, a transplant rejection, obesity, an inherited disease, immunosuppression and a cancer. As used herein "subject" refers to any animal, for example, a mammal that is healthy or that has a disease condition for example a human, or a high value agricultural animal or a zoo animal. A "patient" is a subject that either has a disease condition or is in need of obtaining a diagnosis of a disease condition.
A related embodiment of the method includes at least one of: monitoring, diagnosing, prognosing, and measuring response to therapy by comparing the measured CD3+ T lymphocyte cell numbers in the subject after therapy to that in the patients with the disease condition and in the healthy subjects.
An embodiment of the method provides that the inherited disease is an aneuploidy. For example, aneuploidy is selected from trisomy 21 , Turner's syndrome, and Klinefelter's syndrome.
The sample used in the method is a fresh sample. For example, the fresh sample is freshly drawn blood, a tumor infiltrate or cells obtained from a lymph node puncture.
Alternatively, the sample is an archival sample. For example, the archival sample is archival blood collected and stored on filter paper cards such as a Guthrie card, frozen blood specimens or frozen tissue. Demethylation of DNA is a stable chemical modification of DNA, and archival samples are used to measure cell numbers. Flow cytometry in contrast, requires fresh cells, for detection of cells depends on the availability of protein epitopes, which are labile and not well preserved in archival samples.
In a related embodiment of the method the amount of the demethylated C of the at least one CpG in the CD3Z gene in the sample is at least about 80%, at least about 90%, or at least about 95% of the total amount of the CpG in CD3Z genes in the sample.
An embodiment of the method further involves analyzing the methylation of the CD3Z gene further by amplifying by Polymerase Chain Reaction (PCR) using primer pairs specific for amplification of specific demethylated CpG loci. For example, amplification by PCR involves monitoring quantitative PCR in real time using a MethyLight assay or using digital PCR.
An embodiment of the method further involves analyzing the methylation of the CD3Z gene by a method selected from the group of: Pyrosequencing, Methylation-sensitive single- nucleotide primer extension (Ms-SNuPE), Methylation-sensitive single stranded conformation analysis (MS-SSCA), and High resolution melting analysis (HRM) and digital PCR methods comprising emulsion and nanofluidic partitioning. According to a related embodiment,
Methylation-sensitive single-nucleotide primer extension further includes: chemically converting the lymphocyte derived whole genomic DNA with bisulfite; amplifying chemically converted whole genomic DNA; enzymatically fragmenting resulting amplified DNA;
hybridizing fragmented DNA to methylation sensitive CpG locus specific DNA oligomers; and labeling by single-base extension using fluorescently labeled nucleotides.
Another embodiment of the method further provides steps for analyzing methylation of differentially methylated regions (DMRs) of gene FOXP3, using primer pairs for amplification of specific loci of demethylated CpG in the FOXP3 gene. Within a gene "loci" as used herein refers to locations of all CpG dinucleotide containing sequences present in that gene, and only one or a few may be differentially demethylated in a specific cell.
A related embodiment of the method further includes: determining a ratio of CpG demethylation of FOXP3 gene DMR to the CpG demethylation of CD3Z gene DMR in a sample of tumor infiltrate, such that the ratio involves an index of T regulatory cell number to the total T cell number in the infiltrate; and the method further involves diagnosing of a pathological grade of the cancer, so that the index of T regulatory cell number to the total T cell
number in the tumor infiltrate correlates with the grade of the cancer. In a related embodiment, the cancer is selected from: a glioma; an ovarian cancer; a head and neck squamous cell cancer (HNSCC), breast cancer, lung cancer, prostate cancer, colon cancer, pancreatic cancer, bladder cancer, cervical cancer and liver cancer.
In a related embodiment the method further includes prognosing survival of a patient having or needing a diagnosis of glioma or HNSCC, in which amount of demethylation of CD3Z gene DMR in the patient as a percent of total DNA greater than a median value in a sample population of subjects correlates with a prognosis of poor survival.
An embodiment of the invention provides a kit for measuring CD3+ T lymphocyte and FOXP3+ T regulatory cell numbers by analyzing methylation of CpG positions in CD3Z and FOXP3 genes, the kit having sequencing and PCR primers specific for the CD3Z and the FOXP3 gene DMRs and instructions for analyzing and comparing the CpG methylation between healthy subjects and a patient.
An embodiment provides a method for assessing a disease condition by estimating an alteration in proportions of types of leukocytes in a sample from a subject, the method including the steps of: measuring a DNA methylation profile for each type of leukocyte and for unfractionated cells, such that DNA methylation profiles are obtained for a plurality of CpG loci, and obtaining the status of an individual CpG locus by amplifying DNA from each of the types of leukocyte and from the unfractionated cells, such that amplifying comprises hybridizing methylation sensitive locus-specific DNA oligomers corresponding to each CpG locus; ordering CpG loci by ability to distinguish types of leukocytes, such that the ordering of the CpG loci determines differentially methylated DNA regions (DMRs), such that obtaining DMRs comprises statistically minimizing introduction of bias in amount of total methylation status of a large number of CpG loci obtained from the unfractionated cells by employing a Bayesian treatment of prior probabilities of the methylation status at each individual locus, thereby identifying a plurality of CpG loci to include in the measurement, such that an amount of of CpG loci distinguishes DMR signatures among the types of leukocytes and minimizes bias; obtaining DNA methylation profiles comprising DMRs from the types of leukocytes, such that the DNA methylation profiles comprise validating measures of relative amounts of the types of leukocytes, and obtaining DNA methylation profiles of the unfractionated cells as surrogate measures of relative amounts of each leukocyte type in the unfractionated cells; employing an analog of a measurement error model wherein a DNA methylation surrogate y is reverse formulated with respect to the disease outcome z, as
such that y denotes a multivariate random variable representing a methylation profile, z denotes a disease outcome or state, and/ denotes a probability distribution; y, z, and leukocyte distribution, ω are related by the estimator equations,
E(y|co)=g (ω), and
under an assumption E(z|co,y) = Ε(ζ|ω), such that, E denotes an expectation of a random variable and ω denotes a subject specific distribution of leukocytes; and, comparing relative amounts of each type of leukocyte in the sample from the subject with those in a control sample, thereby providing an assessment of the disease condition. In related embodiments, the locus- specific DNA oligomers are linked to an array selected from the group of: a glass slide array; a quartz slide array; a fiber optic bundle array, a planar slide array, a micro-well array; a multi- well dish array; a digital PCR array; and a bead array having beads located at known addressable locations on the array. A related embodiment of the method further provides at least one of steps of: monitoring, diagnosing, prognosing and measuring response to therapy of the disease condition.
The method in a related embodiment further includes analyzing sensitivity for correcting bias, such that correcting bias is unrelated to measurement error and is related to errors arising from unprofiled cell types and non-cell mediated profile differences. In related embodiments of the method, fractionated leukocyte types include at least one selected from: CD19+ B lymphocytes, CD15+ granulocytes, CD14+ monocytes, CD56+ Natural Killer cells, and CD3+ T lymphocytes.
In an embodiment of the method the disease condition is Head and Neck Squamous Cell Carcinoma (HNSCC).
According to another embodiment of the method the control sample is taken from the subject at a different point in time for prognosis of the course of the disease condition in the subject. In another related embodiment, the method of assessing disease condition further includes after employing the measurement model, comparing the distribution of leukocytes to the relative amounts in the control sample as a normal standard, such that the normal standard is a statistical measure obtained from a plurality of disease-free subjects.
In a related embodiment the method provides a diagnosis of immunosuppression due to smoking in a currently smoking subject by: determining a ratio of CpG demethylation of FOXP3 gene DMR to the CpG demethylation of CD3Z gene DMR in blood in the currently smoking subject, such that the ratio is an index of T regulatory cell number to the total T cell number; and providing a diagnosis of immunosuppression in the currently smoking subject, such that the value of the index of T regulatory cell number to the total T cell number in the currently smoking subject, greater than the average value in a sample population of currently non-
smoking subjects correlates with immunosuppression due to smoking. In a related embodiment of the method the subject with the currently-smoking or currently non-smoking status is a patient having a cancer, an infection or in need of a transplant.
An embodiment provides a method of predicting a methylation class membership in a bodily fluid sample of a subject for assessing disease status of the subject, in which the methylation class membership corresponds to an epigenetic signature of a plurality of leukocyte types, the method including: measuring amounts of DNA methylation in each of a plurality of leukocyte type populations to determine differentially methylated regions (DMRs);
ranking leukocyte DMRs for each leukocyte type according to statistical strength of association of the DMR with each leukocyte type; randomly dividing a data set of control subjects and subjects with a disease into groups having substantially the same numbers of control subjects and subjects with the disease to obtain a training set and a testing set; clustering samples in the training set using a defined number of highest ranked leukocyte DMRs to determine clustering solutions, in which a clustering solution corresponds to the methylation class membership; and predicting methylation class membership for subjects within the testing set by applying the clustering solutions obtained from the training set to the highest ranked leukocyte DMRs in the testing set, such that clinical utility of the predicted methylation class membership is determined by testing association of the predicted methylation class membership with the disease status of the subject.
According to an embodiment of the method, the highest ranked leukocyte DMRs are as shown in Table 21 , in which each DMR is identified by chromosomal location and gene name , and the defined number of highest ranked leukocyte DMRs is selected from: least 10, at least 20, at least 30, at least 40 and is 50.
The methylation class membership of the subject in the testing set is predicted for example using a naiVe Bayes classifier. Testing the association of the predicted methylation class with disease status includes for example using receiver operating characteristic curves
(ROC) and the corresponding area under each curve.
The bodily fluid sample in some embodiments is a fresh sample, for example freshly collected blood or a blood derivative. Alternatively, the bodily fluid is an archival sample, for example stored frozen blood or archival blood collected and stored on a filter paper card such as a Guthrie card.
The method in a related embodiment includes at least one of: diagnosing, monitoring, prognosing and measuring response to therapy of the disease status.
In related embodiments the leukocyte types are selected from the group of: natural killer cells, B Cells, CD4+ T cells, CD8+ T cells, granulocytes and monocytes. The disease according
to an embodiment of the method is exemplified by one of: head and neck squamous cell carcinoma (HNSCC), ovarian cancer, and bladder cancer.
An array is provided as another embodiment for estimating proportions of leukocyte types in a sample from a mammal for assessing a disease condition of the mammal by analyzing differential methylation of CpG dinucleotides in a plurality of genes of the sample, the array including: a plurality of DNA probes attached to a plurality of surfaces at known addressable locations on the array, such that the surface at each location is attached to a DNA probe having a specific nucleotide sequence, such that the DNA probe having the specific nucleotide sequence hybridizes to a nucleotide sequence of a methylated form or an ummethylated form of a CpG dinucleotide in a sequence of a gene of the plurality of genes in the sample, such that the array is selected from having: at least 16 probes, at least 64 probes, at least 96 probes, and at least 384 probes.
The plurality of probes, in a related embodiment of the array, has nucleotide sequences that hybridize with a respective plurality of 96 different nucleotide sequences which are found in nature occurring in the plurality of genes. In another related embodiment, the 96 nucleotide sequences have SEQ ID NO: 1 to SEQ ID NO: 96.
In a related embodiment of the array, the addressable locations are wells of a substrate, such that the substrate is selected from: glass slide; quartz slide; fiber optic bundle and planar silica slides. In another related embodiment the surfaces included in the array are particles added to the wells.
In alternative embodiments the addressable locations of the array are defined spots on a glass slide or are microbeads or particles labeled with a code. For example, the particles are microbeads in the form of glass cylinders identifiable with inscribed holographic code.
In various embodiments the disease condition is selected from: an autoimmune disease, an allergy, a transplant rejection, obesity, an inherited disease, immunosuppression and a cancer.
Another embodiment provides a method for estimating proportions of types of leukocytes in a sample from a subject for assessing a disease condition of the subject by analyzing differential methylation of CpG dinucleotides in a plurality of genes of the sample, the method including: providing an array having a plurality of DNA probes attached to a plurality of surfaces at known addressable locations on the array, such that the surface at each location is attached to a DNA probe having a specific nucleotide sequence; reacting genomic DNA in the sample with a bisulfite reagent to convert unmethylated cytosine residues to uracil; hybridizing resulting bisulfite treated genomic DNA with the array to obtain resulting hybridized probes on the array, such that the DNA probes hybridize to a DNA sequence of each of a methylated form and an ummethylated form of a sequence having a CpG dinucleotide in a gene for each of the
plurality of genes; and detecting the methylation status of each of the CpG dinucleotides in each sequence, thereby estimating proportions of types of leukocyte in the sample from the subject for assessing the disease condition of the subject.
In a related embodiment, detecting the methylation status of the CpG dinucleotide sequence includes: extending each hybridized probe of the resulting hybridized probes on the array by primer extension to obtain a resulting primer extension product; ligating the resulting primer extension product to an oligonucleotide complementary to the DNA sequence of a 3' region of the gene to obtain a resulting template for PCR on the array; and amplifying by PCR and measuring amount of resulting PCR product, thereby detecting the methylation status of the CpG dinucleotide containing nucleotide sequence.
In another related embodiment amplifying by PCR further includes: amplifying the resulting template on the array using primers pairs including a 5' primer specific to each of the methylated or the unmethylated form of the CpG dinucleotide containing gene, and a 3 'primer specific to the gene containing the CpG dinucleotide, thereby resulting in a first PCR product; amplifying the resulting first PCR product with differentially labeled 5' primers that specifically amplify either the methylated or the unmethylated form of the CpG dinucleotide containing nucleotide sequence containing gene, and a common 3 ' primer, resulting in a differentially labeled second PCR product, and hybridizing the second PCR product to the CpG dinucleotide containing gene for measuring amount of the second PCR product, thereby detecting the methylation status of the CpG dinucleotide sequence.
Detecting the methylation status of the CpG dinucleotide sequence, in another related embodiment of the method, includes extending the resulting hybridized probes on the array by single base primer extension with a labeled nucleotide.
The array used in the method, in a related embodiment, includes at least 16 probes, at least 64, at least 96 probes or at least 384 probes. In another related embodiment of the method the plurality of probes on the array hybridizes with a plurality of 96 different nucleotide sequences occurring in the plurality of genes. In yet another related embodiment of the method each probe on the array is complementary to nucleotide sequences having SEQ ID NO: 1 to SEQ ID NO: 96.
In various embodiments of the method, the disease condition assessed is selected from: an autoimmune disease, an allergy, a transplant rejection, obesity, an inherited disease, and a cancer. Assessing the disease condition using the array, in related embodiments of the method, includes at least one of: monitoring, diagnosing, prognosing, and measuring response to therapy by comparing estimated proportions of types of leukocytes of the subject after therapy to proportions of leukocytes from a healthy subject.
In a related embodiment of the method the sample containing the genomic DNA used to hybridize with the probes on the array is fresh i.e., obtained in real time prior to performing the method. In another related embodiment of the method the sample is archival.
In various embodiments of the method for estimating proportions of leukocytes usi ng the array, the leukocyte types include at least one selected from: CD 19+ B lymphocytes, CD! 5+ granulocytes, CD 14+ monocytes, CD56+ natural Killer cells, and CD3+ T lymphocytes.
Another related embodiment provides a kit for estimating proportions of leukocyte types in a sample by analyzing differential methylation of CpG dinucleotides in a plurality of genes of the sample, the kit including: an array having: a plurality of DNA probes attached to a plurality of surfaces at known addressable locations on the array, such that the surface at each location is attached to a DNA probe having a specific nucleotide sequence, such that the DNA probe having the specific nucleotide sequence hybridizes to a DNA sequence of a methylated form or an ummethylated form of a CpG dinucleotide in a sequence of a gene of the plurality of genes in the sample, such that the array is selected from having: at least 16 probes, at least 64 probes, at least 96 probes, and at least 384 probes; primers and reagents for detecting the hybridized probes and for detecting the reaction products derived from the hybridized probes; and instructions for using the array with a bisulfite reagent, thereby providing an estimation of proportions of leukocyte types in the sample.
In a related embodiment of the kit, the probes hybridize with a respective plurality of 96 different DNA sequences occurring in the plurality of genes. In yet another related embodiment of the kit the probes have nucleotide sequences complementary to 96 nucleotide sequences having SEQ ID NO: 1 to SEQ ID NO: 96.
The instructions in a related embodiment of the kit include methods for: reacting genomic DNA in the sample with the bisulfite reagent to convert unmethylated cytosine residues to uracil; hybridizing resulting bisulfite treated genomic DNA with probes immobilized to the surfaces to obtain resulting hybridized probes on the array, such that the DNA probes hybridize to a DNA sequence of each of a methylated form and an ummethylated form of a CpG dinucleotide sequence in a gene of the plurality of genes; and detecting the methylation status of the CpG dinucleotide sequence, thereby estimating proportions of leukocyte types in the sample from the subject for assessing the disease condition of the subject.
In a related embodiment of the kit the instructions for detecting the methylation status of the CpG dinucleotide sequence include methods for: extending each hybridized probe of the resulting hybridized probes on the array by primer extension to obtain a resulting primer extension product; ligating the resulting primer extension product to an oligonucleotide complementary to the DNA sequence of a 3' region of the gene to obtain a resulting template for
PCR on the array; and amplifying by PCR and measuring amount of resulting PCR product, thereby detecting the methylation status of the CpG dinucleotide sequence.
In another related embodiment of the instructions for kit amplifying by PCR include methods for: amplifying the resulting template on the array using primers pairs having a 5' primer specific to each of the methylated or the unmethylated form of the CpG dinucleotide containing gene, and a 3'primer specific to the gene containing the CpG dinucleotide, thereby- resulting in a first PCR product; amplifying the resulting first PCR product with differentially labeled 5' primers that specifically amplify each of the methylated and unmethylated form of the CpG dinucleotide sequence containing gene, and a common 3' primer, resulting in a differentially labeled second PCR product, and hybridizing the second PCR product to the CpG dinucleotide containing gene for measuring amount of the second PCR product, to detect the methylation status of the CpG dinucleotide sequence.
Instructions for detecting the methylation status of the CpG dinucleotide sequence, in another related embodiment of the kit, include methods for extending the resulting hybridized probes on the array by single base primer extension with a labeled nucleotide.
Another embodiment of the invention is a method of treating a subject for a disease condition, such that the subject is a human patient and, such that the disease condition is a cancer, the method comprising: obtaining signatures comprising differentially methylated regions (DMRs) from types of leukocytes in a blood sample of the patient, the types of leukocytes comprising at least one selected from: CD 19+ B lymphocyte, CD 15+ granulocyte, CD 14+ monocyte, CD56dim Natural Killer cell, CD56br,ght Natural Killer cell, and CD3+ T lymphocyte, and from a healthy control human subject not having the cancer; comparing a signature specific for the type of leukocyte in the patient with that in the healthy subject, such that the type of leukocyte specific signature is an indication of amount of cells of the type of leukocyte circulating in blood, and such that a decreased amount of the cells of the type of leukocyte circulating in the blood of the patient compared to the healthy subject is an ind icium of the cancer; and, administering a composition comprising the cells of the type of leukocyte to the patient, thereby increasing the amount of the cells of the type of leukocyte in the patient and treating the cancer.
In various embodiments of the method the leukocyte type cell is the CD56dim Natural
Killer cell.
The cancer in related embodiments of the method is head and neck squamous cell carcinoma (HNSCC). In embodiments of the method the DMR signature specific for CD56dim
Natural Killer cells includes at least one CpG dinucleotide in a region near the promoter of gene NKp46. In other embodiments of the method the DMR signature specific for CD56d m Natural
Killer cells is a CpG dinucleotide in a region near the promoter of the gene NKp46, such the methylation status of the CpG dinucleotide is quantified by methylation specific quantitative polymerase chain reaction (MS-qPCR) using primers and probes having SEQ ID NOs: 1 16-1 18 and 97-99. According to other embodiments of the method, the DMR signature specific for CD56dim Natural Killer cells is a CpG dinucleotide in a region near the promoter of the gene NKp46, such that the methylation status of the CpG dinucleotide is quantified by digital PCR involving emulsion and nanofluidic partitioning using primers and probes having SEQ ID NOs: 1 16-1 18 and 97-99.
In related embodiments of the method the blood sample is archival. Alternatively the blood sample is fresh.
Brief description of the drawings
Figure 1 is a photograph showing a clustering heatmap for External Validation White Blood Cell Data (So)- The data were obtained by applying the measurement error formulation described in Examples 1-3. The method delineates effects resulting from immune cell distribution as compared to those resulting from other "non-cell type" alterations in DNA methylation. Methylation array procedure was carried out using Infinium HumanMethylation27 Beadchip Microarrays from Illumina, inc. (San Diego, CA). The White Blood Cell data were gathered from a set of 46 samples of purified white blood leukocyte subtypes obtained commercially. Light = unmethylated (Υ¾, = 0), black = partially methylated (Y¾ = 0:5), dark = methylated (Υ¾ = 1).
Figure 2 is a chart showing the results of cell mixture reconstruction experiments validating prediction of individual sample profiles. The reconstruction experiments involved six known mixtures of monocytes and B cells and six known mixtures of granulocytes and T cells. Known fractions (Expected) and resulting predictions from Infinium 27K profiles (Observed) percentages of each cell type are shown by shade (dark =100, white=0).
Figure 3 is a photograph showing a clustering heatmap for Target HNSCC data (Si). The target data set Si consisted of arrays applied to whole blood specimens collected in a random subset of individuals involved in an ongoing population-based case-control study (Peters et al.,
2005) of head and neck cancer (HNSCC): 92 cases and 92 age and sex matched controls. Blood was drawn at enrollment (prior to treatment in 85% of the cases). Yellow = unmethylated (Y/y =
0), black = partially methylated (Υ¾,· = 0:5), dark = methylated (Yhj = 1). The annotation track above the heatmap indicates case-control status.
Figure 4 is a graphical representation of bias sensitivity analysis for HNSCC Data. Bias was assessed by resampling the case coefficients of Bj, a procedure that assumes maximum bias. The abscissa shows the number of assumed non-zero alterations. The dark filled diamond shapes (red in color) indicate median, the thick vertical lines (blue in color) indicates interquartile range, the thin lines (blue in color) represent 95% probability ranges, and the outer dots (black in color) represent 99% probability ranges.
Figure 5 panels A-B are graphs showing Rate-of-Convergence of the Hessian matrix Hm which allows the determination of the optimal number of CpG sites whose combined methylation status measurements most accurately reflect the exact distribution of different cells in a mixture. The x-axis represents increasing m, the number of CpG sites (ordered by F- statistic) included in the model space, on a logarithmic scale.
Figure 5 panel A shows convergence by correlating the Hessian Matrix with the number of CpG sites included in the measurement. The dotted line in (A) shows the tangent at low values of m.
Figure 5 panel B shows the Rate of convergence which was calculated by smoothing the first differences of logio(trHm). The dotted line (red in color) in (B) corresponds to linear convergence.
Figure 6 is a photograph showing a clustering heatmap for Target Ovarian Cancer data (S ) (Teschendorff et al., 2009, PLoS ONE 4, e8274). Only those cases were included in which blood was collected pre-treatment. After removing four arrays with a preponderance of missing values, the data set consisted of 272 controls and 129 cases having blood drawn prior to treatment. Light = unmethylated (Y/,y = 0), black = partially methylated (Yhj = 0:5), dark = methylated (Y^- = 1). The annotation track above the heatmap indicates case-control status (cancer case or control).
Figure 7 is a photograph showing a clustering heatmap for Target Down Syndrome Data. The method herein was applied to a trisomy 21 (Down syndrome) data set (Kerkel et al.,. PLoS Genet 2010, 6(1 l):el001212) consisting of 29 total peripheral blood leukocyte samples from Down syndrome cases and 21 controls, as well as six T cell samples from cases and four T cell samples from controls (GEO Accession number GSE25395). Light = unmethylated (Y^- = 0), black = partially methylated Yhj = 0:5), dark = methylated (Yhj = 1). The annotation track
above the heatmap indicates case-control and cell type status [Down syndrome case (whole blood), control (whole blood), T cell (pooled cases and controls)].
Figure 8 is a photograph showing a clustering heatmap for Target Obesity Data obtained from applying the method herein to an obesity data set (Wang et al., BMC Med 2010, 8:87) consisting of 7 lean African-Americans and 7 Obese African-Americans (GEO Accession number GSE25301). Yellow = unmethylated (Yhj = 0), black = partially methylated (Y¾, = 0:5), grey = methylated (Y/y = 1 ). The annotation track above the heatmap indicates case-control status (obese and lean).
Figure 9 is a photograph (heatmap) of the methylation profiles of white blood cells obtained from a DNA methylation array analysis described in Example 9. Methylation array procedure was carried out using Infinium HumanMethylation27 Beadchip Microarrays from Illumina, Inc. (San Diego, CA). The number of individual leukocyte samples in each methylation class is shown in the table to the right. The DNA methylation profile distinguishes Lymphocytes from Myeloid Derived Leukocytes. The highest 5000 most variable CpG loci are plotted on the left. Less methylated loci are grey and more methylated loci are black.
Recursively partitioned mixture model (RPMM) of autosomal gene Infinium beta values from sorted, human, peripheral blood leukocytes was performed in R version 2.11.1 of Illumina's software which provides convenient mechanisms for loading and analyzing the results of methylation status, and for quality control and basic visualization tasks.
Figure 10 panels A-B are graphical representations of the DNA methylation status of regions in CD3E and CD3Z genes.
Figure 10 panel A shows DNA methylation status of a region in CD3E that was identified from the DNA methylation array analysis (the results of which are shown in Figure 9) as one of the two candidate DMRs with specificity towards CD3+ T cells. The DNA methylation status was measured by pyrosequencing bisulfite converted DNA from different sorted, human, peripheral blood leukocytes.
Figure 10 panel B shows DNA methylation status of a region in CD3Z gene that was identified from the DN A methylation array analysis (the results of which are shown in Figure 9) as one of the two candidate DMRs with specificity towards CD3+ T cells. The DNA methylation status of the region in CD3Z gene in different sorted, human, peripheral blood leukocytes was measured by MethyLight® qPCR.
Figure 11 is a drawing showing the genomic region containing CD3Z gene, based on information available from the public databases UniProt, RefSeq and GenBank. UniProt is a freely accessible universal protein resource of protein sequence and functional information. RefSeq is a collection that provides integrated and annotated set of sequences including genomic DNA, transcripts and protein. GenBank® is the genetic sequence database of the National Institutes of Health which contains an annotated collection of all publicly available DNA sequences.
Figure 12 is a list of genomic regions used for measuring methylation of CD3Z and FOXP3 gene, for quantitating genome copy numbers, and a list of the corresponding primer and probe sequences. Underlined letters are "C" in CpG motifs.
Figure 13 panels A-C are graphical representations of standard calibration curves which show the relationship between copy numbers of genomic DNA and the signal obtained from quantitaive real time methylation specific PCR. The calibration curves are used for quantifying CD3+ T cells, Tregs (FOXP3 demethylated) and ratios of Tregs/CD3+ T cells. DNA isolated from purified cell types was bisulfite converted and serially diluted into a background of fully methylated commercial DNA standard (Qiagen). The total genomic copy numbers of each sample within a dilution series remained constant. Log dilutions were performed in the appropriate range of Ct values corresponding to test samples (whole blood, tumor specimens). Using cytosine-less: C-less primers genome copy numbers for each test standard were measured to ensure adequate input DNA and to normalize the CD3+ and Treg assay values.
Figure 13 panel A shows the calibration curve for C-less total input. (N= eight replicates); errors denote standard error of the mean Ct value.
Figure 13 panel B shows dilution of isolated normal PanT cells (N= seven replicates).
Figure 13 panel C shows dilution and calibration curve for isolated CD3+CD25+ T cells (N=8 eight replicates).
Calibration curves (Figure 13 panels A,B,C) were used to estimate total input copies, CD3+ T cell and Tregs copies, respectively.
Figure 14 is a drawing and a set of graphical representations showing detection of CD3+ T cell numbers by measuring differential demethylation using MS-qPCR.
Figure 14 panel A is a schematic diagram showing methylation specific primers and probe targeting six CpGs (lollipops) in a region of the CD3Z gene identified herein as demethylated in CD3+ T cells.
Figure 14 panel B shows results of real time PCR. The real time PCR Ct values decreased linearly with a ten-fold increase in bisulfite converted CD3+ T cell DNA
concentration. Bisulfite converted universal methylated DNA was used to keep total amount of DNA in all samples constant. At least five replicates of each sample were plotted.
Figure 14 panel C shows correlation between T cell levels determined by flow cytometry and CD3Z MS-qPCR. Evaluation of CD3+ T cell level by flow cytometry was observed to be highly correlated with T cell quantification by CD3Z MS-qPCR in whole blood specimens from glioma patients and healthy donors.
Figure 14 panel D shows correlation between T cell counts obtained using by imunohistochemical staining and CD3Z MS-qPCR. CD3+ T cell count by imunohistochemical staining correlates with T cell quantification by CD3Z MS-qPCR in excised tumors across histological subtypes. Pearson correlations and F-test p-values are shown in panels B-D.
Figure 15 panels A-C are graphical representations showing T cells and Tregs in the peripheral blood of glioblastoma multiform (GBM) patients and healthy donors determined by MS-qPCR for demethylation of specific CpG loci.
Figure 15 panel A shows comparison of T cell numbers in blood between GBM patients and control subjects measured using CD3Z demethylation assay.
Figure 15 panel B shows comparison of Tregs between GBM patients and control subjects measured using FOXP3 demethylation assay.
Figure 15 panel C is a graph showing comparison of Treg percent of T cells between GBM patients and control subjects determined by the ratio of FOXP3ICD3Z demethylation. Wilcoxon rank sum p-values are shown. Figure 16 panels A-C are graphical representations showing association between cigarette smoking and peripheral blood T cells and Tregs in glioma patients and healthy donors determined by MS-qPCR for demethylation of specific CpG loci.
Figure 16 panel A shows a comparison of peripheral blood T cell levels, determined by CD3Z demethylation, among never, former and current cigarette smokers stratified by glioma case status (indicated "cases" on the abscissa).
Figure 16 panel B shows a comparison of peripheral blood Treg levels, determined by FOXP3 demethylation, among never, former and current cigarette smokers stratified by glioma case status.
Figure 16 panel C shows a comparison of peripheral blood Treg percent of T cells, determined by ratio of FOXP3 to CD3Z demethylation, among never, former and current cigarette smokers stratified by glioma case status. Wilcoxon rank sum p-values are shown.
Figure 17 panels A-C are graphical representations showing levels of T cell and Treg infiltrates in excised glioma tumors determined by MS-qPCR for demethylation of specific CpG loci.
Figure 17 panel A shows T cell levels, determined by CD3Z demethyation, in solid glioma samples stratified by tumor grade.
Figure 17 panel B shows Treg levels, determined by FOXP3 demethyation, in solid glioma samples stratified by tumor grade.
Figure 17 panel C shows Treg percent of T cells, determined by ratio of FOXP3 to CD3Z demethylation, in solid glioma samples stratified by tumor grade. Wilcoxon rank sum p-values are shown.
Figure 18 panels A-C are graphical representations of flow cytometry analysis of CD3+ T cells and total leukocytes in whole blood from glioma cases and controls.
Figure 18 panel A shows a forward and side scatter plot of a representative blood sample showing gating for lymphocytes and counting beads.
Figure 18 panel B shows lymphocyte subpopulation observed using gating for CD3 expression.
Figure 18 panel C shows CD45 gating on all non-bead events. CD45+ low and high cells were added in order to count total CD45+ cells.
Figure 19 panels A-C are photomicrographs and a lie graph that show
immunohistochemical (IHC) staining of a representative GBM specimen.
Figure 9 panel A shows CD3 staining. Average number of cells positive for staining was 418.
Figure 19 panel B shows CD8 staining. Average number of cells positive for staining was 296.
Figure 19 panel C shows correlation of CD3 and CD8 staining, Pearson r =.992
Figure 20 is a set of two heatmaps showing results of MS-qPCR and bisulfite pyrosequencing of Magnetic activated cell sorting (MACS) sorted human leukocyte subsets.
Abbreviations: B = B lymphocytes, Gran = Granulocytes, Neut = Neutrophils, Mono =
Monocytes, NK = CD56+ Natural killer cells, Nkdim = CD16+CD56dim natural killer cells, NKbr = CD16-CD56bright natural killer cells, NK8+ = CD8+CD56+ natural killer cells, NK8- = CD8-CD56+ natural killer cells, NKT = CD3+CD56+ natural killer T cells, T = CD3+ T lymphocytes, CD8 = CD3+CD8+ T lymphocytes (cytotoxic T cells), CD4 = CD3+CD4+ T lymphocytes (helper T cells), Treg = CD3+CD4+CD25+FOXP3+ regulatory T cells.
Figure 20 panel A is a heatmap of DNA methylation in FOXP3 and CD3Z gene regions assessed by MS-qPCR.
Figure 20 panel B is a heatmap of DNA methylation at three CpG loci in the CD3Z gene assessed by bisulfite pyrosequencing.
Figure 21 panels A-C are graphical representations showing levels of T cell and Treg infiltrates in glioma tissues stratified by histological subtype detennined by MS-qPCR for demethylation of specific CpG loci. Abbreviations: PA = Pilocytic Astrocytoma, EP =
Ependymoma, OD = Oligodendroglioma, OA = Oligoastrocytoma, AS = Astrocytoma, GBM = Glioblastoma multiforme. Kruskal-Wallis one-way analysis of variance by rank test p-values shown.
Figure 21 panel A shows T cell levels determined by CD3Z demethylation in solid glioma samples stratified by tumor histology.
Figure 21 panel B shows Treg levels determined by FOXP3 demethylation in solid glioma samples stratified by tumor histology.
Figure 21 panel C shows Treg percent of T cells, determined by ratio of FOXP3 to CD3Z demethylation in solid glioma samples stratified by histology.
Figure 22 panels A-C are graphical representations showing Kaplan Meier analysis of time of survival of glioma patients stratified according to whether the level of T cells or Tregs in the tumor infiltrates of the patients are above or below the median level of T cells or Tregs, respectively. Log Rank p-values shown.
Figure 22 panel A shows survival (ordinate) of glioma patients as a function of time (abscissa) in relation to T cell levels as determined by CD3Z demethylation.
Figure 22 panel B shows survival of glioma patients in relation to Treg levels as determined by FOXP3 demethylation.
Figure 22 panel C shows survival of glioma patients in relation to Treg percent of T cells as determined by ratio of FOXP3 to CD3Z demethylation.
Figure 23 panels A-B are representations of results obtained from analysis of DMRs of leukocyte subtypes.
Figure 23 panel A shows a heat map of the methylation status for the highest ranked 50 leukocyte DMRs by leukocyte subtype.
Figure 23 panel B shows a Plot depicting the -loglO(P-values) for the highest ranked 50 leukocyte DMRs across three cancer data sets (HNSCC; Ovarian; Bladder). P-values (ordinate) show methylation differences between cancer cases and non-cancer controls and were obtained from individual unconditional logistic regression models fit to each of the 50 leukocyte DMRs. For the HNSCC data set, logistic regression models were adjusted for patient age, gender, smoking status (never, former, current), smoking pack years, weekly alcohol consumption, and HPV serology status. The bladder cancer data set was adjusted for patient age, gender, smoking status, smoking pack years, and family history of bladder cancer. The ovarian cancer data set was adjusted for patient age group (55-60, 60-65, 65-70, 70-75 and >75 years). The horizontal dashed line represents -logl0(p = 0.05).
Figure 24 panels A-B shows results obtained from the DMR profile analysis of the HNSCC data set determining methylation class membership.
Figure 24 panel A left column shows a heat map of the HNSCC testing data set. Rows represent subjects, which are grouped by predicted methylation class membership. Columns represent the highest ranked 50 leukocyte DMRs that were used to generate the methylation classes for the HNSCC testing set. Panel A right column is a bar-plot depicting the percent cancer case/control across the predicted methylation classes in the HNSCC testing set.
Figure 24 panel B shows receiver operating characteristic (ROC) curves based on the predicted methylation classes only in the HNSCC testing set and methylation classes including patient age, gender, smoking status (never, former, current), smoking pack years, weekly alcohol consumption, and HPV serostatus.
Figure 25 shows results obtained from the DMR profile analysis of the Ovarian data set for determining methylation class membership.
Figure 25 panel A is a heat map of the ovarian testing data set. Rows represent subjects which are grouped by predicted methylation class membership. Columns represent the highest ranked ten leukocyte DMRs that were used to generate the methylation classes for the ovarian testing set. Panel A right column is a bar-plot depicting the percent cancer case/control across the predicted methylation classes in the ovarian testing set.
Figure 25 panel B shows ROC curves based on the predicted methylation classes alone in the ovarian testing set and methylation classes plus patient age group (55-60, 60-65, 65-70, 70-75 and >75 years). Figure 26 shows results obtained from the DMR profile analysis of the bladder data set for determining methylation class membership.
Figure 26 panel A is a heat map of the bladder testing data set. Rows represent subjects, which are grouped by predicted methylation class membership. Columns represent the highest ranked 56 leukocyte DMRs that were used to generate the methylation classes for the bladder testing set. Panel A right column represents a bar-plot depicting the percent cancer case/control across the predicted methylation classes in the bladder testing set.
Figure 26 panel B shows ROC curves based on the predicted methylation classes alone in the bladder testing set and methylation classes plus patient age, gender, smoking status (never, former, current), smoking pack years, and family history of bladder cancer.
Figure 27 panels A-C are graphical representations showing image plots representing the pairwise spearman correlation coefficients.
Figure 27 panel A shows the six CpG loci identified by HNSCC analysis (Langevin SM et al., Epigenetics. 2012 Mar; 7(3):291-9) and the highest ranked 50 leukocyte DMRs used in the present analysis.
Figure 27 panel B shows the seven CpG loci identified by the alternative ovarian analysis and the highest ranked ten leukocyte DMRs used in the present analysis,
and (c) the nine CpG loci identified by the bladder analysis reported in (Laird PW, 2003 Nat Rev Cancer 3:253-266) and the highest ranked 56 leukocyte DMRs used in the present analysis.
Figure 27 panel C shows the nine CpG loci identified by the bladder analysis reported in
(Shen L et al., 2007 PLoS genetics 3:2023-2036) and the highest ranked 56 leukocyte DMRs used in the present analysis.
Figure 28 is a schematic diagram showing hierarchy of leukocyte subtypes and sample sizes for each of the leukocyte subtypes used in the analysis for determination of methylation class membership.
Figure 29 is a diagram representing the analytic workflow the HNSCC data set (n = 184;
92 HNSCC cases and 92 cancer-free controls). The full HNSCC data set was first divided into equally sized training and testing sets. The training sets were used in development of a classifier
based on leukocyte DMRs. The resulting classifiers were then used to predict methylation class membership for the observations in the respective independent testing sets. The phenotypic importance of the predicted methylation classes in the testing data was examined subsequently. Figure 30 is a diagram representing the analytic workflow the ovarian cancer data set
(n = 401 ; 128 ovarian cancer cases and 273 cancer-free controls). The full ovarian cancer data set was divided into equally sized training and testing sets. The training sets were used in the development of a classifier based on leukocyte DMRs. The resulting classifiers were then used to predict methylation class membership for the observations in the respective independent testing sets. The phenotypic importance of the predicted methylation classes in the testing data was then examined.
Figure 31 is a diagram representing the analytic workflow of the bladder cancer data set (n = 460; 23 Bladder cancer cases and 237 cancer-free controls). The full bladder cancer data set was divided into equally sized training and testing sets. The training sets were used in the development of a classifier based on leukocyte DMRs. The resulting classifiers were then used to predict methylation class membership for the observations in the respective independent testing sets. The phenotypic importance of the predicted methylation classes in the testing data was then examined.
Figure 32 is a diagram illustrating Semi-Supervised Recursively Partitioned Mixture Models (SS-RPMM) for predicting methylation class membership. The full methylation dataset was randomly divided into training and testing sets. Using the training data only, univariate models (adjusted for potential confounders) were used to identify CpG loci whose methylation is most strongly associated with the clinical variable of interest (i.e., case/control status). RPMM is then fit to the training data using the M CpGs that are most associated with the clinical variable of interest ( M is determined using a nested cross-validation procedure) CpGs. The resulting solution is then used in conjunction with an empirical Bayes classifier to predict methylation class membership for the observations in the testing data.
Figure 33 panels A-D show results obtained from SS-RPMM analysis (see Figure 30) of the ovarian cancer data set for determination of methylation class membership.
Figure 33 panel A is a heatmap of the testing set obtained by predicted methylation class using the SS-RPMM procedure. Rows represent subjects and columns represent the seven CpG loci identified by this analysis.
Figure 33 panel B represents percentage of cases/controls obtained by predicted methylation class membership in the testing set.
Figure 33 panel C sows information regarding the seven CpG loci identified by the SS- RPMM analysis.
Figure 33 panel D shows a ROC/AUC (area under the curve) analysis based on the predicted methylation class memberships in the testing set. Dark represents the ROC/AUC based on the predicted methylation classes along and light represents the ROC/AUC using the predicted methylation classes and patient age group. Figure 34 is a graphical representation showing loci in the gene NKp46 chosen from candidate NK cell-specific differential DNA methylation markers, selected by DNA methylation and mRNA expression criteria.
Linear mixed effects modeling of DNA methylation microarray data from MACS isolated human leukocytes generated a coefficient estimating differential methylation in NK cells relative to other cell subtypes, shown on the avscissa. Linear modeling of mRNA microarray data from the same isolated cells determined log-fold change in expression between N K cells and each of the following subtypes: T cells, B cells, granulocytes and monocytes. The average of these four log-fold change values is shown on the ordinate. Significance for a particular gene region was achieved when q < 0.1 for four mRNA expression linear models as well as the DNA methylation mixed effects model. Candidates for NK cell-specific DNA methylation biomarkers were limited to significant gene loci exhibiting decreased methylation in NK cells (methylation estimate < 0) and within genes that exhibited increased RNA expression (log fold change > 1). The candidate loci are marked with asterisks in the top left quadrant, and NKp46 loci are marked with grey asterisks.
Figure 35 is a heatmap showing demethylation status of NKp46 determined by methylation specific quantitative PCR (MS-qPCR) of isolated human leukocyte populations. Individual samples of (MACS) purified white blood cell subtypes were subjected to a MS-qPCR assay that detects demethylated copies of NKp46 DNA. Extent of NKp46 methylation is illustrated in this heatmap in which light indicates that all copies of DNA in particular sample were demethylated in the targeted region of NKp46, and dark indicates that all copies were methylated.
Figure 36 is a line graph showing linearity of NKp46 MS-qPCR calibration. Bisulfite converted universal methylated DNA was used to standardize total amount of DNA in all
samples at a constant amount. At least three replicates of each standard are plotted. Real time PCR Ct values decrease linearly with ten-fold increase in bisulfite converted NK cell DNA concentration. Figure 37 is a bar graph showing prevalence of HNSCC by normal NKp46
demethylation tertile. Normal NKp46 demethylation tertile cutoffs were determined from control blood samples only. Higher tertiles indicate higher NK cell levels. HNSCC prevalence
(ordinate) refers to the percent of total cases in this example whose NKp46 demethylation measurements fell within the control derived tertile range. Displayed p-value is from a chi- squared test for trend in proportions.
Figure 38 is a heatmap showing methylation status of selected NKp46 CpG loci measured by bisulfite pyrosequencing of isolated human leukocytes. The methylation status of eight individual CpG loci near the promoter region of NKp46 were interrogated by
pyrosequencing of bisulfite converted DNA extracted from Magnetic activated cell sorting
(MACS) isolated human leukocyte populations. CpG numbers 2 through 7 represent the six loci targeted in the MS-qPCR assay. This heatmap displays methylation levels at each locus ranging from unmethylated (light) to methylated (dark). Figure 39 is a graph showing percent demethylation (ordinate) of a DNA region in
NKp46 in control and HNSCC patient blood samples (abscissa) assessed by MS-qPCR. The NKp46 MS-qPCR assay measures the extent of DNA demethylation. A higher level of demethylation indicates a higher level of NK cells within a sample. Wilcoxon rank sum p-value is displayed.
Figure 40 is a listing of DNA sequences of regions in 96 different genes, each sequence having one CpG dinucleotide shown within square brackets and used to determine methylation status of the gene. The DNA sequence surrounding the CpG dinucleotides was used to design probes for the array and for primers for performing the methods for analyzing differential methylation. Also included are the names of the genes, chromosome number indicating the chromosome in which each genes is located, the source of the DNA sequences, Genebank accession numbers, and the coordinate of the CpG dinucleotide in each respective gene.
Figure 41 is a schematic diagram showing different ways of representing effects on measured DNA methylation due to an exposure or a specific phenotype.
Figure 41 panel A depicts the marginal effects (β ) on measured DNA methylation. The marginal effects are effects which are not adjusted for white blood cell (WBC) distribution.
Figure 41 panel B depicts the effects on measured DNA methylation adjusted for WBC distribution resulting from exposure or a specific phenotype.
Figure 42 is a set of graphical representations showing the relationship between a and β , the effect on measured DNA methylation not adjusted or adjusted for WBC distribution, for the covariate (e.g. age, current smoker status, toe Arsenic concentration and Dye use) of interest over all autosomal CpGs. Dots represents overall methylation as indicated by the first component of the coefficient vector β , corresponding to the intercept (Example 38), light=low, black=moderate, dark=high. The diagonal straight line represents identity (α = β). The curve depicts a loess fit to the scatter plot.
Figure 43 is a graphical representation showing fluorescence intensities of CD3Z gene amplified by digital droplet PCR, and a graphical representation showing concentration of CD3Z gene in PCR samples.
Figure 43 panel A shows a fluorescence intensity dot plot for amplification of CD3Z gene by detection of intensities of 6 FAM (6-Carboxyfluorescein). Positive and negative droplets are distinguished by a horizontal line.
Figure 43 panel B shows a correlation of the concentration of copy numbers of CD3Z gene obtained by measuring 6 FAM fluorescence intensities and the expected copy numbers of CD3Z gene obtained by dilution of a known amount of DNA from CD3+ T cells.
Figure 44 is a graphical representation showing fluorescence intensities of FoxP3 gene amplified by digital droplet PCR, and a graphical representation showing concentration of FoxP3 gene in PCR samples.
Figure 44 panel A shows a fluorescence intensity dot plot for amplification of FoxP3 gene by detection of intensities of 6 FAM (6-Carboxyfluorescein). Positive and negative droplets are distinguished by a horizontal line.
Figure 44 panel B shows a correlation of the concentration of copy numbers of FoxP3 gene obtained by measuring 6 FAM fluorescence intensities and the expected copy numbers of FoxP3 gene obtained by dilution of a known amount of DNA from CD3+ T cells.
Figure 45 is a graphical representation showing fluorescence intensities of NKp46 gene amplified by digital droplet PCR, and a table showing concentration of NKp46 gene in the PCR samples amplified under different conditions.
Figure 45 panel A shows a fluorescence intensity dot plot for amplification of NKp46 gene under different conditions by detection of intensities of 6 FAM (6-Carboxyfluorescein). Positive and negative droplets are distinguished by a horizontal line.
Figure 45 panel B is a table showing concentration of NKp46 gene in copies/μΐ determined under different PCR conditions as fractions of methylated control DNA.
Figure 46 is a graphical representation showing fluorescence intensities of NKp46 gene amplified by digital droplet PCR, and a table showing concentration of NKp46 gene in the PCR samples amplified under different conditions.
Figure 46 panel A shows a fluorescence intensity dot plot for amplification of NKp46 gene by detection of intensities of 6 FAM (6-Carboxyfiuorescein). The amplification of demethylated NKp46 locus was performed using C-less and NKp46 DMR specific primers and probes, and results compared. Positive and negative droplets are distinguished by a horizontal line.
Figure 46 panel B is a table showing concentration of NKp46 gene in copies/μΐ determined with whole blood DNA, Neutrophil DNA, CD 16+CD56dim NK cell DNA and CD16+CD56brightNK cell DNA.
Detailed description of the invention
A model of hematopoiesis includes an early restriction point at which multipotent progenitor cells become committed to either lymphoid or myeloid lineages. The standard methods of distinguishing immune cell lineages are inadequate for fully distinguishing lineage commitment and the process of hematopoiesis.
Epigenetics refers to heritable control of gene expression that occurs without changing the sequence of DNA. Chromatin packaging is a mechanism of epigenetic gene regulation which has been implicated in cell lineage commitment and lineage-specific gene expression.
Transcriptionally inactive, or silenced, heterochromatin is more tightly packaged around histone proteins than transcriptionally active euchromatin due to differences in DNA methylation patterns and post-translational histone modifications. Due to its accessibility for measurement,
DNA methylation is a marker of chromatin packaging. DNA methylation is largely confined to cytosine residues in CpG dinucleotides which, though underrepresented in the genome, are
frequently found in high concentrations called CpG islands. Less methylated CpG islands are highly associated with transcriptional activity and subsequent gene expression, and more methylated CpG islands are highly associated with transcriptional inactivity and gene silencing. Methylation of CpG dinucleotides causes chromatin to become more compact and inaccessible to transcription machinery by moving histones and altering the organization of chromatin and nucleosomes.(Christensen, B.C., et al. 2009, PLoS Genet S, el 000602; Schmidl, C, et al. 2009, Genome Res 19, 1165-1 174).
In some instances, the overall balance of leukocyte subclasses in circulation or in tissue most prominently influences pathogenesis. For example, incipient cancer cells are recognized and eliminated by cytotoxic T cells (CTLs) and natural killer (NK) cells, and tumorigenesis is also promoted by certain other inflammatory cells, including B-lymphocytes, mast cells, neutrophils, regulatory T cells (Tregs), and others. These cells have been shown to promote angiogenesis, tumor cell proliferation, tissue invasion and metastasis (Hanahan and Weinberg 201 1, Cell 144, 646-74; Ostrand-Rosenberg, 2008, Curr Opin Genet Dev, 18, 11-18). Likewise, higher levels of NK cells and CTLs circulating in the blood and residing in adipose tissues are associated with lower incidence of metabolic diseases such as type II diabetes (Lynch et al., 2009, Obesity, 17, 601-5), and higher levels of Ml macrophages in adipose tissue can induce inflammation and insulin resistance (Anderson et al, 201 1, Curr Opin Lipidol. 21, 172-177). Methods of quantifying the composition of lymphocyte populations can be informative regarding the underlying immuno-biology of disease states as well as the immune response to almost all chronic medical conditions. (Chua et al., 201 1, Brit J Cancer 104, 1288-1295).
The methods described herein provide a measurement of individual human or animal immune cell numbers or immune cell ratios and in diverse biologic media without the requirement for viable cells or cell sorting or the use of any antibodies or protein markers. The methods are applicable to blood including samples of unsorted blood that is fresh, or is frozen or unfrozen anticoagulant treated peripheral whole blood, finger stick blood, non-anticoagulant treated whole blood, blood clots, isolated mononuclear cells, buffy coat, archival Guthrie card neonatal blood, and to a sample that is a spot, fresh, frozen or is from a tumor such as a formalin-fixed tumor biopsy, and to urine sediment, CNS fluid, fat or other tissue biopsy.
In one embodiment the methods described herein are provided as diagnostic kits for testing laboratories in the form of immune cell specific detection reagents, premixed and optimized plate formatted multiplex assays for immune profiling compatible with specific instrument platforms, applications for in vitro diagnostics of blood, CNS, urine or
bronchoalveolar lavage and point of care blood sampling kits for mail-in immune testing and immune monitoring.
The simplified DNA based immuno-diagnostic approach provided herein uses samples that are much smaller volumes of blood than required for earlier methods and that require no processing. These samples can be simply 'spotted' onto a solid phase carrier and transported through the mail or delivered using courier.
In another embodiment, the methods described include development of software that can process the output data of immune specific methylation assays to create immune parameter reports by comparison to different reference and control values.
In an alternate embodiment the methods herein describe a discovery platform which is a bioinformatic integration of empirically derived genome wide methylation analyses with publically available differential gene expression analyses. The merged datasets are then sorted to produce candidates for further examination. The discovery platform is useful to discover clinically useful gene biomarkers.
The methods described herein include a proof-of-principal test of the discovery platform. For the test the goal set was to discover a gene or gene set that provides a marker of CD3+ T cells. The method is applicable to finding a biomarker for any cell. Specifically, the platform identifies gene regions that are 'demethylated' within the target cell population (CD3+ T cell) and completely methylated in non-target cells.
To accomplish this discovery phase for the set goal, normal immune cells from the peripheral blood of different individuals was isolated using flow cytometry antibody based cell sorting. Following purification each of the immune cell subtypes was subjected to methylation discovery analysis using the Infinium genome-wide methylation platform. (Infinium®
HumanMethylation27 Beadchip Microarray, developed by Illumina®, Inc., San Diego, CA). The DNA methylation data was then merged with existing gene expression data. Candidates that have high potential to discriminate CD3+ T cells from non-T cells were then further analyzed with two different methylation validation methods (pyrosequencing and quantitative methylation specific PCR i.e. MethylLight). Finally, a quantitative calibration curve was developed by diluting known and measured numbers of CD3+ T cells into a background matrix of fully methylated lymphocyte DNA. The latter procedure reconstructs the conditions of detection that are present in differentiating CD3+ T cells from a mixture of cells in a complex biological sample.
The methods described herein use individual samples of sorted, normal, human, peripheral blood leukocytes shown in Table 15, Example 13, purchased from AllCells®, LLC
(Emeryville, CA). These leukocytes were sorted in a column containing antibody-conjugated magnetic beads through a combination of positive and negative selection. DNA from the leukocytes was extracted according to manufacturer's protocol using the DNeasy Blood &
Tissue kit (Qiagen), and subjected to Bisulfite conversion by treatment with sodium bisulfite using the EZ DNA ethylation Kit (Zymo) following the manufacturer's protocol, thereby converting unmethylated cytosine residues to uracil and leaving methylated cytosine residues intact. DNA methylation is measured using a DNA methylation microarray as described in Example 13.
Huehn et al. (U.S. patent publication number 2007/0269823 Al) describes a method for identifying FoxP3-positive regulatory T cells by analyzing the methylation status of CpG positions in the FOXP3 gene, and further describes a method for diagnosing immune status of a mammal by measuring amounts of regulatory T cells thus identified. CpG methylation analysis of FoxP3 gene is also used to determine the quality of in vitro generated T regulatory cells and for identifying chemical or biological substances that modulate the expression of the FOXP3 gene in T cells. Specific CpG positions in the mouse FoxP3 gene are identified for analyzing methylation status and primers for amplifying mouse and human CpG dense regions in FOXP3 gene are described.
Olek (U.S. patent publication number 2007/0243161 Al) describes a method for pan-cancer diagnostics involving identification of an amount and/or proportion of stable regulatory T cells in a patient suspected of having cancer by analyzing methylation status of CpG positions in the FOXP3 and/or camtal genes. Increased amount proportion of stable regulatory T cells in the patient is indicative of an unspecified cancerous disease. A method of treating cancer by reducing the amount or proportion of stable regulatory T cells and a method for diagnosing survival of a cancer patient by measuring T regulator}' cell amounts and/or proportions in patients suspected of having cancer using CpG methylation analysis of FoxP3 and/or camtal genes are described. Increased amounts and/or proportions of stable regulatory T cells in the cancer patient is indicative of a shorter survival.
Olek et al. (International publication number WO 2010/069499 A2) describes a method of identifying T-lymphocytes, in particular CD3+CD4+ and/or CD3+CD8+ cells by analyzing the methylation status of CpG positions in one or more of genes for CD3 multi-protein complex CD3 γ, -δ and -ε, or in other genes. Demethylation is indicative of a CD3+ cell. Olek further describes methods for methylation analysis of CpG positions in CD4+ and/or CD8+ genes, in particular CDS beta gene, or in other genes, and for determining immune status based on T- lymphocytes identified by methylation analyses, and for monitoring amounts of T-lymphocytes in response to chemical and/or biological substance exposure, in particular CD4+ or CD8+ T lymphocytes.
Shen-Orr et al. 2010, Nature Methods Vol. 7:4, 287-289 describes a cell-type specific significance analysis of microarrays for analyzing differential gene expression for each cell type
in a biological sample from microarray data and relative cell type frequencies. In Shen-Orr's method relative abundance of each cell type in a mix tissue sample is first quantified, and this information is used in combination with microarray gene expression data to deconvolve and compare cell type-specific average expression profiles for groups of mixed tissue samples.
Abbas et al. 2009, PLoS One Vol. 4:7 e6098 describes deconvolution of microarray gene expression data to characterize proportions of cells in a tissue, and further identifies cellular activation patterns in Systematic Lupus Erythematosus.
A method similar to regression calibration is provided herein for determining changes in the distribution of white blood cells between different subpopulations (e.g. cases and controls) using DNA methylation signatures ro DNA methylation profiles, in combination with an external validation set having methylation signatures from purified leukocyte samples. The method is demonstrated with Head and Neck Squamous Cell Carcinoma (HNSCC) cases and matched controls, showing that DNA methylation signatures register known changes in CD4+ and granulocyte populations.
Use of DMRs as markers of immune cell identity is employed herein with a high density methylation platform, and a set of analytical tools for estimating the proportions of immune cells in unfractionated whole blood to determine the DNA methylation signature of each of the principal immune components of whole blood (B cells, granulocytes, monocytes, NK cells, and T cells subsets). A form of regression calibration was determined that considers a methylation signature as a high-dimensional multivariate surrogate for the distribution of white blood cells. This distribution was used to predict or model disease states. As a surrogate, the DNA methylation signature was assumed to be a highly correlated measure of leukocyte distribution, and thus fits into the framework of measurement error models, in which the use of a noisy surrogate marker to investigate an association with a disease outcome of interest results in biased estimates, unless internal or external validation data are obtained to "calibrate" the model and correct the bias (Carroll et al., 2006, Measurement error in nonlinear models. Chapman & Hall, Boca Raton, Florida, 2nd edition).
In this case, the problem was complicated by the extremely high dimension of the surrogate. Measurement error problems are formulated as a set of relationships between z, the disease outcome (e.g. case/control status), ω, the gold standard (e.g. leukocyte distribution), and y, the surrogate (e.g. DNA methylation). The concept Ε(ζ|ω), was difficult to estimate due to the cost or logistical complications involved in obtaining ω in a large number of samples. Sufficient data for modeling E(z|y) =/ (y) were collected, which provides information about Ε(ζ|ω) through the (often imperfect) association E(y|co) = g(a>), which is inferred from an external
validation sample (Thurston et al, 2003, J Stat Plan Inf, 113, 527-34; Carroll et al, 2006, Measurement error in nonlinear models. Chapman & Hall, Boca Raton, Florida, 2nd edition). An additional assumption was that E(z|o,y) = Ε(ζ|ω), i.e. the surrogate provides no information about disease above and beyond the standard for which it serves as a surrogate. The high- dimensional nature of y renders / (y) difficult to formulate. Although multivariate methods of measurement error correction exist, even in a high-dimensional context (e.g. Li and Yin, 2007, Ann Stat 35, 2143-72) an explicit specification of/ (y) is important, which becomes unwieldy as each component of y contributes a small amount of information about z, and both dimension- reduction strategies and constrained regression strategies entail substantial loss of information. In the present context, specification of y =/ (z) is natural and straightforward. Consequently, a reversal of the modeling equation is here provided, formulating y=f(z) as part of the modeling strategy, and linking the linear functions /and g in a manner that admits the estimation of ω. In methods herein several major sources of possible bias were identified and methods provided for control and subjection to sensitivity analysis of the sources of the bias.
Examples herein include methods for an estimation technique, theoretical treatment of bias, and a demonstration of the approach through an application to whole blood specimens collected in an example of head and neck squamous cell carcinoma (HNSCC). See Figure 3. Also provided are methods for a sensitivity analysis, demonstrating the impact of possible biases. Simulation study results are shown in examples herein based on the biology in the samples used.
Examples 1-3 herein show a method for determining changes in distribution of white blood cells between different subpopulations (e.g. cases and controls) from DNA methylation signatures, assuming an external validation set consisting of methylation signatures from purified white blood cell (WBC) samples exists. Examples 4, 10 andl 1 herein demonstrate the methodology using a data set of HNSCC cases and matched controls, inferring from DNA methylation assays alone known changes in CD4+ and granulocyte populations between cases and controls and change in CD4+ populations due to aging. Using previous methods flow cytometry would have been necessary to obtain the same results. A method for assessing the sensitivity of the magnitude estimates to possible biases is also provided. Example 12 validates the method through simulation.
Methods are provide herein for determining changes in the distribution of white blood cell types between different human populations (e.g. cases and controls) using DNA methylation signatures; by using an external validation set having methylation profiles from purified white blood cell components. DNA methylation in peripheral blood was accordingly shown to be a
biomarker for clinical and epidemiological investigation. Studies have attempted to distinguish cancer cases from controls using whole peripheral blood assayed with DNA methylation arrays, including ovarian (Teschendorff et al., 2009, PLoS ONE 4, e8274), bladder (Marsit et al., 2011 , J Clin Oncol 29, 1 133-1 139), and pancreatic (Pedersen et al., 201 1 , PLoS ONE 6, el 8223) cancers. Although these studies have demonstrated discrimination of cases from controls, sound evidence for a biological mechanism has been elusive. Presumably, disease associated alterations in blood methylation have several etiological components driven by endogenous genetic, environmental and disease specific factors. From known developmental associated differences in DNA methylation among specific blood cell types, changes in the distributions of blood cell types alone could account for disease associated DNA methylation. The many diverse types of immune cells in blood make this issue highly complex and problematic to tackle using single cell type assays. Therefore, it is important for the development of this new avenue of biomarker research to delineate effects due to the immune cell distribution itself from other "non cell type" alterations in DNA methylation. The differences among human populations attributed to cell distributions are termed "immunologically mediated".
Immunological explanations for differences in mRNA profiles between cases and controls have been proposed, e.g. Showe et al, 2009, Cancer Res 69: 9202- 10 and Kossenkov et al., 201 1 , Clin Cancer Res 17: 5867-77. The statistical principles described in the method herein apply to mRNA expression profiles and an appropriate validation set So based on mRNA expression arrays. Little to no modification of mathematical expressions and computer code is necessary to apply the statistical principles described in the method herein to analysis of mRNA expression profiles. Under the assumption that the upstream epigenetic control mechanisms are more biologically stable, less variability in measurement of DNA methylation is expected compared with measurement of mRNA expression.
In the methods herein, a solution to partition this component of variation in methylation from other determinants employs multivariate analytic tools including regression coefficients, associated inference, and coefficients of determination measures. These tools were used to evaluate whether the observed DNA methylation differences were due to an immunologically mediated response. Prior measurement error formulations (Thurston et al., 2003, J Stat Plan Inf, 1 13, 527-34; Li and Yin, 2007, Ann Stat, 35, 2143-2172) require specification of a logistic regression model for case/control status, conditional on DNA methylation signature, a computationally difficult task that is vulnerabe to model mis-specifications. A reverse formulation was used herein that naturally models the relationship of DNA methylation conditional on known phenotypes. The formulation respects the protocol (DNA methylation assay data collected after sampling from phenotype groups). Other strategies to formulate errors
were found to be unsuccessful. For example, the strategy utilizing Expectation-Maxinlization (EM) algorithm to integrate over the missing data ω (Little and Rubin, 2002, Statistical Analysis with Missing Data. Wiley, Hoboken, NJ, 2nd edition) is outside the measurement error literature and within the larger missing-data literature. However, by design, the distribution of ω varied substantially between the data sets S0 and S1 , severely complicating the approach, with side- effect of introducing feedback from S1 to S0, contaminating the gold-standard status of S0. Another alternative that was found to be unsuccessful was the simpler approach of an empirical Bayes procedure, similar to existing mixture-model approaches (Koestler et al., 2010,
Bioinformatics, 26, 2578-2585). However, difficulty in specifying the distribution of ξ rendered this approach untenable, and in a separate simulation, attempts to impute ω among Sx samples using parameters obtained from S0 samples resulted in extremely biased estimates of ω.
Examples herein show that group level comparisons of blood cell DNA methylation revealed significant immune alterations. Methods for individual level immune cell profiling are applicable also, since methods herein are useful also to clinical and detailed analytical epidemiologic applications that examine individual risk factor information. When Zn involves an orthogonal (e.g. one-way ANOVA) parameterization and ordinary least squares (OLS) is used to obtain Bi, then equation 5 (Example 3) herein reduces to simple expressions involving the projected quantities to, = yi,Bo(Bo Bo)"1. For exploratory purposes, projections ω, serve as estimates of individual profiles. There is interest in minor immune cell fractions and their role in disease, though the signal strength of cell types comprising < 5% of the total white cell compartment is difficult to quantitate. Examples of such cell types include the regulatory T cell or NK cell fractions, which are implicated in autoimmune and malignant diseases. Optimization of platforms for technical sensitivity to minor subtypes combined with statistical optimization of signature recognition are needed to enhance the approach for testing highly targeted immune hypotheses.
In addition to group level comparisons of blood cell DNA methylation, immune cell profiling at the individual level is important for examining individual risk factors in clinical and detailed analytical epidemiologic applications. As shown in Examples herein, individual immune profiles are theoretically achievable and require extensive validation with a wide array of mixture combinations.
The methods herein have potentially far reaching implications for rapid, simple and complete assessment of the composition of human white blood cell populations, i.e. the immune profile. Currently, assessment of the cellular composition of peripheral blood cannot be accomplished without the use of freshly drawn venous blood that is immediately prepared in a
specially equipped laboratory. A complete assessment of the entire immune profile requires extensive flow cytometric measurements based on protein epitopes on leukocyte membranes that distinguishes subtypes of immune cells that are either too rare or too similar in appearance to be distinguished using simple microscopic approaches. In particular, flow cytometry is limited by the following: cells must be separated, requiring large volumes of fresh cells; detection can be accomplished only by the fluorescent antibody tags available, which require expensive technology to read; the outer cell membrane must be intact, mandating limited utility in many instances.
In contrast, using the methods herein, the application of labor-intensive or expensive steps is required only in the construction of the validation set So, which need only be developed once. Once So is available, subsequent interrogation is based on the chemically stable CpG methylation of DNA. Thus the methods herein obviate the need for fresh blood and the preservation of labile protein epitopes. The methods herein are able to also simultaneously assess all of the individual components of the peripheral blood using a highly multiplexed molecular platform and therefore logistically straightforward. Furthermore, the statistical methodology used here is implemented easily with the instrumental output of the methylation arrays, which simplifies the interpretation of the immune profile data from the operator's point of view. The methods herein are immediately deployed in a research framework to cost effectively assess human immune profiles (in fresh or archival samples), to explore the potential of the immune profiles to function as biomarkers, and to address key questions regarding disease pathogenesis. Furthermore, the approach used in the methods herein is readily suited for rapid translation to a broad base of clinical applications such as disease monitoring, diagnosis, prognosis, and response to therapy.
The methods herein are applied to tumor biopsies for immune characterization of cancer patients. Other notable applications exist including the application of the test to urine sediments in patients with autoimmune and diabetic kidney disease or in patients undergoing kidney transplantation. Positive detection of T cells in urine sediment is indicative of immune activation and potential kidney disease progression or acute rejection in the context of kidney transplantation.
Populations of blood lymphocytes can be distinguished morphologically on the basis of size and the presence of a granular cytoplasm.
Small lymphocytes, including all subsets of T- and B cells, are responsible for adaptive immune responses. Sublineages of small lymphocytes are morphologically indistinguishable and are distinguished by cell surface receptors and cellular function. B cells are typically distinguished by expression of the surface molecule CD19. They express immunoglobulins,
which are surface receptors for pathogens. In addition, B cells are capable of further differentiating into effector cells called plasma cells. (Parham, P. The Immune System, Garland Science, New York, NY, 2005). Differentiated T cells exhibit a complex of surface molecules which function as antigen receptors, referred to as the T cell receptor (TCR) complex. This complex includes the TCR a plus β, or γ plus δ antigen recognition chains, which are associated with invariant chain subunits CD3y, δ, ε, and ζ. (Zhang, Z., et al. 2007, Blood 109, 4328-4335). In general, T cells are distinguished from other cell lineages by expression of CD3 molecules on the cell surface. The genes that encode CD3 γ, δ, ε, and ζ subunits are CD3G, CD3D, CD3E and CD3Z respectively. The former three genes are tightly clustered on chromosome 1 1, whereas CD3Z is located on chromosome 1. Differentiated T cells are further divided into two lineages depending on their expression of either CD4 or CD8. The main function of CD8+- T cells, also known as cytotoxic T cells, is to kill infected and transformed cells. The main function of CD4+ T cells is to help other immune cells respond appropriately to sources of infection or malignancy. There are several subsets of CD4+ T cells, including Thl, Th2, Th l 7 and regulatory T cells. (Parham, P. The Immune System, Garland Science, New York, NY, 2005). Regulatory T cells suppress an immune response by influencing the activity of other cell types. They act primarily in the periphery on mature lymphocytes that have exited the main lymphoid tissues and serve as a means of preventing autoimmunity during protective immune responses. Exemplary regulatory T cells are thymus-derived CD4+CD25+Foxp3+ T cells, commonly referred to as Tregs. (Zou, W. 2006, Nat Rev Immunol 6, 295-307). These cells primarily function to maintain peripheral self-tolerance. (Cesana, G.C., et al , 2006, J Clin Oncol 24, 1 169-1 177). Forkhead Box P3 (FOXP3), a transcription factor expressed by Tregs, is an important developmental and functional factor that regulates Treg immunosuppressive functions. (Janson, P.C., Winerdal, M.E. & Winqvist, O. 2009, Biochim Biophys Acta 1790, 906-919; Zou, W. 2006, Nat Rev Immunol 6, 295-307).
Natural killer (NK) cells are large CD56+ lymphocytes with a granular cytoplasm. They enter infected or malignant tissue to kill damaged cells and secrete cytokines aimed at preventing the spread of disease to other cells or tissues. Thus, NK cells act as effector cells of innate immunity. A subset of CD56+ NK cells that express CD3 surface molecules are NKT cells.
To determine if distinct methylation profiles are indeed associated with leukocyte lineages, statistical clustering of methylation patterns was performed using a modified model- based form of unsupervised clustering known as recursively partitioned mixture modeling (RPMM). (Houseman, E.A., et al. 2008, BMC Bioinformatics, 2008, 9, 365).
A locus by locus comparison was performed in which putative leukocyte DMRs were identified from Infmium data in SAS version 9.1 using a macro for locus-by-locus linear modeling that adjusts for control probe and beadchip plate. Infinium beta values for Group 1 leukocyte samples were compared to Infinium beta values for Group 2 leukocyte samples, in which group membership for each phase of the comparison is shown in Table 1.
Table 1. Locus by locus comparison groups

Resultant t- values from each comparison were converted to p-values in R version 2.11.1 of Illumina's software which provides convenient mechanisms for loading and analyzing the results of methylation status, and for quality control and basic visualization tasks.
False discovery rate estimation and Q- values were computed by the Q-value package in R to adjust for multiple comparisons. (Significance was characterized as Q < 0.05.)
For significant CpG loci (Q < 0.05), a negative t-value indicates the locus putatively represents a DMR that is unmethylated in group 1 leukocyte lineage(s) and methylated in group 2 leukocyte lineage(s). Conversely, a positive t-value indicates that the locus putatively represents a DMR that is methylated in group 1 leukocyte lineages and unmethylated in group 2 leukocyte lineages. A DMR that is unmethylated in the leukocyte lineage(s) of interest and methylated in other leukocyte lineages would make the best epigenetic biomarker, since unmethylation is associated with transcriptional activity whereas methylation is associated with transcriptional silencing. Therefore, significant CpG loci exhibiting negative t-values are preferred.
In the methods herein, results of locus by locus comparisons were merged with cell type specific gene expression data. (Palmer et al., 2006, BMC Genomics 7, 1 15; Du et al, 2006, Genomics 87, 693-703; and Hashimoto et al, 2003, Blood 101, 3509-3513) to identify putative DMRs that are in genes associated with altered expression by Group 1 leukocyte lineages compared to Group 2 leukocyte lineages. An exemplary candidate epigenetic biomarker of a specific leukocyte lineage is an unmethylated region of a gene that is highly expressed by the leukocyte lineage, and not expressed by other cell types such as lineage-specific surface molecules,obligate differentiation proteins, and secreted factors. A further candidate is a
methylated region of a gene that is not expressed by the leukocyte lineage and is expressed by all other cell types. Without being limited by any theory or mechanism of action scenarios correlate with chromatin packaging, so that differential DNA methylation plays a large role in regulating leukocyte lineage specific expression of the gene. If no leukocyte lineage specific difference in expression of the gene containing a putative DMR were observed, other modes of gene regulation such as activators, repressors, and enhancers overshadow the role of chromatin packaging in regulating expression of the gene. Alternatively, such a gene is expressed in a temporally or environmentally specific manner that was not elucidated by the gene expression candidate data. Such a putative DMR would not be an ideal target to explore as an epigenetic biomarker of that leukocyte lineage.
In the methods described herein DMR validation is performed for each putative DMR identified from array data using bisulfite pyrosequencing and/or MethyLight quantitative real time PCR assays that measure DNA methylation of the gene region in all sorted human leukocyte samples shown in Table 15, Example 13. Bisulfite pyrosequencing assays were designed using Pyromark Assay Design 2.0 (Qiagen), and carried out on a Pyromark MD pyrosequencer running Pyromark qCpG software (Qiagen). Oligonucleotide primers were obtained from Invitrogen™ by Life Technologies™. The gene region of interest were PCR amplified from bisulfite converted DNA using a biotinylated reverse primer and an unlabelled forward primer. The biotinylated PCR product was complexed with sequencing primers that anneal upstream from the target region, and was then incubated with enzymes and substrates.
Then, dNTPs were dispensed in a specific order and light emitted with the incorporation of each nucleotide is measured with a CCD camera. Methylation was quantified by calculating the ratio of cytosine (methylated) to thymine (unmethylated) at each CpG locus.
In the methods described herein methylation status of specific gene regions was calculated using MethyLight according to the protocol described by Campan et al. 2009,
Methods Mol Biol 507, 325-337, with the following modifications: C-less primers and probe were used to determine total DNA input for each sample and control reference rather than ALU- C4 primers and probe. To measure unmethylation, control unmethylated DNA was used as a reference, generating a percent unmethyated reference value which is subsequently converted into percent methylation. Real time PCR primers and flourescent (major groove binding)MGB probes were obtained from Applied Biosystems (Foster City, CA). TaqMan® Universal PCR Mastermix, no AmpErase® UNG was obtained from Applied Biosystems, manufactured by Roche (Branchburg, NJ). Quantitative, real time PCR reactions were performed with Applied Biosystems 7300 Real Time PCR System using Applied Biosystems 7300 system sequence detection software version 1.4.0.25 ©2001-2006.
In the methods herein, a putative DMR identified as being unmethylated in group 1 leukocytes based on Infinium methylation data was shown using bisulfite pyrosequencing or MethyLight® qPCR to be unmethylated in group 1 leukocytes and methylated in group 2 leukocytes and the DMR was confirmed as an unmethylated epigenetic biomarker specific to the group 1 leukocyte lineage(s). A putative DMR shown using bisulfite pyrosequencing or
MethyLight® qPCR to be unmethylated in group 1 leukocytes and in some group 2 leukocytes, was not confirmed as an epigenetic biomarker specific to the group 1 leukocyte lineage(s). Instead that DMR represents an epigenetic biomarker of several different human leukocyte lineages including the group 1 lineage(s). A DMR that is partially unmethylated by bisulfite pyrosequencing or MethyLight® qPCR in group 1 leukocytes and methylated in group 2 leukocytes, is a weak epigenetic biomarker of the group 1 leukocyte lineage(s). That DMR is heterogeneously unmethylated in group 1 leukocytes and is homogeneously methylated in group 2 leukocytes and is therefore not useful for distinguishing group 1 from group 2 leukocyte lineages.
If Infinium data suggested that a CpG locus represents a DMR specific to group 1 leukocytes, and bisulfite pyrosequencing or MethyLight qPCR did not find a difference in DNA methylation in that region between group 1 and group 2 leukocyte samples, the region was not considered a DMR that would serve as an epigenetic biomarker of the group 1 leukocyte lineage(s).
These discovery platform criteria successfully identified a unique heretofore unknown sequence of genomic DNA that is specifically marked by CpG demethylation in CD3 positive T cells, not in other hematopoietic peripheral blood cells (Figure 10 panel B). In examples herein it is further shown the DNA methylation status of this region in the promoter of CD3Z gene in sorted human peripheral blood leukocytes measured by MethyLight® qPCR confirms that the identified genomic sequence is an immune cell type specific differentially methylated region that is a useful marker to quantify CD3+ T cells in biological specimens such as whole or separated blood and other tissues.
Gliomas are a histologically diverse cancer with few established risk factors and poor prognoses (Kleihues et al. 1993, Brain Pathol 3(3): 255-68; Ohgaki and Kleihues 2005, Acta Neuropathol 109(1): 93-108: Louis et al. 2007, Acta Neuropathol 114(2): 97-109; Ohgaki, and Kleihues 2007, Am J Pathol 170(5): 1445-53). However, immune factors are associated with increased glioma risk and are also thought to play a role in patient outcomes (Wiemels et al. 2009, Int J Cancer. 2009 Aug 1 ; 125(3):680-7; Yang et al. 2010, J Clin Neurosci 17(11): 1381- 5). Patients with glioblastoma multiforme (GBM) exhibit abnormalities (McVicar et al, 1992, J Neurosurg 76(2): 251-60; Ashkenazi et al. 1997, Neuroimmunomodulation 4(1): 49-56) of T
cell response associated with pronounced reductions in T cell numbers in peripheral blood including the suppressive regulatory T cells (Tregs) (Fecci, et al, 2006, Cancer Res 66(6): 3294- 302). Despite low T cell and Treg counts, the ratio of Tregs to T cells is clinically relevant in immunosuppression. Currently there is no validated method to quantify this ratio. The quantification of immunosuppression is envisioned herein to help also in characterizing patient tumors. An immunosuppressive environment in glioma is also suggested by the accumulation of tumor infiltrating lymphocytes (TILs) displaying markers of Tregs, (i.e. cell membrane CD4 and CD25 and intracellular staining of the FOXP3 protein).
Epigenetic markers involving the demethylation of the FOXP3 gene have been determined to be the most specific marker of stable Tregs. (Baron et al., 2007, Eur J Immunol 37(9): 2378-89; Floess et al., 2007 PLoS Biol 5(2): e38; Polansky et al., 2008, Eur J Immunol 38(6): 1654-63). As described in examples herein, by combining information about the FOXP3 differentially methylated region (DMR) with methylation specific quantitative PCR (MS-qPCR) highly sensitive and accurate counts of Tregs in blood and tissues were obtained. Such DNA- based methods to interrogate specific populations of T cell subsets are far less expensive than flow-cytometry and can be applied to archival specimens. Examples herein show that the DMR marker for CD3+ T cells identified herein is used alone or in conjunction with the previously described Treg DMR marker.
A quantitative assay for CD3+ T cells based on the demethylation of the promoter of a component of the T cell receptor complex: CD3Z (CD247) is also described herein. Examples herein show the validity of CD3Z demethylation as a CD3+ T cell marker and illustrate its application in patients with glioma that demonstrate the high discriminating value of CD3Z demethylation in glioma case-control subject comparisons, histopathological characterization of tumors and patient prognosis.
An understanding of the role played by an altered immune response in etiology facilitates development of more effective therapies and prognostic indicators. Epidemiological studies implicate atopic immune alterations in glioma risk (Wrensch et al., 2005, Am J Epidemiol 161 (10): 929-38; Schwartzbaum et al., 2010, Carcinogenesis 31(10): 1770-7). Immune suppression and abnormalities in T cells in glioma patients may prevent antitumor immunity and poses barriers to effective immunotherapeutic strategies (Grauer et al, 2007, Int J Cancer
121 (1 ): 95-105: Sonabend et al., 2008, Anticancer Res 28(2B): 1 143-50). Data obtained using novel T cell epigenetic assays described in examples herein demonstrate dramatic decreases in
CD3+ T cells and Tregs in peripheral blood from GBM patients. The copy numbers of demethy lated CD3Z and FOXP3, as a percent of total leukocyte copies, were observed to be reduced about two-fold in GBM patients, which was highly statistically significant.
Validation studies herein support the notion that the CD3Z MS-qPCR assay using unprocessed archival whole blood is an accurate reflection of T cells as measured by conventional flow cytometry. Previous studies have validated the FOXP3 demethylation assay as a measure of Tregs in blood and tissues (Baron et al., 2007, Eur J Immunol 37(9): 2378-89). Current steroid use (dexamethasone), temozolomide and radiation exposures as possible factors in these effects among cases were investigated but no significant associations of any factor with these T cell alterations was found. The methods described in examples herein that delineate T cell subsets from DNA facilitate immune cell analyses using blood specimens that have been archived in cohort populations with long-term glioma follow-up data. Nested case control studies within large epidemiologic cohorts are now feasible as a result, allowing for the first time, to test whether T cell and Treg abnormalities precede the diagnosis of glioma.
The balance of suppressive Tregs to total T cells in peripheral blood has been reported to be shifted towards greater suppression in GBM patients and other types of cancer (Beyer and Schultze, 2006, Blood 108(3): 804-1 1). Ratio of Tregs/T cells in association with cigarette smoking was examined herein. An association of current smoking with higher Treg/T cell ratios was observed. There is strong evidence that cigarette smoke exposure leads to the accumulation of Tregs in respiratory airways in mice (Brandsma et al., 2008, Respir Res 9: 17) and humans (Smyth et al., 2007, Chest 132(1): 156-63) as well as in the gut epithelium of exposed mice (Verschuere et al., 201 1 Lab Invest. 91(7): 1056-67). Treg/T cell ratios were herein observed to be higher in current smokers versus former smokers (Figure 16). It was subsequently confirmed in an independent population that current but not former cigarette smoking exhibit higher Treg/T cell ratios. Results herein illustrate the need for examination of patient characteristics to include cigarette smoking in diseases that affect Treg levels. New epigenetic methods described herein are useful in promoting these types of studies.
Similar to many types of cancer CD4+ T helper cells and Tregs have been shown to infiltrate the human glioma tumor microenvironment (Nishikawa and Sakaguchi, 2010, Int J Cancer 127(4): 759-67). In glioma studies using IHC to quantify T cells in FFPE preparations CD4+ T cell numbers were reported to increase with tumor grade, whereas CD8+ T cells appear in equal frequencies across glioma grades (Heimberger et al., 2008, Clin Cancer Res 14(16): 5166-72). Results herein indicate increased CD3Z demethylated cells according to grade (Figure
17). Immunohistochemical IHC analysis herein showed that mostly these cells were CD8+ cells with very few CD4+ cells. Examples herein also show that ependymal tumor cells and some significant fraction of grade II Oligodendrogliomas (OD) and Astrocytomas (AS) tumors contain significant numbers of T cells and Tregs (Figure 21). As progression of lower grade to higher grade brain tumors is a common and serious clinical problem results herein show that epigenetic
analyses are useful for characterizing low grade OD and AS tumors as well as Ependymomas (EP). Compared to previous reports (El Andaloussi and Lesniak, 2006, Neuro Oncol 8(3): 234- 43; El Andaloussi and Lesniak, 2007, J Neurooncol 83(2): 145-52; Heimberger et al, 2008, Clin Cancer Res 14(16): 5166-72; Heimberger et al, 2008, Neuro Oncol 10(1): 98-103) analysis herein using the MS-qPCR showed significantly increased ratio of Treg/CD3-t- Tcells within glioma tumor tissues of different pathological grade (Figure 17). Results herein showed also how the ratio of Tregs/CD3+ Tcells increases with tumor grade in comparison to blood. Thus, until the present results, there was no evidence of a specific accumulation of Tregs in human brain tumors. The survival data in examples herein show significant associations of immune parameters with patient survival (Figure 22).
Without being limited by any theory or mechanism of action, observations herein of a close linear relationship between flow cytometry of CD3+ T cells and CD3Z demethylation that was identical among glioma cases and controls argues against a cancer related effect on CD3Z demethylation such as downregulation of CD3Z through a posttranslational effect on CD3Z proteins mediated by up regulation of lysosomal or proteasomal degradation pathways. Another issue concerning the validity of CD3Z demethylation as a CD3+ T cell marker in cancer tissues is that DNA demethylation may take place in transformed cells and thus 'mimic' a lymphocyte signal. To ascertain that the observed CD3Z demethylation was taking place in CD3+ T cells and not due to DNA demethylation taking place in transformed cells CD3Z and FOXP3 demethylation in brain tumor cells lines and in human GBM xenografts which cannot contain human T cells was assessed. These samples contained non-detectable levels of CD3Z or FOXP3 demethylation. Normal brain tissue was also uniformly devoid of T cell signals, consistent with the specificity of the MS-qPCR in tumor as reflecting infiltration of immune cells. Some subtypes of NK cells (CD56dimCDl 6bright) utilize CD3Z in NK receptor signaling (Lanier, 2006, Trends Cell Biol 16(8): 388-90). The contribution of CD3Z expressing and demethylated NK cells to the overall CD3Z demethylated signal in peripheral white blood cells is estimated to be very small. Furthermore, NK cells have not been observed in glioma tissues.
The fundamental innovation in the epigenetic analyses described herein is a shift in immunodiagnostics away from proteomic-based approaches to one that is based on quantifying cell type specific DNA methylation events. This new approach produces gains in versatility, sensitivity, feasibility and throughput compared with conventional flow cytometry or IHC and does so at a lower cost. The high chemical stability of cytosine methylation marks within genomic DNA and the fact that differentiation within the immune system is tightly linked with gene specific DNA methylation events makes quantification of immune cells through epigenetic analyses a unique approach. The method combines the intrinsic chemical stability of DNA with
the high sensitivity of qPCR methods. Automation and liquid robotic handling in processing and analysis add further to the power of the methodology and open avenues for investigations in the immunoepidemiology of glioma and many other diseases.
Methods herein show that blood-based DNA methylation signatures across a complex cellular mixture of WBCs are useful for distinguishing solid tumor cancer cases in which there are well-defined immune-mediated responses and controls. As tumorigenesis elicits a distinct immune response (Camilleri-Brot S et al, 2004, Ann Oncol 15: 104-112; Wang Y et al, 2005, Am J Clin Pathol 124:392^01 ; Rui L et al, 201 1 Nat Immunol 12:933-940), the result is a hematopoietic shift in WBC populations, which can be precisely discerned by applying the unique epigenetic signature of differing lineages. The aggregate methylation signature in blood that distinguishes cancer cases from controls corresponds to the epigenetic signatures that define leukocyte subtypes.
To understand the role of immune-mediated responses to tumorigenesis in defining distinct signatures of blood-based DNA methylation between cancer cases and cancer-free controls in examples herein, the epigenetic landscape of WBCs was obtained by identifying DMRs among leukocyte subtypes. This analysis revealed that nearly all of the highest ranking 50 leukocyte DMRs (Example 25) were differentially methylated between disease cases and normal controls for HNSCC and ovarian cancers, with a smaller fraction differentially methylation between bladder cancer cases and controls. Among the eight overlapping CpG loci that were found to be significantly differentially methylated between cancer cases and controls across the three data sets, the direction of the relationships was similar for HNSCC and ovarian cancer cases compared to controls. These findings show that HNSCC and ovarian cancer elicit similar shifts in leukocyte compositions in the hematopoietic system.
Of the seven overlapping DMRs (CD 72, PACAP, FGD2, SLC22A18, GSTP 1,
NFE2, ASGR2) several are located within genes with either established or alleged involvement in immune differentiation or function, viz., CD72, PACAP and FGD2 (Kumanogoh and ikutani, 2001, Trends Immunol 22:670-676; Parnes and Pan, 2000, Immunol Rev 176:75-85; Tan et al., 2009, Proc Natl Acad Sci 106:2012- 2017; Huber C et al., 2008, J Biol Chem 283:34002-34012). CD72, a member of the C-type lectin superfamily, negatively regulates B cell coreceptor signaling (Kumanogoh and Kikutani, 2001) and has been shown to act as a unique inhibitoiy receptor on NK cells regulating cytokine production (Alcon VL et al., 2009, Eur J Immunol 39:826-832). Moreover, PACAP has been implicated as an intrinsic regulator of regulatory T cell abundance after inflammation36 and FGD2 has been shown to play a role in leukocyte signaling and vesicle trafficking in cells specialized to present antigen in the immune system (Huber C et al., 2008, J Biol Chem 283:34002-34012).
In the model described herein containing the DNA methylation profile for the highest ranking 50 leukocyte DMRs, patient age, gender, smoking status, smoking pack years, weekly alcohol consumption, and HPV serological status (Table 19, Example 13), HNSCC cancer was predicted with high degree of sensitivity and specificity. Similarly high prediction performance was obtained for ovarian cancer using the DNA methylation profile for the highest ranking ten leukocyte OMRs and patient age group. Prediction performance for bladder cancer, based on the methylation profile of the highest ranking 56 DMRs, patient age, gender, smoking status, smoking pack years, and family history of bladder cancer, was lower than that observed for HNSCC and ovarian cancer. One explanation for the differences in magnitude for discriminating cancer cases and controls among cancer types is underlying differences in the magnitude of shift in leukocyte subtypes. Cancers characterized by a pronounced immunologic response such as HNSCC and ovarian cancer (Alhamarneh O et al., 2008, Head Neck 30:251-261; Zhang L et al., 2003, N Engl J Med 348:203-213; Tomsova M et al., 2008, Gynecol Oncol 108:415-420; Sato E et al., 2005, Proc Natl Acad Sci 102: 18538-18543; Curiel TJ et al, 2004, Nat Med 10:942-949), correspond to more discernable shifts in leukocyte sub-population, thus resulting in greater discrimination of blood-derived DNA methylation using leukocyte DMRs for these cancers compared to bladder cancer.
Substantial correlation was also obtained in methylation of the loci identified via the semi-supervised recursively partitioned mixture model (SS-RPMM) analyses and the leukocyte DMRs that defined the methylation classes discovered for the HNSCC and ovarian data sets. A diagram illustrating the analytic framework for SS-RPMM is provided in Figure 32. The SS-RPMM25 procedure is specifically designed to construct methylation classes that are based on an optimal number of informative features (loci whose methylation is most strongly associated with cancer case/control status). The results demonstrate that the methylation classes identified through SS-RPMM for the HNSCC and ovarian data sets are in large part due to systematic hematopoietic changes in WBC populations in response to tumorigenesis. The 56 leukocyte DMRs used in the bladder profile analysis were less correlated with the nine CpG loci identified via the previously reported SSRPMM analysis of this data set (Marsit CJ et al., 201 1, J Clin Oncol 29: 1 133-1 139). Alternative biological epigenetic mechanisms may be operative in bladder cancer in addition to the epigenetic signatures characteristic of leukocyte subtypes, and contribute independently to the blood-derived differences in DNA methylation between bladder cancer cases and controls.
Examples herein provide evidence that observed differences in blood-derived DNA methylation in cancer cases are largely explained by systematic differences in the methylation signatures of leukocyte sub-populations. These findings signify that different cancers elicit a
discernible, unique immune response evident in peripheral blood. These results have important implications for research into the immunology of cancer. Further, the approach of observing differences in blood derived DNA methylation provides a completely novel tool for the study of the immune profiles of diseases where only DNA can be accessed; that is, this approach has utility not only in cancer diagnostics and risk-prediction, but can also be applied to future research (including stored specimens) for any disease where the immune profile holds medical information. The approach represents an extremely simple, yet truly powerful and important new tool for medical research and may serve as a catalyst for future non-invasive disease diagnostics.
Natural kil ler (NK) cells are a key element of the innate immune system implicated in human cancer. To examine NK cell levels in archived blood samples from a study of human head and neck squamous cell carcinoma (HNSCC), a DNA -based quantification method described in methods herein was developed (Examples 27-36).
Head and neck squamous cell carcinoma (FTNSCC) is strongly associated with alterations in the immune system and it is postulated that progression of HNSCC tumors is linked to immune evasion or failure of the immune system to fight the cancer (Duray A, et al., 2010, Clinical & developmental immunology, 2010:701657; Pries R, and Wollenberg B, 2006, Cytokine Growth Factor Rev, 17: 141-6; Wulff S et al., 2009, Anticancer research, 29:3053-7; Kuss I et al., 2004. Clin Cancer Res, 10:3755-62; Kuss I et al, 2005, Adv Otorhinolaryngol, 62: 161-72). Natural killer (NK) cells are of particular interest in the context of HNSCC and other cancers, since they are able to recognize and destroy pre-cancerous and malignant cells (Kim R et al., 2007, Immunology, 121 : 1-14; Ostrand-Rosenberg S. 2008, Curr Opin Genet Dev, 18: 1 1-8; Whiteside TL, 2006, Cancer Treat Res, 130: 103-24; Parham P. The Immune System. 2nd ed. New York, NY: Garland Science; 2005). Natural killer cell infiltration into solid tumor tissue has been associated with improved survival in studies of many different types of cancer (Ishigami S et al., 2000 Cancer, 88:577-83; Kondo E et al., 2003, Dig Surg, 20:445-51; Villegas FR et al., 2002, Lung Cancer 2002;35:23-8). Immune suppression is frequently seen in patients with head and neck cancer (Duray A, et al, 2010, Clinical & developmental immunology, 2010:701657; Pries R, and Wollenberg B, 2006, Cytokine Growth Factor Rev, 17: 141-6; Wulff S et al., 2009, Anticancer research, 29:3053-7; Kuss I et al., 2004. Clin Cancer Res, 10:3755-62; Kuss 1 et al., 2005, Adv Otorhinolaryngol, 62: 161-72). Diminished NK cell and natural killer T (NKT) cell activity and number have been observed in the peripheral blood of patients with HNSCC (Wulff S et al, 2009, Anticancer research, 29:3053-7; Moiling JW et al., 2007, J Clin Oncol, 25:862-8).
A novel DMR is identified herein that distinguishes NK cells from other leukocytes to facilitate the quantification of NK cells in archived blood samples from a case control study of HNSCC. Many chemical exposures, such as tobacco and alcohol, as well as viral factors, such as human papilloma virus (HPV), are known or suspected to be causal factors in HNSCC (Furniss CS et al., 2009 Annals of oncology : official journal of the European Society for Medical Oncology / ESMO, 20:534-41 ; Applebaum KM et al., 2007, Journal of the National Cancer Institute, 99: 1801-10) and may independently affect immune profiles (Mehta H et al., 2008, Inflammation research, 57:497-503; Wansom D et al, 2010, Archives of otolaryngology~head & neck surgery 2010; 136: 1267-73; Gao B et al., 201 1 American journal of physiology
Gastrointestinal and liver physiology 300:G516-25). Unlike previous studies, data shown herein evaluates the effects of these factors on the depression in NK immune profile. Patient risk factors and disease characteristics (e.g. tumor location) are evaluated herein in relationship to NK cells to determine the independent associations of HNSCC with innate immune parameters.
NK cell-specific DNA methylation was identified by analyzing DNA methylation and mRNA array data from purified blood leukocyte subtypes (NK, T, B, monocytes, granulocytes), and confirmed via pyrosequencing and methylation specific quantitative PGR (MS-qPCR). NK cell levels in archived whole blood DNA from 122 HNSCC patients and 122 controls from a study population were assessed by MS-qPCR. Details of this study population have been previously described (Applebaum KM et al., 2007, Journal of the National Cancer Institute, 99: 1801-10). Briefly, peripheral blood from 122 control donors and 122 HNSCC patients was collected between December 1999 and December 2003 in the greater Boston area. Population based control subjects with no prior history of cancer were from the same region as cases, and were frequency matched on age and gender. Study approval was obtained from the Brown University Institutional Review Board. All subjects provided written informed consent for participation in this study. Venous anticoagulated whole blood was drawn into sodium citrate and stored at -20 °C prior to DNA isolation.
Pyrosequencing and MS-qPCR (Figure 39) confirmed that a demethylated DNA region in NKp46 distinguishes NK cells from other leukocytes, and serves as a quantitative NK cell marker. Demethylation of NKp46 was significantly lower in HNSCC patient blood samples compared with controls (p < 0.001). Individuals in the lowest NK tertile had over 5-fold risk of being a HNSCC case, controlling for age, gender, HPV1 status, cigarette smoking, alcohol consumption, and BMI (OR = 5.6, 95% CI: 2.0, 17.4) (Figure 37). Cases did not show differences in NKp46 demethylation based on disease treatment or tumor site.
The results of this study indicate a significant depression in NK cells in HNSCC patients that is unrelated to exposures associated with the disease. DNA methylation biomarkers
of NK cells represent an alternative to conventional flow cytometry that can be applied in a wide variety of clinical and epidemiologic settings including archival blood specimens.
Understanding of immune cell level alterations associated with cancer and other diseases has, until now, been restricted by the limitations of immunodiagnostic methods. Described herein is a new method for measuring NK cell levels in human blood and tissue based on cell- lineage specific DNA methylation that can be applied to samples regardless of handling and storage procedures. This is a step forward in immune cell detection and quantification that is applicable to many types of clinical samples. Applying the method to a case-control study of HNSCC (Examples 27-36) revealed a case-associated decrease in circulating NK cells that is independent of known risk factors and treatments. This shows that it is important to monitor NK cell levels in patients with HNSCC, and that it may be worthwhile to pursue future immune therapies may be designed aimed at restoring circulating NK cells in patients with HNSCC.
A variety of methods are available as bases for methodology used to analyze CpG methylation states. These methods can be divided roughly into two types: gene-specific and global methylation analysis. A large number of techniques have been developed for gene- specific CpG methylation analysis. Early studies used methylation sensitive restriction enzymes to digest DNA followed by Southern detection or PCR amplification. Bisulfite reaction based methods such as methylation specific PCR (MSP) and bisulfite genomic sequencing PCR are commonly used currently. Global methylation analysis measures the overall level of methyl cytosines in genome by methods such as chromatography or methyl accepting capacity assay. Further, methylation hot-spots or methylated CpG islands in the genome may also be identified by several of the recently developed genome-wide screen methods such as Restriction Landmark Genomic Scanning for Methylation (RLGS-M), and CpG island microarray.
The gene-specific method MethyLight is a highly sensitive high-throughput quantitative methylation assay, capable of detecting methylated alleles in the presence of a 10000-fold excess of unmethylated alleles using fluorescence-based real-time PCR technology that requires few or minor further manipulations after the PCR step. Eads CA et al., Nucl. Acids Res. (2000) 28 (8): e32-00. For example, a MethylLight assay is commercially available from Q1AGEN, Inc. Valencia, CA.
In another embodiment of the method, analyzing the methylation of any gene, e.g., the
CD3Z gene through amplification by Polymerase Chain Reaction (PCR) is performed using digital PCR. Digital PCR is an improved method of PCR useful to overcome difficulties associated with conventional PCR. Conventional PCR assumes that amplification of nucleic acid is exponential and nucleic acids are quantified by comparing the number of amplification cycles and amount of PCR end-product to those of a reference sample. In practice however, several
factors interfere with this calculation, making measurements uncertainties and inaccurate and hence unsuitable for highly sensitive measurements.
In digital PCR, a sample is partitioned so that individual nucleic acid molecules within the sample are localized and concentrated within many separate regions. Molecules can be counted by estimating by using a Poisson distribution. Each partition contains "0" or " 1 " molecules, or a negative or positive reaction, respectively. After PCR amplification, nucleic acids are quantified by counting the regions that contain PCR end-product, which is a count of positive reactions. A system for digital PCR based on integrated fluidic circuits (chips) having integrated chambers and valves for partitioning samples is commercially available. For example a digital PCR system is available from Life Technologies (Grand Island, NY 140721JSA) and QuantaLife QuantaLife Pleasanton, CA USA).
A skilled person will recognize that many suitable variations of the methods may be substituted for or used in addition to those described above and in the claims. It should be understood that the implementation of other variations and modifications of the embodiment of the invention and its various aspects will be apparent to one skilled in the art, and that the invention is not limited by the specific embodiments described herein and in the claims. The present application mentions various patents, scientific articles, and other publications, each of which is hereby incorporated herein in its entirety by reference.
The invention having now been fully described, it is exemplified by the following examples and claims which are for illustrative purposes only and are not meant to be further limiting.
Examples
Example 1 : Statistical methods for using DNA methylation arrays as surrogate measures of cell mixture distribution
In the framework for measurement of methylation status of CpG sites in cell mixtures Yoh represents an m x 1 vector of methylation assay values, e.g. average beta values from an
Infinium bead-array product corresponding to a purified blood sample consisting of a homogenous cellular population (e.g. monocytes or granulocytes), with the qualitative characterization of the cell type indicated by a dQ x 1 covariate vector w,, . Here, h e { 1,..., n0 } , and the m individual values correspond to CpG sites on a DNA methylation microarray, possibly pre-selected to correspond to putative DMRs for distinguishing different cellular types. Correspondingly, Y, . represents an m x 1 vector of methylation assay values for the same CpG sites (in the same order) as Υ0Λ , but corresponding to a heterogeneous mixture of cells (e.g.
peripheral whole blood) from a human subject. Here, i e { 1 ,...,«, } , «, is the number of target specimens, and z„ is a dl l covariate vector representing an intercept as well as phenotypes or exposures corresponding to the subject, e.g. dx = 2 for a simple case/control study without confounders. Here the goal is to understand the associations between Y„. and zu in terms of associations between Y0A nd w0A , i.e. to infer changes in mixtures of cell types associated with phenotypes or exposures, using DNA methylation as a surrogate measure of cell mixture. Thus, there are two data sets, ^ = {(Y01,w1 ),..., (Y0¾ ,>v¾ )} , the set of data from "purified" cell samples effectively representing external validation or gold-standard data and
5, = { Yu, zl),..., (Yl ,z^ )} , representing surrogate data collected from a target population. To this end following linear models are provided:
 where B0 and l are, respectively, m x dQ and , m x dt matrices and e0 and e, are error vectors.
For simplicity a one-way ANOVA parameterization for w is assumed. Slight generalizations to account for design complications met in practice is described in Example 2.
A reasonable regression parameterization for z is also assumed, including an intercept, and for convenience, the first column of B0 is denoted as μ , , the m x l intercept. The error vectors e0 and el may reflect independence among arrays h and / , or else may have more complex random effects structure accounting for technical effects or biological replication; however, their substructures are incidental to this analysis, with the exception of the fine details of the bootstrap procedure proposed below.
To implement a surrogacy relation, the following linking regression model is proposed:
Β, - Ι^+ Β, Γ+ υ. (2) where Γ is a d0 χ dx matrix that summarizes associations between the rows of B0j and B1( and
U is a matrix of errors. Substituting equation (2) into (1), writing B0 = (b01,...,borf ) explicitly in terms of its columns and writing Γ T= (j„..., γ d ) , it follows that
 To impart a biological interpretation, it is assumed assume that the DNA assayed in Sl arises as a mixture of DNA from cell types profiled in S0 , with mixture coefficients whose population average, conditional on z , are {ω^ζ) ,.,., ω^} , so that
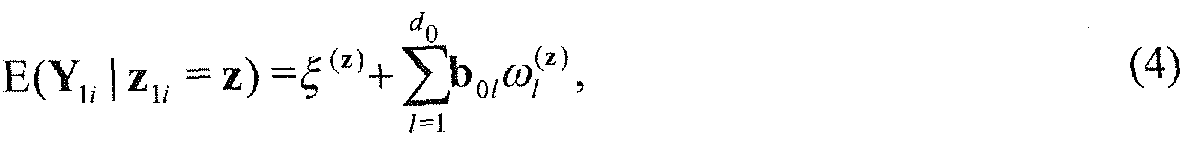 where the m x \ vector ξ {'λ represents cell types excluded from consideration among the purified samples in S0 , or else non-cell specific methylation, including alterations at the molecular level in the maintanence of DNA methylation patterns themselves (possibly exposure related, age, or disease related). It follows from (3) and (4) that the mixture coefficients are recoverable from Γ , =y zu , provided ξ (τ) η orthogonal to the column space of B„ . As discussed in detail in the Example 3 bias can arise if differences in ξ { ) between distinct values of z have nonzero projection onto the column space of B0 , although the magnitude of anticipated biases can be assessed through sensitivity analysis as sown in Example 1 1 .
It is possible to assign interpretations to the components of variation in (3). SS0 represents overall variability in Y„. , i.e. SS0 = || Y1; -μ ,|2 , where μ = E(Y ) . From multivariate probability theory it is straightforward to show that SS0 = SSe + SSr + SSU , where
 . SSe measures variation unexplained by the covariates ζ,, , presumed to represent a combination of technical noise and unsystematic biological heterogeneity. SSV measures variability explained by mixtures of profiles in the set S0 , and SS measures variability in systematic biological heterogeneity that nevertheless remains unexplained by mixtures of profiles in S0 , presumably due to some process other than differences in mixtures of cell types. Thus two partial coefficient of determination measures are proposed: R,2 0 = SS SSa , which represents the proportion of total variation in S1 explained by S0 , and = SS (SS0 - SSe) , which represents the proportion of systematic variation in S1 explained by S0 . It is noted that R,2, is poorly defined when SSa * SSe .
Estimation proceeds by applying an appropriate linear model, e.g. ordinary least squares, linear mixed effects models (Wang and Petronis, 2008, DNA Methylation Microarrays:
. SSe measures variation unexplained by the covariates ζ,, , presumed to represent a combination of technical noise and unsystematic biological heterogeneity. SSV measures variability explained by mixtures of profiles in the set S0 , and SS measures variability in systematic biological heterogeneity that nevertheless remains unexplained by mixtures of profiles in S0 , presumably due to some process other than differences in mixtures of cell types. Thus two partial coefficient of determination measures are proposed: R,2 0 = SS SSa , which represents the proportion of total variation in S1 explained by S0 , and = SS (SS0 - SSe) , which represents the proportion of systematic variation in S1 explained by S0 . It is noted that R,2, is poorly defined when SSa * SSe .
Estimation proceeds by applying an appropriate linear model, e.g. ordinary least squares, linear mixed effects models (Wang and Petronis, 2008, DNA Methylation Microarrays:
Experimental Design and Statistical Analysis. Chapman & Hall, Boca Raton, Florida), limma (Smyth, 2004, Stat Appl Genet and Mol Biol, 3(1), 3), or surrogate variable analysis
(Teschendorff et al., 2011, Bioinformatics, 27(11), 1496-505), to obtain estimates B 0 and B, .
Estimates of γ 0 and Γ are then obtained by projecting B, onto the column space of
B0 = (lm, B0) , as described in detail in the Example 3. Standard errors can be obtained in one of three ways. The simplest estimator, SE0 , is the "naive" estimator from simple least squares theory, ignoring the fact that B 0 and B1 are estimates, i.e. potentially variable. To account for variation in estimating B. , a simple alternative is to use a nonparametric bootstrap procedure.
For each bootstrap iteration t , sampling is performed with replacement from S1 (or sample errors in a manner consistent with a hierarchical experimental design) to obtain S,(" , producing bootstrap estimates B ° from which "single-bootstrap" standard errors SEl are computed.
Finally, it is possible to account for variation in estimating B0 by also bootstrapping S0 ; because of potentially small sample sizes n0 , using a parametric bootstrap is proposed herein. A "double- bootstrap" standard error estimator, SE2 , is computed from these two sets of bootstraps. The double-bootstrap has the additional benefit over the single-bootstrap, in that it can be used to assess bias due to measurement error (variability) in B c, . Estimation details are provided in Example 3.
Beyond bias due to measurement error, which is easily corrected using the double- bootstrap procedure, there are additional sources of potential bias. For example, a univariate zu representing case/control status is considered, where δ≡ξ (1)-ξ (0)= Β0 for some d0 x l vector a≠0. In such a situation, there will be a bias equal to a in estimating the mixture differences. Example 2 provides a detailed analysis of such biases, and proposes a sensitivity analysis procedure for assessing the magnitude of possible bias in a given data set.
In the examples herein the method for inferring changes in the distribution of white blood cells between different subpopulations is used for analysis of population data. It is possible to use S0to predict distribution of leukocytes in a single sample having DNA methylation profile Y* . Equating the intercept term of B, in (1) with Y* and applying (2), mixing proportion estimates Γ*= (BjB0)""' BjY* is obtained. Estimates can be further refined with the use of quadratic programming techniques (Goldfarb and Idnani, 1983, Math Prog, 27,
1-33), restricting the components of Γ * , /,* > 0 in minimizing || Y* - B0 Γ * || 2 with respect to Γ * . Such individual projections of methylation profiles on the column space spanned by S0 facilitate the application of the fundamental ideas proposed above to individual, clinically-based diagnostic procedures.
It is noted that DNA methylation arrays are typically focused on the comparison of methylated to unmethylated CpG dinucleotides, not quantifying actual amounts of DNA.
Therefore, information on cell mixtures from DNA methylation is limited to distributions, not actual counts, as one might obtain from flow cytometry. In addition, it is possible to model zy directly as a function of mixture coefficients Γ * obtained individually via the constraint γ ≥ 0 .
Example 2: General designs for the treatment of methylation assay data obtained from purified cells S0
Because the cell types assembled in S0 potentially involve hierarchical relationships corresponding to cell lineage, designs that are more general than a one-way ANOVA parameterization may be necessary forw . If cell-type interpretations can be extracted from ¾ via a d0 x d0 * contrast matrix L (i.e. B L identifies the mean methylation for d0 * cell types), then interpretations can be obtained by simply replacing B 0 with BL in the projection used to estimate / 0 and Γ and their standard errors. The case of CD4+ and CD8+ T cells, both of which are the primary components of the T-lymphocyte group is considered as an example. In this example one sample is purified CD4+ T cells, another sample is purified CD8+ T cells, and yet another sample is T-lymphocyte cells that have not been purified to more specific lineages. Such was the case for S0 in the examples. The CD4+ sample may be identified as
w0A = ( 1 , 1 ,0)T , the CD8+ sample as w0A = (1 ,0, 1 )T , and the latter, less specific sample as w0A = (1,0,0)T . Then an appropriate contrast L for identifying CD4+ and CD8+ samples would be constructed as a 3 x 2 matrix with columns (1 ,1,0)T and (1,0, 1 )T . This approach was used in the examples 6-9 below, and was also employed in the simulations.
Example 3: Estimation details and bias
Estimation : A two-stage estimation procedure is here introduced. The first stage of analysis involves estimation of B0 and Bi by appropriate linear models, e.g. ordinary least squares (OLS) regression estimator and a similar estimator for
 (μ ,,B,)T ; a procedure such as limma; or else locus-by-locus linear mixed effects models that
0 D adjust for technical (e.g. chip) effects. The second stage of analysis, estimation of γ 0 and Γ , proceeds as follows:

where B0 = (lm ,B0) . Let rv = Bl - l 0- Bat ,∑ ≡(& )„ = (m - d0 - ΙΓ' Γ^ ,
V0 = m(BjB0)~\ and V0 = ( ^ )ra . Naive standard error estimates for the (r, s)'h element of ( 0, f T) can be obtained by computing (m^v^a^ )1'2 . The naive standard error estimates fail to account for the variability in estimating B 0 and Bj , and are consequently biased, as demonstrated in the simulations, Example 12.
A nonparametric bootstrap procedure is used as an alternative. For each bootstrap iteration t, with replacement from Si is sampled, (or sample errors in a manner consistent with a hierarchical experimental design, e.g. takin into account chip effects), to obtain
 . From S,' an estimate of Bj° is obtained, and then y
 with B[° in (SI). After resampling a large number Γ times, standard errors are obtained empirically from the bootstrap sets { , }(=1 xand {Γ (,)}(=1 T . This method of estimation is called the "single bootstrap" to distinguish it from an alternative that accounts for variability in estimation of B0 as well.
Because So will typically consist of small sample sizes per cell type, a nonparametric bootstrap procedure for estimating variation in B 0 may not perform well. Therefore a parametric bootstrap is used. Let Ω; be the variance-covariance matrix for the j"' row of B 0 . A resampled matrix B,3 is formed by adding, to each row j of B 0 , a zero-mean multivariate normal vector with variance-covariance Ω ; , or a corresponding multivariate t-distribution with n0 - d0 degrees of freedom. Then γ ^ and Γ( are computed from (SI) by replacing B 0 with Bp (in addition to the previously mentioned replacement). This method is referred to as the
"double bootstrap". The double bootstrap ignores correlation between CpG sites within a single validation sample, and given the relative purity assumed for these samples and adequate correction for technical effects, this is reasonable to first order. As is demonstrated in
Examples 6-9 and simulations (Example 10), there is negligible difference between the single and double bootstrap, so the incorporation of additional complexity to model cross-CpG correlations is unlikely to produce much benefit. However, the double-bootstrap has the additional benefit over the single-bootstrap, in that it can be used to assess bias due to measurement error (variability) in B 0 .
Bias: There are several potential sources of bias in this analysis. The first arises from
measurement error in Bo, and the others arise from biological non-orthogonality.
It can be shown that first form of bias, from measurement error, manifests as a multiple of Γ on the order of V(l Ω , where Ω = » ι °'_[ Ω ί . However, it is easily assessed using the double-bootstrap procedure described above, by subtracting ^ from Ύ '∑'=1 / o ! and f from
^ 'Σ ^ '" ' an( k'as correction can be implemented by subtracting this term from the estimate.
Biases induced by biological non-orthogonality are more insidious. For example, a univariate zv is considered representing case/control status, where δ≡ξ (1)-ξ (0)= 0a for some d0 x 1 vector a≠0. In such a situation, there will be a bias equal to in estimating the mixture differences. Non-orthogonal δ may arise from two distinct sources. One occurs when some cell types have not been profiled in S0 , so that <¾) ί < 1 . The other may arise when some non- cell-mediated biological process (i.e. distinct from a change in cellular mixtures) nevertheless results in methylation profiles that appear similar to those that distinguish cell types profiled in S0 ,. To this end, model represented by equation (4) is elaborated follows:
E(Y„. I zm = z) = £(Β0 ί ;+Α«Χ + ( 7 ) (6)
where q e { 1 ,...,Q} indexes unprofiled cell t es (or free DNA), each with methylation profile μ q , and in mixture proportions = 1 · Here X [z) denotes an

"abnormal", or at least non-functional, non-cell-mediated process that is specific to disease status (and may affect different cell types in different degrees of intensity).
Let P = (BJBo) ' BQ , and denote difference between case and control parameters using Δ, e.g. Αω, = ω^ - ω^ and ΔΕ(Υ„) = E(Y„ | z,„ = 1 ) - E(Y | z1;, = 0) . It follows from equation (6) that
ΡΛΕ( Y„ ) = ^ε ,Λω, + ff < +∑ΡΔ(Λ ,ω, ) +∑ΡΛ(Λ ¾ )· (7)
=l
The values A oq may need to shift in order to accommodate any shifts ΐηΑω, , since the model constrains ^'Δω, +∑^=]Δί¾ = 0 . The first term on the right hand side of (6) is the target quantity, identifying the desired mixture weights. The second term will be negligible if all profiles μ are approximately orthogonal to the columns ofB 0 , or else the differences A >q are all small. This condition will be satisfied if S0 is exhaustive in the sense that !-Li^ is negligible.
Mathematically, it is difficult to further characterize the latter two terms, without specifying what kinds of non-cell-mediated processes are likely. For example, even if Αλ = 0 for a particular value ofq , it may nevertheless still produce a bias if Δίο ≠ 0 . Conversely, even if Am, = 0 , bias can result from a nonzero difference Αλ ι (e.g. different methylation intensities at island shores due to distinct risk profiles) if Αλ , is not annihilated by P. Only processes that are equal in intensity in both cases and controls and across all cell types will be differenced out of equation (7). Thus, a key consideration is whether P annihilates the methylation signature corresponding to a given non-cell-mediated biological process. In order to examine this issue more carefully, a Bayesian view is adopted to characterize a prior expectation of bias as a function of prior probabilities for individual CpG sites. The goal, in part, is to understand the potential for bias, given the number m of CpG sites chosen to be measured in S0 , with the goal of selecting m in a manner consistent with minimizing bias.
Assuming that the CpGs under consideration are ordered in advance (e.g. randomly or by
F-statistic . =
 , and that the dependence of trHm = BjB0 is explicitly written on m . If the CpGs are randomly ordered, then trHm = 0{m) , otherwise it is possible that trHm = 0{ml~i' ) , ζ > 0 reflecting a diminishing rate of return by adding additional non- informative CpG sites. Then S- is decomposed by the number
 k of CpG sites affected by all alterations that distinguish cases from controls, k is fixed, k G Jm = { ! ,..., m) ; each of the C(m, k) = ml/[k\(m- k)\] subsets Jw cz Jm of £ indices corresponds to a vector δ kl representing the mean methylation difference between case and control over all systematic biological processes that result in changes at the k specific CpG sites represented by the k indices, and only those k CpG sites. Thus δ kl as at most k nonzero values. The bias resulting from such processes is H^Bj<5 H= 0(1αηζ~ι ) . A prior probability πα is assumed that the subset Jkl could correspond to one or more biological processes that distinguish cases from controls. It follows from this view that the prior expectation of δ is m C(m,k) ( m C(m,k
If a prior probability over all sets of CpG sites in the genome is constructed so that CpG sites are considered independent, and each CpG site is assigned a uniform prior probability of π0 , then πΜ≡ π ( 1 - π0 )m~k and, from (8),
Ε(δ\ π0) = Ο ηιζ £c'(/« - 1. ft - 1 ),τ* ( 1 - π„ = πϋ {\ - π0)Ο(τηζ ). (9)
The bias does not depend on m if trHM = 0(m) , i.e. random ordering. Random ordering renders the size of Ε(ό"| π0 ) theoretically independent of m , it does so at the cost of including many potentially noninformative CpGs, early on at low values of m , and these may be possible sources of bias in practice, without offering any modeling benefit in return. If the CpG sites are ordered by level of informativeness, then potentially H,„ = 0(τηλ~ζ ) , and there will be a small increasing prior expectation of bias, motivating judicious choice of m . The key, then, is to order the CpGs in terms of their ability to distinguish different types profiled in S0 , choosing m large enough to distinguish all signatures from one another, but small enough that the E(<5| π0 ) is reasonably low, in a relative sense. Naturally, different choices of prior nkl in (8) will lead to different conclusions about the magnitude of bias. If the set Jm of CpG sites used in S0 and £*, oversample those known to have less modifiable methylation states, e.g. away from so-called shore regions (Doi A et al., 2009, Nat Genet 41 : 1350-3), then π0 is effectively lowered, and so
will be the corresponding expected prior bias. It is worth emphasizing that this analysis concerns only a Bayesian prior, not the actual biological truth. In choosing CpG sites among those assayed in S0 and S1 , a potentially negative outcome would be to have included a number of sites that also happen to represent systematic, non-cell-mediated biological differences between cases and controls in^ , in which case biased estimates will be inevitable. In summary, bias in the proposed estimation procedure is controlled by selecting a sufficiently exhaustive list of cell types to profile inS0 , and by choosing m judiciously.
Example 4: Proof of concept of Measurement Error Model for determining changes in distribution of white blood cells between different subpopulations
In this example, general features of the method herein are described that can be used with existing methylation data sets as benchmarks for validating the proposed method to demonstrate its clinical or epidemiological utility. Examples 6-9 that follow show application of the method to specific data sets. The data analyses involve DNA methylation data obtained by the Infmium HumanMefhylation27 Beadchip Microarrays from Illumina, Inc. (San Diego, CA). A subset of m = 100 CpG sites on the array was used and the subset was selected as described below. In Examples 6-9, S0 consisted of 46 white blood cell samples; the sorted, normal, human, peripheral blood leukocyte subtypes were purchased from AllCells®, LLC (Emeryville, CA) and were isolated from whole blood using a combination of negative and positive selection with highly specific cell surface antibodies conjugated to magnetic beads; materials and protocols were obtained from Miltenyi Biotec, Inc. (Auburn, CA). These 46 samples are summarized in Table 2 and depicted by the clustering heatmap in Figure 1. T lymphocytes that express CD4 or CD8 constitute over 95% of the T cell class. The pan-T cell type was further refined to CD4+, CD8+, and "other" Pan-T cells subtypes.
In summary, the covariate vector wh consisted of indicators for five cell types and another two indicators for CD4+ and CD8+ T cell subtypes. A generalization of the one-way ANOVA parameterization assumed above for wh (Example 2) was necessary to account for the ambiguous status of some Pan-T cells. For each CpG site, a linear mixed effects model with a random intercept for bead chip was used to estimate B0 ; 27 additional whole blood control samples (replicates from the same individual) were used to assist in estimating chip effects, since otherwise the data set would have been sufficiently sparse to risk confounding between cell type and chip. These "array controls" were indicated with an additional term in wo¾. For
each CpG site, a linear mixed effects model with a random intercept for bead chip was used to estimate the corresponding row of B„ and Bj .
From S0 , F statistics were computed and used to order each of the 26,486 autosomal
CpGs by decreasing level of informativeness with respect to blood cell types. Figure 5A depicts the relationship log10 trHm by log10 (m) for increasing array sizes. Figure 5B depicts the relationship dlogw tr(Hm)/ dlog(m) by logi0(m) for increasing array sizes, obtained by smoothing the first differences of the curve depicted in Figure 5 panel A via loess smoother. Figure 5 panel A also shows the tangent (obtained from the loess curve) at low values of m. For 0(m) convergence, Figure 5 panel A should show a linear association with slope equal to one, and the curve in Figure 5 panel B should show a curve close to the value of 1.0. Neither is the case, i.e. convergence is sub-linear in m. It is noted that the rate of convergence dropped precipitously after about 6,000 CpG sites, but was notably slower than 0(m) even after m = 10. In the range of 1-1000 CpG sites the convergence rate appeared parabolic with a minimum of about 0.85, starting to stabilize in the m = 100 - 300 range. Thus, maximum informativeness was provided by the highest ranking m = 100 - 300 CpG sites, with m > 300 reflecting diminishing returns from adding additional CpGs. Therefore, a moderately low value of m in this range, m = 100, consistent with the size of a small custom microarray chip was chosen.
Table 2. Sorted white blood cells

1 Considered as a member of the "pan-T cell" group.
2 Pan-T cell further refined as also belonging to the "CD4+" group.
3 Pan-T cell further refined as also belonging to the "CD8+" group. Example 5: Cell mixture experiment for validating the method for determining changes in distribution of white blood cells between different subpopulations
In this example is described a laboratory reconstruction experiment, which validates the concept on which the method herein is based that DNA methylation retains substantial information about cell mixtures. The results of applying the method herein to several different target data sets S\ is described in Examples 6-9.
For the HNSCC and ovarian cancer data sets, from which bead chip data were available, a linear mixed effects model with a random intercept for bead chip was used to estimate the corresponding row of B 1. For the remaining data sets, no bead chip data were available;
consequently, ordinary least squares was used. 250 bootstrap iterations were used for each example and each of the two bootstrap methods of standard error estimation.
An experiment was conducted which involved six known mixtures of monocytes and B cells and six known mixtures of granulocytes and T cells. Figure 2 presents both the known fractions ("Expected") and the resulting predictions ("Observed") from Infinium 27K profiles, as described above. As Figure 2 shows, accuracy of prediction is within 10%, and often less than 5%, with the largest errors occurring for granulocytes, as shown in Table 3. It is noted that the sum of the individual observed predictions for each individual profile ranged from 98.9% to 102.7% even though the constraints of the projection do not explicitly constrain the sum to 100%; this provides additional evidence that the DNA methylation profile captures information about cell mixtures.
Table 3. Summary statistics for errors in cell mixture reconstruction Results*

[Observed% - Expected%|
Example 6: Application of the methods herein to the subpopulations of head and neck cancer patients and controls
This example describes the application of the method herein for detennining changes in the distribution of white blood cells between different subpopulations to patients having head and neck squamous cell carcinoma (FINSCC). The target data set Si was obtained from arrays applied to whole blood specimens collected in a random subset of individuals involved in an ongoing population-based case-control study (Peters et al, 2005, Cancer Epidemiol Biomarkers Prev, 14(2), 476-82) of head and neck cancer (HNSCC): 92 cases and 92 age and sex matched controls. Blood was drawn at enrollment (prior to treatment in 85% of the cases). Mean age among the subjects arrayed in this study was 60 years, and there were 56 females and 128 males, consistent with the higher incidence of the disease in men. Thus, the covariate vector z consisted of an indicator for case/control status, an indicator for male sex, and age (in decades) centered at the mean. The clustering heatmap in Figure 3 depicts the raw DNA methylation data in Si. Table
4 presents coefficient case status, double-bootstrap bias estimates (estimates of bias arising from measurement error), as well as naive, single-bootstrap, and double-bootstrap standard error estimates. Each of these quantities is measured in percentage points (%). Estimates of bias arising from measurement error (i.e. substituting estimated quantities for known ones in a two- stage statistical procedure) were almost always less than half a percentage point, and for significant coefficient estimates, always towards the null.
The proportion of CD4+ T-lymphocytes decreased in cases compared with controls, with a bias-corrected estimate of -10:4 percentage points and approximate 95% confidence interval (- 13: l %;-3:3%); the proportion of NK cells decreased, with a bias-corrected estimate of -1.5 percentage points and 95% confidence interval (-2:2%;-0:75%); and the proportion of granulocytes increased, with a bias-corrected estimate of 7.6 percentage points and 95% confidence interval (4:2%; 10:9%). There was also some evidence of an increase in CD8+ T- lymphocytes, with an estimate of 4.5 percentage points and 95% confidence interval (4:5%; 7:0%). As shown in Table 5 the proportion of CD4+ T-lymphocytes decreased by 3.3 percentage points (-4:4%;-2:2%) per decade of age, and CD8+ T-lymphocytes increased by 2.0 percentage point (1 :0%; 3:0%) per decade. All other coefficients were insignificant.
For this analysis, ?^0 was estimated at 14.2%, and was estimated at 93:9%. Thus, a small but non-negligible proportion of total variation (systematic variation + unexplained biological heterogeneity + technical noise) appeared to have been driven by changes in cell population between cases and controls and as a result of aging. The SSe comprised 85% of total variation, so a substantial portion of variability in DNA methylation appeared to remain unexplained (presumably due, in large part, to technical noise). However, almost all of the systematic variation was explained by changes in cell population.
These results were consistent with previous studies, as HNSCC patients are known to display an absolute and relative increase in myeloid derived granulocytes (Trellakis et al., 2011, Int J Cancer, Epub ahead of print DOI: 10.1002/ijc.25892) and also displayed an alteration in lymphoid T cell homeostasis that leads to decreases in CD4+ T cells (Kuss et al, 2004, Clin Cancer Res, 10(1 1), 3755-62; Kuss et al., 2005, Adv Otorhinolaryngol, 62, 161-72). In addition, the proportion of Treg cells (a subclass of CD4+ T cells) is known to decrease from infancy to adulthood (Mold et al., 2010, Science, 330(6011 ), 1695-9). The bias estimates obtained from the double-bootstrap procedure allow the correction of bias arising from measurement error. However, there is no statistical procedure for correcting the other possible sources of bias, those arising from changes in distribution among unprofiled cell types as well as non-immune-mediated methylation differences. Example 7 presents a detailed sensitivity
analysis which shows that the magnitude of the resulting bias is likely to be small, less than a percentage point.
Table 4. Estimates for HNSCC analysis (case vs. control)

Est = Regression coefficient estimate (x 100%).
Bias2 = Double-bootstrap bias estimate (x 100%).
SEo = Naive standard error (x 100%)
SEi = Single-bootstrap standard error (x 100%).
SE2 = Double-bootstrap standard error (x 100%).
P-values were computed using SE2.
Table 5. Estimated Regression Coefficients for Sex and Age in HNSCC Data Set

1 .44
Est = Regression coefficient estimate (x 100%)
Bias2 = Double-bootstrap bias estimate ( x 100%)
SE0 = Naive standard error ( x 100%).
SE , = Single-bootstrap standard error ( x 100%).
SE2 = Double-bootstrap standard error ( x 100%).
P-values were computed using SE 2 . Example 7: Application of the methods herein to subpopulations of ovarian cancer cases and controls
In this example the method herein for inferring changes in the distribution of white blood cells between different subpopulations (e.g. cases and controls) was applied to an ovarian cancer data set (Teschendorff et al, 2009, PLoS ONE, 4(12), e8274). DNA methylation data for blood samples were obtained from Gene Expression Omnibus (Accession number GSE1971 1). Only those cases in which blood was collected pre-treatment were used ere. After removing four arrays with a preponderance of missing values, the data set consisted of 272 controls and 129 cases in which blood was collected prior to treatment. A clustering heatmap displaying the DNA methylation data is shown in Figure 6. In this analysis, z consisted of case-control status, age (categorized in five-year increments), and two bisulfite conversion efficiency measures. Tables 6-8 presents result for case-control status and estimated regression coefficients for age in ovarian cancer data set. R (l was estimated at 17.8%, and was estimated at 86: 1 %.
Table 6. Estimates for Ovarian Cancer Analysis (Case vs. Control)

Est = Regression coefficient estimate (x 100%).
Bias2 = Double-bootstrap bias estimate (x 1 00%).
SE0 = Naive standard error (x 100%)
SEi = Single-bootstrap standard error (x 100%).
SE2 = Double-bootstrap standard error (x 100%).
P-values were computed using SE2.
Table 7. Estimated Regression Coefficients for Age in Ovarian Cancer Data Set

Est = Regression coefficient estimate (x 100%)
Bias2 = Double-bootstrap bias estimate (x 100%).
SE0 = Naive standard error ( x 100%).
SE, = Single-bootstrap standard error (x 100%).
SE2 = Double-bootstrap standard error (x 100%).
P-values were computed using SE 2 .
Table 8. Estimated Regression Coefficients for Bisulfite Conversion in Ovarian Cancer Data Set

Est = Regression coefficient estimate ( x 100%)
Bias, = Double-bootstrap bias estimate (x 100%).
SE0 = Naive standard error ( x 100%).
SE1 = Single-bootstrap standard error (x 100%).
SE2 = Double-bootstrap standard error ( x 100%).
P-values were computed using SE 2 .
It is noted that coefficients are given as % / 1000 units fluorescence, and that standard deviations for BSC1 and BSC2 were 1950 and 2169, respectively.
Compared with controls, data obtained from cases showed significant increases in granulocytes and significant decreases in B cells, NK cells, and CD4+ T cells. Cases also showed marginally significant increases in monocytes. These results are consistent with previous literature, in which it has been demonstrated that ovarian cancer patients experience decreases in B and T lymphocytes (den Ouden et al., 1997, Eur J Obstet Gynecol Reprod Biol, 72, 73-77; Bishara et al., 2008, Reprod Biol, 138, 7175; Cho et al„ 2009, Cancer Immunol Immunother, 58, 1523), increases in monocytes (den Ouden et al., 1997, Eur J Obstet Gynecol Reprod Biol, 72, 73-77; Bishara et al., 2008, Reprod Biol, 138, 7175) and (somewhat equivocally) increases in eosinophil granulocytes (Bishara et al., 2008, Reprod Biol, 138, 7175). Additionally, there were significant systematic decreases in CD4+ T cells with increasing age, with a gradient consistent in direction and somewhat consistent in magnitude with the corresponding effect found in the HNSCC data set. The CD8+ T cell coefficients for were all
positive, with gradient consistent in direction and somewhat consistent in magnitude with the corresponding effect found in the HNSCC data set. No bisulfite conversion coefficient was significant, and all coefficients were of small magnitude (Table 8; generally less than 1 percentage point per standard deviation).
Example 8: Application of the methods herein to subpopulations of Down Syndrome patients and controls
The method herein was applied to trisomy 21 (Down syndrome) data set (Kerkel et al.,. PLoS Genet 2010, 6(1 l):el001212) consisting of 29 total peripheral blood leukocyte samples from Down syndrome cases and 21 controls, as well as six T cell samples from cases and four T cell samples from controls (GEO Accession number GSE25395). Because of the potential for bias induced by copy number amplification four CpG sites on Chromosome 21 were excluded, resulting in m = 96 CpG sites that were used for analysis. A clustering heatmap displaying the DNA methylation data is shown in Figure 7. In one analysis data from cases and controls were compared using the total leukocyte samples only, and in another total leukocytes to T cells were compared, pooling cases and controls. Coefficient estimates are provided in Table 9. The only significant difference between cases and controls was in B cell distribution, with bias-corrected estimated decrease of 4.8%, 95% confidence interval (- 6:2%; - 3:5%). This result is consistent with known immune characteristics of Down Syndrome, including deficiencies in both B and T cells (Verstegen et al., 2010, Pediatr Res, 67, 563-9; Ram and Chinen, 201 1, Clin Exp Immunol, 164, 9-16). However, in the comparison between total leukocytes and T cells, all coefficients except B Cell and NK were highly significant, in directions consistent with comparison of a sample of purified T cells to a generic whole blood sample. In fact, an estimate of the cellular composition of the T cell samples can be obtained by a simple linear transformation of Γ estimates (adding intercept terms with the T cell coefficients); this operation produces values that are not significantly distinct from zero for all cell types except CD4+ and CD8+, whose bias-corrected estimates were, respectively, 75.9%, 95% confidence interval (67%; 85%) and 8.6%, 95% confidence interval (0%; 17%), for cases and controls consistent with the known distribution of these T cells. For the analysis of case vs. control within total leukocytes, RfQ was estimated at 4.5%, and was estimated at 67:6%. For the analysis of total leukocyte vs. T cell with pooled cases and controls, Rffi was estimated at 81.4%, and R^ was estimated at 98:9%.
The latter set of coefficients of determination indicates that a substantial portion of variation is explained by composition of leukocytes, which is the expected result for such an analysis.
Table 9. Estimates for Down syndrome analysis (case vs. control, total leukocyte vs. T Cell)

Est = Regression coefficient estimate (x 100%).
Bias, = Double-bootstrap bias estimate (x 100%).
SE0 = Naive standard error ( 100%).
SEj = Single-bootstrap standard error ( x 100%).
SE2 = Double-bootstrap standard error (x 100%).
P-values were computed using SE 2 .
Example 9: Application of the methods herein to obesity in an African American population
The method herein was also applied to an obesity data set (Wang et al, 2010) consisting of seven lean African-Americans and seven Obese African-Americans (GEO Accession number GSE25301). Figure 8 shows a clustering heatmap displaying the DNA methylation data. In this analysis, z consisted of obesity status. Obese subjects had an estimated increase of 12 percentage points in granulocytes, bias-corrected 95% confidence interval (3:4%; 20%) and an estimated decrease of 4 percentage points in NK cells, bias-corrected 95% confidence interval (-7:7%;- 0:9%) (Table 10). No significant differences were found for other blood cell types. The specific immunological differences estimated by the method herein are consistent with known immunological perturbations associated with type II diabetes (Lynch et al., 2009, Obesity, 17(3), 601-5; Anderson et al., 201 1 , Curr Opin Lipidol, 21(3), 172-7.).
Table 10. Estimated Regression Coefficients for Data Set concerning Obesity in African Americans

Est = Regression coefficient estimate (x 100%).
Bias2 = Double -bootstrap bias estimate ( x 100%).
SE0 = Naive standard error ( x 100%).
SEj = Single-bootstrap standard error (x 100%).
SE2 = Double-bootstrap standard error (x 100%).
P-values were computed using SE 2 .
Example 10: Additional analyses
In this example a special case was considered in which subject population was such that for this population z = 0 and the population was sufficiently homogeneous with respect to blood cell distribution to admit sensible characterization of that distribution. In such case it is possible to recover estimates fromf . The results of such an analysis applied to the HNSCC case/control data set is shown in Table 1 1 below.
Table 1 1 : White Blood Cell Distribution in HNSCC Controls

Est = Regression coefficient estimate ( x 100%), normalized so that estimates sum to
SE2 = Double-bootstrap standard error (x 100%).
Bias2 = Double-bootstrap bias estimate (x 100%).
BC-Est = bias-corrected estimate.
If the coefficients represented a complete profiling of blood cell types, the estimates should sum approximately to one, even though the model does not explicitly constrain them so. In this case, the original bias corrected estimates (of leukocyte distribution in HNSCC controls) summed to 133%. The table shows the values re-normalized to 90%, the anticipated proportion of the cell types. The resulting estimated distribution of leukocytes is consistent with the literature (Alberts B et al, 2008, Molecular Biology of the cell. New York, NY: Taylor and Francis, 5th edition)
An additional analysis was also conducted in which So consisted of only samples with pure CD4+ or CD8+ cells and S\ to consisted only of samples having the less purified T- lymphocytes. For such S , there were no covariates, so z consisted only of an intercept. The following unnormalized bias-corrected estimates: 69.0% CD4+, 95% confidence interval (54%; 84%), and 32.5% CD8+, 95% confidence interval (19%; 46%). This is consistent with known proportions of these specific cell types among T lymphocytes.
Example 11 : Sensitivity analysis
The bias estimates evident from the double-bootstrap procedure admit the possibility of correcting the bias arising from measurement error. There is no statistical procedure for correcting the other possible sources of bias, those arising from unprofiled cell types and non- cell-mediated profile differences, i.e. methylation difference signatures δ with nonzero projection onto the space spanned by the WBC signatures. It is possible to conduct a sensitivity analysis using the theory presented under "Bias" (equations 6-9). It is shown that the magnitude of the bias is likely to be small, less than a percentage point.
Detailed analysis
A method of sensitivity analysis to estimate the magnitude of bias arising from unprofiled cell types and non-cell-mediated profile differences is described below for the HNSCC data set presented in Example 6 and Figure 4.
For each value of k £ JJOT, k elements are randomly sampled, Jfo c JJ,„ without replacement, then k rows of Bj are sampled without replacement, δ* is set equal to the m x d\ zero matrix, and the rows indicated by J* are substituted by the k rows selected from BL . The matrix δ* served as a representative of the sum of processes having systematic methylation changes at k locations, of total magnitude consistent with the observed data (under the conservative assumption that no systematic methylation difference is cell mediated), and * = ( B0 B0 V1 B0 δ* represented the corresponding bias in Γ. If, as in this situation, the goal was to assess the
sensitivity to bias in column of Bj (i.e. Case Status), the uninteresting columns of δ* or a*could be simply deleted. Replicating this resampling procedure 100, 000 times, an approximation to the distribution of possible biases corresponding to processes involving exactly k CpG sites was generated. Figure 4 displays the results of such an analysis, showing the distribution of (α*τα*)" 1/2 for various values of k. It is noted that the relationship of median values to m was consistent with the theory presented in Example 12 under the subheading "Additional simulations." The median values of (α*τα* ) had an almost perfect linear relationship with m. The magnitude of the bias was small: for the more likely low values of k, the bias was 0.1 to 0.25 of a percentage point. In addition, this analysis was conservative in that it assumed all of the effect in Bl was due to non-cell -mediated processes, a strongly conservative assumption. In addition, for various choices of πο over a range of small magnitudes, the expected bias over the uniform posterior implied by π0 was computed by iterated expectation, first by computing the mean bias for each choice of k, then forming the expectation over the binomial distribution j5/«(100, πο), As noted in details described under "Bias" in Example 3 the result scaled linearly with πο. The constant of proportionality was estimated to be 2.08 percentage points. In summary, if the prior expectation is of even moderate size (~0.1) that any one CpG among the 100 selected for this application will show systematic differentiation between cases and controls, then the implied bias would be expected to be less than a percentage point. Example 12: Simulations
To verify the properties of the proposed methodology, extensive simulation studies were conducted. Simulation parameters were obtained from the HNSCC data set, and most simulations assumed no sources of biological bias (DNA methylation changes arising from processes not mediated by the profiled leukocytes, including shifts in distribution within cell types not profiled). In every simulation, ¾ was specified to consist of five B cell samples, ten granulocyte samples, five monocyte samples, 15 NK samples, five general T cell samples, eight specific CD4+ T cell samples, and two specific CD8+ T cell samples. Estimates from the external validation set So, described above, were used for mean methylation profiles among WBC types, using the m = 100 most informative CpG sites.
ni/2 cases and nJ2 controls, were specified, no e { 100, 200, 500} . Among the controls, methylation profiles were generated by a white blood cell population of 7% B cells, 62% granulocytes, 6% monocytes, 2% NK cells, and 13% were T cells, of which 65% were CD4+ cells and 35% were CD8+ cells, and the remaining 5% were unspecified (and assumed to have mean equal to the unsorted T-lymphocytes). Among cases, one of the following scenarios was
specified: a 4% reduction in CD4+ cells, a 2% reduction in CD8+ cells, and an 8% increase in granulocytes (alternative with changes in both CD4+ and CD8+, "Strong Alternative I"); a 6% reduction in CD4+ cells, and an 8% increase in granulocytes (alternative with changes in CD4+ and not CD8+, "Strong Alternative Π"); a weaker alternative with half the effects of Strong Alternative I ("Mixed Alternative" elaborated upon below); and two null scenarios with no changes in cell population, each with a different assumption about δ. It is noted that these changes reflect absolute changes in percentage points, not relative changes. It is also noted that these values were actually used to generate Dirich let-distributed mixture weights for each simulated subject, with Dirichlet parameters equal to a precision parameter (10 corresponding to "noisy", and 100 corresponding to "precise") times the mean weight described above.
Residual effects ξ 0) for controls were set equal to 0.1 times estimated intercept μ\ and residual effects
 plus multiples 10$ of the column of U corresponding to case. The constants of proportionality 0.1, 0.08, and 0.09 were chosen to correspond to assumed contributions of ξ to an overall methylation signature presumed to be dominated by profiled populations of white blood cells in specified proportions, with 0.08 used for the strong alternatives and 0.09 used for the Mixed Alternative. The constant 10 was used to amplify the scale of δ so that its effect could be detected in simulation; it is noted that U was orthogonal to the white blood cell profiles, by construction.
It is noted also that the individual, Dirichlet-generated subject weights did not necessarily sum to one, and the difference from 1 was not applied as a multiplier; thus the resulting ξ corresponded to the situation Ppq = 0, where P = (B0 B0 )"] B0 along with orthogonal contributions from the λ terms of (6). The multiplier Θ = 0 was used for strong alternatives, and the "Strong Null" case (i.e. no methylation differences between cases and controls) and Θ = 0.5 was used for the Mixed Alternative, and 0 = 1 was used for the "Mixed Null" with case/control differences not mediated by cellular population differences.
A simple normal error structure for e0h and e0I- was specified, with no chip effects, and with variance equal to the sum of chip and residual variance estimated (individually for each CpG) for the HNSCC data. For each simulation, 50 bootstraps were used to estimate standard errors. 1000 simulations were run for each scenario. Table 12 presents results for n\ = 200 with precise mixture weights (small within-status heterogeneity in distribution), and Table 13 presents results for n = 200 with noisy mixture weights (larger within-status heterogeneity). The tables show mean estimate, simulation standard deviation, median estimates for the three types of proposed standard errors, and proportion of p-values (obtained from z-scores constructed using the double-bootstrap standard error) falling below a = 0.05 and a = 0.01.
in all cases, the bias in estimation was minimal. Both types of bootstrap produced similar standard error estimates, which were close to the simulation standard deviation and often quite different from the naive standard error estimate. Under null scenarios, the rejection probabilities were tolerably close to their nominal values, and for alternatives, power could be quite high, even with this modest design.
Results for Coefficients of Determination
Results for the coefficients of determination are provided in Table 14. ? 0 decreased with decreasing strength of the alternative, falling to zero under both null scenarios. For strong alternatives, Rfr was frequently close to 1.0. For the Mixed Alternative, R2j had a lower, and still high values ranging from about 0.85 to 0.90. For the mixed null result, Rf typically had lower values, from about 0.05 to 0.20. In the Strong Null case, ^ covered a broader range among moderately low values; note, however, that this scenario effectively represents 0/0, i.e. a poorly defined value. Scenarios with n\ e { 100, 500} produced similar results, with simulation standard deviations and power adjusted accordingly, and still having practical utility.
Additional Simulations
Additional simulations, were conducted which assumed bias arising from processes not profiled by the profiled leukocytes. For these scenarios, ξ ° was set to i^ and ξ ι=ξ ° except for a set of CpG sites randomly selected among the m dimensions of the array (once and for all before all 1000 simulations); among those dimensions j , was set to 1 - μ ] , reflecting a \reversal" of methylation state. Estimates were biased towards the null, on the order of about a percentage point.
Table 12. Simulation results (precise mixtures, nx = 200)
Strong Alternative I (Θ

Strong Alternative II (9 = 0 )

Mixed Alternative (Θ
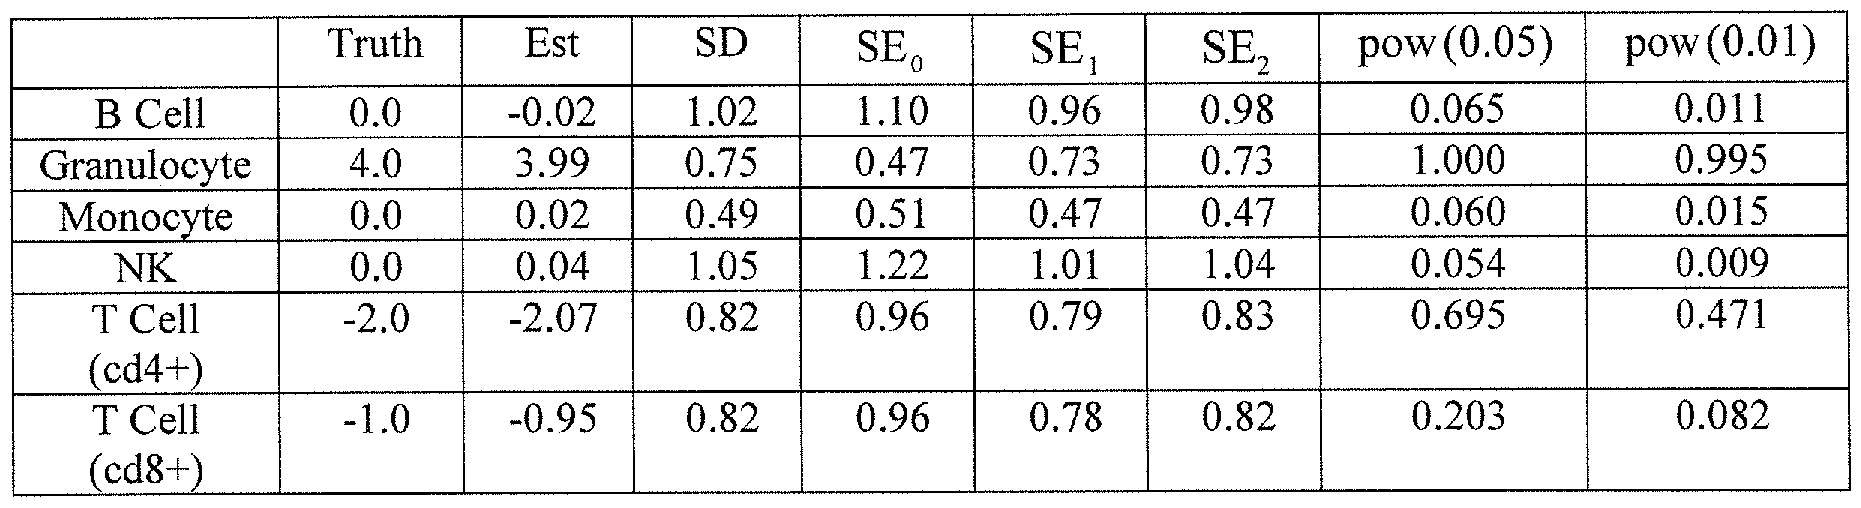
Mixed Null ((9 = 1 )

Strong Null (0 = 0 )

Est = Mean regression coefficient estimate (x 100%); SD = SD regression coefficient estimate ( x 100%).
SE0 = Naive standard error ( x 00%); SE, = Single-bootstrap standard error (x 100%).
SE2 = Double-bootstrap standard error (x 100%).
pow(a) = Pr{P2 < a} , where P2 is the p-value computed from SE2 .
Table 13. Simulation Results (Noisy Mixtures, nx = 200)
Strong Alternative I (Θ

Strong Alternative Π (Θ = 0 )

Mixed Alternative (Θ = 0.5)
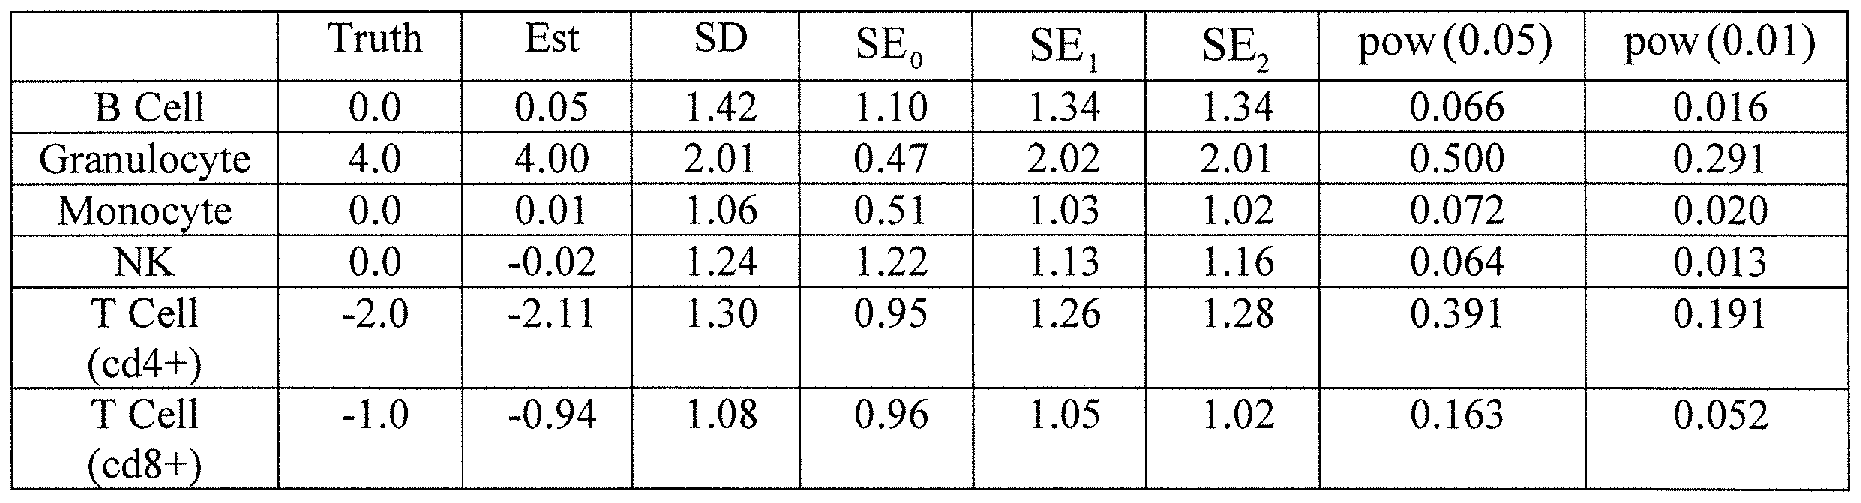
MixedNull(# = l)
 Strong Null (0 = 0 )

Est = Mean regression coefficient estimate ( x 100%); SD = SD regression coefficient estimate ( x 100%).
SE0 = Naive standard error ( x 100%); SE, = Single-bootstrap standard error ( x 100%).
SE2 = Double-bootstrap standard error ( x 100%).
pow(a) = Pr{P2 < a) , where P2 is the p-value computed from SE2 . Table 14. Results for coefficients of determination

Example 13: Identification of a unique DMR in CD3Z gene
Individual samples of sorted, normal, human, peripheral blood leukocytes as shown in
Table 15, were purchased from AllCells®, LLC (Emeryville, CA). These leukocytes were sorted in a column with antibody-conjugated magnetic beads using a combination of positive and negative selection. Genomic DNA from the leukocytes was extracted according to
manufacturer's protocol using the DNeasy Blood & Tissue kit (Qiagen) or the AllPrep
DNA/RN A/Protein Mini Kit according to manufacturer's protocol (Cat. No. 8004, QIAGEN,
Valencia, CA), then quantified by NanoDrop ND-1000 Spectrophotometer (NanoDrop
Technologies, Inc. , Wilmington, DE) and stored at -20 °C. The extracted genomic DNA was subjected to Bisulfite conversion by treatment with sodium bisulfite using the EZ DNA
Methylation Kit (Zymo) following the manufacturer's protocol, thereby converting
unmethylated cytosine residues to uracil and leaving methylated cytosine residues intact.
Table 15: Sorted leukocytes from AllCells®, LLC
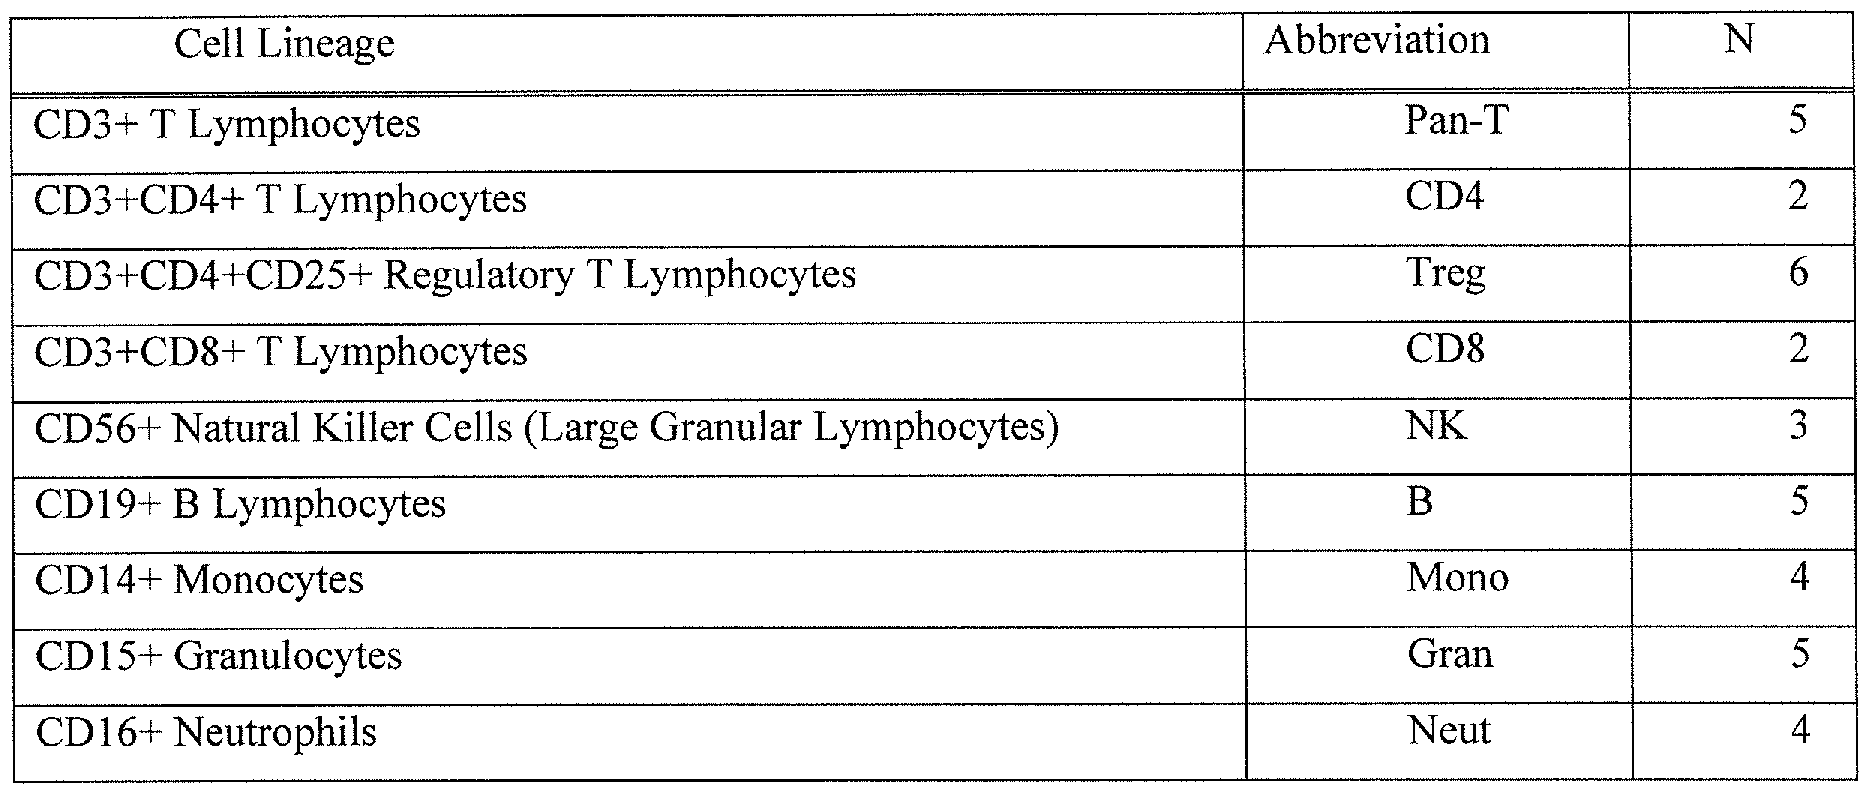
Analysis of the methylation status of the bisulfate converted DNA was performed using DNA methylation microarray, Infinium® HumanMethylation27 Beadchip Microarray, (lllumina®, Inc. ,San Diego, CA). This microarray quantifies the methylation status of 27,578 CpG loci from 14,495 genes, with a redundancy of 15-18-fold. Bisulfite converted, genomic DNA from sorted human peripheral blood leukocytes was subjected to whole genome amplification. The purified whole genome amplified DNA was hybridized to locus-specific DNA oligomers linked to individual bead types corresponding to each CpG locus, unmethylated or methylated. Allele-specific primer annealing was followed by specific single-base extension using labeled ddNTPs. Extension only occurs if the bead type matches the methylation status of the genomic DNA.
The array was fluorescently stained, scanned, and fluorescent intensities of each of the unmethylated and methylated bead types were measured. The ratio of fluorescent signals is computed from both alleles using the following equation:
 + 100. The β-value is a continuous variable ranging from 0 (unmethylated) to 1 (completely methylated) that represents the methylation at each CpG site and is used in subsequent statistical analyses. Data were assembled with BeadStudio methylation software from lllumina, Inc. (San Diego, CA). Bibikova, M., et al , Epigenomics 1, 177-200 (2009).
A comparison of methylation in sorted normal human immune cells was observed to produce distinct profiles of methylation markers for further consideration. As shown in Figure 9 DMA Methylation profiles distinguished lymphocytes from myeloid derived leukocytes.
+ 100. The β-value is a continuous variable ranging from 0 (unmethylated) to 1 (completely methylated) that represents the methylation at each CpG site and is used in subsequent statistical analyses. Data were assembled with BeadStudio methylation software from lllumina, Inc. (San Diego, CA). Bibikova, M., et al , Epigenomics 1, 177-200 (2009).
A comparison of methylation in sorted normal human immune cells was observed to produce distinct profiles of methylation markers for further consideration. As shown in Figure 9 DMA Methylation profiles distinguished lymphocytes from myeloid derived leukocytes.
Recursively partitioned mixture model (RPMM) of autosomal gene Infinium beta values from sorted, human, peripheral blood leukocytes was performed in R version 2.11.1 of lllumina's software which provides convenient mechanisms for loading and analyzing the results of methylation status, and for quality control and basic visualization tasks.
Candidate DNA regions with high potential to discriminate CD3+ T cells from non-T cells were chosen based on the criteria of being differentially demethylated and differentially overexpressed in CD3+ T cells compared with other cell types (monocytes, granulocytes, NK cells, and B cells). Two quantitative methylation methods, bisulfite pyrosequencing and MS- qPCR, were used to confirm array methylation.
The highest ranking 5000 most variable CpG loci were plotted on the left (Figure 9 left panel), such that the less methylated loci appear as grey and more methylated loci appear as black. The number of individual leukocyte samples in each methylation class is shown in Figure 9 in the table to the right. The algorithm for prioritizing these candidates described herein yielded CD3E and CD3Z as specific DMR for identifying CD3+ T cells.
Example 14: Patient characteristics and biological samples for determining CD3+ T cell distribution in glioma cases and controls
Whole blood samples from glioma patients (N=94) and controls (N=71) were obtained from the UCSF San Francisco Adult Glioma Study (AGS) for these examples (Table 16). The patients included in this example were diagnosed between 1997 and 2011. Details of subject ascertainment through the rapid case ascertainment program of San Francisco regional population-based registry or the UCSF Neuro-oncology Clinic have been described (Wrensch M et al., 2007, Clin Cancer Res 13(1): 197-205; Felini MJ et al. 2009, Cancer Causes Control
20(1 ): 87-96; Wrensch M et al., 2009, Nat Genet 41 (8): 905-8; Christensen BC et al., 201 1, J
Natl Cancer Inst 103(2): 143-53). Pertinent data for this analysis included age at histological diagnosis, gender, vital status, and survival time between diagnosis date and date of death for those deceased or between diagnosis date and date of last contact for those alive, and any of cigarette smoking history and exposure to steroids, chemotherapy and radiation therapy.
A panel of 120 fresh frozen glioma tumors from the UCSF Brain Tumor Research Center tissue bank, obtained under appropriate institutional review board approval, which were previously characterized for molecular features (Christensen BC et al., 2011, J Natl Cancer Inst
103(2): 143-53; Zheng S et al., 2011, Neuro Oncol 13(3): 280-9) was chosen for tumor MS-
qPCR and IHC studies (Table 16). Tumor samples were defined as secondary GBM if the patients had prior histological diagnosis of a low-grade glioma. All ages are given at the time of surgery, which occurred at UCSF between 1990 and 2003. This tumor set contained the following histological subtypes: 2 pilocytic astrocytoma (PA), 15 ependymoma grade II (EPII), 20 oligodendroglioma grade II (ODII), 16 oligoastroglioma grade II (OAII), 3 oligoastroglioma grade III (OAIII), 23 astrocytoma grade II (ASII), 4 astrocytoma grade III (ASIII) and 37 astrocytoma grade IV, also called glioblastoma multiforme grade IV (GBM), ten of which were recurrent and five of which were secondary.
Sorted, normal, human, peripheral blood leukocyte subtypes were isolated from different non-diseased individuals' whole blood by MACS using a combination of negative and positive selection with highly specific cell surface antibodies conjugated to magnetic beads. The purity of separated cells was determined with flow cytometry to be >97%.
Example 15 : Bisulfite pyrosequencing and MS-qPCR assays for validating CD3Z, CD3E and FOXP3 specific DMRs
The demographic characteristics of donors for all samples (N = 285) used in MS-qPCR analysis is as shown in Table 16. CpGenome Universal Methylated DNA (Cat. No. S7821, Millipore Corp., Temecula, CA), purified T cell and Treg DNA were bisulfite converted at the same time. All bisulfite pyrosequencing assays were designed using Pyromark Assay Design 2.0 (QIAGEN), and carried out using a Pyromark MD pyrosequencer running Pyromark qCpG software (QIAGEN). Custom oligonucleotide primers used in bisulfite pyrosequencing were obtained from Invitrogen (Life Technologies Co, Carlsbad CA). For MS-qPCR reactions, primers and TaqMan major groove binding (MGB) probes with 5' 6FAM and 3 ' non-fluorescent quencher (NFQ) as well as TaqMan 1000 RXN Gold with Buffer A Pack were obtained from Applied Biosystems (Part No. 4304971 , 4316034 and 4304441, Applied Biosystems, Foster City, CA). The primer and probe sequences are shown in Table 17 and Figure 12. Solutions for MS-qPCR: 10X TaqMan Stabilizer containing 0.1 % Tween-20, 0.5% gelatin were prepared weekly. Each reaction of 20 μΐ contained 5 μΐ DNA, 1 1.9 μΐ PreMix, 3 μΐ OligoMix, and 0.1 μΐ Taq DNA polymerase. Cycling was performed using a 7900HT Fast Real-Time PCR System (Applied Biosystems, Foster City, CA); 50 cycles at 95 °C for 15 sec and 60 °C for 1 min after 10 min at 95 °C preheat. All samples were run in triplicate using the absolute quantification method. Copy number of the target locus in each sample was determined by reference to a four- point standard curve, which was based on known copies of bisulfite converted template.
Table 16. Demographic characteristics of donors for all samples (N = 285) used in MS-qPCR analysis
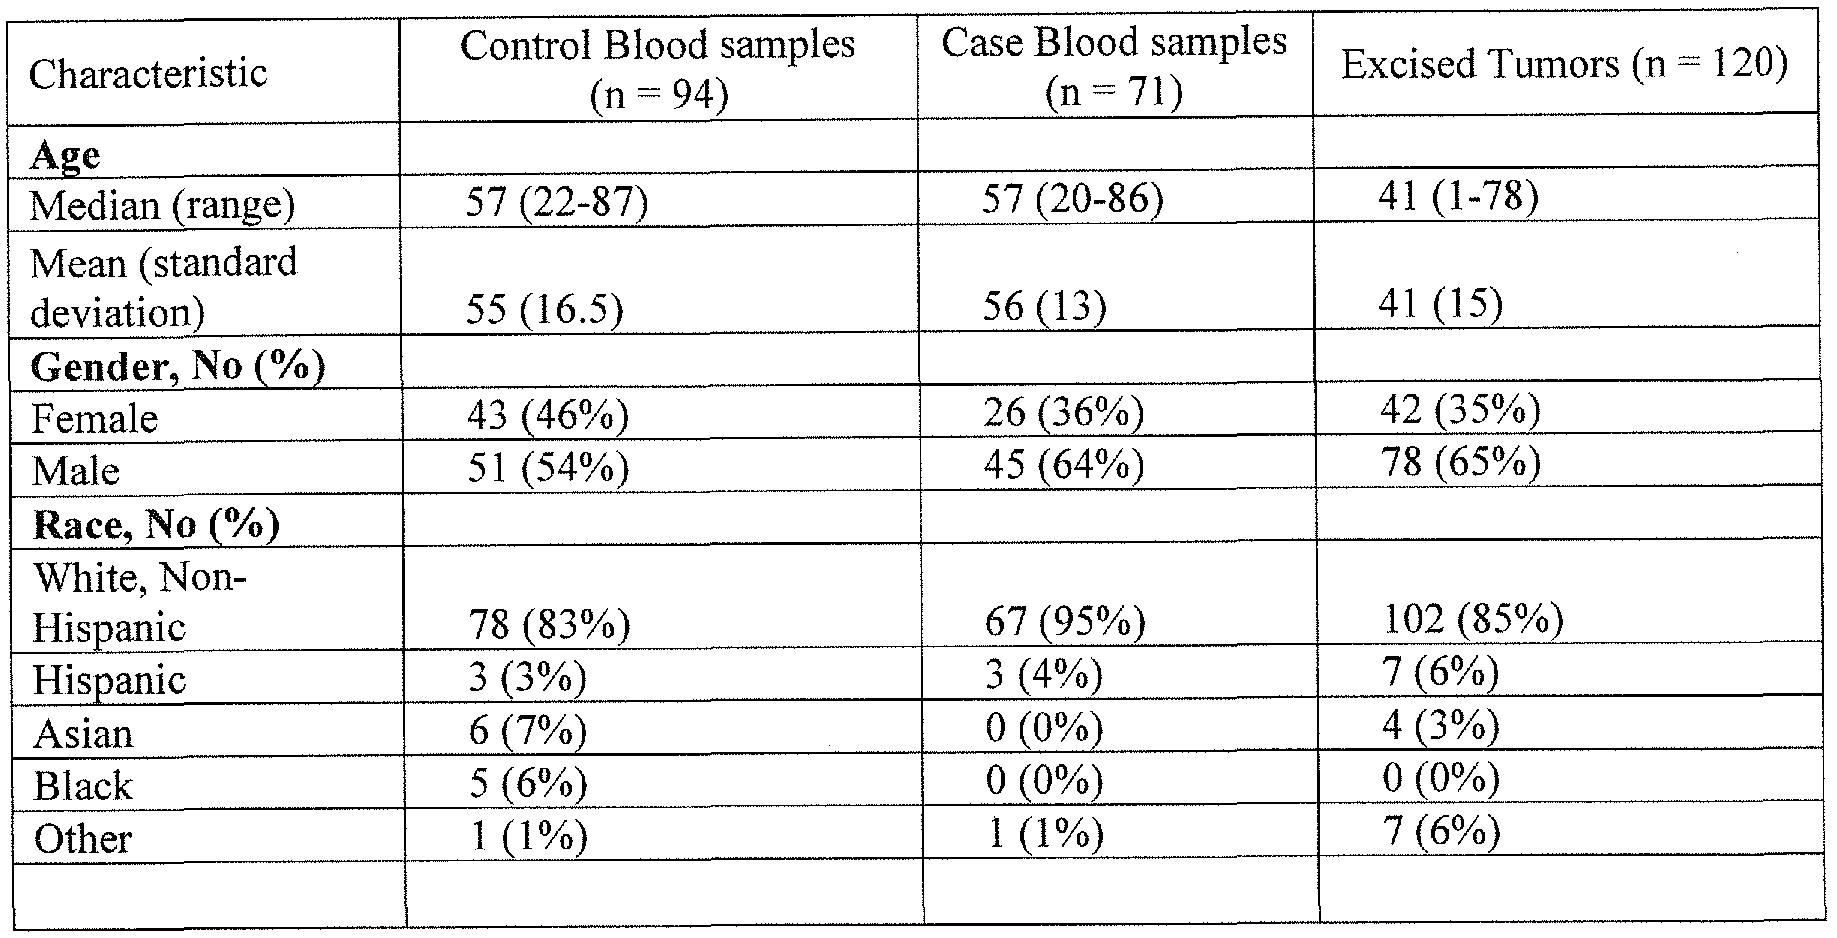
Quantification of total bisulfite converted DNA copies for all standard and biological samples was determined by reference to the C-less qPCR assay as described previously
(Weisenberger DJ et al., 2008, Nucleic Acids Res 36(14): 4689-98.; Campan M et al., 2009, Methods Mol Biol 507: 325-37). In this procedure one determines the relative amounts of a bisulfite converted sample through the use of a TaqMan PCR reaction using primers and probes that recognize a DNA strand that does not contain cytosines, and hence is able to amplify the total amount of DNA (bisulfite-converted or unconverted) in a PCR reaction well. The absolute copy number in DNA Standard Solution (Cambio Ltd. Cambridge, UK) was used to calibrate the C-less reaction and assuming 3.3 pg = 1 genome copy. Universal methylated DNA and purified CD3+ T cell and Treg DNA (all bisulfite converted) were quantified at the same time. Since C-less primers hybridize to both strands of the standard DNA (non-bisulfite converted) and bisulfite converted samples allow for only single strand hybridization during the first cycle, the resultant copy number in bisulfite samples is multiplied by two. After C-less assay, the copy number of the different standards: universal methylated, CD3+ T cell and Treg DNA was used to create standard curves for CD3Z and FOXP3. To create a calibration curve known quantities of CD3+ T cell or Treg DNA were spiked into universal methylated DNA in ratios that maintained a constant total copy number in each reaction across the dilution scheme. The latter procedure mimics the conditions of detection that exist in differentiating different relative numbers of CD3+ T cells and Tregs within a mixture of cells in a complex biological sample. For absolute quantification of CD3Z, the four-point standard curve used 10,000, 1,000, 100, and
10 bisulfite converted CD3+ T cell DNA copies; absolute quantification of FOXP3 used, 5,000, 500, 50 and 5 bisulfite converted Treg cell DNA copies.
Table 17. Primer and probe sequences for MS-qPCR assays
Oligonucleotide Name Sequence (5' to 3')
C-less Fwd TTGTATGTATGTGAGTGTGGGAGAGA (SEQ ID NO: 97)
C-less Rev TTTCTTCCACCCCTTCTCTTCC (SEQ ID NO: 98)
C-less Probe (6FAM) CTCCCCCTCTAACTCTAT (MGB,NFQ) (SEQ ID NO: 99)
CD3Z Fwd GGATGGTTGTGGTGAAAAGTG (SEQ ID NO: 100)
CD3Z Rev CAAAAACTCCTTTTCTCCTAACCA (SEQ ID NO: 101)
CD3Z Probe (6FAM) CCAACCACCACTACCTCAA (MGB,NFQ) (SEQ ID NO: 102)
FOXP3 Fwd GGGTTTTGTTGTTATAGTTTTTG (SEQ ID NO: 103)
FOXP3 Rev TTCTCTTCCTCCATAATATCA (SEQ ID NO: 104)
FOXP3 Probe (6FAM) CAACACATCCAACCACCAT (MGB,NFQ) (SEQ ID NO: 105)
MGB: major groove binding
FAM: 6-Carboxyfluorescein
NGQ: NFQ
C-less qPCR assay: Campan M et al, 2009, Methods Mol Biol, 507:325-37; Weisenberger DJ et al., 2008, Nucleic Acids Res 2008; 36:4689-98
The CD3E specific DMR DNA methylation status of the DMR in CD3E gene was measured by pyrosequencing bisulfite converted DNA from sorted, human, peripheral blood leukocytes. Figure 10 panel A. The CD3Z specific DMR, DNA methylation status of the DMR in CD3Z gene was measured by MethyLight® qPCR. of converted DNA from sorted, human, peripheral blood leukocytes (Figure 10 panel B). The genomic region containing the CD3Z DMR is shown in Figure 1 1.
Standard calibration curves were used to determine if the newly identified CD3Z DMR was useful to quantify CD3+ T cells, Tregs (FOXP3 demethylated) and ratios of Tregs/CD3+ T cells in biological specimens such as whole or separated blood or other tissues. To obtain these curves quantitative real time methylation specific PCR was performed. DNA isolated from purified cell types was bisulfite converted and serially diluted into a background of fully methylated commercial DNA standard (Qiagen). This method is referred to herein as "CS-DM assay" or assays.
It was observed that the total genomic copy numbers of each sample within a dilution series remained constant. Log dilutions were prepared to include the appropriate range of Ct values corresponding to test samples (whole blood, tumor specimens). Using cytosine less: C- less primers genome copy numbers for each test standard were measured to ensure adequate
input DNA and to normalize the CD3+ and Treg assay values. The calibration curve for C-less total input is shown in Figure 13 panel A (N=8 replicates); errors denote standard error of the mean Ct value. Figure 13 panel B shows dilution of isolated normal PanT cells (N=7 replicates) and Figure 13 panel C shows dilution and calibration curve for isolated CD3+CD25+ T cells (N=8 replicates). For samples to be tested these calibration curves (Figure 13 panels A-C) were used to estimate total input copies, CD3+ T cell, and Tregs copies, respectively.
The results show that the DNA methylation status of this region identified herein in the promoter of CD3Z gene in sorted human peripheral blood leukocytes, which was validated as an immune cell type specific differentially methylated region (Figure 10 panel B) was observed to be useful to quantify CD3+ T cells in biological specimens such as whole or separated blood, or other tissues.
Example 16: Flow cytometry of blood lymphocytes in whole blood for quantification of CD3+ T cells
Levels of CD3+ T cells in whole blood were quantified by flow cytometry for comparison with CD3+ T cell levels determined using CD3Z Ms-qPCR assay. Venous whole blood samples were collected in citrate EDTA and processed using a lysis no wash protocol (Invitrogen, Carlsbad, CA cat# GAS-010). Cells were labeled by direct staining with the appropriate fluorochrome-conjugated antibodies (eBioscience Inc, San Diego, CA), and were incubated for 20 minutes in the dark at 4 °C; CD3-fluorescein isothiocyanate (FITC, cat # 1 1 - 0038-41), anti-CD4-allophycocyanin (APC, cat # 17-0048-41 ), anti-CD8-phycoerythrin (PE, cat #12-0086-41), and anti-CD45-PerCP-Cy5.5 (cat #45-0459-41). Isotype control mAbs were used as negative controls. Accucheck counting beads (Invitrogen, Carlsbad CA cat # PCB 100) were used for quantifying leukocyte numbers. Acquisition was preformed within 48 hrs of blood draw on a FACScalibur flow cytometer using Cell-Quest Software (Becton Dickinson, Franklin Lakes, NJ). For CD3+ cells a minimum of 10,000 events were collected on the lymphocyte gate that was set on the forward scatter vs. side scatter (FSC vs. SSC ) and then gated on CD3+ cells. CD45+ counts were obtained by first gating on all non-bead events using the FSC vs. SSC. A CD45+ histogram plot of the non-bead events was then created, CD45+ cells were gated.
Examples are seen in Figure 18. Absolute counts (number cells per μΐ) were obtained by taking the number of cells counted, divided by total number of beads counted, multiplied by the known concentration of beads. Flowjo software (TreeStar Inc, Ashland, OR) was used for data analysis.
Example 17: Tumor immunohistochemistry (IHC) for measuring levels of tumor infiltrating lymphocytes (TIL) in glioma tumors
Slides were prepared from a 5 micron slice of each FFPE tumor block. Slides were stained using a Benchmark XT instrument per manufacturer's instructions (Ventana, Tucson, AZ). CD3 antibody (Dako, Carpinteria, CA cat # A0452) was added in a 1 :600 dilution, and incubated for 30 minutes. CD8 antibody (Dako, Carpinteria, CA cat # M7103) was added in a 1 :200 dilution and incubated for 60 minutes. CD4 antibody (Leica Microsystems, Buffalo Grove IL, cat # NCL-L-CD4-368) was added in a 1 :50 dilution, and incubated for 2 hours. Slides were counterstained with hematoxylin. Each slide was scanned at a magnification of 10X to identify four suitable fields that were then scored at 25X magnification. Examples are seen in Figure 19 panels A-C. The numbers of positive staining cells were recorded and the average count per four fields calculated. Photomicrographs was taken and scored for specimens with very high cell counts to increase accuracy. Samples were also examined to see if they contained predominantly perivascular and/or parenchymal infiltrates. A blind comparison of observation by two individuals was carried out to ensure uniform interpretation. Data from tumor IHC were analyzed in combination with CD3Z MS-qPCR data to determine association between the two data sets, (see Example 19)
Example 18: Statistical analysis of differential methylation in CD3+ T cells for identification of cell-specific OMRs
To identify putative cell specific DMRs, MACS sorted leukocyte DNA methyation data consisting of un-normalized average beta values from the Illumina HumanMethyation27 microrray were calculated from probe intensities using Illumina GenomeStudio. Locus by locus comparisons of DNA methyation between the sorted cell types were performed using a linear mixed effects model (controlling for beadchip) in SAS version 9.2, thereby generating estimates and p-values for differential methyation in CD3+ T cells compared to other cell types. Resultant p-values were adjusted for multiple comparisons using the qValue package in the software program R project for statistical computing, version 2.13 available for downloading from the internet, and q-values of less than 0.05 were considered significant. All correlations, F-tests, Wicoxon rank sum and Kruskal-Wallis one-way analysis of variance by ranks tests were carried out in R version 2.1 1.1 and survival analysis was performing using the survival pack in R version 2.1 1.1.
Example 19: Discovery and validation of CD3Z demethylation as a marker of CD3+ T cells
The search for genes containing DMRs specific for CD3+ T cells using methods herein revealed candidate CpG sites within the genes encoding several components of the T cell receptor (TCR) complex; namely, CD3D, CD3E, CD3G, and CD3Z. Myeloid derived blood cells (granulocytes, neutrophils, monocytes) and B-lymphocytes contained methylated CpG sites within CD3D, CD3E, CD3G and CD3Z loci compared with T cells, which were demethylated. CD3Z was also unmethylated in CD16+ NK cells, but was methylated in CD 16- NK cells. The promoter regions of the CD3D, CD3E and CD3G genes are CpG sparse compared with CD3Z, which contains a CpG island that is optimally suited for designing MS-qPCR assays (Fig. 1 panel A). For these reasons the CD3Z locus was analyzed for the development of a CD3+ T cell epigenetic marker. CD3Z is significantly overexpressed (p = 0.0001 ; Palmer, Diehn et al. 2006) and demethylated (q = 0.00026) in CD3+ T cells compared with non-T cells. Pyrosequencing of CD3Z showed the extent of differences in demethylation among immune cell lineages, which approaches complete demethylation in CD3+ T cells and nearly complete methylation in other cell lineages (Figure 20 panels A-B).
Bisulfite converted universal methylated DNA and DNA from purified CD3+ Tcells were used to prepare a four point calibration curve to estimate CD3+ T cell numbers in mixtures of cells (Figure 14 panel B). Total amount of DNA was held constant at all four points. Log Linear PGR kinetics were demonstrated over a range of CD3+ T cell DNA inputs corresponding to 10 to 100000 genomic copies, indicating that the MS-qPCR assay was able to detect a few demethylated cells within a background of many thousands of methylated cells.
Whole blood samples from 46 healthy controls and 20 patients with glioma were then used to compare flow cytometry quantification of CD3+ T cells with the CD3Z MS-qPCR assay (Figure 14 panel C). The MS-qPCR measurements were observed to correlate highly with conventional flow measurement of T cells as a fraction of total blood leukocytes (Pearson R = 0.93; F test p < 2.2x10⁻¹⁶). The uniform regression and close correspondence of the two methods was true for both glioma patients (labeled "cases") and the healthy controls. These data show that the disease process itself and treatment exposures did not influence the demethylation assay.
The correlation of CD3+ T cells detected by IHC and MS-qPCR was assessed in a set of FFPE samples; the results indicated a significant association of IHC score with CD3Z demethylation (Pearson R = 0.85; F test p = 3.4x10"" ; Figure 14 panel D). Most CD3+ TILs were CD8+ and only a few stained positively for CD4+ (Figure 19). Glioma cell lines (A172,
T98G) were also studied; both expressed Foxp3 copy numbers < 0.06% of total input. Analysis of two autopsy brain specimens revealed Foxp3 copy numbers <0.04% of total input. These values show limits of detection of the assay which were observed to be much lower than values
observed in patient blood or tumor samples. These results demonstrate the specificity of the CD3Z epigenetic assay for detecting CD3+ immune cells within a background of tumor cells.
Example 20: Determination of T cells and Tregs levels in peripheral blood by CD3Z and FOXP3 MS-qPCR assays in glioma cases and controls
The utility of the epigenetic assays using archived frozen blood specimen samples was tested by performing a case control analysis of CD3Z and FOXP3 demethylation in glioma patients and control subjects to measure CD3+ T cell and Treg levels, respectively, in stored peripheral blood specimens from the University of San Francisco Adult Glioma Study (AGS). Results of MS-qPCR assays are summarized in Table 18. The total inputs of DNA from whole blood from the 94 controls and 71 glioma cases were not significantly different from each other. In patients with grade I V glioblastoma multiforme (GBM), peripheral blood CD3+ T cell levels were observed to be significantly lower (Wilcoxon p = 1.7x10⁻⁹; Figure 15 A), peripheral blood Treg levels were observed to be significantly lower (Wilcoxon p=5.2xl0-l 1; Figure 5 B) and peripheral blood Treg/ CD3+ T cell ratios were observed to be moderately lower (Wilcoxon p = 0.024; Figure 1 C) compared to healthy controls. In glioma patients and controls subjects, levels of T cells and Tregs were positively correlated (Pearson R = 0.61, F test p < 2.2x10⁻¹⁶). Use of dexamethasone or chemotherapy was not associated with T cell measures. The GBM case patients received steroid treatments prior to blood sampling. In healthy controls, but not glioma patients, people who had smoked were observed to have higher peripheral blood CD3+ T cell levels than those who had never smoked (Wilcoxon p = 0.08, Figure 16 panel A) and current smokers had significantly higher levels of peripheral blood Tregs than former smokers
(Wilcoxon p = 0.01 ) and never smokers (Wilcoxon p = 0.002; Figure 16 panel B). Furthermore, the ratio of Tregs / CD3+ T cells was significantly elevated in the peripheral blood of current smokers compared to former smokers (Wilcoxon p = 0.01) and never smokers (Wilcoxon p = 0.03) among healthy controls, and trended towards elevated levels in current smokers compared to former smokers (Wilcoxon p = 0.17) and never smokers (Wilcoxon p = 0.14; Figure 16 panel C).
Table 1 8. Summary of MS-qPCR measurements for all samples (N = 285)
Percent Demethylation, Median (Range)
Sample Description
CD3Z FOXP3 FOXP3/CD3Z
Blood samples (n = 165) 17.6 (2.1-44.4) 0.8 (0.06-3.2) 4.5 (0.9-20.2)
Controls (n = 94) 21.7 (4.7-44.4) 1.0 (0.2-3.2) 4.8 (1.0-20.2)
Never Smokers (n = 44) 19.3 (4.7-32.1) 1.0 (0.2-2.5) 4.8 (1.0-11.7)
Former Smokers (n = 42) 22.4 (8.8-43.4) 1.1 (0.2-2.2) 4.4 (1.8-10.5)
Current Smokers (n = 8) 23.4 (5.7-44.4) 1.6 (0.8-3.2) 7.4 (3.6-20.2)
Glioma Cases (n = 71) 11.2 (2.1-37.7) 0.5 (0.06-2.5) 4.1 (0.9-14.8)
Never Smokers (n = 31 ) 11.3 (2.7-37.7) 0.5 (0.06-2.5) 3.8 (1.3-11.5)
Former Smokers (n = 29) 12.7 (3.3-32.8) 0.5 (0.06-1.7) 4.1 (0.9-12.8)
Current Smokers (n = 1 1 ) 9.6 (2.1-27.8) 0.5 (0.1-1.2) 5.1 (2.3-14.8)
Non-GBM (n = 6) 18.5 (3.5-26.6) 0.9 (0.2-1.6) 6.0 (3.8-7.1)
GBM (n = 65) 10.5 (2.1-37.7) 0.5 (0.06-2.5) 4.1 (0.9-14.8)
Excised Tumors (n = 120) 0.5 (0.03-18.7) 0.03 (0-1.5) 5.1 (0- 100)
Grades I, II & III (n = 83) 0.3 (0.03-3.9) 0.02 (0-0.5) 3.4 (0- 100)
Pilocytic Astrocytoma (n = 2) 1.4 (1.0-1.9) 0 (0-0) 0 (0-0)
Ependymoma (n = 15) 0.5 (0.09-3.0) 0.03 (0-0.3) 3.4 (0-29.4)
Oligodendroglioma (n = 20) 0.2 (0.04-1.6) 0 (0-0.2) 0 (0-57.3)
Oligoastrocytoma (n = 19) 0.25 (0.04-3.9) 0.05 (0-0.4) 10.5 (0-100)
Astrocytoma (n = 27) 0.3 (0.03-2.0) 0 (0-0.5) 0 (0-100)
Grade IV, GBM (n = 37) 1.1 (0.17-18.7) 0.08 (0-1.5) 7.8 (0-47.4)
Example 21 : Determination of T cells and Tregs levels in tumor infiltrates by CD3Z and FOXP3 MS-qPCR assays in excised glioma tumors.
The demethylation assays of CD3Z and FOXP3 were used to measure levels of tumor infiltrating CD3+ T cells and Tregs, respectively, in 120 fresh frozen glioma tumors from the UCSF Brain Tumor Research Center tissue bank. Results of MS-qPCR assays are summarized in Table 18. Increased glioma tumor grade and higher levels of both CD3+T cell (Wilcoxon p = 5.7x10⁻⁷; Figure 17 panel A) and Treg (Wilcoxon p = 0.00014; Figure 17 panel B) in tumor infiltrates were observed ro be significantly associated. In grade IV glioma tumor tissues the median level of Treg percentage of T cells was observed to be higher than that of control blood samples (Table 1 8), and higher than that of lower grade tumors (Figure 17 panel C). Data from MS-qPCR showed significant differences among glioma tumor histologies in levels of CD3+ T cells (Kruskal-Wallis p = 8.6x10⁻⁷; Figure 21 panel A), Tregs (Kruskal-Wallis p = 0.00011 ; Figure 21 panel B) and Treg/CD3+ T cell ratios (Kruskal-Wallis p = 0.018; Figure 21 panel C). Poorer patient survival was associated with and higher levels of tumor infiltrating CD3+ T cells (Log-Rank p-value = 0.014; Figure 22 panel A) and Tregs (Log-Rank p-value = 0.039; Figure 22 panel B) measured by MS-qPCR. Example 22: Kaplan-Meier survival curves for glioma cases show association of lower Treg with improved survival
Survival of glioma patients were correlated with the incidence of CD3+ T cells and
Tregs as measured by CD3Z demethylation assays. (Figure 22 panels A-C). Both univariate and multivariate survival analyses were performed. Kaplan-Meier survival curves for glioma cases were stratified by median values of CD3Z demethylation assays. For depicting the survival results in panels A-C, patients were divided into two groups. In each panel the top trace
represents survival data of the group of patients for whom the measured variable (methylation status of CD3+ T cells, or of Tregs, or a ratio Tregs/T cells) was below the median observed for that variable, and the bottom trace represents survival data of the group of patients for whom the measured variable was above the median observed for that variable.
The results show that after controlling for age, gender and grade the CD3Z
demethylation assays for CD3+ and CD3+Tregs in glioma tumor tissue were significantly associated (Figure 22 panels A-C) with poorer patient survival.
A CD3+ T cell CD3Z demethylation assay was performed which showed that lower CD3+T cell/total input in glioma tumor tissue was significantly associated (Figure 22 panel A) with improved survival (Log-Rank p-value = 0.0144). A Treg CS-DM CD3Z demethylation assays was performed which showed (Figure 22 panel B) that lower Treg/total input in glioma tumor tissue was significantly associated with improved survival (Log-Rank p-value = 0.0385). A measurement of Treg/ CD3+ T cell ratio was performed by CD3Z demethylation assay which showed (Figure 22 panel C) that lower Treg percentage of CD3+ T cells in glioma tumor tissue was significantly associated with improved survival (Log-Rank p-value = 0.4558).
Example 23: Cells, and cancer patient and control datasets for determining DNA methylation based epigenetic signatures for differentiating patients and controls
Sorted, normal, human peripheral blood leukocyte subtypes were isolated from whole blood by magnetic activated cell sorting (MACS) (AllCells LLC, Emeryville, CA). The purity of separated cells was confirmed with flow cytometry to be >97%. Genomic DNA was extracted and purified from cell pellets using a commercially available method (Qiagen, Valencia, CA), treated with sodium bisulfite (Zymo Research, Irvine, CA) and subjected to methylation profiling using the Infinium HumanMethyation27 BeadArray (Illumina, San Diego, CA). This same platform was used for the analysis of samples from the case-control studies described below.
The ITNSCC data set consists (Table 19) of 92 incident cases from the greater Boston area and 92 cancer-free population-based control subjects from the same region (Applebaum
KM et al, Int J Cancer 124:2690-2696, 2009). The clinical characteristics for this study population are contained in Table 19. The ovarian cancer data set (Teschendorff AE et al, 2009,
PLoS One 4:e8274, 2009) is publicly available from Gene Expression Omnibus (GEO, http://www.ncbi.nlm.nih.gov/geo/, Accession number GSE1971 1), and consists of 266 postmenopausal women diagnosed with primary epithelial ovarian cancer (131 pre-treatment and 135 post-treatment cases) from the UK Ovarian Cancer Population Study (UKOPS).
Controls (n = 274) were cancer-free postmenopausal women for which annual serum samples
were available. To avoid potential biases due to therapy, only pre-treatment ovarian cases were included in the analysis. The bladder cancer data set (Marsit CJ et al., 201 1, J Clin Oncol 29: 1133-1 139) consists of 223 incident bladder cancer cases identified from the New Hampshire state cancer registry and 237 population controls from the same region (Karagas MR et al., 1998, Environ Health Perspect 106: 1047-1050; Wallace K et al., 2009, Cancer Prev Res 2:70- 73). Table 20 provides a summary of the participant characteristics.
Tablel9. Characteristics of the study population in the HNSCC data set.

Table 20. Characteristics of the study population in the Bladder cancer data set.
Characteristics Controls Cases
No. % No. %
Total No. 237 223
Age, years
Median 65 66
Range 28-74 25-74
Sex
Male 158 48 171 52
Female 79 60 52 40
Family history of bladder
cancer*
No 224 53 199 47
Yes 7 44 9 56
Smoking history
Never 72 64 40 36
Former 126 53 11 1 47
Current 39 35 72 66
Tumor stage/grade designation
Carcinoma in situ NA 6 3
Noninvasive low grade
(grade 1 -2) NA 140 63
Noninvasive high grade
(grade 3) NA 17 7
Invasive NA 60 27
* Data on family history were not available for 13 subjects
Example 24: Statistical analysis of differences in methylation status in leucocyte subsets for determining signatures based on leukocyte DMRs
The analytic strategy was aimed toward examining the extent to which peripheral blood DNA methylation of non-hematopoietic cancers is driven by the epigenetic signatures that define leukocyte subtypes. Linear mixed-effects models were used to assess differences in methylation across the leukocyte subtypes and controlled for the large number of comparisons using false discovery rate (fdr) estimation. Leukocyte DMRs were subsequently ranked based on their strength of association and the highest ranking 50 DMRs were examined across the three cancer data sets between cancer cases and cancer-free controls.
An analysis was performed that capitalized on the aggregate methylation signatures across a collection of leukocyte DMRs. Each one of the full cancer data sets was split into equally sized training and testing sets. Samples in the training sets were then clustered using leukocyte DMRs. Clustering analysis was achieved using the Recursively Partitioned Mixture Model20 (RPMM), a hierarchical model-based method for clustering used for the clustering of array -based methylation data ((Christensen BC et al., 2009, PLoS Genet 5:el000602; Christensen BC et al, 2011, J Natl Cancer Inst 103: 143-153; Hinoue T et al, 2012, Genome Res. 22(2):271-82;
Koestler DC et al., 2010, Bioinformatics 26:2578-2585). Based on the RPMM fit to the training sets, methylation class membership for the observations in the respective testing sets was predicted and the association between predicted methylation class and cancer case/control status were assessed.
The detailed statistical methodologies employed in the analysis are shown in Examples 25-26. Analyses were carried out using the R statistical package, R project for statistical computing, version 2.13 R available for downloading from the internet.
Example 25: Prediction of methylation class membership based on epigenetic signatures from leukocyte derived DMRs
Genome-wide DNA methylation was profiled in 46 samples of magnetic antibody sorted, normal human peripheral blood leukocyte subtypes (including B cells, granulocytes, monocytes, NK-cells, CD4+ T cells, CD8+ T cells, and Pan-T cells; Figure 28) using the Infinium
HumanMethylation27 BeadArray. To discern leukocyte subtype DMRs, an association between methylation and leukocyte subtype for each of 26,486 autosomal CpG loci was examined. This data revealed 10,370 significantly differentially methylated CpGs among the leukocyte subtypes (fdr q-value < 0.05), which were ranked by q-value (Table 22 and Figure 24 panel A). The highest ranking 50 DMRs (Table 21) from this ranked list were selected for use in the case- control analyses. Since the publically available ovarian cancer data set included both pre- and post-treatment cases, only pre-treatment cases (n = 131) were considered in subsequent analyses to avoid potential biases resulting from therapy. Using unconditional logistic regression models, adjusted for available and relevant confounders (Figure 24 panel A), a substantial proportion of the 50 selected leukocyte DMRs were found to be significantly differentially methylated between cancer cases and cancer-free controls at the a = 0.05 threshold (48, 47, and 8 out of 50, permutation p-values = O.001, <0.001, 0.085, for HNSCC, ovarian cancer, and bladder cancer, respectively; Figure 24 panel B).
Eight of the leukocyte DMRs that were significantly differentially methylated in cancer cases compared to controls were observed to be common to the three cancer types (Figure 24 panel B). In HNSCC and ovarian cancer, seven of these eight leukocyte DMRs were hypomethylated in cases relative to controls, whereas all 8 DMRs were hypermethylated in bladder cancer cases relative to controls (Table 22).
To extend on the aggregate methylation signatures across a collection of leukocyte DMRs, classifiers based on profiles of leukocyte DMRs obtained from the subset analysis were developed and tested and the performance of these classifiers for successfully discriminating cancer cases from cancer-free controls was assessed. The workflow of the DMR methylation profile analysis is shown in Figures 29-31. For each of the three cancer data sets, a cross- validation procedure (Christensen BC et al., 2011, J Natl Cancer Inst 103: 143-153) was implemented on the training sets only to determine the number of highest ranking leukocyte
DMRs (M) for subsequent clustering analysis of the training sets. The highest ranking 50, 10, and 56 leukocyte DMRs from the respective cross-validation procedures using the 10,370 putative DMRs initially identified were selected to cluster the observations in the HNSCC, ovarian cancer, and bladder cancer training sets respectively. The resultant clustering solutions were used to predict methylation class membership for the subjects within the respective
independent testing sets. Figures 24 panel A, 25 panel A and 26 panel A depict heat maps of the respective testing sets by predicted methylation class for each cancer data set. Methylation classes derived from leukocyte subtype DMRs were significantly associated with cancer case status within each cancer type (permutation χ2 p-values <0.0001, <0.0001, 0.03, HNSCC, ovarian cancer, and bladder cancer data sets respectively), supporting the phenotypic relevance of predicted methylation classes based on leukocyte DMRs.
For the HNSCC testing set, subjects predicted to be in the right most classes of the dendrogram (classes beginning with R) were six-fold more likely to be HNSCC cases compared to subjects in the left most classes (classes beginning with L) (OR = 5.99; 95% CI [1.96, 18.36]), controlling for age, gender, smoking, alcohol consumption, and HPV serostatus. Assessing the clinical utility of the predicted methylation classes in H SCC demonstrated that methylation classes derived from the highest ranking 50 leukocyte DMRs were highly predictive of HNSCC case/control status (area under the curve (AUC) = 0.82 95% CI [0.74, 0.91]), which increased to 0.92 (0.87, 0.98 with age, gender, smoking, alcohol consumption, and HPV serostatus included in the model (Figure 24 panel B).
For ovarian cancer, subjects predicted to be in the right most classes were approximately ten-fold more likely to be ovarian cancer cases compared to subjects in the left most classes (OR = 9.87, 95% CI [4.63, 21.10]), controlling for age. Additionally, the predicted methylation classes in the ovarian cancer data demonstrated remarkably high sensitivity and specificity for predicting ovarian cancer case/control status (AUC = 0.83 95% CI [0.77, 0.89]), which increased to AUC = 0.86 95% CI [0.81 , 0.92] with age included in the model (Figure 25 panel B).
In the bladder cancer data, subjects in the right most classes were nearly twice as likely to be bladder cancer cases compared to subjects in the left most (OR = 1.94 95% CI [0.95, 3.98], adjusted for age, gender, smoking and family history of bladder cancer). The clinical utility of the predicted methylation classes in the bladder cancer data was lower than that observed for HNSCC and ovarian cancer (bladder AUC = 0.67 95% CI [0.60, 0.73] and adjusted AUC = 0.77 95% CI [0.71, 0.83] with age, gender, smoking, and family history in the model) (Figure 26 panel B).
Utilizing leukocyte-derived DMRs to differentiate cases and controls resulted in methylation profiles that were consistent, and in the case of HNSCC and ovarian tumors, considerably better in terms of their prediction performance compared to previously published results using the same data sets (Teschendorff AE et al., 2009, PLoS One 4ie8274; Marsit CJ et al., 201 1 , J Clin Oncol 29: 1133-1 139; Langevin SM et al„ Epigenetics. 2012 Mar; 7(3):291-9). For the HNSCC and ovarian data sets there was a high degree of correlation in the methylation
status of leukocyte DMRs and CpG loci identified by previous analytic strategies (Langevin SM et al., Epigenetics. 2012 Mar; 7(3):291 -9; mean absolute spearman correlations = 0.68 and 0.75, respectively; Figure 27 panels A and B). In contrast, the highest ranking 56 DMRs in the bladder data set were found to be less correlated with the CpG loci used to form the methylation classes in a previous study using the same data set (mean absolute spearman correlation = 0.1 1 ; Figure 27 panel C).
Table 21. The highest ranking 50 differentially methylated regions (DMRs) among the leukocyte subtypes (false discovery rate q-values < 0.001 for all)
CpG Name Chromosome Gene Name F-statistic
cg03801286 21 KCNE1 373.63 cg25634666 1 1 FOLR3 369.50 cg24777950 14 CTSG 350.66 cgl7356733 21 IFNGR2 291.97 cg02497428 16 IGSF6 291.35 cg2421 1388 6 AIF1 285.92 cg03330678 17 9-Sep 284.79 cg00546897 21 LOC284837 279.64 cg24841244 1 1 CD3D 271.62 cgl 1283860 1 SLC45A 1 271.09 cg27485921 2 ATP6V1E2 267.19 cg00974864 1 FCGR3B 260.62 cg07730301 1 1 ALDH3B 1 252.52 cg07728874 1 1 CD3D 250.67 cgl 7496921 19 TSPAN 16 246.58 cg26661623 17 ASGR2 242.83 cgl 8920397 1 LY9 238.64 cg27461 196 19 FXYD1 236.64 cg20720686 7 POR 232.23 cg09303642 12 NFE2 231.34 cg23140706 12 NFE2 224.95 cg08458487 10 SFTPD 217.67 cg20748065 7 POR 217.63 cgl 8589858 1 1 SLC02B 1 217.14 cgl 0287137 11 P2RY2 215.31 cg25587233 9 PPP2R4 207.25 cg08044694 19 BRD4 202.50 cgl 8084554 19 ARID3A 198.61 cgl 3650156 7 PILRA 197.87 cgl 8854666 2 SLC1 1A1 197.42 cgl 7173423 1 1 MS4A3 195.50 cg22242539 17 SERPINF1 194.11 cg02780988 17 KRTHA6 193.25 cgl 0266490 1 ACOT11 192.62
cg27606341 5 FYB 191.23 cgl 5512851 6 FGD2 185.34
Table 22.
cg20070090 1 S100A8 183.43
Methylation cgl 1058932 7 TSGA13 183.31 differences cgl3500819 5 PACAP 182.82 cgl5880738 11 CD3G 182.73 between
cg07285167 1 CSF3R 182.16 cancer cases cg09868035 20 C20orfl35 179.56 and controls cgO 1980222 6 TREM2 178.94 cg21019522 11 SLC22A18 176.20 for the eight eg 16097772 12 LYZ 172.89 overlapping cg21969640 12 GPR84 172.51 eg 12971694 9 CD72 172.43 differentially
cg22224704 11 GSTP1 172.40 methylated cg07239938 19 ELA2 170.70 leukocyte cg02240622 15 PLCB2 169.99
DMRs. Mean delta-beta refers to the difference in mean methylation between cancer cases and controls (i.e. peases - controls).

Example 26. Statistical analysis of methylation differences in leukocyte DMRs between cancer cases and cancer-free controls for determining epigenetic signatures specific to each group
Linear mixed-effects models were used to assess differences in methylation across the leukocyte subtypes, modeling arcsine square-root transformed methylation as the response 1, leukocyte subtype as a fixed effect covariate, and a random effect term for plate/BeadChip.
False discovery rate (fdr) estimation was used to control for the large number of comparisons and putative leukocyte DMRs were defined as those with fdr q-value < 0.05. Leukocyte DMRs
were then ranked based on their strength of association using the F-statistics that resulted from the respective linear mixed-effects models.
Methylation differences among the highest ranking 50 leukocyte DMRs were examined between cancer cases and cancer-free controls using a series of unconditional logistic regression models that were adjusted using available and relevant covariate information. A leukocyte DMR was considered differentially methylated if the nominal p-value from the unconditional logistic regression model was less than 0.05. Permutation tests were then applied to each of the three data sets to determine if the number of differentially methylated leukocyte DMRs was significantly greater than expected by chance. Specifically, samples were randomly permuted (same permutation across the highest ranking 50 DMRs) and an unconditional logistic regression model was fit to the resampled data. For each data set 1000 permutations were considered to generate a null distribution of the number of differentially methylated leukocyte DMRs. Permutation p-values were then obtained by comparing the observed number of differentially methylated leukocyte DMRs to the respective null distribution.
The leukocyte DMR profile analysis involved splitting the full cancer data sets into equally sized training and testing sets (Figures 29-32). Samples in the training set were clustered using the highest ranking M leukocyte DMRs, where M was determined from the total pool of putative DMRs using the previously described cross-validation procedure (Sincic N and Herceg Z, 2011, Curr Opin Oncol 23:69-76). Clustering analysis was achieved using the Recursively Partitioned Mixture ModeB (RPMM), a hierarchical model-based method for clustering that has been extensively used for the clustering of array-based methylation data (Cui HM, 2007, Dis Markers 23: 105-1 12; Wilhelm-Benartzi CS et al., 2010, Carcinogenesis 31 : 1972-1976; Schwartzman J et al, 2011, Epigenetics 6: 1248-1256, 2011). Based on the RPMM fit to the training data, a naive Bayes classifier was used to predict methylation class membership for the observations in the independent testing set. Associations between predicted methylation class and cancer case/control status were assessed using permutation χ2 tests and unconditional logistic regression models adjusted for available and relevant confounders. The clinical utility of the identified methylation classes were investigated using receiver operating characteristic (ROC) curves and the corresponding area under the curve (AUC).
Pairwise spearman correlation coefficients were computed between the highest ranking
M leukocyte DMRs and the CpG loci identified from the corresponding semi-supervised RPMM2 (SS-RPMM) analysis of the HNSCC, ovarian, and bladder cancer data sets. A diagram illustrating the analytic framework for SS-RPMM is provided in Figure 32. Briefly SS-RPMM is a statistical methodology for identifying classes of methylation that are associated with a
phenotype of interest and has been successfully applied in several of settings (Christensen BC et al., 2009, Cancer Res 69:227-234; Marsit CJ et al., 2006, Cancer Res 66: 10621-10629, 2006).
The same training and testing sets were used for the HNSCC and bladder cancer data sets as were used in the references Langevin SM et al., Epigenetics. 2012 Mar; 7(3):291-9 and Christensen BC et al., 2009, Cancer Res 69:227-234, to compare the results of the present analysis to previously published results, and to provide additional insight with respect to the findings of those studies. The ovarian cancer data set was also analyzed using SS-RPMM strategy described in Langevin SM et al., Epigenetics. 2012 Mar; 7(3):291-9 and Christensen BC et al., 2009, Cancer Res 69:227-234, and the results are shown in Figure 33. Following the logic above, the training sets used for the SS-RPMM analysis were applied to the leukocyte DMR profile analysis of the ovarian data.
Analyses were carried out using the R statistical package, R project for statistical computing, version 2.13 R available for downloading from the internet. Example 27: Methylation analysis by DNA Methylation Microarray for NK cell specific DMR Normal human peripheral blood leukocytes were isolated by magnetic activated cell sorting (MACS; Miltenyi Biotec Inc., Auburn, CA) and purity was confirmed by fluorescence activated cell sorting (FACS). The major cell types obtained included NK cells (n=9), B cells (n=5), T cells (n=16), monocytes (n=5), and granulocytes (n = 8). DNA and RNA were co- extracted from MACS sorted leukocytes using AllPrep DNA/RNA mini kit (Qiagen Inc., Valencia, CA). DNA from archived blood was extracted with DNeasy Blood & Tissue kit (Qiagen Inc., Valencia, CA). DNA was treated with sodium bisulfite according to the EZ DNA Methylation Kit (Zymo Research Corporation, Irvine, CA).
Methylation analysis was performed using The Infinium® HumanMethylation27 Beadchip Microarray (lilumina Inc., San Diego, CA), which quantifies the methylation status of 27,578 CpG loci from 14,495 genes, with a redundancy of 15-18 fold. The ratio of fluorescent signals was computed from both alleles using the following equation: p=(max(M,0))/(|Uj + |M|) + 100. The resultant β-value is a continuous variable ranging from 0 (unmethylated) to 1 (completely methylated) that represents the methylation at each CpG site and is used in subsequent statistical analyses. Data were assembled with the methylation module of
GenomeStudio software (lilumina, Inc., San Diego, CA; Bibikova M et al, 2009, Epigenomics 2009; 1 : 177-200)
Example 28: Validation of DNA Methylation Microarray results for identifying NK cell-specific DMRs by pyrosequencing
Pyrosequencing assays to validate microarray results were designed using Pyromark Assay Design 2.0 (Qiagen Inc., Valencia, CA), and carried out on a Pyromark
MD pyrosequencer running Pyromark qCpG 1.1.11 software (Qiagen Inc., Valencia, CA).
Oligonucleotide primers were obtained from Life Technologies™ (Grand Island, NY).
Example 29: Protein expression analysis by mRNA expression array for identifying NK cell- specific DMRs
The Whole-Genome DASL HT Assay Kit (Illumina Inc., San Diego, CA) was used to obtain simultaneous profiles of more than 29,000 mRNA transcripts. Data were assembled with the expression module of GenomeStudio software (Illumina Inc., San Diego, CA). The mRNA expression array data was used in combination with DNA methylation array data to identify NK cell-specific DNA methylation.
Example 30: Methylation specific quantitative polymerase chain reaction (MS-qPCR) analysis for quantification of NKp46 demethylation
Primers and TaqMan major groove binding (MGB) probes (Table 23) with 5' 6-FAM (6- Carboxyfluorescein) and 3' non-fluorescent quencher (NFQ) as well as TaqMan® 1000 RXN Gold with Buffer A Pack were obtained from Life Technologies™ (Grand Island, NY).
MS-qPCR was performed using solutions and conditions according to Campan M et al., 2009, Methods Mol Biol, 507:325-37 with the following modifications. A solution of 10X TaqMan® Stabilizer containing 0.1% Tween-20, 0.5% gelatin was prepared weekly. Each reaction of 20 μΐ contained 5 μΐ DNA, 11.9 μΐ preMix, 3 μΐ oligoMix, and 0.1 μΐ Taq DNA polymerase. Cycling was performed using a 7900HT Fast Real- Time PCR System (Applied Biosystems, Foster City, CA); 50 cycles at 95 °C for 15 sec and 60 °C for 1 min after 10 min at 95 °C preheat. All samples were run in triplicate using the absolute quantification method.
Table 23. MS-qPCR oligonucleotide sequences
Oligonucleotide
name Sequence
NKp46 forward
ATTAGGTTGGTAGAATTTGAGT (SEQ ID NO: 116)
primer
NKp46 reverse primer CCCATTCCCCTTCCACA (SEQ ID NO: 117)
NKp46 probe (6FAM) CTCACCAACACAAAACAA (MGB, NFQ) (SEQ ID NO: 118 ) C-less forward primer TTGTATGTATGTGAGTGTGGGAGAGA (SEQ ID NO: 97)
C-less reverse primer TTTCTTCCACCCCTTCTCTTCC (SEQ ID NO: 98)
C-less probe (6FAM) CTCCCCCTCTAACTCTAT (MGB, NFQ) (SEQ ID NO: 99)
MGB: major groove binding
FAM: 6-Carboxyfluorescein
NGQ: NFQ
C-less qPCR assay: Campari M et al., 2009, Methods Mol Biol, 507:325-37; Weisenberger DJ et al., 2008, Nucleic Acids Res 2008; 36:4689-98
Quantification of total bisulfite converted DNA copies was performed by reference to the C-less qPCR assay (Campan M et al., 2009, Methods Mol Biol, 507:325-37; Weisenberger DJ et al., 2008, Nucleic Acids Res 2008;36:4689-98). C-less primers and probes
recognize a DNA sequence without cytosines; hence, the assay amplifies the total amount of DNA in a PCR reaction regardless of bisulfite conversion or methylation status. A conversion factor was used for a diploid human cell, which is 6.6 picograms (pg) of DNA ( 3.3 pg per copy) to calculate copy number.
Normal human blood DNA quantified by UV absorption (Nanodrop, Inc) was used to generate a four point standard curve with 30,000 copies, 3,000 copies, 300 copies and 30 copies of genomic DNA. This standard curve was included on each sample plate to obtain
quantification of DNA from Ct values. Since C-less primers hybridize to both strands of the standard DNA (non-bisulfite converted) and since bisulfite converted samples hybridize to a single strand during the first cycle, the resultant copy number obtained from bisulfite treated samples was multiplied by two. Bisulfite converted, universal methylated DNA standard (Zymo Research Corperation, Valencia, CA) and bisulfite converted, isolated NK cell DNA were quantified at the same time using the C-less assay. Resultant copy number measurements were used to prepare a calibration curve for the NKp46 demethylation assay. NK cell DNA in known copy numbers was spiked into universal methylated DNA in ratios that maintained a constant total number of DNA copies (10,000 copies) in each reaction across the dilution scheme. This mimics conditions for detecting different relative numbers of NK cells within a complex mixture of cells in a biological sample. For absolute quantification of NKp46 demethylation, the four- point standard curve used 10,000 copies, 1,000 copies, 100 copies, and 10 copies of bisulfite converted NK cell DNA. Example 31 : Statistical modeling of the DNA methylation microarray data for estimation of differential methylation
A linear mixed effects model was applied to the Illumina Infinium®
HumanMethylation27 data using SAS (SAS Institute Inc., Gary, NC). Cell type was designated as the fixed effect and beadchip plate was the random effect. For this example, the fixed effect groups were NK cells and non-NK cells, which included pan T lymphocytes, CD4+ T- lymphocytes, Tregs, CD8+ T-lymphocytes, B-lymphocytes, granulocytes and monocytes.
Coefficients were generated that estimated differential methylation were generated such that, for
any particular locus, a negative coefficient indicated less methylation in NK cells than in the other cell types. Resultant p-values were adjusted for multiple comparisons using the "qvalue" package in the software, the R project for statistical computing available for downloading from the internet.
Example 32: Statistical modeling of the RNA expression array for estimation of differential RNA expression
Linear models were applied to the Illumina Whole-Genome DASL HT using the "limma" package in the software, the R project for statistical computing. RNA expression for MACS isolated NK cells was compared to each of the following MACS isolated leukocytes: pan T-lymphocytes, CD4+ T-lymphocytes, Tregs, CD8+ T-lymphocytes, B lymphocytes, ganulocytes and monocytes. Thus, estimates were obtained for log-fold changes in RNA expression between NK cells and each of the aforementioned cell types, in which a positive value indicated higher RNA expression in NK cells compared to a particular cell type. Resultant p values were adjusted for multiple comparisons using the "qvalue" package in R project for statistical computing. NK cell specific differential RNA expression was considered significant only if the seven q-values were each less than 0.1.
Example 33: Statistical analysis of the (MS-qPCR) data
Statistical analyses were carried out in R project for statistical computing. A generalized linear model analysis and F-test were performed to determine log linear PCR kinetics for the NK cell standard curve. To test for univariate associations between continuous NKp46
demethylation measurements and discrete variables, Wilcoxon rank sum tests (for dichotomous variables, such as case status) and Kruskal-Wallis one-way analysis of variance tests were employed. To test for univariate associations between continuous NKp46 demethylation and other continuous variables linear regression analysis, calculation of Pearson product-moment correlations and F-tests were performed. A chi-squared test for trends in proportions was applied to identify trends in HNSCC prevalence by control-determined demethylation tertiles.
Multivariate logistic regression analyses were performed using the "glm" function with family set to binary.
Example 34: NKp46 demethylation is a biomarker of NK cells
Analysis of DNA methylation and RNA expression microarray data from MACS isolated
(FACS validated) normal human leukocytes were integrated to identify putative, NK cell- specific DMRs that could potentially serve as reliable biomarkers of the cell type. The list of
candidate gene regions was narrowed to CpG loci that were significantly demethylated in NK cells (q < 0.1 , coefficient < 0) and that were located within genes whose RNA expression was significantly elevated in NK cells (q < 0.1, log fold-change > 1 ). These candidates are marked as darkened asterisks in the top left quadrant of Figure 34. Pyrosequencing and MS-qPCR of bisulfite converted DNA from the MACS isolated leukocytes confirmed that a region near the promoter of NKp46 is demethylated in NK cells, and is methylated in T cells, B cells,
granulocytes, and monocytes (Figures 35 and 38). Furthermore, the CD56a,m subset of NK cells showed complete demethylation in the NKp46 region, whereas CD56bright NK cells exhibited only partial demethylation in the region as measured by MS-qPCR. The NKp46 MS-qPCR assay was optimized to fit a log-linear relationship between lower Ct values (more demethylated copies of NKp46) and increased NK cell DNA content (Pearson R = -0.996, p < 2.2.xl 016;
Figure 36).
Example 35 : Samples from F1NSCC patients have diminished circulating NK cells
The calibrated NKp46 MS-qPCR assay was used to measure the level of circulating NK cells in the peripheral blood of patients with FTNSCC and cancer free controls. The
demographics of the study population are shown in Table 24.
Table 24. Demographic characteristics
Total Controls HNSCC Oral Pharyngeal Laryngeal
(N = (n =
Characteristic (n = (n = 43) (n = 53) (n = 26)
244) 122) 122)
Age
61 61 60
Mean (SD) 62 ( 12) 60 (10) 64 (9.5)
(12) (12) (15)
60 60 (31 - 60 59 60 (41- 64 (50-
Median (Range)
(29-87) 87) (29-86) (29-86) 86) 83)
Gender
178 89 89 27 21 Male, No. (%) 41 (77%)
(73%) (73%) (73%) (63%) (81%)
66 33 33 16
Female, No. (%) 12 (23%) 5 ( 19%)
(27%) (27%) (27%) (37%)
HPV 16 Serology
33 29 6
L1 +, No. (%) 4 (3%) 22 (42%) 1 (4%)
(14%) (24%) (14%)
41 37 2
E6+, No. (%) 4 (3%) 32 (60%) 3 (12%)
(17%) (30%) (5%)
28 26 1
E7+, No. (%) 2 (2%) 23 (43%) 2 (8%)
(11%) (21 %) (2%)
E6+ and E7+, 25 25 0
0 (0%) 23 (43%) 2 (8%) No. (%) (10%) (20%) (0%)
E6+ or E7+ , 44 38 3
6 (5%) 32 (60%) 3 ( 12%) No. (%) (18%) (31 %) (7%)
Cigarette
Smoking Status
Never, No. (%)
Former, No.(%)
Current, No.(%) )
Cigarette Pack- Years
Mean (SD)
Median (Range)

Alcohol Drinks per
Week
18 21 18
Mean (SD) ((2266)) 1155 ((2277)) ((2244)) ((2233)) 22 (25) 23 (25)
7 (0- 6 (0- 14 (0- 7 (0 18 (0- 19 (0-
Median (Range)
199) 199) 155) 90) 155) 113)
Univariate analysis revealed that significantly fewer demethylated copies of NKp46 were detected in HNSCC blood than in control blood (p < 0.0001, Figure 39), indicative of a diminished NK cell compartment in the peripheral blood of HNSCC patients. There was no significant univariate association observed between the measured number of demethylated NKp46 copies and age, gender, HPV16 (E6 and/or E7) serology, cigarette smoking, alcohol consumption, or body mass index. There was no significant difference in the number of demethylated NKp46 copies detected in patients with oral, pharyngeal, and laryngeal tumors.
To determine whether the observed association between NK cells and case status was attributable to systemic chemotherapy or other treatments, the number of demethylated NKp46 copies detected in case blood samples drawn within one month of diagnosis was compared to those drawn more than one month after diagnosis, and no significant difference was observed.
The NKp46 MS-qPCR measurements from cancer-free control blood samples were used to determine suitable cutoffs for NKp46 demethylation tertiles. The proportion of total HNSCC cases decreased significantly with increasing demethylation tertile (p> 0.001, Figure 37), indicating that HNSCC patients are more likely to have depressed levels of NK cells in their peripheral blood. The trend held true independent of the case stratification by HPV16 (E6 and/or E7) serology, or time of blood drawing within a month of diagnosis or earlier. Multivariate logistic regression controlling for age, gender, cigarette smoking, alcohol consumption, BMI, and HPV16 (E6 and/or E7) serology confirmed increased HNSCC risk for individuals in the lower two normal NKp46 demethylation tertiles (Table 25), strongly indicating that lower levels of NK cells in the peripheral blood are significantly associated with HNSCC.
Table 25 Logistic regression of HNSCC risk
NKp46 demethylation Crude Adjusted*
tertile OR (95% CI) p-value OR (95% CI) p-value
1st (lowest) 4.3 (2.2, 9.0) 5.0x10"5 5.6 (2.0,17.4) 0.002
2nd (middle) 2.8 (1.4, 6.0) 0.006 4.9 (1 .8, 16.1) 0.004
3rd (highest) Reference Reference
""Unconditional multivariate model controlling for age, gender, smoking, drinking, BMI and
HP VI 6 (E6 and/or E7) serology
Example 36: Application of the methodology to mRNA data
The statistical methods described herein for determining changes the distribution of white blood cells among different subpopulations are applicable to mRNA expression profiles with the following considerations. A mathematical consideration is that mRNA is typically analyzed on a logarithmic scale, yet the assumptions of the methods herein involve linearity on an arithmetic scale, since the mixing coefficients are assumed to act linearly on absolute numbers of nucleic acid molecules; thus, the proposed methods would require analysis of untransformed fluorescence intensities, for which skewed distributions would result in numerical instabilities. A biological consideration is absence of a linear relationship between cell number and mRNA copies, since proteins may be translated as a consequence of an initial burst of mRNA transcription upon cellular development, followed by significant mRNA degradation. In contrast, one would expect the average beta value provided by Illumina bead-array products, as well as similarly constructed quantities from other platforms to scale in proportion to the actual fraction of methylated nucleic acids with a biologically reasonable assumption of two DNA molecules per cell.
An example of an application of methods herein is shown using mRNA data. The validation data set S0 was obtained from Watkins NA et al., 2009, Blood 113: e l-e9, in which the illumina Human-6 v2 Expression BeadChip was used to characterize the mRNA expresion profile of eigt types of blood cells: B cells, granulocytes, erythroblasts, megakaryocytes, monocytes, natural killer cells, CD4+ T cells, and CD8+ T cells. For this analysis erythroblasts (nucleated progenitors of red blood cells) and megakaryocytes (progenitors of platelets) were removed. The target data set Sl was obtained from Showe MK et al, 2009, Cancer Res 69: 9202-10, in which the same mRNA expression platform was used to characterize expression differences in isolated mononuclear cells between nonsmall cell lung cancer (NSCLC) cases and controls having non-cancer lung disease, adjusting for age, sex and smoking. In addition, data was presented from 18 matched case samples, pre- and post-operative.
The same methodology was used as for the DNA methylation data sets herein, ordering the 46,693 transcripts by F statistic according to their ability to distinguish six types of leukocytes. Of the 100 transcripts having the largest F statistics it was observed that 86 overlapped with the transcripts in Showe MK et al, 2009, Cancer Res 69: 9202-10. Thus the remainder of the analysis was carried out using the 86 overlapping loci. In the analyses, untransformed data (i.e. using either the normalized fluorescence intensities or 2 raised to the power of the normalized log, intensities) were used. Application of the constrained projection in Examples 1 and 5 resulted in an average percentage estimates consistent with mononuclear cells (i.e. a subfraction with most granulocytes removed): 3.3% B cell, 3.4% granulocyte, 18.1% monocyte, 29.5 % NK cell, 11.6 CD4+ T cell, and 2.2 % CD8+ T cell.
Table 26 presents results from 137 NSCLC cases and 91 controls, adjusted for age, sex, and smoking status. Table 27 presents results from 18 matched pre-operative and post-operative samples from NSCLC cases, where the analyzed outcome was the difference in untransformed expression (post-operative expression minus pre-operative expression), and coefficients displayed correspond to the intercept of l (analogous to a paired t-test). Perturbations in T cell distribution were consistent with known immunological changes resulting from NSCLC (Ginns LC et al, 1982, Am Rev Respir Dis 23: 265—9; Mazzoccoli G et al., 1999, In Vivo 13: 205-9), as well as with age and smoking. The perturbations and coefficient signs were reasonable; the magnitudes were potentially biased. For example, the estimates corresponding to granulocyte distribution were much larger than expected given the relatively small number of granulocytes present in a monouclear subfraction. Thus, the methods herein were determined to be suitable for application to mRNA data sets.
Table 26. White blood cell distribution comparing cases to controls in NSCLC mRNA data set
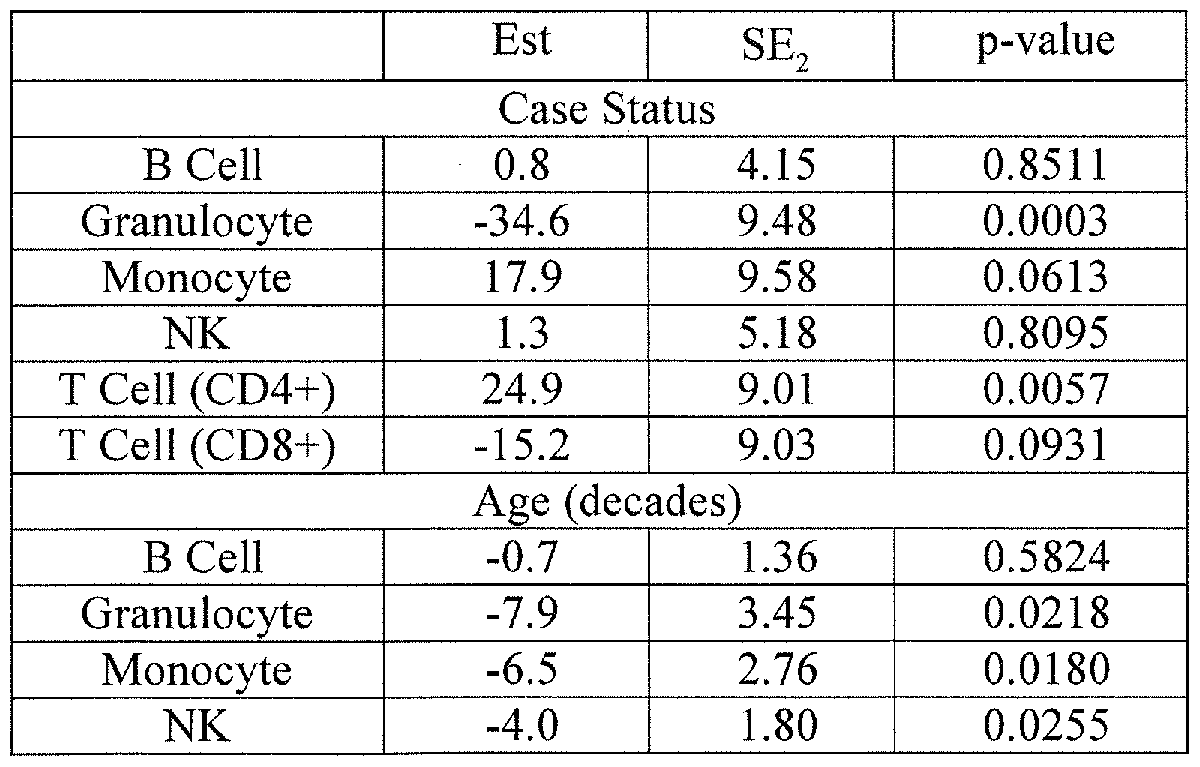

T Cell (CD8+) -41.2 1 1.10 0.0002
Est = Regression coefficient estimate ( x 100%)
SE2 = Double-bootstrap standard error (x 100
%).
Table 27. White blood cell distribution comparing matched pre-operative and post-operative cases in SCLC mRNA data set

Est = Regression coefficient estimate (x 100%)
SE2 = Double-bootstrap standard error ( x 100%).
Example 37: An array for high-throughput DNA methylation analysis
An array for performing DNA methylation analysis in a high-throughput manner was made using VeraCode microbeads (Illumina, San Diego, CA USA) and DNA sequences of
regions in 96 different genes, each sequence having one CpG dinucleotide shown within square brackets (Figure 40) and used to determine methylation status of the gene. Veracode beads are cylindrical glass microbeads 240 microns in length by 28 microns in diameter with a surface suitable for attaching DNA, RNA, protein, antibody and other ligands for performing bioassays. For performing DNA methylation analysis various CpG specific DNA oligomers were attached to these beads. Each microbead is inscribed with a high-density holographic code (24-bit), allowing development of very large numbers of bead types. When a laser is shone at the high density codes of the beads they emit a signal specific to the code and the signal is detected by a CCD camera. The fluorescence of the bead indicates whether the particular CpG site carried by the bead is demethylated. The result is compared with the fluorescence readout obtained from DNA from a purified leukocyte sample. A VeraCode array is a collection of beads, each carrying a DNA oligomer specific for either the methylated or the unmethylated form of a particular CpG locus, distributed into different wells of a micro titer plate. A user selects all or a subset of nucleotide sequences containing CpG sites in a gene or genes of interest for attaching to VeraCode beads to have a custom designed VeraCode array particularly advantageous for the user's analysis.
To ascertain which 96 CpGs would give optimal precision for all of the white blood cell (WBC) types the following procedure was followed. The Infmium HumanMethylation 27K data corresponding to all of the Magnetic activated cell sorting (MACS sorted leukocyte DNA were assembled in the methylation module of GenomeStudio, and the quality of the data was assessed by calculating Mahalanobis distances. All 47 samples yielded acceptable data. A matrix of β- values was generated with rows defined by microarray CpG locus and columns defined by sample identification. A corresponding matrix indicating cellular phenotypes was also generated, with rows defined by sample identification (in precisely the same order as the columns in the corresponding matrix) and columns defining the cell lineage(s) to which each cell lineage belongs.
A linear mixed effects (LME) model was applied to the Illumina Infmium
HumanMethylation27 WBC lineage as the fixed effect and beadchip plate as the random effect. The fixed effect groups were: Pan-T cell, CD4+ T cell, CD8+ T cell, Pan-NK cell, CD56dim NK cell, CD56bnght NK cell, B cell, granulocyte, neutrophil, eosinophil, and monocyte. Across all gene loci, this model generated coefficients for each fixed effect group indicating relative estimates of DNA methylation for each of the different cell types. Collapsing categories accounted for the hierarchical relationships among cell lineages and a linear transformation was applied to convert coefficient estimates to estimated mean value per cell type, resulting in a
matrix B0 of mean values, each row corresponding to a CpG locus and each column corresponding to a cell type. The model also generated an F-statistic for each locus that indicates how significantly different DNA methylation was between the cell types.
A stochastic search algorithm was then employed to select the differentially methylated regions (DMRs) that work best in concert on a custom microarray to distinguish leukocyte lineages, and would therefore be the most effective at quantifying immune ceil types in a biological sample. The objective was to ascertain which 96 CpGs would give optimal precision for all of the WBC types.
The stochastic search algorithm was designed to maximize precision of estimated cellular fractions, under the assumption that the variance-covariance of the fraction estimates is proportional to (BjB0)~' . To optimize precision for a single individual cell type, the corresponding diagonal element of (BjB,,)'1 was minimized; to optimize a set of cell types, the sum of the corresponding diagonal elements was minimized.
The general strategy was as follows. The engine is a stochastic search algorithm that starts with an initial set of CpGs, which is the beginning choice for the "current" set. On each iteration a randomly chosen CpG from the current set is switched out with a randomly chosen CpG from the remaining (unselected) CpGs, and precision is compared between the current set and the "candidate" set. If the candidate set gives better precision then the switch is accepted. Otherwise it is rejected. Ideally, by the end of the algorithm, the acceptance rate should be 0%.
The algorithm was run for 50,000 iterations starting with the 500 CpGs having the best F statistics. This was repeated ten times with different random number seeds each time. Then, the algorithm was run for 50,000 iterations starting with the CpGs having the 500 largest absolute effect sizes (coefficients generated by the LME model) for the WBC types. This was also repeated ten times with different random number seeds each time. Next all 20 runs were compared and the algorithm run for 50,000 iterations starting with the 500 most frequently chosen CpGs from the previous 20 runs. This was repeated five times with different random number seeds each time. Finally, a run was performed for 750,000 iterations starting with the 96 most frequently chosen CpGs from the previous five runs. Example 38: Mediation analysis for estimating effects of an exposure or phenotype on measured DNA methylation
A method is described for conducting a mediation analysis to estimate the effects of an exposure or to estimate the effects of a specific phenotype on measured DNA methylation along two paths: through changes in WBC distribution, and directly, unmediated by changes in WBC
distribution. Most Epigenome-wide association scans (EWAS) have attempted to estimate the marginal effect (β , depicted in Figure 41, panel A) on measured DNA methylation, which are effects not adjusted for WBC distribution. However, a significant portion of the effect on DNA methylation is mediated through changes in WBC distribution as shown in Figure 41, panel B. Of interest in EWAS studies is a , the direct effect adjusted for WBC distribution. Estimating this effect requires estimation of two other quantities, Γ , the effect of exposure or phenotype on WBC distribution, and ξ , the effect of WBC distribution on methylation. If y is the DNA methylation measured for subject at a particular CpG site (j , subscript suppressed for clarity), z( is a p x 1 matrix of covariates for subject i (including the exposure or phenotype of interest), and (oj is the subject-specific WBC distribution estimated using constrained projection in the manner described in Example 1 then yi = x a + ω,1 ξ + ef , where et is a zero-mean error.
Additionally, the effect of exposure/phenotype on WBC distribution can be modeled as ω, = Γζ + u( , where u( is a zero-mean error vector. It is noted that a is a p x 1 vector, and K cell types are assumed, so that ω, is &K x 1 vector, Γ is a K x p matrix, and ξ is a K x 1 vector. It follows that y - z (a + Γ 'ξ) + + e, , so that the marginal effect β is the p x l vector α + Γτξ . Estimation proceeds first by computing Γ = (^ '^ co,z, ^'', , z^z. \ , then computing ΰ, = ω, - Γζ, , i- = (z,1 , a )τ , ξ = r,1 r; ) (^"=i rjyi ), extracting ξ as the last K components of ζ and obtaining ά by subtracting τξ from the first p components of ζ .
Statistical inference is achieved by permutation. Specifically, the null distributions of a and Γ are obtained by permuting the exposure or phenotype of interest within z (only the components representing the covariate to be tested), and the null distribution of ξ is obtained by permuting the subject assignments corresponding to o)t . Adjustments for multiple comparisons are achieved by nesting within each permutation a loop that estimates ά . , Γ; , and ξ7 for each individual CpG , with adjusted p-values obtained by comparing the maximum absolute values of a j , Tj , and ξ . (over all CpGs ) to the corresponding statistics computed from each individual permutation. For comparison purposes, a similar permutation test can be applied for the marginal coefficient β .
This method to a data set consisting of n=205 control subjects in a bladder cancer case/control study (Karagas MR et al., 1998, Environ Health Perspect 106: 1047-1050). Four separate analyses were performed: (1) the phenotype of interest was age; (2) the exposure of
interest was current smoker status; (3) the exposure of interest was toenail arsenic; and (4) the exposure of interest was reported use of hair dye. Sex was included as a covariate in all analyses, and age was included in (2)-(4).
The relationship between a and β for the covariate of interest over all autosomal CpGs is shown in Figure 42. Dots represents overall methylation as indicated by the first component of the coefficient vector β , corresponding to the intercept (light=low, black=moderate, dark=high). The diagonal straight line represents the identity (ά = /? ). The curve depicts a loess fit to the scatter plot. In all cases there is an S-shaped relationship that shows attenuation of effect ( tends to be smaller than β ). Table 28 shows the multiple-comparisons adjusted p- values for each coefficient corresponding to the covariate of interest ( β , a , γ ) and overall WBC distribution effect on DNA methylation (ξ ), obtained by permutation test using 5000 permutations. As shown in the table, significance of a may be greater than, less than, or equal to the significance of β . Remarkably, in every case, the covariate of interest shows a strongly significant association with WBC distribution. It is noted that WBC shows significant overall association with DNA methylation.
Table. 28. Multiple-comparisons adjusted p-values

Example 39: Comparison of methods herein for estimating fractions of blood cell types with non-negative matrix factorization (NNMF)
The methods herein are predicated on the relationship E(Yt ) = , where Y; is a

vector of DNA methylation measurements obtained for subject i, do is the number of blood cell types to be assayed, ωϋ are the fractions of each blood cell type corresponding to subject i, and b, is the vector of methylation fractions corresponding to blood cell type /; the methods herein provide techniques for estimating the fractions ωα assuming the values of b, have been obtained from an external validation data set. In contrast, non-negative matrix factorization
(NNMF) could be used to estimate oa and b, simultaneously in absence of an external validation set. In the context of NNMF, the do vectors ω„, are considered "factors", and the o vectors (assumed to represent individual methylation profiles) are considered "basis vectors" and the number of factors d0 must be provided to the NNMF algorithm.
Using the 12 experimental samples described in Example 5 NNMF was compared to methods herein (Examples 1-3). Highest ranking 100 and 500 pseudo-DMRs were selected on the basis of informativeness as in Example 4; for each choice, the constrained projection described in Examples 1 and 5 was used to impute specific cell distributions, then NNMF was performed assuming four, five, and six factors (i.e. factor values assumed to represent the fractions ω„ for one cell type I). The nmf function in the R package NMF was used with default settings. Since NNMF requires random inputs, NNMF was applied 100 times, each with different randomly generated starting values according to the default settings of the nmf function. Six cases were considered, viz., 100 CpGs and 500 CpGs for each of four, five and six factors. For each of the 100 runs in each of the six cases, the fitted factors ω,, (values of which were assumed to correspond to fractions ωα ) were correlated to expected fractions of B cells, T cells, monocytes, and granulocytes, and for each specific cell type, the factor with the maximum correlation to that type was assigned to it. Then, for each cell type in each case, the median correlation with assigned factor was tabulated. Table 29 below reports these median values, and Table 30 reports the correlation between expected fraction and the fraction observed using methods herein. A comparison of these tables demonstrates that, though NNMF can achieve high correlation with expected cell fraction if the pseudo-DMRs are known in advance, the methods described herein in Examples 1 -4 still achieves higher correlation. In addition, NNMF occasionally fails to match known cell types to imputed cell types in a monomorphic manner. Table 31 reports the percentage of runs for which at least two different cell types were matched via NNMF to the same factor.
It is expected that NNMF would behave less favorably than methods described herein (Examples 1 -4), since NNMF requires the estimation of (n + M) F unknown parameters (where n = # of target samples, M = # of CpGs, and F = # of factors) and methods herein require the estimation of only n K unknown parameters, where K < F and is the number of known cell types.
Table 29. Median correlation for two different sets of CpG containing sequences
100 CpGs
Factors = 4 Factors = 5 Factors = 6
B cells 0.998 0.996 0.996
T cells 0.988 0.989 0.990
Monocytes 0.832 0.900 0.927
Granulocytes 0.967 0.954 0.963
500 CpGs

Table 30. Correlation between expected fraction and the fraction observed using methods herein.

Table 31. Percentage of runs for which at least two different cell types were matched to the same factor

Example 40: Quantitation of T cell Treg and CD16+CD56d"n NK cell numbers by CD3Z.
FoxP3 and NKp46 methylation assays, respectively using droplet digital PCR
A droplet digital PCR technique was used to quantitate T cell, Treg and CD16+CD56dim NK cell numbers using CD3Z, FoxP3 and NKp46 methylation assays described in Examples 15 and 30. Digital PCR (dPCR) is a refinement of conventional PCR methods and is used to directly quantify and clonally amplify nucleic acids. dPCR and traditional PCR differ in method
of measuring nucleic acid amounts, as dPCR is more precise. The two PCR methods differ in that the sample is separated into a large number of partitions in dPCR, and the reaction in each partition is carried out individually. This separation produces a more reliable collection and sensitive measurement of nucleic acid amounts.
Isolated and purified T cells and Tregs were serially diluted, and copies of each of the targets were quantified as measures of cell numbers. Bisulfite converted DNA from whole blood, isolated human T-cells and Treg cells and from N cells was quantified using the emulsion partitioning method of BioRad QX100™ Droplet Digital™ PGR (ddPCR™) system. This system creates portioned PCR reaction using water-in-oil droplets for performing high- throughput digital PCR. The QX100 droplet generator partitions samples into 20,000 nanoliter- sized droplets. After PCR using a thermal cycler, droplets from the samples were streamed in single file on a reader (QX100 droplet reader). The PCR-positive and PCR-negative droplets were counted to obtain quantification of target DNA in digital form. Results are shown in Figures 43-46 as dot plots of fluorescence intensities of the droplets, with each point on the plot representing a single droplet. The horizontal lines are cutoffs between "positive" and "negative" droplets for each sample. A measure of concentration of the target sequence (demethylated CD3Z, Fox3P or NKp46) in copies per microliter was obtained as readout from the system. Dividing target sequence concentration by total DNA concentration obtained by C-less PCR yielded the percent of total DNA that was positive for the target DNA region (Figures 45-46).
Figures 43 and 44 show that successful amplification and detection of CD3Z and Foxp3
DMRs, respectively were obtained. Panel A of Figures 43 and 44 show dot plots indicating distinguishing of positive droplets and negative droplets. Panel B of Figures 43 and 44 show the calculated absolute numbers of positive PCR droplets. Results obtained from dilution of standard purified T cells shows correspondence of quantities of CD3Z and FoxP3 genes with extent of dilution and hence validity of dPCR as a detection method for methylation based assay of immune cell identity. Other partitioning approaches have been developed that employ microfluidic manipulation and results similar to the data obtained herein are expected from the use of such other methods of partitioning. Figure 45 shows quantitation of purified NK cells under different conditions and Figure 46 shows quantitation of whole blood and of purified leukocyte subsets by measuring demethylated NKp46 DMR described in Example 30.
Claims
1 . A method for assessing a disease condition in a subject, comprising:
measuring a CD3Z positive T lymphocyte cell number in a sample from the subject by analyzing methylation in the sample of at least one CpG dinucleotide (CpG) in gene CD3Z or in an orthologous or a paralogous gene thereof, wherein an amount of a demethylated C of the at least one CpG in the sample is a measure of CD3+ T lymphocyte cell number; and
comparing the amount of the demethylated C in the sample from the subject with that in positive control samples from patients with the disease condition, and with that in negative control samples from healthy subjects, wherein the disease condition is selected from: an autoimmune disease, an allergy, a transplant rejection, obesity, an inherited disease,
immunosuppression and a cancer.
2. The method according to claim 1 , wherein assessing a disease condition comprises at least one of: monitoring, diagnosing, prognosing, and measuring response to therapy by comparing the measured CD3+ T lymphocyte cell numbers in the subject after therapy to that in the patients with the disease condition and in the healthy subjects.
3. The method according to claim 1, wherein the sample a fresh sample.
4. The method according to claim 1, wherein the sample an archival sample.
5. The method according to claim 1, wherein the amount of the demethylated C of the at least one CpG in the CD3Z gene in the sample is at least about 80%, at least about 90%, or at least about 95% of the total amount of the CpG in CD3Z genes in the sample.
6. The method according to claim 1 , wherein analyzing methylation of the CD3Z gene further comprises amplifying by Polymerase Chain Reaction (PCR) using primer pairs specific for amplification of specific demethylated CpG loci.
7. The method according to claim 1, wherein analyzing methylation of the CD3Z gene further comprises a method selected from the group of: Pyrosequencing, Methylation-sensitive single- nucleotide primer extension (Ms-SNuPE), Methylation-sensitive single stranded conformation analysis (MS-SSCA), High resolution melting analysis (HRM), and digital PCR methods comprising emulsion and nanofluidic partitioning.
8. The method according to claim 6 wherein amplification by PCR comprises monitoring quantitative PCR in real time using a MethyLight assay or digital PCR.
9. The method according to claim 7 wherein Methylation-sensitive single-nucleotide primer extension further comprises:
chemically converting lymphocyte derived whole genomic DNA with bisulfite;
amplifying chemically converted whole genomic DNA;
enzymatically fragmenting resulting amplified DNA;
hybridizing fragmented DNA to methylation sensitive CpG locus specific DNA oligomers; and
labeling by single-base extension using labeled nucleotides.
10. The method according to claim 1, further comprising analyzing methylation of differentially methylated regions (DMRs) of gene FOXP3 using primer pairs for amplification of specific loci of demethylated CpG.
1 1. The method according to claim 10 further comprising:
determining a ratio of CpG demethylation of FOXP3 gene DMR to the CpG
demethylation of CD3Z gene DMR, wherein the sample is a tumor infiltrate, and wherein the ratio is an index of T regulatory cell number to the total T cell number in the infiltrate; and providing a diagnosis of a pathological grade of the cancer, wherein the index of T regulatory cell number to the total T cell number in the tumor infiltrate correlates with the grade of the cancer.
12. The method according to claim 1 1 wherein the cancer is selected from: a glioma; an ovarian cancer; and a head and neck squamous cell cancer (HNSCC).
13. The method according to claim 1 further comprising prognosing survival of a patient having or needing a diagnosis of glioma or HNSCC, wherein the amount of demethylation of CD3Z gene DMR as a percent of total DNA greater than a median value in a sample population of subjects correlates with a prognosis of poor survival.
14. A kit for measuring CD3+ T lymphocyte and FOXP3+ T regulatory cell numbers, by analyzing methylation of CpG positions in CD3Z and FOXP3 genes, the kit comprising sequencing and PCR primers specific for the CD3Z and the FOXP3 gene DMRs and instructions for analyzing and comparing methylation of the CpG positions of a subject in need of diagnosis of a disease with that of control subjects.
15. A method for assessing a disease condition by estimating an alteration in proportions of types of leukocytes in a sample from a subject, the method comprising:
measuring a DNA methylation profile for each type of leukocyte and for unfractionated cells, wherein DNA methylation profiles are obtained for a plurality of CpG loci, and obtaining the status of an individual CpG locus by amplifying DNA from each of the types of leukocyte and from the unfractionated cells, wherein amplifying comprises hybridizing methylation sensitive locus-specific DNA oligomers corresponding to each CpG locus;
ordering CpG loci by ability to distinguish types of leukocytes, wherein the ordering of the CpG loci determines differentially methylated DNA regions (DMRs), wherein obtaining DMRs comprises statistically minimizing introduction of bias in amount of total methylation status of a large number of CpG loci obtained from the unfractionated cells by employing a
Bayesian treatment utilizing prior probabilities of the methylation status at each individual locus, thereby identifying a plurality of CpG loci to include in the measurement, wherein an amount of CpG loci distinguishes DMR signatures among the types of leukocytes and minimizes bias; obtaining DNA methylation profiles comprising DMRs from the types of leukocytes, wherein the DNA methylation profiles comprise validating measures of relative amounts of the types of leukocytes, and obtaining DNA methylation profiles of the unfractionated cells as surrogate measures of relative amounts of each type of leukocyte in the unfractionated cells; employing an analog of a measurement error model wherein a DNA methylation surrogate y is reverse formulated with respect to the disease outcome z, as
y=/(z),
wherein y denotes a multivariate random variable representing a methylation profile, z denotes a disease outcome or state, and / denotes a probability distribution; y, z, and leukocyte distribution, ω are related by the estimator equations,
E(y|oo)=g (ω), and
under an assumption E=(z|co,y) = Ε(ζ|ω), wherein E denotes an expectation of a random variable and ω denotes a subject specific distribution of leukocytes; and,
comparing relative amounts of each type of leukocyte in the sample from the subject with those in a control sample, thereby providing an assessment of the disease condition.
16. The method according to claim 15, wherein the locus-specific DNA oligomers are linked to an array selected from the group of: a glass slide array; a quartz slide array; a fiber optic bundle array, a planar slide array, a micro-well array; a multi-well dish array; a digital PCR array; and a bead array having beads located at known addressable locations on the array.
17. The method according to claim 15, wherein assessing a disease condition comprises at least one of: monitoring, diagnosing, prognosing, and measuring response to therapy of the disease condition.
18. The method according to claim 15, further comprising analyzing sensitivity for correcting bias, wherein the correcting bias is unrelated to measurement error and is related to errors arising from unprofiled cell types and non-cell mediated profile differences.
19. The method according to claim 15 wherein fractionated leukocyte types comprise at least one selected from: CD19+ B lymphocytes, CD15+ granulocytes, CD 14+ monocytes, CD56+
Natural Killer cells, and CD3+ T lymphocytes.
20. The method according to claim 17 wherein the disease condition is Head and Neck Squamous Cell Carcinoma (HNSCC).
21. The method according to claim 1, wherein the inherited disease is an aneuploidy.
22. The method according to claim 21, wherein the aneuploidy is selected from trisomy 21, Turner's syndrome, and Klinefelter's syndrome.
23. The method according to claim 15, wherein the control sample is taken from the subject at a different point in time, for prognosis of the course of the disease condition in the subject.
24. The method according to claim 15, further comprising after employing the measurement model, comparing the distribution of leukocytes to the relative amounts in the control sample as a normal standard, wherein the normal standard is a statistical measure obtained from a plurality of disease-free subjects.
25. The method according to claim 10, further comprising providing a diagnosis of
immunosuppression due to smoking in a currently smoking subject by:
determining a ratio of CpG demethylation of FOXP3 gene DMR to the CpG
demethylation of CD3Z gene DMR in blood in the currently smoking subject, wherein the ratio comprises an index of T regulatory cell number to the total T cell number; and
providing a diagnosis of immunosuppression in the currently smoking subject, wherein the value of the index of T regulatory cell number to the total T cell number in the currently smoking subject, greater than the average value in a sample population of currently nonsmoking subjects correlates with immunosuppression due to smoking.
26. The method according to claim 25, wherein the subject has cancer, an infection or need of a transplant.
27. A method of predicting a methylation class membership in a bodily fluid sample of a subject for assessing disease status of the subject, wherein the methylation class membership corresponds to an epigenetic signature of a plurality of leukocyte types, the method comprising: measuring amounts of DNA methylation in each of a plurality of leukocyte type populations to determine differentially methylated regions (DMRs);
ranking leukocyte DMRs for each leukocyte type according to statistical strength of association of the DMR with each leukocyte type;
randomly dividing a data set of control subjects and subjects with a disease into groups having substantially the same numbers of control subjects and subjects with the disease to obtain a training set and a testing set;
clustering samples in the training set using a defined number of highest ranked leukocyte DMRs to determine clustering solutions, wherein a clustering solution corresponds to the methylation class membership; and
predicting the methylation class membership for subjects within the testing set by applying the clustering solutions obtained from the training set to the highest ranked leukocyte DMRs in the testing set, wherein clinical utility of the predicted methylation class membership is determined by testing association of the predicted methylation class membership with the disease status of the subject.
28. The method according to claim 27, wherein the highest ranked leukocyte DMRs is shown in Table 21 , wherein each DMR is identified by chromosomal location and gene name , and the defined number of highest ranked leukocyte DMRs is selected from: at least 10, at least 20, at least 30, at least 40 and 50.
29. The method according to claim 27, wherein the bodily fluid sample is a fresh sample.
30. The method according to claim 27, wherein the bodily fluid is an archival sample.
31. The method according to claim 27, wherein the bodily fluid sample is blood.
32. The method according to claim 27, wherein the methylation class membership of the subject in the testing set is predicted using a naive Bayes classifier.
33. The method according to claim 27, wherein testing the association of the predicted methylation class with the disease status comprises using receiver operating characteristic curves (ROC) and the corresponding area under each curve.
34. The method according to claim 27, further comprising at least one of: diagnosing;
monitoring; prognosing; and measuring response to therapy of the disease status of the subject.
35. The method according to claim 27 wherein the leukocyte types are selected from the group of: Natural killer cells, B Cells, CD4+ T cells, CD8+ T cells, granulocytes, and monocytes.
36. The method according to claim 27, wherein the disease is one of: head and neck squamous cell carcinoma (HNSCC), ovarian cancer and bladder cancer.
37. An array for estimating proportions of leukocyte types in a sample from a mammal for assessing a disease condition of the mammal by analyzing differential methylation of CpG dinucleotides in a plurality of genes of the sample, the array comprising: a plurality of DNA probes attached to a plurality of surfaces at known addressable locations on the array, wherein the surface at each location is attached to a DNA probe having a specific nucleotide sequence, wherein the DNA probe having the specific nucleotide sequence hybridizes to a DNA sequence of a methylated form or an ummethylated form of a CpG dinucleotide in a sequence of a gene of the plurality of genes in the sample, wherein the array is selected from having: at least 16 probes, at least 64 probes, at least 96 probes, and at least 384 probes.
38. The array according to claim 37, wherein the plurality of DNA probes has nucleotide sequences that hybridize with a respective plurality of 96 different nucleotide sequences occurring in the plurality of genes.
39. The array according to claim 38, wherein the plurality of 96 nucleotide sequences comprises SEQ ID NO: 1 to SEQ ID NO: 96.
40. The array according to claim 37, wherein the addressable locations are wells of a substrate, wherein the substrate is selected from: glass slide; quartz slide; fiber optic bundle and planar silica slides.
41. The array according to claim 40, wherein the plurality of surfaces comprises particles added to the wells.
42, The array according to claim 40, wherein the surfaces comprise interior walls and sides of the wells.
43. The array according to claim 37, wherein the addressable locations are defined spots on a glass slide.
44. The array according to claim 41, wherein the particles are microbeads labeled with a code.
45. The array according to claim 41, wherein the particles are microbeads identifiable with inscribed holographic code.
46. The array according to claims 37, wherein the disease condition is selected from:
autoimmune disease, an allergy, a transplant rejection, obesity, an inherited disease, immunosuppression, and a cancer.
47. A method for estimating proportions of types of leukocytes in a sample from a subject for assessing a disease condition of the subject by analyzing differential methylation of CpG dinucleotides in a plurality of genes of the sample, the method comprising:
providing an array having a plurality of DNA probes attached to a plurality of surfaces at known addressable locations on the array, wherein the surface at each location is attached to a DNA probe having a specific nucleotide sequence; reacting genomic DNA in the sample with a bisulfite reagent to convert unmethylated cytosine residues to uracil;
hybridizing resulting bisulfite treated genomic DNA with the array to obtain resulting hybridized probes on the array, wherein the DNA probes hybridize to a DNA sequence of each of a methylated form and an ummethylated form of a sequence having a CpG dinucleotide in a gene for each of the plurality of genes; and
detecting the methylation status of each of the CpG dinucleotides in each sequence, thereby estimating proportions of types of leukocyte in the sample from the subject for assessing the disease condition of the subject.
48. The method according to claim 47, wherein detecting the methylation status of the CpG dinucleotide sequence further comprises:
extending each hybridized probe of the resulting hybridized probes on the array by primer extension to obtain a resulting primer extension product;
ligating the resulting primer extension product to an oligonucleotide complementary to the DNA sequence of a 3' region of the gene to obtain a resulting template for PCR on the array; and,
amplifying by PCR and measuring amount of resulting PCR product, thereby detecting the methylation status of the CpG dinuc leotide sequence.
49. The method according to claim 48, wherein amplifying by PCR further comprises:
using primers pairs having a 5' primer specific to each of the methylated or the unmethylated form of the CpG dinucleotide containing gene, and a 3 'primer specific to the gene containing the CpG dinucleotide, thereby obtaining a first PCR product;
amplifying the first PCR product with differentially labeled 5' primers specific for each of the methylated and the unmethylated form of the CpG dinucleotide sequence containing gene, and a common 3' primer, thereby obtaining a differentially labeled second PCR product, and hybridizing the second PCR product to the CpG dinucleotide containing gene for measuring amount of the second PCR product, thereby detecting the methylation status of the CpG dinucleotide sequence.
50. The method according to claim 47, wherein detecting the methylation status of the CpG dinucleotide sequence comprises extending the resulting hybridized probes on the array by- single base primer extension with a labeled nucleotide.
51. The method according to claim 47, wherein the array comprises at least 16 probes, at least 64, at least 96 probes or at least 384 probes.
52. The method according to claim 47, wherein the plurality of probes on the array hybridizes with a respective plurality of 96 different sequences occurring in the plurality of genes.
53. The method according to claim 52, wherein each probe on the array is complementary to nucleotide sequences having SEQ ID NO: 1 to SEQ ID NO: 96.
54. The method according to claim 47, wherein the disease condition assessed is selected from: an autoimmune disease, an allergy, a transplant rejection, obesity, an inherited disease, and a cancer.
55. The method according to claim 47, wherein assessing the disease condition using the array comprises at least one of: monitoring, diagnosing, prognosing, and measuring response to therapy by comparing estimated proportions of types of leukocytes of the subject after therapy to proportions of leukocytes from a healthy subject.
56. The method according to claims 47, wherein the sample is fresh.
57. The method according to claim 47, wherein the sample is archival.
58. The method according to claim 47, wherein leukocyte types comprise at least one selected from: CD 19+ B lymphocytes, CD15+ granulocytes, CD14+ monocytes, CD56+ Natural Killer cells, and CD3+ T lymphocytes.
59. A kit for estimating proportions of leukocyte types in a sample from a subject by analyzing differential methylation of CpG dinucleotides in a plurality of genes of the sample, the kit comprising:
an array comprising: a plurality of DNA probes attached to a plurality of surfaces at known addressable locations on the array, wherein the surface at each location is attached to a DNA probe having a specific nucleotide sequence, wherein the DNA probe having the specific nucleotide sequence hybridizes to a DNA sequence of a methylated form or an ummethylated form of a CpG dinucleotide in a sequence of a gene of the plurality of genes in the sample, wherein the array is selected from having: at least 16 probes, at least 64 probes, at least 96 probes, and at least 384 probes;
primers and reagents for detecting the hybridized probes and for detecting the reaction products derived from the hybridized probes; and
instructions for using the array with a bisulfite reagent, thereby providing an estimation of proportions of leukocyte types in the sample.
60. The kit according to claim 59, wherein the probes hybridize with a respective plurality of 96 different DNA sequences occurring in the plurality of genes.
61. The kit according to claim 59 wherein, the probes have nucleotide sequences complementary to SEQ ID NO: 1 to SEQ ID NO: 96.
62. The kit according to claim 59, wherein the instructions comprise methods for:
reacting genomic DNA in the sample with the bisulfite reagent to convert unmethylated cytosine residues to uracil;
hybridizing resulting bisulfite treated genomic DNA with probes immobilized to the surfaces to obtain resulting hybridized probes on the array, wherein the DNA probes hybridize to a DNA sequence of each of a methylated form and an ummethylated form of a CpG dinucleotide sequence in a gene of the plurality of genes; and
detecting the methylation status of the CpG dinucleotide sequence, thereby estimating proportions of leukocyte types in the sample from the subject for assessing the disease condition.
63. The kit according to claim 62, wherein the instructions further comprise:
extending each hybridized probe of the resulting hybridized probes on the array by primer extension to obtain a resulting primer extension product;
ligating the resulting primer extension product to an oligonucleotide complementary to the DNA sequence of a 3' region of the gene to obtain a resulting template for PCR on the array; and
amplifying by PCR and measuring amount of resulting PCR product, thereby detecting the methylation status of the CpG dinucleotide sequence.
64. The kit according to claim 63, wherein the instructions further describe methods for amplifying by PCR comprising: amplifying the resulting template on the array using primers pairs comprising a 5' primer specific to each of the methylated or the unmethylated form of the CpG dinucleotide containing gene, and a 3 'primer specific to the gene containing the CpG dinucleotide, thereby resulting in a first PCR product;
amplifying the resulting first PCR product with differentially labeled 5' primers that specifically amplify either the methylated or the unmethylated form of the CpG dinucleotide sequence containing gene, and a common 3' primer, resulting in a differentially labeled second PCR product, and hybridizing the second PCR product to the CpG dinucleotide containing gene for measuring amount of the second PCR product, thereby detecting the methylation status of the CpG dinucleotide sequence.
65. The kit according to claim 62, wherein the instructions further describe methods for detecting the methylation status of the CpG dinucleotide sequence by extending the resulting hybridized probes on the array by single base primer extension with a labeled nucleotide.
66. A method of treating a subject for a disease condition, wherein the subject is a human patient and wherein the disease condition is a cancer, the method comprising:
obtaining signatures comprising differentially methylated regions (DMRs) from types of leukocytes in a blood sample of the patient, the types of leukocytes comprising at least one selected from: CD19+ B lymphocyte, CD15+ granulocyte, CD14+ monocyte, CD56dim Natural Killer cell, CD56b 'sht Natural Killer cell, and CD3+ T lymphocyte; and from a healthy control human subject not having the cancer;
comparing a signature for a specific type of leukocyte in the patient with that in the healthy subject, wherein the signature for the specific type of leukocyte is an indication of amount of cells of the specific type of leukocyte circulating in blood, and wherein a decreased amount of the cells of the specific type of leukocyte circulating in the blood of the patient compared to the healthy subject is an indicium of the cancer; and,
administering a composition comprising the cells of the type of leukocyte to the patient, thereby increasing the amount of the cells of the type of leukocyte in the patient and treating the cancer.
67. The method according to claim 66, wherein the leukocyte type cell is the CD56dim Natural Killer cell.
68. The method according to claim 66 or 67, wherein the cancer is head and neck squamous cell carcinoma (HNSCC).
69. The method according to claim 67, wherein the DMR signature specific for CD56 ""Natural Killer cells comprises at least one CpG dinucleotide in a region near the promoter of gene
NKp46.
70. The method according to claim 67, wherein the DMR signature specific for CD56d™ Natural Killer cells comprises a CpG dinucleotide in a region near the promoter of the gene NKp46, wherein the methylation status of the CpG dinucleotide is quantified by methylation specific quantitative polymerase chain reaction (MS-qPCR) using primers and probes having SEQ ID NOs: 1 16-1 18 and 97-99.
71. The method according to claim 67, wherein the DMR signature specific for CD56dim Natural Killer cells is a CpG dinucleotide in a region near the promoter of the gene NKp46, wherein the methylation status of the CpG dinucleotide is quantified by digital PCR comprising emulsion and nanofluidic partitioning using primers and probes having SEQ ID NOs: 116-118 and 97-99.
72. The method according to claim 66, wherein the blood sample is archival.
73. The method according to claim 66, wherein the blood sample is fresh.
Priority Applications (4)
| Application Number | Priority Date | Filing Date | Title |
|---|---|---|---|
| CA2869295A CA2869295A1 (en) | 2011-05-25 | 2012-05-25 | Methods using dna methylation for identifying a cell or a mixture of cells for prognosis and diagnosis of diseases, and for cell remediation therapies |
| EP12789375.8A EP2714933A4 (en) | 2011-05-25 | 2012-05-25 | Methods using dna methylation for identifying a cell or a mixture of cells for prognosis and diagnosis of diseases, and for cell remediation therapies |
| US14/089,398 US20140178348A1 (en) | 2011-05-25 | 2013-11-25 | Methods using DNA methylation for identifying a cell or a mixture of cells for prognosis and diagnosis of diseases, and for cell remediation therapies |
| US15/271,909 US10619211B2 (en) | 2011-05-25 | 2016-09-21 | Methods using DNA methylation for identifying a cell or a mixture of cells for prognosis and diagnosis of diseases, and for cell remediation therapies |
Applications Claiming Priority (8)
| Application Number | Priority Date | Filing Date | Title |
|---|---|---|---|
| US201161489883P | 2011-05-25 | 2011-05-25 | |
| US61/489,883 | 2011-05-25 | ||
| US201161509644P | 2011-07-20 | 2011-07-20 | |
| US61/509,644 | 2011-07-20 | ||
| US201261585892P | 2012-01-12 | 2012-01-12 | |
| US61/585,892 | 2012-01-12 | ||
| US201261619663P | 2012-04-03 | 2012-04-03 | |
| US61/619,663 | 2012-04-03 |
Related Child Applications (1)
| Application Number | Title | Priority Date | Filing Date |
|---|---|---|---|
| US14/089,398 Continuation-In-Part US20140178348A1 (en) | 2011-05-25 | 2013-11-25 | Methods using DNA methylation for identifying a cell or a mixture of cells for prognosis and diagnosis of diseases, and for cell remediation therapies |
Publications (2)
| Publication Number | Publication Date |
|---|---|
| WO2012162660A2 true WO2012162660A2 (en) | 2012-11-29 |
| WO2012162660A3 WO2012162660A3 (en) | 2013-03-28 |
Family
ID=47218125
Family Applications (1)
| Application Number | Title | Priority Date | Filing Date |
|---|---|---|---|
| PCT/US2012/039699 WO2012162660A2 (en) | 2011-05-25 | 2012-05-25 | Methods using dna methylation for identifying a cell or a mixture of cells for prognosis and diagnosis of diseases, and for cell remediation therapies |
Country Status (3)
| Country | Link |
|---|---|
| EP (1) | EP2714933A4 (en) |
| CA (1) | CA2869295A1 (en) |
| WO (1) | WO2012162660A2 (en) |
Cited By (15)
| Publication number | Priority date | Publication date | Assignee | Title |
|---|---|---|---|---|
| US20140122382A1 (en) * | 2008-10-15 | 2014-05-01 | Eric A. Elster | Bayesian modeling of pre-transplant variables accurately predicts kidney graft survival |
| EP3382033A1 (en) * | 2017-03-30 | 2018-10-03 | Rheinisch-Westfälische Technische Hochschule (RWTH) Aachen | Method for determining blood counts based on dna methylation |
| DE102017125013A1 (en) | 2017-10-25 | 2019-04-25 | Epiontis Gmbh | MCC as an epigenetic marker for the identification of immune cells, in particular basophilic granulocytes |
| DE102017125019A1 (en) | 2017-10-25 | 2019-04-25 | Epiontis Gmbh | PDCD1 as an epigenetic marker for the identification of immune cells, in particular PD1 + cells |
| WO2019081642A1 (en) | 2017-10-26 | 2019-05-02 | Epiontis Gmbh | Endosialin (cd248) as epigenetic marker for the identification of immune cells, in particular naïve cd8+ t-cells |
| WO2019081707A1 (en) | 2017-10-27 | 2019-05-02 | Epiontis Gmbh | Amplicon region as epigenetic marker for the identification of non-classical monocytes |
| DE102017126248A1 (en) | 2017-11-09 | 2019-05-09 | Epiontis Gmbh | ERGIC1 as epigenetic marker for the identification of immune cells, in particular monocytic myeloid-derived suppressor cells (mMDSCs) |
| WO2019224014A1 (en) | 2018-05-25 | 2019-11-28 | Epiontis Gmbh | Cxcr3 as epigenetic marker for the identification of inflammatory immune cells, in particular cd8+ memory t cells |
| WO2020007951A1 (en) | 2018-07-05 | 2020-01-09 | Epiontis Gmbh | Epigenetic method to detect and distinguish ipex and ipex-like syndromes, in particular in newborns |
| DE102020108560A1 (en) | 2020-03-27 | 2021-09-30 | Precision For Medicine Gmbh | CBX6 as an epigenetic marker for the identification of immune cells, especially memory B cells |
| DE102020111423A1 (en) | 2020-04-27 | 2021-10-28 | Precision For Medicine Gmbh | MYH11 / NDE1 region as an epigenetic marker for the identification of endothelial progenitor cells (EPCs) |
| CN114703284A (en) * | 2022-04-15 | 2022-07-05 | 北京莱盟君泰国际医疗技术开发有限公司 | Blood free DNA methylation quantitative detection method and application thereof |
| CN116312794A (en) * | 2023-01-09 | 2023-06-23 | 哈尔滨医科大学 | Methylation sample clustering method fused with single cell analysis method |
| US11759476B2 (en) | 2020-12-14 | 2023-09-19 | Regeneron Pharmaceuticals, Inc. | Methods of treating metabolic disorders and cardiovascular disease with Inhibin Subunit Beta E (INHBE) inhibitors |
| CN116949156A (en) * | 2023-09-19 | 2023-10-27 | 美迪西普亚医药科技(上海)有限公司 | Analysis method for detecting human T cells in general way based on nucleic acid variants |
Family Cites Families (1)
| Publication number | Priority date | Publication date | Assignee | Title |
|---|---|---|---|---|
| PL1826279T3 (en) * | 2006-02-28 | 2011-11-30 | Univ Berlin Charite | Detection and quality control of regulatory T cells through DNA-methylation analysis of the FoxP3 gene |
-
2012
- 2012-05-25 CA CA2869295A patent/CA2869295A1/en not_active Abandoned
- 2012-05-25 WO PCT/US2012/039699 patent/WO2012162660A2/en unknown
- 2012-05-25 EP EP12789375.8A patent/EP2714933A4/en not_active Withdrawn
Non-Patent Citations (9)
| Title |
|---|
| ANDERSON ET AL., CURR OPIN LIPIDOL., vol. 21, 2011, pages 172 - 177 |
| CHRISTENSEN, B.C. ET AL., PLOS GENET, vol. 5, 2009, pages EL 000602 |
| CHUA ET AL., BRIT J CANCER, vol. 104, 2011, pages 1288 - 1295 |
| EADS CA ET AL., NUCL. ACIDS RES., vol. 28, no. 8, 2000, pages E32 - 00 |
| HANAHAN; WEINBERG, CELL, vol. 144, 2011, pages 646 - 74 |
| LYNCH ET AL., OBESITY, vol. 17, 2009, pages 601 - 5 |
| OSTRAND-ROSENBERG, CURR OPIN GENET DEV, vol. 18, 2008, pages 11 - 18 |
| SCHMIDL, C. ET AL., GENOME RES, vol. 19, 2009, pages 1165 - 1174 |
| See also references of EP2714933A4 |
Cited By (38)
| Publication number | Priority date | Publication date | Assignee | Title |
|---|---|---|---|---|
| US20140122382A1 (en) * | 2008-10-15 | 2014-05-01 | Eric A. Elster | Bayesian modeling of pre-transplant variables accurately predicts kidney graft survival |
| US9561006B2 (en) * | 2008-10-15 | 2017-02-07 | The United States Of America As Represented By The Secretary Of The Navy | Bayesian modeling of pre-transplant variables accurately predicts kidney graft survival |
| EP3382033A1 (en) * | 2017-03-30 | 2018-10-03 | Rheinisch-Westfälische Technische Hochschule (RWTH) Aachen | Method for determining blood counts based on dna methylation |
| WO2019081584A1 (en) | 2017-10-25 | 2019-05-02 | Epiontis Gmbh | Mcc as epigenetic marker for the identification of immune cells, in particular basophil granulocytes |
| DE102017125019A1 (en) | 2017-10-25 | 2019-04-25 | Epiontis Gmbh | PDCD1 as an epigenetic marker for the identification of immune cells, in particular PD1 + cells |
| WO2019081590A1 (en) | 2017-10-25 | 2019-05-02 | Epiontis Gmbh | Pdcd1 as epigenetic marker for the identification of immune cells, in particular pd1+ cells |
| DE102017125013B4 (en) | 2017-10-25 | 2019-10-17 | Epiontis Gmbh | MCC as an epigenetic marker for the identification of immune cells, in particular basophilic granulocytes |
| US11597975B2 (en) | 2017-10-25 | 2023-03-07 | Precision For Medicine Gmbh | PDCD1 as epigenetic marker for the identification of immune cells, in particular PD1+ cells |
| US11753683B2 (en) | 2017-10-25 | 2023-09-12 | Precision For Medicine Gmbh | MCC as epigenetic marker for the identification of immune cells, in particular basophil granulocytes |
| DE102017125013A1 (en) | 2017-10-25 | 2019-04-25 | Epiontis Gmbh | MCC as an epigenetic marker for the identification of immune cells, in particular basophilic granulocytes |
| DE102017125019B4 (en) | 2017-10-25 | 2019-10-17 | Epiontis Gmbh | PDCD1 as an epigenetic marker for the identification of immune cells, in particular PD1 + cells |
| WO2019081642A1 (en) | 2017-10-26 | 2019-05-02 | Epiontis Gmbh | Endosialin (cd248) as epigenetic marker for the identification of immune cells, in particular naïve cd8+ t-cells |
| DE102017125150A1 (en) | 2017-10-26 | 2019-05-02 | Epiontis Gmbh | Endosialin (CD248) as an epigenetic marker for the identification of immune cells, in particular naïver CD8 + T cells |
| US11667973B2 (en) | 2017-10-26 | 2023-06-06 | Precision For Medicine Gmbh | Endosialin (CD248) as epigenetic marker for the identification of immune cells, in particular naïve CD8+ t-cells |
| DE102017125150B4 (en) | 2017-10-26 | 2019-10-10 | Epiontis Gmbh | Endosialin (CD248) as an epigenetic marker for the identification of immune cells, in particular naïver CD8 + T cells |
| DE102017125335A1 (en) | 2017-10-27 | 2019-05-02 | Epiontis Gmbh | Amplicon region as an epigenetic marker for the identification of immune cells, especially non-classical monocytes |
| DE102017125335B4 (en) | 2017-10-27 | 2019-10-17 | Epiontis Gmbh | Amplicon region as an epigenetic marker for the identification of immune cells, especially non-classical monocytes |
| US11680294B2 (en) | 2017-10-27 | 2023-06-20 | Precision For Medicine Gmbh | Amplicon region as epigenetic marker for the identification of non-classical monocytes |
| WO2019081707A1 (en) | 2017-10-27 | 2019-05-02 | Epiontis Gmbh | Amplicon region as epigenetic marker for the identification of non-classical monocytes |
| DE102017126248B4 (en) | 2017-11-09 | 2019-10-17 | Epiontis Gmbh | ERGIC1 as epigenetic marker for the identification of immune cells, in particular monocytic myeloid-derived suppressor cells (mMDSCs) |
| WO2019091942A1 (en) | 2017-11-09 | 2019-05-16 | Epiontis Gmbh | ERGIC1 AS EPIGENETIC MARKER FOR THE IDENTIFICATION OF IMMUNE CELLS, IN PARTICULAR MONOCYTIC MYELOID-DERIVED SUPPRESSOR CELLS (mMDSCs) |
| DE102017126248A1 (en) | 2017-11-09 | 2019-05-09 | Epiontis Gmbh | ERGIC1 as epigenetic marker for the identification of immune cells, in particular monocytic myeloid-derived suppressor cells (mMDSCs) |
| WO2019224014A1 (en) | 2018-05-25 | 2019-11-28 | Epiontis Gmbh | Cxcr3 as epigenetic marker for the identification of inflammatory immune cells, in particular cd8+ memory t cells |
| DE102018112644B4 (en) | 2018-05-25 | 2020-06-10 | Epiontis Gmbh | CXCR3 as an epigenetic marker for the identification of inflammatory immune cells, in particular CD8 + memory T cells |
| WO2020007951A1 (en) | 2018-07-05 | 2020-01-09 | Epiontis Gmbh | Epigenetic method to detect and distinguish ipex and ipex-like syndromes, in particular in newborns |
| DE102020108560B4 (en) | 2020-03-27 | 2022-03-03 | Precision For Medicine Gmbh | CBX6 as an epigenetic marker for the identification of immune cells, especially memory B cells |
| WO2021191369A1 (en) | 2020-03-27 | 2021-09-30 | Precision For Medicine Gmbh | Cbx6 as epigenetic marker for the identification of immune cells, in particular memory b cells |
| DE102020108560A1 (en) | 2020-03-27 | 2021-09-30 | Precision For Medicine Gmbh | CBX6 as an epigenetic marker for the identification of immune cells, especially memory B cells |
| DE102020111423A1 (en) | 2020-04-27 | 2021-10-28 | Precision For Medicine Gmbh | MYH11 / NDE1 region as an epigenetic marker for the identification of endothelial progenitor cells (EPCs) |
| DE102020111423B4 (en) | 2020-04-27 | 2022-03-03 | Precision For Medicine Gmbh | MYH11/NDE1 region as an epigenetic marker for the identification of endothelial progenitor cells (EPCs) |
| WO2021219561A1 (en) | 2020-04-27 | 2021-11-04 | Precision For Medicine Gmbh | Myh11/nde1 region as epigenetic marker for the identification of endothelial progenitor cells (epcs) |
| US11759476B2 (en) | 2020-12-14 | 2023-09-19 | Regeneron Pharmaceuticals, Inc. | Methods of treating metabolic disorders and cardiovascular disease with Inhibin Subunit Beta E (INHBE) inhibitors |
| US11957704B2 (en) | 2020-12-14 | 2024-04-16 | Regeneron Pharmaceuticals, Inc. | Methods of treating metabolic disorders and cardiovascular disease with inhibin subunit beta E (INHBE) inhibitors |
| CN114703284A (en) * | 2022-04-15 | 2022-07-05 | 北京莱盟君泰国际医疗技术开发有限公司 | Blood free DNA methylation quantitative detection method and application thereof |
| CN116312794A (en) * | 2023-01-09 | 2023-06-23 | 哈尔滨医科大学 | Methylation sample clustering method fused with single cell analysis method |
| CN116312794B (en) * | 2023-01-09 | 2023-11-14 | 哈尔滨医科大学 | Methylation sample clustering method fused with single cell analysis method |
| CN116949156A (en) * | 2023-09-19 | 2023-10-27 | 美迪西普亚医药科技(上海)有限公司 | Analysis method for detecting human T cells in general way based on nucleic acid variants |
| CN116949156B (en) * | 2023-09-19 | 2023-12-08 | 美迪西普亚医药科技(上海)有限公司 | Analysis method for detecting human T cells in general way based on nucleic acid variants |
Also Published As
| Publication number | Publication date |
|---|---|
| EP2714933A2 (en) | 2014-04-09 |
| WO2012162660A3 (en) | 2013-03-28 |
| CA2869295A1 (en) | 2012-11-29 |
| EP2714933A4 (en) | 2014-12-31 |
Similar Documents
| Publication | Publication Date | Title |
|---|---|---|
| US10619211B2 (en) | Methods using DNA methylation for identifying a cell or a mixture of cells for prognosis and diagnosis of diseases, and for cell remediation therapies | |
| WO2012162660A2 (en) | Methods using dna methylation for identifying a cell or a mixture of cells for prognosis and diagnosis of diseases, and for cell remediation therapies | |
| Jamshidi et al. | Evaluation of cell-free DNA approaches for multi-cancer early detection | |
| ES2735993T3 (en) | Methods to predict the clinical outcome of cancer | |
| EP2569626B1 (en) | Methods and compositions for diagnosing conditions | |
| US9963747B2 (en) | Methods for the identification, assessment, and treatment of patients with cancer therapy | |
| EP3103046B1 (en) | Biomarker signature method, and apparatus and kits therefor | |
| US20180011106A1 (en) | Methods for identifying, diagnosing, and predicting survival of lymphomas | |
| Linton et al. | Acquisition of biologically relevant gene expression data by Affymetrix microarray analysis of archival formalin-fixed paraffin-embedded tumours | |
| EP3739595A2 (en) | Gene expression profile algorithm and test for determining prognosis of prostate cancer | |
| US20190100809A1 (en) | Algorithms for disease diagnostics | |
| JP2008521412A (en) | Lung cancer prognosis judging means | |
| US20140127690A1 (en) | Mutation Signatures for Predicting the Survivability of Myelodysplastic Syndrome Subjects | |
| US11661632B2 (en) | Compositions and methods for diagnosing lung cancers using gene expression profiles | |
| EP2785873A2 (en) | Methods of treating breast cancer with taxane therapy | |
| US20110070582A1 (en) | Gene Expression Profiling for Predicting the Response to Immunotherapy and/or the Survivability of Melanoma Subjects | |
| CA2890161A1 (en) | Biomarker combinations for colorectal tumors | |
| WO2019005764A1 (en) | Mhc-1 genotype restricts the oncogenic mutational landscape | |
| Zheng et al. | Heterozygous/dispermic complete mole confers a significantly higher risk for post-molar gestational trophoblastic disease | |
| JP2011509689A (en) | Molecular staging and prognosis of stage II and III colon cancer | |
| WO2014066984A1 (en) | Method for identifying a target molecular profile associated with a target cell population | |
| CA3041821A1 (en) | A method to measure myeloid suppressor cells for diagnosis and prognosis of cancer | |
| US20210079479A1 (en) | Compostions and methods for diagnosing lung cancers using gene expression profiles | |
| Goan et al. | Deregulated p21WAF1 overexpression impacts survival of surgically resected esophageal squamous cell carcinoma patients | |
| WO2007137366A1 (en) | Diagnostic and prognostic indicators of cancer |
Legal Events
| Date | Code | Title | Description |
|---|---|---|---|
| 121 | Ep: the epo has been informed by wipo that ep was designated in this application |
Ref document number: 12789375 Country of ref document: EP Kind code of ref document: A2 |
|
| NENP | Non-entry into the national phase |
Ref country code: DE |
|
| ENP | Entry into the national phase |
Ref document number: 2869295 Country of ref document: CA |