WO2011151825A2 - Diagnosis of cancer - Google Patents

Diagnosis of cancer Download PDF

Info

Publication number
WO2011151825A2
WO2011151825A2 PCT/IL2011/000426 IL2011000426W WO2011151825A2 WO 2011151825 A2 WO2011151825 A2 WO 2011151825A2 IL 2011000426 W IL2011000426 W IL 2011000426W WO 2011151825 A2 WO2011151825 A2 WO 2011151825A2
Authority
WO
WIPO (PCT)
Prior art keywords
infrared
analyzing
sample
spectrum
ftir
Prior art date
Application number
PCT/IL2011/000426
Other languages
French (fr)
Other versions
WO2011151825A3 (en
Inventor
Joseph Kapelushnik
Shaul Mordechai
Ilana Nathan
Udi Zelig
Rami Zigdon
Original Assignee
Todos Medical Ltd.
Priority date (The priority date is an assumption and is not a legal conclusion. Google has not performed a legal analysis and makes no representation as to the accuracy of the date listed.)
Filing date
Publication date
Application filed by Todos Medical Ltd. filed Critical Todos Medical Ltd.
Priority to RU2012157998/15A priority Critical patent/RU2012157998A/en
Priority to US13/701,262 priority patent/US9606057B2/en
Priority to JP2013513040A priority patent/JP2013533960A/en
Priority to EP11789348.7A priority patent/EP2577298B1/en
Publication of WO2011151825A2 publication Critical patent/WO2011151825A2/en
Publication of WO2011151825A3 publication Critical patent/WO2011151825A3/en
Priority to IL223237A priority patent/IL223237B/en
Priority to US15/443,674 priority patent/US20170176327A1/en
Priority to US16/789,978 priority patent/US11561174B2/en
Priority to US18/100,276 priority patent/US20230160822A1/en

Links

Classifications

    • GPHYSICS
    • G01MEASURING; TESTING
    • G01NINVESTIGATING OR ANALYSING MATERIALS BY DETERMINING THEIR CHEMICAL OR PHYSICAL PROPERTIES
    • G01N21/00Investigating or analysing materials by the use of optical means, i.e. using sub-millimetre waves, infrared, visible or ultraviolet light
    • G01N21/62Systems in which the material investigated is excited whereby it emits light or causes a change in wavelength of the incident light
    • G01N21/63Systems in which the material investigated is excited whereby it emits light or causes a change in wavelength of the incident light optically excited
    • GPHYSICS
    • G01MEASURING; TESTING
    • G01JMEASUREMENT OF INTENSITY, VELOCITY, SPECTRAL CONTENT, POLARISATION, PHASE OR PULSE CHARACTERISTICS OF INFRARED, VISIBLE OR ULTRAVIOLET LIGHT; COLORIMETRY; RADIATION PYROMETRY
    • G01J3/00Spectrometry; Spectrophotometry; Monochromators; Measuring colours
    • G01J3/28Investigating the spectrum
    • G01J3/42Absorption spectrometry; Double beam spectrometry; Flicker spectrometry; Reflection spectrometry
    • G01J3/433Modulation spectrometry; Derivative spectrometry
    • GPHYSICS
    • G01MEASURING; TESTING
    • G01NINVESTIGATING OR ANALYSING MATERIALS BY DETERMINING THEIR CHEMICAL OR PHYSICAL PROPERTIES
    • G01N15/00Investigating characteristics of particles; Investigating permeability, pore-volume, or surface-area of porous materials
    • G01N15/10Investigating individual particles
    • G01N15/14Electro-optical investigation, e.g. flow cytometers
    • G01N15/1456Electro-optical investigation, e.g. flow cytometers without spatial resolution of the texture or inner structure of the particle, e.g. processing of pulse signals
    • GPHYSICS
    • G01MEASURING; TESTING
    • G01NINVESTIGATING OR ANALYSING MATERIALS BY DETERMINING THEIR CHEMICAL OR PHYSICAL PROPERTIES
    • G01N21/00Investigating or analysing materials by the use of optical means, i.e. using sub-millimetre waves, infrared, visible or ultraviolet light
    • G01N21/17Systems in which incident light is modified in accordance with the properties of the material investigated
    • G01N21/25Colour; Spectral properties, i.e. comparison of effect of material on the light at two or more different wavelengths or wavelength bands
    • G01N21/31Investigating relative effect of material at wavelengths characteristic of specific elements or molecules, e.g. atomic absorption spectrometry
    • G01N21/35Investigating relative effect of material at wavelengths characteristic of specific elements or molecules, e.g. atomic absorption spectrometry using infrared light
    • G01N21/3563Investigating relative effect of material at wavelengths characteristic of specific elements or molecules, e.g. atomic absorption spectrometry using infrared light for analysing solids; Preparation of samples therefor
    • G01N2015/016
    • GPHYSICS
    • G01MEASURING; TESTING
    • G01NINVESTIGATING OR ANALYSING MATERIALS BY DETERMINING THEIR CHEMICAL OR PHYSICAL PROPERTIES
    • G01N15/00Investigating characteristics of particles; Investigating permeability, pore-volume, or surface-area of porous materials
    • G01N15/10Investigating individual particles
    • G01N2015/1006Investigating individual particles for cytology
    • GPHYSICS
    • G01MEASURING; TESTING
    • G01NINVESTIGATING OR ANALYSING MATERIALS BY DETERMINING THEIR CHEMICAL OR PHYSICAL PROPERTIES
    • G01N21/00Investigating or analysing materials by the use of optical means, i.e. using sub-millimetre waves, infrared, visible or ultraviolet light
    • G01N21/17Systems in which incident light is modified in accordance with the properties of the material investigated
    • G01N21/25Colour; Spectral properties, i.e. comparison of effect of material on the light at two or more different wavelengths or wavelength bands
    • G01N21/31Investigating relative effect of material at wavelengths characteristic of specific elements or molecules, e.g. atomic absorption spectrometry
    • G01N21/35Investigating relative effect of material at wavelengths characteristic of specific elements or molecules, e.g. atomic absorption spectrometry using infrared light
    • G01N2021/3595Investigating relative effect of material at wavelengths characteristic of specific elements or molecules, e.g. atomic absorption spectrometry using infrared light using FTIR
    • GPHYSICS
    • G01MEASURING; TESTING
    • G01NINVESTIGATING OR ANALYSING MATERIALS BY DETERMINING THEIR CHEMICAL OR PHYSICAL PROPERTIES
    • G01N2201/00Features of devices classified in G01N21/00
    • G01N2201/12Circuits of general importance; Signal processing

Definitions

  • Embodiments of the present invention relate generally to diagnosis and monitoring of cancer, and particularly to methods for diagnosis and monitoring of malignant solid tumors.
  • Infrared spectroscopy is a technique based on the absorption or reflection of infrared radiation by chemical substances; each chemical substance having unique absorption spectra.
  • Fourier Transform Infrared (FUR) spectroscopy is used to identify biochemical compounds and examine the biochemical composition of a biological sample.
  • FUR Fourier Transform Infrared
  • FTIR spectra are composed of absorption bands each corresponding to specific functional groups related to cellular components such as lipids, proteins, carbohydrates and nucleic acids. Processes such as carcinogenesis may trigger global changes in cancer cell biochemistry resulting in differences in the absorption spectra when analyzed by FTIR spectroscopy techniques.
  • FTIR spectroscopy is commonly used to distinguish between normal and abnormal tissue by analyzing the changes in absorption bands of macromolecules such as lipids, proteins, carbohydrates and nucleic acids. Additionally, FTIR spectroscopy may be utilized for evaluation of cell death mode, cell cycle progression and the degree of maturation of hematopoietic cells.
  • methods and systems are provided for the diagnosis and monitoring of multiple types of malignant neoplasms, particularly malignant solid tumors.
  • some applications of the present invention comprise diagnosis and monitoring of a pre-malignant condition.
  • TBIA Total Biochemical Infrared Analysis
  • IR infrared
  • FTIR FTIR spectroscopy
  • microspectroscopy of global biochemical properties of blood-derived mononuclear cells for the detection of solid tumors.
  • FTER Optical Diagnosis Technology (FODT) analysis of biochemical changes in a Peripheral Blood Mononuclear Cells (PBMC) sample of a patient can indicate the presence of a solid tumor and/or a pre-malignant condition.
  • FODT FTER Optical Diagnosis Technology
  • PBMC PBMC from a plurality of cancer patients each suffering from a solid tumor (e.g., in the breast, pancreas, lung, head and neck, prostate, ovary, and gastrointestinal tract) is analyzed by FTIR microspectroscopy techniques. Subsequently, the FTIR spectra (absorption and/or reflection) of the PBMC samples of the cancer patients are compared to the FTIR spectra of PBMC samples obtained from the controls.
  • a solid tumor e.g., in the breast, pancreas, lung, head and neck, prostate, ovary, and gastrointestinal tract
  • PBMC samples obtained from cancer patients suffering from a malignant solid tumor produce FTIR spectra that differ from those of the control individuals who do not suffer from a malignant solid tumor, allowing distinguishing between the cancer patients and controls.
  • some applications of the present invention can be used to diagnose cancer patients suffering from various types of malignancies, particularly solid tumors.
  • the distinction by FTIR spectroscopy between controls and patients suffering from solid tumors is typically performed based on analysis of PBMC and not of the actual tumor cells.
  • a data processor analyzes the IR spectrum, e.g., the FTIR spectrum, of the PBMC sample of a subject. Information from the data processor is typically fed into an output unit that generates a result indicative of the presence of a solid tumor and/or a pre- malignant condition, based on the infrared (IR) spectrum. Additionally, the data processor is typically configured to calculate a second derivative of the infrared (IR) spectrum of the PBMC sample and, based on the second derivative of the infrared (IR) spectrum, to generate an output indicative of the presence of a solid tumor.
  • IR infrared
  • PBMC obtained from each cancer patient suffering from a solid tumor produced an FTIR spectrum having a unique spectral pattern which is characteristic of the type of malignancy, e.g., breast, lung, prostate or gastrointestinal, and distinct from spectra of other malignancy types.
  • IR spectroscopy e.g., FTIR spectroscopy
  • FTIR spectroscopy and microspectroscopy
  • Early detection of cancer generally enables early intervention and treatment, contributing to a reduced mortality rate.
  • IR infrared
  • generating the output includes generating the output indicative of the presence of the solid tumor.
  • analyzing the sample by infrared (IR) spectroscopy includes analyzing the sample by Fourier Transformed Infrared (FTIR) spectroscopy, and obtaining the infrared (IR) spectrum includes obtaining a Fourier Transformed Infrared (FTIR) spectrum.
  • FTIR Fourier Transformed Infrared
  • analyzing the sample by infrared (IR) spectroscopy includes analyzing the sample by Fourier Transformed Infrared microspectroscopy (FTTR-MSP).
  • analyzing includes assessing a characteristic of the sample at at least one wavenumber selected from the group consisting of: 765 ⁇ 4 cm-1, 798 ⁇ 4 cm-1, 809 ⁇ 4 cm-1, 814 ⁇ 4 cm-1, 875 ⁇ 4 cm-1, 997 ⁇ 4 cm-1, 1001 ⁇ 4 cm-1, 1015 ⁇ 4 cm-1, 1103 ⁇ 4 cm-1, 1118 ⁇ 4 cm-1, 1162 ⁇ 4 cm-1, 1221 ⁇ 4 cm-1, 1270 ⁇ 4 cm-1, 1283 ⁇ 4 cm-1, 1295 ⁇ 4 cm-1, 1315 ⁇ 4 cm-1, 1341 ⁇ 4 cm-1, 1367 ⁇ 4 cm-1, 1392 ⁇ 4 cm-1, 1429 ⁇ 4 cm-1, 1440 ⁇ 4 cm-1, 1445 ⁇ 4 cm-1 and 1455 ⁇ 4 cm-1.
  • analyzing includes assessing the characteristic at at least two wavenumbers selected from the group.
  • analyzing includes assessing the characteristic at at least three wavenumbers selected from the group.
  • assessing the characteristic includes analyzing a band of the IR spectrum surrounding at least one wavenumber selected from the group.
  • analyzing the sample includes obtaining a second derivative of the infrared (IR) spectrum of the sample.
  • the infrared (IR) spectrum includes an absorption spectrum
  • obtaining the infrared (IR) spectrum includes obtaining the absorption spectrum
  • the infrared (IR) spectrum includes a reflection spectrum
  • obtaining the infrared (IR) spectrum includes obtaining the reflection spectrum
  • generating the output includes indicating via the output whether the solid tumor is a first type of solid tumor or a second type of solid tumor.
  • the solid tumor includes a solid tumor in tissue selected from the group consisting of: head and neck, esophagus, and pancreas, and generating the output includes generating an output indicative of the presence of a solid tumor in tissue selected from the group.
  • the solid tumor includes a solid tumor in tissue selected from the group consisting of: breast, gastrointestinal tract, prostate, and lung, and generating the output includes generating an output indicative of the presence of a solid tumor in tissue selected from the group.
  • analyzing includes assessing a characteristic of the sample at at least one wavenumber selected from the group consisting of: 752 ⁇ 4 cm-1, 1030 ⁇ 4 cm-1, 1046 ⁇ 4 cm-1, 1128 ⁇ 4 cm-1, and 1237 ⁇ 4 cm-1, and generating includes generating an output indicative of the presence of a tumor in the breast tissue.
  • analyzing includes assessing a characteristic of the sample at at least one wavenumber selected from the group consisting of: 797 ⁇ 4 cm-1, 830 ⁇ 4 cm-1, 893 ⁇ 4 cm-1, 899 ⁇ 4 cm-1, 1128 ⁇ 4 cm-1, 1298 ⁇ 4 cm-1, 1354 ⁇ 4 cm-1, 1714 ⁇ 4 cm-1 1725 ⁇ 4 cm-1, 1738, ⁇ 4 cm-1, and 3013 ⁇ 4 cm-1, and generating includes generating an output indicative of the presence of a tumor in the gastrointestinal tract tissue.
  • analyzing includes assessing a characteristic of the sample at at least one wavenumber selected from the group consisting of: 765 ⁇ 4 cm-1, 780 ⁇ 4 cm-1, 797 ⁇ 4 cm-1, 851 ⁇ 4 cm-1, 874 ⁇ 4 cm-1, 881 ⁇ 4 cm-1, 913 ⁇ 4 cm-1, 923 ⁇ 4 cm-1, 958 ⁇ 4 cm-1, 968, ⁇ 4 cm-1, 1044 ⁇ 4 cm-1, 1085 ⁇ 4 cm-1, 1191 ⁇ 4 cm-1, 1241 ⁇ 4 cm-1, 1344 ⁇ 4 cm-1, 1373 ⁇ 4 cm-1, 1417 ⁇ 4 cm-1, 1458 ⁇ 4 cm-1, 1469 ⁇ 4 cm-1, 1692 ⁇ 4 cm-1, 1714 ⁇ 4 cm-1, 1728 ⁇ 4 cm-1, 2852 ⁇ 4 cm-1, and 2984 ⁇ 4 cm, and generating includes generating an output indicative of the presence of a tumor in the lung tissue.
  • analyzing includes assessing a characteristic of the sample at at least one wavenumber selected from the group consisting of: 828 ⁇ 4 cm-1, 932 ⁇ 4 cm-1, 997 ⁇ 4 cm-1, 1059 ⁇ 4 cm-1, 1299 ⁇ 4 cm-1, 1302 ⁇ 4 cm-1, 1403 ⁇ 4 cm-1, 1454 ⁇ 4 cm-1, 1714 ⁇ 4 cm-1, 2979, ⁇ 4 cm-1, and 3013 ⁇ 4 cm-1, and generating includes generating an output indicative of the presence of a tumor in the prostate tissue.
  • IR infrared
  • generating the output includes generating the output indicative of the presence of the solid tumor.
  • analyzing the sample by infrared (IR) spectroscopy includes analyzing the sample by Fourier Transformed Infrared (FTIR) spectroscopy, and obtaining the infrared (IR) spectrum includes obtaining a Fourier Transformed Infrared (FTIR) spectrum.
  • analyzing the sample by infrared (IR) spectroscopy includes analyzing the sample by Fourier Transformed Infrared microspectroscopy (FTIR-MSP).
  • PBMC Peripheral Blood Mononuclear Cells
  • analyzing the first and second PBMC samples by IR spectroscopy includes analyzing the samples by Fourier Transformed Infrared spectroscopy, and obtaining the IR spectra includes obtaining Fourier Transformed Infrared (FTIR) spectra.
  • FTIR Fourier Transformed Infrared
  • analyzing the first and second PBMC samples by infrared (IR) spectroscopy includes analyzing the first and second PBMC samples by Fourier Transformed Infrared microspectroscopy (FTIR-MSP).
  • IR infrared
  • FTIR-MSP Fourier Transformed Infrared microspectroscopy
  • the method includes obtaining an IR spectrum of a third PBMC sample separated from blood of the subject that was obtained following termination of the treatment, by analyzing the third PBMC sample by IR spectroscopy.
  • analyzing includes assessing a characteristic of the sample at at least one wavenumber selected from the group consisting of: 765 ⁇ 4 cm-1, 798 ⁇ 4 cm-1, 809 ⁇ 4 cm-1, 814 ⁇ 4 cm-1, 875 ⁇ 4 cm-1, 997 ⁇ 4 cm-1, 1001 ⁇ 4 cm-1, 1015 ⁇ 4 cm-1, 1103 ⁇ 4 cm-1, 1118 ⁇ 4 cm-1, 1162 ⁇ 4 cm-1, 1221 ⁇ 4 cm-1, 1270 ⁇ 4 cm-1, 1283 ⁇ 4 cm-1, 1295 ⁇ 4 cm-1, 1315 ⁇ 4 cm-1, 1341 ⁇ 4 cm-1, 1367 ⁇ 4 cm-1, 1392 ⁇ 4 cm-1, 1429 ⁇ 4 cm-1, 1440 ⁇ 4 cm-1, 1445 ⁇ 4 cm-1, and 1455 ⁇ 4 cm-1.
  • analyzing includes assessing the characteristic at at least two wavenumbers selected from the group. For some applications, analyzing includes assessing the characteristic at at least three wavenumbers selected from the group.
  • IR infrared
  • generating the output includes generating the output indicative of the presence of the solid tumor.
  • a system for diagnosing a solid tumor including:
  • a data processor configured to analyze an infrared (IR) spectrum of a Peripheral Blood Mononuclear Cells (PBMC) sample of a subject;
  • an output unit configured to generate an output indicative of the presence of a solid tumor, based on the infrared (IR) spectrum.
  • the data processor is configured to calculate a second derivative of the infrared (IR) spectrum of the PBMC sample and, based on the second derivative of the infrared (IR) spectrum, to generate an output indicative of the presence of a solid tumor.
  • IR infrared
  • the IR spectrum includes a Fourier Transformed Infrared (FTIR) spectrum
  • the data processor is configured to calculate a second derivative of the FTIR spectrum.
  • FTIR Fourier Transformed Infrared
  • the data processor is configured to analyze the infrared (IR) spectrum by assessing a characteristic of the PBMC sample at at least one wavenumber selected from the group consisting of: 765 ⁇ 4 cm-1, 798 ⁇ 4 cm-1, 809 ⁇ 4 cm-1, 814 ⁇ 4 cm-1 , 875 ⁇ 4 cm-1, 997 ⁇ 4 cm-1, 1001 ⁇ 4 cm-1, 1015 ⁇ 4 cm-1, 1103 ⁇ 4 cm-1 , 1 118 ⁇ 4 cm-1, 1 162 ⁇ 4 cm-1, 1221 ⁇ 4 cm-1, 1270 ⁇ 4 cm-1, 1283 ⁇ 4 cm-1, 1295 ⁇ 4 cm-l, 1315 ⁇ 4 cm-1, 1341 ⁇ 4 cm- 1, 1367 ⁇ 4 cm- 1, 1392 ⁇ 4 cm-1, 1429 ⁇ 4 cm- 1, 1440 ⁇ 4 cm-1, 1445 ⁇ 4 cm-1, and 1455 ⁇ 4 cm-1.
  • the data processor is configured to analyze the infrared (IR)
  • the data processor is configured to analyze the infrared (IR) spectrum by assessing the characteristic at at least three wavenumbers selected from the group.
  • IR infrared
  • a computer program product for administering processing of a body of data including a computer-readable medium having program instructions embodied therein, which instructions, when read by a computer, cause the computer to:
  • IR infrared
  • PBMC Peripheral Blood Mononuclear Cells
  • IR infrared
  • analyzing includes assessing a characteristic of the sample at at least one wavenumber selected from the group consisting of: 752 ⁇ 4 cm-1, 1030 ⁇ 4 cm-1, 1046 ⁇ 4 cm-1, 1128 ⁇ 4 cm-1, and 1237 ⁇ 4 cm-1.
  • analyzing includes assessing the characteristic at at least two wavenumbers selected from the group.
  • analyzing includes assessing the characteristic at at least three wavenumbers selected from the group.
  • analyzing the sample by infrared (IR) spectroscopy includes analyzing the sample by Fourier Transformed Infrared (FTIR) spectroscopy, and obtaining the infrared (IR) spectrum includes obtaining a Fourier Transformed Infrared (FTIR) spectrum.
  • analyzing the sample by infrared (IR) spectroscopy includes analyzing the sample by Fourier Transformed Infrared microspectroscopy (FTIR- SP).
  • IR infrared
  • analyzing includes assessing a characteristic of the sample at at least one wavenumber selected from the group consisting of: 797 ⁇ 4 cm-l, 830 ⁇ 4 cm-l, 893 ⁇ 4 cm-l, 899 ⁇ 4 cm-l, 1128 ⁇ 4 cm-l, 1298 ⁇ 4 cm-l, 1354 ⁇ 4 cm-l, 1714 ⁇ 4 cm-l 1725 ⁇ 4 cm-l, 1738, ⁇ 4 cm-l, and 3013 ⁇ 4 cm-l.
  • analyzing includes assessing the characteristic at at least two wavenumbers selected from the group.
  • analyzing includes assessing the characteristic at at least three wavenumbers selected from the group.
  • analyzing the sample by infrared (IR) spectroscopy includes analyzing the sample by Fourier Transformed Infrared (FTIR) spectroscopy, and obtaining the infrared (IR) spectrum includes obtaining a Fourier Transformed Infrared (FTIR) spectrum.
  • FTIR Fourier Transformed Infrared
  • analyzing the sample by infrared (IR) spectroscopy includes analyzing the sample by Fourier Transformed Infrared microspectroscopy (FTIR-MSP).
  • FTIR-MSP Fourier Transformed Infrared microspectroscopy
  • IR infrared
  • analyzing includes assessing a characteristic of the sample at at least one wavenumber selected from the group consisting of: 765 ⁇ 4 cm-1, 780 ⁇ 4 cm-1, 797 ⁇ 4 cm-1, 851 ⁇ 4 cm-1, 874 ⁇ 4 cm-1, 881 ⁇ 4 cm-1, 913 ⁇ 4 cm-1, 923 ⁇ 4 cm-1, 958 ⁇ 4 cm-1, 968, ⁇ 4 cm-1, 1044 ⁇ 4 cm-1, 1085 ⁇ 4 cm-1, 1191 ⁇ 4 cm-1, 1241 ⁇ 4 cm-1, 1344 ⁇ 4 cm-1, 1373 ⁇ 4 cm-1, 1417 ⁇ 4 cm-1, 1458 ⁇ 4 cm-1, 1469 ⁇ 4 cm-1, 1692 ⁇ 4 cm-1, 1714 ⁇ 4 cm-1, 1728 ⁇ 4 cm-1, 2852 ⁇ 4 cm-1, and 2984 ⁇ 4 cm.
  • analyzing includes assessing the characteristic at at least two wavenumbers selected from the group.
  • analyzing includes assessing the characteristic at at least three wavenumbers selected from the group.
  • analyzing the sample by infrared (IR) spectroscopy includes analyzing the sample by Fourier Transformed Infrared (FTER.) spectroscopy, and obtaining the infrared (IR) spectrum includes obtaining a Fourier Transformed Infrared (FTIR) spectrum.
  • FTER. Fourier Transformed Infrared
  • FTIR Fourier Transformed Infrared
  • analyzing the sample by infrared (IR) spectroscopy includes analyzing the sample by Fourier Transformed Infrared microspectroscopy (FTIR-MSP).
  • FTIR-MSP Fourier Transformed Infrared microspectroscopy
  • IR infrared
  • analyzing includes assessing a characteristic of the sample at at least one wavenumber selected from the group consisting of: 828 ⁇ 4 cm-1, 932 ⁇ 4 cm-1, 997 ⁇ 4 cm-1, 1059 ⁇ 4 cm-1, 1299 ⁇ 4 cm-1, 1302 ⁇ 4 cm-1, 1403 ⁇ 4 cm-1, 1454 ⁇ 4 cm-1, 1714 ⁇ 4 cm-1, 2979, ⁇ 4 cm-1, and 3013 ⁇ 4 cm-1.
  • analyzing includes assessing the characteristic at at least two wavenumbers selected from the group. For some applications, analyzing includes assessing the characteristic at at least three wavenumbers selected from the group.
  • analyzing the sample by infrared (IR) spectroscopy includes analyzing the sample by Fourier Transformed Infrared (FTIR) spectroscopy, and obtaining the infrared (IR) spectrum includes obtaining a Fourier Transformed Infrared (FTIR) spectrum.
  • FTIR Fourier Transformed Infrared
  • analyzing the sample by infrared (IR) spectroscopy includes analyzing the sample by Fourier Transformed Infrared microspectroscopy (FTIR-MSP).
  • FTIR-MSP Fourier Transformed Infrared microspectroscopy
  • IR infrared
  • PBMC Peripheral Blood Mononuclear Cells
  • analyzing includes assessing a characteristic of the sample at at least one wavenumber selected from the group consisting of: 865 ⁇ 4 cm-1, 897 ⁇ 4 cm-1, 924 ⁇ 4 cm-1, 1030 ⁇ 4 cm-1, 1047 ⁇ 4 cm-1, 1 191 ⁇ 4 cm-1, and 1238 ⁇ 4 cm-1.
  • analyzing includes assessing the characteristic at at least two wavenumbers selected from the group.
  • analyzing includes assessing the characteristic at at least three wavenumbers selected from the group.
  • analyzing the sample by infrared (IR) spectroscopy includes analyzing the sample by Fourier Transformed Infrared (FTIR) spectroscopy, and obtaining the infrared (IR) spectrum includes obtaining a Fourier Transformed Infrared (FTIR) spectrum.
  • FTIR Fourier Transformed Infrared
  • analyzing the sample by infrared (IR) spectroscopy includes analyzing the sample by Fourier Transformed Infrared microspectroscopy (FTIR-MSP).
  • FTIR-MSP Fourier Transformed Infrared microspectroscopy
  • Figs. 1A-C are graphs representing FTIR absorption spectra and the second derivative of absorption spectra and analysis thereof, based on PBMC samples from several cancer patients and controls, derived in accordance with some applications of the present invention
  • Figs. 2A-C are graphs representing FTIR absorption spectra and the second derivative of absorption spectra of PBMC from a pancreatic cancer patient compared to PBMC from healthy controls, derived in accordance with some applications of the present invention
  • Figs. 3A-C are graphs showing the second derivative of spectra of PBMC from several cancer patients and healthy controls, derived in accordance with some applications of the present invention, and a table summarizing the main biochemical changes induced in PBMC of the cancer patients, as observed by FTIR nricrospectroscopy, as derived in accordance with some applications of the present invention.
  • Fig. 4 shows second derivative spectra of PBMC from a breast cancer patient, a gastrointestinal cancer patient with a history of breast cancer, and healthy controls, as derived in accordance with some applications of the present invention.
  • Figs. 5A-G are graphs representing the second derivative spectra of PBMC and analysis thereof, based on PBMC samples from cancer patients suffering from various types of solid tumors, derived in accordance with some applications of the present invention.
  • Figs. 6A-C are graphs representing the second derivative spectra and analysis thereof, of PBMC samples from cancer patients suffering from different stages of cancer, derived in accordance with some applications of the present invention.
  • Some applications of the present invention comprise diagnosis of a solid tumor by techniques of IR spectroscopy, e.g., FTIR microspectroscopy (MSP) techniques.
  • MSP FTIR microspectroscopy
  • FODT FTIR Optical Diagnosis Technology
  • PBMC Peripheral Blood Mononuclear Cells
  • Some applications of the present invention comprise obtaining a blood sample from a subject and analyzing mononuclear cells from the sample by FTIR-MSP techniques for the detection of a solid tumor.
  • a PBMC sample of a patient suffering from a solid tumor is identified as exhibiting FTIR spectra that are different from FTIR spectra produced by PBMC from a subject who does not suffer from a solid tumor (for some applications, the control group may include subjects suffering from a pathology that is not a solid tumor). Accordingly, some applications of the present invention provide a useful method for the detection of cancer, specifically solid tumors. FTER spectra of PBMC obtained from a cancer patient with a solid tumor generally reflect biochemical changes which occur in the PBMC of the patient in response to the tumor.
  • methods of the present invention are used to determine a stage of the cancer.
  • methods of the present invention can be used to provide monitoring and follow up of cancer patients during and after treatment, e.g., chemotherapy treatment.
  • changes in FTIR spectra of PBMC of solid-tumor patients who are undergoing treatment can indicate biochemical changes in the cells in response to the treatment. This biochemical information can provide insight into the effect of treatment on the patient and/or the tumor.
  • analysis of PBMC by FTIR-MSP is used to detect a type of solid tumor.
  • each type of malignant solid tumor produces distinct FTIR spectra of the PBMC, which are unique to the type of solid tumor. This can be due to each type of solid tumor inducing specific biochemical changes in PBMC.
  • the patient population categorized under "other” included six patients each diagnosed with a different type of primary tumor.
  • the diagnosis of cancer was determined by clinical, surgical, histological, and pathologic diagnosis.
  • the pathologic stage of the tumor was determined according to tumor-node- metastasis (TNM) classification, as described in "TNM Classification of Malignant Tumours", by Sobin LH. et al., 7th Edition, New York: John Wiley, 2009.
  • a control group included healthy volunteers who underwent detailed clinical questioning to exclude a possible pathology, at the Soroka University Medical Center and Ben- Gurion University. Collection of blood samples
  • peripheral blood mononuclear cells PBMC
  • Platelet-depleted residual leukocytes obtained from cancer patients and healthy controls were applied to Histopaque 1077 gradients (Sigma Chemical Co., St. Louis, Missouri, USA) following manufacturer's protocol to obtain PBMC.
  • the cells were aspirated from the interface, washed twice with isotonic saline (0.9% NaCl solution) at 250 g, and resuspended in 5 ⁇ fresh isotonic saline. 1.5 ⁇ of washed cells were deposited on zinc selenide (ZnSe) slides to form approximately a monolayer of cells. It is noted that any other suitable slide may be used, e.g., reflection measurements may be carried out using a gold slide. The slides were then air dried for 1 h under laminar flow to remove water. The dried cells were than measured by FTIR microscopy. FTIR-Microspectroscopy
  • FTIR-MSP Fourier Transform Infrared Microspectroscopy
  • MCT liquid-nitrogen-cooled mercury-cadmium-telluride
  • FTIR-MSP Fourier Transform Infrared Microspectroscopy
  • MCT liquid-nitrogen-cooled mercury-cadmium-telluride
  • MCT liquid-nitrogen-cooled mercury-cadmium-telluride
  • OPUS OPUS software
  • Each sample was measured at least five times at different spots.
  • ADC Analog to Digital Converter
  • Example 1 The experiments presented hereinbelow with reference to Example 1 and Example 2 demonstrate that in accordance with some applications of the present invention, analysis of PBMC samples by FTIR-MSP techniques can be used for diagnosis of a solid tumor based on the FTIR-MSP spectral pattern at selected wavenumbers.
  • Example 1 The experiments presented hereinbelow with reference to Example 1 and Example 2 demonstrate that in accordance with some applications of the present invention, analysis of PBMC samples by FTIR-MSP techniques can be used for diagnosis of a solid tumor based on the FTIR-MSP spectral pattern at selected wavenumbers.
  • Example 1 The experiments presented hereinbelow with reference to Example 1 and Example 2 demonstrate that in accordance with some applications of the present invention, analysis of PBMC samples by FTIR-MSP techniques can be used for diagnosis of a solid tumor based on the FTIR-MSP spectral pattern at selected wavenumbers.
  • PBMC samples from 46 healthy controls were analyzed by FTIR- MSP, and a typical FTIR-MSP spectral pattern was established for control PBMC.
  • PBMC samples from 63 cancer patients suffering from multiple types of solid tumors were subjected to FTIR-MSP analysis and compared to the control FTIR-MSP spectral pattern.
  • the PBMC samples were obtained by preliminary processing of the peripheral blood in accordance with the protocols described hereinabove with reference to extraction of peripheral blood mononuclear cells (PBMC).
  • PBMC samples were then analyzed by FTIR-MSP, in accordance with the protocols described hereinabove with reference to FTIR-MSP.
  • Figs. 1A-C are graphs representing FTIR absorption spectra and the second derivative of the absorption spectra and analysis thereof, for PBMC samples from 63 cancer patients suffering from solid tumors and 46 healthy controls, derived in accordance with some applications of the present invention.
  • FTIR-MSP analysis of peripheral blood mononuclear cells typically generated spectra in the region of 4000-700 cm-1.
  • the spectra are composed of several absorption bands, each corresponding to specific functional groups of specific macromolecules.
  • Fig. 1 A shows an average of the FTIR-MSP spectra of PBMC samples of healthy controls and cancer patients in the regions of 4000-700 cm-1, after baseline correction and vector normalization.
  • the spectra are composed of several absorption bands, each corresponding to specific functional groups of specific macromolecules such as lipids, proteins, and carbohydrates /nucleic acids. The main absorption bands are marked.
  • the region 3000-2830 cm-1 contains symmetric and antisymmetric stretching of CH3 and CH2 groups, which correspond mainly to proteins and lipids respectively.
  • the region 1700-1500 cm-1 corresponds to amide I and amide II, which contain information regarding the secondary structures of proteins.
  • the region 1300-1000 cm-1 includes the symmetric and antisymmetric vibrations of P02- groups.
  • 1000-700 cm-1 is a 'finger print' region which contains several different vibrations, corresponding to carbohydrates, lipids, nucleic acids and other bio-molecules, as described in an article by Mantsch M and Chapman D. entitled "Infrared spectroscopy of bio molecules," John Wiley New York 1996.
  • the FTIR spectrum was typically analyzed by tracking changes in absorption (intensity and/or shift) of these macromolecules.
  • Table ⁇ represents some of the main ER. absorption bands for PBMC cells, and then- corresponding molecular functional groups:
  • Fig. IB In order to achieve effective comparison between the PBMC samples of the cancer patients and the controls, the second derivative of the baseline- corrected, vector-normalized FTIR-MSP spectra was used. Results are presented in Fig. IB. As shown, the second derivative spectra of PBMC samples from the cancer patients differed significantly from the second derivative spectra of PBMC samples from the healthy controls in the spectral region of 1340-1260 cm-1. The mean ⁇ SEM is represented by the hashed region (for control) and the dotted region (for cancer) as shown in the exploded view in Fig. IB.
  • Fig. 1C is a graph representing values of the second derivative of absorption spectra at wavenumbers A1-A23 of PBMC samples from cancer patients compared to PBMC samples from healthy controls, derived in accordance with some applications of the present invention. Statistical analysis was performed and P-values are provided. As shown, the second derivative of PBMC samples from the cancer patients differed significantly from the second derivative analysis of FTIR-MSP spectra from PBMC of healthy controls.
  • Table III lists the wavenumbers shown in Fig. 1C.
  • PBMC samples were analyzed by FTIR-MSP techniques using these wavenumbers to distinguish between healthy controls and cancer patients.
  • PBMC from a single pancreatic cancer patient was subjected to FTIR-MSP analysis and compared to a control FTIR-MSP spectral pattern based on PBMC from 27 healthy controls. Results are presented in Figs. 2A-C.
  • the PBMC was obtained by prelirninary processing of the peripheral blood in accordance with the protocols described hereinabove with reference to extraction of peripheral blood mononuclear cells (PBMC).
  • PBMC samples were then analyzed by FTIR-MSP in accordance with the protocols described hereinabove with reference to FTIR-Microspectroscopy.
  • Fig. 2 A shows representative FTIR-MSP spectra of PBMC of a healthy control compared to FTIR-MSP spectra of PBMC of a pancreatic cancer patient after baseline correction and Min- Max normalization to amide ⁇ .
  • Each spectrum represents the average of five measurements at different sites for each sample.
  • the spectra are composed of several absorption bands, each corresponding to specific functional groups of specific macromolecules such as lipids, proteins, carbohydrates and nucleic acids. The main absorption bands are marked.
  • the FTI spectrum was analyzed by tracking changes in absorption (intensity and/or shift) of these macromolecules.
  • the FTIR-MSP spectra derived from analysis of PBMC from the pancreatic cancer patient exhibited a different spectral pattern when compared to the FTIR-MSP spectra of PBMC of healthy controls.
  • Figs. 2B-C In order to increase accuracy and achieve effective comparison between the PBMC sample of the pancreatic cancer patient and healthy controls, the second derivative of the baseline-corrected, vector-normalized FTIR spectra was used. Results are presented in Figs. 2B-C. The main absorption bands are marked. As shown, the second derivative spectral pattern of PBMC from the pancreatic cancer patient differed significantly from an average FTIR-MSP spectral pattern of PBMC of the healthy controls. The mean ⁇ SEM for the controls is represented by the hashed region as shown in the exploded view in Figs. 2B-C.
  • Example 3 Example 5
  • the experiments presented hereinbelow with reference to Example 3 - Example 5 demonstrate that in accordance with some applications of the present invention, analysis of PBMC samples by FTIR-MSP techniques is used to detect a type of solid tumor. Typically, each type of malignant solid tumor produces distinct FTIR spectra of the PBMC which are unique to the type of solid tumor.
  • PBMC from cancer patients suffering from solid tumors was analyzed by FTIR-MSP.
  • the PBMC was obtained by preliminary processing of the peripheral blood in accordance with the protocols described hereinabove with reference to extraction of peripheral blood mononuclear cells (PBMC).
  • PBMC samples were then analyzed by FTIR-MSP in accordance with the protocols described hereinabove with reference to FTIR-Microspectroscopy.
  • results show that the FTIR-MSP spectral pattern of all the cancer patients differs from those of the healthy controls.
  • the results additionally show that each type of malignancy produces a distinct spectral absorption pattern of the PBMC, which is unique to each type of solid tumor.
  • Figs. 3A-B In order to increase accuracy and achieve effective comparison between PBMC samples of cancer patients and healthy controls, the second derivative of the baseline-corrected, vector-normalized FTIR spectra was used. Results are presented in Fig. 3A. As shown in Fig. 3A, the second derivative spectral pattern of PBMC from each one of the cancer patients differed from PBMC of the healthy controls.
  • the FTIR-MSP spectrum of PBMC of the lung cancer patient is distinct from control by exhibiting decreased absorbance of C3 ⁇ 4, which corresponds to cellular lipids; a decrease in PCV; a shift to a higher wavenumber at 967 cm "1 , which corresponds to deoxyribose skeletal motions of DNA; and an increase in RNA absorption.
  • each spectrum has its own unique spectral pattern, which is distinct from control, and which is characteristic of each type of malignancy.
  • Fig. 3B is a graph showing an analysis of the second derivative data shown in Fig. 3A.
  • Fig. 3B represents the change in value of each type of cancer relative to the control, as derived by analysis by FTIR-MSP of PBMC from each patient. As shown, each cancer patient exhibited a spectrum that differed from the control.
  • Fig. 3C is a table summarizing the main biochemical changes induced in PBMC of cancer patients suffering from different types of solid tumors, as observed by FTIR-MSP (shown in Figs. 3A-B) and analyzed in accordance with some applications of the present invention. Peak intensities which indicate absorption were calculated for each spectrum to reveal the main biochemical changes characteristic of each type of tumor.
  • Example 4
  • PBMC from a breast cancer patient and a gastrointestinal cancer patient were analyzed by FTIR-MSP, and compared to analysis of PBMC from healthy controls. It is to be noted that the breast cancer patient suffers from a primary breast tumor, and the gastrointestinal cancer patient suffers from a primary gastrointestinal tumor.
  • the gastrointestinal cancer patient has a history of breast cancer, and a pathological evaluation of the gastrointestinal tumor showed a breast cancer phenotype rather than a gastrointestinal phenotype.
  • peripheral blood was extracted from the two cancer patients and 27 healthy controls.
  • the PBMC was obtained by preliminary processing of the peripheral blood in accordance with the protocols described hereinabove with reference to extraction of peripheral blood mononuclear cells (PBMC).
  • the PBMC samples were then analyzed by FTIR-MSP in accordance with the protocols described hereinabove with reference to FTIR-Microspectroscopy.
  • results show that the FTIR-MSP spectral pattern of PBMC from the cancer patients differs significantly from those of the healthy controls.
  • results additionally show that PBMC of the breast cancer patient and the gastrointestinal cancer patient (with a history of breast cancer) exhibited a similar spectral pattern that was distinct from the control.
  • the gastrointestinal tumor being shown by pathological evaluation to have a phenotype characteristic of a breast tumor.
  • malignant cells break away from the primary breast tumor and spread to other parts of the body. These cells may remain inactive for years before they begin to grow again. It is possible that a tumor, although located remotely from the original tumor site, triggers biochemical changes in the PBMC that are similar to those triggered by the original tumor.
  • the spectral absorbance pattern of PBMC of both the breast cancer patient and the gastrointestinal cancer patient (who has a history of breast cancer) differ from the spectral pattern produced by PBMC of patients suffering from other types of solid tumors.
  • Fig. 4 shows second derivative spectra of PBMC from the breast cancer patient and from the gastrointestinal cancer patient (the gastrointestinal cancer patient having a history of breast cancer and the gastrointestinal tumor exhibiting a phenotype characteristic of a breast tumor) compared to PBMC of healthy controls, as derived in accordance with some applications of the present invention.
  • the FTIR-MSP second derivative spectra exhibit significant differences between PBMC from the cancer patients and PBMC from healthy controls. These spectral differences typically represent molecular changes in the PBMC of the cancer patients and allow distmguishing between the healthy control and the cancer patients.
  • PBMC from both the primary breast cancer patient and the gastrointestinal cancer patient exhibited a similar FTIR-MSP spectral partem.
  • some applications of the present invention can be used to diagnose the type and/or the origin of solid tumor of a patient based on the unique FTIR-MSP spectra produced by analysis of the patient's PBMC. This is consistent with Example 3, which showed that PBMC from patients with different types of solid tumors each produced a distinct FTIR spectral pattern with its own set of characteristic bands. Additionally, the molecular changes which trigger the changes in the FTIR-MSP spectra of breast cancer patients, including patients with breast cancer history, can serve as biomarkers to diagnose breast cancer. Additionally, some applications of the present invention can be used to select effective treatment based on the origin of a tumor. It is to. be noted that, the type of solid tumor diagnosed in accordance with applications of the present invention is not limited to breast tumors, but may include any other type of solid tumors.
  • PBMC samples from cancer patients suffering from various types of solid tumors were analyzed by FTIR-MSP.
  • the FTIR-MSP spectral pattern of each type of solid tumor was compared to the FTIR-MSP spectral pattern of the other solid rum, allowing distinguishing between different types of solid tumors.
  • the population of cancer patients for this set of experiments comprised a total of 63 patients suffering from solid tumors, in accordance with Table I.
  • the PBMC was obtained by preliminary processing of the peripheral blood in accordance with the protocols described hereinabove with reference to extraction of peripheral blood mononuclear cells (PBMC).
  • the PBMC samples were then analyzed by FTIR-MSP, in accordance with the protocols described hereinabove with reference to FTIR-Microspectroscopy.
  • Figs. 5A-C In order to increase accuracy and achieve effective comparison between PBMC samples of the various types of cancer patients, the second derivative of the baseline-corrected, vector-normalized average FTIR absorption spectra was used. Results are presented in Figs. 5A-C, showing the second derivative of several regions of the spectra (the main absorption bands are marked). As shown in Figs. 5A-C, the second derivative spectra of each type of solid tumor produced a distinct spectral absorption pattern of the PBMC, which is unique to each type of solid tumor.
  • Figs. 5D-G are a series of graphs representing values of the second derivative of absorption spectra of each type of solid tumor compared to the second derivative of absorption spectra of the other solid tumors, derived in accordance with some applications of the present invention.
  • Table IV lists the wavenumbers shown in Fig. 5D.
  • PBMC samples were analyzed by FTIR-MSP techniques using these wavenumbers to distinguish between breast cancer patients and cancer patients who do not have breast cancer.
  • Table V lists the wavenumbers shown in Fig. 5E.
  • PBMC samples were analyzed by FTIR-MSP techniques using these wavenumbers to distinguish between gastrointestinal cancer patients and cancer patients who do not have gastrointestinal cancer.
  • Table VI lists the wavenumbers shown in Fig. 5F.
  • PBMC samples were analyzed by FTIR-MSP techniques using these wavenumbers to distinguish between lung cancer patients and cancer patients who do not have lung cancer.
  • Table VII lists the wavenumbers shown in Fig. 5G.
  • PBMC samples were analyzed by FTIR-MSP techniques using these wavenumbers to distinguish between prostate cancer patients and cancer patients who do not have prostate cancer.
  • Example 6 The experiments presented hereinbelow with reference to Example 6 demonstrate that in accordance with some applications of the present invention, analysis of PBMC samples by FTIR-MSP techniques is used for staging cancer. Typically, each stage of cancer produces distinct FTIR spectra of the PBMC.
  • PBMC samples from cancer patients suffering from different stages of cancer due to solid tumors were analyzed by FTIR-MSP and a second derivative of the average of the spectra was obtained for each of the stages of cancer, allowing distinguishing between different stages of cancer.
  • the PBMC was obtained by preliminary processing of the peripheral blood in accordance with the protocols described hereinabove with reference to extraction of peripheral blood mononuclear cells (PBMC).
  • the PBMC samples were then analyzed by FTIR-MSP in accordance with the protocols described hereinabove with reference to FTIR-Microspectroscopy.
  • PBMC that are different than those produced by PBMC samples taken from patients with advanced stages of cancer, allowing distinguishing among different stages of cancer, in particular, between early and advanced stages.
  • Figs. 6A-C are graphs showing the second derivative spectra of PBMC and analysis thereof, based on PBMC samples from cancer patients suffering from different stages of cancer, derived in accordance with some applications of the present invention.
  • Fig. 6A is a graph representing the second derivative of baseline-corrected, vector- normalized average FTIR absorption spectra of PBMC samples obtained from cancer patients in different stages of the disease. As shown, PBMC of each stage of cancer produced a distinct spectral absorption pattern of the PBMC.
  • Fig. 6B is a graph representing the second derivative of baseline-corrected, vector- normalized average FTIR absorption spectra of PBMC samples obtained from breast cancer patients in different stages of the disease.
  • PBMC of each stage of breast cancer produced a distinct spectral absorption pattern of the PBMC, and particularly, the early stages (stages one and two) were distinct from the more advanced stages (stages three and four).
  • breast cancer is shown by way of illustration and not limitation, and that the scope of the present includes staging of any type of solid tumor by techniques described herein.
  • PBMC peripheral blood mononuclear cells
  • WBC white blood cell
  • FTIR microscopy techniques may be performed on any type of white blood cell, including but not limited to a total population of white blood cells (e.g., as obtained by red blood cell lysis).
  • the data obtained by analysis of the PBMC samples may be further analyzed by any suitable method known in the art, e.g., Artificial Neural Network and/or Cluster Analysis, and/or Principal Component Analysis, and/or Linear Discriminant Analysis (LDA) e.g., Fisher's Linear Discriminant Analysis (FLDA), Quadratic Discriminant Analysis, and/or Non Linear Discriminant Analysis.
  • LDA Linear Discriminant Analysis
  • ANN artificial neural network
  • the scope of the present invention includes the use of only one wavenumber (representing one biomarker) for detection and/or monitoring of a solid tumor, as well as the use of two, three, four, or more wavenumbers.
  • the scope of the present invention includes using any IR spectral feature or any feature derived from analysis of an IR spectral feature (e.g., any type of peak analysis), to indicate the presence of a solid tumor.
  • any IR spectral feature or any feature derived from analysis of an IR spectral feature e.g., any type of peak analysis
  • IR spectroscopy may include Attenuated Total Reflectance (ATR) spectroscopy techniques.
  • ATR Attenuated Total Reflectance
  • aspects of the present invention described hereinabove can be embodied in a computer running software, and that the software can be supplied and stored in tangible media, e.g., hard disks, floppy disks, a USB flash drive, or compact disks, or in intangible media, e.g., in an electronic memory, or on a network such as the Internet.
  • tangible media e.g., hard disks, floppy disks, a USB flash drive, or compact disks
  • intangible media e.g., in an electronic memory, or on a network such as the Internet.

Landscapes

  • Physics & Mathematics (AREA)
  • Spectroscopy & Molecular Physics (AREA)
  • General Physics & Mathematics (AREA)
  • Health & Medical Sciences (AREA)
  • Chemical & Material Sciences (AREA)
  • Analytical Chemistry (AREA)
  • Biochemistry (AREA)
  • General Health & Medical Sciences (AREA)
  • Life Sciences & Earth Sciences (AREA)
  • Immunology (AREA)
  • Pathology (AREA)
  • Nuclear Medicine, Radiotherapy & Molecular Imaging (AREA)
  • Dispersion Chemistry (AREA)
  • Investigating Or Analysing Materials By Optical Means (AREA)
  • Investigating Or Analysing Biological Materials (AREA)
  • Measurement Of The Respiration, Hearing Ability, Form, And Blood Characteristics Of Living Organisms (AREA)

Abstract

A method is provided comprising, obtaining an infrared (IR) spectrum of a Peripheral Blood Mononuclear Cells (PBMC) sample by analyzing the sample by infrared spectroscopy; and based on the infrared spectrum, generating an output indicative of the presence of a solid tumor or a pre-malignant condition. Other embodiments are also provided.

Description

DIAGNOSIS OF CANCER
CROSS-REFERENCES TO RELATED APPLICATIONS
The present application claims the priority of US Provisional Application 61/350,073 to Kapelushnik et al., filed June 1, 2010, which is incorporated herein by reference. FIELD OF EMBODIMENTS OF THE INVENTION
Embodiments of the present invention relate generally to diagnosis and monitoring of cancer, and particularly to methods for diagnosis and monitoring of malignant solid tumors.
BACKGROUND
Infrared spectroscopy is a technique based on the absorption or reflection of infrared radiation by chemical substances; each chemical substance having unique absorption spectra. Fourier Transform Infrared (FUR) spectroscopy is used to identify biochemical compounds and examine the biochemical composition of a biological sample. Typically, FTIR spectra are composed of absorption bands each corresponding to specific functional groups related to cellular components such as lipids, proteins, carbohydrates and nucleic acids. Processes such as carcinogenesis may trigger global changes in cancer cell biochemistry resulting in differences in the absorption spectra when analyzed by FTIR spectroscopy techniques. Therefore, FTIR spectroscopy is commonly used to distinguish between normal and abnormal tissue by analyzing the changes in absorption bands of macromolecules such as lipids, proteins, carbohydrates and nucleic acids. Additionally, FTIR spectroscopy may be utilized for evaluation of cell death mode, cell cycle progression and the degree of maturation of hematopoietic cells.
SUMMARY OF EMBODIMENTS OF THE INVENTION
In some applications of the present invention, methods and systems are provided for the diagnosis and monitoring of multiple types of malignant neoplasms, particularly malignant solid tumors.
Additionally or alternatively, some applications of the present invention comprise diagnosis and monitoring of a pre-malignant condition. Typically "Total Biochemical Infrared Analysis" (TBIA) of blood-derived mononuclear cells is used to diagnose a solid tumor. For example, some applications of the present invention comprise analysis by infrared (IR) spectroscopy, e.g., FTIR spectroscopy and microspectroscopy, of global biochemical properties of blood-derived mononuclear cells for the detection of solid tumors. As provided by some applications of the present invention, FTER Optical Diagnosis Technology (FODT) analysis of biochemical changes in a Peripheral Blood Mononuclear Cells (PBMC) sample of a patient can indicate the presence of a solid tumor and/or a pre-malignant condition.
For some applications, biochemical analysis of PBMC obtained from cancer patients and from control individuals who do not suffer from a malignant solid tumor, e.g., healthy controls, is conducted using FTIR microspectroscopy techniques. In accordance with some applications of the present invention, PBMC from a plurality of cancer patients each suffering from a solid tumor (e.g., in the breast, pancreas, lung, head and neck, prostate, ovary, and gastrointestinal tract) is analyzed by FTIR microspectroscopy techniques. Subsequently, the FTIR spectra (absorption and/or reflection) of the PBMC samples of the cancer patients are compared to the FTIR spectra of PBMC samples obtained from the controls.
The inventors have identified that the PBMC samples obtained from cancer patients suffering from a malignant solid tumor produce FTIR spectra that differ from those of the control individuals who do not suffer from a malignant solid tumor, allowing distinguishing between the cancer patients and controls. Thus, some applications of the present invention can be used to diagnose cancer patients suffering from various types of malignancies, particularly solid tumors. Importantly, the distinction by FTIR spectroscopy between controls and patients suffering from solid tumors is typically performed based on analysis of PBMC and not of the actual tumor cells.
For some applications, a data processor analyzes the IR spectrum, e.g., the FTIR spectrum, of the PBMC sample of a subject. Information from the data processor is typically fed into an output unit that generates a result indicative of the presence of a solid tumor and/or a pre- malignant condition, based on the infrared (IR) spectrum. Additionally, the data processor is typically configured to calculate a second derivative of the infrared (IR) spectrum of the PBMC sample and, based on the second derivative of the infrared (IR) spectrum, to generate an output indicative of the presence of a solid tumor.
Additionally, the inventors have identified that PBMC obtained from each cancer patient suffering from a solid tumor produced an FTIR spectrum having a unique spectral pattern which is characteristic of the type of malignancy, e.g., breast, lung, prostate or gastrointestinal, and distinct from spectra of other malignancy types.
For some applications, analysis by IR spectroscopy, e.g., FTIR spectroscopy, of the biochemistry of PBMC or any other blood-derived cells is used for the screening of large populations, aiding in the early detection of solid tumors. FTIR spectroscopy (and microspectroscopy) is typically a simple, reagent-free and rapid method suitable for use as a screening test for large populations. Early detection of cancer generally enables early intervention and treatment, contributing to a reduced mortality rate.
There is therefore provided in accordance with some applications of the present invention a method including:
obtaining an infrared (IR) spectrum of a Peripheral Blood Mononuclear Cells (PBMC) sample by analyzing the sample by infrared spectroscopy; and
based on the infrared spectrum, generating an output indicative of the presence of a solid tumor or a pre-malignant condition.
For some applications, generating the output includes generating the output indicative of the presence of the solid tumor.
For some applications, analyzing the sample by infrared (IR) spectroscopy includes analyzing the sample by Fourier Transformed Infrared (FTIR) spectroscopy, and obtaining the infrared (IR) spectrum includes obtaining a Fourier Transformed Infrared (FTIR) spectrum.
For some applications, analyzing the sample by infrared (IR) spectroscopy includes analyzing the sample by Fourier Transformed Infrared microspectroscopy (FTTR-MSP).
For some applications, analyzing includes assessing a characteristic of the sample at at least one wavenumber selected from the group consisting of: 765 ± 4 cm-1, 798 ± 4 cm-1, 809 ± 4 cm-1, 814 ± 4 cm-1, 875 ± 4 cm-1, 997 ± 4 cm-1, 1001 ± 4 cm-1, 1015 ± 4 cm-1, 1103 ± 4 cm-1, 1118 ± 4 cm-1, 1162 ± 4 cm-1, 1221 ± 4 cm-1, 1270 ± 4 cm-1, 1283 ± 4 cm-1, 1295± 4 cm-1, 1315 ± 4 cm-1, 1341 ± 4 cm-1, 1367 ± 4 cm-1, 1392 ± 4 cm-1, 1429 ± 4 cm-1, 1440 ± 4 cm-1, 1445 ± 4 cm-1 and 1455 ± 4 cm-1.
For some applications, analyzing includes assessing the characteristic at at least two wavenumbers selected from the group.
For some applications, analyzing includes assessing the characteristic at at least three wavenumbers selected from the group.
. For some applications, assessing the characteristic includes analyzing a band of the IR spectrum surrounding at least one wavenumber selected from the group.
For some applications, analyzing the sample includes obtaining a second derivative of the infrared (IR) spectrum of the sample.
For some applications, the infrared (IR) spectrum includes an absorption spectrum, and obtaining the infrared (IR) spectrum includes obtaining the absorption spectrum.
For some applications, the infrared (IR) spectrum includes a reflection spectrum, and obtaining the infrared (IR) spectrum includes obtaining the reflection spectrum.
For some applications, generating the output includes indicating via the output whether the solid tumor is a first type of solid tumor or a second type of solid tumor.
For some applications, the solid tumor includes a solid tumor in tissue selected from the group consisting of: head and neck, esophagus, and pancreas, and generating the output includes generating an output indicative of the presence of a solid tumor in tissue selected from the group.
For some applications, the solid tumor includes a solid tumor in tissue selected from the group consisting of: breast, gastrointestinal tract, prostate, and lung, and generating the output includes generating an output indicative of the presence of a solid tumor in tissue selected from the group.
For some applications, analyzing includes assessing a characteristic of the sample at at least one wavenumber selected from the group consisting of: 752 ± 4 cm-1, 1030 ± 4 cm-1, 1046 ± 4 cm-1, 1128 ± 4 cm-1, and 1237 ± 4 cm-1, and generating includes generating an output indicative of the presence of a tumor in the breast tissue. For some applications, analyzing includes assessing a characteristic of the sample at at least one wavenumber selected from the group consisting of: 797 ± 4 cm-1, 830 ± 4 cm-1, 893 ± 4 cm-1, 899 ± 4 cm-1, 1128 ± 4 cm-1, 1298 ± 4 cm-1, 1354 ± 4 cm-1, 1714 ± 4 cm-1 1725 ± 4 cm-1, 1738, ± 4 cm-1, and 3013 ± 4 cm-1, and generating includes generating an output indicative of the presence of a tumor in the gastrointestinal tract tissue.
For some applications, analyzing includes assessing a characteristic of the sample at at least one wavenumber selected from the group consisting of: 765 ± 4 cm-1, 780 ± 4 cm-1, 797 ± 4 cm-1, 851 ± 4 cm-1, 874 ± 4 cm-1, 881 ± 4 cm-1, 913 ± 4 cm-1, 923 ± 4 cm-1, 958 ± 4 cm-1, 968, ± 4 cm-1, 1044 ± 4 cm-1, 1085 ± 4 cm-1, 1191 ± 4 cm-1, 1241 ± 4 cm-1, 1344 ± 4 cm-1, 1373 ± 4 cm-1, 1417 ± 4 cm-1, 1458 ± 4 cm-1, 1469 ± 4 cm-1, 1692 ± 4 cm-1, 1714 ± 4 cm-1, 1728 ± 4 cm-1, 2852 ± 4 cm-1, and 2984 ± 4 cm, and generating includes generating an output indicative of the presence of a tumor in the lung tissue.
For some applications, analyzing includes assessing a characteristic of the sample at at least one wavenumber selected from the group consisting of: 828 ± 4 cm-1, 932 ± 4 cm-1, 997 ± 4 cm-1, 1059 ± 4 cm-1, 1299 ± 4 cm-1, 1302 ± 4 cm-1, 1403 ± 4 cm-1, 1454 ± 4 cm-1, 1714 ± 4 cm-1, 2979, ± 4 cm-1, and 3013 ± 4 cm-1, and generating includes generating an output indicative of the presence of a tumor in the prostate tissue.
There is further provided in accordance with some applications of the present invention a method including:
obtaining an infrared (IR) spectrum of a sample of white blood cells by analyzing the sample by infrared spectroscopy; and
based on the infrared spectrum, generating an output indicative of the presence of a solid tumor or a pre-malignant condition.
For some applications, generating the output includes generating the output indicative of the presence of the solid tumor.
For some applications, analyzing the sample by infrared (IR) spectroscopy includes analyzing the sample by Fourier Transformed Infrared (FTIR) spectroscopy, and obtaining the infrared (IR) spectrum includes obtaining a Fourier Transformed Infrared (FTIR) spectrum. For some applications, analyzing the sample by infrared (IR) spectroscopy includes analyzing the sample by Fourier Transformed Infrared microspectroscopy (FTIR-MSP).
There is additionally provided in accordance with some applications of the present invention a method for monitoring the effect of an anti-cancer treatment on a subject undergoing anti-cancer treatment for a solid tumor, for use with a first Peripheral Blood Mononuclear Cells (PBMC) sample separated from blood of the subject that was obtained prior to initiation of the treatment and a second PBMC sample separated from blood of the subject that was obtained after initiation of the treatment, the method including:
obtaining IR spectra of the first and second PBMC samples by analyzing the first and second PBMC samples by IR spectroscopy; and
based on the IR spectra, generating an output indicative of the effect of the treatment.
For some applications, analyzing the first and second PBMC samples by IR spectroscopy includes analyzing the samples by Fourier Transformed Infrared spectroscopy, and obtaining the IR spectra includes obtaining Fourier Transformed Infrared (FTIR) spectra.
For some applications, analyzing the first and second PBMC samples by infrared (IR) spectroscopy includes analyzing the first and second PBMC samples by Fourier Transformed Infrared microspectroscopy (FTIR-MSP).
For some applications, the method includes obtaining an IR spectrum of a third PBMC sample separated from blood of the subject that was obtained following termination of the treatment, by analyzing the third PBMC sample by IR spectroscopy.
For some applications, analyzing includes assessing a characteristic of the sample at at least one wavenumber selected from the group consisting of: 765 ± 4 cm-1, 798 ± 4 cm-1, 809 ± 4 cm-1, 814 ± 4 cm-1, 875 ± 4 cm-1, 997 ± 4 cm-1, 1001 ± 4 cm-1, 1015 ± 4 cm-1, 1103 ± 4 cm-1, 1118 ± 4 cm-1, 1162 ± 4 cm-1, 1221 ± 4 cm-1, 1270 ± 4 cm-1, 1283 ± 4 cm-1, 1295 ± 4 cm-1, 1315 ± 4 cm-1, 1341 ± 4 cm-1, 1367 ± 4 cm-1, 1392 ± 4 cm-1, 1429 ± 4 cm-1, 1440 ± 4 cm-1, 1445 ± 4 cm-1, and 1455 ± 4 cm-1.
For some applications, analyzing includes assessing the characteristic at at least two wavenumbers selected from the group. For some applications, analyzing includes assessing the characteristic at at least three wavenumbers selected from the group.
There is yet additionally provided in accordance with some applications of the present invention, a method including:
obtaining an infrared (IR) spectrum of a Peripheral Blood Mononuclear Cells (PBMC) sample by analyzing the sample; and
based on the infrared spectrum, generating an output indicative of the presence of a solid tumor or a pre-malignant condition.
For some applications, generating the output includes generating the output indicative of the presence of the solid tumor.
There is still additionally provided in accordance with some applications of the present invention, a system for diagnosing a solid tumor, including:
a data processor, configured to analyze an infrared (IR) spectrum of a Peripheral Blood Mononuclear Cells (PBMC) sample of a subject; and
an output unit, configured to generate an output indicative of the presence of a solid tumor, based on the infrared (IR) spectrum.
For some applications, the data processor is configured to calculate a second derivative of the infrared (IR) spectrum of the PBMC sample and, based on the second derivative of the infrared (IR) spectrum, to generate an output indicative of the presence of a solid tumor.
For some applications, the IR spectrum includes a Fourier Transformed Infrared (FTIR) spectrum, and the data processor is configured to calculate a second derivative of the FTIR spectrum.
For some applications, the data processor is configured to analyze the infrared (IR) spectrum by assessing a characteristic of the PBMC sample at at least one wavenumber selected from the group consisting of: 765 ± 4 cm-1, 798 ± 4 cm-1, 809 ± 4 cm-1, 814 ± 4 cm-1 , 875 ± 4 cm-1, 997 ± 4 cm-1, 1001 ± 4 cm-1, 1015 ± 4 cm-1, 1103 ± 4 cm-1 , 1 118 ± 4 cm-1, 1 162 ± 4 cm-1, 1221 ± 4 cm-1, 1270 ± 4 cm-1, 1283 ± 4 cm-1, 1295± 4 cm-l, 1315 ± 4 cm-1, 1341 ± 4 cm- 1, 1367 ± 4 cm- 1, 1392 ± 4 cm-1, 1429 ± 4 cm- 1, 1440 ± 4 cm-1, 1445 ± 4 cm-1, and 1455 ± 4 cm-1. For some applications, the data processor is configured to analyze the infrared (IR) spectrum by assessing the characteristic at at least two wavenumbers selected from the group.
For some applications, the data processor is configured to analyze the infrared (IR) spectrum by assessing the characteristic at at least three wavenumbers selected from the group. There is still further provided in accordance with some applications of the present invention, a computer program product for administering processing of a body of data, the product including a computer-readable medium having program instructions embodied therein, which instructions, when read by a computer, cause the computer to:
obtain an infrared (IR) spectrum of a Peripheral Blood Mononuclear Cells (PBMC) by analyzing the PBMC by infrared spectroscopy; and
based on the infrared spectrum, generate an output indicative of the presence of a solid tumor.
There is yet provided in accordance with some applications of the present invention, a method including:
obtaining an infrared (IR) spectrum of a Peripheral Blood Mononuclear Cells (PBMC) sample by analyzing the sample by infrared spectroscopy; and
based on the infrared spectrum, generating an output indicative of the presence of a solid tumor in a breast tissue of a subject.
For some applications, analyzing includes assessing a characteristic of the sample at at least one wavenumber selected from the group consisting of: 752 ± 4 cm-1, 1030 ± 4 cm-1, 1046 ± 4 cm-1, 1128 ± 4 cm-1, and 1237 ± 4 cm-1.
For some applications, analyzing includes assessing the characteristic at at least two wavenumbers selected from the group.
For some applications, analyzing includes assessing the characteristic at at least three wavenumbers selected from the group.
For some applications, analyzing the sample by infrared (IR) spectroscopy includes analyzing the sample by Fourier Transformed Infrared (FTIR) spectroscopy, and obtaining the infrared (IR) spectrum includes obtaining a Fourier Transformed Infrared (FTIR) spectrum. For some applications, analyzing the sample by infrared (IR) spectroscopy includes analyzing the sample by Fourier Transformed Infrared microspectroscopy (FTIR- SP).
There is still provided in accordance with some applications of the present invention a method including:
obtaining an infrared (IR) spectrum of a Peripheral Blood Mononuclear Cells (PBMC) sample by analyzing the sample by infrared spectroscopy, and
based on the infrared spectrum, generating an output indicative of the presence of a solid tumor in tissue of a gastrointestinal tract of a subject.
For some applications, analyzing includes assessing a characteristic of the sample at at least one wavenumber selected from the group consisting of: 797 ± 4 cm-l, 830 ± 4 cm-l, 893 ± 4 cm-l, 899 ± 4 cm-l, 1128 ± 4 cm-l, 1298 ± 4 cm-l, 1354 ± 4 cm-l, 1714 ± 4 cm-l 1725 ± 4 cm-l, 1738, ± 4 cm-l, and 3013 ± 4 cm-l.
For some applications, analyzing includes assessing the characteristic at at least two wavenumbers selected from the group.
For some applications, analyzing includes assessing the characteristic at at least three wavenumbers selected from the group.
For some applications, analyzing the sample by infrared (IR) spectroscopy includes analyzing the sample by Fourier Transformed Infrared (FTIR) spectroscopy, and obtaining the infrared (IR) spectrum includes obtaining a Fourier Transformed Infrared (FTIR) spectrum.
For some applications, analyzing the sample by infrared (IR) spectroscopy includes analyzing the sample by Fourier Transformed Infrared microspectroscopy (FTIR-MSP).
There is additionally provided in accordance with some applications of the present invention, a method including:
obtaining an infrared (IR) spectrum of a Peripheral Blood Mononuclear Cells (PBMC) sample by analyzing the sample by infrared spectroscopy, and
based on the infrared spectrum, generating an output indicative of the presence of a solid tumor in lung tissue of a subject. For some applications, analyzing includes assessing a characteristic of the sample at at least one wavenumber selected from the group consisting of: 765 ± 4 cm-1, 780 ± 4 cm-1, 797 ± 4 cm-1, 851 ± 4 cm-1, 874 ± 4 cm-1, 881 ± 4 cm-1, 913 ± 4 cm-1, 923 ± 4 cm-1, 958 ± 4 cm-1, 968, ± 4 cm-1, 1044 ± 4 cm-1, 1085 ± 4 cm-1, 1191 ± 4 cm-1, 1241 ± 4 cm-1, 1344 ± 4 cm-1, 1373 ± 4 cm-1, 1417 ± 4 cm-1, 1458 ± 4 cm-1, 1469 ± 4 cm-1, 1692 ± 4 cm-1, 1714 ± 4 cm-1, 1728 ± 4 cm-1, 2852 ± 4 cm-1, and 2984 ± 4 cm.
For some applications, analyzing includes assessing the characteristic at at least two wavenumbers selected from the group.
For some applications, analyzing includes assessing the characteristic at at least three wavenumbers selected from the group.
For some applications, analyzing the sample by infrared (IR) spectroscopy includes analyzing the sample by Fourier Transformed Infrared (FTER.) spectroscopy, and obtaining the infrared (IR) spectrum includes obtaining a Fourier Transformed Infrared (FTIR) spectrum.
For some applications, analyzing the sample by infrared (IR) spectroscopy includes analyzing the sample by Fourier Transformed Infrared microspectroscopy (FTIR-MSP).
There is further additionally provided in accordance with some applications of the present invention, a method including:
obtaining an infrared (IR) spectrum of a Peripheral Blood Mononuclear Cells (PBMC) sample by analyzing the sample by infrared spectroscopy; and
based on the infrared spectrum, generating an output indicative of the presence of a solid tumor in a prostate tissue of a subject.
For some applications, analyzing includes assessing a characteristic of the sample at at least one wavenumber selected from the group consisting of: 828 ± 4 cm-1, 932 ± 4 cm-1, 997 ± 4 cm-1, 1059 ± 4 cm-1, 1299 ± 4 cm-1, 1302 ± 4 cm-1, 1403 ± 4 cm-1, 1454 ± 4 cm-1, 1714 ± 4 cm-1, 2979, ± 4 cm-1, and 3013 ± 4 cm-1.
For some applications, analyzing includes assessing the characteristic at at least two wavenumbers selected from the group. For some applications, analyzing includes assessing the characteristic at at least three wavenumbers selected from the group.
For some applications, analyzing the sample by infrared (IR) spectroscopy includes analyzing the sample by Fourier Transformed Infrared (FTIR) spectroscopy, and obtaining the infrared (IR) spectrum includes obtaining a Fourier Transformed Infrared (FTIR) spectrum.
For some applications, analyzing the sample by infrared (IR) spectroscopy includes analyzing the sample by Fourier Transformed Infrared microspectroscopy (FTIR-MSP).
There is further provided in accordance with some applications of the present invention, a method including:
obtaining an infrared (IR) spectrum of a Peripheral Blood Mononuclear Cells (PBMC) sample from a cancer patient by analyzing the sample by infrared spectroscopy; and
based on the infrared spectrum, generating an output indicative of a stage of the cancer.
For some applications, analyzing includes assessing a characteristic of the sample at at least one wavenumber selected from the group consisting of: 865 ± 4 cm-1, 897 ± 4 cm-1, 924 ± 4 cm-1, 1030 ± 4 cm-1, 1047 ± 4 cm-1, 1 191 ± 4 cm-1, and 1238 ± 4 cm-1.
For some applications, analyzing includes assessing the characteristic at at least two wavenumbers selected from the group.
For some applications, analyzing includes assessing the characteristic at at least three wavenumbers selected from the group.
For some applications, analyzing the sample by infrared (IR) spectroscopy includes analyzing the sample by Fourier Transformed Infrared (FTIR) spectroscopy, and obtaining the infrared (IR) spectrum includes obtaining a Fourier Transformed Infrared (FTIR) spectrum.
For some applications, analyzing the sample by infrared (IR) spectroscopy includes analyzing the sample by Fourier Transformed Infrared microspectroscopy (FTIR-MSP).
The present invention will be more fully understood from the following detailed description of embodiments thereof, taken together with the drawings, in which: BRIEF DESCRIPTION OF THE DRAWINGS
Figs. 1A-C are graphs representing FTIR absorption spectra and the second derivative of absorption spectra and analysis thereof, based on PBMC samples from several cancer patients and controls, derived in accordance with some applications of the present invention;
Figs. 2A-C are graphs representing FTIR absorption spectra and the second derivative of absorption spectra of PBMC from a pancreatic cancer patient compared to PBMC from healthy controls, derived in accordance with some applications of the present invention;
Figs. 3A-C are graphs showing the second derivative of spectra of PBMC from several cancer patients and healthy controls, derived in accordance with some applications of the present invention, and a table summarizing the main biochemical changes induced in PBMC of the cancer patients, as observed by FTIR nricrospectroscopy, as derived in accordance with some applications of the present invention; and
Fig. 4 shows second derivative spectra of PBMC from a breast cancer patient, a gastrointestinal cancer patient with a history of breast cancer, and healthy controls, as derived in accordance with some applications of the present invention; and
Figs. 5A-G are graphs representing the second derivative spectra of PBMC and analysis thereof, based on PBMC samples from cancer patients suffering from various types of solid tumors, derived in accordance with some applications of the present invention; and
Figs. 6A-C are graphs representing the second derivative spectra and analysis thereof, of PBMC samples from cancer patients suffering from different stages of cancer, derived in accordance with some applications of the present invention.
DETAILED DESCRIPTION OF THE EMBODIMENTS
Some applications of the present invention comprise diagnosis of a solid tumor by techniques of IR spectroscopy, e.g., FTIR microspectroscopy (MSP) techniques. For some applications, FTIR Optical Diagnosis Technology (FODT) is used to diagnose a solid tumor based on biochemical proprieties of Peripheral Blood Mononuclear Cells (PBMC) of a subject. Some applications of the present invention comprise obtaining a blood sample from a subject and analyzing mononuclear cells from the sample by FTIR-MSP techniques for the detection of a solid tumor. Typically, a PBMC sample of a patient suffering from a solid tumor is identified as exhibiting FTIR spectra that are different from FTIR spectra produced by PBMC from a subject who does not suffer from a solid tumor (for some applications, the control group may include subjects suffering from a pathology that is not a solid tumor). Accordingly, some applications of the present invention provide a useful method for the detection of cancer, specifically solid tumors. FTER spectra of PBMC obtained from a cancer patient with a solid tumor generally reflect biochemical changes which occur in the PBMC of the patient in response to the tumor.
For some applications, methods of the present invention are used to determine a stage of the cancer.
For some applications, methods of the present invention can be used to provide monitoring and follow up of cancer patients during and after treatment, e.g., chemotherapy treatment. Typically, changes in FTIR spectra of PBMC of solid-tumor patients who are undergoing treatment can indicate biochemical changes in the cells in response to the treatment. This biochemical information can provide insight into the effect of treatment on the patient and/or the tumor.
In some applications of the present invention, analysis of PBMC by FTIR-MSP is used to detect a type of solid tumor. Typically, each type of malignant solid tumor produces distinct FTIR spectra of the PBMC, which are unique to the type of solid tumor. This can be due to each type of solid tumor inducing specific biochemical changes in PBMC. METHODS USED IN SOME EMBODIMENTS OF THE PRESENT INVENTION
A series of protocols are described hereinbelow which may be used separately or in combination, as appropriate, in accordance with applications of the present invention. It is to be appreciated that numerical values are provided by way of illustration and not limitation. Typically, but not necessarily, each value shown is an example selected from a range of values that is within 20% of the value shown. Similarly, although certain steps are described with a high level of specificity, a person of ordinary skill in the art will appreciate that other steps may be performed, mutatis mutandis.
In accordance with some applications of the present invention, the following methods were applied: Obtaining patient and control populations
All studies were approved by the local Ethics Committee of the Soroka University Medical Center and conducted in accordance with the Declaration of Helsinki. Qualified personnel obtained informed consent from each individual participating in this study.
The patient population included cancer patients (n=63) diagnosed with primary solid tumors as set forth in the following Table I:
Table I:
Disease site
Control Breast GI Lung ProOther
state
Gender
Male 24 1 9 7 5 2
Female 22 24 9 1 0 5
Disease
stage
I 0 9 1 0 2 2
II 0 12 3 0 0 0
III 0 3 4 1 0 3
TV 0 1 10 7 3 2
Total 46 25 18 8 5 7
The patient population categorized under "other" included six patients each diagnosed with a different type of primary tumor. Among the "other" group are patients suffering from primary rumors such as pancreas (n=2), head and neck (n=l) and esophagus (n=l).
The diagnosis of cancer was determined by clinical, surgical, histological, and pathologic diagnosis. The pathologic stage of the tumor was determined according to tumor-node- metastasis (TNM) classification, as described in "TNM Classification of Malignant Tumours", by Sobin LH. et al., 7th Edition, New York: John Wiley, 2009.
A control group (n=46) included healthy volunteers who underwent detailed clinical questioning to exclude a possible pathology, at the Soroka University Medical Center and Ben- Gurion University. Collection of blood samples
1-2 ml of peripheral blood was collected in 5 ml EDTA blood collection tubes (BD Vacutainer® Tubes, BD Vacutainer, Toronto) from patients and healthy controls using standardized phlebotomy procedures. Samples were processed within two hours of collection. Extraction of peripheral blood mononuclear cells (PBMC)
Platelet-depleted residual leukocytes obtained from cancer patients and healthy controls were applied to Histopaque 1077 gradients (Sigma Chemical Co., St. Louis, Missouri, USA) following manufacturer's protocol to obtain PBMC.
The cells were aspirated from the interface, washed twice with isotonic saline (0.9% NaCl solution) at 250 g, and resuspended in 5 μΐ fresh isotonic saline. 1.5 μΐ of washed cells were deposited on zinc selenide (ZnSe) slides to form approximately a monolayer of cells. It is noted that any other suitable slide may be used, e.g., reflection measurements may be carried out using a gold slide. The slides were then air dried for 1 h under laminar flow to remove water. The dried cells were than measured by FTIR microscopy. FTIR-Microspectroscopy
Fourier Transform Infrared Microspectroscopy (FTIR-MSP) and Data Acquisition Measurements on cell cultures were performed using the FTIR microscope IR scope 2 with a liquid-nitrogen-cooled mercury-cadmium-telluride (MCT) detector, coupled to the FTIR spectrometer Bruker Equinox model 55/S, using OPUS software (Bruker Optik GmbH, Ettlingen, Germany). For some of the experiments, Fourier Transform Infrared Microspectroscopy (FTIR-MSP) and Data Acquisition Measurements were performed using the FTIR microscope Nicolet Centaurus with a liquid-nitrogen-cooled mercury-cadmium-telluride (MCT) detector, coupled to the FTIR spectrometer Nicolet iSlO, OMNIC software (Nicolet, Madison, WI) using OPUS software (Bruker Optik GmbH, Ettlingen, Germany). Essentially the same results were obtained with each of these microscopes.
To achieve high signal-to-noise ratio (SNR), 128 coadded scans were collected in each measurement in the wavenumber region 700 to 4000 cm-1. The measurement site was circular with a diameter of 100 μπι and a spectral resolution of 4 cm-1 (0.482 cm-1 data spacing). To reduce cell amount variation and facilitate proper comparison between different samples, the following procedures were adopted.
1. Each sample was measured at least five times at different spots.
2. Analog to Digital Converter (ADC) rates were empirically chosen between 2000 to 3000 counts / sec (providing measurement areas with similar cellular density).
3. The obtained spectra were baseline corrected using the rubber band method, with 64 consecutive points, and normalized using vector normalization in OPUS software as described in an article entitled "Early spectral changes of cellular malignant transformation using Fourier transformation infrared microspectroscopy," by Bogomolny et al., 2007. J Biomed Opt.12:024003.
In order to obtain precise absorption values at a given wavenumber with minimal background interference, the second derivative spectra were used to determine concentrations of bio-molecules of interest. This method is susceptible to changes in full width at half maximum (FWHM) of the IR bands. However, in the case of biological samples, all cells from the same type are composed from similar basic components which give relatively broad bands. Thus, it is possible to generally neglect the changes in bands FWHM as described in an article entitled "Selenium alters the lipid content and protein profile of rat heart: An FTIR microspectroscopy study," by Toyran et al., ArcLBiochem.Biophys. 2007 458:184-193.
Statistical analysis:
Statistical analysis was performed using STATISTICA software (STATISTICA, StatSoft,
Inc., Tulsa, OK) and the student T-test. P-values < 0.05 were considered significant.
EXPERIMENTAL DATA
The experiments described hereinbelow were performed by the inventors in accordance with applications of the present invention and using the techniques described hereinabove.
The experiments presented hereinbelow with reference to Example 1 and Example 2 demonstrate that in accordance with some applications of the present invention, analysis of PBMC samples by FTIR-MSP techniques can be used for diagnosis of a solid tumor based on the FTIR-MSP spectral pattern at selected wavenumbers. Example 1
In a set of experiments, PBMC samples from 46 healthy controls were analyzed by FTIR- MSP, and a typical FTIR-MSP spectral pattern was established for control PBMC. Additionally, PBMC samples from 63 cancer patients suffering from multiple types of solid tumors were subjected to FTIR-MSP analysis and compared to the control FTIR-MSP spectral pattern. The PBMC samples were obtained by preliminary processing of the peripheral blood in accordance with the protocols described hereinabove with reference to extraction of peripheral blood mononuclear cells (PBMC). The PBMC samples were then analyzed by FTIR-MSP, in accordance with the protocols described hereinabove with reference to FTIR-MSP.
Reference is made to Figs. 1A-C, which are graphs representing FTIR absorption spectra and the second derivative of the absorption spectra and analysis thereof, for PBMC samples from 63 cancer patients suffering from solid tumors and 46 healthy controls, derived in accordance with some applications of the present invention.
FTIR-MSP analysis of peripheral blood mononuclear cells (PBMC) typically generated spectra in the region of 4000-700 cm-1. The spectra are composed of several absorption bands, each corresponding to specific functional groups of specific macromolecules. Fig. 1 A shows an average of the FTIR-MSP spectra of PBMC samples of healthy controls and cancer patients in the regions of 4000-700 cm-1, after baseline correction and vector normalization. The spectra are composed of several absorption bands, each corresponding to specific functional groups of specific macromolecules such as lipids, proteins, and carbohydrates /nucleic acids. The main absorption bands are marked. For example, the region 3000-2830 cm-1 contains symmetric and antisymmetric stretching of CH3 and CH2 groups, which correspond mainly to proteins and lipids respectively. The region 1700-1500 cm-1 corresponds to amide I and amide II, which contain information regarding the secondary structures of proteins. The region 1300-1000 cm-1 includes the symmetric and antisymmetric vibrations of P02- groups. 1000-700 cm-1 is a 'finger print' region which contains several different vibrations, corresponding to carbohydrates, lipids, nucleic acids and other bio-molecules, as described in an article by Mantsch M and Chapman D. entitled "Infrared spectroscopy of bio molecules," John Wiley New York 1996. The FTIR spectrum was typically analyzed by tracking changes in absorption (intensity and/or shift) of these macromolecules. Table Π represents some of the main ER. absorption bands for PBMC cells, and then- corresponding molecular functional groups:
Table Π:
Figure imgf000019_0001
Reference is made to Fig. IB. In order to achieve effective comparison between the PBMC samples of the cancer patients and the controls, the second derivative of the baseline- corrected, vector-normalized FTIR-MSP spectra was used. Results are presented in Fig. IB. As shown, the second derivative spectra of PBMC samples from the cancer patients differed significantly from the second derivative spectra of PBMC samples from the healthy controls in the spectral region of 1340-1260 cm-1. The mean ± SEM is represented by the hashed region (for control) and the dotted region (for cancer) as shown in the exploded view in Fig. IB.
Reference is made to Fig. 1C, which is a graph representing values of the second derivative of absorption spectra at wavenumbers A1-A23 of PBMC samples from cancer patients compared to PBMC samples from healthy controls, derived in accordance with some applications of the present invention. Statistical analysis was performed and P-values are provided. As shown, the second derivative of PBMC samples from the cancer patients differed significantly from the second derivative analysis of FTIR-MSP spectra from PBMC of healthy controls.
Table III lists the wavenumbers shown in Fig. 1C. Typically, PBMC samples were analyzed by FTIR-MSP techniques using these wavenumbers to distinguish between healthy controls and cancer patients.
Table III:
Figure imgf000021_0001
Example 2
In this set of experiments, PBMC from a single pancreatic cancer patient was subjected to FTIR-MSP analysis and compared to a control FTIR-MSP spectral pattern based on PBMC from 27 healthy controls. Results are presented in Figs. 2A-C. The PBMC was obtained by prelirninary processing of the peripheral blood in accordance with the protocols described hereinabove with reference to extraction of peripheral blood mononuclear cells (PBMC). The PBMC samples were then analyzed by FTIR-MSP in accordance with the protocols described hereinabove with reference to FTIR-Microspectroscopy.
Fig. 2 A shows representative FTIR-MSP spectra of PBMC of a healthy control compared to FTIR-MSP spectra of PBMC of a pancreatic cancer patient after baseline correction and Min- Max normalization to amide Π. Each spectrum represents the average of five measurements at different sites for each sample. The spectra are composed of several absorption bands, each corresponding to specific functional groups of specific macromolecules such as lipids, proteins, carbohydrates and nucleic acids. The main absorption bands are marked. The FTI spectrum was analyzed by tracking changes in absorption (intensity and/or shift) of these macromolecules.
As shown in Fig. 2A, the FTIR-MSP spectra derived from analysis of PBMC from the pancreatic cancer patient exhibited a different spectral pattern when compared to the FTIR-MSP spectra of PBMC of healthy controls.
Reference is made to Figs. 2B-C. In order to increase accuracy and achieve effective comparison between the PBMC sample of the pancreatic cancer patient and healthy controls, the second derivative of the baseline-corrected, vector-normalized FTIR spectra was used. Results are presented in Figs. 2B-C. The main absorption bands are marked. As shown, the second derivative spectral pattern of PBMC from the pancreatic cancer patient differed significantly from an average FTIR-MSP spectral pattern of PBMC of the healthy controls. The mean ± SEM for the controls is represented by the hashed region as shown in the exploded view in Figs. 2B-C.
Reference is now made to Example 3 - Example 5. The experiments presented hereinbelow with reference to Example 3 - Example 5 demonstrate that in accordance with some applications of the present invention, analysis of PBMC samples by FTIR-MSP techniques is used to detect a type of solid tumor. Typically, each type of malignant solid tumor produces distinct FTIR spectra of the PBMC which are unique to the type of solid tumor. Example 3
In this set of preliminary experiments, PBMC from cancer patients suffering from solid tumors, and PBMC from healthy controls was analyzed by FTIR-MSP. The population of cancer patients for this set of experiments comprised a total of 5 patients suffering from the following solid tumors: Breast (n=l), lung (n=l), pancreas (n=l), head and neck (n=l) and esophagus (n=l). The PBMC was obtained by preliminary processing of the peripheral blood in accordance with the protocols described hereinabove with reference to extraction of peripheral blood mononuclear cells (PBMC). The PBMC samples were then analyzed by FTIR-MSP in accordance with the protocols described hereinabove with reference to FTIR-Microspectroscopy. The results show that the FTIR-MSP spectral pattern of all the cancer patients differs from those of the healthy controls. The results additionally show that each type of malignancy produces a distinct spectral absorption pattern of the PBMC, which is unique to each type of solid tumor.
Reference is made to Figs. 3A-B. In order to increase accuracy and achieve effective comparison between PBMC samples of cancer patients and healthy controls, the second derivative of the baseline-corrected, vector-normalized FTIR spectra was used. Results are presented in Fig. 3A. As shown in Fig. 3A, the second derivative spectral pattern of PBMC from each one of the cancer patients differed from PBMC of the healthy controls. For example, the FTIR-MSP spectrum of PBMC of the lung cancer patient is distinct from control by exhibiting decreased absorbance of C¾, which corresponds to cellular lipids; a decrease in PCV; a shift to a higher wavenumber at 967 cm"1, which corresponds to deoxyribose skeletal motions of DNA; and an increase in RNA absorption.
Additionally, each spectrum has its own unique spectral pattern, which is distinct from control, and which is characteristic of each type of malignancy.
Reference is made to Fig. 3B, which is a graph showing an analysis of the second derivative data shown in Fig. 3A. Fig. 3B represents the change in value of each type of cancer relative to the control, as derived by analysis by FTIR-MSP of PBMC from each patient. As shown, each cancer patient exhibited a spectrum that differed from the control.
Fig. 3C is a table summarizing the main biochemical changes induced in PBMC of cancer patients suffering from different types of solid tumors, as observed by FTIR-MSP (shown in Figs. 3A-B) and analyzed in accordance with some applications of the present invention. Peak intensities which indicate absorption were calculated for each spectrum to reveal the main biochemical changes characteristic of each type of tumor. Example 4
In this set of experiments, PBMC from a breast cancer patient and a gastrointestinal cancer patient were analyzed by FTIR-MSP, and compared to analysis of PBMC from healthy controls. It is to be noted that the breast cancer patient suffers from a primary breast tumor, and the gastrointestinal cancer patient suffers from a primary gastrointestinal tumor. The gastrointestinal cancer patient has a history of breast cancer, and a pathological evaluation of the gastrointestinal tumor showed a breast cancer phenotype rather than a gastrointestinal phenotype.
First, peripheral blood was extracted from the two cancer patients and 27 healthy controls. The PBMC was obtained by preliminary processing of the peripheral blood in accordance with the protocols described hereinabove with reference to extraction of peripheral blood mononuclear cells (PBMC). The PBMC samples were then analyzed by FTIR-MSP in accordance with the protocols described hereinabove with reference to FTIR-Microspectroscopy.
The results show that the FTIR-MSP spectral pattern of PBMC from the cancer patients differs significantly from those of the healthy controls. The results additionally show that PBMC of the breast cancer patient and the gastrointestinal cancer patient (with a history of breast cancer) exhibited a similar spectral pattern that was distinct from the control. This can be explained by the gastrointestinal tumor being shown by pathological evaluation to have a phenotype characteristic of a breast tumor. In some cases of breast cancer, malignant cells break away from the primary breast tumor and spread to other parts of the body. These cells may remain inactive for years before they begin to grow again. It is possible that a tumor, although located remotely from the original tumor site, triggers biochemical changes in the PBMC that are similar to those triggered by the original tumor. It is to be noted that the spectral absorbance pattern of PBMC of both the breast cancer patient and the gastrointestinal cancer patient (who has a history of breast cancer) differ from the spectral pattern produced by PBMC of patients suffering from other types of solid tumors.
Fig. 4 shows second derivative spectra of PBMC from the breast cancer patient and from the gastrointestinal cancer patient (the gastrointestinal cancer patient having a history of breast cancer and the gastrointestinal tumor exhibiting a phenotype characteristic of a breast tumor) compared to PBMC of healthy controls, as derived in accordance with some applications of the present invention. As shown, the FTIR-MSP second derivative spectra exhibit significant differences between PBMC from the cancer patients and PBMC from healthy controls. These spectral differences typically represent molecular changes in the PBMC of the cancer patients and allow distmguishing between the healthy control and the cancer patients. In addition, PBMC from both the primary breast cancer patient and the gastrointestinal cancer patient exhibited a similar FTIR-MSP spectral partem. Accordingly, some applications of the present invention can be used to diagnose the type and/or the origin of solid tumor of a patient based on the unique FTIR-MSP spectra produced by analysis of the patient's PBMC. This is consistent with Example 3, which showed that PBMC from patients with different types of solid tumors each produced a distinct FTIR spectral pattern with its own set of characteristic bands. Additionally, the molecular changes which trigger the changes in the FTIR-MSP spectra of breast cancer patients, including patients with breast cancer history, can serve as biomarkers to diagnose breast cancer. Additionally, some applications of the present invention can be used to select effective treatment based on the origin of a tumor. It is to. be noted that, the type of solid tumor diagnosed in accordance with applications of the present invention is not limited to breast tumors, but may include any other type of solid tumors.
Example 5
In this set of experiments, PBMC samples from cancer patients suffering from various types of solid tumors were analyzed by FTIR-MSP. The FTIR-MSP spectral pattern of each type of solid tumor was compared to the FTIR-MSP spectral pattern of the other solid rumors, allowing distinguishing between different types of solid tumors. The population of cancer patients for this set of experiments comprised a total of 63 patients suffering from solid tumors, in accordance with Table I. The PBMC was obtained by preliminary processing of the peripheral blood in accordance with the protocols described hereinabove with reference to extraction of peripheral blood mononuclear cells (PBMC). The PBMC samples were then analyzed by FTIR-MSP, in accordance with the protocols described hereinabove with reference to FTIR-Microspectroscopy.
The results show that each type of solid tumor produces a distinct spectral absorption pattern of the PBMC, which is unique to each type of solid tumor, allowing distinguishing between different types of solid tumors.
Reference is made to Figs. 5A-C. In order to increase accuracy and achieve effective comparison between PBMC samples of the various types of cancer patients, the second derivative of the baseline-corrected, vector-normalized average FTIR absorption spectra was used. Results are presented in Figs. 5A-C, showing the second derivative of several regions of the spectra (the main absorption bands are marked). As shown in Figs. 5A-C, the second derivative spectra of each type of solid tumor produced a distinct spectral absorption pattern of the PBMC, which is unique to each type of solid tumor.
Reference is made to Figs. 5D-G, which are a series of graphs representing values of the second derivative of absorption spectra of each type of solid tumor compared to the second derivative of absorption spectra of the other solid tumors, derived in accordance with some applications of the present invention.
Fig. 5D is a graph representing values of the second derivative of absorption spectra of PBMC samples from the breast cancer patients (n=25) compared to PBMC samples from the cancer patients suffering from other types of solid tumors that do not include breast cancer (n=38), at wavenumbers Bl - B5. Statistical analysis was performed and P- values are provided. As shown, the second derivative of PBMC from the breast cancer patients differed significantly from the second derivative analysis of FTIR-MSP spectral patterns from PBMC of other cancer patients who do not have breast cancer.
Table IV lists the wavenumbers shown in Fig. 5D. Typically, PBMC samples were analyzed by FTIR-MSP techniques using these wavenumbers to distinguish between breast cancer patients and cancer patients who do not have breast cancer.
Table IV:
Figure imgf000026_0001
Fig. 5E is a graph representing values of the second derivative of absorption spectra of PBMC samples from the gastrointestinal cancer patients (n=18) compared to PBMC samples from the cancer patients suffering from other types of solid tumors that do not include gastrointestinal tumors (n=45), at wavenumbers CI - Cl l. Statistical analysis was performed and P-values are provided. As shown, the second derivative of PBMC from the gastrointestinal cancer patients differed significantly from the second derivative analysis of FTIR-MSP spectral pattern from PBMC of other cancer patients who do not have gastrointestinal cancer.
Table V lists the wavenumbers shown in Fig. 5E. Typically, PBMC samples were analyzed by FTIR-MSP techniques using these wavenumbers to distinguish between gastrointestinal cancer patients and cancer patients who do not have gastrointestinal cancer.
Table V:
Figure imgf000027_0001
Fig. 5F is a graph representing values of the second derivative of absorption spectra of PBMC samples from the lung cancer patients (n=8) compared to PBMC samples from the cancer patients suffering from other types of solid tumors that do not include lung tumors (n=55) at wavenumbers Dl - D24. Statistical analysis was performed and P-values are provided. As shown, the second derivative of PBMC from the lung cancer patients differed significantly from the second derivative analysis of FTIR-MSP spectral patterns from PBMC of other cancer patients who do not have lung cancer.
Table VI lists the wavenumbers shown in Fig. 5F. Typically, PBMC samples were analyzed by FTIR-MSP techniques using these wavenumbers to distinguish between lung cancer patients and cancer patients who do not have lung cancer.
Table VI:
Figure imgf000028_0001
D16 1373
D17 1417
D18 1458
D19 1469
D20 1692
D21 1714
D22 1728
D23 2852
D24 2984
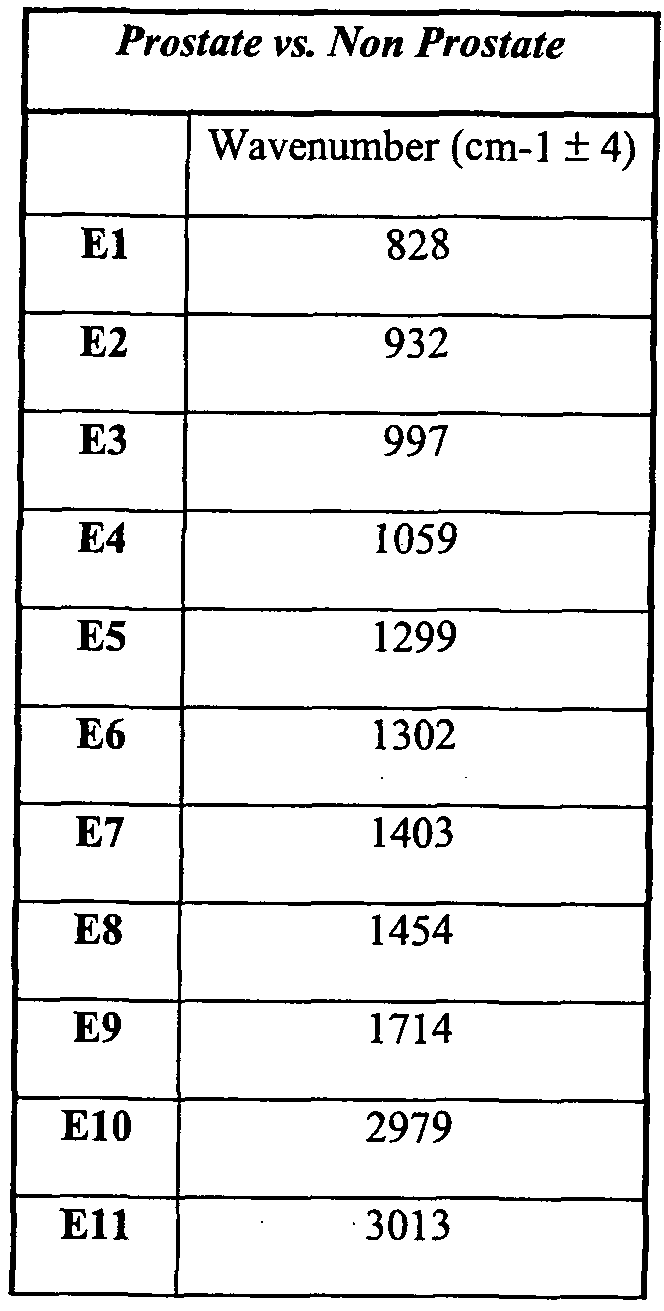
Fig. 5G is a graph representing values of the second derivative of absorption spectra of PBMC samples from the prostate cancer patients (n=5) compared to PBMC samples from the cancer patients suffering from other types of solid tumors that do not include prostate cancer (n=58) at wavenumbers El - El 1. Statistical analysis was performed and P-values are provided. As shown, the second derivative of PBMC from the prostate cancer patients differed significantly from the second derivative analysis of FTIR-MSP spectral pattern from PBMC of other cancer patients who do not have prostate cancer.
Table VII lists the wavenumbers shown in Fig. 5G. Typically, PBMC samples were analyzed by FTIR-MSP techniques using these wavenumbers to distinguish between prostate cancer patients and cancer patients who do not have prostate cancer.
Table MI:
Figure imgf000030_0001
Reference is now made to Example 6. The experiments presented hereinbelow with reference to Example 6 demonstrate that in accordance with some applications of the present invention, analysis of PBMC samples by FTIR-MSP techniques is used for staging cancer. Typically, each stage of cancer produces distinct FTIR spectra of the PBMC.
Example 6
In this set of experiments, PBMC samples from cancer patients suffering from different stages of cancer due to solid tumors were analyzed by FTIR-MSP and a second derivative of the average of the spectra was obtained for each of the stages of cancer, allowing distinguishing between different stages of cancer. The population of cancer patients for this set of experiments comprised a total of 63 patients suffering from the different stages (stages one and two (n=29), and stages three and four (n=34)) of cancer, as described in Table I. The PBMC was obtained by preliminary processing of the peripheral blood in accordance with the protocols described hereinabove with reference to extraction of peripheral blood mononuclear cells (PBMC). The PBMC samples were then analyzed by FTIR-MSP in accordance with the protocols described hereinabove with reference to FTIR-Microspectroscopy.
The results show that early stages of cancer produce spectral absorption pattern of the
PBMC, that are different than those produced by PBMC samples taken from patients with advanced stages of cancer, allowing distinguishing among different stages of cancer, in particular, between early and advanced stages.
Reference is made to Figs. 6A-C, which are graphs showing the second derivative spectra of PBMC and analysis thereof, based on PBMC samples from cancer patients suffering from different stages of cancer, derived in accordance with some applications of the present invention.
Fig. 6A is a graph representing the second derivative of baseline-corrected, vector- normalized average FTIR absorption spectra of PBMC samples obtained from cancer patients in different stages of the disease. As shown, PBMC of each stage of cancer produced a distinct spectral absorption pattern of the PBMC.
Fig. 6B is a graph representing the second derivative of baseline-corrected, vector- normalized average FTIR absorption spectra of PBMC samples obtained from breast cancer patients in different stages of the disease. As shown, PBMC of each stage of breast cancer produced a distinct spectral absorption pattern of the PBMC, and particularly, the early stages (stages one and two) were distinct from the more advanced stages (stages three and four). It is to be noted that breast cancer is shown by way of illustration and not limitation, and that the scope of the present includes staging of any type of solid tumor by techniques described herein.
Fig. 6C is a graph representing values of the second derivative of absorption spectra of PBMC samples from stage one and two (n=29) cancer patients, compared to stage three and four (n=34) cancer patients at wavenumbers Fl - F7. Statistical analysis was performed and P-values are provided. As shown, the second derivative of PBMC from the cancer patients with early stages of cancer (stages one and two) differed significantly from the second derivative analysis of FTIR-MSP spectral pattern of cancer patients with advanced stages of cancer (stage three and four). Table VUi lists the wavenumbers shown in Fig. 6A. Typically, PBMC samples were analyzed by FTIR-MSP techniques using these wavenumbers to distinguish between early stages (stage one and two) and more advanced stages (three and four) of cancer.
Table VIII:
Figure imgf000032_0001
Reference is made to Figs. 1-6 and Examples 1-6. It is to be noted that techniques described herein with reference to use of peripheral blood mononuclear cells (PBMC) may be applied to any type of white blood cell (WBC) or a combination of types of white blood cells. For example, analysis by FTIR microscopy techniques may be performed on any type of white blood cell, including but not limited to a total population of white blood cells (e.g., as obtained by red blood cell lysis).
Reference is still made to Figs. 1-6 and Examples 1-6.
The data obtained by analysis of the PBMC samples may be further analyzed by any suitable method known in the art, e.g., Artificial Neural Network and/or Cluster Analysis, and/or Principal Component Analysis, and/or Linear Discriminant Analysis (LDA) e.g., Fisher's Linear Discriminant Analysis (FLDA), Quadratic Discriminant Analysis, and/or Non Linear Discriminant Analysis.
For example, data obtained in accordance with applications of the present invention may be analyzed by an artificial neural network (ANN). Several biomarkers shown in Tables Π-VII which are statistically significant (p < 0.05) may be served as an input vector for the ANN analysis.
It is further noted that the scope of the present invention includes the use of only one wavenumber (representing one biomarker) for detection and/or monitoring of a solid tumor, as well as the use of two, three, four, or more wavenumbers.
Additionally, the scope of the present invention includes using any IR spectral feature or any feature derived from analysis of an IR spectral feature (e.g., any type of peak analysis), to indicate the presence of a solid tumor.
It is also noted that the scope of the present invention is not limited to any particular form or analysis of IR spectroscopy. For example, IR spectroscopy may include Attenuated Total Reflectance (ATR) spectroscopy techniques.
Although applications of the present invention are described hereinabove with respect to spectroscopy, microspectroscopy, and particularly FTER spectroscopy, the scope of the present invention includes the use of analysis techniques with data obtained by other means as well (for example, using a monochromator or an LED, at specific single wavenumbers, and/or FTIR imaging).
It will additionally be understood by one skilled in the art that aspects of the present invention described hereinabove can be embodied in a computer running software, and that the software can be supplied and stored in tangible media, e.g., hard disks, floppy disks, a USB flash drive, or compact disks, or in intangible media, e.g., in an electronic memory, or on a network such as the Internet.
It will be appreciated by persons skilled in the art that the present invention is not limited to what has been particularly shown and described hereinabove. Rather, the scope of the present invention includes both combinations and subcombinations of the various features described hereinabove, as well as variations and modifications thereof that are not in the prior art, which would occur to persons skilled in the art upon reading the foregoing description.

Claims

1. A method comprising:
obtaining an infrared (IR) spectrum of a Peripheral Blood Mononuclear Cells (PBMC) sample by analyzing the sample by infrared spectroscopy; and
based on the infrared spectrum, generating an output indicative of the presence of a solid tumor or a pre-malignant condition.
2. The method according to claim 1, wherein generating the output comprises generating the output indicative of the presence of the solid tumor.
3. The method according to claim 1, wherein analyzing the sample by infrared (IR) spectroscopy comprises analyzing the sample by Fourier Transformed Infrared (FTIR) spectroscopy, and wherein obtaining the infrared (IR) spectrum comprises obtaining a Pourier Transformed Infrared (FTIR) spectrum.
4. The method according to claim 3, wherein analyzing the sample by infrared (IR) spectroscopy comprises analyzing the sample by Fourier Transformed Infrared microspectroscopy (FTIR-MSP).
5. The method according to claim 1, wherein analyzing comprises assessing a characteristic of the sample at at least one wavenumber selected from the group consisting of: 765 ± 4 cm-1, 798 ± 4 cm-l, 809 ± 4 cm-1, 814 ± 4 cm-1 , 875 ± 4 cm-1, 997 ± 4 cm-1, 1001 ± 4 cm-1 , 1015 ± 4 cm-1, 1103 ± 4 cm-1, 11 18 ± 4 cm-1, 1162 ± 4 cm-1, 1221 ± 4 cm-1, 1270 ± 4 cm-1, 1283 ± 4 cm-1, 1295± 4 cm-l, 1315 ± 4 cm-1, 1341 ± 4 cm-1, 1367 ± 4 cm-1, 1392 ± 4 cm-1, 1429 ± 4 cm-1, 1440 ± 4 cm-1, 1445 ± 4 cm-1 and 1455 ± 4 cm-1.
6. The method according to claim 5, wherein analyzing comprises assessing the characteristic at at least two wavenumbers selected from the group.
7. The method according to claim 5, wherein analyzing comprises assessing the characteristic at at least three wavenumbers selected from the group.
8. The method according to claim 5, wherein assessing the characteristic comprises analyzing a band of the IR spectrum surrounding at least one wavenumber selected from the group.
9. The method according to claim 1, wherein analyzing the sample comprises obtaining a second derivative of the infrared (IR) spectrum of the sample.
10. The method according to claim 1, wherein the infrared (IR) spectrum includes an absorption spectrum, and wherein obtaining the infrared (IR) spectrum comprises obtaining the absorption spectrum.
11. The method according to claim 1, wherein the infrared (IR) spectrum includes a reflection spectrum, and wherein obtaining the infrared (IR) spectrum comprises obtaining the reflection spectrum.
12. The method according to claim 1, wherein generating the output comprises indicating via the output whether the solid tumor is a first type of solid tumor or a second type of solid tumor.
13. The method according to claim 1, wherein the solid tumor includes a solid tumor in tissue selected from the group consisting of: head and neck, esophagus, and pancreas, and wherein generating the output comprises generating an output indicative of the presence of a solid tumor in tissue selected from the group.
14. The method according to claim 1, wherein the solid tumor includes a solid tumor in tissue selected from the group consisting of: breast, gastrointestinal tract, prostate, and lung, and wherein generating the output comprises generating an output indicative of the presence of a solid tumor in tissue selected from the group.
15. The method according to claim 14, wherein analyzing comprises assessing a characteristic of the sample at at least one wavenumber selected from the group consisting of:
752 ± 4 cm-1, 1030 ± 4 cm-1, 1046 ± 4 cm-1, 1128 ± 4 cm-1, and 1237 ± 4 cm-1, and wherein generating comprises generating an output indicative of the presence of a tumor in the breast tissue.
16. The method according to claim 14, wherein analyzing comprises assessing a characteristic of the sample at at least one wavenumber selected from the group consisting of:
797 ± 4 cm-1, 830 ± 4 cm-1, 893 ± 4 cm-1, 899 ± 4 cm-1, 1128 ± 4 cm-1, 1298 ± 4 cm-1, 1354 ± 4 cm-1, 1714 ± 4 cm-1 1725 ± 4 cm-1, 1738, ± 4 cm-1, and 3013 ± 4 cm-1, and wherein generating comprises generating an output indicative of the presence of a tumor in the gastrointestinal tract tissue.
17. The method according to claim 14, wherein analyzing comprises assessing a characteristic of the sample at at least one wavenumber selected from the group consisting of: 765 ± 4 cm-1, 780 ± 4 cm-1, 797 ± 4 cm-1, 851 ± 4 cm-1, 874 ± 4 cm-1, 881 ± 4 cm-1, 913 ± 4 cm-1, 923 ± 4 cm-1, 958 ± 4 cm-i, 968, ± 4 cm-1, 1044 ± 4 cm-1, 1085 ± 4 cm-1, 1191 ± 4 cm- 1, 1241 ± 4 cm-1, 1344 ± 4 cm-1, 1373 ± 4 cm-1, 1417 ± 4 cm-1, 1458 ± 4 cm-1, 1469 ± 4 cm-1, 1692 ± 4 cm-1, 1714 ± 4 cm-1, 1728 ± 4 cm-1, 2852 ± 4 cm-1, and 2984 ± 4 cm, and wherein generating comprises generating an output indicative of the presence of a tumor in the lung tissue.
18. The method according to claim 14, wherein analyzing comprises assessing a characteristic of the sample at at least one wavenumber selected from the group consisting of:
828 ± 4 cm-1, 932 ± 4 cm-1, 997 ± 4 cm-1, 1059 ± 4 cm-1, 1299 ± 4 cm-1, 1302 ± 4 cm-1, 1403 ± 4 cm-1, 1454 ± 4 cm-1, 1714 ± 4 cm-1, 2979, ± 4 cm-1, and 3013 ± 4 cm-1, and wherein generating comprises generating an output indicative of the presence of a tumor in the prostate tissue.
19. A method comprising:
obtaining an infrared (IR) spectrum of a sample of white blood cells by analyzing the sample by infrared spectroscopy; and
based on the infrared spectrum, generating an output indicative of the presence of a solid tumor or a pre-malignant condition.
20. The method according to claim 19, wherein generating the output comprises generating the output indicative of the presence of the solid tumor.
21. The method according to claim 19, wherein analyzing the sample by infrared (IR) spectroscopy comprises analyzing the sample by Fourier Transformed Infrared (FTIR) spectroscopy, and wherein obtaining the infrared (IR) spectrum comprises obtaining a Fourier Transformed Infrared (FTIR) spectrum.
22. The method according to claim 21, wherein analyzing the sample by infrared (IR) spectroscopy comprises analyzing the sample by Fourier Transformed Infrared microspectroscopy (FTIR-MSP).
23. A method for monitoring the effect of an anti-cancer treatment on a subject undergoing anti-cancer treatment for a solid tumor, for use with a first Peripheral Blood Mononuclear Cells (PBMC) sample separated from blood of the subject that was obtained prior to initiation of the treatment and a second PBMC sample separated from blood of the subject that was obtained after initiation of the treatment, the method comprising:
obtaining IR spectra of the first and second PBMC samples by analyzing the first and second PBMC samples by ER spectroscopy; and
based on the IR spectra, generating an output indicative of the effect of the treatment.
24. The method according to claim 23, wherein analyzing the first and second PBMC samples by IR spectroscopy comprises analyzing the samples by Fourier Transformed Infrared spectroscopy, and wherein obtaining the IR spectra comprises obtaining Fourier Transformed Infrared (FTIR) spectra.
25. The method according to claim 24, wherein analyzing the first and second PBMC samples by infrared (ER) spectroscopy comprises analyzing the first and second PBMC samples by Fourier Transformed Infrared microspectroscopy (FTIR-MSP).
26. The method according to claim 23, further comprising obtaining an IR spectrum of a third PBMC sample separated from blood of the subject that was obtained following termination of the treatment, by analyzing the third PBMC sample by IR spectroscopy.
27. The method according to claim 3, wherein analyzing comprises assessing a characteristic of the sample at at least one wavenumber selected from the group consisting of: 765 ± 4 cm-1,
798 ± 4 cm-1, 809 ± 4 cm-1, 814 ± 4 cm-1, 875 ± 4 cm-1, 997 ± 4 cm-1, 1001 ± 4 cm-1, 1015 ± 4 cm-1, 1103 ± 4 cm-1, 1118 ± 4 cm-1, 1162 ± 4 cm-1, 1221 ± 4 cm-1, 1270 ± 4 cm-1, 1283 ± 4 cm-1, 1295 ± 4 cm-1, 1315 ± 4 cm-1, 1341 ± 4 cm-1, 1367 ± 4 cm-1, 1392 ± 4 cm-1, 1429 ± 4 cm-1, 1440 ± 4 cm-1, 1445 ± 4 cm-1, and 1455 ± 4 cm-1.
28. The method according to claim 27, wherein analyzing comprises assessing the characteristic at at least two wavenumbers selected from the group.
29. The method according to claim 27, wherein analyzing comprises assessing the characteristic at at least three wavenumbers selected from the group.
30. A method comprising:
obtaining an infrared (IR) spectrum of a Peripheral Blood Mononuclear Cells (PBMC) sample by analyzing the sample; and
based on the infrared spectrum, generating an output indicative of the presence of a solid tumor or a pre-malignant condition.
31. The method according to claim 30, wherein generating the output comprises generating the output indicative of the presence of the solid tumor.
32. A system for diagnosing a solid tumor, comprising:
a data processor, configured to analyze an infrared (IR) spectrum of a Peripheral Blood Mononuclear Cells (PBMC) sample of a subject; and
an output unit, configured to generate an output indicative of the presence of a solid tumor, based on the infrared (IR) spectrum.
33. The system according to claim 32, wherein the data processor is configured to calculate a second derivative of the infrared (IR) spectrum of the PBMC sample and, based on the second derivative of the infrared (IR) spectrum, to generate an output indicative of the presence of a solid tumor.
34. The system according to claim 33, wherein the IR spectrum includes a Fourier Transformed Infrared (FTIR) spectrum, and wherein the data processor is configured to calculate a second derivative of the FTIR spectrum.
35. The system according to claim 32, wherein the data processor is configured to analyze the infrared (IR) spectrum by assessing a characteristic of the PBMC sample at at least one wavenumber selected from the group consisting of: 765 ± 4 cm-1, 798 ± 4 cm-1, 809 ± 4 cm-1, 814 ± 4 cm-1, 875 ± 4 cm-1, 997 ± 4 cm-1, 1001 ± 4 cm-1, 1015 ± 4 cm-1, 1103 ± 4 cm-1, 1118 ± 4 cm-1, 1162 ± 4 cm-1, 1221 ± 4 cm-1, 1270 ± 4 cm-1, 1283 ± 4 cm-1, 1295± 4 cm-1, 1315 ± 4 cm-1, 1341 ± 4 cm-1, 1367 ± 4 cm-1, 1392 ± 4 cm-1, 1429 ± 4 cm-1, 1440 ± 4 cm-1, 1445 ± 4 cm-1, and 1455 ± 4 cm-1.
36. The system according to claim 35, wherein the data processor is configured to analyze the infrared (IR) spectrum by assessing the characteristic at at least two wavenumbers selected from the group.
37. The system according to claim 35, wherein the data processor is configured to analyze the infrared (IR) spectrum by assessing the characteristic at at least three wavenumbers selected from the group.
38. A computer program product for administering processing of a body of data, the product comprising a computer-readable medium having program instructions embodied therein, which instructions, when read by a computer, cause the computer to:
obtain an infrared (IR) spectrum of a Peripheral Blood Mononuclear Cells (PBMC) by analyzing the PBMC by infrared spectroscopy; and
based on the infrared spectrum, generate an output indicative of the presence of a solid tumor.
39. A method comprising:
obtaining an infrared (IR) spectrum of a Peripheral Blood Mononuclear Cells (PBMC) sample by analyzing the sample by infrared spectroscopy; and
based on the infrared spectrum, generating an output indicative of the presence of a solid tumor in a breast tissue of a subject.
40. The method according to claim 39, wherein analyzing comprises assessing a characteristic of the sample at at least one wavenumber selected from the group consisting of: 752 ± 4 cm-1, 1030 ± 4 cm-1, 1046 ± 4 cm-1, 1128 ± 4 cm-1, and 1237 ± 4 cm-1.
41. The method according to claim 40, wherein analyzing comprises assessing the characteristic at at least two wavenumbers selected from the group.
42. The method according to claim 40, wherein analyzing comprises assessing the characteristic at at least three wavenumbers selected from the group.
43. The method according to claim 39, wherein analyzing the sample by infrared (IR) spectroscopy comprises analyzing the sample by Fourier Transformed Infrared (FTIR) spectroscopy, and wherein obtaining the infrared (IR) spectrum comprises obtaining a Fourier Transformed Infrared (FTIR) spectrum.
44. The method according to claim 43, wherein analyzing the sample by infrared (IR) spectroscopy comprises analyzing the sample by Fourier Transformed Infrared microspectroscopy (FTIR-MSP).
45. A method comprising:
obtaining an infrared (IR) spectrum of a Peripheral Blood Mononuclear Cells (PBMC) sample by analyzing the sample by infrared spectroscopy; and
based on the infrared spectrum, generating an output indicative of the presence of a solid tumor in tissue of a gastrointestinal tract of a subject.
46. The method according to claim 45, wherein analyzing comprises assessing a characteristic of the sample at at least one wavenumber selected from the group consisting of:
797 ± 4 cm-1, 830 ± 4 cm-1, 893 ± 4 cm-1, 899 ± 4 cm-1, 1128 ± 4 cm-1, 1298 ± 4 cm-1, 1354 ± 4 cm-1, 1714 ± 4 cm-1 1725 ± 4 cm-1, 1738, ± 4 cm-1, and 3013 ± 4 cm-1.
47. The method according to claim 46, wherein analyzing comprises assessing the characteristic at at least two wavenumbers selected from the group.
48. The method according to claim 46, wherein analyzing comprises assessing the characteristic at at least three wavenumbers selected from the group.
49. The method according to claim 45, wherein analyzing the sample by infrared (IR) spectroscopy comprises analyzing the sample by Fourier Transformed Infrared (FTIR) spectroscopy, and wherein obtaining the infrared (IR) spectrum comprises obtaining a Fourier Transformed Infrared (FTIR) spectrum.
50. The method according to claim 49, wherein analyzing the sample by infrared (IR) spectroscopy comprises analyzing the sample by Fourier Transformed Infrared microspectroscopy (FTIR-MSP).
51. A method comprising:
obtaining an infrared (IR) spectrum of a Peripheral Blood Mononuclear Cells (PBMC) sample by analyzing the sample by infrared spectroscopy; and
based on the infrared spectrum, generating an output indicative of the presence of a solid tumor in lung tissue of a subject.
52. The method according to claim 51, wherein analyzing comprises assessing a characteristic of the sample at at least one wavenumber selected from the group consisting of: 765 ± 4 cm-1 , 780 ± 4 cm-1, 797 ± 4 cm-1, 851 ± 4 cm-1, 874 ± 4 cm-1, 881 ± 4 cm-1, 913 ± 4 cm-1, 923 ± 4 cm-1, 958 ± 4 cm-1, 968, ± 4 cm-1, 1044 ± 4 cm-1, 1085 ± 4 cm-1, 1191 ± 4 cm- 1, 1241 ± 4 cm-1, 1344 ± 4 cm-1, 1373 ± 4 cm-1 , 1417 ± 4 cm-1, 1458 ± 4 cm-1, 1469 ± 4 cm-1, 1692 ± 4 cm-1, 1714 ± 4 cm-1, 1728 ± 4 cm-1, 2852 ± 4 cm-1, and 2984 ± 4 cm.
53. The method according to claim 52, wherein analyzing comprises assessing the characteristic at at least two wavenumbers selected from the group.
54. The method according to claim 52, wherein analyzing comprises assessing the characteristic at at least three wavenumbers selected from the group.
55. The method according to claim 51, wherein analyzing the sample by infrared (IR) spectroscopy comprises analyzing the sample by Fourier Transformed Infrared (FTIR) spectroscopy, and wherein obtaining the infrared (ER.) spectrum comprises obtaining a Fourier Transformed Infrared (FTIR) spectrum.
56. The method according to claim 55, wherein analyzing the sample by infrared (IR) spectroscopy comprises analyzing the sample by Fourier Transformed Infrared microspectroscopy (FTIR-MSP).
57. A method comprising:
obtaining an infrared (IR) spectrum of a Peripheral Blood Mononuclear Cells (PBMC) sample by analyzing the sample by infrared spectroscopy; and
based on the infrared spectrum, generating an output indicative of the presence of a solid tumor in a prostate tissue of a subject.
58. The method according to claim 57, wherein analyzing comprises assessing a characteristic of the sample at at least one wavenumber selected from the group consisting of: 828 ± 4 cm-1, 932 ± 4 cm-1, 997 ± 4 cm-1, 1059 ± 4 cm-1, 1299 ± 4 cm-1, 1302 ± 4 cm-1, 1403 ± 4 cm-1, 1454 ± 4 cm-1, 1714 ± 4 cm-1, 2979, ± 4 cm-1, and 3013 ± 4 cm-1.
59. The method according to claim 58, wherein analyzing comprises assessing the characteristic at at least two wavenumbers selected from the group.
60. The method according to claim 58, wherein analyzing comprises assessing the characteristic at at least three wavenumbers selected from the group.
61. The method according to claim 57, wherein analyzing the sample by infrared (IR) spectroscopy comprises analyzing the sample by Fourier Transformed Infrared (FTIR) spectroscopy, and wherein obtaining the infrared (IR) spectrum comprises obtaining a Fourier Transformed Infrared (FTIR) spectrum.
62. The method according to claim 61, wherein analyzing the sample by infrared (IR) spectroscopy comprises analyzing the sample by Fourier Transformed Infrared microspectroscopy (FTIR-MSP).
63. A method comprising:
obtaining an infrared (IR) spectrum of a Peripheral Blood Mononuclear Cells (PBMC) sample from a cancer patient by analyzing the sample by infrared spectroscopy; and
based on the infrared spectrum, generating an output indicative of a stage of the cancer.
64. The method according to claim 63, wherein analyzing comprises assessing a characteristic of the sample at at least one wavenumber selected from the group consisting of:
865 ± 4 cm-1, 897 ± 4 cm-1, 924 ± 4 cm-1, 1030 ± 4 cm-1, 1047 ± 4 cm-1, 1191 ± 4 cm-1, and 1238 ± 4 cm-1.
65. The method according to claim 64, wherein analyzing comprises assessing the characteristic at at least two wavenumbers selected from the group.
66. The method according to claim 64, wherein analyzing comprises assessing the characteristic at at least three wavenumbers selected from the group.
67. The method according to claim 63, wherein analyzing the sample by infrared (IR) spectroscopy comprises analyzing the sample by Fourier Transformed Infrared (FTIR) spectroscopy, and wherein obtaining the infrared (IR) spectrum comprises obtaining a Fourier Transformed Infrared (FTIR) spectrum.
68. The method according to claim 67, wherein analyzing the sample by infrared (IR) spectroscopy comprises analyzing the sample by Fourier Transformed Infrared microspectroscopy (FTIR-MSP).
PCT/IL2011/000426 2010-06-01 2011-06-01 Diagnosis of cancer WO2011151825A2 (en)

Priority Applications (8)

Application Number Priority Date Filing Date Title
RU2012157998/15A RU2012157998A (en) 2010-06-01 2011-06-01 CANCER DIAGNOSTICS
US13/701,262 US9606057B2 (en) 2010-06-01 2011-06-01 Biochemical analysis of PBMC
JP2013513040A JP2013533960A (en) 2010-06-01 2011-06-01 Diagnosis of cancer
EP11789348.7A EP2577298B1 (en) 2010-06-01 2011-06-01 Diagnosis of cancer
IL223237A IL223237B (en) 2010-06-01 2012-11-25 Method for indicating the precence of solid tumor
US15/443,674 US20170176327A1 (en) 2010-06-01 2017-02-27 Biochemical analysis of pbmc
US16/789,978 US11561174B2 (en) 2010-06-01 2020-02-13 Infrared (IR) spectroscopy system
US18/100,276 US20230160822A1 (en) 2010-06-01 2023-01-23 Infrared (ir) spectroscopy system

Applications Claiming Priority (2)

Application Number Priority Date Filing Date Title
US35007310P 2010-06-01 2010-06-01
US61/350,073 2010-06-01

Related Child Applications (2)

Application Number Title Priority Date Filing Date
US13/701,262 A-371-Of-International US9606057B2 (en) 2010-06-01 2011-06-01 Biochemical analysis of PBMC
US15/443,674 Continuation US20170176327A1 (en) 2010-06-01 2017-02-27 Biochemical analysis of pbmc

Publications (2)

Publication Number Publication Date
WO2011151825A2 true WO2011151825A2 (en) 2011-12-08
WO2011151825A3 WO2011151825A3 (en) 2012-01-26

Family

ID=45067149

Family Applications (1)

Application Number Title Priority Date Filing Date
PCT/IL2011/000426 WO2011151825A2 (en) 2010-06-01 2011-06-01 Diagnosis of cancer

Country Status (5)

Country Link
US (4) US9606057B2 (en)
EP (1) EP2577298B1 (en)
JP (1) JP2013533960A (en)
RU (1) RU2012157998A (en)
WO (1) WO2011151825A2 (en)

Cited By (7)

* Cited by examiner, † Cited by third party
Publication number Priority date Publication date Assignee Title
WO2014076480A1 (en) * 2012-11-15 2014-05-22 University Of Central Lancashire Methods of diagnosing proliferative disorders
WO2014191980A1 (en) * 2013-05-28 2014-12-04 Todos Medical Ltd. Differential diagnosis of benign tumors
WO2017042579A1 (en) * 2015-09-10 2017-03-16 Beamline Diagnostics Ltd Method, computer programme and system for analysing a sample comprising identifying or sorting cells according to the ftir spectrum each cell produces
US9606057B2 (en) 2010-06-01 2017-03-28 Todos Medical Ltd. Biochemical analysis of PBMC
GB2545676A (en) * 2015-12-21 2017-06-28 Dublin Inst Of Tech Prediction of therapeutic response using vibrational spectroscopy
US9719937B2 (en) 2011-05-11 2017-08-01 Todos Medical Ltd. Diagnosis of cancer
WO2019216260A1 (en) 2018-05-09 2019-11-14 国立研究開発法人量子科学技術研究開発機構 Tissue identifying device, tissue identifying system, tissue identifying method, inspecting method, endoscope system, tissue identifying program, and recording medium

Families Citing this family (1)

* Cited by examiner, † Cited by third party
Publication number Priority date Publication date Assignee Title
GB201806002D0 (en) * 2018-04-11 2018-05-23 Univ Liverpool Methods of spectroscopic analysis

Family Cites Families (43)

* Cited by examiner, † Cited by third party
Publication number Priority date Publication date Assignee Title
US4912050A (en) 1986-02-26 1990-03-27 The Beth Israel Hospital Association Process for the screening of cancer using nuclear magnetic resonance
US4832483A (en) 1987-09-03 1989-05-23 New England Medical Center Hospitals, Inc. Method of using resonance raman spectroscopy for detection of malignancy disease
US5197470A (en) 1990-07-16 1993-03-30 Eastman Kodak Company Near infrared diagnostic method and instrument
US5168162A (en) 1991-02-04 1992-12-01 Cornell Research Foundation, Inc. Method of detecting the presence of anomalies in exfoliated cells using infrared spectroscopy
CA2035603C (en) 1991-02-04 1998-08-04 Patrick T.T. Wong A method of detecting the presence of anomalies exfoliated cells using infrared spectroscopy
US5261410A (en) 1991-02-07 1993-11-16 Alfano Robert R Method for determining if a tissue is a malignant tumor tissue, a benign tumor tissue, or a normal or benign tissue using Raman spectroscopy
US6690966B1 (en) * 1991-02-26 2004-02-10 Massachusetts Institute Of Technology Methods of molecular spectroscopy to provide for the diagnosis of tissue
EP0644412A3 (en) 1993-09-17 1995-08-09 Boehringer Mannheim Gmbh Method for the analysis of fluids and suspensions having clinical relevance.
EP0767902A1 (en) 1994-06-28 1997-04-16 WONG, Patrick, T.,T. Infrared spectroscopy of a sample treated with preservative
US5697373A (en) 1995-03-14 1997-12-16 Board Of Regents, The University Of Texas System Optical method and apparatus for the diagnosis of cervical precancers using raman and fluorescence spectroscopies
US5733739A (en) 1995-06-07 1998-03-31 Inphocyte, Inc. System and method for diagnosis of disease by infrared analysis of human tissues and cells
AUPN825796A0 (en) * 1996-02-26 1996-03-14 Ashdown, Martin The application of infrared (ir) spectrometry to the investigations of components of blood and other body fluids
US5945675A (en) 1996-03-18 1999-08-31 Pacific Northwest Research Foundation Methods of screening for a tumor or tumor progression to the metastatic state
US20030054443A1 (en) * 1997-08-05 2003-03-20 Ruben Steven M. 90 human secreted proteins
US6214550B1 (en) 1997-06-27 2001-04-10 Pacific Northwest Research Institute Methods of differentiating metastatic and non-metastatic tumors
US5945674A (en) 1997-07-30 1999-08-31 Vysis, Inc. Method of identifying cellular types in a biological sample supported on an absorptive substrate by infrared spectroscopy
US6274871B1 (en) * 1998-10-22 2001-08-14 Vysis, Inc. Method and system for performing infrared study on a biological sample
US6251616B1 (en) 1999-01-14 2001-06-26 Biocrystal Ltd. Methods and assay kits for detecting altered mononuclear cell phenotype related to a pro-tumor immune response
US7450229B2 (en) * 1999-01-25 2008-11-11 Amnis Corporation Methods for analyzing inter-cellular phenomena
US6749565B2 (en) 2000-07-08 2004-06-15 Victor Chudner Method for blood infrared spectroscopy diagnosing of inner organs pathology
US6841388B2 (en) 2000-12-05 2005-01-11 Vysis, Inc. Method and system for diagnosing pathology in biological samples by detection of infrared spectral markers
US7132510B2 (en) 2000-12-29 2006-11-07 Bio-Technology General (Israel) Ltd. Specific human antibodies for selective cancer therapy
AU2002234621A1 (en) 2001-01-22 2002-07-30 Ralf Masuch Rapid test for biological substances using ftir
IL146521A0 (en) 2001-11-15 2002-07-25 Univ Ben Gurion Novel optical method for diagnosis and grading of premalignant and malignant human colonic tissues
MXPA05005283A (en) * 2002-11-21 2005-07-25 Wyeth Corp Methods for diagnosing rcc and other solid tumors.
CA2523798A1 (en) 2003-04-29 2004-11-11 Wyeth Methods for prognosis and treatment of solid tumors
WO2006011487A1 (en) 2004-07-30 2006-02-02 National University Corporation Chiba University Method for measuring glucose concentration in blood using infrared spectroscopy and instrument employing it
MX2007001357A (en) 2004-08-02 2009-08-07 Childrens Medical Center Platelet biomarkers for cancer.
US20070003921A1 (en) 2005-07-01 2007-01-04 Andrus Paul G Method of grading disease by Fourier Transform Infrared Spectroscopy
US20090175819A1 (en) 2005-11-15 2009-07-09 Apollo Life Sciences Limited Molecule and chimeric molecules thereof
US8774902B2 (en) 2006-06-01 2014-07-08 Passive Imaging Medical Systems Engineering Ltd. (Pims) Method of infrared thermography for earlier diagnosis of gastric colorectal and cervical cancer
JP5047962B2 (en) 2006-07-06 2012-10-10 株式会社疲労科学研究所 Method of operating test / diagnosis apparatus for cancer, systemic lupus erythematosus (SLE) or antiphospholipid antibody syndrome using near infrared light
WO2010093503A2 (en) 2007-01-05 2010-08-19 Myskin, Inc. Skin analysis methods
CA2703794C (en) 2007-12-10 2017-03-21 The Medical Research, Infrastructure, And Health Services Fund Of The Tel Aviv Medical Center Methods of diagnosing cancer
KR20110036056A (en) 2008-06-26 2011-04-06 다나-파버 캔서 인스티튜트 인크. Signatures and determinants associated with metastasis and methods of use thereof
US20100210023A1 (en) 2008-09-22 2010-08-19 The Regents Of The University Of California Salivary metabolic biomarkers for human oral cancer detection
WO2011121588A1 (en) 2010-03-29 2011-10-06 Ben Gurion University Of The Negev Research And Development Authority Method and system for detecting and monitoring hematological cancer
US9606057B2 (en) 2010-06-01 2017-03-28 Todos Medical Ltd. Biochemical analysis of PBMC
EP2707710B1 (en) 2011-05-11 2022-08-17 Todos Medical Ltd. Diagnosis of cancer based on infrared spectroscopic analysis of dried blood plasma samples
US20140087397A1 (en) 2012-09-25 2014-03-27 Children's Hospital Medical Center Biomarkers for fanconi anemia
WO2014055683A1 (en) 2012-10-03 2014-04-10 The Research Foundation For The State University Of New York Spectroscopic method for alzheimer's disease diagnosis
EP3004870B1 (en) 2013-05-28 2019-01-02 Todos Medical Ltd. Differential diagnosis of benign tumors
US11534622B2 (en) * 2014-08-18 2022-12-27 Immunolight, Llc Non-invasive systems and methods for selective activation of photoreactive responses

Non-Patent Citations (5)

* Cited by examiner, † Cited by third party
Title
BOGOMOLNY ET AL.: "Early spectral changes of cellular malignant transformation using Fourier transformation infrared microspectroscopy", J BIOMED OPT., vol. 12, 2007, pages 024003
MANTSCH M; CHAPMAN D: "Infrared spectroscopy of bio molecules", 1996, JOHN WILEY
See also references of EP2577298A4
SOBIN LH. ET AL.: "TNM Classification of Malignant Tumours", 2009, JOHN WILEY
TOYRAN ET AL.: "Selenium alters the lipid content and protein profile of rat heart: An FTIR microspectroscopy study", ARCH.BIOCHEM.BIOPHYS., vol. 458, 2007, pages 184 - 193, XP005874748, DOI: doi:10.1016/j.abb.2006.12.012

Cited By (22)

* Cited by examiner, † Cited by third party
Publication number Priority date Publication date Assignee Title
US9606057B2 (en) 2010-06-01 2017-03-28 Todos Medical Ltd. Biochemical analysis of PBMC
US11561174B2 (en) 2010-06-01 2023-01-24 Todos Medical Ltd. Infrared (IR) spectroscopy system
US10139349B2 (en) 2011-05-11 2018-11-27 Todos Medical Ltd. Diagnosis of cancer
US10379056B2 (en) 2011-05-11 2019-08-13 Todos Medical Ltd. Diagnosis of cancer
US9719937B2 (en) 2011-05-11 2017-08-01 Todos Medical Ltd. Diagnosis of cancer
WO2014076480A1 (en) * 2012-11-15 2014-05-22 University Of Central Lancashire Methods of diagnosing proliferative disorders
CN104981695A (en) * 2012-11-15 2015-10-14 中央兰开夏大学 Methods of diagnosing proliferative disorders
US9664680B2 (en) 2012-11-15 2017-05-30 University Of Central Lancashire Methods of diagnosing proliferative disorders
EP3118624A1 (en) * 2012-11-15 2017-01-18 University of Central Lancashire Methods of diagnosing proliferative disorders
US10288615B2 (en) 2012-11-15 2019-05-14 University Of Central Lancashire Methods of diagnosing proliferative disorders
US9804145B2 (en) 2013-05-28 2017-10-31 Todos Medical Ltd. Infrared analysis of benign tumors
US10732165B2 (en) 2013-05-28 2020-08-04 Todos Medical Ltd. Infrared analysis of benign tumors
EP3489659A1 (en) * 2013-05-28 2019-05-29 Todos Medical Ltd. Differential diagnosis of benign tumors
WO2014191980A1 (en) * 2013-05-28 2014-12-04 Todos Medical Ltd. Differential diagnosis of benign tumors
US11513112B2 (en) 2013-05-28 2022-11-29 Todos Medical Ltd. Infrared analysis of benign tumors
WO2017042579A1 (en) * 2015-09-10 2017-03-16 Beamline Diagnostics Ltd Method, computer programme and system for analysing a sample comprising identifying or sorting cells according to the ftir spectrum each cell produces
US10809190B2 (en) 2015-09-10 2020-10-20 Beamline Diagnostics Ltd Method, computer programme and system for analysing a sample comprising identifying or sorting cells according to the FTIR spectrum each cell produces
GB2545676A (en) * 2015-12-21 2017-06-28 Dublin Inst Of Tech Prediction of therapeutic response using vibrational spectroscopy
US10725017B2 (en) 2015-12-21 2020-07-28 Technological University Dublin Prediction of therapeutic response using vibrational spectroscopy
KR20210002729A (en) 2018-05-09 2021-01-08 국립연구개발법인 양자과학기술연구개발기구 Organization identification device, organization identification system, organization identification method, organization identification program and recording medium
JPWO2019216260A1 (en) * 2018-05-09 2020-05-28 国立研究開発法人量子科学技術研究開発機構 Tissue identification device, tissue identification system, tissue identification method, inspection method, endoscope system, tissue identification program and recording medium
WO2019216260A1 (en) 2018-05-09 2019-11-14 国立研究開発法人量子科学技術研究開発機構 Tissue identifying device, tissue identifying system, tissue identifying method, inspecting method, endoscope system, tissue identifying program, and recording medium

Also Published As

Publication number Publication date
US11561174B2 (en) 2023-01-24
US20230160822A1 (en) 2023-05-25
US20200182791A1 (en) 2020-06-11
US20170176327A1 (en) 2017-06-22
EP2577298B1 (en) 2020-02-26
EP2577298A4 (en) 2017-12-06
WO2011151825A3 (en) 2012-01-26
JP2013533960A (en) 2013-08-29
US20130143258A1 (en) 2013-06-06
EP2577298A2 (en) 2013-04-10
US9606057B2 (en) 2017-03-28
RU2012157998A (en) 2014-07-20

Similar Documents

Publication Publication Date Title
US11561174B2 (en) Infrared (IR) spectroscopy system
US10379056B2 (en) Diagnosis of cancer
Liu et al. Raman spectroscopy in colorectal cancer diagnostics: Comparison of PCA-LDA and PLS-DA models
US11513112B2 (en) Infrared analysis of benign tumors
Beleites et al. Classification of human gliomas by infrared imaging spectroscopy and chemometric image processing
US20130137134A1 (en) Method and system for detecting and monitoring hematological cancer
Krafft et al. Identification of primary tumors of brain metastases by infrared spectroscopic imaging and linear discriminant analysis
Liu et al. Raman spectroscopy: A novel technology for gastric cancer diagnosis
Chen et al. A novel diagnostic method: FT-IR, Raman and derivative spectroscopy fusion technology for the rapid diagnosis of renal cell carcinoma serum
Ollesch et al. An infrared spectroscopic blood test for non-small cell lung carcinoma and subtyping into pulmonary squamous cell carcinoma or adenocarcinoma
Happillon et al. Diagnosis approach of chronic lymphocytic leukemia on unstained blood smears using Raman microspectroscopy and supervised classification
Güleken et al. Diagnosis of opioid use disorder with high sensitivity and specificity by advanced computational analysis of Fourier transform infrared spectroscopy
Krafft et al. Micro-Raman spectroscopy in medicine
Lin et al. Identification of pulmonary edema in forensic autopsy cases of fatal anaphylactic shock using Fourier transform infrared microspectroscopy
Shaikh et al. Saliva based non invasive screening of Oral Submucous Fibrosis using ATR-FTIR spectroscopy
Lykina et al. Raman spectra analysis of human blood protein fractions using the projection on latent structures method
Krafft et al. Raman and FTIR imaging of lung tissue: bronchopulmonary sequestration
Vanna et al. High-resolution Raman imaging of> 300 cells from human patients affected by nine different leukemia subtypes: a global clustering approach
Ralbovsky et al. Raman Spectroscopy and Advanced Statistics for Cancer Diagnostics
Lyng et al. RAMAN SPECTROSCOPIC ANALYSIS OF ORAL CELLS IN THE HIGH WAVENUMBER REGION
Mordehai et al. Health status prediction using FTIR microspectroscopy of blood components and cluster analysis

Legal Events

Date Code Title Description
WWE Wipo information: entry into national phase

Ref document number: 223237

Country of ref document: IL

ENP Entry into the national phase

Ref document number: 2013513040

Country of ref document: JP

Kind code of ref document: A

NENP Non-entry into the national phase

Ref country code: DE

WWE Wipo information: entry into national phase

Ref document number: 2011789348

Country of ref document: EP

ENP Entry into the national phase

Ref document number: 2012157998

Country of ref document: RU

Kind code of ref document: A

WWE Wipo information: entry into national phase

Ref document number: 13701262

Country of ref document: US