WO2011069100A2 - Microrna and use thereof in identification of b cell malignancies - Google Patents
Microrna and use thereof in identification of b cell malignancies Download PDFInfo
- Publication number
- WO2011069100A2 WO2011069100A2 PCT/US2010/058952 US2010058952W WO2011069100A2 WO 2011069100 A2 WO2011069100 A2 WO 2011069100A2 US 2010058952 W US2010058952 W US 2010058952W WO 2011069100 A2 WO2011069100 A2 WO 2011069100A2
- Authority
- WO
- WIPO (PCT)
- Prior art keywords
- mir
- hsa
- mmu
- rno
- cell
- Prior art date
Links
Classifications
-
- C—CHEMISTRY; METALLURGY
- C12—BIOCHEMISTRY; BEER; SPIRITS; WINE; VINEGAR; MICROBIOLOGY; ENZYMOLOGY; MUTATION OR GENETIC ENGINEERING
- C12Q—MEASURING OR TESTING PROCESSES INVOLVING ENZYMES, NUCLEIC ACIDS OR MICROORGANISMS; COMPOSITIONS OR TEST PAPERS THEREFOR; PROCESSES OF PREPARING SUCH COMPOSITIONS; CONDITION-RESPONSIVE CONTROL IN MICROBIOLOGICAL OR ENZYMOLOGICAL PROCESSES
- C12Q1/00—Measuring or testing processes involving enzymes, nucleic acids or microorganisms; Compositions therefor; Processes of preparing such compositions
- C12Q1/68—Measuring or testing processes involving enzymes, nucleic acids or microorganisms; Compositions therefor; Processes of preparing such compositions involving nucleic acids
- C12Q1/6876—Nucleic acid products used in the analysis of nucleic acids, e.g. primers or probes
- C12Q1/6883—Nucleic acid products used in the analysis of nucleic acids, e.g. primers or probes for diseases caused by alterations of genetic material
- C12Q1/6886—Nucleic acid products used in the analysis of nucleic acids, e.g. primers or probes for diseases caused by alterations of genetic material for cancer
-
- C—CHEMISTRY; METALLURGY
- C12—BIOCHEMISTRY; BEER; SPIRITS; WINE; VINEGAR; MICROBIOLOGY; ENZYMOLOGY; MUTATION OR GENETIC ENGINEERING
- C12Q—MEASURING OR TESTING PROCESSES INVOLVING ENZYMES, NUCLEIC ACIDS OR MICROORGANISMS; COMPOSITIONS OR TEST PAPERS THEREFOR; PROCESSES OF PREPARING SUCH COMPOSITIONS; CONDITION-RESPONSIVE CONTROL IN MICROBIOLOGICAL OR ENZYMOLOGICAL PROCESSES
- C12Q2600/00—Oligonucleotides characterized by their use
- C12Q2600/112—Disease subtyping, staging or classification
-
- C—CHEMISTRY; METALLURGY
- C12—BIOCHEMISTRY; BEER; SPIRITS; WINE; VINEGAR; MICROBIOLOGY; ENZYMOLOGY; MUTATION OR GENETIC ENGINEERING
- C12Q—MEASURING OR TESTING PROCESSES INVOLVING ENZYMES, NUCLEIC ACIDS OR MICROORGANISMS; COMPOSITIONS OR TEST PAPERS THEREFOR; PROCESSES OF PREPARING SUCH COMPOSITIONS; CONDITION-RESPONSIVE CONTROL IN MICROBIOLOGICAL OR ENZYMOLOGICAL PROCESSES
- C12Q2600/00—Oligonucleotides characterized by their use
- C12Q2600/158—Expression markers
-
- C—CHEMISTRY; METALLURGY
- C12—BIOCHEMISTRY; BEER; SPIRITS; WINE; VINEGAR; MICROBIOLOGY; ENZYMOLOGY; MUTATION OR GENETIC ENGINEERING
- C12Q—MEASURING OR TESTING PROCESSES INVOLVING ENZYMES, NUCLEIC ACIDS OR MICROORGANISMS; COMPOSITIONS OR TEST PAPERS THEREFOR; PROCESSES OF PREPARING SUCH COMPOSITIONS; CONDITION-RESPONSIVE CONTROL IN MICROBIOLOGICAL OR ENZYMOLOGICAL PROCESSES
- C12Q2600/00—Oligonucleotides characterized by their use
- C12Q2600/16—Primer sets for multiplex assays
-
- C—CHEMISTRY; METALLURGY
- C12—BIOCHEMISTRY; BEER; SPIRITS; WINE; VINEGAR; MICROBIOLOGY; ENZYMOLOGY; MUTATION OR GENETIC ENGINEERING
- C12Q—MEASURING OR TESTING PROCESSES INVOLVING ENZYMES, NUCLEIC ACIDS OR MICROORGANISMS; COMPOSITIONS OR TEST PAPERS THEREFOR; PROCESSES OF PREPARING SUCH COMPOSITIONS; CONDITION-RESPONSIVE CONTROL IN MICROBIOLOGICAL OR ENZYMOLOGICAL PROCESSES
- C12Q2600/00—Oligonucleotides characterized by their use
- C12Q2600/178—Oligonucleotides characterized by their use miRNA, siRNA or ncRNA
Definitions
- sequence listing is filed with the application in electronic format only and is incorporated by reference herein.
- sequence listing text file "WO_ASFILED_SequenceListing.txt” was created on December 3, 2010, and is 262,254 bytes in size.
- Naive B cells migrate through the circulation to lymphoid organs where they undergo the T cell-dependent germinal center reaction.
- Adaptive immunity is acquired as specific antigen-reactive germinal center B cells differentiate into the major effector B cells of the adaptive immune system: memory cells and plasma cells.
- Figure 1 A Although the role of specific transcription factors in mature B cell differentiation has been examined ⁇ see Nutt et al. Nature. 1999;401 :556-562; Chang et al. Proc Natl Acad Sci U S A. 1996;93 :6947- 6952; Turner et al. Cell. 1994;77:297-306; Shaffer et al., Immunity. 2004;21 :81 -93 ; and Schebesta et al. Curr Opin Immunol. 2002; 14:216-223), mechanisms regulating such transcription factors during mature B cell differentiation are largely unknown.
- malignancies derived from mature B cells are known and are believed to constitute the majority of leukemias and lymphomas. Such malignancies appear to reflect defined stages of normal B cell differentiation. Diagnosis of leukemias and lymphomas can be particularly difficult because of their shared lineage. These cancers frequently display overlapping morphologies, genetic abnormalities, and expression of surface markers, which can complicate the diagnosis. However, the distinction of these tumors is clinically important because there are important differences in the treatments and expected response to treatment. Thus methods that improve the accuracy of their diagnosis should provide to improved outcomes for these patients.
- MicroRNAs are commonly 18-22 nucleotide-long RNA molecules that regulate expression of genes. There is an increasing recognition of the role of microRNAs in oncogenesis, lineage-selection, and immune cel l function, including early B cell differentiation. See Calin et al. N Engl J Med. 2005;353 : 1793- 1 801 ; O'Donnell et al. Nature. 2005;435 :839-843 ; Chen et al. Science. 2004;303:83-86; Lim et al. Nature. 2005;433 :769-773; Li et al. Cell. 2007; 129: 147- 161 ; Xiao et al., Nat Immunol.
- B cell malignancies Correct diagnosis of B cell malignancies is important from both a clinical standpoint and from the standpoint of setting appropriate patient expectations. A misdiagnosed B cell malignancy may lead to an inappropriate therapy, which can unnecessarily endanger the patient's life and/or be an ineffective treatment for the B cell malignancy.
- the diagnostic distinction of Burkitt lymphoma (BL) from diffuse large B cell lymphomas (DLBCLs) can be difficult because of overlapping morphology, immunophenotype and cytogenetics. Burkitt lymphoma tumors are molecularly distinct from DLBCL, however. The difficulty and importance of obtaining the correct diagnosis in BL was highlighted by the experience of a multicenter clinical trial, CALGB trial#9251 19, in which nearly half of the 100 patients with an assigned diagnosis of BL were found to have another diagnosis upon further pathology review.
- DLBCLs can also be subclassified into two different B cell mal ignancies, activated B- cell (ABC) DLBCL and germinal center B cell like (GCB) DLBCL.
- ABSC activated B- cell
- GCB germinal center B cell like
- the prognostic information could inform the choices and expectations of patients and their physicians.
- the important molecular differences in these subgroups form the basis of testing different targeted therapies in these patients.
- the possibility of a differential response to therapy among ABC and GCB DLBCLs is supported by data that suggest that the benefit of receiving a proteosome inhibitor, bortozemib, is predominantly limited to those patients who have ABC DLBCL.
- the clinical distinction of the subgroups of DLBCL using immunohistochemistry is difficult with current methods distinguishing GCB DLBCL from non-GCB DLBCL with limited success.
- Mature B cell differentiation is important for the development of adaptive immunity. The process is also of interest because B cell malignancies are common and retain a number of features derived from their normal counterpart B cell subsets. Unlike other maturation pathways in the hematopoietic and other cell lineages, successive stages of mature B cells do not simply signify progressive differentiation away from the stem cell stage. Rather, each stage represents a specialized state with specific functions. Thus, germinal center (GC) cells interact with CD4 T cells and dendritic cells and undergo somatic hypermutation and Ig-heavy chain class-switching. On the other hand, plasma cells secrete immunoglobulin, while memory cells are primed to proliferate and differentiate into plasma cells upon repeat contact with antigen. The specialized functions demand a finely tuned program of gene regulation.
- GC germinal center
- MicroRNAs represent a novel class of biomarkers that provide new opportunities for clinical translation.
- intact microRNAs can be isolated from tissues preserved using standard methods, such as formalin fixed, paraffin embedded (FFPE) tissue.
- FFPE formalin fixed, paraffin embedded
- microRNA- based biomarkers could be easy to translate to clinical use.
- microRNAs can be readily assayed using real-time PCR and other methods available in conventional pathology.
- the disclosure provides an isolated nucleic acid molecule having at least 80% sequence identity to any one of SEQ ID NOs: 763- 1350 or 1 565 or a complementary sequence thereof.
- Embodiments provide for sequence identity of at least 90% or 95%.
- an isolated nucleic acid molecule comprises any one of SEQ I D NOs: 763- 1 350 or 1 565 or a complementary sequence thereof.
- Embodiments provide for isolated nucleic acid molecules comprising a primary miRNA, a precursor miRNA, a mature miRNA, or a DNA molecule coding therefore.
- Embodiments further provide for a cDNA molecule comprising sequence that corresponds to a miRNA sequence of any one of SEQ ID NOs: 763- 1 350 or 1 565.
- compositions, pharmaceutical compositions, vectors, host cells, and DNA libraries comprising at least one nucleic acid molecule described herein.
- the disclosure provides a method of determining the B cell stage of a B cell malignancy in a subject comprising determining the level of expression of at least one microRNA in a sample comprising a B cell taken from the subject relative the level of expression of the at least one microRNA in a control sample, wherein the at least one microRNA is selected from the microRNAs listed in Table 4.
- the disclosure provides a method of identifying a B cell malignancy in a subject comprising determining the level of expression of at least one microRNA in a sample comprising a B cell taken from the subject relative the level of expression of the at least one microRNA in a control sample, wherein the at least one microRNA is selected from the microRNAs listed in Table 4.
- the disclosure provides a method of diagnosing a B cell malignancy in a subject comprising determining the level of expression of at least one microRNA in a sample comprising a B cell taken from the subject relative the level of expression of the at least one microRNA in a control sample, wherein the at least one microRNA is selected from the microRNAs listed in Table 4.
- the disclosure provides a method of identifying a B cell malignancy in a subject comprising determining the level of expression of at least one microRNA in a sample comprising a B cell taken from the subject relative the level of expression of the at least one microRNA in a control sample, wherein the at least one microRNA is selected from the microRNAs listed in any one of Tables 7 to 35.
- the disclosure provides a method of diagnosing a B cell malignancy in a subject comprising determining the level of expression of at least one microRNA in a sample comprising a B cell taken from the subject relative to the level of expression of the at least one microRNA in a control sample, wherein the at least one microRNA is selected from the microRNAs listed in any one of Tables 7 to 35.
- Embodiments of these aspects provide for identification or diagnosis of a B cell malignancy selected from chronic lymphocytic leukemia, follicular lymphoma, Hodgkin's lymphoma, activated B-cell diffuse large B cell lymphoma (DLBCL), germinal center-like DLBCL, and Burkitt lymphoma.
- a B cell malignancy selected from chronic lymphocytic leukemia, follicular lymphoma, Hodgkin's lymphoma, activated B-cell diffuse large B cell lymphoma (DLBCL), germinal center-like DLBCL, and Burkitt lymphoma.
- the disclosure provides a method of determining whether a B cell malignancy in a sample is Burkitt lymphoma, activated B cell-like diffuse large B cell lymphoma (DLBCL), or germinal center-like DLBCL, comprising determining the level of expression of at least one microRNA in the sample relative to the level of expression of the at least one microRNA in a control sample, wherein the at least one microRNA is selected from the microRNAs listed in Table 10, column "BL miRNA list”; Table 14, column “BL High”; Table 1 1 ; Table 14, column “ABC High”; Table 10, column “GCB miRNA list”; Table 14, column “GCB High”; Table 32, or Table 35.
- the disclosure provides a method of determining whether a B cell malignancy in a sample is Burkitt lymphoma, activated B cell-like diffuse large B cell lymphoma (DLBCL), or germinal center-like DLBCL, comprising determining the level of expression of at least one microRNA in the sample relative to the level of expression of the at least one microRNA in a control sample, wherein the at least one microRNA is selected from the microRNAs listed in at least one column labeled "GCBvsBL” or "GCBvsABC” in Table 7 or "ABCvsBL” in Table 8.
- the disclosure provides a method of determining whether a B cell malignancy in a sample is activated B cell-like diffuse large B cell lymphoma (DLBCL), or germinal center-like DLBCL, comprising determining the level of expression of at least one microRNA in the sample relative to the level of expression of the at least one microRNA in a control sample, wherein the at least one microRNA is selected from the microRNAs listed in Table 35.
- DLBCL diffuse large B cell lymphoma
- the disclosure provides a microarray comprising miRNA-specific probe oligonucleotides wherein at least one miRNA-specific probe oligonucleotide is specific for a sequence of SEQ ID NOs: 763- 1350 or 1565, or any combination thereof.
- kits comprising at least one primer sequence that can detect any one of SEQ ID NOs: 763- 1350 or 1565, or a combination thereof.
- kits comprising at least one isolated nucleic acid molecule having a sequence of any one of SEQ ID NOs: 1351 - 1564.
- the disclosure provides a method of identifying a B cell malignancy comprising determining the level of expression of at least one microRNA selected from the microRNAs listed in Table 4.
- a method comprises determining the level of expression of at least one microRNA selected from the microRNAs listed in Tables 7- 35.
- Figure 1 shows that mature B cell subsets demonstrate distinct microRNA profiles.
- Figure 1 A is a diagram showing the overall schema of mature B cell differentiation.
- Figure 1 B shows selection of B cel l subsets using flow cytometry.
- Figure 1 C shows the distinction between naive and memory B cells based on IgD and CD27 expression using flow cytometry.
- Figure I D shows relative expression of microRNA in the naive to germinal center B cell transition.
- Figure I E shows relative expression of mRNA in the naive to germinal center B cell transition.
- Figure I F shows relative expression of microRNA in the germinal center B cell to plasma cell transition.
- Figure 1 G shows relative expression of mRNA in the germinal center B cell to plasma cell transition.
- Figure 1 H shows relative expression of microRNA in the germinal center B cell to memory B cell transition.
- Figure I I shows relative expression of mRNA in the germinal center B cell to memory B cell transition.
- Figures I D, I F, and 1 H mi NAs that were, on average, at least 2-fold differentially expressed at a false discovery rate of less than 5% are shown according to the color scale.
- Figures and I E, 1 G, and 1 mRN As that were, on average, at least 2-fold differentially expressed at a false discovery rate of less than 1 % are shown according to the color scale.
- Figure 1 J shows that expression of certain microRNA processing genes, DGCR8, DICER 1 , EIF2C2, DROSHA, and XP05 is unchanged among the B cell subsets (P>0.1 in all. cases).
- Figure 2 shows experimental validation of the interaction of miR-223, which is expressed highly in naive and memory B cells compared to germinal center B cells, and targets the transcription factor LM02.
- Figure 2 A shows base-pairing of the 3 'UTR of the LM02 gene with nucleotides 1 -8 of miR-223. This 8-mer is highly conserved across a number of species and serves as a potential binding site for miR-223.
- Figure 2B shows the effects of over- expression of miR-223 in germinal center lymphoma-derived BJAB cells in 3 separate experiments.
- Figure 2C shows the relative LM02 protein expression from a representative experiment (from 3 replicates) transfecting a scrambled control versus a precursor for miR-223 in BJAB cells.
- Figure 2D shows average expression of LM02 relative to Actin over three Western blots of BJAB cells transfected with a scrambled control versus a precursor for miR- 223.
- Figure 2E shows luciferase activity in BJAB cells transfected with a vector comprising either a luciferase gene coupled to the 3 'UTR of the LM02 gene or a luciferase gene coupled to the 3 'UTR of the LM02 gene with the miR-223 binding site mutated, and cotransfected with miR-223.
- Figure 3 shows experimental validation of the interaction of miR-9 and miR-30, which are expressed highly in germinal center B cells compared to plasma cells and target the transcription factor PRDM1.
- Figure 3A shows base-pairing of the 3 'UTR of the PRDM 1 gene with the 5' seed region of miR-9 and the miR-30 family.
- Figure 3 B shows the effects of over- expressing miR-9 and 2 members of the miR-30 family, miR-30b and miR-30d, in plasma cell myeloma-derived U266 cells in 3 separate experiments.
- Figure 3C shows the relative PRDM 1 protein expression from a representative experiment (from 3 replicates) transfecting a scrambled control versus a precursor for miR-9, miR-30b, or miR-30d in U266 cells.
- Figure 3D shows the average expression of PRDM1 relative to Actin over three Western blots of U266 cells transfected with a scrambled control versus a precursor for miR-9, miR-30b, or miR-30d.
- Figure 3E shows repression of luciferase activity from the PRDM 1 3 'UTR construct by overexpression of miR-9, miR-30b, and miR-30d wild-type and mutant sequences.
- Figure 4 shows that expression of microRNAs in normal B cells is conserved in certain B cell malignancies.
- Figure 4A shows lineage prediction of both IgV mutated and unmutated chronic lymphocytic leukemia, germinal center B cell derived DLBCL, and Burkitt lymphoma based on differential expression of microRNAs in normal na ' ive B cells and germinal center B cells (microRNAs depicted in Figure I D).
- Figure 4B shows miRNAs that were found to be differentially expressed (PO.05) in malignant cells and normal cells as discussed in Example 5.
- Figure 4D shows differentially expressed miRNAs that distinguish Burkitt lymphoma, activated B cell-like (ABC) diffuse large B cell lymphoma (DLBCL), germinal center-like DLBCL (GCB DLBCL), and chronic lymphocytic leukemia. Predictor miRNAs from each pair-wise comparison that distinguish each entity are shown in the boxes.
- Figure 5 shows the distribution of miRNAs present in B-cell subsets.
- Figure 6 shows that certain microRNA targets are expressed at lower levels.
- Figure 6A shows density plots of the expression frequency of predicted mRNA targets of miRNAs expressed highly in germinal center B cells compared to naive cells.
- Figure 6B shows density plots of the expression frequency of predicted mRNA targets of miRNAs expressed highly in germinal center B cells compared to plasma cells.
- Figure 6C shows density plots of the expression frequency of predicted mRNA targets of miRNAs expressed highly in the germinal center B cells compared to memory B cells.
- Figure 7 shows that differentially expressed transcription factors are frequently microRNA targets.
- the left panel indicates the proportion of transcription factors that are differentially expressed in the naive to germinal center B-cell transition that are also predicted targets of differentially expressed miRNAs.
- the right panel indicates the proportion of transcription factors that are not differentially expressed and also are predicted targets of differentially expressed miRNA in that stage-transition.
- the p-value indicates the results of a chi-squared test for the enrichment of predicted miRNA targets among the differentially expressed transcription factors.
- Figure 7B shows a similar analysis of the germinal center to plasma cell transition.
- Figure 7C shows a similar analysis of the germinal center to memory cell transition.
- Figure 8 shows that Mybl transcript levels decrease with miR-223 overexpression.
- Figure 8A shows base-pairing of the 3'UTR of the MYBL 1 gene with nucleotides 2-8 of miR- 223. This 7-mer is highly conserved across a number of species and serves as a potential binding site for miR-223.
- Figure 8B shows the effects of over-expression of miR-223 in germinal center lymphoma-derived BJAB cells in 3 separate experiments.
- Figure 9 shows the specificity of real-time PCR probes for members of the miR-30 family.
- Figure 10 shows the results of leave one out cross validation applied to the predictors for Burkitt lymphoma, chronic lymphocytic leukemia, activated B-cell diffuse large B-cell lymphoma, and germinal center B-cell DLBCL.
- Figure 1 1 shows differentially expressed miRNAs that distinguish activated B cell-like diffuse large B cell lymphoma (DLBCL), germinal center-like DLBCL (GCB DLBCL), Burkitt lymphoma, chronic lymphocytic leukemia, follicular lymphoma, and Hodgkin's lymphoma. Predictor miRNAs from each pair-wise comparison that distinguish each entity are shown in the boxes.
- DLBCL diffuse large B cell lymphoma
- GCB DLBCL germinal center-like DLBCL
- Burkitt lymphoma Burkitt lymphoma
- chronic lymphocytic leukemia follicular lymphoma
- Hodgkin's lymphoma Hodgkin's lymphoma
- the disclosure relates to nucleic acid sequences, such as microRNAs (miRNA), as well as to the identification and analysis of microRNA expression levels and/or patterns in B cells.
- miRNA microRNAs
- the inventors have identified regulatory roles for microRNAs at each stage in mature B cell differentiation. This provides methods identifying microRNA-mediated regulation of oncogenes and key transcription factors in B cell differentiation. This work establishes the landscape of normal microRNA expression in mature B cells and its role in regulating normal B cell differentiation. Further, our work demonstrates that in contrast to the described down-regulation in other malignancies, stage-specific microRNAs are retained in B cell malignancies.
- the disclosure relates to an isolated nucleic acid molecule comprising: (a) a nucleotide sequence as shown in Table 32; (b) a nucleotide sequence which is the complement of (a), (c) a nucleotide sequence comprising a sequence identity of at least 80%, (e.g., 80, 81 , 82, 83, 84, 85, 86, 87, 88, 89, 90, 91 , 92, 93, 94, 95, 96, 97, 98, or at least 99%), to a sequence of (a) or (b) and/or (d) a nucleotide sequence which hybridizes under stringent conditions to a sequence of (a), (b) and/or (c).
- sequence (c) to a sequence of (a) or (b) is at least 90%. In other embodiments, the identity of sequence (c) to a sequence of (a) or (b) at least 95%.
- the percent identity can be calculated by any routine method used by one of skill in the art such as, for example, the methods described herein.
- the isolated nucleic acid molecule relates to a miRNA molecule and analogs thereof, a miRNA precursor molecule, or a primary miRNA molecule, as well as to DNA molecules encoding miRNA, miRNA precursor, or primary miRNA molecules. Accordingly, in such embodiments, the isolated nucleic acid molecule can function as a miRNA molecule under suitable conditions. Suitable conditions include, but are not limited to, various buffer systems that approximate physiologically relevant ionic concentrations and pHs, as well as physiological conditions.
- the nucleic acid molecule comprises a sequence that hybridizes to a nucleotide sequence as shown in Table 32, a complementary sequence thereof or a nucleic acid molecule having at least 80% sequence identity under stringent hybridization conditions.
- Table 32 a nucleotide sequence as shown in Table 32
- a complementary sequence thereof or a nucleic acid molecule having at least 80% sequence identity under stringent hybridization conditions.
- stringent salt concentration will ordinarily be less than about 750 mM NaCl and 75 mM trisodium citrate, or less than about 500 mM NaCl and 50 mM trisodium citrate, or even less than about 250 mM NaCl and 25 mM trisodium citrate.
- High stringency hybridization conditions can be obtained by adding an amount of organic solvent (e.g., at least about 35% to about 50% formamide).
- Stringent temperature conditions will ordinarily include temperatures of at least about 30°C, (e.g., at least about 37°C, 42°C, 45°C, 50°C, or 55°C).
- additional parameters such as hybridization time, the concentration of detergent (e.g., 0.1 - 1 .0% sodium dodecyl sulfate (SDS)), and the inclusion or exclusion of carrier DNA (e.g., about 100-200 ⁇ g/ml denatured salmon sperm DNA (ssDNA)), are well known to those skilled in the art.
- Stringent hybridization conditions include non-limiting examples such as, washing for 1 hr in 300 mM NaCl, 30 mM trisodium citrate and 0. 1 % SDS at 45-50°C; washing for 1 h in 300 mM NaCl, 30 mM trisodium citrate and 0.1 % SDS at 45-50°C; in 500 mM NaCl, 50 mM trisodium citrate, 1 % SDS, 35% formamide, and 100 ⁇ g/ml denatured salmon sperm DNA (ssDNA) at 37°C; or in 250 mM NaCl, 25 mM trisodium citrate, 1 % SDS, 50% formamide, and 200 ⁇ g/ml ssDNA at 42°C. Useful variations on these conditions will be readily apparent to those skilled in the art.
- the isolated nucleic acid molecules provided herein suitably have a length of from about 18 to about 100 nucleotides.
- the lengths of the miRNAs are suitably in an expected range for the particular type of miRNA molecule.
- mature miRNAs are typically from about 1 5 to about 28 nucleotides in length, and suitably have a length of about 19 to about 24 nucleotides (e.g., 19, 20, 21 , 22, 23, or 24 nucleotides).
- Precursor miRNAs typically comprise the mature miRNA sequence and contain a stem-loop structure, suitably of length of about 50 to about 90 nucleotides (e.g., 50, 55, 60, 65, 70, 75, 80, 85, or 90 nucleotides).
- Primary miRNAs e.g., a primary transcript comprising a precursor miRNA
- the nucleic acid molecules can be provided in either a single-stranded or double- stranded form.
- a miRNA as such is identified as a single-stranded molecule, while the precursor mi RNA is typically at least partially self-complementary and capable of forming double-stranded portions, e.g. stem- and loop-structures.
- DNA molecules encoding the miRNA and miRNA precursor molecules are typically double-stranded.
- the individual nucleic acids that comprise the isolated nucleic acid molecules can be selected from RNA, DNA, or nucleic acid analog molecules, such as chemically modified sugar (e.g., 2'-modified (2'-F, 2'-OMe, etc.) or backbone (e.g., phosphorothioates), or cap (e.g., 5 '- and/or 3 '-abasic groups) moieties of ribonucleotides or deoxyribonucleotides.
- Other nucleic acid analogs such as peptide nucleic acids (PNA) or locked nucleic acids (LNA), are also suitable in various embodiments described herein.
- the nucleic acid molecules can comprise any combination of nucleic acid analog(s).
- RNA sequences e.g., miRNAs
- the disclosure of those sequences should be understood to encompass the corresponding DNA (e.g., cDNA) sequences, wherein the uracil (U) nucleotides of the disclosed RNAs are substituted by thymidine (T) nucleotides in the corresponding DNA.
- U uracil
- T thymidine
- One of skill in the art is able to generate such DNA sequences (e.g., cDNA) through routine microbiological techniques known in the art such as, for example, reverse transcription using methods that incorporate the reverse transcriptase enzyme.
- the disclosure provides a recombinant expression vector comprising a recombinant nucleic acid sequence operatively linked to an expression control sequence, wherein expression of the recombinant nucleic acid sequence provides a miRNA sequence, a precursor miRNA sequence, or a primary miRNA sequence as described herein.
- the resulting sequence e.g., primary or precursor miRNAs
- the recombinant expression vector comprises at least one sequence in Table 32. Any suitable expression vector can be used such as, for example, a ' DNA vector (e.g., viral vector, plasmid, etc.).
- the expression vector is selected for expression in a eukaryotic cell such as, for example, a mammalian cell.
- a eukaryotic cell such as, for example, a mammalian cell.
- a mammalian cell such as, for example, a mammalian cell.
- One of skill in the art will be able to select an appropriate vector based on the particular application and/or expression system to be employed.
- nucleic acid constructs in the form of plasmids, vectors, transcription or expression cassettes which comprise at least one nucleotide sequence encoding a miRNA described herein, or fragments thereof, and a suitable promoter region.
- Suitable vectors can be chosen or constructed, which contain appropriate regulatory sequences, such as promoter sequences, terminator sequences, polyadenylation sequences, enhancer sequences, marker genes and other sequences as desired.
- Vectors can be plasmids, phage (e.g. phage, or phagemid) or viral (e.g. lentivirus, adenovirus, AAV) or any other appropriate vector.
- phage e.g. phage, or phagemid
- viral e.g. lentivirus, adenovirus, AAV
- identity refers to a relationship between the sequences of two or more two or more nucleic acid molecules, as determined by comparing the sequences. In the art, “identity” also means the degree of sequence relatedness between amino acid or nucleic acid molecule sequences, as the case may be, as determined by the match between strings of nucleotide or amino acid sequences. “Identity” measures the percent of identical matches between two or more sequences with gap alignments addressed by a particular mathematical model or computer programs (i.e., "algorithms").
- Non-limiting methods for determining identity are designed to give the largest match between the sequences tested. Methods to determine identity are codified in publicly available computer programs. Preferred computer program methods to determine identity between two sequences include, but are not limited to, the GCG program package, including GAP (Devereux, et a!., Nucleic Acids Research 12:387 [1984]; Genetics Computer Group, University of Wisconsin, Madison, Wis.), BLASTN, and FASTA (Atschul et al., J. Molec. Biol. 21 5 :403-410 [ 1990]).
- the BLAST X program is publicly available from the National Center for Biotechnology Information (NCBI) and other sources (BLAST Manual, Altschul] et al., NCB NLM NIH Bethesda, Md. 20894; Altschul et al., J. Mol. Biol. 21 5 :403-410 [ 1990]).
- NCBI National Center for Biotechnology Information
- the well known Smith Waterman algorithm may also be used to determine identity.
- Exemplary parameters for nucleic acid molecule sequence comparison include the following:
- the GAP program is also useful with the above parameters.
- the aforementioned parameters are the default parameters for nucleic acid molecule comparisons.
- gap opening penalties can be used by those of skill in the art, including those set forth in the Program Manual, Wisconsin Package, Version 9, September 1 997.
- the particular choices to be made will depend on the specific comparison to be made, such as DNA to DNA or RNA to DNA; and additionally, whether the comparison is between given pairs of sequences (in which case GAP or BestFit are generally preferred) or between one sequence and a large database of sequences (in which case FASTA or BLASTA are preferred).
- the disclosure provides a vector comprising the isolated polynucleotide as described herein such as, for example one or more of SEQ ID NOs 773- 1046 or 1450- 1 542.
- the vector can be any type of vector that finds use as a vehicle to transfer foreign genetic material into a cell.
- Non-limiting examples of vectors include plasmids, viral vectors (e.g., derived from lentivirus, adenovirus, adeno-associated virus (AAV), retrovirus, etc.), bacteriophage, cosmids, and artificial chromosomes.
- the vector can be an expression (or expression constructs) for driving expression of the polynucleotide in a target cell. Vectors and methods for inserting them into a target cell are known in the art [See, e.g., Sambrook et al., 1989] .
- the disclosure provides recombinant cells that comprise the vectors and/or polynucleotides described herein.
- the cells can be any cell suitable as a host for recombinant nucleic acid molecules, and selected based on well known techniques. Techniques for generating and maintaining recombinant cells are known in the art, such as those described in Sambrook et al., 1 989.
- B cell malignancy refers to a malignancy derived from any stage of B cell, including, but not limited to, na ' ive cells, germinal center cells, memory B cells, and plasma cells.
- B cell malignancies include, but are not limited to, mantle cell lymphoma, follicular lymphoma, Hodgkin's lymphoma, Burkitt lymphoma, germinal center B- cell like diffuse large B cell lymphoma (DLBCL), chronic lymphocytic leukemia, small lymphocytic lymphoma, lymphoplasmacytic lymphoma, multiple myeloma, and activated B- cell like DLBCL.
- DLBCL diffuse large B cell lymphoma
- the disclosure provides a method of distinguishing B cell malignancies on the basis of the B-cell origin.
- methods of diagnosing B cell malignancies on the basis of the B-cell origin are provided.
- a B cell malignancy is determined to be derived from a particular B-cell stage.
- the B-cell origin of a B cell malignancy may be determined, in certain embodiments, by detecting one or more microRNAs that can be used to distinguish B-cell stages.
- Certain exemplary B-cell stages include, but are not limited to, na ' ive cells, germinal center cells, memory B cells, and plasma cells.
- Certain exemplary microRNAs that can be used to distinguish B-cell stages are shown in Table 4.
- the method comprises detecting at least one, at least two, at least five, at least 10, at least 20, at least 30, at least 50, at least 75, or at least 100 microRNAs.
- a panel of microRNAs is selected that will allow determination of the B cell stage from which a B cell malignancy is derived.
- two or more microRNAs from Table 4 are selected such that detection of the levels of those microRNAs in a B cell malignancy will indicate whether the B cell malignancy is derived from na ' ive, germinal center, plasma, or memory B cells.
- the panel of microRNAs comprises at least one, at least two, at least five, at least 10, at least 20, at least 30, at least 50, at least 75, or at least 100 microRNAs from Table 4.
- One skilled in the art can select a suitable panel of microRNAs, including one or more microRNAs from Table 4, according to the intended use of the panel.
- the methods herein can include detecting one or a plurality of miRNAs.
- a number e.g., “at least 20” that term will be understood to include 20 as well as optionally any integer after 20 and up to and including the total number of microRNAs disclosed herein.
- a B cell malignancy derived from naive cells is mantle cell lymphoma.
- a B cell malignancy derived from germinal center cells includes, but is not limited to, follicular lymphoma, Hodgkin's lymphoma, Burkitt lymphoma, or germinal center B-cell like diffuse large B cell lymphoma (DLBCL).
- a B cell malignancy derived from memory B cells includes, but is not limited to, chronic lymphocytic leukemia or smal l lymphocytic lymphoma.
- a B cell malignancy derived from plasma cells includes, but is not limited to, multiple myeloma or activated B-cell DLBCL.
- Burkitt lymphoma and DLBCLs are often confused.
- mantle cell lymphoma and small lymphocytic lymphoma can also be confused.
- Burkitt lymphoma and germinal center DLBCL are both derived from germinal center cells, while activated B-cell DLBCL is derived from plasma cells.
- microRNA analysis can be used to narrow down the B cell malignancy to either a germinal center cell-derived B cell malignancy or a plasma cell-derived B cell malignancy. If the B cell malignancy is plasma-cell derived, then it may be activated B-cell DLBCL.
- microRNAs that distinguish certain B cell stages can be used to further narrow down the identity of the B cell malignancy.
- microRNAs that distinguish certain B cell stages can be used to identify the B cell malignancy.
- One or more such microRNAs can be selected, in certain embodiments, from the microRNAs in Table 4.
- One skilled in the art can select a suitable set of microRNAs, including at least one microRNA from Table 4, for distinguishing particular B cell stages.
- the disclosure provides a method of identifying a B cell malignancy comprising detecting one or a plurality of microRNAs.
- the method can provide a diagnosis of a B cell malignancy.
- one or more microRNAs that are characteristic of a particular B cell malignancy are used to identify the B cell malignancy.
- the identity of the B cell malignancy is first narrowed down to a list of two or more particular B cell malignancies using, for example, tumor morphology and/or immunohistochemistry and/or microRNA detection, e.g., to determine the B cell stage from which the tumor is derived.
- Certain exemplary microRNAs that can be used to identify B cell malignancies are shown in the Tables (e.g., Tables 7-35).
- methods of identifying B cell malignancies comprise detecting one or more microRNAs from one or more of Tables 7 to 1 5, and Appendix B, Tables 16 to 30. That is, in certain embodiments, a panel of microRNAs is selected that wil l identify a B cell malignancy as being one of a particular selection of B cell malignancies. As a non-limiting example, a panel of microRNAs can be designed to identify a B cell malignancy as one of Burkitt lymphoma, ABC DLBCL, or GCB DLBCL.
- the panel of microRNAs comprises at least one microRNA from Table 10, column “BL miRNA list” and/or Table 14, column “BL High”; at least one microRNA from Table 1 1 and/or Table 14, column “ABC High”; and at least one microRNA from Table 10, column “GCB miRNA list” and/or Table 14, column “GCB High”.
- microRNAs can be used to confirm that identification.
- a B cell malignancy is believed to be a Burkitt lymphoma
- that identification can be confirmed by determining the expression level of one or more microRNAs listed in Table 10, column "BL miRNA list” and/or Table 14, column "BL High”.
- a B cell malignancy is believed to be ABC DLBCL
- that identification can be confirmed by determining the expression level of one or more microRNAs listed in Table 1 1 and/or Table 14, column "ABC High”.
- a B cell malignancy is believed to be GCB DLBCL, that identification can be confirmed by determining the expression level of one or more microRNAs listed in Table 10, column "GCB miRNA list” and/or Table 14, column "GCB High”. If a B cell malignancy is believed to be chronic lymphocytic leukemia, that identification can be confirmed by determining the expression level of one or more microRNAs listed in Table 12 and/or Table 1 5, column "CLL High”. If a B cell malignancy is believed to be Hodgkin's lymphoma, that identification can be confirmed by determining the expression level of one or more microRNAs listed in Table 1 3 and/or Table 1 5, column "HL High”. If a B cell malignancy is believed to be follicular lymphoma, that identification can be confirmed by determining the expression level of one or more microRNAs listed in Table 10, column "FL miRNA list” and/or Table 1 5, column "FL High”.
- the identity of a B cell malignancy when the identity of a B cell malignancy has been narrowed down to two B cell malignancies selected from Burkitt lymphoma, GCB DLBCL, ABC DLBCL, chronic lymphocytic leukemia, follicular lymphoma, and Hodgkin's lymphoma, the identity of the B cell malignancy can be determined by detecting one or more microRNAs from Tables .16 to 30.
- the miRNAs described herein as differential ly expressed in a B cell malignancy have been identified with high confidence, and thus, identification of one miRNA is adequate to perform the methods of identification and diagnosis disclosed herein. Accordingly, in various embodiments, the methods can comprise detecting at least one, at least two, at least five, at least 10, at least 20, at least 30, or at least 50 microRNAs in order to narrow down the identity of, or identify, a B cell malignancy.
- the treatment regimens and prognoses for the various B cell malignancies can differ significantly.
- determining the correct identity and/or origin of a B cell malignancy can be important for selecting an effective therapy and/or setting appropriate patient expectations.
- B cell malignancy samples may be obtained and prepared using methods known in the art.
- One skilled in the art can select an appropriate method of obtaining a B cell malignancy sample according to various parameters, such as the age, size, medical history, and/or identity of the patient.
- One skilled in the art can select an appropriate method of preparing a B cell malignancy sample for analysis according to the B cell malignancy sample source, size, quality, and/or intended use.
- a B cell malignancy sample is prepared in a manner that preserves microRNAs in the sample as much as practicable under the circumstances.
- MicroRNAs can be detected using any method known in the art. Exemplary methods of detecting microRNAs include, but are not limited to, hybridization-based methods and amplification-based methods. Certain exemplary detection methods include, but are not limited to, arrays (including microarrays and bead-based arrays), in situ hybridization, Northern blotting, TaqMan probes, RT-PCR, real-time PCR, and direct sequencing. One skilled in the art can select a suitable detection method according to the sample source, size, quality, and/or particular application. [0078] In certain embodiments, real-time PCR is employed to determine the expression level of a microRNA. In some embodiments a miRNA is considered present in a subpopulation if the cycling time (CT) is less than 36 in all three biological replicates, and a CT greater than 36 is undetected.
- CT cycling time
- the expression level of a microRNA in a sample is determined relative to a control sample.
- a control sample may be selected, in various embodiments, because it is expected to have either high or low expression of the microRNA.
- the expression level of a microRNA may be normalized to the expression level of a polynucleotide that is expected to be expressed at similar levels in several different cell types and/or at constant levels in the cell type being analyzed.
- an identified miRNA from Tables 7-35 is used to distinguish one of the six exemplified B cell malignancies from the other malignanicies.
- a "high” and a “low” in Tables 10 to 1 3 refer to at least a 2-fold difference in the expression of the identified miRNA when one lymphoma is compared to other lymphomas and benign lymph nodes.
- mRNA levels can be profiled by using a microarray.
- array elements with median signal intensities of less than 7 log2 units across samples are removed from analysis.
- a gene is considered for further analysis if it is on-average 2-fold or higher differentially expressed in a binary comparison of B cell subsets and expressed in at least one of the two B cell subsets being compared.
- the level of at least one miRNA is measured by reverse transcribing RNA from a test sample obtained from a subject to provide a set of target oligodeoxynucleotides, hybridizing the target oligodeoxynucleotides to one or more miRNA-specific probe oligonucleotides (e.g., a microarray that comprises miRNA-specific probe oligonucleotides) to provide a hybridization profile for the test sample, and comparing the test sample hybridization profile to a hybridization profile generated from a control sample.
- miRNA-specific probe oligonucleotides e.g., a microarray that comprises miRNA-specific probe oligonucleotides
- an alteration in the signal of at least one miRNA in the test sample relative to the control sample is indicative of the subject either having, or being at risk for developing, a B-cell malignancy.
- the signal of at least one miRNA is upregulated, relative to the signal generated from the control sample.
- the signal of at least one miRNA is down-regulated, relative to the signal generated from the control sample.
- the microarray comprises miRNA-specific probe oligonucleotides for a substantial portion of all known human miRNAs.
- the microarray comprises miRNA-specific probe oligonucleotides for one or more miRNAs selected from the group consisting of SEQ ID NOs: 763- 1 350, or 1565 and any combination thereof.
- the microarray can be prepared from gene-specific oligonucleotide probes generated from known miRNA sequences.
- the array may contain two different oligonucleotide probes for each miRNA, one containing the active, mature sequence and the other being specific for the precursor of the miRNA.
- the array may also contain controls, such as one or more mouse sequences differing from human orthologs by only a few bases, which can serve as controls for hybridization stringency conditions.
- tRNAs and other RNAs e.g., rRNAs, mRNAs
- sequences are selected based upon the absence of any homology with any known miRNAs.
- the microarray may be fabricated using techniques known in the art. For example, probe oligonucleotides of an appropriate length, e.g., 40 nucleotides, are 5'-amine modified at position C6 and printed using commercially available microarray systems. Labeled cDNA corresponding to the target RNA sequence(s) is prepared by reverse transcribing the target RNA with labeled primer. Following first strand synthesis, the RNA/DNA hybrids are denatured to degrade the RNA templates. The labeled target cDNAs thus prepared are then hybridized to the microarray chip under typical hybridizing conditions. At positions on the array where the immobilized probe DNA recognizes a complementary target cDNA in the sample, hybridization occurs.
- probe oligonucleotides of an appropriate length, e.g. 40 nucleotides, are 5'-amine modified at position C6 and printed using commercially available microarray systems.
- Labeled cDNA corresponding to the target RNA sequence(s) is prepared by
- the labeled target cDNA marks the exact position on the array where binding occurs, allowing automatic detection and quantification.
- the output consists of a list of hybridization events, , indicating the relative abundance of specific cDNA sequences, and therefore the relative abundance of the corresponding complementary miRNAs, in the patient sample.
- kits can be used in methods of identifying a miRNA or mRNA described herein; an expression level or expression pattern of one or more miRNA(s) or mRNA(s) described herein; and/or identifying a B-cell malignancy.
- the kit can provide a diagnosis of a B-cell type and or a B-cell malignancy.
- the kit can differentiate one B-cell malignancy from other B-cell malignancies (e.g., ABC-DLBCL from GBC-DLBCL), and can provide information useful to a medical professional regarding a preferred course of therapeutic treatment.
- a kit can comprise an isolated nucleic acid molecule or a plurality of isolated nucleic acid molecules as described herein (e.g., a sequence complementary to any of the miRNAs disclosed in the Tables).
- the isolated nucleic acid molecule can comprise a sequence of one or more RT-PCR target sequences, primers directed thereto, or a sequence complementary thereto.
- the kit can also include adapter nucleic acid molecules (e.g., universal adapter molecules for attachment to expressed miRNAs/mRNAs for reverse transcription and amplification); appropriate buffer systems and reagents, detectable labels, an energy source (e.g., ATP), and other agents and components that can be used in performing analysis of miRNA expression (e.g., in RT-PCR, deep sequencing, or microarray-based methods). Kits also include instructions for use.
- adapter nucleic acid molecules e.g., universal adapter molecules for attachment to expressed miRNAs/mRNAs for reverse transcription and amplification
- detectable labels e.g., an energy source (e.g., ATP), and other agents and components that can be used in performing analysis of miRNA expression (e.g., in RT-PCR, deep sequencing, or microarray-based methods).
- Kits also include instructions for use.
- any numerical value recited herein includes all values from the lower value to the upper value. For example, if a concentration range is stated as 1 % to 50%, it is intended that values such as 2% to 40%, 10% to 30%, or 1 % to 3%, etc., are expressly enumerated in this specification. These are only examples of what is specifically intended, and all possible combinations of numerical values between the lowest value and the highest value enumerated are to be considered to be expressly stated in this application.
- the disclosure provides a DNA library comprising one or more miRNA sequences from Tables 4-5, or 6-33. In a related aspect, the disclosure provides a method for generating such a DNA library.
- the library comprises a cDNA library that includes sequences derived from a sample of the miRNAs or, in addition or alternatively, the mRNA purified from a particular source such as, for example, a collection of cells, a particular tissue, or an entire organism.
- the source of the cDNA library is a B cell, such as a B cell in any stage (e.g., na ' ive, germinal center, memory, activated, or plasma, etc.) or a B cel l malignancy (e.g., mantle cell lymphoma, follicular lymphoma, Hodgkin's lymphoma, Burkitt lymphoma, germinal center B-cell like diffuse large B cell lymphoma (DLBCL), chronic lymphocytic leukemia, small lymphocytic lymphoma, lymphoplasmacytic lymphoma, multiple myeloma, and activated B-cell like DLBCL).
- a B cel l malignancy e.g., mantle cell lymphoma, follicular lymphoma, Hodgkin's lymphoma, Burkitt lymphoma, germinal center B-cell like diffuse large B cell lymphoma (DLBCL), chronic lymphocy
- the isolated miRNA (or m RNA) is converted to a DNA template by reverse transcription, and comprises the cDNA version of the expressed RNA (e.g., miRNA or mRNA).
- a library can represent the cDNA version of the active "transcriptome" in a particular source under the physiological, developmental, or environmental conditions that existed when the miRNA/mRNA was purified.
- the library comprises a miRNA sequence described in Tables 4-5; 7- 33. In embodiments, the library comprises at least one of SEQ ID NOs 763- 1 350 or 1 565, and any combination thereof. In an embodiment, the library comprises a collection of miRNA sequences comprising SEQ ID NOs 763- 1 350 or 1 565. In embodiments the library can be used to identify and/or differentiate a B-cell malignancy from other B-cell malignancies. In such embodiments, the library comprises at least one miRNA sequence selected from those listed in any of Tables 4 or 7-35.
- a "library” is a collection of DNA sequences that is stored and propagated in a population of microorganisms through standard molecular cloning processes.
- a DNA library can be of any type such as, for example, a cDNA library (formed from reverse- transcribed RNA) or a genomic library (formed from genomic DNA).
- the DNA library can be used in any routine application or technique known in the art (e.g., gene discovery; cloning of full-length cDNAs to identify/study gene function; miRNA/mRNA expression in different cells or tissues; splice variants in different cells or tissues) and, in some embodiments, can depend on the source of the original DNA fragments.
- the library can be used to isolate, characterize, and/or quantify the actively expressed miRNA is a population of cells such as, for example, B-cells or B-cell malignancies.
- the library can be used to study miRNA-protein interactions or miRNA-based regulation of protein expression or activity.
- Any known method of library preparation can be used to make the library described herein, including the methods described in the detailed description and non-limiting Examples. Further general techniques can be based on the methods and techniques known in the art, (see, e.g., RNA Methodologies: A Laboratory Guide for Isolation and Characterization (R.E. Farrell, Academic Press, 1998); cDNA Library Protocols (Cowell & Austin, eds., Humana Press; Functional Genomics (Hunt & Livesey, eds., 2000); and the Annual Review of Genomics and Human Genetics (E. Lander, ed., yearly publications by Annual Reviews).
- the nucleotide sequences of interest in a library are preserved as inserts in a plasmid or the genome of a bacteriophage that has been used to infect bacterial cells.
- cloning vectors and techniques used in library preparation differ in the cloning vectors and techniques used in library preparation, but in general each DNA fragment is uniquely inserted into a cloning vector and the pool of recombinant DNA molecules is then transferred into a population of bacteria or yeast such that each organism contains on average one construct (vector + insert).
- the DNA molecules are copied and propagated along with the population of organisms in culture (thus, effectively, "cloned").
- the term "library” can refer to a population of organisms, each of which carries a DNA molecule inserted into a cloning vector, or alternatively to the collection of all of the cloned vector molecules.
- An "increased level" of expression refers to a level of expression that is at least 2-fold greater than the level of expression in a control cell type or tissue.
- the level of expression is at least 2.5-fold, at least 3-fold, at least 5-fold, or at least 10-fold, greater than the level of expression in a control cel l.
- Exemplary control cells and tissues include, but are not limited to, normal cells, benign lymph nodes, and other B cell malignancies.
- benign lymph nodes are used as a control tissue. Such benign lymph node tissue contains a variety of cell types.
- a “decreased level” of expression refers to a level of expression that is less than 50% of the level of expression in a control cell.
- the term "differentially expressed” or “differential expression” relates to a difference in the observed or detected level of expression of a biomolecule such as, for example, nucleic acids (e.g., a polynucleotide, mRNA, miRNA, etc.) or amino acid sequence (e.g., protein, polypeptide, etc.) in a test sample relative to the observed or detected level of expression of the same biomolecule in a control sample or other reference (e.g., a previously established reference level).
- the difference in expression can be either an increase or a decrease in the expression of the biomolecule in the test sample relative to the control sample.
- B cell populations were obtained from young patients undergoing routine tonsillectomy using a protocol approved by the Clinical Center at the National Institutes of Health. Patient tonsils were disaggregated and separated by Ficoll. The mononuclear cell layer was harvested, washed in PBS, and resuspended in AC lysing buffer to remove small numbers of red blood cells. After a wash and resuspension with 10 ml of PBS with 10% Bovine Serum Albumin, cells were counted and 200 million were stained with fluorochrome-tagged monoclonal antibodies to CDI9, IgD, CD38 and CD27.
- the specific monoclonal antibodies employed were anti-CDI9-PE-Cy5.5, anti-lgD-FITC, anti-CD27-PE, and anti-CD38-APC, all from BD Biosciences and BD Pharmingen (San Jose California).
- Cells were sorted using the MoFIo Cell sorter (Dako Cytomation, Colorado Springs, CO) into naive B cel ls (CDI9+IgD+CD2TCD38+), germinal center B cells (CDI9+IgD-CD38++), memory B cells (CDI9+IgD- CD27+CD38dim) and plasma cells (CDI9dimIgD-CD27++CD38+++).
- MiRNA expression profiling was conducted using the Applied Biosystems 384-well multiplexed real-time PCR assay using 400ng of total RNA. Eight reactions, each containing 50ng of RNA and a multiplex looped primer pool with endogenous small nucleolar (sno)-RNA controls, were used to reverse-transcribe the miRNAs in parallel fashion. Each completed reaction was loaded onto the 384-well plate per manufacturer's instructions, and real-time PCR was run on the ABI 7900HT Prism. For each 384-well plate, we used the automatically determined cycle-threshold (CT) using the SDS 2.2.1 software (Applied Biosystems). Consistent with manufacturer recommendations, we considered CT greater than 36 as undetected.
- CT cycle-threshold
- a miRNA was considered to be present in a subpopulation if the CT was less than 36 in all three biological replicates.
- the probes deemed to be present were normalized to the average expression of a sno-RNA control. The expression values were calculated as 2 "ACT , then median centered to 500 and log2-transformed.
- MiRNA expression profiling from human B cell malignancies was conducted using up to 1 ⁇ g of total RNA from sample and reference (normal lymph node), which were labeled with Cy3 or Cy5 fluorescent dyes, using the miRNA LNA labeling kit (Exiqon, Denmark).
- the fluorescently labeled samples were combined and hybridized to a miRNA microarray (v.10.0, Exiqon, Denmark), in a nitrogen atmosphere.
- the micro array slides were scanned with GenePix 4100 Scanner.
- the quantified signals were normalized using the global Lowess algorithm, using Genespring (Agilent) software.
- the intensity values for multiple spots were averaged and the normalized values were log2-transformed. Missing values were replaced with the lowest value for analysis.
- TargetScan www.targetscan.org
- a target gene was defined by the presence of a seed sequence match (nuc l eotides 2-8) and conservation of the seed sequence and 3 'UTR in humans, dog, rat, mouse and chicken. Additional conservation was examined in miRNA target genes selected for experimental validation. The distribution of the mRNA expression for these genes was plotted as a density plot using the Splus statistical software (Insightful Corporation).
- the difference in distribution between the B cell subsets was calculated using a two-sample, 1 -sided Kolmogorov-Smirnov test to examine the hypothesis that being a miRNA target conferred repression in the appropriate population (consistent with the known biology of miRNA effects).
- the 3'UTRs of LM02, MYBL l and PRDM 1 were aligned using Blastz alignment of Human, Chimp, Mouse, Rat, Dog, Chicken, Frog (Xenopus) and Zebrafish, and were displayed using the UCSC genome browser.
- the conservation of miR-223 seed sequence and the 3'UTRs of LM02 and MYBL l , as well as that of the miR-30 family and miR-9 on PRDM 1 were thus verified.
- RIPA Lysis buffer ( l x phosphate-buffered saline [PBS], 1 % Nonidet P-40,
- 0.5% sodium deoxycholate, 0.1 % SDS, 10 mM phenylmethylsulfonyl fluoride, 1 ⁇ g/mL aprotinin, and 100 mM sodium orthovanadate) was added to 750,000 cells and incubated on ice for 30 minutes. The mixture was spun down and the supernatant was transferred to a new tube as the whole cell extract. A total of 20 ⁇ g of cell lysate was separated on a 4 - 18 % Tris-Bis NuPAGE gel (Invitrogen) and transferred using the iBlot transfer device (Invitrogen) program 3 for 7 minutes (LM02 detection) or program 2 for 6 minutes (PRDM 1 ).
- the blots were probed using 1 :200 mouse-anti-LM02 (Santa Cruz Biotechnologies SC-65736), 1 :750 mouse- anti-Blimp- 1 (Santa Cruz Biotechnologies SC-6601 5) or 1 :5000 goat-anti-B-actin (Santa Cruz Biotechnologies SC-47778) for 1 hour at room temperature.
- the antibodies were detected using 1 : 10,000 goat-anti-mouse horseradish peroxidase conjugated antibodies (Santa Cruz Biotechnologies).
- Western Blotting Luminol Reagent (Santa Cruz Biotechnologies) was used to visualize the bands corresponding to each antibody.
- RNAs of interest were reverse-transcribed with ABI individual stem-loop primers designed to detect only mature miRNA, and measured by Taqman real-time PCR normalized to the small nucleolar RNA, RNU48.
- ABI High Capacity cDNA Reverse Transcription kit was used to assess mRNA expression using RT-PCR. Gene expression was measured with exon-spanning Taqman probes, and normalized to beta-2 micro globulin expression.
- BJAB and H929 were cultured in RPMI (Gibco) supplemented with 10% fetal bovine serum, and U266 was cultured in RPM I supplemented with 1 5% fetal bovine serum.
- 293T cells were grown in DMEM media (Gibco) with 10% FBS. All cell lines were grown in 37°C humidified cell culture incubators with C0 2 maintained at 5%.
- miRNAs of interest were over-expressed in cell lines of interest by transfecting the appropriate miRNA precursors (Ambion) at 100 nanomoles using Amaxa's Nucleofector system.
- BJAB was transfected with Nucleofector solution T, program T-016, U266 with Nucleofector C, program X-005, and H929 with Nucleofector V, program T-001.
- 1.5 million cells were used per transfection and mixed with appropriate miRNA precursors (Ambion) for a concentration of 100 nM.
- MiRNAs were considered to be differentially expressed if the mean signal was changed at least 2-fold and a false discovery rate (q) was less than 5% using Significance Analysis of Microarrays (SAM) with 1000 permutations. See Tusher et al. Proc Natl Acad Sci U S A. 2001 ;98:51 16-5 1 21 .
- SAM Significance Analysis of Microarrays
- Germinal Center versus Plasma Cells, and Germinal Center versus Memory Cells comparisons were identified using SAM. Genes that were 2-fold differentially expressed at a false discovery rate (q) less than 1 % with 1000 permutations were identified as significantly differentially expressed.
- Transcription factors were identified based on the gene ontology (GO search term "transcription factor") and matched to the probes of the Affymetrix U 133plus 2.0 microarray. Of the total of 938 transcription factor genes thus identified, we selected 364 genes that were differentially expressed in at least one of the B cell stage transitions. We evaluated the breakdown of the differentially expressed transcription factors among miRNA targets versus npn targets. The p-values were computed using a chi-square test separately in each B cell stage-transition.
- the top 50 most differentially expressed miRNAs (PO.01 ) in each pair-wise B cell malignancy type comparison were chosen as the initial predictor. Singular value decomposition was applied to reduce the list to 20 most informative miRNAs in each pair-wise comparison. See West et al. Proc Natl Acad Sci U S A . 2001 ; 98: 1 1462- 1 1467. A Bayesian logistic regression was performed in Matlab (Mathworks) using the 20-predictor miRNAs for each pair-wise comparison. Each sample was tested using the microRNA-based predictor in a leave-one-out fashion to determine the accuracy of each prediction. For a sample to be classified as a particular B cell malignancy (or normal) type, it had to be predicted as such in every pair-wise comparison.
- Firefly luciferase reporter constructs were created in the pL/SV40/GL3 vector for the LM02 3'UTR and the LM02 3'UTR with the predicted miR-223 binding site mutated, as described below. Mature microRNA expression of a pL/CMV/eGFP vector coding for pri- miR-223 from the 3 'UTR of EGFP of the vector was confirmed by Taqman-real time PCR in transfected 293T cells. gl3 activity was normalized in dual luciferase assays to pL/SV40/RLuc, with which it was cotransfected. The PRDMI 3'UTR was also cloned into the pL/SV40/GL3 vector. microRNA expression vectors and their respective seed sequence • mutants were created for miR-9-2, miR-30b, and miR-30d.
- the LM02 3 'UTR was PCR-amplified from BJAB cD A using primers 1 and 2 (SEQ ID NOs: 1 and 2, respectively) and ligated into the Xhol and Xbal sites of the previously described lentivirai vector pL/SV40/GL3, which expresses firefly luciferase. See Tusher et al. Proc Natl Acad Sci U S A. 2001 ; 98:51 16-5121.
- an LM02 3 'UTR mutant was created using mutant PCR primers 3 and 4 and then outer primers 1 and 2. The resulting fragment was also placed into the Xhol and Xbal sites of pL/SV40/GL3.
- the seed match predicted to bind to nucleotides 2-8 of miR-223 is converted from 5'AACUGAC 3 ' to 5'AACAGUC 3 '.
- a -350 nucleotide-long fragment of pri-miR-223, encompassing the pre-miRNA stem loop in its middle was PCR-amplified from genomic BJAB DNA with primers 6 and 7 (SEQ ID NOs. 6 and 7) and ligated into the Xhol and Xbal sites of the pL/CMV/eGFP vector.
- This pL/CMV/eGFP vector was generated by ligating a fragment containing the CMV promoter and the EGFP ORF into the BamHI and Xhol sites of the previously described lentivirai backbone pL. See Tusher et al. Proc Natl Acad Sci U S A. 2001 ; 98:51 16-5121. The expression of miR- 223 from the 3 'UTR of EGFP in the resulting vector was confirmed by Taqman real time PCR in transfected 293T cells.
- Table 1 Luciferase indicator assay compositions 2.5ng pL/SV40/GL3 2.5ng pL/SV40/GL3/LMO2 2.5ng pL/SV40/GL3/LMO2 seed
- Reporter expression was evaluated by dual luciferase assays (Promega) 48 hours post-transfection.
- Firefly Luciferase (GL3) to internal control Renilla Luciferase (RLuc) ratios from 293T cells transfected with pL/CMV/eGFP/miR-223 were divided by those obtained from 293T transfected with the pL/CMV/eGFP vector control.
- the average and standard deviation were taken across five experiments for the pL/SV40/gl3 empty, LM02, and LM02 mutant vectors.
- the PRDM l 3 'UTR was PCR-amplified from BJAB genomic DNA in two reactions using primer pairs 7 and 8 in one reaction, and 9 and 10 in another (SEQ ID NOs: 7 to 10, respectively). The two fragments were then ligated together into the Xhol and Notl sites of pL/SV40/GL3 to generate the entire PRDM l 3 'UTR.
- microRNA expression vectors were created as described above for mir-9-2, mir-30b, and mir-30d with the primers listed below. Again, over-expression from the 3'UTR of EGFP in the resulting vector was confirmed by Taqman real-time PCR in transfected 293T cells.
- PRDMl primer sequences 1 550 PRD 1 3'UTR piece 1 REV TTGCTTCTCTAGAGGAGAAAC
- Luciferase assays were carried out in a manner similar to those described for LM02.
- genomic DNA was isolated from purified CLL cells and isolated using the GenElute Mammalian DNA extraction Kit from Sigma (St. Louis, MO) according to the manufacturer's instructions. DNA was amplified using nested PCR primers. PCR products were electrophoresed, purified, and sequenced using an automated DNA sequencer (Applied Biosystems, Foster City, CA) with the BigDye Terminator kit (Perkin Elmer, Boston, MA).
- Example 2 Mature B cell Stages Display Characteristic Patterns of MicroRNA Expression
- Mature B cell subsets can be defined by the expression of surface CD19, IgD, CD38, and CD27, and were obtained by fluorescence activated cell sorting of tonsils from young individuals undergoing routine tonsillectomy. See Figures I B and 1 C. Cells were previously gated on CD 19 positive cells. Naive and memory B cells were distinguished from germinal center and plasma cells based on surface CD38 and IgD expression. [00122] To determine whether mature B cell subsets had unique patterns of microRNA (miRNA) expression, we used a 384-well multiplexed real time polymerase chain reaction (RT-PCR) assay (Applied Biosystems) that allowed measurement of all 365 miRNAs in miRBase 9.2. See Chen et al.
- RT-PCR real time polymerase chain reaction
- Table 5 miRNAs measured using the multiplex RT-PCR assay, but not consistently detected in any B-cell population
- hsa-let-7e hsa-miR-383 hsa-miR-376a hsa-miR-566 hsa-miR-IOa hsa-miR-198 hsa-miR-376b hsa-miR-551b hsa-miR-IOb hsa-miR-224 hsa-miR-380-5p hsa-miR-569 hsa-miR-34a hsa-miR-299-5p hsa-miR-410 hsa-miR-570 hsa-miR-34b hsa-miR-409-5p hsa-miR-412 hsa-miR-548a hsa-m ' iR-34c hsa-miR-432 hsa-miR-432 hsa-miR
- the B cell subsets were profiled for gene expression at the whole genome level, as described previously. See Dave et al. N Engl J Med. 2004; 351 :2159-2169. At each stage, we identified differentially expressed genes as those genes with a mean two-fold difference in expression and a false-discovery rate of less than 1 %. See Figures I E, 1 G, and I I. Genes that we found to be differentially expressed in each stage-transition were consistent with previous studies that examined gene expression in B cell subsets using microarrays with fewer probes, an overlap that was found to be highly statistically significant (PO.001 , chi-squared test). See, e.g., Klein et al. Proc Natl Acad Sci U S A . 2003; 100:2639-2644; and Shaffer et al. Immunity. 2001 ; 1 5: 375-385.
- FIG. 6A shows density plots of the expression frequency of predicted mRNA targets of microRNAs expressed highly in germinal center B cells compared to naive cells.
- Figure 6B shows density plots of the expression frequency of predicted mRNA targets of miRNAs expressed highly in germinal center B cells compared to plasma cells.
- the depicted p-value was calculated using a 1 -sided Kolmogorov-Smirnov test.
- Figure 6C shows density plots of the expression frequency of predicted mRNA targets of miRNAs expressed highly in the germinal center B cells compared to memory B cells.
- the depicted p-value was calculated using a 1 -sided Kolmogorov- Smirnov test.
- Example 3 MiR-223 regulates LM02 in the naive ⁇ germinal center and germinal center ⁇ memory cell transitions
- MiR-223 has previously been described as being important in the commitment to myeloid lineage. See Chen et al. Science. 2004; 303:83-86; Johnnidis et al. Nature. 2008; 451 : 1 125- 1 129.
- miR-223 has a highly conserved sequence complementarity to the 3 'UTR of 2 transcription factors that are expressed highly during GC cell differentiation: LM02 ( Figure 2A) and MYBL1 ( Figure 8A). Higher expression of miR-223 in the naive B cell stage could inhibit the untimely expression of these transcription factors until the cell is ready to undergo the germinal center reaction.
- B1AB GC cell lymphoma cells
- Over-expression of miR-223 resulted in a consistent down-regulation of LM02 at the transcript level compared to a transfection with a scrambled control with no sequence complementarity to the human genome.
- Figure 2B In that figure, the blue bars depict expression of LM02 24 hours after transfection with a scrambled control that does not possess complementarity to the human genome.
- LM02 Activation of LM02 has been associated with the development of leukemia in patients undergoing gene therapy. Hacein-Bey-Abina et al. Science. 2003;302:415-419. On the other hand, higher expression of PRDM 1 alone is sufficient to induce plasma cell-differentiation. Turner et al. Cell. 1994;77:297-306. Inappropriate expression of such genes must be effectively turned off for a cell to maintain its state. This mode of regulation is reflected in the effects of miR-223, miR-9 and miR-30, which turn off the inappropriate expression ofLM02 and PRDM1 and might promote state maintenance and inhibition of lymphomagenesis.
- Example 4 MiR-9 and the miR-30 family regulate PRDM1 (blimp-1) in the germinal center -> plasma cell transition
- the 3'UTR of PRDM 1 contains 3 highly conserved binding sites complementary to. the seed sequence of members of the miR-30 family, as well as 3 binding sites for the seed sequence of miR-9, 2 of which are highly conserved across multiple species. See Figure 3A.
- the 3 'UTR region of PRDM1 complementary to miR-30 is shown in red.
- the 3 sites are complementary to nucleotides 2-8 (UTR position 408), nucleotides 1 -8 (UTR position 2370) and nucleotides 2-8 (UTR position 2383) on the miRNA, respectively.
- the 3'UTR region of PRDM1 complementary to miR-9 is shown in green.
- the 3 sites are complementary to nucleotides 1 -7 (UTR position 1459), nucleotides 2-8 (UTR position 2108) and nucleotides 2-8 (UTR position 2323) on the miRNA respectively. These sites are highly conserved across a number of species, with the exception of one miR-9 site (UTR position 1459) that is only present in humans. [00138] To evaluate the effects of the miR-30 family and miR-9 on PRDM l expression in plasma cells, we introduced precursors of miR-9, miR-30b and miR-30d into the U266 multiple myeloma (plasma cell) cell line.
- luciferase reporter activity of the PRDM l 3'UTR construct was decreased by overexpression of miR-9, miR-30b, and miR-30d, but not their respective seed sequence mutants. See Figure 3E, which shows the average of three experiments.
- the down-regulation of the luciferase reporter signal and its restoration in the mutant constructs was found to be statistically significant in each of the 3 microRNAs: miR-9, miR-30b and miR-30d (PO.05, student's t-test).
- the luciferase reporter activity level was rescued to the activity level of the empty vector control when the seed sequence of the microRNAs was mutated.
- the miR-17 ⁇ 92 family has been implicated in early B cell differentiation and mice lacking the loci that encode these miRNAs have arrested early B cell development. See Ventura et al. Cell. 2008; 132:875-886.
- the expression patterns of the miR- 17-92 family suggest that the regulatory motifs embedded in the interaction of this miRNA family and its targets might have an additional function in regulating mature B cell differentiation.
- miRNA expression may promote a highly regulated state that enables GC cells to interact with T cells and antigen presenting cells, and to leave the GC cells poised for differentiation into memory or plasma cells.
- miRNAs expressed highly in naive and plasma cells may be underrepresented in current miRNA libraries. Such libraries are often constructed from lymph nodes, which are typically enriched in GC cells. High throughput sequencing of sorted populations of B cells could reveal novel miRNAs that are highly expressed in those populations.
- Table 7 Predictor microRNAs that distinguish germinal center B-cell (GCB) DLBCL from Burkitt Lymphoma, activated B-cell (ABC) DLBCL, and chronic lymphocytic leukemia
- BL Burkitt lymphoma
- ABC activated B-cell DLBCL
- CLL chronic lymphocytic lymphoma
- Table 8 Predictor microRNAs that distinguish activated B-cell (ABC) DLBCL from Burkitt Lymphoma and chronic lymphocytic leukemia
- BL Burkitt lymphoma
- CLL chronic lymphocytic lymphoma
- Table 9 Predictor microRNAs that distinguish Burkitt lymphoma from chronic lymphocytic leukemia
- CLL chronic lymphocytic lymphoma
- microRNAs that can be used to distinguish each of the six B cell malignancies analyzed from the other five. Lists of those microRNAs, and whether they are expressed in high levels or low levels relative to the other 5 B cell malignancies, are shown in Tables 10 through 13. In certain embodiments, each of those microRNAs could be used to distinguish one of the six B cell malignancies from the other five. High and low in the table refer to at least a 2 fold difference when compared to other lymphomas and benign lymph nodes.
- Table 10 Predictor microRNAs that distinguish Burkitt lymphoma, germinal center B-cell (GCB) DLBCL, and follicular lymphoma from all other B cell malignancies in the study
- miR-20a/rno-miR-20a High 103/rno-miR-103 High High hsa-miR-23a/mmu- hsa-miR-637 hsa-miR-744/mmu-miR- miR-23a/rno-miR-23a Low High 744 High hsa-miR-27a/mmu- hsa-mi ' R-148a/mmu- hsa-miR-221*
- miR-27a/rno-miR-27a Low miR-148a High High hsa-miR-34b/mmu- hsa-miR-199a-3p/hsa- hsa-miR-215
- miR-34b-3p miR-199b-3p/mmu-miR- 199a-3p/mmu-miR-
- miR-195/rno-miR-195 Low High hsa-miR-103/mmu- hsa-miR-574-3p/mmu- miR-103/rno-miR-103 Low miR-574-3p High hsa-miR-888* Low hsa-miR-155* High hsa-miR-363/mmu- hsa-miR-374b*
- miR-363/rno-miR-363 Low High hsa-miR-140- hsa-miR-497/mmu-miR-
- miR-668 Low High hsa-miR-221/mmu- hsa-miR-934
- miR-29c/rno-miR-29c Low High hsa-miR-146a/mmu- hsa-miR-129*
- Table 12 Predictor microRNAs that distinguish chronic lymphocytic leukemia from all other B cell malignancies in the study
- CLL miRNA list CLL vs CLL miRNA list CLL vs CLL miRNA list (con't) CLL vs others (con't) others others hsa-miR- hsa-miR-199a- hsa-miR-185*
- miR-33/rno-miR-33 High 7i/rno-let-7i High Low hsa-miR-363/mmu- hsa-miR-26a/mmu- hsa-miR-519c-5p/hsa-miR- miR-363/rno-miR- miR-26a/rno-miR- 519b-5p/hsa-miR-523*/hsa-
- Table 13 Predictor microRNAs that distinguish Hodgkin's lympoma from all other B cell malignancies in the study
- miR-425 High High High hsa-miR-514 High hsa-miR-7-2* High hsa-miR-513a-5p High hsa-miR-519e hsa-miR-490- hsa-miR-494/mmu-miR-
- microRNAs From the data in Tables 10 through 13, we identified subsets of microRNAs that are sufficient to distinguish each of the six B cell malignancies from the other five. We selected only microRNAs that are expressed more highly in the selected B cell malignancy. Those microRNAs are listed in Tables 14 and 15. In certain embodiments, each of the microRNAs listed in Tables 14 and 15 can be used to distinguish one B cell malignancy from the other five.
- Table 14 Predictor microRNAs that distinguish activated B-cell (ABC) DLBCL, germinal center B-cell like (GCB) DLBCL, and Burkitt lymphoma
- Table 15 Predictor microRNAs that distinguish chromic lymphocytic leukemia, follicular lymphoma, and Hodgkin's lymphoma
- hsa-miR-550 hsa-miR-524-5p hsa-miR-145*/mmu-miR-145* hsa-miR-801/mmu-miR-801 hsa-miR-34c-5p/mmu-miR- hsa-miR-296-5p/mmu-miR-296-
- microRNAs that can distinguish between each pair of B cell malignancies in the study. Lists of those microRNAs are shown in Appendix B, Tables 16 to 30. In certain embodiments, each of the listed microRNAs is sufficient to distinguish between the two B cell malignancies listed in the table description.
- Diffuse large B cell lymphoma is the most common form of lymphoma and is known to comprise at least 2 molecularly distinct subgroups with different responses to standard therapy. These two distinct subgroups are typically identified as ABC DLBCL and GC (or GCB) DLBCL.
- Total RNA was extracted from the 31 samples using the phenol-chloroform method to preserve microRNAs, using Ambion reagents.
- Total RNA (typically 5 ⁇ g) from each sample was run on denaturing polyacrylamide-urea gels.
- the ⁇ 17-25 nucleotide RNAs were excised from the gel, ligated to sequencing adaptors on both ends and reverse transcribed.
- the resulting cDNA library was PCR-amplified for 15 cycles and gel purified on 6% acrylamide gel. The gel-purified amplicon quality and quantity were analyzed on a 6% acrylamide gel relative to oligonucleotides of known concentration and size.
- RNA libraries from the 31 samples which were subjected to massively parallel, high-throughput sequencing using the lllumina platform generated a total of 328 million separate reads.
- Our approach to analyzing the sequences and discovering microRNAs broadly follows a previously described method (see, Zheng, Q., et al. GOEAST: a web-based software toolkit for Gene Ontology enrichment analysis, Nucleic acids Res. 2008;36 (Web Server issue: W358-363). All bioinformatics analyses were performed using a cluster of 1024 Linux computer nodes. Preprocessing was carried out using locally written Shell and Perl scripts.
- miRNA expression profiling was conducted using the Applied Biosystems 384-well multiplexed real-time PCR assay using 400ng of total RNA. Eight reactions, each containing 50ng of RNA and a multiplex looped primer pool with endogenous small nucleolar (sno)-RNA controls, were used to reverse-transcribe the miRNAs in parallel fashion (see Tables 33 and 34 for primers). The completed reactions were loaded onto the 384-well plate per manufacturer's instructions, and real-time PCR was run on the ABI 7900HT Prism instrument. For each 384- well plate, we used the automatically determined cycle-threshold (Cj) using the SDS 2.2.1 software (Applied Biosystems).
- Cj cycle-threshold
- a CT greater than 35 was treated as undetected.
- the probes deemed to be present were normalized to the average expression of a sno-RNA control. The expression values were calculated as 2 "ACT , then median centered to 500 and log2-transformed.
- Tumor samples from 101 patients with diffuse large B cell lymphoma were obtained at the time of diagnosis and freshly frozen. These cases were profiled using Affymetrix Gene 1 .0 ST arrays. The molecular subgroups were distinguished using a Bayesian approach described previously (Ambros, V., et al., RNA (2003);9(3):277-279).
- microRNAs that we have identified in our study may be expressed at higher levels in other development stages or in other cell types. This notion is confirmed by our examination of the novel microRNAs in non B cell data. For instance, a number of the microRNAs that we discovered were also present at 10-fold or higher levels in cell lines derived from breast cancer and cervical cancer, suggesting that the microRNAs that we have discovered in B cells have broad biological significance.
- microRNAs appear to be distributed throughout the genome, a number of microRNAs have been found in clusters such as miR-17-92 that are transcribed from a single primary transcript and cleaved into the individual microRNAs by the enzyme DROSHA.
- clusters such as miR-17-92 that are transcribed from a single primary transcript and cleaved into the individual microRNAs by the enzyme DROSHA.
- the first cluster was previously annotated as a hypothetical gene LOC100130622, and subsequently discarded from Refseq when no associated protein was identified.
- microRNAs of this cluster all share the same seed sequence, suggesting that they target the same genes.
- SMAD2 and SMAD3 which are well known mediators of the TGF-beta signaling pathway.
- gene expression of both SMAD2 and SMAD3 in our set of 101 DLBCLs were inversely correlated with this cluster (P ⁇ 0.001 , correlation test).
- Gene set enrichment analysis revealed that expression of the TGF-beta pathway in DLBCL samples varied inversely with the expression of the microRNA cluster, with a higher expression of the microRNA associated with a lower expression of the pathway (P ⁇ 10 '6 ), which has been noted as a factor in the biology of these tumors.
- Table 31 miRNAs identifled by deep sequencing analysis.
- Table 32 Novel miRNAs identified by deep sequencing analysis.
- the 3 '-end G of SEQ ID NO. 1565 is optionally omitted (providing SEQ ID NO. 1022)
- Appendix A Average expression of the genes depicted in Fig. 6 *
Landscapes
- Chemical & Material Sciences (AREA)
- Life Sciences & Earth Sciences (AREA)
- Health & Medical Sciences (AREA)
- Organic Chemistry (AREA)
- Proteomics, Peptides & Aminoacids (AREA)
- Engineering & Computer Science (AREA)
- Immunology (AREA)
- Pathology (AREA)
- Analytical Chemistry (AREA)
- Zoology (AREA)
- Wood Science & Technology (AREA)
- Genetics & Genomics (AREA)
- Hospice & Palliative Care (AREA)
- Biochemistry (AREA)
- Microbiology (AREA)
- Molecular Biology (AREA)
- Biophysics (AREA)
- Physics & Mathematics (AREA)
- Oncology (AREA)
- Biotechnology (AREA)
- Bioinformatics & Cheminformatics (AREA)
- General Engineering & Computer Science (AREA)
- General Health & Medical Sciences (AREA)
- Measuring Or Testing Involving Enzymes Or Micro-Organisms (AREA)
- Detergent Compositions (AREA)
- Materials For Photolithography (AREA)
Abstract
Disclosed are nucleic acid sequences, including microRNA sequences and cDNA sequences, as well as vectors, DNA libraries, microarrays, and recombinant cells comprising the nucleic acid sequences described herein. Methods of determining the B cell stage from which a B cell malignancy is derived. Methods of identifying B cell malignancies are also provided. Methods of diagnosing B cell malignancies are provided. Such methods comprise, in certain embodiments, detecting one or more microRNAs or cDNAs as disclosed herein.
Description
MICRORNA AND USE THEREOF IN IDENTIFICATION OF B CELL
MALIGNANCIES
CROSS REFERENCE TO RELATED APPLICATIONS
[0001 ] This application is related to and claims the benefit of priority of U.S. Provisional Application Serial No. 61 /266,733, filed December 4, 2009, which is incorporated herein by. reference.
STATEMENT OF GOVERNMENT SUPPORT
(0002] This invention was made with United States government support from the National Institutes of Health grant no. 12-CA- 100639. The United States government has certain rights in this invention.
SEQUENCE LISTING
[0003] The sequence listing is filed with the application in electronic format only and is incorporated by reference herein. The sequence listing text file "WO_ASFILED_SequenceListing.txt" was created on December 3, 2010, and is 262,254 bytes in size.
BACKGROUND
[0004] Naive B cells migrate through the circulation to lymphoid organs where they undergo the T cell-dependent germinal center reaction. Adaptive immunity is acquired as specific antigen-reactive germinal center B cells differentiate into the major effector B cells of the adaptive immune system: memory cells and plasma cells. See, e.g., Figure 1 A. Although the role of specific transcription factors in mature B cell differentiation has been examined {see Nutt et al. Nature. 1999;401 :556-562; Chang et al. Proc Natl Acad Sci U S A. 1996;93 :6947- 6952; Turner et al. Cell. 1994;77:297-306; Shaffer et al., Immunity. 2004;21 :81 -93 ; and Schebesta et al. Curr Opin Immunol. 2002; 14:216-223), mechanisms regulating such transcription factors during mature B cell differentiation are largely unknown.
[0005] Many malignancies derived from mature B cells are known and are believed to constitute the majority of leukemias and lymphomas. Such malignancies appear to reflect defined stages of normal B cell differentiation. Diagnosis of leukemias and lymphomas can be particularly difficult because of their shared lineage. These cancers frequently display overlapping morphologies, genetic abnormalities, and expression of surface markers, which can complicate the diagnosis. However, the distinction of these tumors is clinically important
because there are important differences in the treatments and expected response to treatment. Thus methods that improve the accuracy of their diagnosis should provide to improved outcomes for these patients.
[0006] MicroRNAs are commonly 18-22 nucleotide-long RNA molecules that regulate expression of genes. There is an increasing recognition of the role of microRNAs in oncogenesis, lineage-selection, and immune cel l function, including early B cell differentiation. See Calin et al. N Engl J Med. 2005;353 : 1793- 1 801 ; O'Donnell et al. Nature. 2005;435 :839-843 ; Chen et al. Science. 2004;303:83-86; Lim et al. Nature. 2005;433 :769-773; Li et al. Cell. 2007; 129: 147- 161 ; Xiao et al., Nat Immunol. 2008;9:405-414; Baltimore et al. Nat Immunol. 2008;9:839-845; and Ventura et al. Cell. 2008; 132:875-886. However, the full extent and function of microRNA expression during mature B cell differentiation and in B cell malignancies are not known.
[0007J Correct diagnosis of B cell malignancies is important from both a clinical standpoint and from the standpoint of setting appropriate patient expectations. A misdiagnosed B cell malignancy may lead to an inappropriate therapy, which can unnecessarily endanger the patient's life and/or be an ineffective treatment for the B cell malignancy. As an example, the diagnostic distinction of Burkitt lymphoma (BL) from diffuse large B cell lymphomas (DLBCLs) can be difficult because of overlapping morphology, immunophenotype and cytogenetics. Burkitt lymphoma tumors are molecularly distinct from DLBCL, however. The difficulty and importance of obtaining the correct diagnosis in BL was highlighted by the experience of a multicenter clinical trial, CALGB trial#9251 19, in which nearly half of the 100 patients with an assigned diagnosis of BL were found to have another diagnosis upon further pathology review.
(0008] If diagnosed and treated appropriately, nearly 80% of patients with BL can be cured with intensive (high dose) chemotherapy regimens. Thus, a misclassification of BL as DLBCL can result in a missed opportunity to cure the malignancy. On the other hand, misclassification of DLBCL as BL leads to unnecessarily morbidity from intensive chemotherapy regimens. Thus, methods that improve the diagnosis of BL, and other B cell malignancies, can provide better outcomes in patients.
|0009] DLBCLs can also be subclassified into two different B cell mal ignancies, activated B- cell (ABC) DLBCL and germinal center B cell like (GCB) DLBCL. There are at least two important clinical applications for the molecular sub-grouping of DLBCL patients. First, the prognostic information could inform the choices and expectations of patients and their physicians. Second, the important molecular differences in these subgroups form the basis of
testing different targeted therapies in these patients. The possibility of a differential response to therapy among ABC and GCB DLBCLs is supported by data that suggest that the benefit of receiving a proteosome inhibitor, bortozemib, is predominantly limited to those patients who have ABC DLBCL. However, the clinical distinction of the subgroups of DLBCL using immunohistochemistry is difficult with current methods distinguishing GCB DLBCL from non-GCB DLBCL with limited success.
[0010] Mature B cell differentiation is important for the development of adaptive immunity. The process is also of interest because B cell malignancies are common and retain a number of features derived from their normal counterpart B cell subsets. Unlike other maturation pathways in the hematopoietic and other cell lineages, successive stages of mature B cells do not simply signify progressive differentiation away from the stem cell stage. Rather, each stage represents a specialized state with specific functions. Thus, germinal center (GC) cells interact with CD4 T cells and dendritic cells and undergo somatic hypermutation and Ig-heavy chain class-switching. On the other hand, plasma cells secrete immunoglobulin, while memory cells are primed to proliferate and differentiate into plasma cells upon repeat contact with antigen. The specialized functions demand a finely tuned program of gene regulation.
[0011] MicroRNAs represent a novel class of biomarkers that provide new opportunities for clinical translation. First, intact microRNAs can be isolated from tissues preserved using standard methods, such as formalin fixed, paraffin embedded (FFPE) tissue. Thus, microRNA- based biomarkers could be easy to translate to clinical use. Second, microRNAs can be readily assayed using real-time PCR and other methods available in conventional pathology.
SUMMARY
[0012] In an aspect the disclosure provides an isolated nucleic acid molecule having at least 80% sequence identity to any one of SEQ ID NOs: 763- 1350 or 1 565 or a complementary sequence thereof. Embodiments provide for sequence identity of at least 90% or 95%.
[0013] In an aspect the disclosure provides an isolated nucleic acid molecule comprises any one of SEQ I D NOs: 763- 1 350 or 1 565 or a complementary sequence thereof. Embodiments provide for isolated nucleic acid molecules comprising a primary miRNA, a precursor miRNA, a mature miRNA, or a DNA molecule coding therefore. Embodiments further provide for a cDNA molecule comprising sequence that corresponds to a miRNA sequence of any one of SEQ ID NOs: 763- 1 350 or 1 565.
[0014] Aspects of the disclosure provide compositions, pharmaceutical compositions, vectors, host cells, and DNA libraries comprising at least one nucleic acid molecule described herein.
[0015] In an aspect the disclosure provides a method of determining the B cell stage of a B cell malignancy in a subject comprising determining the level of expression of at least one microRNA in a sample comprising a B cell taken from the subject relative the level of expression of the at least one microRNA in a control sample, wherein the at least one microRNA is selected from the microRNAs listed in Table 4.
[0016] In an aspect the disclosure provides a method of identifying a B cell malignancy in a subject comprising determining the level of expression of at least one microRNA in a sample comprising a B cell taken from the subject relative the level of expression of the at least one microRNA in a control sample, wherein the at least one microRNA is selected from the microRNAs listed in Table 4.
[0017] In an aspect the disclosure provides a method of diagnosing a B cell malignancy in a subject comprising determining the level of expression of at least one microRNA in a sample comprising a B cell taken from the subject relative the level of expression of the at least one microRNA in a control sample, wherein the at least one microRNA is selected from the microRNAs listed in Table 4.
[0018] In an aspect the disclosure provides a method of identifying a B cell malignancy in a subject comprising determining the level of expression of at least one microRNA in a sample comprising a B cell taken from the subject relative the level of expression of the at least one microRNA in a control sample, wherein the at least one microRNA is selected from the microRNAs listed in any one of Tables 7 to 35.
[0019] In an aspect the disclosure provides a method of diagnosing a B cell malignancy in a subject comprising determining the level of expression of at least one microRNA in a sample comprising a B cell taken from the subject relative to the level of expression of the at least one microRNA in a control sample, wherein the at least one microRNA is selected from the microRNAs listed in any one of Tables 7 to 35.
[0020] Embodiments of these aspects provide for identification or diagnosis of a B cell malignancy selected from chronic lymphocytic leukemia, follicular lymphoma, Hodgkin's lymphoma, activated B-cell diffuse large B cell lymphoma (DLBCL), germinal center-like DLBCL, and Burkitt lymphoma.
[0021 ] In an aspect the disclosure provides a method of determining whether a B cell malignancy in a sample is Burkitt lymphoma, activated B cell-like diffuse large B cell lymphoma (DLBCL), or germinal center-like DLBCL, comprising determining the level of expression of at least one microRNA in the sample relative to the level of expression of the at least one microRNA in a control sample, wherein the at least one microRNA is selected from
the microRNAs listed in Table 10, column "BL miRNA list"; Table 14, column "BL High"; Table 1 1 ; Table 14, column "ABC High"; Table 10, column "GCB miRNA list"; Table 14, column "GCB High"; Table 32, or Table 35.
[0022] In an aspect the disclosure provides a method of determining whether a B cell malignancy in a sample is Burkitt lymphoma, activated B cell-like diffuse large B cell lymphoma (DLBCL), or germinal center-like DLBCL, comprising determining the level of expression of at least one microRNA in the sample relative to the level of expression of the at least one microRNA in a control sample, wherein the at least one microRNA is selected from the microRNAs listed in at least one column labeled "GCBvsBL" or "GCBvsABC" in Table 7 or "ABCvsBL" in Table 8.
[0023] In an aspect the disclosure provides a method of determining whether a B cell malignancy in a sample is activated B cell-like diffuse large B cell lymphoma (DLBCL), or germinal center-like DLBCL, comprising determining the level of expression of at least one microRNA in the sample relative to the level of expression of the at least one microRNA in a control sample, wherein the at least one microRNA is selected from the microRNAs listed in Table 35.
[0024] In an aspect the disclosure provides a microarray comprising miRNA-specific probe oligonucleotides wherein at least one miRNA-specific probe oligonucleotide is specific for a sequence of SEQ ID NOs: 763- 1350 or 1565, or any combination thereof.
[0025] In an aspect the disclosure provides a kit comprising at least one primer sequence that can detect any one of SEQ ID NOs: 763- 1350 or 1565, or a combination thereof.
[0026] In an aspect the disclosure provides a kit comprising at least one isolated nucleic acid molecule having a sequence of any one of SEQ ID NOs: 1351 - 1564.
[0027] In an aspect, the disclosure provides a method of identifying a B cell malignancy comprising determining the level of expression of at least one microRNA selected from the microRNAs listed in Table 4. In certain embodiments, a method comprises determining the level of expression of at least one microRNA selected from the microRNAs listed in Tables 7- 35.
[0028] Other aspects and embodiments will be apparent to one of skill in the art in light of the following detailed description.
DESCRIPTION OF THE FIGURES
[0029] Figure 1 shows that mature B cell subsets demonstrate distinct microRNA profiles. Figure 1 A is a diagram showing the overall schema of mature B cell differentiation. Figure 1 B
shows selection of B cel l subsets using flow cytometry. Figure 1 C shows the distinction between naive and memory B cells based on IgD and CD27 expression using flow cytometry. Figure I D shows relative expression of microRNA in the naive to germinal center B cell transition. Figure I E shows relative expression of mRNA in the naive to germinal center B cell transition. Figure I F shows relative expression of microRNA in the germinal center B cell to plasma cell transition. Figure 1 G shows relative expression of mRNA in the germinal center B cell to plasma cell transition. Figure 1 H shows relative expression of microRNA in the germinal center B cell to memory B cell transition. Figure I I shows relative expression of mRNA in the germinal center B cell to memory B cell transition. In Figures I D, I F, and 1 H, mi NAs that were, on average, at least 2-fold differentially expressed at a false discovery rate of less than 5% are shown according to the color scale. In Figures and I E, 1 G, and 1 1, mRN As that were, on average, at least 2-fold differentially expressed at a false discovery rate of less than 1 % are shown according to the color scale. Figure 1 J shows that expression of certain microRNA processing genes, DGCR8, DICER 1 , EIF2C2, DROSHA, and XP05 is unchanged among the B cell subsets (P>0.1 in all. cases).
|0030] Figure 2 shows experimental validation of the interaction of miR-223, which is expressed highly in naive and memory B cells compared to germinal center B cells, and targets the transcription factor LM02. Figure 2 A shows base-pairing of the 3 'UTR of the LM02 gene with nucleotides 1 -8 of miR-223. This 8-mer is highly conserved across a number of species and serves as a potential binding site for miR-223. Figure 2B shows the effects of over- expression of miR-223 in germinal center lymphoma-derived BJAB cells in 3 separate experiments. Figure 2C shows the relative LM02 protein expression from a representative experiment (from 3 replicates) transfecting a scrambled control versus a precursor for miR-223 in BJAB cells. Figure 2D shows average expression of LM02 relative to Actin over three Western blots of BJAB cells transfected with a scrambled control versus a precursor for miR- 223. Figure 2E shows luciferase activity in BJAB cells transfected with a vector comprising either a luciferase gene coupled to the 3 'UTR of the LM02 gene or a luciferase gene coupled to the 3 'UTR of the LM02 gene with the miR-223 binding site mutated, and cotransfected with miR-223.
[0031 ] Figure 3 shows experimental validation of the interaction of miR-9 and miR-30, which are expressed highly in germinal center B cells compared to plasma cells and target the transcription factor PRDM1. Figure 3A shows base-pairing of the 3 'UTR of the PRDM 1 gene with the 5' seed region of miR-9 and the miR-30 family. Figure 3 B shows the effects of over- expressing miR-9 and 2 members of the miR-30 family, miR-30b and miR-30d, in plasma cell
myeloma-derived U266 cells in 3 separate experiments. Figure 3C shows the relative PRDM 1 protein expression from a representative experiment (from 3 replicates) transfecting a scrambled control versus a precursor for miR-9, miR-30b, or miR-30d in U266 cells. Figure 3D shows the average expression of PRDM1 relative to Actin over three Western blots of U266 cells transfected with a scrambled control versus a precursor for miR-9, miR-30b, or miR-30d. (PO.05 for miR-30b and miR-30d, P=0.08 for miR-9.) Figure 3E shows repression of luciferase activity from the PRDM 1 3 'UTR construct by overexpression of miR-9, miR-30b, and miR-30d wild-type and mutant sequences.
[0032] Figure 4 shows that expression of microRNAs in normal B cells is conserved in certain B cell malignancies. Figure 4A shows lineage prediction of both IgV mutated and unmutated chronic lymphocytic leukemia, germinal center B cell derived DLBCL, and Burkitt lymphoma based on differential expression of microRNAs in normal na'ive B cells and germinal center B cells (microRNAs depicted in Figure I D). Figure 4B shows miRNAs that were found to be differentially expressed (PO.05) in malignant cells and normal cells as discussed in Example 5. Figure 4C shows cloning frequency of miRNAs in unselected mature B cells (N=3) and certain B cell malignancies (N=42) from a previously published study ("sequencing data"), as discussed in Example 5. Figure 4D shows differentially expressed miRNAs that distinguish Burkitt lymphoma, activated B cell-like (ABC) diffuse large B cell lymphoma (DLBCL), germinal center-like DLBCL (GCB DLBCL), and chronic lymphocytic leukemia. Predictor miRNAs from each pair-wise comparison that distinguish each entity are shown in the boxes.
[0033] Figure 5 shows the distribution of miRNAs present in B-cell subsets.
[0034] Figure 6 shows that certain microRNA targets are expressed at lower levels. Figure 6A shows density plots of the expression frequency of predicted mRNA targets of miRNAs expressed highly in germinal center B cells compared to naive cells. Figure 6B shows density plots of the expression frequency of predicted mRNA targets of miRNAs expressed highly in germinal center B cells compared to plasma cells. Figure 6C shows density plots of the expression frequency of predicted mRNA targets of miRNAs expressed highly in the germinal center B cells compared to memory B cells.
[0035] Figure 7 shows that differentially expressed transcription factors are frequently microRNA targets. In Figure 7A, the left panel indicates the proportion of transcription factors that are differentially expressed in the naive to germinal center B-cell transition that are also predicted targets of differentially expressed miRNAs. The right panel indicates the proportion of transcription factors that are not differentially expressed and also are predicted targets of differentially expressed miRNA in that stage-transition. The p-value indicates the results of a
chi-squared test for the enrichment of predicted miRNA targets among the differentially expressed transcription factors. Figure 7B shows a similar analysis of the germinal center to plasma cell transition. Figure 7C shows a similar analysis of the germinal center to memory cell transition.
[0036] Figure 8 shows that Mybl transcript levels decrease with miR-223 overexpression. Figure 8A shows base-pairing of the 3'UTR of the MYBL 1 gene with nucleotides 2-8 of miR- 223. This 7-mer is highly conserved across a number of species and serves as a potential binding site for miR-223. Figure 8B shows the effects of over-expression of miR-223 in germinal center lymphoma-derived BJAB cells in 3 separate experiments.
[0037] Figure 9 shows the specificity of real-time PCR probes for members of the miR-30 family.
[0038] Figure 10 shows the results of leave one out cross validation applied to the predictors for Burkitt lymphoma, chronic lymphocytic leukemia, activated B-cell diffuse large B-cell lymphoma, and germinal center B-cell DLBCL.
[0039] Figure 1 1 shows differentially expressed miRNAs that distinguish activated B cell-like diffuse large B cell lymphoma (DLBCL), germinal center-like DLBCL (GCB DLBCL), Burkitt lymphoma, chronic lymphocytic leukemia, follicular lymphoma, and Hodgkin's lymphoma. Predictor miRNAs from each pair-wise comparison that distinguish each entity are shown in the boxes.
DETAILED DESCRIPTION
[0040] All patent and non-patent literature references that are cited herein are incorporated herein by reference in their entirety.
[0041 ] In a general sense, the disclosure relates to nucleic acid sequences, such as microRNAs (miRNA), as well as to the identification and analysis of microRNA expression levels and/or patterns in B cells. Through concomitant microRNA and mRNA profiling, the inventors have identified regulatory roles for microRNAs at each stage in mature B cell differentiation. This provides methods identifying microRNA-mediated regulation of oncogenes and key transcription factors in B cell differentiation. This work establishes the landscape of normal microRNA expression in mature B cells and its role in regulating normal B cell differentiation. Further, our work demonstrates that in contrast to the described down-regulation in other malignancies, stage-specific microRNAs are retained in B cell malignancies. The lineage of common B cell malignancies can be predicted based upon miRNA profiles of normal B cells, pointing to a role for microRNAs in the maintenance of mature B cell phenotypes in normal and malignant B cells.
[0042] In an aspect, the disclosure relates to an isolated nucleic acid molecule comprising: (a) a nucleotide sequence as shown in Table 32; (b) a nucleotide sequence which is the complement of (a), (c) a nucleotide sequence comprising a sequence identity of at least 80%, (e.g., 80, 81 , 82, 83, 84, 85, 86, 87, 88, 89, 90, 91 , 92, 93, 94, 95, 96, 97, 98, or at least 99%), to a sequence of (a) or (b) and/or (d) a nucleotide sequence which hybridizes under stringent conditions to a sequence of (a), (b) and/or (c). In some embodiments, the identity of sequence (c) to a sequence of (a) or (b) is at least 90%. In other embodiments, the identity of sequence (c) to a sequence of (a) or (b) at least 95%. The percent identity can be calculated by any routine method used by one of skill in the art such as, for example, the methods described herein.
|0043) In embodiments, the isolated nucleic acid molecule relates to a miRNA molecule and analogs thereof, a miRNA precursor molecule, or a primary miRNA molecule, as well as to DNA molecules encoding miRNA, miRNA precursor, or primary miRNA molecules. Accordingly, in such embodiments, the isolated nucleic acid molecule can function as a miRNA molecule under suitable conditions. Suitable conditions include, but are not limited to, various buffer systems that approximate physiologically relevant ionic concentrations and pHs, as well as physiological conditions.
[0044] In some embodiments, the nucleic acid molecule comprises a sequence that hybridizes to a nucleotide sequence as shown in Table 32, a complementary sequence thereof or a nucleic acid molecule having at least 80% sequence identity under stringent hybridization conditions. The basic parameters affecting the choice of hybridization conditions and guidance for devising suitable conditions are set forth by Sambrook, et al. (See, 1989, Molecular Cloning: A Laboratory Manual, Cold Spring Harbor Laboratory Press, Cold Spring Harbor, N.Y.; and Current Protocols in Molecular Biology, 1995, Ausubel et al., eds., John Wiley & Sons, Inc.), and can be readily determined by those of ordinary skill in the art based on, for example, the length and/or base composition of the DNA. Generally, stringent salt concentration will ordinarily be less than about 750 mM NaCl and 75 mM trisodium citrate, or less than about 500 mM NaCl and 50 mM trisodium citrate, or even less than about 250 mM NaCl and 25 mM trisodium citrate. High stringency hybridization conditions can be obtained by adding an amount of organic solvent (e.g., at least about 35% to about 50% formamide). Stringent temperature conditions will ordinarily include temperatures of at least about 30°C, (e.g., at least about 37°C, 42°C, 45°C, 50°C, or 55°C). Varying additional parameters, such as hybridization time, the concentration of detergent (e.g., 0.1 - 1 .0% sodium dodecyl sulfate (SDS)), and the inclusion or exclusion of carrier DNA (e.g., about 100-200 μg/ml denatured
salmon sperm DNA (ssDNA)), are well known to those skilled in the art. Stringent hybridization conditions are known in the art and include non-limiting examples such as, washing for 1 hr in 300 mM NaCl, 30 mM trisodium citrate and 0. 1 % SDS at 45-50°C; washing for 1 h in 300 mM NaCl, 30 mM trisodium citrate and 0.1 % SDS at 45-50°C; in 500 mM NaCl, 50 mM trisodium citrate, 1 % SDS, 35% formamide, and 100 μg/ml denatured salmon sperm DNA (ssDNA) at 37°C; or in 250 mM NaCl, 25 mM trisodium citrate, 1 % SDS, 50% formamide, and 200 μg/ml ssDNA at 42°C. Useful variations on these conditions will be readily apparent to those skilled in the art.
[0045] The isolated nucleic acid molecules provided herein suitably have a length of from about 18 to about 100 nucleotides. In embodiments wherein the isolated nucleic acid molecules are miRNAs, the lengths of the miRNAs are suitably in an expected range for the particular type of miRNA molecule. For example, mature miRNAs are typically from about 1 5 to about 28 nucleotides in length, and suitably have a length of about 19 to about 24 nucleotides (e.g., 19, 20, 21 , 22, 23, or 24 nucleotides). Precursor miRNAs typically comprise the mature miRNA sequence and contain a stem-loop structure, suitably of length of about 50 to about 90 nucleotides (e.g., 50, 55, 60, 65, 70, 75, 80, 85, or 90 nucleotides). Primary miRNAs (e.g., a primary transcript comprising a precursor miRNA) can suitably have a length of greater than 1 00 nucleotides.
[0046] The nucleic acid molecules can be provided in either a single-stranded or double- stranded form. Typically, a miRNA as such is identified as a single-stranded molecule, while the precursor mi RNA is typically at least partially self-complementary and capable of forming double-stranded portions, e.g. stem- and loop-structures. DNA molecules encoding the miRNA and miRNA precursor molecules (e.g., expression vectors, cloning vectors, and the like) are typically double-stranded. The individual nucleic acids that comprise the isolated nucleic acid molecules can be selected from RNA, DNA, or nucleic acid analog molecules, such as chemically modified sugar (e.g., 2'-modified (2'-F, 2'-OMe, etc.) or backbone (e.g., phosphorothioates), or cap (e.g., 5 '- and/or 3 '-abasic groups) moieties of ribonucleotides or deoxyribonucleotides. Other nucleic acid analogs, such as peptide nucleic acids (PNA) or locked nucleic acids (LNA), are also suitable in various embodiments described herein. In some embodiments the nucleic acid molecules can comprise any combination of nucleic acid analog(s).
]0047] While many of the nucleic acid molecules in the Tables are identified as RNA sequences, e.g., miRNAs, the disclosure of those sequences should be understood to encompass the corresponding DNA (e.g., cDNA) sequences, wherein the uracil (U) nucleotides
of the disclosed RNAs are substituted by thymidine (T) nucleotides in the corresponding DNA. One of skill in the art is able to generate such DNA sequences (e.g., cDNA) through routine microbiological techniques known in the art such as, for example, reverse transcription using methods that incorporate the reverse transcriptase enzyme.
[0048] In another aspect, the disclosure provides a recombinant expression vector comprising a recombinant nucleic acid sequence operatively linked to an expression control sequence, wherein expression of the recombinant nucleic acid sequence provides a miRNA sequence, a precursor miRNA sequence, or a primary miRNA sequence as described herein. The resulting sequence (e.g., primary or precursor miRNAs) can optionally be further processed to provide the miRNA sequence. In embodiments, the recombinant expression vector comprises at least one sequence in Table 32. Any suitable expression vector can be used such as, for example, a ' DNA vector (e.g., viral vector, plasmid, etc.). In some embodiments the expression vector is selected for expression in a eukaryotic cell such as, for example, a mammalian cell. One of skill in the art will be able to select an appropriate vector based on the particular application and/or expression system to be employed.
[0049] Thus, embodiments provide nucleic acid constructs in the form of plasmids, vectors, transcription or expression cassettes which comprise at least one nucleotide sequence encoding a miRNA described herein, or fragments thereof, and a suitable promoter region. Suitable vectors can be chosen or constructed, which contain appropriate regulatory sequences, such as promoter sequences, terminator sequences, polyadenylation sequences, enhancer sequences, marker genes and other sequences as desired. Vectors can be plasmids, phage (e.g. phage, or phagemid) or viral (e.g. lentivirus, adenovirus, AAV) or any other appropriate vector. For further details see, for example, Molecular Cloning: a Laboratory Manual : 2nd edition, Sambrook et al., 1 989, Cold Spring Harbor Laboratory Press.
|0050] Relatedness of Nucleic Acid Molecules/Sequences
[0051 ] The term "identity" refers to a relationship between the sequences of two or more two or more nucleic acid molecules, as determined by comparing the sequences. In the art, "identity" also means the degree of sequence relatedness between amino acid or nucleic acid molecule sequences, as the case may be, as determined by the match between strings of nucleotide or amino acid sequences. "Identity" measures the percent of identical matches between two or more sequences with gap alignments addressed by a particular mathematical model or computer programs (i.e., "algorithms").
[0052] Identity of related nucleic acid molecules can be readily calculated by known methods, including but not limited to those described in Computational Molecular Biology, Lesk, A. M.,
ed., Oxford University Press, New York, 1 988; Biocomputing: Informatics and Genome Projects, Smith, D. W., ed., Academic Press, New York, 19933 ; Computer Analysis of Sequence Data, Part 1 , Griffin, A. M ., and Griffin, H. G., eds., Humana Press, New Jersey, 1994; Sequence Analysis in Molecular Biology, von Heinje, G., Academic Press, 1987; and Sequence Analysis Primer, Gribskov, M. and Devereux, J., eds., M. Stockton Press, New York, 1991 ; and Carillo, H., and Lipman, D., SIAM J. Applied Math., 48: 1073 ( 1988).
[0053] Non-limiting methods for determining identity are designed to give the largest match between the sequences tested. Methods to determine identity are codified in publicly available computer programs. Preferred computer program methods to determine identity between two sequences include, but are not limited to, the GCG program package, including GAP (Devereux, et a!., Nucleic Acids Research 12:387 [1984]; Genetics Computer Group, University of Wisconsin, Madison, Wis.), BLASTN, and FASTA (Atschul et al., J. Molec. Biol. 21 5 :403-410 [ 1990]). The BLAST X program is publicly available from the National Center for Biotechnology Information (NCBI) and other sources (BLAST Manual, Altschul] et al., NCB NLM NIH Bethesda, Md. 20894; Altschul et al., J. Mol. Biol. 21 5 :403-410 [ 1990]). The well known Smith Waterman algorithm may also be used to determine identity.
[0054] Exemplary parameters for nucleic acid molecule sequence comparison include the following:
[0055] Algorithm: Needleman and Wunsch, J. Mol Biol. 48 :443-453 ( 1 970)
[0056] Comparison matrix: matches=+ 10, mismatch=0
[0057] Gap Penalty: 50
[0058] Gap Length Penalty: 3
[0059] The GAP program is also useful with the above parameters. The aforementioned parameters are the default parameters for nucleic acid molecule comparisons.
[0060] Other exemplary algorithms, gap opening penalties, gap extension penalties, comparison matrices, thresholds of similarity, etc. can be used by those of skill in the art, including those set forth in the Program Manual, Wisconsin Package, Version 9, September 1 997. The particular choices to be made will depend on the specific comparison to be made, such as DNA to DNA or RNA to DNA; and additionally, whether the comparison is between given pairs of sequences (in which case GAP or BestFit are generally preferred) or between one sequence and a large database of sequences (in which case FASTA or BLASTA are preferred).
[0061 ] In an aspect, the disclosure provides a vector comprising the isolated polynucleotide as described herein such as, for example one or more of SEQ ID NOs 773- 1046 or 1450- 1 542.
In embodiments, the vector can be any type of vector that finds use as a vehicle to transfer foreign genetic material into a cell. Non-limiting examples of vectors include plasmids, viral vectors (e.g., derived from lentivirus, adenovirus, adeno-associated virus (AAV), retrovirus, etc.), bacteriophage, cosmids, and artificial chromosomes. In embodiments, the vector can be an expression (or expression constructs) for driving expression of the polynucleotide in a target cell. Vectors and methods for inserting them into a target cell are known in the art [See, e.g., Sambrook et al., 1989] .
[0062] In an aspect, the disclosure provides recombinant cells that comprise the vectors and/or polynucleotides described herein. The cells can be any cell suitable as a host for recombinant nucleic acid molecules, and selected based on well known techniques. Techniques for generating and maintaining recombinant cells are known in the art, such as those described in Sambrook et al., 1 989.
[0063] The term "B cell malignancy," as used herein, refers to a malignancy derived from any stage of B cell, including, but not limited to, na'ive cells, germinal center cells, memory B cells, and plasma cells. Examples of B cell malignancies include, but are not limited to, mantle cell lymphoma, follicular lymphoma, Hodgkin's lymphoma, Burkitt lymphoma, germinal center B- cell like diffuse large B cell lymphoma (DLBCL), chronic lymphocytic leukemia, small lymphocytic lymphoma, lymphoplasmacytic lymphoma, multiple myeloma, and activated B- cell like DLBCL.
[0064] In an aspect, the disclosure provides a method of distinguishing B cell malignancies on the basis of the B-cell origin. In certain embodiments, methods of diagnosing B cell malignancies on the basis of the B-cell origin are provided. In certain such embodiments, a B cell malignancy is determined to be derived from a particular B-cell stage. The B-cell origin of a B cell malignancy may be determined, in certain embodiments, by detecting one or more microRNAs that can be used to distinguish B-cell stages. Certain exemplary B-cell stages include, but are not limited to, na'ive cells, germinal center cells, memory B cells, and plasma cells. Certain exemplary microRNAs that can be used to distinguish B-cell stages are shown in Table 4. In various embodiments, the method comprises detecting at least one, at least two, at least five, at least 10, at least 20, at least 30, at least 50, at least 75, or at least 100 microRNAs.
[0065] In certain embodiments, a panel of microRNAs is selected that will allow determination of the B cell stage from which a B cell malignancy is derived. For example, in certain embodiments, two or more microRNAs from Table 4 are selected such that detection of the levels of those microRNAs in a B cell malignancy will indicate whether the B cell malignancy is derived from na'ive, germinal center, plasma, or memory B cells. In various embodiments,
the panel of microRNAs comprises at least one, at least two, at least five, at least 10, at least 20, at least 30, at least 50, at least 75, or at least 100 microRNAs from Table 4. One skilled in the art can select a suitable panel of microRNAs, including one or more microRNAs from Table 4, according to the intended use of the panel.
[0066] As described throughout the disclosure, the methods herein can include detecting one or a plurality of miRNAs. When the term "at least" is used in association with a number (e.g., "at least 20") that term will be understood to include 20 as well as optionally any integer after 20 and up to and including the total number of microRNAs disclosed herein.
[0067] In some embodiments, a B cell malignancy derived from naive cells is mantle cell lymphoma. In other embodiments, a B cell malignancy derived from germinal center cells includes, but is not limited to, follicular lymphoma, Hodgkin's lymphoma, Burkitt lymphoma, or germinal center B-cell like diffuse large B cell lymphoma (DLBCL). In other embodiments, a B cell malignancy derived from memory B cells includes, but is not limited to, chronic lymphocytic leukemia or smal l lymphocytic lymphoma. In some embodiments, a B cell malignancy derived from plasma cells includes, but is not limited to, multiple myeloma or activated B-cell DLBCL.
[0068] Certain B cell malignancies can be difficult to distinguish using current methodologies. In extreme cases, almost any B cell malignancy can be confused with another. As illustrative examples, Burkitt lymphoma and DLBCLs are often confused. Similarly, mantle cell lymphoma and small lymphocytic lymphoma can also be confused. Burkitt lymphoma and germinal center DLBCL are both derived from germinal center cells, while activated B-cell DLBCL is derived from plasma cells. Thus, if a B cell malignancy appears to be Burkitt lymphoma or a DLBCL, in certain embodiments, microRNA analysis can be used to narrow down the B cell malignancy to either a germinal center cell-derived B cell malignancy or a plasma cell-derived B cell malignancy. If the B cell malignancy is plasma-cell derived, then it may be activated B-cell DLBCL.
[0069] Thus, in certain embodiments, when the identity of a particular B cell malignancy has been narrowed down to two or more possible B cell malignancies, and at least two of those B cell malignancies are derived from different B cell stages, microRNAs that distinguish certain B cell stages can be used to further narrow down the identity of the B cell malignancy. In certain embodiments, microRNAs that distinguish certain B cell stages can be used to identify the B cell malignancy. One or more such microRNAs can be selected, in certain embodiments, from the microRNAs in Table 4. One skilled in the art can select a suitable set of microRNAs, including at least one microRNA from Table 4, for distinguishing particular B cell stages.
[0070] In an. aspect, the disclosure provides a method of identifying a B cell malignancy comprising detecting one or a plurality of microRNAs. In certain embodiments, the method can provide a diagnosis of a B cell malignancy. In certain embodiments, one or more microRNAs that are characteristic of a particular B cell malignancy are used to identify the B cell malignancy. In certain embodiments, the identity of the B cell malignancy is first narrowed down to a list of two or more particular B cell malignancies using, for example, tumor morphology and/or immunohistochemistry and/or microRNA detection, e.g., to determine the B cell stage from which the tumor is derived. Certain exemplary microRNAs that can be used to identify B cell malignancies are shown in the Tables (e.g., Tables 7-35).
[0071 ] In certain embodiments, methods of identifying B cell malignancies comprise detecting one or more microRNAs from one or more of Tables 7 to 1 5, and Appendix B, Tables 16 to 30. That is, in certain embodiments, a panel of microRNAs is selected that wil l identify a B cell malignancy as being one of a particular selection of B cell malignancies. As a non-limiting example, a panel of microRNAs can be designed to identify a B cell malignancy as one of Burkitt lymphoma, ABC DLBCL, or GCB DLBCL. In certain such embodiments, the panel of microRNAs comprises at least one microRNA from Table 10, column "BL miRNA list" and/or Table 14, column "BL High"; at least one microRNA from Table 1 1 and/or Table 14, column "ABC High"; and at least one microRNA from Table 10, column "GCB miRNA list" and/or Table 14, column "GCB High".
[0072] When other methods indicate a particular identity for a B cell malignancy, in certain embodiments, microRNAs can be used to confirm that identification. Thus, for example, if a B cell malignancy is believed to be a Burkitt lymphoma, that identification can be confirmed by determining the expression level of one or more microRNAs listed in Table 10, column "BL miRNA list" and/or Table 14, column "BL High". Similarly, if a B cell malignancy is believed to be ABC DLBCL, that identification can be confirmed by determining the expression level of one or more microRNAs listed in Table 1 1 and/or Table 14, column "ABC High". If a B cell malignancy is believed to be GCB DLBCL, that identification can be confirmed by determining the expression level of one or more microRNAs listed in Table 10, column "GCB miRNA list" and/or Table 14, column "GCB High". If a B cell malignancy is believed to be chronic lymphocytic leukemia, that identification can be confirmed by determining the expression level of one or more microRNAs listed in Table 12 and/or Table 1 5, column "CLL High". If a B cell malignancy is believed to be Hodgkin's lymphoma, that identification can be confirmed by determining the expression level of one or more microRNAs listed in Table 1 3 and/or Table 1 5, column "HL High". If a B cell malignancy is believed to be follicular
lymphoma, that identification can be confirmed by determining the expression level of one or more microRNAs listed in Table 10, column "FL miRNA list" and/or Table 1 5, column "FL High".
[0073] In certain embodiments, when the identity of a B cell malignancy has been narrowed down to two B cell malignancies selected from Burkitt lymphoma, GCB DLBCL, ABC DLBCL, chronic lymphocytic leukemia, follicular lymphoma, and Hodgkin's lymphoma, the identity of the B cell malignancy can be determined by detecting one or more microRNAs from Tables .16 to 30.
|0074] As discussed in the Examples, the miRNAs described herein as differential ly expressed in a B cell malignancy have been identified with high confidence, and thus, identification of one miRNA is adequate to perform the methods of identification and diagnosis disclosed herein. Accordingly, in various embodiments, the methods can comprise detecting at least one, at least two, at least five, at least 10, at least 20, at least 30, or at least 50 microRNAs in order to narrow down the identity of, or identify, a B cell malignancy.
[0075] As noted above, the treatment regimens and prognoses for the various B cell malignancies can differ significantly. Thus, determining the correct identity and/or origin of a B cell malignancy can be important for selecting an effective therapy and/or setting appropriate patient expectations.
[0076J B cell malignancy samples may be obtained and prepared using methods known in the art. One skilled in the art can select an appropriate method of obtaining a B cell malignancy sample according to various parameters, such as the age, size, medical history, and/or identity of the patient. One skilled in the art can select an appropriate method of preparing a B cell malignancy sample for analysis according to the B cell malignancy sample source, size, quality, and/or intended use. For example, in certain embodiments, a B cell malignancy sample is prepared in a manner that preserves microRNAs in the sample as much as practicable under the circumstances.
[0077] MicroRNAs can be detected using any method known in the art. Exemplary methods of detecting microRNAs include, but are not limited to, hybridization-based methods and amplification-based methods. Certain exemplary detection methods include, but are not limited to, arrays (including microarrays and bead-based arrays), in situ hybridization, Northern blotting, TaqMan probes, RT-PCR, real-time PCR, and direct sequencing. One skilled in the art can select a suitable detection method according to the sample source, size, quality, and/or particular application.
[0078] In certain embodiments, real-time PCR is employed to determine the expression level of a microRNA. In some embodiments a miRNA is considered present in a subpopulation if the cycling time (CT) is less than 36 in all three biological replicates, and a CT greater than 36 is undetected.
[0079] In certain embodiments, the expression level of a microRNA in a sample is determined relative to a control sample. A control sample may be selected, in various embodiments, because it is expected to have either high or low expression of the microRNA.
[0080] In certain embodiments, the expression level of a microRNA may be normalized to the expression level of a polynucleotide that is expected to be expressed at similar levels in several different cell types and/or at constant levels in the cell type being analyzed.
[0081 ] In certain embodiments, an identified miRNA from Tables 7-35 is used to distinguish one of the six exemplified B cell malignancies from the other malignanicies. A "high" and a "low" in Tables 10 to 1 3 refer to at least a 2-fold difference in the expression of the identified miRNA when one lymphoma is compared to other lymphomas and benign lymph nodes.
[0082] In embodiments, mRNA levels can be profiled by using a microarray. In some embodiments, array elements with median signal intensities of less than 7 log2 units across samples are removed from analysis. In embodiments, a gene is considered for further analysis if it is on-average 2-fold or higher differentially expressed in a binary comparison of B cell subsets and expressed in at least one of the two B cell subsets being compared.
[0083] In an embodiment, the level of at least one miRNA is measured by reverse transcribing RNA from a test sample obtained from a subject to provide a set of target oligodeoxynucleotides, hybridizing the target oligodeoxynucleotides to one or more miRNA- specific probe oligonucleotides (e.g., a microarray that comprises miRNA-specific probe oligonucleotides) to provide a hybridization profile for the test sample, and comparing the test sample hybridization profile to a hybridization profile generated from a control sample. An alteration in the signal of at least one miRNA in the test sample relative to the control sample is indicative of the subject either having, or being at risk for developing, a B-cell malignancy. In an embodiment, the signal of at least one miRNA is upregulated, relative to the signal generated from the control sample. In another embodiment, the signal of at least one miRNA is down-regulated, relative to the signal generated from the control sample. In some embodiments, the microarray comprises miRNA-specific probe oligonucleotides for a substantial portion of all known human miRNAs. In a further embodiment, the microarray comprises miRNA-specific probe oligonucleotides for one or more miRNAs selected from the group consisting of SEQ ID NOs: 763- 1 350, or 1565 and any combination thereof.
(0084] The microarray can be prepared from gene-specific oligonucleotide probes generated from known miRNA sequences. The array may contain two different oligonucleotide probes for each miRNA, one containing the active, mature sequence and the other being specific for the precursor of the miRNA. The array may also contain controls, such as one or more mouse sequences differing from human orthologs by only a few bases, which can serve as controls for hybridization stringency conditions. tRNAs and other RNAs (e.g., rRNAs, mRNAs) from both species may also be printed on the microchip, providing an internal, relatively stable, positive control for specific hybridization. One or more appropriate controls for non-specific hybridization may also be included on the microchip. For this purpose, sequences are selected based upon the absence of any homology with any known miRNAs.
[0085] The microarray may be fabricated using techniques known in the art. For example, probe oligonucleotides of an appropriate length, e.g., 40 nucleotides, are 5'-amine modified at position C6 and printed using commercially available microarray systems. Labeled cDNA corresponding to the target RNA sequence(s) is prepared by reverse transcribing the target RNA with labeled primer. Following first strand synthesis, the RNA/DNA hybrids are denatured to degrade the RNA templates. The labeled target cDNAs thus prepared are then hybridized to the microarray chip under typical hybridizing conditions. At positions on the array where the immobilized probe DNA recognizes a complementary target cDNA in the sample, hybridization occurs. The labeled target cDNA marks the exact position on the array where binding occurs, allowing automatic detection and quantification. The output consists of a list of hybridization events,, indicating the relative abundance of specific cDNA sequences, and therefore the relative abundance of the corresponding complementary miRNAs, in the patient sample.
[0086] In an aspect, the disclosure relates to kits. Such kits can be used in methods of identifying a miRNA or mRNA described herein; an expression level or expression pattern of one or more miRNA(s) or mRNA(s) described herein; and/or identifying a B-cell malignancy. In some embodiments the kit can provide a diagnosis of a B-cell type and or a B-cell malignancy. In some embodiments the kit can differentiate one B-cell malignancy from other B-cell malignancies (e.g., ABC-DLBCL from GBC-DLBCL), and can provide information useful to a medical professional regarding a preferred course of therapeutic treatment. Suitably, a kit can comprise an isolated nucleic acid molecule or a plurality of isolated nucleic acid molecules as described herein (e.g., a sequence complementary to any of the miRNAs disclosed in the Tables). In embodiments, the isolated nucleic acid molecule can comprise a sequence of one or more RT-PCR target sequences, primers directed thereto, or a sequence
complementary thereto. The kit can also include adapter nucleic acid molecules (e.g., universal adapter molecules for attachment to expressed miRNAs/mRNAs for reverse transcription and amplification); appropriate buffer systems and reagents, detectable labels, an energy source (e.g., ATP), and other agents and components that can be used in performing analysis of miRNA expression (e.g., in RT-PCR, deep sequencing, or microarray-based methods). Kits also include instructions for use.
(0087] It will be understood that any numerical value recited herein includes all values from the lower value to the upper value. For example, if a concentration range is stated as 1 % to 50%, it is intended that values such as 2% to 40%, 10% to 30%, or 1 % to 3%, etc., are expressly enumerated in this specification. These are only examples of what is specifically intended, and all possible combinations of numerical values between the lowest value and the highest value enumerated are to be considered to be expressly stated in this application.
[0088] In an aspect, the disclosure provides a DNA library comprising one or more miRNA sequences from Tables 4-5, or 6-33. In a related aspect, the disclosure provides a method for generating such a DNA library. In an embodiment the library comprises a cDNA library that includes sequences derived from a sample of the miRNAs or, in addition or alternatively, the mRNA purified from a particular source such as, for example, a collection of cells, a particular tissue, or an entire organism. In embodiments, the source of the cDNA library is a B cell, such as a B cell in any stage (e.g., na'ive, germinal center, memory, activated, or plasma, etc.) or a B cel l malignancy (e.g., mantle cell lymphoma, follicular lymphoma, Hodgkin's lymphoma, Burkitt lymphoma, germinal center B-cell like diffuse large B cell lymphoma (DLBCL), chronic lymphocytic leukemia, small lymphocytic lymphoma, lymphoplasmacytic lymphoma, multiple myeloma, and activated B-cell like DLBCL). Typically, the isolated miRNA (or m RNA) is converted to a DNA template by reverse transcription, and comprises the cDNA version of the expressed RNA (e.g., miRNA or mRNA). Thus, a library can represent the cDNA version of the active "transcriptome" in a particular source under the physiological, developmental, or environmental conditions that existed when the miRNA/mRNA was purified.
[0089] In an embodiment, the library comprises a miRNA sequence described in Tables 4-5; 7- 33. In embodiments, the library comprises at least one of SEQ ID NOs 763- 1 350 or 1 565, and any combination thereof. In an embodiment, the library comprises a collection of miRNA sequences comprising SEQ ID NOs 763- 1 350 or 1 565. In embodiments the library can be used to identify and/or differentiate a B-cell malignancy from other B-cell malignancies. In
such embodiments, the library comprises at least one miRNA sequence selected from those listed in any of Tables 4 or 7-35.
[0090] As used herein, a "library" is a collection of DNA sequences that is stored and propagated in a population of microorganisms through standard molecular cloning processes. A DNA library can be of any type such as, for example, a cDNA library (formed from reverse- transcribed RNA) or a genomic library (formed from genomic DNA). The DNA library can be used in any routine application or technique known in the art (e.g., gene discovery; cloning of full-length cDNAs to identify/study gene function; miRNA/mRNA expression in different cells or tissues; splice variants in different cells or tissues) and, in some embodiments, can depend on the source of the original DNA fragments. In embodiments, the library can be used to isolate, characterize, and/or quantify the actively expressed miRNA is a population of cells such as, for example, B-cells or B-cell malignancies. In some embodiments, the library can be used to study miRNA-protein interactions or miRNA-based regulation of protein expression or activity.
[0091 ] Any known method of library preparation can be used to make the library described herein, including the methods described in the detailed description and non-limiting Examples. Further general techniques can be based on the methods and techniques known in the art, (see, e.g., RNA Methodologies: A Laboratory Guide for Isolation and Characterization (R.E. Farrell, Academic Press, 1998); cDNA Library Protocols (Cowell & Austin, eds., Humana Press; Functional Genomics (Hunt & Livesey, eds., 2000); and the Annual Review of Genomics and Human Genetics (E. Lander, ed., yearly publications by Annual Reviews). Suitably, the nucleotide sequences of interest in a library are preserved as inserts in a plasmid or the genome of a bacteriophage that has been used to infect bacterial cells. There are differences in the cloning vectors and techniques used in library preparation, but in general each DNA fragment is uniquely inserted into a cloning vector and the pool of recombinant DNA molecules is then transferred into a population of bacteria or yeast such that each organism contains on average one construct (vector + insert). The DNA molecules are copied and propagated along with the population of organisms in culture (thus, effectively, "cloned"). Accordingly, in some embodiments, the term "library" can refer to a population of organisms, each of which carries a DNA molecule inserted into a cloning vector, or alternatively to the collection of all of the cloned vector molecules.
[0092] An "increased level" of expression, as used herein, refers to a level of expression that is at least 2-fold greater than the level of expression in a control cell type or tissue. In various embodiments, the level of expression is at least 2.5-fold, at least 3-fold, at least 5-fold, or at
least 10-fold, greater than the level of expression in a control cel l. Exemplary control cells and tissues include, but are not limited to, normal cells, benign lymph nodes, and other B cell malignancies. In certain embodiments, benign lymph nodes are used as a control tissue. Such benign lymph node tissue contains a variety of cell types.
[0093] A "decreased level" of expression, as used herein, refers to a level of expression that is less than 50% of the level of expression in a control cell.
[0094] The term "differentially expressed" or "differential expression" relates to a difference in the observed or detected level of expression of a biomolecule such as, for example, nucleic acids (e.g., a polynucleotide, mRNA, miRNA, etc.) or amino acid sequence (e.g., protein, polypeptide, etc.) in a test sample relative to the observed or detected level of expression of the same biomolecule in a control sample or other reference (e.g., a previously established reference level). The difference in expression can be either an increase or a decrease in the expression of the biomolecule in the test sample relative to the control sample.
[0095] The Examples that follow provide further illustration of certain aspects and embodiments described in the foregoing description. These illustrative Examples should not be interpreted as limiting the scope of the appended claims.
EXAMPLES
Example 1 : Materials and Methods
Patient sample processing
[0096] B cell populations were obtained from young patients undergoing routine tonsillectomy using a protocol approved by the Clinical Center at the National Institutes of Health. Patient tonsils were disaggregated and separated by Ficoll. The mononuclear cell layer was harvested, washed in PBS, and resuspended in AC lysing buffer to remove small numbers of red blood cells. After a wash and resuspension with 10 ml of PBS with 10% Bovine Serum Albumin, cells were counted and 200 million were stained with fluorochrome-tagged monoclonal antibodies to CDI9, IgD, CD38 and CD27. The specific monoclonal antibodies employed were anti-CDI9-PE-Cy5.5, anti-lgD-FITC, anti-CD27-PE, and anti-CD38-APC, all from BD Biosciences and BD Pharmingen (San Jose California). Cells were sorted using the MoFIo Cell sorter (Dako Cytomation, Colorado Springs, CO) into naive B cel ls (CDI9+IgD+CD2TCD38+), germinal center B cells (CDI9+IgD-CD38++), memory B cells (CDI9+IgD- CD27+CD38dim) and plasma cells (CDI9dimIgD-CD27++CD38+++). Three replicates of each B cell subset were obtained from separate patients. The sample purity was verified by FACS and found to be over 90% in all cases.
|0097] Tumor specimens were obtained from patients who were examined under a protocol approved by the Duke University Medical Center Institutional Review Board. The pathologic diagnosis of the samples was verified prior to analysis. Samples from patients with diffuse large B cell lymphoma were further subclassified as described previously. See Hans et al. (2004) Blood 103 : 275-282. Chronic lymphocytic leukemia samples were processed and purified as described previously. See Volkheimer et al. (2007) Blood 109: 1559- 1 567. Total RNA was extracted using the phenol-chloroform method to preserve miRNAs, using Ambion reagents.
microRNA profiling using multiplexed real-time PCR
[0098] MiRNA expression profiling was conducted using the Applied Biosystems 384-well multiplexed real-time PCR assay using 400ng of total RNA. Eight reactions, each containing 50ng of RNA and a multiplex looped primer pool with endogenous small nucleolar (sno)-RNA controls, were used to reverse-transcribe the miRNAs in parallel fashion. Each completed reaction was loaded onto the 384-well plate per manufacturer's instructions, and real-time PCR was run on the ABI 7900HT Prism. For each 384-well plate, we used the automatically determined cycle-threshold (CT) using the SDS 2.2.1 software (Applied Biosystems). Consistent with manufacturer recommendations, we considered CT greater than 36 as undetected. A miRNA was considered to be present in a subpopulation if the CT was less than 36 in all three biological replicates. The probes deemed to be present were normalized to the average expression of a sno-RNA control. The expression values were calculated as 2"ACT, then median centered to 500 and log2-transformed.
Gene expression (mRNA) profiling using microarrays
[0099] Gene expression profiling and normalization were performed using methods identical to those we have described previously. See Dave et al. (2004) N. Engl. J. Med. 351 : 21 59- 2169. Array elements with median signal intensities of less than 7 log2 units across the samples were removed from analysis, in order to exclude poorly measured genes and genes not appreciably expressed in the samples. Genes that were on-average 2-fold or higher differentially expressed in a binary comparison of B cell subsets, and appreciably expressed in at least one of the 2 B cell subsets being compared, were selected for further analysis as described below. The data have been deposited in the publicly available Gene Expression Omnibus database (GSE 12366).
MiRNA profiling using microarray
|00100] MiRNA expression profiling from human B cell malignancies was conducted using up to 1 μg of total RNA from sample and reference (normal lymph node), which were
labeled with Cy3 or Cy5 fluorescent dyes, using the miRNA LNA labeling kit (Exiqon, Denmark). The fluorescently labeled samples were combined and hybridized to a miRNA microarray (v.10.0, Exiqon, Denmark), in a nitrogen atmosphere. The micro array slides were scanned with GenePix 4100 Scanner. The quantified signals were normalized using the global Lowess algorithm, using Genespring (Agilent) software. The intensity values for multiple spots were averaged and the normalized values were log2-transformed. Missing values were replaced with the lowest value for analysis.
MiRNA target prediction
(00101] Annotated genes on the U 133plus 2.0 array were matched to the miRNA target list downloaded from TargetScan (www.targetscan.org). For the purpose of this study, a target gene was defined by the presence of a seed sequence match (nuc l eotides 2-8) and conservation of the seed sequence and 3 'UTR in humans, dog, rat, mouse and chicken. Additional conservation was examined in miRNA target genes selected for experimental validation. The distribution of the mRNA expression for these genes was plotted as a density plot using the Splus statistical software (Insightful Corporation). The difference in distribution between the B cell subsets was calculated using a two-sample, 1 -sided Kolmogorov-Smirnov test to examine the hypothesis that being a miRNA target conferred repression in the appropriate population (consistent with the known biology of miRNA effects).
[00102] The 3'UTRs of LM02, MYBL l and PRDM 1 were aligned using Blastz alignment of Human, Chimp, Mouse, Rat, Dog, Chicken, Frog (Xenopus) and Zebrafish, and were displayed using the UCSC genome browser. The conservation of miR-223 seed sequence and the 3'UTRs of LM02 and MYBL l , as well as that of the miR-30 family and miR-9 on PRDM 1 , were thus verified.
Western blot
[00103] RIPA Lysis buffer ( l x phosphate-buffered saline [PBS], 1 % Nonidet P-40,
0.5% sodium deoxycholate, 0.1 % SDS, 10 mM phenylmethylsulfonyl fluoride, 1 μg/mL aprotinin, and 100 mM sodium orthovanadate) was added to 750,000 cells and incubated on ice for 30 minutes. The mixture was spun down and the supernatant was transferred to a new tube as the whole cell extract. A total of 20 μg of cell lysate was separated on a 4 - 18 % Tris-Bis NuPAGE gel (Invitrogen) and transferred using the iBlot transfer device (Invitrogen) program 3 for 7 minutes (LM02 detection) or program 2 for 6 minutes (PRDM 1 ). The blots were probed using 1 :200 mouse-anti-LM02 (Santa Cruz Biotechnologies SC-65736), 1 :750 mouse- anti-Blimp- 1 (Santa Cruz Biotechnologies SC-6601 5) or 1 :5000 goat-anti-B-actin (Santa Cruz Biotechnologies SC-47778) for 1 hour at room temperature. The antibodies were detected
using 1 : 10,000 goat-anti-mouse horseradish peroxidase conjugated antibodies (Santa Cruz Biotechnologies). Western Blotting Luminol Reagent (Santa Cruz Biotechnologies) was used to visualize the bands corresponding to each antibody.
Single miRNA/mRNA expression using real-time polymerase chain reaction CRT -
PCR)
[00104] With lOng of RNA per reaction, miRNAs of interest were reverse-transcribed with ABI individual stem-loop primers designed to detect only mature miRNA, and measured by Taqman real-time PCR normalized to the small nucleolar RNA, RNU48. In order to assess mRNA expression using RT-PCR, ^g of RNA was reverse-transcribed with the ABI High Capacity cDNA Reverse Transcription kit. Gene expression was measured with exon-spanning Taqman probes, and normalized to beta-2 micro globulin expression.
Cell culture
100105] BJAB and H929 were cultured in RPMI (Gibco) supplemented with 10% fetal bovine serum, and U266 was cultured in RPM I supplemented with 1 5% fetal bovine serum. 293T cells were grown in DMEM media (Gibco) with 10% FBS. All cell lines were grown in 37°C humidified cell culture incubators with C02 maintained at 5%.
MiRNA functional analysis
MicroRNA transfection
[00106] miRNAs of interest were over-expressed in cell lines of interest by transfecting the appropriate miRNA precursors (Ambion) at 100 nanomoles using Amaxa's Nucleofector system. In particular, BJAB was transfected with Nucleofector solution T, program T-016, U266 with Nucleofector C, program X-005, and H929 with Nucleofector V, program T-001. 1.5 million cells were used per transfection and mixed with appropriate miRNA precursors (Ambion) for a concentration of 100 nM.
Statistical Analysis
Identifying differentially expressed miRNA and mRNA
[00107] MiRNAs were considered to be differentially expressed if the mean signal was changed at least 2-fold and a false discovery rate (q) was less than 5% using Significance Analysis of Microarrays (SAM) with 1000 permutations. See Tusher et al. Proc Natl Acad Sci U S A. 2001 ;98:51 16-5 1 21 .
[00108] Differentially expressed genes (mRNA) in Naive versus Germinal Center,
Germinal Center versus Plasma Cells, and Germinal Center versus Memory Cells comparisons were identified using SAM. Genes that were 2-fold differentially expressed at a false discovery
rate (q) less than 1 % with 1000 permutations were identified as significantly differentially expressed.
Transcription factors and miRNA target genes
[00109] Transcription factors were identified based on the gene ontology (GO search term "transcription factor") and matched to the probes of the Affymetrix U 133plus 2.0 microarray. Of the total of 938 transcription factor genes thus identified, we selected 364 genes that were differentially expressed in at least one of the B cell stage transitions. We evaluated the breakdown of the differentially expressed transcription factors among miRNA targets versus npn targets. The p-values were computed using a chi-square test separately in each B cell stage-transition.
B cell malignancy sample classification
[00110] The top 50 most differentially expressed miRNAs (PO.01 ) in each pair-wise B cell malignancy type comparison were chosen as the initial predictor. Singular value decomposition was applied to reduce the list to 20 most informative miRNAs in each pair-wise comparison. See West et al. Proc Natl Acad Sci U S A . 2001 ; 98: 1 1462- 1 1467. A Bayesian logistic regression was performed in Matlab (Mathworks) using the 20-predictor miRNAs for each pair-wise comparison. Each sample was tested using the microRNA-based predictor in a leave-one-out fashion to determine the accuracy of each prediction. For a sample to be classified as a particular B cell malignancy (or normal) type, it had to be predicted as such in every pair-wise comparison.
Normal B cell stage classification of B cell malignancies
[00111] We constructed a Bayesian predictor to distinguish normal naive from germinal center B cells based on the 32 miRNAs depicted in Figure I D. We then applied the predictor without optimization to the microarray data generated for GCB DLCBL, Burkitt lymphoma and chronic lymphocytic leukemia to render a Bayesian prediction of lineage; i.e. naive versus germinal center B cell.
Western Blot Quantitative Analysis
[00112] Western blot scans were quantified using NIH ImageJ software. For each experiment, the ratios of protein of interest (LM02, PRDM1) to Actin were determined and mean centered to 100 across the experiment. The average and standard deviation of these values across the three experiments were calculated and displayed relative to the scrambled control expression.
Luciferase Indicator Assay Quantitative Analysis
[00113] Firefly luciferase reporter constructs were created in the pL/SV40/GL3 vector for the LM02 3'UTR and the LM02 3'UTR with the predicted miR-223 binding site mutated, as described below. Mature microRNA expression of a pL/CMV/eGFP vector coding for pri- miR-223 from the 3 'UTR of EGFP of the vector was confirmed by Taqman-real time PCR in transfected 293T cells. gl3 activity was normalized in dual luciferase assays to pL/SV40/RLuc, with which it was cotransfected. The PRDMI 3'UTR was also cloned into the pL/SV40/GL3 vector. microRNA expression vectors and their respective seed sequence • mutants were created for miR-9-2, miR-30b, and miR-30d.
LM02
[00114] The LM02 3 'UTR was PCR-amplified from BJAB cD A using primers 1 and 2 (SEQ ID NOs: 1 and 2, respectively) and ligated into the Xhol and Xbal sites of the previously described lentivirai vector pL/SV40/GL3, which expresses firefly luciferase. See Tusher et al. Proc Natl Acad Sci U S A. 2001 ; 98:51 16-5121. As a control, an LM02 3 'UTR mutant was created using mutant PCR primers 3 and 4 and then outer primers 1 and 2. The resulting fragment was also placed into the Xhol and Xbal sites of pL/SV40/GL3. In this LM02 3'UTR mutant, the seed match predicted to bind to nucleotides 2-8 of miR-223 is converted from 5'AACUGAC 3 ' to 5'AACAGUC 3 '. To create a miR-223 expression vector, a -350 nucleotide-long fragment of pri-miR-223, encompassing the pre-miRNA stem loop in its middle, was PCR-amplified from genomic BJAB DNA with primers 6 and 7 (SEQ ID NOs. 6 and 7) and ligated into the Xhol and Xbal sites of the pL/CMV/eGFP vector. This pL/CMV/eGFP vector was generated by ligating a fragment containing the CMV promoter and the EGFP ORF into the BamHI and Xhol sites of the previously described lentivirai backbone pL. See Tusher et al. Proc Natl Acad Sci U S A. 2001 ; 98:51 16-5121. The expression of miR- 223 from the 3 'UTR of EGFP in the resulting vector was confirmed by Taqman real time PCR in transfected 293T cells.
[00115] For luciferase indicator assays, 293T cells plated in 24 well plates were transfected using FUGENE6 as follows:
Table 1: Luciferase indicator assay compositions
 2.5ng pL/SV40/GL3 2.5ng pL/SV40/GL3/LMO2 2.5ng pL/SV40/GL3/LMO2 seed
2.5ng pL/SV40/RLuc UTR mut
0Αμ pL/CMV/eGFP 2.5ng pL/SV40/RLuc 2.5ng pL/SV40/RLuc
0.4μ£ pL/CMV/eGFP 0.4μg pL/CMV/eGFP
[00116] Reporter expression was evaluated by dual luciferase assays (Promega) 48 hours post-transfection. Firefly Luciferase (GL3) to internal control Renilla Luciferase (RLuc) ratios from 293T cells transfected with pL/CMV/eGFP/miR-223 were divided by those obtained from 293T transfected with the pL/CMV/eGFP vector control. The average and standard deviation were taken across five experiments for the pL/SV40/gl3 empty, LM02, and LM02 mutant vectors.
[00117] Firefly Luciferase (GL3) activity readings of the PRDM l 3 'UTR construct were divided by internal control Renilla Luciferase (RLuc) activity readings. The average and standard deviation of these ratios across three experiments were calculated and scaled relative to the empty vector (pL/CMV/eGFP) transfection.
Table 2: LM02 primer sequences

PRDMl
[00118] The PRDM l 3 'UTR was PCR-amplified from BJAB genomic DNA in two reactions using primer pairs 7 and 8 in one reaction, and 9 and 10 in another (SEQ ID NOs: 7 to 10, respectively). The two fragments were then ligated together into the Xhol and Notl sites of pL/SV40/GL3 to generate the entire PRDM l 3 'UTR. microRNA expression vectors were created as described above for mir-9-2, mir-30b, and mir-30d with the primers listed below. Again, over-expression from the 3'UTR of EGFP in the resulting vector was confirmed by Taqman real-time PCR in transfected 293T cells. For the PRDM l luciferase assays, we used the sequences listed below to PCR-mutate the seed sequence of the microRNA expression vectors rather than the PRDM l 3 'UTR, which had numerous seed sequence binding sites.
Table 3: PRDMl primer sequences
 1 550 PRD 1 3'UTR piece 1 , REV TTGCTTCTCTAGAGGAGAAAC
155 1 PRDM 1 3'UTR piece 2, FW GTTTCTCCTCTAGAGAAGCAA
1 552 PRD 1 3'UTR piece 2, REV AGAGAGCGGCCGCAGGGGAGAGACAAATTGCATTG
1 553 pri-mir-9-2, FW AGAGACTCGAGATAAAAGGAGGAATCTTAAG
1 554 pri-mir-9-2, REV AGAGAGCGGCCGCGAAAAAAACAAAACAAAAACAA
1 555 pri-mir-30b, FW AGAGAGCGGCCGCCCGATTGAGTCTTGCCTCAT
1 556 pri-mir-30b, REV AGAGAGAATTCAATGGTCTCACATTTCCAAC
1 557 pri-mir-30d, FW AGAGAGCGGCCGCATGTCACAGCTATTGTTCAG
1 558 pri-mir-30d, REV AGAGAGAATTCGCAGTAAAAGAATGCAGCTA
1 559 pri-mir-9-2 seed mutant, FW GGAAGCGAGTTGTTATCTATGCTTATCTAGCTGTATGAGT
1 560 pri-mir-9-2 seed mutant, REV ACTCATACAGCTAGATAAGCATAGATAACAACTCGCTTCC
1 561 pri-mir-30b seed mutant, FW ACCAAGTTTCAGTTCATGTTAAGATCCTACACTCAGCTGT
1 562 pri-mir-30b seed mutant, REV ACAGCTGAGTGTAGGATCTTAACATGAACTGAAACTTGGT
1563 pri-mir-30d seed mutant, FW CAGAAAGTCTGTTGTTGTTAAGATCCCCGACTGGAAGCTG
1564 pri-mir-30d seed mutant, REV CAGCTTCCAGTCGGGGATCTTAACAACAACAGACTTTCTG
[00119] Luciferase assays were carried out in a manner similar to those described for LM02.
IgVH mutation Status of Chronic Lymphocytic Leukemia Samples
[00120] IgVH mutation status was determined as described in Volkheimer et al. {Blood. 2007; 109: 1559- 1567) using genomic DNA. In brief, genomic DNA was isolated from purified CLL cells and isolated using the GenElute Mammalian DNA extraction Kit from Sigma (St. Louis, MO) according to the manufacturer's instructions. DNA was amplified using nested PCR primers. PCR products were electrophoresed, purified, and sequenced using an automated DNA sequencer (Applied Biosystems, Foster City, CA) with the BigDye Terminator kit (Perkin Elmer, Boston, MA). Forward and reverse sequences were aligned into a single resolved sequence using Sequencher 4.1 software (Gene Codes Corporation, Ann Arbor, MI), and then aligned with germline sequences derived from DNA Plot on the V BASE directory website (http://vbase.mrc-cpe.cam.ac.uk/). The percent sequence identity was calculated by dividing the number of mutations from FRl to FR3 by the total number of nucleotides in this region. Samples were considered somatically mutated if they had greater than 2% mutations in this region.
Example 2: Mature B cell Stages Display Characteristic Patterns of MicroRNA Expression
[00121] Mature B cell subsets can be defined by the expression of surface CD19, IgD, CD38, and CD27, and were obtained by fluorescence activated cell sorting of tonsils from young individuals undergoing routine tonsillectomy. See Figures I B and 1 C. Cells were previously gated on CD 19 positive cells. Naive and memory B cells were distinguished from germinal center and plasma cells based on surface CD38 and IgD expression.
[00122] To determine whether mature B cell subsets had unique patterns of microRNA (miRNA) expression, we used a 384-well multiplexed real time polymerase chain reaction (RT-PCR) assay (Applied Biosystems) that allowed measurement of all 365 miRNAs in miRBase 9.2. See Chen et al. Nucleic Acids Res. 2005; 33:e l 79; and He et al. Nature. 2007; 447: 1 130- 1 134. We detected a total of 1 13 unique miRNAs in the B cell populations. See Table 4. This detection frequency compares favorably to the identification of 71 unique miRNAs (45 miRNAs with more than one clone) through the examination of 3 101 sequences cloned from unselected CD 19-positive mature B cells. See Landgraf et al. Cell. 2007; 129: 1401 - 1414. We identified differentially expressed miRNAs in mature B cell subsets using a false discovery rate of less than 5%. See Figures I D, I F, and 1 H. The complete list of assayed miRNAs found to be expressed in the B cell populations is shown in Tables 4 and 5.
[00123] In Table 4, normalized expression values for B-cell subsets are shown, along with significance analysis of microarrays q values. Empty microRNA expression cells indicate below-threshold values, defined as RT-QPCR Ct values greater than 36 or undetected. SAM q values greater than 5 were considered non-significant and not displayed.
Table 4: MicroRNAs detected in at least one B-cell subset


hsa-miR-532 7.0 7.8
hsa-miR-545 5.5 6.3
hsa-miR-572 7.7 6.8
hsa-miR-629 6.7 7.3 7.2 9.0 1.4 hsa-miR-646 6.0 7.3
hsa-miR-650 8.8 11.4 8.0
hsa-miR-659 7.6 6.0 6.8
hsa-miR-660 9.5 8.6 10.1
hsa-miR-7 6.1 5.8
hsa-miR-9 7.8 6.8 6.2 2.8 hsa-miR-9* 6.4 6.5
hsa-miR-92 14.5 15.8 14.2 15.5 3.6 0.0 hsa-miR-93 11.5 14.6 10.5 12.3 0.0 0.0 0.0 hsa-miR-98 6.3 5.0 5.0 7.8 2.1 hsa-miR-99a 7.3
hsa-miR-99b 6.8
Table 5: miRNAs measured using the multiplex RT-PCR assay, but not consistently detected in any B-cell population
hsa-let-7e hsa-miR-383 hsa-miR-376a hsa-miR-566 hsa-miR-IOa hsa-miR-198 hsa-miR-376b hsa-miR-551b hsa-miR-IOb hsa-miR-224 hsa-miR-380-5p hsa-miR-569 hsa-miR-34a hsa-miR-299-5p hsa-miR-410 hsa-miR-570 hsa-miR-34b hsa-miR-409-5p hsa-miR-412 hsa-miR-548a hsa-m'iR-34c hsa-miR-432 hsa-miR-432 hsa-miR-586 hsa-miR-107 hsa-miR-433 hsa-miR-512-5p hsa-miR-587 hsa-miR-181c hsa-miR-485-5p hsa-miR-199a hsa-miR-548b hsa-miR-215 hsa-miR-489 hsa-miR-199b hsa-miR-588 hsa-miR-218 hsa-miR-494 hsa-miR-219 hsa-miR-589 hsa-miR-372 hsa-miR-506 hsa-miR-323 hsa-miR-550 hsa-miR-375 hsa-miR-508 hsa-miR-338 hsa-miR-591 hsa-miR-378 hsa-miR-521 hsa-miR-368 hsa-miR-593 hsa-miR-137 hsa-miR-134 hsa-miR-373 hsa-miR-596 hsa-miR-200a hsa-miR-147 hsa-miR-373 hsa-miR-597 hsa-miR-l hsa-miR-149 hsa-miR-382 hsa-miR-622 hsa-miR-183 hsa-miR-153 hsa-miR-424 hsa-miR-599 hsa-miR-302a hsa-miR-187 hsa-miR-448 hsa-miR-600 hsa-miR-302c hsa-miR-190 hsa-miR-450 hsa-miR-624 hsa-miR-302d hsa-miR-193a hsa-miR-451 hsa-miR-601 hsa-miR-367 hsa-miR-196a hsa-miR-452 hsa-miR-626 hsa-miR-369-5p hsa-miR-196b hsa-miR-452 hsa-miR-548d hsa-miR-449 hsa-miR-205 hsa-miR-453 hsa-miR-639 hsa-miR-497 hsa-miR-208 hsa-miR-485-3p hsa-miR-613
-hsa-miR-501 hsa-miR-213 hsa-miR-488 hsa-miR-614 hsa-miR-509 hsa-miR-220 hsa-miR-490 hsa-miR-615 hsa-miR-510 hsa-miR-325 hsa-miR-492 hsa-miR-616 hsa-miR-511 hsa-miR-326 hsa-miR-493 hsa-miR-548c hsa-miR-514 hsa-miR-337 hsa-miR-503 hsa-miR-617 hsa-miR-515-3p hsa-miR-340 hsa-miR-504 hsa-miR-642 hsa-miR-515-5p hsa-miR-380-3p hsa-miR-505 hsa-miR-618 hsa-miR-517a hsa-miR-422b hsa-miR-507 hsa-miR-644 hsa-miR-517b hsa-miR-422a hsa-miR-513 hsa-miR-647 hsa-miR-517c hsa-miR-429 hsa-miR-516-5p hsa-miR-649 hsa-miR-518a hsa-miR-491 hsa-miR-517 hsa-miR-661 hsa-miR-518b hsa-miR-496 hsa-miR-518c hsa-miR-662 hsa-miR-518c hsa-miR-500 hsa-miR-518f hsa-miR-449b hsa-miR-518d hsa-miR-502 hsa-miR-519b hsa-miR-653 hsa-miR-518e hsa-miR-105 hsa-miR-519c hsa-miR-411 hsa-miR-520a hsa-miR-122a hsa-miR-519d hsa-miR-654 hsa-miR-520b hsa-miR-124a hsa-miR-51ge hsa-miR-575 hsa-miR-520c hsa-miR-126 hsa-miR-522 hsa-miR-576 hsa-miR-520d hsa-miR-128b hsa-miR-523 hsa-miR-578 hsa-miR-520e hsa-miR-129 hsa-miR-524 hsa-miR-579 hsa-miR-520f hsa-miR-130a hsa-miR-526b hsa-miR-580
hsa-mi -520g hsa-miR-139 hsa-miR-96 hsa-miR-585 hsa-miR-520h hsa-miR-143 hsa-miR-651 hsa-miR-512-3p hsa-miR-95 hsa-miR-145 hsa-miR-376a hsa-miR-631 hsa-miR-126 hsa-miR-182 hsa-miR-542-5p hsa-miR-363 hsa-miR-127 hsa-miR-185 hsa-miR-544 hsa-miR-487b hsa-miR-133a hsa-miR-189 hsa-miR-656 hsa-miR-645 hsa-miR-135a hsa-miR-18b hsa-miR-549 hsa-miR-556 hsa-miR-135b hsa-miR-202 hsa-miR-657 hsa-miR-558 hsa-miR-184 hsa-miR-202 hsa-miR-658 hsa-miR-627 hsa-miR-204 hsa-miR-299-3p hsa-miR-652 hsa-miR-630 hsa-miR-206 hsa-miR-302a hsa-miR-551a hsa-miR-603 hsa-miR-211 hsa-miR-302b hsa-miR-552 hsa-miR-606 hsa-miR-216 hsa-miR-302b hsa-miR-553 hsa-miR-607 hsa-miR-217 hsa-miR-302c hsa-miR-554 hsa-miR-608 hsa-miR-330 hsa-miR-329 hsa-miR-555 sa-miR-609 hsa-miR-371 hsa-miR-33 hsa-miR-562 hsa-miR-633 hsa-miR-379 hsa-miR-362 hsa-miR-563 hsa-miR-565* hsa-miR-381 hsa-miR-369-3p hsa-miR-564 hsa-miR-594* miRNAs marked with * were not used in analyses because they have been reclassified as non-miRNAs.
[00124] The B cell subsets were profiled for gene expression at the whole genome level, as described previously. See Dave et al. N Engl J Med. 2004; 351 :2159-2169. At each stage, we identified differentially expressed genes as those genes with a mean two-fold difference in expression and a false-discovery rate of less than 1 %. See Figures I E, 1 G, and I I. Genes that we found to be differentially expressed in each stage-transition were consistent with previous studies that examined gene expression in B cell subsets using microarrays with fewer probes, an overlap that was found to be highly statistically significant (PO.001 , chi-squared test). See, e.g., Klein et al. Proc Natl Acad Sci U S A . 2003; 100:2639-2644; and Shaffer et al. Immunity. 2001 ; 1 5: 375-385.
[00125] In the naive- germinal center (GC) B cell transition, we identified 32 miRNAs that were differentially expressed. Interestingly, all but 4 miRNAs were found to be expressed more highly in GC cells than in naive B cells. See Figure I D. We confirmed the mRNA expression patterns of several genes that are known to be differentially expressed in the transition including BCL6, MME, MYBL1 , as well as LM02. See Figure IE. LM02 was found to be expressed more highly in germinal center B cells compared to both naive B cells and memory B cells. See Figures I E and I I. In the GC->plasma cell transition, we found 33 miRNAs that were differentially expressed. Once again, we noted a striking asymmetry, with all but 2 miRNAs found to be expressed highly in GC cells, but down-regulated in plasma cells. See Figure I F. We also confirmed that the plasma cell-specific genes, PRDMI (Figure 1 G), XBPI and IRF4
were highly differentially expressed in our experiments. In the GC->memory B cell transition, there was a preponderance of the 27 significant miRNAs expressed at higher levels in memory cells. See Figure 1 H. Five miRNAs were expressed highly in GC cells compared to all the other B cell types. These included 3 members of the miR- 17-92 cluster (miR-17-5p, miR-20b, miR- 93), as well as miR-28 and miR- 181 b.
[00126] The expression pattern of all the miRNAs that were measurable in at least one of the B cell subsets is summarized in Figure 5. Notably, there were no differences in the expression of genes involved in miRNA processing, including DICERl, DROSHA, XP05 (exportin5), EIF2C2 (ag02) and DGCR8, among the B cell subsets. See Figure 1 J.
[00127] Separately, we examined the expression of predicted target genes of differentially expressed microRNAs. We also found that predicted mRNA target genes of microRNAs expressed highly in GC cells were expressed at lower levels in GC cells compared to other stages. See Figure 6 and Appendix A. Figure 6A shows density plots of the expression frequency of predicted mRNA targets of microRNAs expressed highly in germinal center B cells compared to naive cells. mRNAs from Fig. I E that were also predicted targets of the miRNAs (N=830) were plotted for both naive cells and germinal center B cells. The depicted p-value was calculated using a 1 -sided Kolmogorov-Smirnov test. Figure 6B shows density plots of the expression frequency of predicted mRNA targets of miRNAs expressed highly in germinal center B cells compared to plasma cells. mRNAs from Fig. 1G that were also predicted targets of the miRNAs (N=1098) were plotted for both plasma cells and germinal center B cells. The depicted p-value was calculated using a 1 -sided Kolmogorov-Smirnov test. Figure 6C shows density plots of the expression frequency of predicted mRNA targets of miRNAs expressed highly in the germinal center B cells compared to memory B cells. mRNAs from Fig. I I that were also predicted targets of the miRNAs (N=269) were plotted for both naive cells and germinal center B cells. The depicted p-value was calculated using a 1 -sided Kolmogorov- Smirnov test.
[00128] In the naive to germinal center transition (see Figure 6A), genes with at least a two-fold change in expression were analyzed by SAM using a false discovery rate of less than 1 % (Larsson et. al, BMC Bioinformatics. 2005; 6: 129), depicted in Figure I E. From that list of significantly differentially expressed genes, we determined those that were predicted targets of miRNAs (defined as genes with 3'UTR sequence complementarity to microRNA nucleotides 2-
7) that were expressed more highly in germinal center cells. The gene expression distribution of those mRNA targets was graphed for naive B Cells (blue curve) and germinal center B cells (orange curve). Thus, in Fig. 6A, we show genes differentially expressed between naive and germinal center B cells that are also predicted targets of miRNA expressed more highly in germinal center B cells. We observe that the expression of these microRNA target genes is lower in germinal center B cells compared to naive B cells.
(00129] A similar analysis was carried out for the transitions from germinal center to plasma cell (Figure 6B) and germinal center to memory cell (Fig. 6C). In all three cases examined, the distribution of germinal center miRNA target gene expression is statistically significantly lower (leftward shift of orange curve), which suggests a possible gene regulatory role for the miRNAs that are more highly expressed in germinal center cells. We note that the observed lower expression of the miRNA target genes could, however, also be caused by other factors such as downstream effects of particular transcription factors. The complete set of genes plotted in Figure 6 is listed in Appendix A.
[00130] Finally, we found that a higher proportion of differentially expressed transcription factors are predicted microRNA targets. See Figure 7. Table 6 shows differentially expressed transcription factors, with the average level of expression for each in naive, germinal center, plasma, and memory cells. Transcription factors for which the significance analysis showed a q value of 0 are indicated.
Table 6: Differentially-expressed transcription factors


104 NRIP1 11.79 10.3 10.33 11.20 0
105 PAX3 7.01 5.55 5.01 5.96 0
106 PHF1 11.85 10.69 12.26 11.45 0 0
107 POU3F1 6.08 7.52 6.86 7.52 0
108 POU4F1 5.62 8.85 8.46 7.53 0 0
109 POU4F2 7:09 5.72 7.21 5.1 0 0
110 PPARD 11.23 9.98 10.29 10.69 0
111 PPARG 7.79 7.22 6.74 -.-. !.V 5.47 0
112 PPARGCIB 6.89 6.09 6.51 . · 7.91 0
113 PRDM1 8.49 9.15 14.1 9.33 0
1 14 PRDM4 10.48 9.81 9.76 10,83 0
1 15 PROX1 7.18 : 6.38 7.89 ; 5.54 0
1 16 RAN 13.46 14.57 12.39 13.78 0 0
117 RSF1 10.05 9.1 9.56 10.18 0
1 18 RUNX1T1 7.37 5.95 6.63 6.34 0
119 RUNX2 8.75 7.91 · 10.22 9.75 0 0
120 RUNX3 11.8 ...11.13, :■; ■-. 10.26 12.47 0
121 RXRA 9.07 7.15 8.81 8.32 0 0 0
122 SAP30 8.22 : 1 9:28 8.33 0 0
123 SCMH1 8.48 9.69 9 65 8.62 0 0
124 SCML1 10.32 8.48 7.81 7.91 0
125 SCML2 10.33 8.76 9.27 8.96 Ό
126 SF1 11.72 11.44 10.36 11.37 0
127 SIAH2 10.35 12.34 10.57 9.90 0 0 0
128 SLC2A4RG 8.25 8198 7.4 8.91 0
129 SMAD1 5:91 8 1 6.34 7.33 0 0
130 SMAD2 10.45 11.57 10.8 10.98 0
131 SMAD3 10.72 9.23 7.74 10.54 0 0 0
132 SMARCA2 11.14 10.12 10.79 11.19 0 0
133 SOLH 8.78 7.88 8.7 9.03 0
134 SOX4 8.99 9.14 9.17 10.2 0
135 SOX5 9.3 10.47 7.33 9.08 0 0 0
136 SOX9 6.72 8.42 8.18 7.03 0 0
137 SP4 11.26 10.14 9.58 11.75 0 0
138 SRCAP 8.58 8.06 6.96 8.38 0
139 SREBF1 8.23 8.36 6.56 5.89 0 0
140 STAT5B 10.35 10.95 9.73 10.7 0
141 SUFU 7.12 . 6.03 7.84 . , 7.62 0 0
142 SUPT16H 11.12 : 11.35 9.6 10.71 0
143 SUPT3H ■7.77'., " > ■ 8 05 8.35 0 0 0
144 TARDBP " 12.31 ■ - 12.72 1*1.49 11.91 0
145 TBP 10.55 10.14 9.09 10.38 0
146 TBX3 5.67 6.05 7.89 5.53 0 47 TCEAl 13.31 15 14.05 13.6 0 0 48 TCERGl 12.29 12.5 11.46 12.04 0 49 TCF7 10.21 10.82 9.97 12.61 0 50 TFAP2A 6.7 5.54 8.26 6.88 0 51 TFAP4 7.28 5.29 5.42 5.13 0
52 TFDP1 10.95 12.9 10.49 11.36 0 0 0 53 TFEB 11.56 11.15 9.49 11.77 0 54 THRA 7.41 7.26 8.48 7.05 0 55 THRB 7.45 7.51 6.11 6.29 0 0

Example 3: MiR-223 regulates LM02 in the naive ~ germinal center and germinal center ~ memory cell transitions
[00131] MiR-223 has previously been described as being important in the commitment to myeloid lineage. See Chen et al. Science. 2004; 303:83-86; Johnnidis et al. Nature. 2008; 451 : 1 125- 1 129. We found miR-223 to be expressed at nearly 8-fold higher levels in both naive and memory cells compared to GC cells. This miRNA has a highly conserved sequence complementarity to the 3 'UTR of 2 transcription factors that are expressed highly during GC cell differentiation: LM02 (Figure 2A) and MYBL1 (Figure 8A). Higher expression of miR-223 in the naive B cell stage could inhibit the untimely expression of these transcription factors until the cell is ready to undergo the germinal center reaction.
|00132] We evaluated the effects of miR-223 expression on its predicted target gene, LM02, by v
transfecting precursors of miR-223 into a cell line derived from GC cell lymphoma cells (B1AB). Over-expression of miR-223 resulted in a consistent down-regulation of LM02 at the transcript level compared to a transfection with a scrambled control with no sequence complementarity to the human genome. See Figure 2B. In that figure, the blue bars depict expression of LM02 24 hours after transfection with a scrambled control that does not possess complementarity to the human genome. The orange bars depict the expression of LM02 24 hours after transfection with a precursor for miR-223. The expression of LM02 was consistently lower in the cells treated with the miR-223 precursor, and the results were statistically significant (P<0.05 in all cases,
student's t-test). There was no effect on the expression of a non-target control, beta-2 micro globulin in these experiments (data not shown). Over-expression of miR-223 also resulted in a consistent down-regulation of LM02 at the protein level compared to a transfection with a scrambled control with no sequence complementarity to the human genome. See Figure 2C. We quantified the results of 3 separate experiments examining LM02 protein expression and found consistent down-regulation of LM02 in cells treated with miR-223 compared to cells transfected with scrambled controls. See Figure 2D. Those results that were statistically significant (P<0.05, student's t-test). The extent of down-regulation of LM02 mRNA and protein by miR- 223 was comparable, suggesting that miR-223 regulation of LM02 occurs predominantly at the mRNA level. Similarly, over-expression of miR-223 resulted in a down-regulation of MYBL 1 transcripts. See Figure 8B. In that figure, the blue bars depict expression of MYBL 1 mRNA 24 hours after transfection with a scrambled control that does not possess complementarity to the human genome. The orange bars depict the expression of Mybl l 24 hours after transfection with a precursor for miR-223. The expression of LM02 was consistently lower in the cells treated with the miR-223 precursor (P<0.05 in all cases).
[00133] As additional validation, we investigated whether the miR-223 had a direct effect on LM02 by cloning the 3'UTR sequence of LM02 3' to the firefly luciferase ORF (Flue). See Gottwein et al. Nature. 2007; 450: 1096- 1099. The resulting constructs and the unmodified vector were co-transfected into 293T cells along with a Renilla luciferase internal control and pL-CMV-eGFP constructs expressing either no miRNA or miR-223. Flue expression from constructs bearing LM02 3' UTR sequences were differentially down-regulated by miR-223 compared to those with mutated seed sequences; the seed sequence mutant construct had consistently diminished miR-223 repression compared to the wild-type construct in 5 separate experiments. See Figure 2E. Those results were statistically significant (P<0.05, student's t- test). These observations provide evidence for an inhibitory role for miR-223 in regulating the transcription factor L 02.
[00134] Activation of LM02 has been associated with the development of leukemia in patients undergoing gene therapy. Hacein-Bey-Abina et al. Science. 2003;302:415-419. On the other hand, higher expression of PRDM 1 alone is sufficient to induce plasma cell-differentiation. Turner et al. Cell. 1994;77:297-306. Inappropriate expression of such genes must be effectively turned off for a cell to maintain its state. This mode of regulation is reflected in the effects of
miR-223, miR-9 and miR-30, which turn off the inappropriate expression ofLM02 and PRDM1 and might promote state maintenance and inhibition of lymphomagenesis.
[00135] On the other hand, our data also identify a number of instances in which miRNAs are co-expressed with their predicted targets. It is possible that such interactions within the cell help to stabilize a defined expression level by dampening fluctuations. For example, in GC cells, we found that miR- 1 81b was strongly co-expressed with its predicted target, BCL6. Such interactions could also be important in B cell stage maintenance and curbing the oncogenic potential of genes involved in B cell differentiation. See Cattoretti et al. Cancer Cell. 2005;7:445-455; Dorsett et al. Immunity. 2008;28:630-638.
Example 4: MiR-9 and the miR-30 family regulate PRDM1 (blimp-1) in the germinal center -> plasma cell transition
[00136] In the GC -> plasma cell transition, we observed that several members of the miR-30 family were expressed at 2-fold or higher levels in GC cells. See Figure I F. The transcription factor PRDM1 is an essential regulator of plasma cell differentiation. Martins et al. Annu Rev Immunol. 2008; 26: 133-169. The miR-30 family comprises 5 members (miR-30a, 30b, 30c, 30d and 30e), of which 4 (all except 30e) were found to be expressed at higher levels in GC cells compared to plasma cells. Control transfection experiments documented good specificity of the RT-PCR probes for individual members of the miR-30 family with no discernible cross- hybridization. See Figure 9. Three separate transfection experiments using high concentrations of miR-30b precursors are shown in the left panel with measurement of miR-30b and miR-30d. Similar experiments were performed with precursors for miR-30d (right panel).
[00137] The 3'UTR of PRDM 1 contains 3 highly conserved binding sites complementary to. the seed sequence of members of the miR-30 family, as well as 3 binding sites for the seed sequence of miR-9, 2 of which are highly conserved across multiple species. See Figure 3A. The 3 'UTR region of PRDM1 complementary to miR-30 is shown in red. The 3 sites are complementary to nucleotides 2-8 (UTR position 408), nucleotides 1 -8 (UTR position 2370) and nucleotides 2-8 (UTR position 2383) on the miRNA, respectively. The 3'UTR region of PRDM1 complementary to miR-9 is shown in green. The 3 sites are complementary to nucleotides 1 -7 (UTR position 1459), nucleotides 2-8 (UTR position 2108) and nucleotides 2-8 (UTR position 2323) on the miRNA respectively. These sites are highly conserved across a number of species, with the exception of one miR-9 site (UTR position 1459) that is only present in humans.
[00138] To evaluate the effects of the miR-30 family and miR-9 on PRDM l expression in plasma cells, we introduced precursors of miR-9, miR-30b and miR-30d into the U266 multiple myeloma (plasma cell) cell line. Overexpression of miR-30 family members miR-30b and miR- 30d, as well as miR-9, had no effect on PRDM l at the mRNA level. See Figure 3B. In that figure, the blue bars depict expression of PRDMl 24 hours after transfection with a scrambled control with no complementarity to the human genome. The magenta bars depict the expression of PRDMl 24 hours after transfection with a hairpin precursor for miR-30b, while the red bars depict the expression of PRDMl 24 hours after transfection with a hairpin precursor for miR-30d. The green bars depict the expression of PRDMl 24 hours after transfection with a hairpin precursor for miR-9. By contrast, there was a consistent down-regulation of PRDM l at the protein level. See Figures 3C and 3D. Those results were statistically significant in each case (P<0.05, student's t-test), except for the transfections with the precursor to miR-9 (P=0.08, student's t-test). Overexpression of each of those microRNAs had an average knockdown effect of around 40%. These exclusively post-transcriptional effects of miR-9 and miR-30 on PRDMl expression are consistent with one mechanism of miRNA regulation that has been described previously in other systems. See, e.g., O'Donnell et al. Nature. 2005; 435:839-843; Gottwein et al. Nature. 2007; 450: 1096- 1099; Selbach et al. Nature. 2008;455:58-63; and Baek et al. Nature. 2008;455:64-71. There was no effect on the expression of a non-target control (Actin).
|00139] Additionally, luciferase reporter activity of the PRDM l 3'UTR construct was decreased by overexpression of miR-9, miR-30b, and miR-30d, but not their respective seed sequence mutants. See Figure 3E, which shows the average of three experiments. The down-regulation of the luciferase reporter signal and its restoration in the mutant constructs was found to be statistically significant in each of the 3 microRNAs: miR-9, miR-30b and miR-30d (PO.05, student's t-test). The luciferase reporter activity level was rescued to the activity level of the empty vector control when the seed sequence of the microRNAs was mutated.
[00140] The combined effect of 5 different microRNA species (miR-30a, miR-30b, miR-30c, miR-30d and miR -9) is likely to be more potent than that of a single microRNA. The role of mutual repression of BCL6 and PRDMl in the germinal center to plasma cell differentiation as been described previously. See Martins et al. Immunol. 2008; 26: 133-169. Our data suggest that microRNAs may bolster the effects of BCL6 in the inhibition of PRDMl.
[00141] Our data show that members of the miR-17~92 family are consistently expressed in GC cells and may play a role in mature B cell differentiation. Interestingly, the miR-17~92 family has been implicated in early B cell differentiation and mice lacking the loci that encode these miRNAs have arrested early B cell development. See Ventura et al. Cell. 2008; 132:875-886. The expression patterns of the miR- 17-92 family suggest that the regulatory motifs embedded in the interaction of this miRNA family and its targets might have an additional function in regulating mature B cell differentiation.
[00142] A striking observation in this study is the high degree of asymmetry observed in relative expression of miRNAs in GC cells compared to naive and plasma cells. At least 2 hypotheses could account for these findings. First, miRNA expression may promote a highly regulated state that enables GC cells to interact with T cells and antigen presenting cells, and to leave the GC cells poised for differentiation into memory or plasma cells. Second, miRNAs expressed highly in naive and plasma cells may be underrepresented in current miRNA libraries. Such libraries are often constructed from lymph nodes, which are typically enriched in GC cells. High throughput sequencing of sorted populations of B cells could reveal novel miRNAs that are highly expressed in those populations. Interestingly, a larger number of miRNAs were highly expressed in memory cells compared to GC cells. This observation might stem from the fact that memory cells are known to be heterogeneous (Sanz et al. Semin Immunol. 2008;20:67-82) and standard methods used to select memory cells may capture a diverse group of memory subpopulations.
Example 5: MiRNAs and B cell malignancies
[00143] To examine the expression of B cell stage-specific microRNAs in B cell malignancies, we undertook miRNA profiling of 75 tissue samples derived from normal lymph nodes (N=5) as well as patients with B cell malignancies including the molecular subsets of diffuse large B cell lymphoma (DLBCL; see Rosenwald et al. N Engl J Med. 2002; 346: 1937- 1947), germinal center B cell-like (GCB) DLBCL (N=20) and activated B cell-like (ABC) DLBCL (N=20), as well as cases of IgV mutated and unmutated chronic lymphocytic leukemia (N=20) and Burkitt lymphoma ( = 10).
[00144] We constructed a Bayesian predictor from miRNAs that distinguished normal memory B cells from GC cells. See Figure 1 H. We tested the predictor in the B cell malignancies derived from germinal center B cells (Burkitt lymphoma and GCB DLBCL) along with chronic
lymphocytic leukemia, which is thought to arise from memory B cells. See Klein et al. J Exp Med. 2001 ; 194: 1625- 1638. Using leave one out cross-validation, we found that the predictor constructed from miRNAs expressed in normal B cells was able to correctly identify the B cell specific stage of the B cell malignancy type in over 95% of the cases. See Figure 4A.
[00145] An interesting aspect regarding the role of miRNAs in malignancies is their reported down-regulation in a number of malignancies compared to normal cells from the same lineage. See Lu et al. Nature. 2005;435:834-838. To further examine this effect in B cell malignancies, we examined the expression of 1 13 miRNAs that we had identified in normal B cells. See Table 4, above. Of the 1 13 miRNAs, 103 were detected using the microarrays that we used to profile B cell malignancies and normal lymph nodes. We applied a 2-sided student's t-test to evaluate the relative expression of those 103 miRNAs in B cell malignancies (N=60) and normal lymph nodes (N=5). 34 miRNAs were differentially expressed (P<0.05) at higher levels in malignant cells and 9 miRNAs were expressed more highly in normal cells. 60 miRNAs were not differentially expressed. See Figure 4B.
[00146] As additional validation, we examined miRNA cloning frequencies for sequences cloned from normal and malignant B cells. See Landgraf et al. Cell. 2007; 129: 1401 - 1414. MiRNAs for which a sequence was identified in at least 2 of the 3 available normal B cell samples were used in the analysis. We applied a 2-sided student's t-test (P<0.05) to compare the differential cloning frequency of the miRNAs between normal B cells (N=3) and a variety of mature B cell malignancy patient samples and cell lines (N=42). In all, we found 56 miRNAs that were consistently expressed in normal B cells. We found 13 of those 56 miRNAs were differentially expressed (P<0.05) between normal and malignant B cells, of which 12 miRNAs were expressed more highly in malignant cells and 1 miRNA was expressed more highly in normal cells. See Figure 4C. In order to avoid effects from tumor-infiltrating non-malignant cells, we repeated the analysis with 20 chronic lymphocytic leukemia samples in the malignant group. The results were similar to those obtained with the larger set of malignancies (data not shown).
[00147] These results demonstrate that miRNAs are not down-regulated in B cell malignancies compared to normal B cells and that normal B cell stage-specific miRNAs are maintained in B cell malignancies.
[00148] MicroRNA profiling also revealed that each B cell malignancy type had a distinctive pattern of miRNA expression. See Figure 4D. In order to evaluate the ability of miRNA profiles to distinguish different B cell malignancy types, we constructed Bayesian predictors from the most highly differentially expressed miRNAs for each pair-wise comparison. See Tables 7, 8, and 9.
Table 7: Predictor microRNAs that distinguish germinal center B-cell (GCB) DLBCL from Burkitt Lymphoma, activated B-cell (ABC) DLBCL, and chronic lymphocytic leukemia
GCBvsBL GCBvsABC GCBvsCLL hsa-miR-146a hsa-miR-142-3p hsa-miR-126
hsa-miR-154 hsa-miR-16 hsa-miR-130a
hsa-miR-155 hsa-miR-184 hsa-miR-IOb
hsa-miR-184 hsa-miR-191 hsa-miR-154
hsa-miR-29b hsa-miR-19a hsa-miR-193b
hsa-miR-29c hsa-miR-19b hsa-miR-199a-3p
hsa-miR-363 hsa-miR-299-5p hsa-miR-365
hsa-miR-503 hsa-miR-32 hsa-miR-99b
hsa-miR-519c-5p hsa-miR-30e* hsa-miR-143
hsa-miR-301a hsa-miR-151-5p hsa-miR-585
hsa-miR-152 hsa-miR-583 hsa-miR-193a-5p
hsa-miR-30b* mghv-miR-MI-7-5p hsa-miR-886-5p
hsa-miR-590-5p hsa-miR-142-5p hsa-miR-100
hsa-miR-149* hsa-miR-106b hsa-miR-768-5p
hsa-miR-300 hsa-miR-30e hsa-miR-145
hsa-miR-625* hsa-miR-140-3p hsa-miR-943
kshv-miR-K12-3 hsa-miR-20a hsa-miR-371-5p
hsa-miR-28-5p hsa-miR-526b* hsa-miR-675
hsa-miR-25* hsa-miR-28-5p hsa-miR-150
ebv-miR-BHRFI-2 hsa-miR-30c hsa-miR-181a
BL=Burkitt lymphoma, ABC=activated B-cell DLBCL, CLL=chronic lymphocytic lymphoma
Table 8: Predictor microRNAs that distinguish activated B-cell (ABC) DLBCL from Burkitt Lymphoma and chronic lymphocytic leukemia
ABCvsBL ABCvsCLL hsa-miR-182 hsa-miR-193b
hsa-miR-377 hsa-miR-99b
hsa-miR-660 hsa-miR-551a
hsa-miR-595 mghv-miR-MI-7-3p
ebv-m'iR-BARTIO hsa-miR-585
hsa-miR-532-5p hsa-miR-617
hsa-miR-200c* hsa-miR-629*
hsa-miR-362-3p hsa-miR-575
hsa-miR-455-3p kshv-miR-K12-6-5p
hsa-miR-128 hsa-miR-193a-5p
hsa-miR-21* hsa-miR-30e
hsa-miR-589 hsa-miR-296-3p
hsa-miR-135a* hsa-miR-518b
hsa-miR-532-3p hsa-miR-492
hsa-miR-548d-5p hsa-miR-220c
hsa-miR-652 hsa-miR-326
hsa-miR-150* hsa-miR-671-5p
hsa-miR-330-5p hsa-miR-340*
hsa-miR-339-3p hsa-miR-150
hsa-miR-502-3p hsa-miR-193b*
BL=Burkitt lymphoma, CLL=chronic lymphocytic lymphoma.
Table 9: Predictor microRNAs that distinguish Burkitt lymphoma from chronic lymphocytic leukemia
BLvsCLL
hsa-miR-130b
hsa-miR-154
hsa-miR-155
hsa-miR-29b
hsa-miR-29c
hsa-miR-637
hsa-miR-658
hsa-miR-193a-5p
hsa-miR-886-5p
hsa-miR-768-5p
hsa-miR-101
hsa-miR-933
hsa-miR-371-5p
hsa-miR-675
hsa-miR-150
hsa-miR-874
hsa-miR-181a
hsa-miR-30c
ebv-miR-BHRFI-2
hsa-miR-628-3p
CLL=chronic lymphocytic lymphoma
[00149] We tested the performance of the predictor using leave-one-out cross-validation applied to the predictors for Burkitt lymphoma, chronic lymphocytic leukemia, activated B-cell diffuse large B-cell lymphoma, and germinal center B-cell DLBCL. For a sample prediction to be correct, it had to be classified correctly in each pair-wise comparison with all remaining entities. We found it to be over 90% accurate in the identification of each entity. See Figure 10.
[00150] We next expanded the analysis to include follicular lymphoma and Hodgkin's lymphoma. We included the samples from the earlier study and we undertook miRNA profiling of the following additional samples: normal lymph nodes (N=5) and patients with germinal
center B cell-like (GCB) DLBCL (N=10), activated B cell-like (ABC) DLBCL (N= 10), chronic lymphocytic leukemia (N=10), Burkitt lymphoma (N=10), follicular lymphoma (N= 10), and Hodgkin's lymphoma (N=9). As before, microRNA profiling revealed that each B cell malignancy type had a distinctive pattern of miRNA expression. See Figure 1 1 .
[00151] From that data, we identified microRNAs that can be used to distinguish each of the six B cell malignancies analyzed from the other five. Lists of those microRNAs, and whether they are expressed in high levels or low levels relative to the other 5 B cell malignancies, are shown in Tables 10 through 13. In certain embodiments, each of those microRNAs could be used to distinguish one of the six B cell malignancies from the other five. High and low in the table refer to at least a 2 fold difference when compared to other lymphomas and benign lymph nodes.
Table 10: Predictor microRNAs that distinguish Burkitt lymphoma, germinal center B-cell (GCB) DLBCL, and follicular lymphoma from all other B cell malignancies in the study
BL miRNA list BL vs GCB miRNA list GCB vs FL miRNA list FL v others others othe hsa-miR-106a hsa-miR-93/mmu-miR- hsa-miR-96/mmu-miR-
High 93/rno-miR-93 High 96/rno-miR-96 High hsa-miR-17/mmu- hsa-miR-886-3p hsa-miR-138/mmu-miR- miR-17/rno-miR-17- 138/rno-miR-138
5p/rno-miR-17 High High High hsa-miR-628-3p hsa-miR-365/mmu-miR- hsa-miR-342-5p/mmu- 365/rno-miR-365 miR-342-5p/rno-miR-342-
High High 5p High hsa-miR-193a-5p hsa-miR-378/mmu-miR- hsa-miR-337-3p
High 378/rno-miR-378 High High hsa-miR-371-5p hsa-miR-320/mmu-miR- hsa-miR-301a/mmu-miR-
High 320/rno-miR-320 High 301a/rno-miR-301a High hsa-miR-20a/mmu- hsa-miR-103/mmu-miR- hsa-miR-922
miR-20a/rno-miR-20a High 103/rno-miR-103 High High hsa-miR-23a/mmu- hsa-miR-637 hsa-miR-744/mmu-miR- miR-23a/rno-miR-23a Low High 744 High hsa-miR-27a/mmu- hsa-mi'R-148a/mmu- hsa-miR-221*
miR-27a/rno-miR-27a Low miR-148a High High hsa-miR-34b/mmu- hsa-miR-199a-3p/hsa- hsa-miR-215
miR-34b-3p miR-199b-3p/mmu-miR- 199a-3p/mmu-miR-
Low 199b/rno-miR-199a-3p High High hsa-miR-21/mmu- hsa-miR-126*/mmu- hsa-miR-197/mmu-miR- miR-21/rno-miR-21 miR-126-5p/rno-miR- 197
Low 126* High High hsa-miR-29a/mmu- kshv-miR-K12-6-3p hsa-miR-92b/mmu-miR- miR-29a/rno-miR-29a Low High 92b/rno-miR-92b High
BL miRNA list BL s GCB miRNA list GCB vs FL miRNA list FL s others others others hsa-let-7b/mmu-let- hsa-miR-125a-5p/mmu- hsa-miR-218-2*/mmu-
7b/rno-let-7b miR-125a-5p/rno-miR- miR-218-2*/rno-miR-
Low 125a-5p High 218* High hsa-let-7f/mmu-let- hsa-miR-551b/mmu- hsa-miR-636
7f/rno-let-7f Low miR-551b/rno-miR-551b Low High hsa-miR-29b/mmu- hsa-miR-923 hsa-miR-600
miR-29b/rno-miR-
29b Low Low High hsa-miR-549 Low kshv-miR-K12-7 High hsa-miR-374a hsa-miR-194/mmu-miR-
Low 194/rno-miR-194 High hsa-miR-513a-5p Low hsa-miR-524-5p High hsa-miR-148a/mmu- hsa-miR-22*/mmu-miR- miR-148a Low 22*/mo-miR-22* High hsa-miR-223/mmu- hsa-miR-34c-5p/mmu- miR-223/rno-miR-223 Low miR-34c/rno-miR-34c High hsa-miR-138- hsa-miR-151-3p
l*/mmu-miR-
138*/rno-miR-138* Low High hsa-miR-342- hsa-miR-425/mmu-miR-
3p/mmu-miR-342- 425/rno-miR-425
3p/rno-miR-342-3p Low High hsa-miR-146b- ebv-miR-BART16
5p/mmu-miR-
146b/rno-miR-146b Low High hsa-miR-195/mmu- hsa-miR-20b*
miR-195/rno-miR-195 Low High hsa-miR-103/mmu- hsa-miR-574-3p/mmu- miR-103/rno-miR-103 Low miR-574-3p High hsa-miR-888* Low hsa-miR-155* High hsa-miR-363/mmu- hsa-miR-374b*
miR-363/rno-miR-363 Low High hsa-miR-140- hsa-miR-497/mmu-miR-
3p/mmu-miR- 497/rno-miR-497
140*/rno-miR-140* Low High hsa-miR-191/mmu- hsa-miR-708/mmu-miR- miR-191/rno-miR-191 Low 708/rno-miR-708 High hsa-miR-768-5p hsa-miR-92a/mmu-miR-
Low 92a/rno-miR-92a High hsa-miR-222/mmu- hsa-miR-361-3p
miR-222/rno-miR-222 Low High hsa-miR-668/mmu- hsa-miR-513a-3p
miR-668 Low High hsa-miR-221/mmu- hsa-miR-934
miR-221/rno-miR-221 Low High
BL miRNA list BL vs GCB miRNA list GCB vs FL miRNA list FL vs others others others hsa-miR-24-l*/mmu- hsa-miR-363*/rno-miR- miR-24-l*/rno-miR- 363*
24-1* Low High hsa-miR-29c/mmu- mghv-miR-Ml-3
miR-29c/rno-miR-29c Low High hsa-miR-146a/mmu- hsa-miR-129*
miR-146a/rno-miR-
146a Low High hsa-miR-154/mmu- hsa-miR-148b/mmu-miR- miR-154/rno-miR-154 Low 148b/rno-miR-148b-3p High hsa-miR-215 Low hsa-miR-493 High hsa-miR-487b/mmu- hsa-miR-151-5p/mmu- miR-487b/rno-miR- miR-151-5p/rno-miR-151
487b Low High hsa-miR-155 Low hsa-miR-146b-3p High hsa-miR-886-5p High hsa-miR-331-3p/mmu- miR-331-3p/rno-miR-331 High hsa-miR-574-5p/mmu- miR-574-5p High hsa-miR-424 High hsa-miR-152/mmu-miR-
152/rno-miR-152 High hsa-miR-302a/mmu-miR-
302a High hsa-miR-181a/mmu-miR-
181a/rno-miR-181a High hsa-miR-509-5p High hsa-let-7d/mmu-let-
7d/rno-let-7d High hsa-miR-18b High hsa-miR-620 High hsa-miR-18a/mmu-miR-
18a/rno-miR-18a High hsa-miR-298 High hsa-miR-98/mmu-miR-
98/rno-miR-98 High hsa-miR-576-3p High hsa-miR-374b/mmu-miR-
374/rno-miR-374 High hsa-miR-32* High hsa-miR-302d* High ebv-miR-BART17-5p High hsa-miR-620 High hsa-miR-665 High
BL miRNA list BL vs GCB miRNA list GCB vs FL miRNA list
others others
hsa-miR-185/mmu-miR 185/rno-miR-185
hsa-miR-34b/mmu-miR 34b-3p
hsa-let-7e/mmu-let- 7e/rno-let-7e
Table 11 : Predictor microRNAs that distinguish activated B-cell (ABC) DLBCL from all other B cell malignancies in the study
ABC vs ABC miRNA list ABC vs ABC miRNA list ABC
ABC miRNA list others (con't) others (con't) othe hsa-miR-126/mmu-miR- hsa-miR-300 hsa-miR-
126-3p/rno-miR-126 30e*/mmu-miR- 30e*/rno-miR-
High Low 30e* Low hsa-miR-125b/mmu-miR- hsa-miR-620 hsa-miR-
125b-5p/rno-miR-125b-5p 183*/mmu-miR-
High Low 183* Low sa-miR-145/mmu-miR- hsa-miR- hsa-miR-144*
145/rno-miR-145 130b*/mmu-miR-
High 130b* Low Low hsa-miR-22/mmu-miR- hsa-miR-20b/mmu- hsa-miR-574-
22/rno-miR-22 miR-20b/rno-miR- 3p/mmu-miR-574-
High 20b-5p Low 3p Low hsa-miR-21/mmu-miR- kshv-miR-K12-3 hsa-miR-889
21/rno-miR-21 High Low Low hsa-miR-199a-3p/hsa-miR- hsa-miR-28-3p/rno- hsa-miR-525-5p
199b-3p/mmu-miR-199a- miR-28*
3p/mmu-miR-199b/rno- miR-199a-3p High Low Low hsa-miR-24/mmu-miR- hsa-miR-557 kshv-miR-K12-8
24/rno-miR-24 High Low Low hsa-miR-143/mmu-miR- hsa-miR-150/mmu- hsa-miR-32/mmu-
143/rno-miR-143 miR-150/rno-miR- miR-32/rno-miR-
High 150 Low 32 Low hsa-miR-23b/mmu-miR- hsa-miR-98/mmu- hsa-miR-938
23b/rno-miR-23b High miR-98/rno-miR-98 Low Low hsa-miR-23a/mmu-miR- hsa-miR-486- hsa-miR-198
23a/rno-miR-23a High 5p/mmu-miR-486 Low Low hsa-miR-142-3p/mmu-miR- hsa-miR-518a- hsa-miR-
142-3p/rno-miR-142-3p 5p/hsa-miR-527 186/mmu-miR-
High Low 186/rno-miR-186 Low hsa-let-7a/mmu-let-7a/rno- hsa-miR-302d* hsa-miR- let-7a 18a/mmu-miR-
High Low 18a/rno-miR-18a Low
ABC s ABC miRNA list ABC vs ABC miRNA list ABC vs
ABC miRNA list others (con't) others (con't) others hsa-miR-146b-5p/mmu- hsa-miR-516a-5p hsa-miR-516b
miR-146b/rno-miR-146b High Low Low hsa-miR-27a/mmu-miR- hsa-miR-148b/mmu- hsa-miR-625*
27a/rno-miR-27a miR-148b/rno-miR-
High 148b-3p Low Low hsa-miR-30a/mmu-miR- hsa-miR-25* hsa-miR-551b*
30a/rno-miR-30a High Low Low hsa-miR-27b/mmu-miR- hsa-miR-374b/mmu- hsa-miR-885-5p
27b/rno-miR-27b miR-374/rno-miR-
High 374 Low Low hsa-let-7c/mmu-let-7c/rno- hsa-miR-638 hsa-miR-891a
let-7c High Low Low hsa-miR-921 hsa-miR-302a/mmu- hsa-miR- miR-302a 340/mmu-miR- 340-5p/rno-miR-
Low Low 340-5p Low ebv-miR-BHRFl-2 hsa-miR-99b*/mmu- hsa-let-7d/mmu- miR-99b*/rno-miR- let-7d/rno-let-7d
Low 99b* Low Low hsa-miR-199a-5p/mmu- hsa-miR-29c*/mmu- hsa-miR-151- miR-199a-5p/rno-miR- miR-29c*/rno-miR- 5p/mmu-miR-151-
199a-5p Low 29c* Low 5p/rno-miR-151 Low hsa-miR-768-5p hsa-miR-138/mmu- hsa-miR-18b
miR-138/rno-miR-
Low 138 Low Low hsa-miR-491-3p Low hsa-miR-766 Low ebv-miR-BHRFl-1 Low hsa-miR-185/mmu-miR- hsa-miR-488 hsa-miR-510
185/rno-miR-185 Low Low Low ebv-miR-BART17-5p Low hsa-miR-498 Low hsa-miR-625 Low hsa-miR-32* hsa-miR-339- mghv-miR-M l-8
5p/mmu-miR-339-
Low 5p/rno-miR-339-5p Low Low hsa-miR-335/mmu-miR- hsa-miR-193b* ebv-miR-BART19-
335-5p/rno-miR-335 Low Low 3p Low hsa-miR-149* hsa-miR-299- hsa-miR-147
5p/mmu-miR-
Low 299*/rno-miR-299 Low Low hsa-miR-576-3p ebv-miR-BART8* hsa-miR-28- 5p/mmu-miR-
Low Low 28/rno-miR-28 Low hsa-miR-214/mmu-miR- hsa-miR-107/mmu- ebv-miR-BART13
214/rno-miR-214 miR-107/rno-miR-
Low 107 Low Low hsa-miR-184/mmu-miR- hsa-miR-519e* hsa-miR-25/mmu- 184/rno-miR-184 miR-25/rno-miR-
Low Low 25 Low
ABC vs ABC miRNA list ABC vs ABC miRNA list ABC vs
ABC miRNA list others (con't) others (con't) others hsa-miR-520d-5p Low hsa-miR-146b-3p Low hsa-miR-519d Low hsa-miR-518c* hsa-miR-552 hsa-miR-361- 5p/mmu-miR-
Low Low 361/rno-miR-361 Low hsa-miR-801/mmu-miR-801 hsa-miR-509-5p hsa-miR-331- 3p/mmu-miR-331-
Low Low 3p/rno-miR-331 Low hsa-miR-298 hsa-miR-574- hsa-miR-423- 5p/mmu-miR-574- 3p/mmu-miR-423-
Low 5p Low 3p/rno-miR-423 Low hsa-miR-634 hsa-miR-524-5p hsa-miR-93/mmu- miR-93/rno-miR-
Low Low 93 Low hsa-miR-583 Low mghv-miR-Ml-7-5p Low
hsa-miR-187* Low hsa-miR-659 Low
hsa-miR-30d/mmu-miR- hcmv-miR-UL148D
30d/rno-miR-30d Low Low
hsa-miR-129-5p/mmu-miR- hsa-miR-92a/mmu-
129-5p/rno-miR-129 miR-92a/rno-miR-
Low 92a Low
Table 12: Predictor microRNAs that distinguish chronic lymphocytic leukemia from all other B cell malignancies in the study
CLL miRNA list CLL vs CLL miRNA list CLL vs CLL miRNA list (con't) CLL vs others (con't) others others hsa-miR- hsa-miR-199a- hsa-miR-185*
30e*/rnmu-miR- 5p/mmu-miR-199a-
30e*/rno-miR-30e* 5p/rno-miR-199a-
High 5p High Low hsa-miR-32/mmu- hsa-miR-649 hsa-miR-503
miR-32/rno-miR-32 High High Low hsa-let-7g/mmu- hsa-miR-191/mmu- hsa-miR-126*/mmu-miR- let-7g miR-191/rno-miR- 126-5p/rno-miR-126*
High 191 High Low hsa-miR-186/mmu- hsa-miR-30e/mmu- hsa-miR-lOb/mmu-miR- miR-186/rno-miR- miR-30e/rno-miR- lOb/rno-miR-lOb
186 High 30e High Low hsa-miR-140- hsa-miR-107/mmu- hsa-miR-628-3p
5p/mmu-miR- miR-107/rno-miR- 140/rno-miR-140 High 107 High Low hsa-miR- hsa-mtR-93/mmu- hsa-miR-422a
196a*/mmu-miR- miR-93/rno-miR-93
196a*/rno-miR- 196a* High High Low hsa-miR- High hsa-miR-29c/mmu- High hsa-miR-193a-5p Low
CLL miRNA list CLL vs CLL miRNA list CLL vs CLL miRNA list (con't) CLL others (con't) others othc
487b/mmu-miR- miR-29c/rno-miR-
487b/rno-miR-487b 29c
hsa-miR-150/mmu- hsa-miR-541* hsa-miR-143/mmu-miR- miR-150/rno-miR- 143/rno-miR-143
150 High High Low hsa-miR-147 High hsa-miR-888* High hsa-miR-371-5p Low hsa-miR-486- hsa-miR-549 hsa-miR-100/mmu-miR-
5p/mmu-miR-486 High High 100/rno-miR-lOO Low hsa-miR-144* hsa-miR-19a/mmu- hsa-miR-365/mmu-miR- miR-19a/rno-miR- 365/rno-miR-365
High 19a High Low hsa-miR-154/mmu- hsa-miR-342- hsa-miR-145/mmu-miR- miR-154/rno-miR- 3p/mmu-miR-342- 145/rno-miR-145
154 High 3p/mo-miR-342-3p High Low hsa-miR-28- hsa-miR-142- kshv-miR-K12-6-3p
5p/mmu-miR- 5p/mmu-miR-142-
28/rno-miR-28 High 5p/rno-miR-142-5p High Low hsa-miR-299- hsa-miR-801/mmu- ebv-miR-BART6-3p
5p/mmu-miR- miR-801
299*/rno-miR-299 High High Low hsa-miR-33a/mmu- hsa-let-7i/mmu-let- hsa-miR-220c
miR-33/rno-miR-33 High 7i/rno-let-7i High Low hsa-miR-363/mmu- hsa-miR-26a/mmu- hsa-miR-519c-5p/hsa-miR- miR-363/rno-miR- miR-26a/rno-miR- 519b-5p/hsa-miR-523*/hsa-
363 26a miR-518e*/hsa-miR-
High High 522*/hsa-miR-519a* Low hsa-miR-891a hsa-miR-15a/mmu- hsa-miR-130a/mmu-miR-
High miR-15a High 130a/rno-miR-130a Low hsa-miR-768-5p hsa-miR-195/mmu- hsa-miR-424
miR-195/rno-miR-
High 195 High Low hsa-miR-361- hsa-miR- hsa-miR-483-5p
5p/mmu-miR- 106b/mmu-miR-
361/rno-miR-361 High 106b/rno-miR-106b High Low hsa-miR-519d hsa-miR-26b/mmu- hsa-miR-193b
miR-26b/rno-miR-
High 26b High Low hsa-miR-335/mmu- hsa-miR-15b/mmu- hsa-miR-637
miR-335-5p/rno- miR-15b/rno-miR- miR-335 High 15b High Low hsa-miR-668/mmu- hsa-miR-222/mmu- hsa-miR-920
miR-668 miR-222/rno-miR-
High 222 High Low hsa-let-7f/mmu-let- hsa-miR-185/mmu- hsa-miR-488
7f/rno-let-7f miR-185/rno-miR-
High 185 High Low
CLL miRNA list CLL vs CLL miRNA list CLL vs CLL miRNA list (con't) CLL vs others (con't) others others hsa-miR-24- hsa-miR-550 ebv-miR-BHRFl-2
l*/mmu-miR-24- l*/rno-miR-24-l* High High Low hsa-miR-223/mmu- hsa-let-7e/mmu- hsa-miR-526b
miR-223/rno-miR- let-7e/rno-let-7e
223 High Low Low hsa-miR-140- hsa-miR-24/mmu- hsa-miR-126/mmu-miR-126-
3p/mmu-miR- miR-24/rno-miR-24 3p/rno-miR-126
140*/rno-miR-140* High Low Low hsa-miR-144/mmu- hsa-miR-30c- hsa-miR-943
miR-144/rno-miR- 2*/mmu-miR-30c-
144 High 2*/rno-miR-30c-2* Low Low hsa-miR-638 hsa-miR-765 hsa-miR-199a-3p/hsa-miR-
199b-3p/mmu-miR-199a-
3p/mmu-miR-199b/rno-miR-
High Low 199a-3p Low hsa-miR-30d/mmu- mghv-miR-M l-4 mghv-miR-M l-3
miR-30d/rno-miR-
30d High Low Low hsa-miR-423- hsa-miR-933 hsa-miR-934
3p/mmu-miR-423-
3p/rno-miR-423 High Low Low hsa-miR-155 High hsa-miR-620 Low hsa-miR-886-5p Low hsa-miR-101/mmu- hsa-miR-30b* hsa-miR-200b*/mmu-miR- miR-lOla/rno-miR- 200b*
101a High Low Low hsa-miR-20b/mmu- hsa-miR-658 hsa-miR-485-3p/mmu-miR- miR-20b/rno-miR- 485*
20b-5p High Low Low hsa-miR-374a hsa-miR-lOa/mmu- hsa-miR-181a/mmu-miR- miR-lOa/rno-miR- 181a/rno-miR-181a
High 10a-5p Low Low hsa-miR-25/mmu- hsa-miR-665 hsa-miR-125b/mmu-miR- miR-25/rno-miR-25 High Low 125b-5p/rno-miR-125b-5p Low
Table 13: Predictor microRNAs that distinguish Hodgkin's lympoma from all other B cell malignancies in the study
HL miRNA list HL s HL miRNA list HL s HL miRNA list (con't) HL s others (con't) others others hsa-miR-338- hsa-miR-500* hsa-miR-502-3p
5p/mmu-miR-338-
5p/rno-miR-338* High High High hsa-miR-433/mmu- hsa-miR-24- hsa-miR-29c*/mmu-miR- miR-433/rno-miR- 2*/mmu-miR-24- 29c*/rno-miR-29c*
433 High 2*/rno-miR-24-2* High High
HL miRNA list HL vs HL miRNA list HL vs HL miRNA list (con't) HL i others (con't) others oth( hsa-miR-552 hsa-miR-382/mmu-■ hsa-miR-937
miR-382/rno-miR-
High 382 High High hsa-miR-202 High ebv-miR-BART8* High hsa-miR-515-5p High hsa-miR-299-3p hsa-miR-125b- hsa-miR-153/mmu-miR-
High 2*/rno-miR-125b* High 153/rno-miR-153 High hsa-miR-509-3-5p High hsa-miR-194* High hsa-miR-519e* High hsa-miR-490-5p hsa-miR-297/mmu- hsa-miR-128/mmu-miR-
High miR-297a High 128/rno-miR-128 High hsa-miR-508-5p High hsa-miR-610 High hsa-miR-516b High hsa-miR-181a-2* hsa-miR-575 hsa-miR-532-5p/mmu-miR-
High High 532-5p/rno-miR-532-5p High hsa-miR-663 High hsa-miR-21* High kshv-miR-K12-8 High hsa-miR-326/mmu- hsa-miR-936 hsa-miR-455-3p
miR-326/rno-miR-
326 High High High hsa-miR-542- kshv-miR-K12-6-5p hsa-miR-27a*/mmu-miR-
3p/mmu-miR-542- 27a*/rno-miR-27a*
3p/rno-miR-542-3p High High High hsa-miR-492 High hsa-miR-553 High hsa-miR-510 High hsa-miR-584 hsa-miR-652/mmu- hsa-miR-505/rno-miR-505
miR-652/rno-miR-
High 652 High High hsa-miR-654-5p hsa-miR-877/mmu- hsa-miR-187*
miR-877/rno-miR-
High 877 High High ebv-miR-BART20-3p hsa-miR-526a/hsa- hsa-miR-498
miR-520c-5p/hsa-
High miR-518d-5p High High hsa-miR-542- hsa-miR-122* hsa-miR-625
5p/mmu-miR-542-
5p/mo-miR-542-5p High High High ebv-miR-BART9* hsa-miR-576-5p hsa-miR-129-5p/mmu-miR-
High High 129-5p/rno-miR-129 High hsa-miR-124/mmu- mghv-miR-Ml-6 ebv-miR-BHRFl-2
miR-124/rno-miR-
124 High High High hsa-miR-551a High hsa-miR-551b* High hsa-miR-143* High hsa-miR-208a/mmu- hsa-miR-125b- kshv-miR-K12-3
miR-208a/rno-miR- l*/mmu-miR-125b-
208 3p/mo-miR-125b-
High 3p High High hsa-miR-220b hsa-miR-137/mmu- hsa-miR-660
miR-137/rno-miR-
High 137 High High
HL miRNA list HL vs HL miRNA list HL s HL miRNA list (con't) HL vs others (con't) others others hsa-miR-615- ebv-miR-BART18-3p hsa-miR-25*
3p/mmu-miR-615-3p High High High hsa-miR- hsa-miR-452 hsa-miR-29a*/mmu-miR-
135a*/mmu-miR- 29a*/rno-miR-29a*
135a* High High High hivl-miR-Hl hsa-miR-23a*/rno- hsa-miR-422a
High miR-23a* High High hsa-miR-124*/mmu- hsa-miR-617 hsa-miR-518a-5p/hsa-miR- miR-124*/rno-miR- 527
124* High High High hsa-miR-502-5p hsa-miR-550* hsa-miR-519c-5p/hsa-miR-
519b-5p/hsa-miR-
523*/hsa-miR-518e*/hsa-
High miR-522*/hsa-miR-519a* High hsa-miR-92b* High hsa-miR-557
 hsa-miR-28-3p/rno-miR-28* High hsa-miR-518a hsa-miR-331- hsa-miR-300
5p/mmu-miR-331-
High 5p High High hsa-miR-377* hsa-miR-296- hsa-miR-130a/mmu-miR- 5p/mmu-miR-296- 130a/rno-miR-130a
High 5p/rno-miR-296* High High hsa-miR-125a- mghv-miR-M l-2 hsa-miR-583
3p/mmu-miR-125a-
3p/mo-miR-125a-3p High High High hsa-miR-30c- ebv-miR-BART6-3p hsa-miR-149*
l*/mmu-miR-30c- l*/rno-miR-30c-l* High High High hsa-miR-650 hsa-miR-518b hsa-miR-184/mmu-miR- High High 184/rno-miR-184 High hsa-miR-629 hsa-miR-99b/mmu- hsa-miR-625*
miR-99b/rno-miR-
High 99b High High hsa-miR-296- hsa-miR-525-5p hsa-miR-99a/mmu-miR-
3p/mmu-miR-296- 99a/rno-miR-99a
3p/rno-miR-296 High High High hsa-miR-425 */mmu- hsa-miR-589 hsa-miR-199b-5p
miR-425* High High High hsa-miR-514 High hsa-miR-7-2* High hsa-miR-513a-5p High hsa-miR-519e hsa-miR-490- hsa-miR-494/mmu-miR-
High 3p/mmu-miR-490 High 494/rno-miR-494 High hsa-miR-938 hsa-miR- mghv-miR-M l-4
150*/mmu-miR- High 150* High High hsa-miR-340*/mmu- hsa-miR-17*/rno- hsa-miR-634
miR-340-3p/rno- miR-17-3p
miR-340-3p High High High
HL miRNA list HL vs HL miRNA list HL s HL miRNA list (con't) HL s others (con't) others others hsa-miR-657 High hsa-miR-509-3p High hsa-miR-923 High hsa-miR-9*/mmu- ebv-miR-BHRFl-1 hsa-miR-503
miR-9*/rno-miR-9* High High High ebv-miR-BART7* hsa-miR- ebv-miR-BART2-3p hsa-miR-612
hsa-miR-640

130b/mmu-miR-
High 130b/rno-miR-130b High High hsa-miR-623 mghv-miR-M l-8 hsa-miR-30c-2*/mmu-miR- High High 30c-2*/rno-miR-30c-2* High hsa-miR-99b*/mmu- hsa-miR-887 hsa-miR-658
miR-99b*/rno-miR-
99b* High High High hsa-miR-645 hsa-miR-210/mmu- hsa-miR-921
miR-210/rno-miR-
High 210 High High hsa-miR-484/mmu- hsa-miR-766 hsa-miR-423-5p/mmu-miR- miR-484/rno-miR- 423-5p
484 High High High hsa-miR-376a* hsa-miR-671- hsa-miR-933
5p/mmu-miR-671-
High 5p High High hsa-miR-345 hsa-miR-659 hsa-miR-23b/mmu-miR- High High 23b/rno-miR-23b Low hsa-miR-586 hsa-miR-330- hsa-miR-27b/mmu-miR-
5p/mmu-miR- 27b/rno-miR-27b
High 330/rno-miR-330 High Low hsa-miR-622 hsa-miR-323- hsa-miR-550
3p/mmu-miR-323-
High 3p/rno-miR-323 High Low hsa-miR-206/mmu- ebv-miR-BART13 hsa-let-7a/mmu-let-7a/rno- m'iR-206/mo-miR- let-7a
206 High High Low hcmv-miR-US25-l* ebv-miR-BART5 hsa-miR-24/mmu-miR- High High 24/rno-miR-24 Low hsa-miR-302c* hsa-miR-602 hsa-miR-451/mmu-miR- High High 451/rno-miR-451 Low hsa-miR- hcmv-miR-UL148D hsa-miR-30a/mmu-miR-
106b*/mmu-miR- 30a/rno-miR-30a
106b*/rno-miR-
106b* High High Low hsa-miR-500 hsa-miR-373* hsa-miR-20b/mmu-miR- High High 20b/rno-miR-20b-5p Low
HL miRNA list HL vs HL miRNA list HL vs HL miRNA list (con't) HL others (con't) others othi hsa-miR-890 hsa-miR-526b hsa-miR-26a/mmu-miR-
High High 26a/rno-miR-26a Low hsa-miR-10a*/mmu- hsa-miR-328/mmu- hsa-miR-26b/mmu-miR- miR-10a*/rno-miR- miR-328/rno-miR- 26b/rno-miR-26b
10a-3p High 328 High Low kshv-miR-K12-l hsa-miR-874/mmu- hsa-miR-101/mmu-miR- miR-874/rno-miR- lOla/rno-miR-lOla
High 874 High Low hsa-miR-629* ebv-miR-BART19-3p hsa-miR-106b/mmu-miR-
High High 106b/rno-miR-106b Low hsa-miR-193b* hsa-miR-595 hsa-miR-16/mmu-miR-
High High 16/rno-miR-16 Low ebv-miR-BH RFl-3 hsa-miR-889 hsa-miR-29b/mmu-miR-
High High 29b/rno-miR-29b Low hsa-miR-183/mmu- mghv-miR-M l-7-5p hsa-miR-768-3p
miR-183/rno-miR-
183 High High Low hsa-let-7b*/mmu- hsa-miR-483-5p hsa-miR-30e/mmu-miR- let-7b*/rno-let-7b* High High 30e/rno-miR-30e Low hsa-miR-409- hsa-miR- hsa-miR-106a
5p/mmu-miR-409- 487b/mmu-miR-
5p/rno-miR-409-5p High 487b/rno-miR-487b High Low hsa-miR-585 hsa-miR-675 hsa-miR-142-5p/mmu-miR-
High High 142-5p/rno-miR-142-5p Low hsa-miR-526b* hsa-miR-220c hsa-miR-144/mmu-miR-
High High 144/rno-miR-144 Low hsa-tniR-337-3p mghv-miR-M l-7-3p hsa-miR-17/mmu-miR- 17/rno-miR-17-5p/rno-miR-
High High 17 Low hsa-miR-212/mmu- hsa-miR-485- hsa-miR-15b/mmu-miR- miR-212/rno-miR- 3p/mmu-miR-485* 15b/rno-miR-15b
212 High High Low hsa-miR-548b-3p hsa-miR-198 hsa-miR-30c/mmu-miR-
High High 30c/rno-miR-30c Low hcmv-miR-UL112 hsa-miR-483-3p hsa-miR-142-3p/mmu-miR-
High High 142-3p/rno-miR-142-3p Low hsa-m'iR-601 hcmv-miR-UL70-3p hsa-miR-20a/mmu-miR-
High High 20a/rno-miR-20a Low hsa-let-7d*/mmu- hsa-miR-149/mmu- hsa-miR-30b/mmu-miR- let-7d*/rno-let-7d* High miR-149 High 30b/rno-miR-30b-5p Low hsa-miR-181b/mmu- hsa-miR-516a-5p hsa-miR-19a/mmu-miR- miR-181b/rno-miR- 19a/rno-miR-19a
181b High High Low hsa-m'iR-195* hsa-miR- hsa-miR-19b/mmu-miR- 145*/mmu-miR- 19b/rno-miR-19b
High 145* High Low
HL miRNA list HL vs HL miRNA list HL vs HL miRNA list (con't) HL vs others (con't) others others kshv-miR-K12-5 High hsa-miR-656 High
[00152] From the data in Tables 10 through 13, we identified subsets of microRNAs that are sufficient to distinguish each of the six B cell malignancies from the other five. We selected only microRNAs that are expressed more highly in the selected B cell malignancy. Those microRNAs are listed in Tables 14 and 15. In certain embodiments, each of the microRNAs listed in Tables 14 and 15 can be used to distinguish one B cell malignancy from the other five.
Table 14: Predictor microRNAs that distinguish activated B-cell (ABC) DLBCL, germinal center B-cell like (GCB) DLBCL, and Burkitt lymphoma
ABC High GCB High BL High hsa-miR-22/mmu-miR-22/rno-miR- hsa-miR-93/mmu-miR-93/rno-miR-93 hsa-miR-628-
22 3p hsa-miR-21/mmu-miR-21/rno-miR- hsa-miR-103/mmu-miR-103/rno-miR-103
21
hsa-miR-24/mmu-miR-24/rno-miR- hsa-miR-320/mmu-miR-320/rno-miR-320
24
hsa-miR-23b/mmu-miR-23b/rno- hsa-miR-125a-5p/mmu-miR-125a-5p/rno-miR- miR-23b 125a-5p
hsa-miR-23a/mmu-miR-23a/rno- m'iR-23a
hsa-let-7a/mmu-let-7a/rno-let-7a
hsa-!et-7c/mmu-let-7c/rno-let-7c
Table 15: Predictor microRNAs that distinguish chromic lymphocytic leukemia, follicular lymphoma, and Hodgkin's lymphoma
CLL High FL High HL High hsa-miR-32/mmu-miR-32/rno- hsa-miR-152/mmu-miR- hsa-miR-498
miR-32 152/rno-miR-152
hsa-miR-150/mmu-miR-150/rno- hsa-miR-885-5p hsa-miR-525-5p
miR-150
hsa-miR-140-5p/mmu-miR- hsvl-miR-Hl hsa-miR-551b*
140/rno-miR-140
hsa-let-7g/mmu-let-7g hsa-mSR-548d-5p hsa-miR-340*/mmu-miR-340-
3p/rno-miR-340-3p
hsa-miR-154/mmu-miR-154/rno- hsa-miR-488 hsa-miR-494/mmu-miR-494/rno- miR-154 miR-494
hsa-miR-486-5p/mmu-miR-486 ebv-miR-BART16 hsa-miR-183*/mmu-miR-183* hsa-miR-101/mmu-miR- hsa-miR-22*/mmu-miR- hsa-miR-659
lOla/rno-miR-lOla 22*/rno-miR-22*
hsa-miR-30e/mmu-miR-30e/rno- hsa-miR-513a-3p hsa-miR-193b*
miR-30e
CLL High FL High HL High hsa-miR-768-5p hsa-miR-708/mmu-miR- hsa-miR-766
708/rno-miR-708
hsa-miR-363/mmu-miR-363/rno- hsa-miR-425/mmu-miR- hsa-miR-516a-5p
miR-363 425/rno-miR-425
hsa-miR-668/mmu-miR-668 hsa-miR-337-3p hsa-miR-125b-l*/mmu-miR- 125b-3p/rno-miR-125b-3p hsa-miR-147 ebv-miR-BART17-5p ebv-miR-BART6-3p
hsa-miR-196a*/mmu-miR- hsa-miR-221* ebv-miR-BART8*
196a*/rno-miR-196a*
hsa-miR-142-5p/mmu-miR-142- hsa-miR-92b/mmu-miR- hsa-miR-509-3-5p
5p/rno-miR-142-5p 92b/rno-miR-92b
hsa-miR-199a-5p/mmu-miR- hsa-miR-197/mmu-miR-197 hsa-miR-602
199a-5p/rno-miR-199a-5p
hsa-miR-24-l*/mmu-miR-24- hsa-miR-32* ebv-miR-BHRFl-1
l*/rno-miR-24-l*
hsa-miR-891a hsa-miR-342-5p/mmu-miR- mghv-miR-M l-2
342-5p/rno-miR-342-5p
hsa-miR-550 hsa-miR-524-5p hsa-miR-145*/mmu-miR-145* hsa-miR-801/mmu-miR-801 hsa-miR-34c-5p/mmu-miR- hsa-miR-296-5p/mmu-miR-296-
34c/rno-miR-34c 5p/rno-miR-296*
hsa-miR-549 hsa-let-7e/mmu-let-7e/rno-let- hsa-miR-17*/rno-miR-17-3p
7e
hsa-miR-888* hsa-miR-151-3p hsa-miR-452
hsa-miR-744/mmu-miR-744 hsa-miR-326/mmu-miR-326/rno- miR-326
hsa-mi'R-574-3p/mmu-mi'R- hsa-miR-652/mmu-miR-652/rno-
574-3p miR-652
hsa-miR-600 hsa-miR-623
hsa-miR-20b* hsa-miR-194*
hsa-miR-194/mmu-miR- hsa-miR-125a-3p/mmu-miR-
194/rno-miR-194 125a-3p/rno-miR-125a-3p hsa-miR-363*/rno-miR-363* hsa-miR-10a*/mmu-miR-
10a*/rno-miR-10a-3p hsa-miR-155* hsa-miR-519e
hsa-miR-34b/mmu-miR-34b-3p hsa-miR-502-5p
hsa-miR-922 hsa-miR-124*/mmu-miR-
124*/rno-miR-124*
hsa-miR-497/mmu-miR- hsa-miR-345
497/rno-miR-497
hsa-miR-493 hsa-miR-584
hsa-miR-138/mmu-miR- hsa-miR-650
138/rno-miR-138
hsa-miR-215 hsa-miR-202
hsa-miR-302a/mmu-miR-302a hsa-miR-548b-3p
hsa-miR-96/mmu-miR-96/rno- hsa-miR-492
miR-96
CLL High FL High HL High
hsa-miR-218-2*/mmu-miR hsa-miR-135a*/mmu-miR-135a*
218-2*/rno-miR-218*
kshv-miR- 12-7 ebv-miR-BART20-3p
hsa-miR-301a/mmu-miR- hsa-miR-586
301a/rno-miR-301a
hsa-miR-338-5p/mmu-miR-338-
5p/rno-miR-338*
hsa-miR-92b*
hivl-miR-Hl
hsa-miR-508-5p
hsa-miR-542-5p/mmu-miR-542- 5p/mo-miR-542-5p
hsa-miR-490-5p
hsa-miR-663
hsa-miR-433/mmu-miR-433/rno- miR-433
[00153] Finally, we identified sets of microRNAs that can distinguish between each pair of B cell malignancies in the study. Lists of those microRNAs are shown in Appendix B, Tables 16 to 30. In certain embodiments, each of the listed microRNAs is sufficient to distinguish between the two B cell malignancies listed in the table description.
[00154] The consistent expression of a number of miRNAs in a diverse set of B cell malignances suggests a role for miRNAs in the maintenance of tumor phenotype. Assays for stage-specific B cell markers such as BCL6, a marker for GC cells, are essential in the clinical diagnosis of B cell malignancies. Our data suggest that stage-specific biology in B cell malignancies is retained at the miRNA level. Recent work has demonstrated the utility of gene expression profiling in reliably distinguishing closely related B cell malignancies. See Hummel et al. N Engl J Med. 2006;354:2419-2430; Dave et al. N Engl J Med. 2006;354:243 1 -2442. However, clinical translation of gene expression profiling has proved to be difficult because of the need for freshly frozen tissue. Since intact miRNAs can be isolated from tissues preserved using standard methods {see, e.g., Doleshal et al. J Mol Diagn. 2008; 10:203-21 1 ; Xi et al. Rna. 2007; 13: 1668- 1674), diagnostic methods based upon miRNA profiles could be fairly easy to translate to clinical use.
[00155] Interestingly, in contrast to a previous study (Lu et al. Nature 2005;435:834-838), we did not note a decrease in the expression of the total number or overall expression levels of miRNAs in B cell malignancies compared to normal lymph nodes. Although B cell
malignancies maintain the expression of a number of stage-specific miRNAs, their miRNA expression patterns are clearly deranged compared to normal lymph nodes. The consequences of altered miRNA expression in B cell tumors would be important to explore in future studies.
[00156] In conclusion, our study demonstrates that mature B cell subsets have distinct patterns of microRNA expression, suggesting a role for miRNAs in B cell differentiation. We provide experimental evidence that transcription factors such as LM02 and PRDMI are direct targets of differentially expressed miRNAs. B cell malignancies demonstrate a distinct pattern of miRNA expression that could be useful in distinguishing morphologically identical subtypes of these tumors. The conserved expression of stage-specific microRNAs in normal and malignant B cells suggests a role for microRNAs in the maintenance of the mature B cell phenotype.
Example 6: Differential expression of miRNAs in ABC DLBCL vs. GBC DLBCL malignancies
[00157] As discussed above, microRNAs have shown promise as biomarkers in a number of malignancies. Diffuse large B cell lymphoma (DLBCL)is the most common form of lymphoma and is known to comprise at least 2 molecularly distinct subgroups with different responses to standard therapy. These two distinct subgroups are typically identified as ABC DLBCL and GC (or GCB) DLBCL.
[00158] However, the current methods used to distinguish GCB from non GCB DLBCL are limited fashion and can yield inconsistent results. While gene expression profiling remains the gold standard for distinguishing these 2 molecular subgroups it is not routinely performed in clinical laboratories. In an effort to expand and improve the existing analytical options we sought to develop microRNA-based assays. We created RNA libraries from 31 different samples and performed deep sequencing analysis to identify the present miRNAs.
Small RNA library creation and deep sequencing
[00159] Total RNA was extracted from the 31 samples using the phenol-chloroform method to preserve microRNAs, using Ambion reagents. Total RNA (typically 5μg) from each sample was run on denaturing polyacrylamide-urea gels. The ~ 17-25 nucleotide RNAs were excised from the gel, ligated to sequencing adaptors on both ends and reverse transcribed. The resulting cDNA library was PCR-amplified for 15 cycles and gel purified on 6% acrylamide gel. The gel-purified
amplicon quality and quantity were analyzed on a 6% acrylamide gel relative to oligonucleotides of known concentration and size. 120 μΐ of 1 -4 pM library were loaded on to the lllumina cluster station, where DNA molecules were attached to high-density universal adaptors in the flow cells and amplified. The DNA clusters generated via this process were sequenced with sequencing-by- synthesis technology, where successive high-resolution images of the four-color fluorescence excitation dependent on the base incorporated during each cycle were captured. Sequencing reads were generated for each of the 31 samples and base calls were rendered using lllumina software. All the primary sequencing data and gene expression data is publicly available through the GEO archive through accession GSE22898.
[00160] The small RNA libraries from the 31 samples which were subjected to massively parallel, high-throughput sequencing using the lllumina platform generated a total of 328 million separate reads. Our approach to analyzing the sequences and discovering microRNAs broadly follows a previously described method (see, Zheng, Q., et al. GOEAST: a web-based software toolkit for Gene Ontology enrichment analysis, Nucleic acids Res. 2008;36 (Web Server issue: W358-363). All bioinformatics analyses were performed using a cluster of 1024 Linux computer nodes. Preprocessing was carried out using locally written Shell and Perl scripts.
[00161] From the raw sequences generated by high-throughput sequencing, the 3'- and 5'- adaptor sequences were trimmed. Low quality sequences were identified as those sequencing reads that contained stretches of consecutive identical bases or uncalled nucleotides (N) in the first 12 bases and sequencing reads shorter than 17 nucleotides. To minimize redundancy, reads were initially curtailed to the first 22 nucleotides and identical sequences were represented with a single fasta entry for analysis. Each unique sequence was mapped to the reference genome (Ensembl, build 50) and reads were filtered such that only perfect alignments (full length, 100% identity) were retained. Reads that aligned to more than five positions in the genome and reads that overlapped with the UCSC RNA genes were identified and excluded from microRNA analysis.
Identification and analysis of the captured miRNA sequences
[00162] Sequences that occurred 20 or more times in at least one sample were consolidated and annotated for the 3 1 samples. Genomic loci that overlapped with microRNAs described in
miRBase (version 13) were identified as known microRNAs (see Table 31). The remaining genomic loci were identified as encoding candidate novel microRNAs (see Table 32).
[00163] The vast majority (96%) of the candidate novel microRNAs were found in more than one sample, with only a small minority of microRNAs were expressed exclusively in a specific B cell subset or malignancy. Many of the microRNAs that we identified in normal and malignant B cells were expressed at ten-fold or higher levels in these non B cell cases. These findings suggest that the microRNAs we have identified are broadly expressed and may have roles in a number of diverse tissue types. miRNA profiling using real-time PCR
[00164] miRNA expression profiling was conducted using the Applied Biosystems 384-well multiplexed real-time PCR assay using 400ng of total RNA. Eight reactions, each containing 50ng of RNA and a multiplex looped primer pool with endogenous small nucleolar (sno)-RNA controls, were used to reverse-transcribe the miRNAs in parallel fashion (see Tables 33 and 34 for primers). The completed reactions were loaded onto the 384-well plate per manufacturer's instructions, and real-time PCR was run on the ABI 7900HT Prism instrument. For each 384- well plate, we used the automatically determined cycle-threshold (Cj) using the SDS 2.2.1 software (Applied Biosystems). Consistent with manufacturer recommendations, a CT greater than 35 was treated as undetected. The probes deemed to be present were normalized to the average expression of a sno-RNA control. The expression values were calculated as 2"ACT, then median centered to 500 and log2-transformed.
[00165] For further validation of the deep sequencing results, we selected candidate novel microRNAs (see Table 34) that were detectably measured in at the sequencing data from least one of four diffuse large B cell lymphoma (DLBCL) cases. Using stem-loop reverse transcription (Ashburner, M., et al., Nat Genet. (2000); 25( l ):25-29) for quantitative PCR, we tested the expression of the candidate microRNAs in 101 primary tumors from patients with DLBCL and found that about 92% were detectably measured by real-time PCR in at least 10% of these cases, suggesting that real-time PCR reproducibly identifies microRNAs that are expressed in lymphomas. We also used real-time PCR to measure the expression of known microRNAs (see Table 33) in the same 101 samples and found that over 90% of these were also detected in at
least 10% of the cases using real-time PCR. We found that six of the seven RT-PCR constructs that targeted RNA hairpins that had low probability of being a microRNA resulted in no detectable signal. These results suggest that our assays have high specificity for microRNAs and that the computational predictions based on our sequencing data correctly identified microRNAs.
Differentiating ABC DLBCL vs. GCB DLBCL malignancies
[00166] Gene expression profiling of patients with DLBCL has demonstrated that the tumors comprise at least two distinct diseases with different response rates to standard chemotherapy regimens (Chen, C, et al., Nucleic Acids Res. (2005);33(20):e l 79). We hypothesized that microRNAs might be used to make this clinically important distinction for which gene expression profiling remains the gold standard. We performed gene expression profiling on 101 DLBCL cases and further subdivided these cases into the molecular subgroups.
[00167] Tumor samples from 101 patients with diffuse large B cell lymphoma were obtained at the time of diagnosis and freshly frozen. These cases were profiled using Affymetrix Gene 1 .0 ST arrays. The molecular subgroups were distinguished using a Bayesian approach described previously (Ambros, V., et al., RNA (2003);9(3):277-279).
[00168] We found that 25 microRNAs with the highest t-statistic were equally efficacious as the gene expression profiling in differentiating the two groups of DLBCL with over 95% overlap between the classifications rendered by the two methods, using leave out one cross-validation (see Table 35). Interestingly, a subset of these 25 predictor microRNAs was candidate novel microRNAs, suggesting a biological and clinical relevance for these candidate novel microRNAs in DLBCL tumors.
[00169] Our work provides an exhaustive identification of the microRNAs in normal and malignant B cells; that is a prerequisite to the delineation of their role. Further, we have developed a comprehensive framework that spans the identification of microRNAs from deep sequencing data to measuring their expression using real-time PCR and validating their expression in primary human tumors.
[00170] It is also conceivable that some of the low-abundance microRNAs that we have identified in our study may be expressed at higher levels in other development stages or in other
cell types. This notion is confirmed by our examination of the novel microRNAs in non B cell data. For instance, a number of the microRNAs that we discovered were also present at 10-fold or higher levels in cell lines derived from breast cancer and cervical cancer, suggesting that the microRNAs that we have discovered in B cells have broad biological significance.
Deep sequencing reveals a novel miRNA cluster that regulates the TGF-β pathway
[00171] Although microRNAs appear to be distributed throughout the genome, a number of microRNAs have been found in clusters such as miR-17-92 that are transcribed from a single primary transcript and cleaved into the individual microRNAs by the enzyme DROSHA. We found 2 separate clusters of candidate novel microRNAs on chromosome 9 and chromosome 14 (within the IgH locus), respectively. The first cluster was previously annotated as a hypothetical gene LOC100130622, and subsequently discarded from Refseq when no associated protein was identified. Our data' demonstrate that this cluster (miR-2355), conserved only in primates, encodes 6 separate microRNAs: has-miR-2355a-l , has-miR-2356- 1 , has-miR-2355a-2, has-miR- 2356-2, hsa-miR2355a-3, and hsa-miR-2355b (see Table 32 for sequence).
[00172] In order to evaluate whether the microRNAs encoded in these clusters originate from the same primary transcript, we took MS 12 multiple myeloma cells which express these microRNAs and used siRNA to knock-down the expression of the microRNA processing enzyme Drosha. This enzyme acts at the first step of microRNA processing by cleaving microRNA precursors from the primary transcript. We found that decreased Drosha expression was associated with increased accumulation of primary transcripts of both the miR- 17-92 cluster as well as the novel miR-2355 cluster. MicroRNAs from miR-2355 cluster were found to be expressed more highly in normal germinal center (GC) B cells compared to memory cells.
[00173] The microRNAs of this cluster all share the same seed sequence, suggesting that they target the same genes. Among the computationally predicted targets of this microRNA cluster, we identified SMAD2 and SMAD3 which are well known mediators of the TGF-beta signaling pathway. We noted that gene expression of both SMAD2 and SMAD3 in our set of 101 DLBCLs were inversely correlated with this cluster (P<0.001 , correlation test). Gene set enrichment analysis revealed that expression of the TGF-beta pathway in DLBCL samples varied inversely with the expression of the microRNA cluster, with a higher expression of the microRNA
associated with a lower expression of the pathway (P<10'6), which has been noted as a factor in the biology of these tumors.
Table 31: miRNAs identifled by deep sequencing analysis.
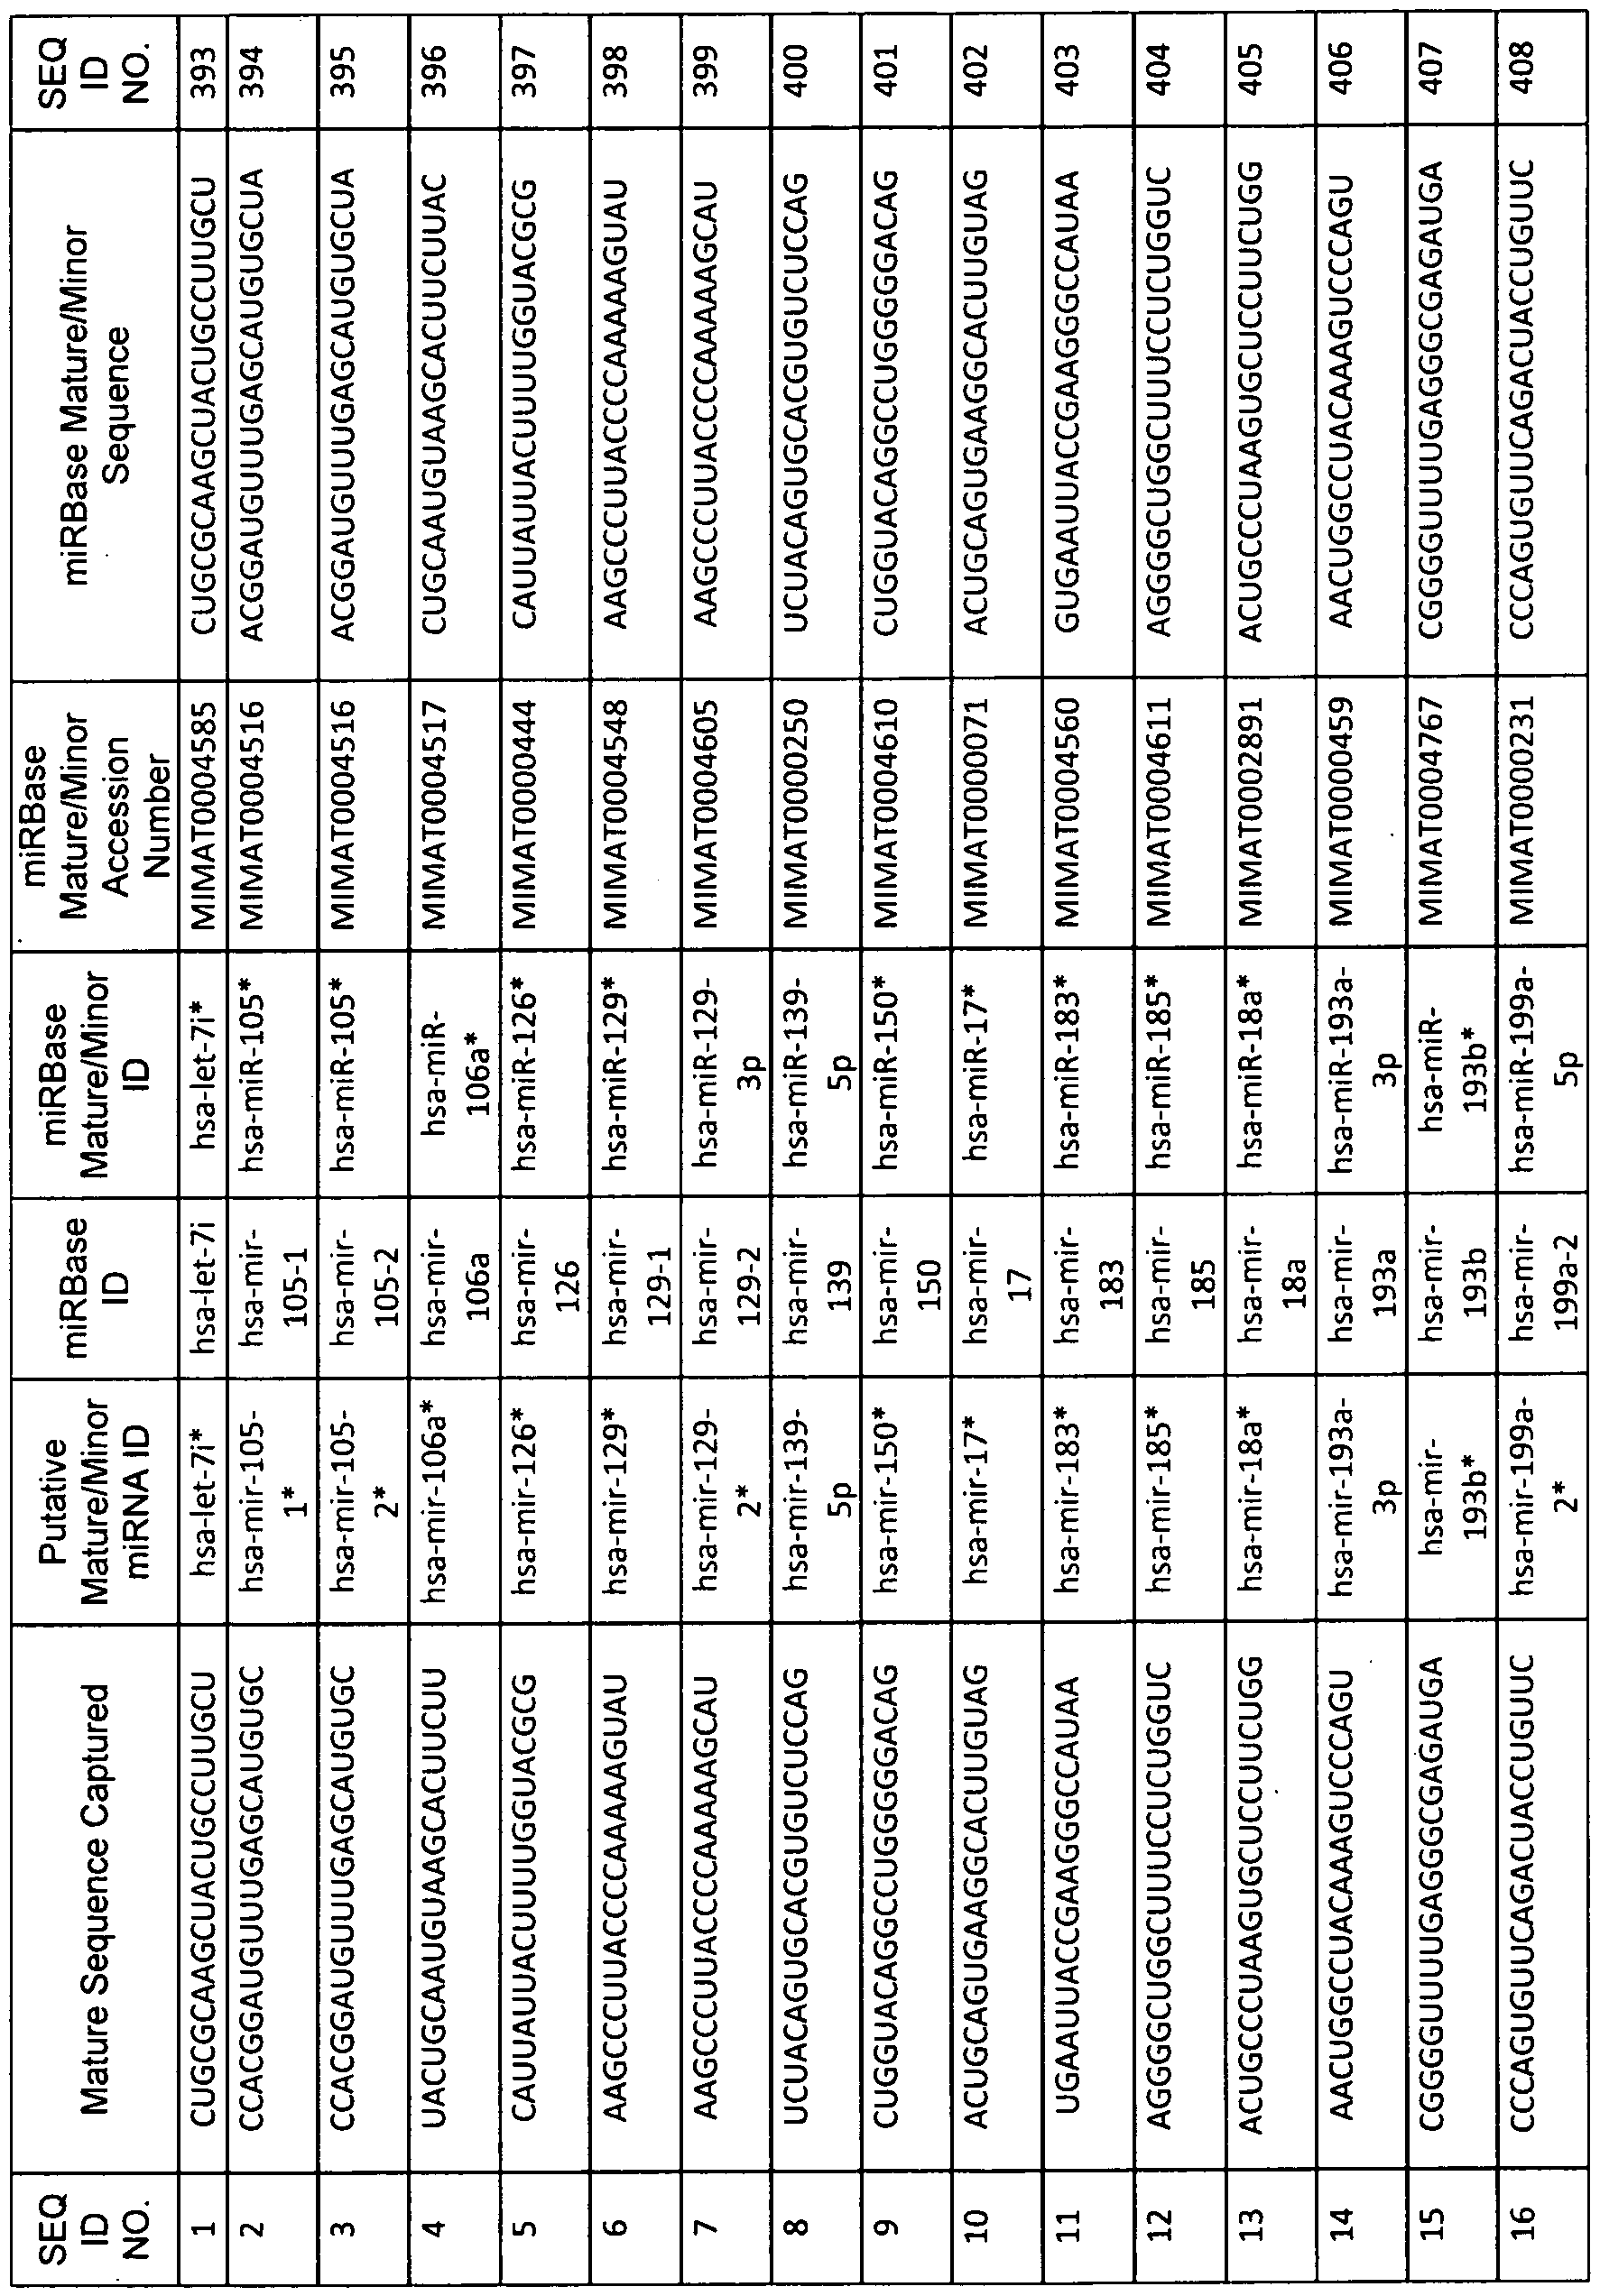


miRBase
SEQ Putative miRBase SEQ miRBase Mature/Minor miRBase Mature/Minor
ID Mature Sequence Captured Mature/Minor Mature/Minor ID
ID Accession Sequence
NO. miRNA ID ID NO.
Number
336 UCCGGUUCUCAG6GCUCCACC hsa-mir-671- hsa-mir- hsa-miR-671- MIMAT0004819 UCCGGUUCUCAGGGCUCCACC 728
3p 671 3p
337 AAGGAGCUUACAAUCUAGCUGGG hsa-mir-708 hsa-mir- hsa-miR-708 MIMAT0004926 AAGGAGCU UACAAUCUAGCUGGG 729
708
338 UGGAAGACUAGUGAUUUUGUUGU hsa-mir-7-1 hsa-mir- hsa-miR-7 IMAT0000252 UGGAAGACUAGUGAUUUUGUUGU 730
7-1
339 UGGAAGACUAGUGAUUUUGUUGU hsa-mir-7-2 hsa-mir- hsa-miR-7 MIMAT0000252 UGGAAGACUAGUGAUUUUGUUGU 731
7-2
340 UGGAAGACUAGUGAUUUUGUUGU hsa-mir-7-3 hsa-mir- hsa-miR-7 MIMAT0000252 UGGAAGACUAGUGAUUUUGUUGU 732
7-3
341 CGGCUCUGGGUCUGUGGGGA hsa-mir-760 hsa-mir- hsa-miR-760 MIMAT0004957 CGGCUCUGGGUCUGUGGGGA 733
760
342 UGCACCAUGGUUGUCUGAGCAUG hsa-mir-767- hsa-mir- hsa-miR-767- MIMAT0003882 UGCACCAUGGUUGUCUGAGCAUG 734
5p 767 5p
343 UGAGACCUCUGGGUUCUGAGCU hsa-mir-769- hsa-mir- hsa-miR-769- MI AT0003886 UGAGACCUCUGGGUUCUGAGCU 735
5p 769 5p
344 GCAGGAACUUGUGAGUCUCCU hsa-mir-873 hsa-mir- hsa-miR-873 MIMAT0004953 GCAGGAACUUGUGAGUCUCCU 736
873
345 CUGCCCUGGCCCGAGGGACCGA hsa-mir-874 hsa-mir- hsa-miR-874 MIMAT0004911 CUGCCCUGGCCCGAGGGACCGA 737
874
346 GUAGAGGAGAUGGCGCAGGG hsa-mir-877 hsa-mir- hsa-miR-877 MIMAT0004949 GUAGAGGAGAUGGCGCAGGG 738
877
347 GUGAACGGGCGCCAUCCCGAGG hsa-mir-887 hsa-mir- hsa-miR-887 MIMAT0004951 GUGAACGGGCGCCAUCCCGAGG 739
887
348 UUAAUAUCGGACAACCAUUGU hsa-mir-889 hsa-mir- hsa-miR-889 MIMAT0004921 UUAAUAUCGGACAACCAUUGU 740
889
349 UGCAACGAACCUGAGCCACUGA hsa-mir-891a hsa-mir- hsa-miR-891a MIMAT0004902 UGCAACGAACCUGAGCCACUGA 741
891a
350 CACUGUGUCCUUUCUGCGUAG hsa-mir-892a hsa-mir- hsa-miR-892a MIMAT0004907 CACUGUGUCCUUUCUGCGUAG 742
892a
351 UCUUUGGUUAUCUAGCUGUAUGA hsa-mir-9-1 hsa-mir- hsa-miR-9 MIMAT0000441 UCUUUGGUUAUCUAGCUGUAUGA 743


Table 32: Novel miRNAs identified by deep sequencing analysis.


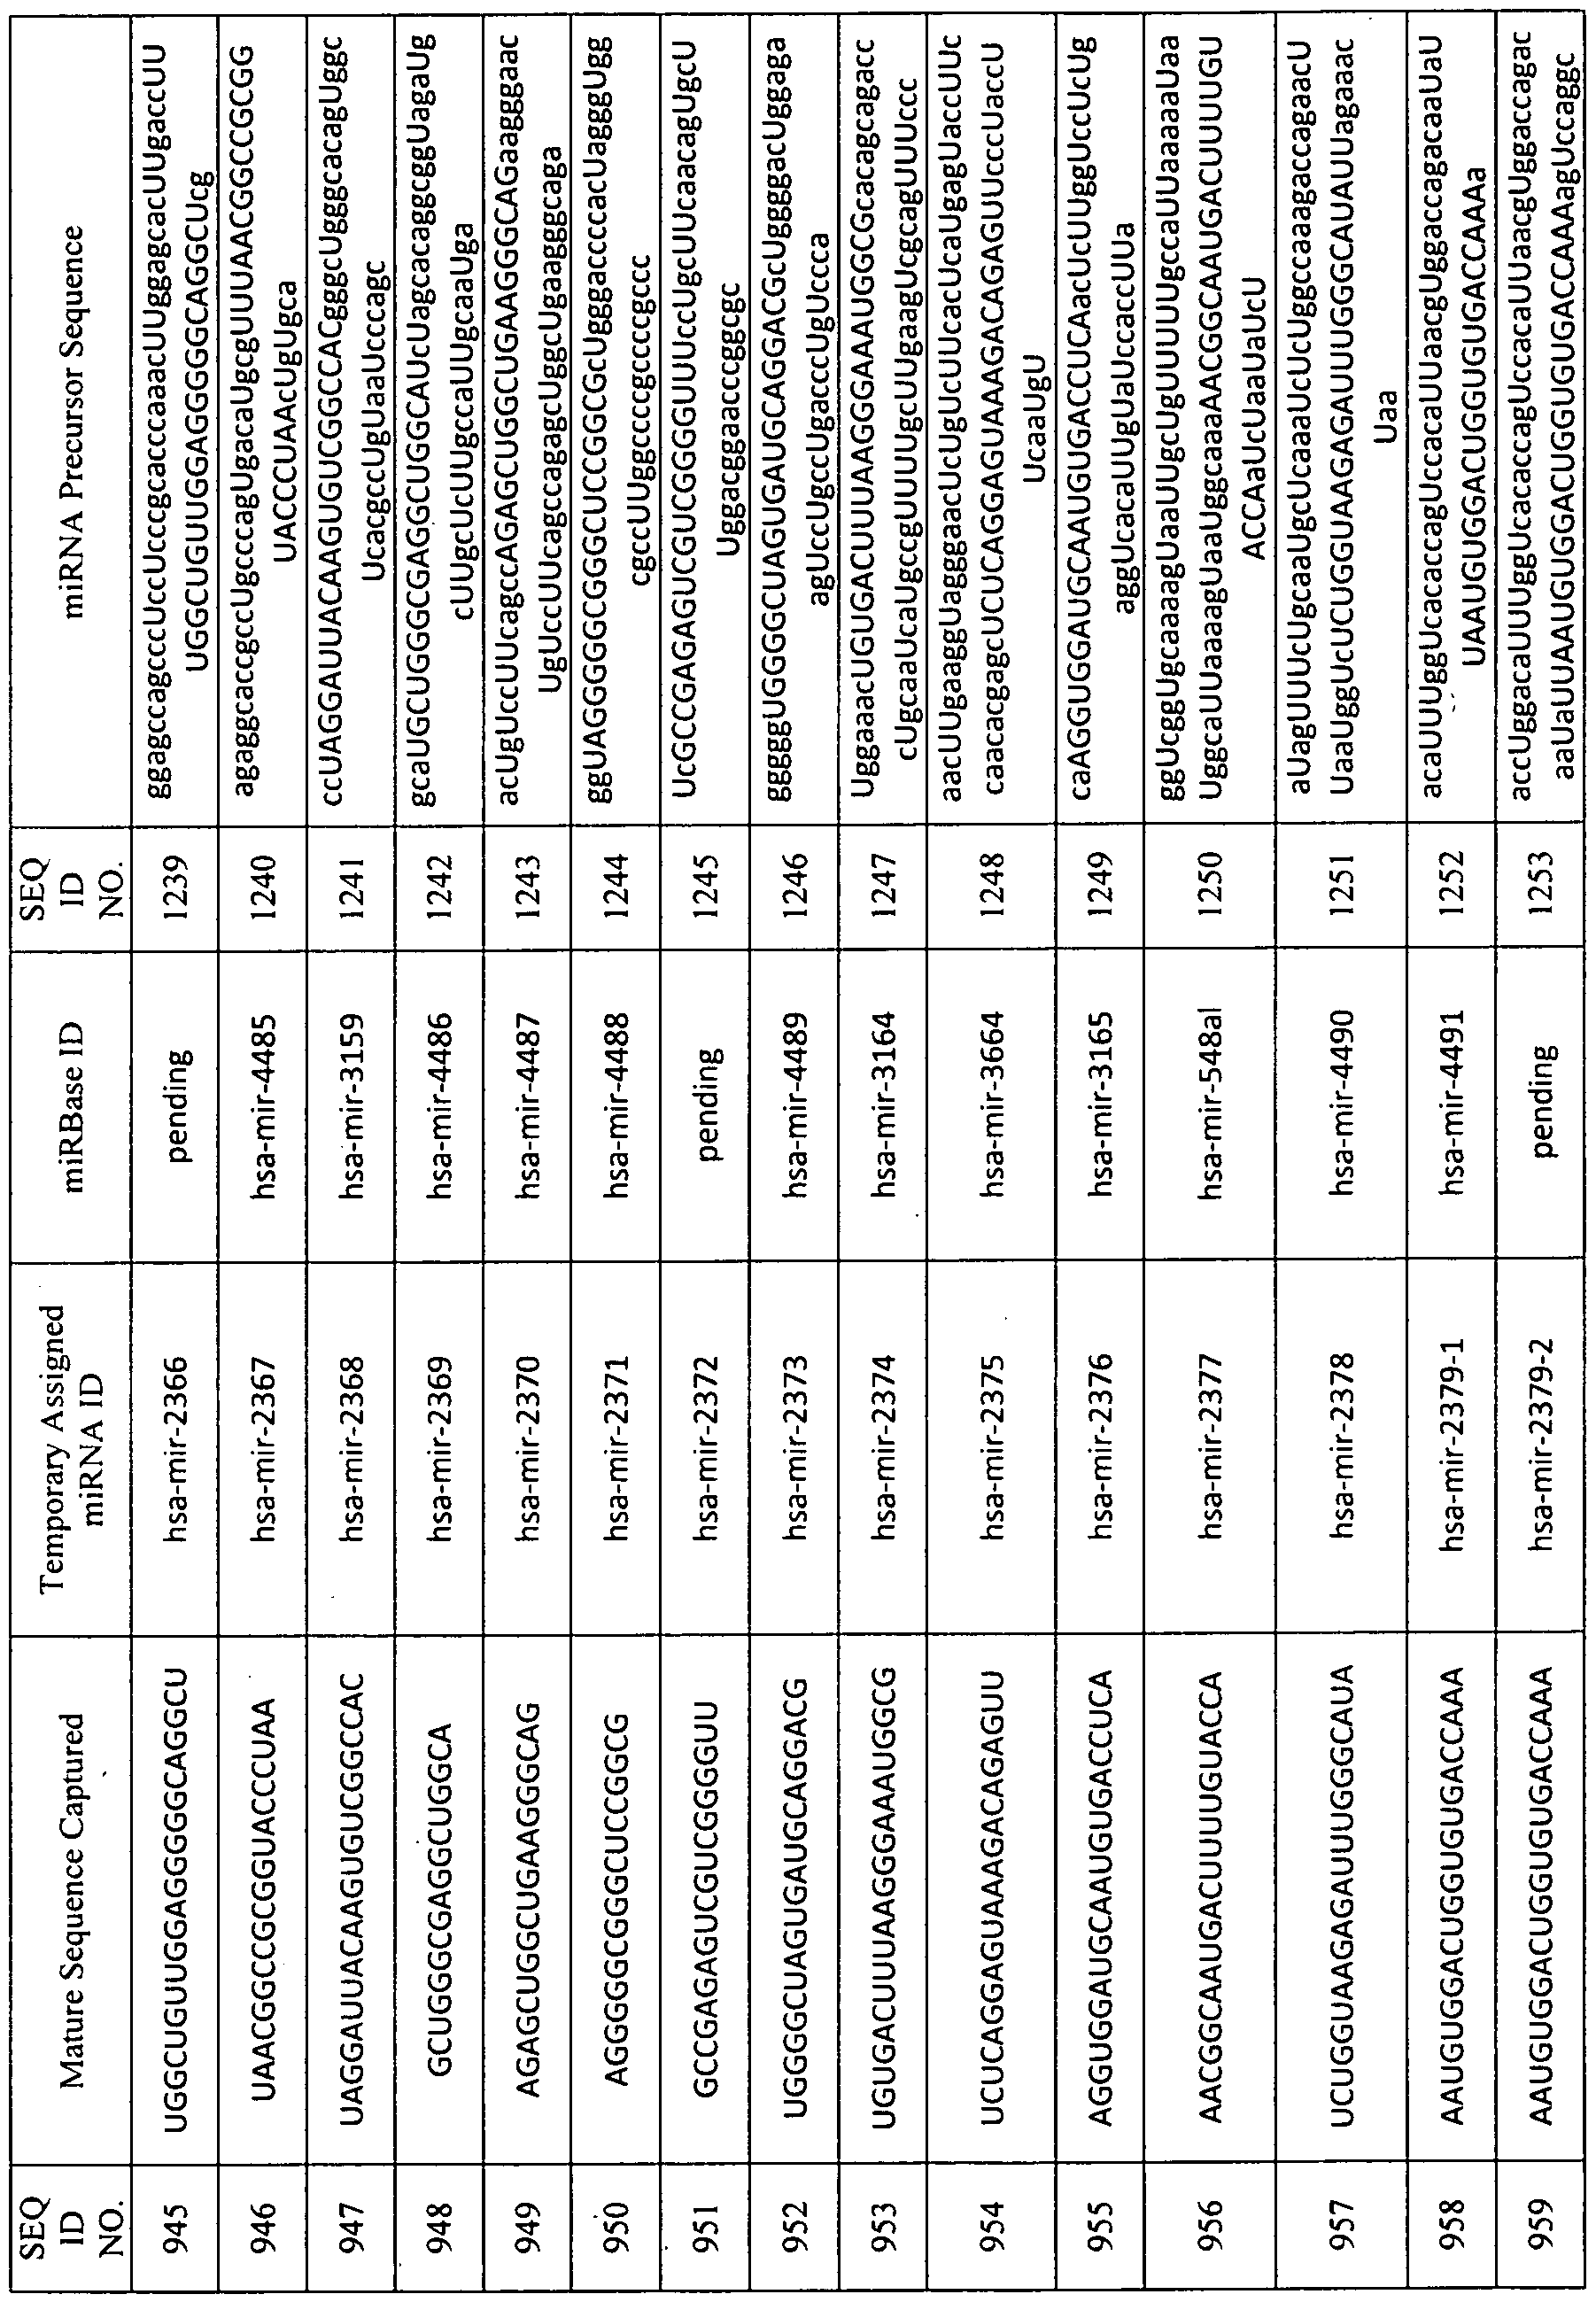


Table 33: Primers for Reverse Transcription for a subset of the known miRNAs identified b dee se uencin anal sis.


246 hsa-mir-374a UUAUAAUACAACCUGAUAAGUG TTATAATACAACCTGATAAGTG 1430
250 hsa-mir-378 ACUGGACUUGGAGUCAGAAGG ACTGGACTTGGAGTCAGAAGG 1431
259 hsa-mir-423 UGAGGGGCAGAGAGCGAGACUUU TGAGGGGCAGAGAGCGAGACTTT 1432
. 265 hsa-mir-449a UGGCAGUGUAUUGUUAGCUGGU TGGCAGTGTATTGTTAGCTGGT 1433
287 hsa-mir-503 UAGCAGCGGGAACAGUUCUGCAG TAG CAG CGG G AACAGTTCTG CAG 1434
296 hsa-mir-532 CAUGCCUUGAGUGUAGGACCGU CATGCCTTGAGTGTAGGACCGT 1435 hsa-mir-576-
316 AAGAUGUGGAAAAAUUGGAAUC AAGATGTGGAAAAATTGGAATC 1436
3p
327 hsa-mir-625 AGGGGGAAAGUUCUAUAGUCC AGGGGGAAAGTTCT ATAGTCC 1437
338 hsa-mir-7-1 UGGAAGACUAGUGAUUUUGUUGU TGGAAG ACT AGTG ATTTTGTTGT 1438
339 hsa-mir-7-2 UGGAAGACUAGUGAUUUUGUUGU TGGAAGACTAGTGATTTTGTTGT 1439
340 hsa-mir-7-3 UGGAAGACUAGUGAUUUUGUUGU TGGAAGACTAGTGATTTTGTTGT 1440
345 hsa-mir-874 CUGCCCUGGCCCGAGGGACCGA CTGCCCTGGCCCGAGGGACCGA 1441
351 hsa-mir-9-1 UCUUUGGUUAUCUAGCUGUAUGA TCTTTGGTTATCT AGCTGTATGA 1442
352 hsa-mir-9-2 UCUUUGGUUAUCUAGCUGUAUGA TCTTTG G TT ATCTAG CTG TATG A 1443
353 hsa-mir-92a-l UAUUGCACUUGUCCCGGCCUGU TATTG CACTTGTCCCGG CCTGT 1444
354 hsa-mir-92a-2 UAUUGCACUUGUCCCGGCCUGU TATTG CACTTGTCCCGG CCTGT 1445
356 hsa-mir-93 CAAAGUGCUGUUCGUGCAGGUAG CAAAGTGCTGTTCGTGCAGGTAG 1446
357 hsa-mir-9-3 UCUUUGGUUAUCUAGCUGUAUGA TCTTTGGTTATCTAGCTGTATGA 1447
364 hsa-mir-99a AACCCGUAGAUCCGAUCUUGUG AACCCGTAGATCCGATCTTGTG 1448
387 hsa-mir-570 AAAGGUAAUUGCAGUUUUUCCC AAAGG 1 AA I IGCAG M i l l CCCA 1449
Table 34: Primers for Reverse Transcription of a subset of novel miRNAs identified by

SEQ ID Primer for Reverse Transcription of SEQ ID
Assigned Mature Sequence Captured
NO: miRNA NO. miRNA ID
820 hsa-mir-2259 AUGGCCAGAGCUCACACAGAGG ATGGCCAGAGCTCACACAGAGG 1468
821 hsa-mir-2260 UGAGGAUAUGGCAGGGAAGGGG TGAGGATATGGCAGGGAAGGGGA 1469
825 hsa-mir-2264 UGGGCUCAGGGUACAAAGGUU TGGGCTCAGGGTACAAAGG TTC 1470 hsa-mir-
828 GCUGCACCGGAGACUGGGUAA. GCTGCACCGGAGACTGGGTAA 1471
2266-1
hsa-mir-
829 GCUGCACCGGAGACUGGGUAA GCTGCACCGGAGACTGGGTAA 1472
2266-2
836 hsa-mir-2272 UGUCGUGGGGCUUGCUGGCUUG TGTCGTGGGGCTTGCTGGCTTG 1473
838 hsa-mir-2274 ACUGGACUUGGAGGCAGAA ACTG G ACTTG GAGGCAGAA 1474
841 hsa-mir-2277 UUGGAGGCGUGGGUUUU TTGGAGGCGTGGGTTTT 1475
844 hsa-mir-2280 CUGACUGAAUAGGUAGGGUCAU CTGACTGAATAGGTAGGGTCAT 1476
846 hsa-mir-2282 AGAUUGUUUCUUUUGCCGUGCA AG ATTGTTTCTTTTG CCGTGCA 1477 hsa-mir-
847 CACGGCAAAAG AAA C AA U CC A CACGGCAAAAGAAA CAATCCA 1478
2282*
848 hsa-mir-2283 CAGGGCUGGCAGUGACAUGGGU CAGGGCTGGCAGTG ACATG G GT 1479
849 hsa-mir-2284 GGUGGGGGCUGUUGUUU GGTGGGGGCTGTTGTTT 1480
850 hsa-mir-2285 UGGGGAGGUGUGGAGUCAGCAU TG G G G AG G TG TG G AGTCAG C ATG 1481
852 hsa-mir-2287 GGCUCCUUGGUCUAGGGGUA GGCTCCTTGGTCTAGGGGTA 1482
856 hsa-mir-2290 UGGGGAUUUGGAGAAGUGGUGA TGGGGATTTGGAGAAGTGGTGA 1483
857 hsa-mir-2291 AAAAGUGAUUGCAGUGUUUG AAAAGTGATTGCAGTGTTTGCC 1484
860 hsa-mir-2294 UAGGAGCUCAACAGAUGCCUGU TAGGAGCTCAACAGATGCCTGT 1485
861 hsa-mir-2295 AGCUUUUGGGAAUUCAGGUAG AGCTTTTGGGAATTCAGGTAG 1486
864 hsa-mir-2298 CAAAAGUGAUCGUGGUUUUUG CAAAA I GA I C I G I 1 1 1 I G 1487
865 hsa-mir-2299 AGGGUGUGUGUGUUUUU AGGGTGTGTGTGTTTTT 1488
871 hsa-mir-2305 ACUGACAGGAGAGCAUUUUGA ACTGACAGGAGAGCATTTTGA 1489
874 hsa-mir-2308 AUAGUGGUUGUGAAUUUACCUU ATAG TG GTTG TG AATTTACCTTC 1490
876 hsa-mir-2310 CUACCCCAGGAUGCCAGCAUAG CTACCCCAGGATGCCAGCATAGTT 1491
877 hsa-mir-2311 ACUGGACUUGGUGUCAGAUGG ACTGGACTTGGTGTCAGATGG 1492
880 hsa-mir-2314 UAGUGGAUGAUGGAGACUCGGU TAGTGGATGATGGAGACTCGGT , 1493
888 hsa-mir-2322 AAGGUUUGGAUAGAUGCAAUA AAG GTTTG G ATAG ATG CAATA 1494
889 hsa-mir-2323 AAAGGUAAUUGCAGUUUUUCCC AAAGG IAA I 1 GCAG 1 1 1 1 I CCCA 1495
890 hsa-mir-2324 AGGGGACCAAAGAGAUAUAUAG AGGGGACCAAAGAGATATATAG 1496
896 hsa-mir-2328 GGCGACAAAACGAGACCCUGU GGCGACAAAACGAGACCCTGTC 1497
897 hsa-mir-2329 GGGUGCGGGCCGGCGGGG GGGTGCGGGCCGGCGGGGT 1498
899 hsa-mir-2331 CAUGCUAGGAUAGAAAGAAUGG C ATG CTAG G ATAG AA AG AATG G 1499
901 hsa-mir-2333 GCAAAGUGAUGAGUAAUACUGG GCAAAGTGATGAGTAATACTGG 1500
915 hsa-mir-2346 CCCUGGGGUUCUGAGGACAUG CCCTGGGGTTCTGAGGACATG 1501
917 hsa-mir-2348 CAGGAAGGAUUUAGGGACAGGC CAGGAAGGATTTAGGGACAGGC 1502
919 hsa-mir-2350 AUUAAGGACAUUUGUGAUUGAU ATTAAGGACATTTGTGATTGAT 1503 hsa-mir-
920 AAAAGGCAUAAAACCAAGACA AAAAGGCATAAAACCAAGACA 1504
2351-1
hsa-mir-
921 AAAAGGCAUAAAACCAAGACA AAAAGGCATAAAACCAAGACA 1505
2351-2
hsa-mir-
924 UAAAAACUGCAAUUACUUUC TA AAAACTG CAATTACTTTC 1506
2354-1
hsa-mir-
926 UGUGAUAUCAUGGUUCCUGGGA TGTGATATCATGGTTCCTGGGA 1507
2355-1
Temporary
SEQ ID Primer for Reverse Transcription of SEQ ID
Assigned Mature Sequence Captured
NO. miRNA NO. miRNA ID
hsa-mir-
929 UGUGAUAUCAUGGUUCCUGGGA TGTGATATCATGGTTCCTGGGA 1508
2355-2
hsa-mir-
931 UGUGAUAUCAUGGUUCCUGGGA TGTGATATCATGGTTCCTGGGA 1509
2355-3
hsa-mir-
932 UGUGAUAUCGUGCUUCCUGGGA TGTGATATCGTGCTTCCTGGGA 1510
2355b
936 hsa-mir-2358 AAAAGUAACUGCGGUUUUUGA AAAAG 1 AA 1 GG 1 1 1 1 1 A 151 1
938 hsa-mir-2360 GGAGUGGGCUGGUGGUU GGAGTGGGCTGGTGGTT 1512 hsa-mir-
940 AAGGGCUUCCUCUCUGCAGGAC AAGGGCTTCCTCTCTGCAGGAC 1 513
2362-1
hsa-mir-
941 AAGGGCUUCCUCUCUGCAGGAC AAGGGCTTCCTCTCTGCAGGAC 15 14
2362-2
949 hsa-mir-2370 AGAGCUGGCUGAAGGGCAG AGAGCTGGCTGAAGGGCAG 1 515
953 hsa-mir-2374 UGUGACUUUAAGGGAAAUGGCG TG TG ACTTTA AG G G A AATG G CG 1516
954 hsa-mir-2375 UCUCAGGAGUAAAGACAGAGUU TCTCAGGAGTAAAGACAGAGTT 1517 .
955 hsa-mir-2376 AGGUGGAUGCAAUGUGACCUCA AGGTGGATGCAATGTGACCTCA 1518
977 hsa-mir-2397 AGGCUGGGCUGGGACGGA AGGCTGGGCTGGGACGGA 1 519
979 hsa-mir-2399 UAGGAUGGGGGUGAGAGGUG TAGGATGGGGGTGAGAGGTG 1520
988 hsa-mir-2406 UGAGGGAGUAGGAUGUAUGGUU TGAGGGAGTAGGATGTATGGTT 1521
991 hsa-mir-2409 AGACUGACGGCUGGAGGCCCAU AGACTGACGGCTGGAGGCCCAT 1522
994 hsa-mir-2412 UAGUGAGUUAGAGAUGCAGAGC TAGTGAGTTAGAGATGCAGAGC 1523
996 hsa-mir-2414 GGGAGAAGGGUCGGGGC GGGAGAAGGGTCGGGGC 1524
1002 hsa-mir-2416 CUCGUGGGCUCUGGCCACGGC CTCGTG GG CTCTGG CCACG GCC 1525 hsa-mir-
1003 AGAAGGGGUGAAAUUUAAACGU AGAAGGGGTGAAATTTAAACGT 1526
2417-1
hsa-mir-
1004 AGAAGGGG UG AAAU UUAAACG U AGAAGGGGTGAAATTTAAACGT 1527
2417-2
hsa-mir-
1005 AGAAGGGGUGAAAUUUAAACGU AGAAGGGGTGAAATTTAAACGT 1528
2417-3
1007 hsa-mir-2419 GCUCAGGGAUGAUAACUGUGCUGAGA GCTCAGGGATGATAACTGTGCTGAGA 1529
101 1 hsa-mir-2423 CUGGACUGAGCCAUGCUACUGG CTGGACTGAGCCATGCTACTGG 1530
1017 hsa-mir-2428 AUAGCAGCAUGAACCUGUCUCA ATAGCAGCATGAACCTGTCTCA 1531 hsa-mir-
1018 UGAGACAGGCUUAUGCUGCUAU TGAGACAGGCTTATGCTGCTAT 1532
2428*
1022 hsa-mir-2432 UGGUCUGCAAAGAGAUGACUGU TGGTCTGCAAAGAGATGACTGTG 1533
1025 hsa-mir-2435 UUGGAGGGUGUGGAAGACAUC TTGGAGGGTGTGGAAGACATC 1534
1027 hsa-mir-2437 AUGGAGAAGGCU UCUGA ATGGAGAAGGCTTCTGA 1535
1028 hsa-mir-2438 AAAAGCUGGGUUGAGAA AAAAGCTGGGTTGAGAAG 1536
1029 hsa-mir-2439 UGGAAGGUAGACGGCCAGAGAG TGGAAGGTAGACGGCCAGAGAG 1 537
1030 hsa-mir-2440 UCUGGGAGGUUGUAGCAGUGGA TCTGGGAGGTTGTAGCAGTGGA 1538
1036 hsa-mir-2445 GGAGGAACCUUGGAGCUUCGGC GGAGGAACCTTGGAGCTTCGGCA 1539
1038 hsa-mir-2447 ACUGGACUAGGAGUCAGAAGG ACTGGACTAGGAGTCAGAAGG - 1540
1041 hsa-mir-2450 CAAAAACUGCAGUUACUUUUGU CAAAAACTGCAGTTACTTTTGT 1541
1046 hsa-mir-2455 AAAAGGCAUUGUGGUUUUUG AAAAGGCA 1 I G I GG I 1 1 1 l b 1542
Table 35: miRNAs that differentiate ABC DLBC vs. GCB DLBCL

The 3 '-end G of SEQ ID NO. 1565 is optionally omitted (providing SEQ ID NO. 1022)
Appendix A: Average expression of the genes depicted in Fig. 6 *

♦Empty cells indicate values not appreciably measured.
Gene Name Naive vs Germinal Center vs Germinal Center vs
Germinal Center Plasma Memory
Naive GC GC PC GC Memory
Average Average average Average Average Average
ClSorfl 9.49 6.47 6.47 8.63
FXYD7 7.36 4.35
DUSP8 7.96 4.96 4.96 8.41 4.96 7.75
BTBD3 7.41 4.42
TMEPAI 11.15 8.20 8.20 11.03
ANTXR2 9.90 6.97
FOSB 10.13 7.21 7.21 1 1.05
TMCC3 8.23 5.31 5.31 7.09 5.31 8.05
ARL4C 1 1.31 8.41 8.41 10.32
ZMYNDl 1 1 1.33 8.43 8.43 11.34 8.43 11.68
RHOBTBl 7.33 4.48
JU 12.14 9.34 9.34 12.70
SKI 10.46 7.67 7.67 10.68
TMEM121 7.07 4.29
IL13RA1 8.99 6.21
KIF13B 6.23 9.01
BHLHB5 4.26 7.39
PGM2L1 10.35 7.65
C14orf4 12.11 9.47 9.47 11.01 9.47 1 1.65
PDE4B 12.38 9.74 9.74 11.60
PDE7B 8.64 6.03
BCL9L 9.37 6.77 6.77 8.61
PCDH9 10.32 7.73
ARHGAP5 10.44 7.86 7.86 9.11 7.86 9.85
KIAA0802 9.18 6.61 6.61 7.91 6.61 7.89
ITGB4 7.48 4.91
NOTCH2NL 7.17 8.95
CDC42BPA 7.32 4.77
SPG20 9.25 6.73
KLF4 10.04 7.57 7.57 9.09
AHNAK 9.34 6.87 6.87 9.56 6.87 1 1.51
FCHSD1 9.15 6.69
KIAA1622 3.94 7.67
PLXNC1 10.92 8.48
TMEM150 8.39 5.96
ACVR2A 7.81 5.38 5.38 8.63 5.38 7.40
KALR 5.61 7.64
ANK2 7.69 5.28 5.28 7.54 5.28 7.00
FLJ14213 7.61 5.21 5.21 7.97
CHPTl 10.92 8.52
TCF2 5.69 7.82
FGF5 5.41 7.52
SLC12A6 12.18 9.80 9.80 11.09
MGC 17330 11.53 9.16
NR4A2 10.21 7.85 7.85 9.21 7.85 10.54
SLC39A10 1 1.06 8.70
LITAF 12.52 10.18 10.18 11.82
AKT3 9.32 6.99 6.99 9.25
PDCD4 12.89 10.57 10.57 13.33
STMN3 10.03 7.72
ID Gene Name Naive vs Germinal Center vs Germinal Center vs
Germinal Center Plasma Memory
N3ive GC GC PC- GC Memory
Average Average average Average Average Average
101 SIDT2 13.13 10.85
102 GRIA3 7.04 4.77
103 EML4 12.83 10.57
104 DIP2B 1 1.26 8.99 8.99 10.77
105 FBN1 4.89 8.17
106 FAM84B 9.21 6.96
107 EG 3 11.59 9.35 9.35 8.24 9.35 10.62
108 CTHRCl 4.25 11.94
109 RRAGD 7.69 5.46
110 MACF1 12.S8 10.66
111 FOXF2 7.05 4.83
112 GAB1 8.01 5.81 5.81 10.91
113 ST18 4.42 7.40
114 ZFP36L2 13.78 11.59 11.59 13.43 11.59 14.05
115 GAB2 8.29 6.12 6.12 9.02
116 CHSTl 1 1 1.17 8.99 8.99 10.28
117 CLOCK 9.85 7.68 7.68 9.91 7.68 9.62
118 PREX1 10.07 7.90 7.90 11.16
119 KLF11 8.08 5.94 5.94 8.39
120 PTGER4 11.66 9.53
121 LF9 9.47 7.34 7.34 9.27
122 FLJ37078 7.55 5.42 5.42 7.49
123 ODZ2 7.20 5.08 5.08 7.25 5.0S 7.22
124 SES 3 11.24 9.1 1 9.1 1 7.60
125 PDK4 7.22 5.09
126 CNT AP3 7.35 5.23 5.23 7.10
127 DUSP1 13.34 1 1.22
128 MARCKS 1 1.19 9.07 9.07 1 1.05 9.07 12.21
129 SPRY4 7.02 4.91
130 LMOl 4.75 7.16
131 MTUS1 7.77 5.66 5.66 8.16
132 ADCY9 8.01 5.91 5.91 7.74
133 SLC17A6 3.80 7.06
134 NOX4 7.45 5.37 5.37 7.22
135 UTRN 9.46 10.97
136 ZBTB10 8.50 6.45
137 SLC26A7 8.37 6.32 6.32 7.89
138 PNRC1 13.14 11.09
139 LLGL2 6.83 9.29
140 CHSTl 7.15 5.12
141 CREB3L2 10.53 8.51 8.51 13.30
142 DDIT4 12.69 10.68
143 C20orfl08 8.82 6.80 6.80 10.19
144 CDH1 3.85 10.26
145 TFAP4 7.2S 5.29
146 SLC38A2 13.57 11.58 11.58 13.74 11.58 13.17
147 SES 1 9.84 7.87 7.87 9.13
148 YPEL2 10.18 8.20 8.20 10.04
149 GRASP 8.47 6.50
150 TSC22D3 13.22 11.26 11.26 12.67
ID Gene Name Naive vs Germinal Center vs Germinal Center vs
Germinal Center Plasma emorv
Naive GC GC PC GC Memory
Average Average average Average Average Average
151 ATP11A 9.70 7.75 7.75 9.50
152 L3MBTL3 10.61 8.66 8.66 10.06
153 SORT1 7.61 5.67 5.67 8.11
154 CAVl 4.80 9.11
155 RXRA 9.07 7.15 7.15 8.81
156 CRELD1 8.40 6.48 6.48 8.26
157 RBMS1 12.40 10.49 10.49 8.80
158 LYST 10.90 8.99
159 PIP5K1B 9.61 7.70 7.70 9.97
160 JUNB 1 1.62 9.72
161 MBOAT1 4.80 7.27
162 IRF4 11.16 9.28 9.28 13.66
163 LIFR 4.62 7.08
164 ORC3 11.25 9.37
165 MBP 11.91 10.05 10.05 8.61
166 SRC 4.98 7.98
167 ALS2CR13 11.79 9.93 9.93 8.89 9.93 11.47
168 MYH1 4.40 7.37
169 DUSP3 9.36 7.50 7.50 9.16
170 HLX1 7.14 5.2S 5.28 7.65
171 CDKN1A 9.09 7.23 7.23 8.97 7.23 8.43
172 SOCS5 10.00 8.15
173 PPP1R9A 5.14 7.35
174 TGFBR2 12.81 10.99 10.99 12.63
175 LRRC16 S.47 6.66
176 ZNF629 8.17 6.35 6.35 8.58
177 RPS6KA5 1 1.75 9.95 9.95 11.48
17S SATB1 12.79 10.99 10.99 9.06
179 SEMA4C 7.38 5.59 5.59 8.49 5.59 7.14
180 UL 1 7.79 5.99 5.99 8.72 5.99 8.06
1S1 STX3 8.8S 7.09 7.09 8.91
182 BAMBI 4.81 7.26
183 MAP3K5 10.63 8.84 8.84 7.66 8.84 10.71
184 KIAA1147 1 1.70 9.91 9.91 11.53
185 SBK1 5.20 7.04
186 RYR3 7.80 6.02 6.02 8.27
187 ZNF238 13.05 1 1.27 11.27 10.08 11.27 12.54
188 IL12A 5.65 7.26
1S9 SLC2A3 12.00 10.23 10.23 11.89
190 GFPT2 3.39 7.18
191 G0S2 7.72 5.96
192 LYRM5 10.29 8.53 8.53 10.93
193 SSH2 11.67 9.91 9.91 11.85
194 NRPl 7.44 5.69 5.69 7.22
195 LMLN 8.92 7.19
196 UCP3 7.71 5.99
197 TMEM166 7.31 5.60
198 CACNA1I 7.46 5.76 5.76 7.06
199 PHOSPHOl 3.55 7.10
200 CRIM1 9.79 8.11 8.11 9.32
ID Gene Name Naive vs Germinal Center vs Genninal Center vs
Genninal Center Plasma Memory
Naive GC GC PC GC Memory
Average Average average Average Average Average
201 GATA6 5.41 7.59
202 SACS 10.06 8.39 8.39 10.54
203 CDKN1B 12.91 11.24 11.24 14.41
204 CACNA2D2 5.25 7.57 5.25 7.93
205 MKRN3 3.65 7.10
206 MTFR1 10.40 8.74 8.74 7.34 8.74 10.15
207 GALNT3 10.19 8.54
208 RPS6 A3 12.07 10.42 10.42 1 1.48
209 DTNA 5.47 7.86
210 MAGI2 7.04 5.40 5.40 7.42
211 FOXJ2 10.01 8.38 8.38 9.97 8.3S 9.85
212 KIAA0513 5.29 8.44 5.29 7.36
213 ND G1 7.75 10.02
214 AKAP7 10.16 8.54
215 CD72 13.74 12.12
216 IGFBP5 7.30 5.69 5.69 7.59
217 REPS 2 7.51 5.92 5.92 7.60
218 PRDM12 7.17 5.57
219 ZNF3 S.86 7.27 7.27 8.75
220 TLL2 4.88 7.01
221 PCNX 9.77 S.19
222 ARHGAP24 1 1.31 9.73 9.73 8.65 9.73 11.32
223 THRAP2 11.31 9.73
224 RNF11 9.72 . 8.15 8.15 11.08
225 HOXC8 7.05 5.48
226 SCML2 10.33 8.76
227 BMPR2 9.70 8.14 8.14 10.06
228 STAC 5.27 7.20
229 C10orf54 9.12 7.56 7.56 10.16
230 FBXL1 9.51 7.95 7.95 9.36
231 CBX7 10.87 9.32 9.32 10.96
'13? UBE2W 9.80 8.25 8.25 9.76 8.25 9.38
233 ProSAPiPl 4.12 7.54
234 UBL3 10.73 9.18 9.18 1 1.27 9.18 1 1.03
235 TTYH3 7.35 5.81 5.81 8.16
236 PUNC 5.39 8.85 5.39 7.30
237 GDF1 1 7.01 5.47 5.47 7.70
238 LMX1A 5.25 7.43
239 ΉΜΡ2 7.51 5.97 5.97 7.69 5.97 7.40
240 NHLH2 3.93 7.35
241 CLCFl 10.50 8.98
242 ITGB3 7.66 6.14
243 T EM132E 3.93 7.20
244 KCTD17 7.45 5.94 5.94 7.33
245 ChGii 7.75 6.24 6.24 8.36
246 DIP2C 9.25 7.75
247 DKFZpd67G21 10 8.79 7.28 7.28 9.25
248 CSNK1G3 10.84 9.34 9.34 10.70
249 NRIP1 11.79 10.30
250 SMAD3 10.72 9.23 9.23 7.74 9 23 10.54
 ID Gene Name Naive vs Germinal Center vs Germmal Center vs
Germinal Center Plasma Memory
Naive GC GC PC- GC Memory
Average Average average Average Average Average
301 PHF20 12.00 10.67
302 VAV3 10.44 7.84
303 CAR L 8.38 7.06 7.06 8.94
304 TRIM36 5.43 7.77
305 CTLA4 6.57 7.95
306 POLK 9.69 8.38 8.38 10.55
307 WSB1 13.22 1 1.91 1 1.91 13.02
308 ALS2CR2 9.87 8.57 8.57 10.14
309 PLK2 4.94 7.13
310 SRPK2 10.83 9.53 9.53 1 1.13
31 1 ARRDC2 10.86 9.55
312 IER5 13.10 11.80
313 EP l 8.95 7.66 7.66 9.07
314 SLC20A2 9.45 8.16
315 DLG4 4.23 7.22
316 TMTC2 6.16 7.92
317 ETV1 8.19 6.90
318 JAZF1 1 1.93 10.65 10.65 7.49
319 VAV2 10.22 8.94
320 C15orf27 7.19 5.91
321 FYCOl 9.75 8.47
322 KIAA07S9 7.27 6.00
323 OBFC2A 9.94 8.66 8.66 10.94
324 CF2 7.19 5.92
325 KIAA201S 11.77 10.50 10.50 9.50
326 TMR10 10.75 9.48
327 FAM63B 6.03 7.83 6.03 7.95
328 SNF1LK 10.20 8.93 8.93 10.18
329 ZNF385 8.89 7.63
330 SESTD1 1 1.05 9.78
331 SLC3 1 A2 5.41 9.13
332 PCMTD1 12.03 10.76 10.76 12.44
333 NBEA S.06 6.81 6.81 8.02 6.81 8.35
334 ZNF295 9.24 10.61
335 SIPA 1L3 10.81 9.57
336 CC2D1B 9.11 7.87
337 PRKAG2 7.12 8.42
38 PKD1 9.04 7.81
39 CNTNAP2 7.54 6.32
340 FNBPIL 7.90 6.67
41 HEXIM1 10.27 9.05 9.05 10.24 42 C19orf2 12.29 11.07
43 YLIP 1 1.62 10.41 10.41 11.81 44 SLC1 1A2 9.27 8.06
45 CLU 9.92 8.71
46 GCN5L2 10 18 S.97
47 DKFZP564J0863 10.85 9.65 9.65 11.1 1 48 CNNM2 7.85 6.64 6.64 8.07
49 CDC42SE1 12.07 10.87 10.87 12.18 50 HOXB9 6.20 8.41
ID Gene Name Naive vs Germinal Center vs Germinal Center vs
Germinal Center Plasma Memory
Naive GC GC PC GC Memory
Average Average average Average Average Average
351 NFATC3 11.39 10.19
352 UNC84B 1 1.12 9.93 9.93 8.59
353 DUSP5 6.23 9.44
354 ING1 11.35 10.17
355 ΓΓΜ2Β 1 1.23 13.62
356 FAM53B 1 1.67 10.49
357 ZFP36L1 14.07 12.89 12.89 10.09
35S NIPA1 9.75 8.57 8.57 10.07
359 GALNT l 10.93 9.76 9.76 1 1.12
360 MYP 4.25 7.32
361 ITPK1 10.03 8.86
362 TTYH2 7.90 6.73
363 DOCK 10 10.80 9.63 9.63 11.53
364 HorDS 9.18 8.01 8.01 9.58 8.01 9.50
365 RP1 1- 130N24.1 4.76 7.62
366 FGF12 5.82 7.33
367 ATP2B2 7.93 6.76
368 PPP1R9B 9.77 8.60
369 PPP3CA 13.50 12.33 12.33 13.86
370 TFAP2A 5.54 8.26
371 CYLD 10.91 9.75
372 PHF1 11.85 10.69 10.69 12.26
373 NEBL 7.98 6.82 6.82 8.08
374 ACINI 12.04 10.89 10.89 11.99
375 SPTBN1 12.28 11.14 1 1.14 12.53 11.14 12.42
376 VAMP4 10.81 9.67 9.67 11.18
377 D AJB9 10.80 9.66 9.66 15.21 9.66 11.03
378 ZDHHC2 1 1.55 10.42
379 TRIO 10.57 9.43
380 TMEM25 6.24 8.57
381 TAF9B 10.82 9.69
382 ARID3A 8.03 6.90 6.90 9.81
383 K1AA0182 10.68 9.55
384 RPS6KA2 8.61 7.49
385 C3orf58 1 1.47 10.34
386 CAST 1 1.94 10.82
387 SH3PXD2A 8.46 7.34
388 RAB6B 5.93 7.36
389 RNF141 1 1.47 10.35
390 SP4 1 1.26 10.14
391 AR CX2 9.44 8.32 8.32 9.54
392 ZNF398 10.39 9.28
393 PBX3 9.69 .8.58 8.58 7.00
394 FOS 12.35 11.25 1 1.25 13.34
395 FHOD3 6.40 7.94
396 C20orf59 10.11 9.01 9.01 10.92
397 FAM117A 11.67 10.57 10.57 12.06 10.57 11.64
398 ATP8B2 8.58 7.49 7.49 10.87 7.49 8.88
399 UXSl 9.53 8.43
400 GOLGA8A 12.84 11.74 · 11.74 13.14 11.74 13.05
ID Gene Name Naive \¾ Germinal Center vs Germinal Center vs
Germinal Center Plasma Memory
Naive GC GC PC GC Memory
Average Average average Average Average Average
401 SUFU 6.03 7.84
402 NAGPA 9.32 8.23
403 MLLT6 11.70 10.61
404 CPEB4 9.46 8.36 8.36 12.21
405 TMEM50B 10.67 9.58 9.58 11.41 9.58 10.63
406 AMPD3 11.65 10.56 10.56 8.76
407 SLX5 5.19 7.53
408 MMP16 5.66 7.47
409 LBH 11.87 10.79 10.79 8.83
410 POM121 9.60 11.26
411 ATP8B 1 11.93 10.86 10.S6 8.88
412 ARHGAP29 3.75 7.60
413 ZNF395 1 1.78 10.76
414 CRY 2 6.50 8.01
415 BIN1 10.68 9.67
416 PSAP 1 1.24 13.41 1 1.24 12.71
417 ISL1 5.91 7.60
418 D AJB5 8.04 6.97
419 IAA0284 6.42 8.79
420 RB 35B 11.44 10.38
421 ADCY7 11.53 10.47
422 ARRDC3 9.46 10.68
423 MICALl 11.72 10.67
424 MTHFR 10.31 9.26
425 HOOK3 8.57 7.53 7.53 6.52
426 EFNB3 5.16 7.79
427 ARHGAP12 9.86 8.S2
428 LMBRIL 9.33 8.29
429 FGF7 5.88 7.86
430 USP2 5.50 7.52
431 SMARCA2 11.14 10.12
432 ELL2 8.23 13.60
433 Clori26 7.06 10.01
434 CXCR4 14.61 13.45
435 HDGFRP3 5.58 7.39
436 BNC2 6.18 7.72
437 YPEL3 10.16 11.81 10.16 11.47
438 PPFIA3 4.58 8.06
439 DLGAP4 9.34 10.68
440 ZBTB7A 9.84 1 1.10
441 D4S234E 5.90 7.38
442 FNDC3A 9.41 13.60
443 FOXC1 5.84 7.39
444 K1F26B 5.55 7.30
445 NAV2 6.26 7.90
446 DDX3Y 8.07 10.38
447 FGD 1 7.31 6.06
448 HTR4 7.26 9.01 7.26 8.40
449 C22orG l 5.67 8.10
450 RI\TF44 1 1.48 10.14
ID Gene Name Naive vs Germinal Center vs Germinal Center vs
Germinal Center Plasma Memory
Naive GC GC PC GC Memory
Average Average average Average Average Average
451 GALNAC4S-6ST 10.43 12.71
452 CC T2 10.15 1 1.23
453 CHICl 8.91 10.02
454 N AT 5.97 8.19 5.97 7.84
455 CTDP1 6.81 8.26
456 BTG1 14.95 13.94
457 CMTM4 5.27 7.81
458 GOLGA8B 11.37 12.63
459 HBP1 10.07 12.13
460 GDPD1 6.35 7.61
461 CDYL 9.31 10.61 9.31 10.50
462 Z F217 10.77 9.73
463 KIF5A 6.13 7.75
464 ClQLl 5.80 8.11
465 SOLH 7.88 9.03
466 ZC3H6 9.81 10.96
467 LATS2 7.61 10.19
468 COL 18A1 6.46 7.85
469 Cl lorf24 9.89 1 1.07
470 SCUBE3 6.14 7.88
471 SEMA4G 5.57 7.81 -
472 FOXP1 12.31 10.84
473 TRIB2 10.62 9.61
474 LOC285382 5.35 7.20
475 U X2 7.91 10.22
476 LOCI 96463 4.16 7.52
477 LPGAT1 10.57 7.99
478 RASSF2 12.52 10.93
479 IRFl 9.86 11.60
480 RAB40B 7.31 10.89
481 CTDSPL 6.37 7.83
482 CLC 4 7.44 6.39
4S3 CACNB1 6.41 8.20
484 SYNGR1 8.45 10.40
485 ST8SIA4 10.67 1 1.81
4S6 PLD3 7.63 10.59
487 FOX03A 10.17 12.41
488 TSPAN33 10.49 9.38
489 HIST1H4F 6.20 8.08
490 LAPTM4A 12.05 13.06
491 PRKCB 1 12.14 10.50
492 PROX1 6.38 7.89
493 CD 5R1 10.12 7.78
494 MAP3K9 7.96 9.13
495 GPX3 5.92 7.61
496 GNS 8.79 11.06
497 ARL15 8.27 6.51
498 OXR1 9.21 1 1.17 9.21 10.25
499 AAK1 7.38 9.54 7.38 8.47
500 SH3PX3 6.72 8.58
ID Gene Name Naive vs Germinal Center vs Germinal Center vs
Germinal Center Plasma Memory
Naive GC GC PC GC Memory
Average Average average Average Average Average
501 MS4A7 10.55 8.35
502 FLJ20273 5.96 1 1.23 5.96 8.65
503 ISCU 12.01 13.55
504 ITGA2 5.70 7.60
505 ME 1 5.87 7.89
506 LRP1 4.92 7.04
507 ZNF652 9.66 10.81
508 TRAK1 1 1.07 9.85
509 SLC8A1 6.27 7.83
510 Clorfl l9 10 76 1 1.98
511 KLF6 1 1.33 9.24 11.33 12.40
512 TRIM2 6.22 8.20
513 USP3 11.1 1 12.51
514 AKLD5B 11.02 12.48
515 RASD1 6.15 9.32
516 ZCCHC2 10.63 8.93
517 LEFTY2 5.08 7.03
518 BACH1 9.97 1 1.76
519 IRAKI 11.48 12.80
520 RP1 1-217H1.1 10.76 13.04
521 HLCS 6.54 8.45
522 NAGK 10.94 12.14
523 CELSR2 6.26 7.89
524 PCBP4 7.75 9.08
525 FLJ25476 9.49 10.72
526 TPP1 12.10 11.06
527 ACVR1 7.95 9.31
528 EHD3 8.99 10.35
529 FAM80B 9.35 8.02
530 S PR YD 3 8.19 9.51
531 PRDM4 9.81 10.83
532 C6orfl34 7.92 5.60
533 HSP90B 1 12.04 16.36
534 DYNC1I1 5.98 7.33
535 NFIX 7.43 8.67
536 DOCK4 5.96 7.97
537 ZNF287 · 7.09 8.47
538 XRN1 10.92 12.37
539 YES1 6.39 8.60
540 RBM35A 8.19 9.44
541 HOXB4 7.58 9.27
542 OTUD7B 7.24 8.57
543 CELSR3 6.83 8.39
544 RHOC 7.71 8.84
545 ZNF607 8.10 6.95
546 XYLTl 10.28 8.78 10.28 8.86
547 FAM89B 9.16 10.75
548 OSBPL8 12.99 11.66
549 SRCRB4D 6.82 8.67
550 RASL12 5.05 8.07
ID Gene ame Naive vs Germinal Center vs Germinal Center vs
Gemiinal Center Plasma Memory
Naive GC GC PC GC Memory
Average Average average Averaae Average Average
551 NAGS 8.39 9.78
552 MA 1A2 10.83 12.15
553 PPARA 8.59 9.65
554 CLDN12 6.66 8.39
555 ID4 5.93 7.79
556 HECTD2 7.98 6.80
557 EFCAB4A 5.93 8.96
558 CREBL1 6.97 8.09
559 SARM1 6.98 8.29
560 MIDN S.48 7.29
561 EMB 10.48 8.65
562 FOXK2 8.40 9.63
563 INADL 6.87 8.44
564 KCNAB 1 6.26 9.76
565 MAP3K8 10.92 9.60
566 C8orf58 7.89 5.62
567 SLC4A7 9.82 8.52 9.82 10.90
568 RAB8B 12.46 10.92
569 C lOorfl l S 8.93 10.20
570 CRTC2 9.37 7.94
571 KLC2 7.31 9.19
572 SRCAP 8.06 6.96
573 C TFR 7.15 8.67
574 SPTBN2 4.75 7.11
575 SMAD7 8.69 9.93
576 NDFIP1 9.10 10.95
577 BCL1 1A 14.03 10.63
578 SFXN5 7.26 8.87
579 RLMBP2 5.93 8.33
580 FUT8 8.62 11.08
581 PSEN2 5.86 9.17
582 MAP6 5.22 7.37
583 FOXOIA 11.53 10.14
584 BTG2 11.81 13.82
585 C10orf56 6.93 9.30
586 MAPK1 12.06 10.36
587 ZBTB47 6.63 8.12
588 GOSR2 9.73 11.07
589 ZFP90 10.15 8.92
590 RALGPS1 8.02 9.38
591 DGKI 4.77 7.39
592 RGL2 1 1.08 9.55
593 PAK6 5.90 8.55
594 D XLl 11.85 10.31
595 TMEM11 12.28 11.03
596 SNX24 6.75 8.53
597 HOXA3 5.99 8.27
598 SAMD4A 9.84 8.36
599 WDR45 9.88 12.43
600 TLOCl 12.91 14.52
 ID Gene Name Naive vs Germinal Center vs Germinal Center vs
Germinal Center Plasma Memory
Naive GC GC PC GC Memory
Average Average average. Average Average Average
651 YPEL5 12.41 13.78
652 TTN 9.61 7.03
653 HTRA3 5.62 8.02
654 CHST2 7.80 12.49
655 BAZ1A 1 1.43 10.06
656 LRFN5 7.38 6.21
657 MBNL1 14.10 12.62
658 MLL2 10.93 9.S9
659 SF1 1 1.44 10.36
660 FRMPD1 4.80 7.06
661 PPP2R5B 7.60 9.12
662 RNF43 10.04 8.01
663 GAP43 5.07 7.49
664 NOMOl 1 1.1 1 14.31
665 VEGFA 7.79 9.36
666 C22orf> 8.75 11.38
667 AKAP11 11.79 10.64
668 INSIG2 9.46 11.32
669 PDI 1L 9.11 10.72
670 TMEM4 10.93 13.32
671 LMNA 7.80 9.75
672 TP53INP1 1 1.84 14.14
673 NAV1 6.96 8 31
674 SPTY2D1 9.25 10.77
675 CREBL2 9.95 1 1 .10
676 MFAP3L 5.90 7.46
677 REX02 10.96 13.71
678 SPTBN4 6.77 8.22
679 NOM02 9.74 12.94
680 PTEN 12.78 1 1.40
681 FBXL16 6.86 9.56
6S2 GPM6A 7.87 6.15 7.87 6.67
683 PRX 6.76 8.91
684 HOXC11 6.40 7.88
685 IAA0329 8.27 9.87
686 PAFAH1B 1 1 1.68 10.33 '
687 C20orfl 74 9.5S 7.27
688 MTPN 13.87 12.17
689 TMED5 12.25 14.41
690 FURIN 8.03 9.54
691 ELAVL3 4.66 8.01
692 SH2B3 10.31 8.87
693 LIN28B 5.99 7.58
694 KIAA1033 12.65 11.38
695 TMEM28 4.95 7.14
696 TBC1D15 10.30 11.52
697 GOLGA4 10.1 1 11.71
698 STX1A 5.63 7.82
699 SLC40A1 6.87 8.27
700 KIAA1S 15 9.18 7.93
ID Gene Name Naive vs Gemunal Center vs Germinal Center vs
Germinal Center Plasma Memory
Naive GC GC PC GC Memory
Average. Average average Average Average Average
701 HNT 5.53 7.09
702 PDE11A 5.72 7.82
703 TGFBR3 7.84 9.52
704 MTF1 9.92 8.86
705 MAN1A1 9.99 13.65
706 THRA 7.26 8.48
707 CBLB 11.46 9.08
708 SLC35F1 6.29 8.16
709 FOXP4 8.52 7.30
710 ELOVL5 13.83 12.78
711 NMUR1 4.13 7.31
712 ITPRl 12.06 9.69
713 CDCA7L 1 1.95 10.33
714 RASSF1 9.35 10.69
715 ILI RAPLI 6.42 8.18
716 AUH 9.37 11 .19
717 DIAPH1 11.52 9.74
718 ENSA 12.33 11.22
719 FAM43A 10.62 9.39
720 CSMD3 4.79 7.58
721 SLC25A37 10.10 8.69
722 SLC33A1 9.78 12.19
723 CNOT6 9.98 8 93
724 GRID1 7.05 8.80
725 C21orf9l 11.51 10.18
726 ΓΤΡΚΒ 11.28 8.91
727 CP 5.89 7.41
728 HMBOX1 10.05 8.50
729 ARID 1 A 12.22 11 .1 1
730 C5orf5 11.86 10.38
731 T SB4X 16.86 15.10
732 EPAS1 7.02 8.39
733 HPS3 11.65 10.16
734 DKK1 6.16 7.86
735 ZNF282 7.89 5.40
736 AP3D1 11.29 12.84
737 DERLl 1 1.69 13.43
738 C5orfl 3 9.89 7.62
739 CCNG2 13.32 11.64
740 PGRMC2 9.44 11.38
741 ARF6 13.60 12.55
742 TMEM110 7.75 9.24
743 FAM13A1 7.11 9.69
744 BRi S IL 8.58 10 18
745 TRAM1 12.52 15.17
746 CALU 9.42 11.20
747 GOLPH3 11.55 12.81
748 MAP3K7 11.14 10.06
749 ABCG4 6.90 8.22
750 NELF 8.75 7.70
ID Gene Name Naive vs Germinal Center vs Germinal Center vs
Germinal Center Plasma Memory
Naive GC GC PC GC Memory
Average Average average Average Average Average
751 ADIPOR1 9.67 10.92
752 INSR 8.48 11.62
753 GRM5 6.24 7.65
754 TFG 10; 76 12.30
755 USP48 11.91 13.09
756 CLC 6 9.26 7.48
757 ZNF219 6.11 8.42
758 C7orf43 8.34 6.62
759 . NF B 1 11.90 10.70
760 ARF3 1 1.1 1 9.87
761 JMJD1C 12.34 1 1.11
762 ROD1 13.13 11.42
763 OXSR1 10.69 9.15
764 ERGIC2 10.86 12.81
765 EIF4E3 7.61 9.87
766 SEC24A 10.05 12.S5
767 SPRED1 7.19 5.77
76S H RPH3 12.60 11.38
769 ZDHHC7 10.34 9.05
770 HNRPA 1 16.14 15.14
771 TMED2 12.01 14.26
772 VASP 10.60 8.60
773 CHD4 11.40 10.31
774 RTN4RL1 5.48 8.36
775 PPP1R12A 12.03 10.97
776 SG 3 9.58 11.68
777 ARHGAP 17 12.37 8.62
778 GO ASP2 11.28 13.30
779 C2orf44 8.38 6.72
780 FAM116A 11.12 10.08
7S1 SSR1 12.75 14.73
782 MYH9 11.24 9.89
7S3 PIK3CD 12.99 10.03
7S4 DAZAP2 14.26 13.23
785 SELIL 10.74 14.04
7S6 LOC38S284 7.05 8.32
787 THRB 7.51 6.11 7.51 6.29
788 MGAT2 11.91 14.44
789 C8orfl 3 9.35 6.47
790 PDZD2 7.00 4.39
791 DERL2 10.74 12.75
792 ZCCHC5 7.39 6.27
793 NFYC 10.27 9.03
794 GLUD2 8.88 7.58
795 ESR1 7.55 9.88
796 NRP2 6.51 8.13
797 US 1 10.01 11.53
798 BIRC6 12.15 10.94
799 ARTO3B 7.83 9.22
800 STCH 10.16 13.88
ID Gene Name Naive vs Germinal Center vs Germinal Center vs
Germinal Center Plasma ' Memory
Naive GC GC PC GC Memory
Average Average average Average Average Average
801 SLC7A11 6.32 8.00
802 OSBPL5 7.91 9.22 7.91 6.62
803 IGFBP3 5.60 7.61
804 LNPEP 13.72 11.05
805 ZNRF1 8.18 9.68
806 DDAH1 7.96 5.87
807 ERG 4.07 7.49
808 APLP2 10.90 8.38
809 ZNFX1 10.14 8.93
810 GPM6B 8.66 6.69
81 1 BLCAP 11.49 10.10
812 SRP6S 1 1.47 12.88
813 PIK3AP1 14.12 11.74
814 ANKRD28 11.00 12.46
815 KCNH8 8.27 4.80
816 KIAA0430 12.43 10.61
817 PPP2 1B 9.84 8.41
818 TMED9 1 1.62 13.82
819 CTNNBIPl 7.31 8.89
820 PPP2R5D 9.51 7.92
821 CSX4 12.36 13.69
S22 AKAP6 7.38 5.55 7.38 4.93
823 C2orf30 10.72 13.84
824 DR1 11.97 10.65
S25 MTDH 12.46 13.96
826 ETS l 14.40 12.62
827 EPHA8 6.12 8.10
828 ANKRD13B 7.23 5.S5
829 C4orfl6 S.83 7.70
830 SOX4 9.14 10.20
831 SLC12A2 10.23 9.01
832 IER3rPl 1 1.35 12.56
833 DST 7.02 8.34
834 WRNIP1 11.03 9.49
835 CLCC1 9.63 11.48
836 B4GALT6 7.90 6.82
837 BTBD10 10.12 8.07
838 SDC 1 7.05 12.14
S39 C 10orfl 2 10.32 8.40
S40 ZDHHC3 9.80 8.78
841 GNAI2 10.86 9.27
842 HNRPU 13.82 12.47
843 GNAZ 8.86 7.26
844 ALG9 8.93 10.97
845 FBXL10 11.75 10.43
846 ARID4B 12.19 10.96
847 PPP1R3F 6.19 7.79
848 EPB49 6.49 7.94
S49 PCNP 12.91 11.74
850 PCYT1B 11.35 9.77
ID Gene Name Naive vs Germinal Center vs Germinal Center vs
Germinal Center Plasma Memory
Naive GC GC PC GC Memory
Average Average average Average Average Average
851 RAB 14 11.64 10.41
852 TCERG 1 12.50 11.46
853 MKNK2 14.87 12.67
854 COL4A3 8.78 12.23
855 H RPAO 12.50 11.36
856 P2RX4 8.88 10.29
857 JUP 9.23 5.70
858 EGR2 10.43 8.07
859 SUPT16H 1 1.35 9.60
860 PNRC2 13.93 1 1.64
861 SRPR 11.87 13.89
862 BPTF 12.46 11.34
863 RBM16 12.05 10.52
864 YWHAZ 13.62 12.61
865 EDEM3 11.01 12.76
866 C12orf23 11.18 12.40
867 DOC2A 3.96 7.21
868 SETD2 11.54 10.39
869 FAM98A 10.91 12.10
870 C13orfl8 13.25 9.86
871 BRP44L 10.48 11.91
872 CCDC6 11.25 9.82
873 GLCCI1 12.22 15.19
874 PLEKHH l 7.03 9.25
875 SMEK1 1 1.38 10.37
876 ANKRD9 4.70 8.61
877 CS K1E 8.86 11.48
878 DCUN1D3 7.48 5.95
879 LTB 14.66 9.91
880 EOMES 7.30 6.14
881 PARP8 10.81 8.69
882 ABCDl 7.12 8.49
883 HOXA10 5.56 7.32
884 RNPS1 12.60 11.25
S85 AYTL2 12.08 10.79
886 FLJ20699 5.74 8.80
887 SAPS1 1 1.43 9.76
SSS SYNJ1 8.36 9.64
889 ZNF403 12.06 10.91
890 KPNB l 13.37 12.26
891 ISOC1 9.67 10.98
892 HYOU1 9.95 1 1.85
893 ZNF706 12.83 14.30
894 HDLBP 10.60 13.37
895 ELF1 12.70 . 11.34
896 TM9SF4 S.66 10.55
897 RAB8A 11.94 10.88
898 MORF4L2 12.94 14.69
899 SERP1 13.31 15.16
900 ADAMTS5 5.71 7.31
ED Gene Name Naive vs Germinal Center vs Germinal Center vs
Germinal Center Plasma Memory
Naive GC GC PC GC Memory
Average Average average Average Average Average
901 TRIOBP 1 1.23 10.18
902 ZNF664 1 1.32 12.57
903 RAB11FIP1 11.78 9.03
904 MY018A 8.06 6.19
905 DUSP10 10.13 8.70
906 ATXN1 6.66 10.65 6.66 10.25
907 EPB 1L4B 6.12 7.95
908 C.NTNAP1 6.51 9.06
909 SLC17A7 6.47 8.01
910 SPCS2 13.75 15.53
911 CCNC 12.68 14.10
912 WDR77 10.67 8.83
913 GMFB 12.03 10.70
914 ITGA6 6.72 10.51
915 CASP8AP2 10.55 9.44
916 SEC24D 8.79 11.88
917 CBXl 12.16 10.96
918 TBX3 6.05 7.89
919 NFAT5 12.09 10.72
920 ATP6V1B2 10.73 9.53
921 ACTG1 16.72 14.81
922 RND3 7.31 5.65
923 HNRPUL l 11.97 10.58
924 TJP1 7.18 10.59
925 RAPGEF4 5.25 8.09
926 RGMA 5.65 7.42
927 NAP1L1 14.70 12.60
928 TARDBP 12.72 11.49
929 DAZAP1 12.74 11.30
930 ZNF609 8.26 6.94 8.26 9.52
931 ARL1 10.44 12.41
932 ERC2 7.03 5.97
933 PDE4A 7.65 9.22
934 CSK 12.83 10.59
935 I PAD1 S.44 10.05
936 PNN 13.75 12.48
937 DCP2 13.06 10.74
938 PIK3R3 6.34 7.82
939 RAB IA 13.59 14.83
940 CENTB2 12.39 10.97
941 SPTAN1 1 1.48 9.79
942 DNAJC8 12.25 11.00
943 UNC13B 6.70 8.35
944 DHX15 14.19 12.99
945 VEZFl 1 1.45 9.94
946 DHDDS 8.74 10.05
947 FAM55C 8.19 9.74
948 USP37 8.89 7.60
949 MMD 11.68 10.32
950 HCLS1 14.42 13.12
ID Gene Name Naive vs Germinal Center vs Germinal Center vs
Gemiinal Center Plasma Memory
Naive GC GC PC GC Memory-
Average Average average Average Average Average
951 IAA1370 13.30 14.72
952 GANC 8.31 6.12
953 SS P1 1 1.34 10.27
954 G3BP1 12.24 10.55
955 BAAT 4.91 7.24
956 FNDC3B 8.27 14.34
957 FBXW7 10.21 12.19
958 SPECC1L 10.27 7.66
959 YBX1 15.31 14.20
960 YAP1 7.23 5.61
961 ARF4 12.09 14.23
962 PNKD 10.86 9.79
963 CLEC2D 1 1.96 10.90
964 POl 13.81 11.82
965 TRAM2 9.38 12.80
966 MITF 8.05 6.41
967 CFLl 16.37 14.09
968 CREB5 5.46 7.24
969 GREM1 4.48 7.14
970 LONRF1 1 1.26 10.00
971 NME7 9.37 8.30
972 PMAIP1 12.26 10.75
973 KLHL14 11.89 10.84
974 AOF1 ' 9.33 7.96 9.33 8.28
975 S PD3 5.90 7.83
976 RGL1 6.66 8.04
977 LYPD6 5.38 7.39
978 STAT5B 10.95 9.73
979 C lOorfe 10.04 8.44
980 CLDND1 10.72 12.01
981 DUSP9 5.59 7.70
982 SLC36A1 8.53 7.23
983 PAM 8.90 10.86
984 GHR 5.87 7.56
985 CBL 11.69 10.26
986 CENTG2 5.96 7.39
987 BACH2 13.68 9.35 13.68 11.88
988 UP153 12.33 10.55
989 CPD 8.37 9.72
990 APLN 8.58 6.47
991 RFXDC2 11.67 10.00
992 GABRB2 5.58 8.10
993 NOM03 5.39 7.39
994 RHOJ 6.41 7.75
995 PRDM1 9.15 14.10
996 IGSF3 7.62 5.91
997 UBE2A 12.47 11.47
998 KBTBD8 12.82 9.73 12.82 11.71
999 PRR15 7.27 5.94 7.27 4.67
1000 ILF3 1 1.94 10.71
ID Gene Name Naive vs Germinal Center vs Germinal Center vs
Germinal Center Plasma Memory
Naive GC GC PC GC Memory
Average Average average Averaee Average Average
1001 WIPF1 13.81 12.41
1002 GCNT2 1 1.01 8.49
1003 DBNL 10.43 8.48
1004 C14orf43 10.14 8.01
1005 MIDI IP 1 9.16 8. 1 1
1006 LIMD2 10.43 8.88
1007 HNRPK 14.49 12.95 14.49 13.46
1008 Z F697 5.74 8.07
1009 TSHZ3 7.31 5.32
1010 MBNL2 1 1.88 13.47
101 1 ELL 7.83 9.1 7
1012 MAFB 7.30 8.56
1013 GGA2 13.25 10.77
1014 C20orfl 2 1 10.01 8.93
1015 CDC2L6 1 1.52 9.69
1016 TOB2 1 1.39 9.58
1017 MAP4K4 12.04 10.41
101S FAM102A 1 1.41 10.18
1019 ITGB3BP 1 1.86 10.76
1020 HIVEP1 10.35 9.05
1021 NUDT21 12.51 11.1 1
1022 EIF4A1 14.02 12.98
1023 TSPAN 14 8.38 6.31
1024 SLC2A4 G 8.98 7.40
1025 DGKZ 9.74 7.85
1026 PTPN9 9.30 7.85
1027 BCL7A 1 1.33 10.10
1028 LSM14A 12.74 1 1.19
1029 GNB2 1 1.50 10.12
1030 SLC6A6 1 1.35 8.51
1031 TACC1 13.21 1 1.62
1032 LIMK2 9.80 8.12
1033 ACVR2B 6.69 8.33
1034 SCC-1 12 12.25 10.55
10 5 PTBP1 13.38 12.19 13.38 12.21
1036 CITED 2 9.88 12.56
1037 SNX5 14.17 13.16
1038 ACTR2 15.12 13.32
1039 OSBPL3 10.59 12.84
1040 SFRS 1 14.60 13.24
1041 ADM 7.24 11.10
1042 PFKFB3 1 1.91 10.01
1043 FNBP1 13.61 12.25
1044 MTMR2 10.53 9.06
1045 DDHD1 10.18 8.74
1046 HSPA5 13.70 16.32
1047 PTK2 12.12 8.33
1048 UBE2I 13.1 7 1 1.22
1049 SNAP 23 13.78 12.23
1050 MTERFD2 10.53 8.59
ID Gene Name Naive vs Germinal Center vs Germinal Center vs
Germinal Center Plasma Memory
Naive GC GC PC GC Memory
Average Average average Average Average Average
105 ) COTL1 13.89 10 14
1052 PHACTR2 8.65 6.86
1053 GLRA2 5.93 7.69
1054 NUTF2 10.39 9.26
1055 TSGA14 9.52 8.03
1056 FKBP1A 12.16 10.89 12.16 10.82
1057 LRRC1 8.82 7.68
1058 PDIA6 13.07 14.91
1059 Y HAQ 14.50 12.99
1060 ACHE 5.59 8.29
1061 KRAS 12.36 10.49
1062 FAM107B 13.87 12.55
1063 CCDC 117 1 1.03 9.56
1064 WDR1 13.38 11.36
1065 HMGB1 16.36 14.98 16.36 14.97
1066 CCND3 12.69 9.79
1067 SUV39H1 9.28 8.07
1068 RANBP5 11.94 10.87
1069 SLC25A33 10.24 9.00
1070 EDNRA 5.94 7.12
1071 RABl lA 12.94 11.73
1072 DDEF1 11.98 10.54
1073 CXorfl S 11.84 10.47
1074 C4orf34 13.65 10.16
1075 SLC44A1 1 1.10 13.50
1076 EIF2AK3 12.29 13.83
1077 RAP1 B 14.21 13.21
1078 CDK2 10.20 8.73 10.20 9.01
1079 JDP2 7.94 ' 5.97
1080 GSTCD 8.86 7.85
1081 T KS2 10.95 9.62 10.95 9.62
1082 FUZ 7.15 8.96 7.15 8.19
1083 SYPL1 13.56 10.87
1084 EIF4H 13.07 12.02
1085 PIP5K2A 9.65 8.06
1086 RGS2 11.61 14.48
1087 ARF5 10.35 9.13
1088 JAK IP2 S.57 6.96
1089 RABGAP1 12.19 9.65 12.19 10.85
1090 LRIG1 9.76 10.77 10.77 9.16
1091 CLTA 13.08 11.71
1092 APBB2 7.87 6.39
1093 SMC1A 12.88 11.33
1094 CDC27 9.86 10.88
1095 STT3A 8.64 9.66
1096 ZFAND6 12.01 13.04 13.04 11.95
1097 BZRAP1 8.43 7.15
109S DPP3 9.41 10.44 10.44 8.39
1099 CNDi 11.94 12.98
1 100 TMEM16F 9.42 10.46
ID Gene Name N3»ve vs Germinal Center vs Germinal Center vs
Germinal Center Plasma Memory
Naive GC GC PC- GC Memory
Average Average average Average Average Average
1101 ARHGEF7 11.99 13.03 13.03 1118 13.03 11.60
1102 CAMTA1 10.60 11.64
1103 PFN1 14.03 15.08
1104 USP12 10.18 11.23
1105 AZIN1 11.24 12.29
1106 G A13 13.89 14.94 14.94 13.37
1107 RCOR1 10.46 11.51 11.51 9.96
1108 USP1 13.36 11.52
1109 VA GLl 7.47 9.15
1110 CAPZB 11.85 12.91
1111 CDV3 13.86 14.91
1112 ABI1 11.61 12.67 12.67 10.96
1113 ST5 7.21 8.28
1114 TTL 8.63 9.69 9.69 8.03
1115 ANP32E 12.76 13.82 13.82 12.19
1116 USP7 12.27 13.34
1117 BCL11B 7.20 8.27 8.27 9.68
1118 OAZ2 8.98 10.06
1119 PPP2CA 12.04 13.12 13.12 11.89
1120 TSC1 10.58 11.66
1121 CTDSPL2 9.81 10.90 10.90 9.51 10.90 9.68
1122 NEDD4L 7.81 8.90
1123 NAT 13 12.06 13.16
1124 ASF1A 9.54 10.64
1125 DPF1 7.1S 8.50 7.18 5.84
1126 RAN 13.46 14.57 14.57 12.39
1127 ELAVL1 11.66 12.77 12.77 11.43
1128 GRHL1 5.76 7.24
1129 SMAD2 10.45 11.57
1130 IQWD1 9.70 10.83 10.83 9.73
1131 ETS2 7.50 5.66
1132 CDC25B 10.04 11.18
1133 USP32 10.65 11.78 11.78 10.75
1134 EED 11.76 12.90 12.90 11.50
1135 CTNND2 5.93 7.81
1136 SHROOM3 7.86 9.01 9.01 6.05
1137 PSCD3 6.43 7.57
1138 ATF7 7.83 8.97
1139 CDK6 10.31 11.46
1140 GCH1 12.59 10.17
1141 AP3S1 11.95 13.12
1142 ARL6IP1 12.03 13.20 13.20 11.51
1143 TBC1D1 11.00 12.17 12.17 10.01
1144 ATP2A2 10.75 11.92 11.92 10.76
1145 SORL1 12.49 13.67 13.67 10.58
1146 SOX5 9.30 10.47 10.47 7.33 10.47 9.08
1147 KIAA1411 8.65 9.83
1148 KIAA0922 12.43 .13.61 13.61 10.86 13.61 12.35
1149 SSX IP 7.82 9.00 9.00 7.49
1150 SNRPD1 11.85 13.04
ED Gene Name Naive vs Germinal Center vs Germinal Center vs
Germinal Center Plasma Memory
Naive GC GC PC GC Memory
.Average Average average Averaee Average Average
1151 EDD1 11.23 12.42
1152 BLMH 9.01 10.21
1153 PTPLB 11.32 12.52
1154 SLC25A27 7.44 3.28
1155 PG AM 1 12.40 13.61 13.61 12.55
1156 HMGA1 11.26 12.47 12.47 10.36
1157 EDEMl 11.34 12.55
1158 PRPF38A 10.27 11.48 11.48 10.00
1159 DCU 1D1 9.82 11.03
1160 ROBOl 7.43 8.64
1161 LRRC59 11.26 12.65
1162 Z F207 12.29 13.51
1163 GTDCl 9.19 10.42 10.42 9.35
1164 Clorfl21 10.47 11.70
1165 NF1 9.23 10.46
1166 CUL3 12.98 14.21 14.21 12.80 14.21 12.99
1167 B4GALT5 8.74 9.97 9.97 8.08 9.97 8.71
1168 GADD45A 8.14 9.37 9.37 11.74
1169 RASD2 5.53 7.35
1170 CD4 6.76 8.01 8.01 6.11
1171 WWC1 6.16 7.S8
1172 DUSP2 9.43 10.69 10.69 9.18
1173 TP53INP2 8.44 9.70 9.70 8.53 9.70 8.00
1174 NRAS 8.89 10.16
1175 TFRC 12.12 13.39 13.39 11.88
1176 MASTL 8.76 10.03 10.03 8.23 10.03 8.64
1177 USP6 9.12 10.39 10.39 9.25
1178 VGLL4 10.30 11.57 11.57 10.16
1179 C10orf78 8.93 10.21
1180 BTG3 9.87 11.16
1181 TMOD2 8.64 9.93 9.93 6.94
1182 HOXA5 7.03 8.32
1183 AK2 10.33 11.62
1184 MAP2K1 10.41 11.71 11.71 10.69 11.71 10.61
1185 CASP3 10.16 11.47
1186 STK40 9.30 10.60 10.60 8.13
1187 GRHL3 5.20 7.46
1188 SLC25A4 8.65 9.96
1189 KLHDC5 9.52 10.83
1190 SAMHD1 9.72 11.03
1191 PHLPP 7.93 9.24 9.24 7.58
1192 CC El 7.86 9.18
1193 EGR1 11.92 13.24
1194 PIM1 9.44 10.76 10.76 8.87
1195 HECW1 6.49 7.81
1196 CHAC1 6.73 8.76
1197 P4HA2 6.84 8.18
1198 PPM IE 6.59 7.92
1199 KIAA0746 13.65 14.98
1200 LOC401720 6.33 7.63
ID Gene Name Naive vs Germinal Center vs Germinal Center vs
Germinal Center Plasma Memory
Naive GC GC PC GC Memory
Average Average average Averaee Average Average
1201 CAPN5 5.90 7.24
1202 DYNLL 1 12.69 14.03
1203 EHMT1 10.40 1 1.75
1204 RIC8B 7.54 8.89
1205 GRIN1 7.40 8.93
1206 DEK 12.73 14.09 14.09 10.29
1207 E2F1 7.01 8.37 8.37 7.21
1208 FAM45A 10.66 12.02
1209 VAMP1 1 1.10 12.47
1210 LTBP1 7.23 8.61
121 1 SOCS 1 9.18 10.56 10.56 9.25
1 212 ZCCHC 14 6.98 8.36
1213 LHL3 S.04 9.43
1214 RET 5.90 7.29 7.29 5.99
1215 CUTL1 10.33 1 1.72 1 1.72 10.67 1 1.72 10.50
1216 RBL1 7.58 8.98 B.9S 7.52 8.98 7.97 .
1217 TOPI 1 1.47 12.87
1218 GPD1 L 7.94 9.35
1219 SAR1 B 9.03 10.46 10.46 12.55
1220 MTF2 1 1.84 13.27 13.27 1 1 .18
1221 ANP32B 15.53 14.21
1222 err 8.19 9.63 9.63 7.43 9.63 7.77
1223 POU3F1 6.08 7.52
1224 MTMR12 1 1.44 12.89 12.89 1 1.13 12.89 1 1.60
1225 MBOAT2 6.73 8.17 8.17 6.25
1226 DOCK9 9.28 10.73
1227 ZAK 8.60 10.05 10.05 8.21
1228 LOCI 52485 1 1.05 12.51 12.51 10.56
1229 HNRPA3 14.33 12.26
1230 LMNB1 10.63 8.78
1231 ZFYVE21 8.42 9.90
1232 TXNDC5 12.47 16.40
1233 UBE2G1 1 1.36 12.84
1234 KIF23 7.44 8.93 8.93 5.57 8.93 6.64
1235 DPYSL2 9.98 1 1.46 1 1.46 9.03
1236 ATP5G3 12. 15 13.64
1237 GLRXS 10.08 1 1.57
1238 NLK 10.41 1 1.92
1239 ARL6IP6 10.51 12.02 12.02 10.43
1240 CNNM4 6.17 7.68 7.68 5.21
1241 TBC1 D4 9.12 10.64 10.64 8.94
1242 CD 163 5.49 7.00
1243 PKD2 8.17 9.71 9.71 7.48
1244 DIAPH3 S.23 9.77 9.77 8.34
1245 RAD23B 10.65 12.20 12.20 10.54
1246 DCAMKL2 5.53 7.08 7.08 5.S8
1247 LMBR1 7.22 8.77
1248 RRAS2 1 1.24 12.79 12.79 1 1 .03
1249 MYOID 6.31 7.88 7.88 10.07
1250 KLHL5 10.57 12.15 12.15 10.43 12.15 10.80
ID Gene Name Naive vs Germinal Center vs Germinal Center vs
Germinal Center Plasma Memory
Naive GC GC PC GC Memory-
Average Average average. Average Average Average
1251 EPS 15 12.32 13.91 13.91 12.70
1252 FASLG 5.47 7.06
1253 H2AFY 12.56 14.16
1254 LIMA1 8.47 10.07 10.07 9.06
1255 CDCA4 8.92 10.52 10.52 9.16
1256 HAS 3 5.70 7.31 7.31 6.15
1257 HRBL 5.96 7.57 7.57 6.35 7.57 5.97
1258 SYAP1 9.71 11.32 11.32 9.76
1259 MDFIC 12.06 13.67
1260 FAM76B 11.27 12.89 12.89 10.52
1261 SNTB2 8.22 9.85 9.85 8.64
1262 A L3 8.92 10.55
1263 GPR124 5.50 7.14
1264 BCL2L11 10.79 12.43 12.43 1 1.14
1265 R F103 12.03 13.23
1266 YB 6.97 8.62 8.62 5.61
1267 PKM2 1 1.21 12.87
1268 VCL 8.92 10.57 10.57 8.25
1269 RBBP7 12.45 14.1 1 14.1 1 12.96 14.1 1 12.70
1270 LBR 12.86 14.53 14.53 12.16 14.53 12.50
1271 RRBP1 6.97 8.64 8.64 11.94
1272 GABRB3 5.33 7.00
1273 SGCB 7.7S 9.45 9.45 8.22
1274 FAM81A 6.61 8.30 8.30 5.44
1275 RAB15 5.75 7.44
1276 SOX9 6.72 8.42
1277 SAP30 8.22 9.91
1278 BRWD1 8.60 10.30 10.30 8.72 10.30 9.04
1279 KCNMAl 7.47 9.17 9.17 10.42
1280 WHSC1 9.67 11.37 1 1.37 9.60
1281 CCDC 126 9.36 11.09
12S2 GRAMD1C 7.83 9.57
1283 PHF19 8.9S 10.73 10.73 9.18
1284 ADAM23 7.02 8.77 8 77 7.00
1285 C9orfl 50 5.38 7.13
1286 ZNF 72 6.52 8.30 S.30 6.S2
1287 STK39 9.3S 11.15 1 1.15 9.40
1288 SMS 9.73 11.54
1289 DMD 8.96 10.77 10.77 9.32
1290 ClorfB3 6.15 7.96
1291 MFHAS1 9.80 11.61 11.61 9.36
1292 STXBP1 6.57 7.79
1293 CPNE2 5.44 7.27 7.27 4.84
1294 MYH10 7.07 8.90 8.90 7.S5
1295 CALM3 9.63 11.46 11.46 10.30
1296 EFNB2 7.01 8.85
1297 ACTN1 5.89 7.74
1298 RBMS3 5.67 7.51
1299 AC0T7 9.70 7.83
1300 RKHDl 5.92 7.77
ID Gene Name Naive vs Germinal Center v Germinal Center vs
Germinal Center Plasma Memory
Naive GC GC PC GC Memory
Average Average average Averaee Average Average
1301 LRRK 1 9.74 1 1.62 1 1.62 10.12
1302 PTCHl 7.70 9.58
1303 MGLL 7.30 9.18 9.18 10.57 9.18 8.06
1304 YWHAH 8.94 10.82 10.82 9.09
1305 PDE4D 6.78 8.66
1306 MAF 8.05 9.95 9.95 8.25
1307 PTGER3 5.18 7.09 7.09 6.06
130S PRKCD 9.49 1 1.40
1309 CCDC64 8.15 10.07 10.07 7.55
1310 ASL1 1 A 7.89 6.65
131 1 KPNA2 1 1.18 13.09 13.09 1 1 .78 13.09 1 1 55
1312 GPR137B 8.65 10.58 10.58 9.36
1313 TIAM1 6.97 8.90
1314 TFDP1 10.95 12.90 12.90 10.49
1315 SSBP2 10.47 12.42 12.42 10.32
1316 REE PI 5.64 7.61
1317 MAP2 7.85 9.83 9.83 7.75
1318 HOXA9 5.15 7.12
1319 SCR 1 1 1.81 9 54
1320 LOCI 29607 8.79 10.78 10.78 9.33 10.78 9.45
1321 SIAH2 10.35 12.34 12.34 10.57
1322 DKFZP564O0823 6.96 8.95
1323 . POLQ 8.30 10.30 10.30 8.98 10.30 7.83
1324 KLF15 5.8S 7.88 7.88 9.36 7.88 6.74
1325 PXDN 8.36 10.37
1326 BTBD12 8.06 10.08 10.08 8.56
1327 PHF6 1 1.19 13.21 13.21 1 1.96 13.21 12.09
132S SLC41 A2 5.67 7.68
1329 H 1 9.87 1 1.92 1 1.92 9.85 1 1.92 10.58
1330 ZNF608 8.98 11.07 1 1.07 9.74
1331 RNGTT 10.32 12.45
1332 RAP2A 10.35 12.47
1333 LIMK1 5.18 7.36 7.36 5.05
1334 SMAD1 5.91 8.10 8.10 6.34
1335 NCOA7 10.39 12.58
1336 PRDM15 10.29 12.49
1337 PEUl 10.67 12.88
1338 PLS1 5.43 7.65 7.65 4.53
1339 RAB23 6.14 8.36
1340 NAP1L5 7.40 9.63 9.63 8.30 9.63 8.34
1341 DNER 6.90 9.14
1342 LRRC'42 7.58 9.83
1343 ID2 7.74 9.99
1344 IBRDC2 9.98 12.24 12.24 8.84 12.24 9.94
1345 DNMT1 1 1.21 13.50
1 346 STAC 3 5.74 8.02 8.02 7.01
1347 HMGB3 8.20 10 50 10.50 8.80 10.50 8.08
1348 BMPR1A 6.75 9.06
1349 SGK 10.06 12.37
1350 CBX2 6.06 8.37 8.37 6.38
ID Gene Name Naive vs Germinal Center vs Germinal Center vs
Germinal Center Plasma Memory
Naive GC GC PC GC Memory
Average Average average Average Average Average
1351 LRRC20 5.69 8.03
1352 LRRC4 4.81 7.15 7.1 5 5.05
1353 HOXA1 5.36 7.70
1354 LRRC62 4.95 7.30
1355 ATAD2 9.00 11.34 1 1.34 8.44 1 1.34 9.37
1356 MOBKL1A 9.73 12.08 12.08 9.13 12.08 10.12
1357 LOC220594 10.06 12.41 12.41 10.07
1358 ZNF804A 6.14 8.51
1359 Clorfl l3 5.99 8.36 8.36 5.74
1360 FMNL2 6.58 8.96
1361 H2AFX 12.49 10.60
1362 ATP1B1 5.60 8.03
1363 GPT2 6.54 S.97
1 364 PSRC1 9.89 7.46
1365 SLC2 A35 5.23 7.68
1366 LHFPL2 8.94 1 1.41
1367 UBE2J1 1 1.34 13.81 13.81 12.22
136S TBC1 D8B 5.43 7.91 7.91 6.89
1369 SGPP1 10.96 13.46 13.46 1 1 .28
1370 Cl lorf9 4.74 7.24
1371 BCL6 12.29 14.82 14.82 10.60 14.82 1 1.78
1 372 ANUBL1 8.12 10.66 10.66 8.78
1373 MTA3 8.37 10.92
1374 PGBD5 4.87 7.45 7.45 5.87
1375 LPP 11.00 13.59 13.59 10.07 13.59 10.89
1376 NDFIP2 7.39 9.99
1377 ST N1 1 1.76 9.03
1378 PITP C1 8.77 1 1.42 1 1.42 10.00
1379 SH3RF1 7.37 10.05 10.05 8.10
1380 ASF1B S.56 1 1.25 11.25 7.91 1 1.25 8.27
1381 FLJ20186 12.06 14.82 14.82 12.05
1382 SLC16A2 8.08 5.17
1383 PEX5 9.12 1 1.90 1 1.90 9.50
1384 ECT2 7.45 10.23 10.23 7.70 10.23 7.63
1385 MAML3 S.05 10.85
1386 TEAD1 4.42 7.24
1387 HMGB2 12.96 15.7S 15.78 12.73 15.7S 13.36
138S NCALD 5.15 7.97
1389 RGC32 7.75 10.62
1390 PPP1R3C 4.18 7.06
1391 DEPDC1B 9.96 7.1 1
1392 WEE 1 10. 1 1 13.01 13.01 10.32 13.01 1 1.84
1 93 FHL2 4.82 7.77
1394 ITGB8 4.70 7.66
1395 SLC1A 1 10.86 8.88
1396 FAM83D 7.36 10.32
1397 UHRFl 12.22 8.72
1398 C7orf41 4.94 7.95 7.95 6.29
1399 ZBTB8 5.5 S 8.59 8.59 1 1.07
1400 Z F367 7.97 10.99 10.99 8.04 10.99 8.22
ID Gene Name Naive vs Germinal Center vs Germinal Center v s
Germinal Center Plasma Memory
Naive GC GC PC GC Memory
Average Average average Average Average Average.
1401 CDC25A 6.03 9.09 9.09 6.81
1402 CHEK1 7.59 10.68 10.68 7.72
1403 CDC A 7 10.61 13.76 13.76 10.16 13.76 1 1.06
1404 FGF13 4.55 7.69
1405 SSBP3 6.20 9.35
1406 EZH2 9.40 12.57 12.57 10.22
1407 TNFSF1 1 5.18 8.36 8.36 5.91 8.36 9.78
1408 PACSI 1 5.16 8.35
1409 RRM2 10.59 13 82 13.82 9.47 13.82 10.79
1410 POU4F 1 5.62 8.85
141 1 YBL2 9.07 12.41 12.41 9.12
1412 KIAA1212 8.46 1 1.81 1 1.81 8.55
1413 CCNE2 7.30 10.66 10.66 8.02 10.66 8.03
1414 IGF2BP3 7.92 11.34 1 1.34 9.93 11.34 9.55
1415 PRKAR2B 6.17 9.66 9.66 8.16
1416 CADPS 5.04 8.58 8.58 6.18
1417 ANKRD15 6.97 10.52 10.52 7.58
1418 DAAM1 9.33 12.92
1419 MAP IB 4.05 7.68 7.68 5.03 7.68 6.23
1420 AFF2 6.32 10.00
1421 E2F7 5.66 9.37 9.37 6.53 9.37 6.89
1422 PRC 1 8.37 12.08
1423 ENPP5 3.54 7.26 7.26 4.97
1424 E2F8 7.68 1 1.41
1425 MED12L 7.82 11.59 1 1.59 7.46 1 1.59 10.57
1426 LOCI 62073 6.30 10.08
1427 LRRC32 4.14 7.93 7.93 6.61 7.93 4.95
1428 DMXL2 6.57 10.38 10.38 6.61 10.38 7.76
1429 FLJ20366 7.86 11.68 1 1.68 7.62 11.68 9.86
1430 TOX 9.05 12.88 12.SS 11.27
1431 MME 11.56 10.33
1432 FGD6 7.63 11.73 11.73 9.12
1433 MYBL1 9.68 14.13 14.13 10.02 14.13 9.72
Table 16: Predictor microRNAs that distinguish activated B-cell (ABC) DLBCL from germinal center B-cell (GCB) DLBC
ABC vs GCB Higher
in
hsa-miR-93/mmu-miR-93/rno-miR-93 GCB
hsa-miR-331 -3p/mmu-miR-331 -3p/rno-miR-33 1 GCB
hsa-miR- 129* GCB
hsa-miR-423-3p/mmu-miR-423-3p/rno-miR-423 GCB
hsa-miR-28-5p/mmu-miR-28/rno-miR-28 GCB
mghv-miR-M l -7-3p GCB
hsa-miR-518b GCB
ebv-miR-BHRF l - 1 GCB
hsa-miR- 140-5p/mmu-miR- 140/rno-miR- 140 GCB
hsa-miR-505* GCB
hsa-miR-675 GCB
hsa-miR- 198 GCB
hsa-miR- 125b- 1 */mmu-miR- 125b-3p/rno-miR- GCB
125b-3p
hsa-miR-361 -5p/mmu-miR-361/rno-miR-361 GCB
ebv-miR-BART8* GCB
Table 17: Predictor microRNAs that distinguish activated B-cell (ABC) DLBCL from Burkitt lymphoma
ABC vs BL ABC vs BL (con't) Higher in hsa-miR- 155 hsa-miR- 142-3p/mmu-miR- ABC
142-3p/rno-miR- 142-3p
hsa-miR-29c/mmu-miR- hsa-!et-7a/mmu-!et-7a/rno-Iet- ABC
29c/rno-miR-29c 7a
hsa-miR- 146b-5p/mmu-mi hsa-miR-30b/mmu-miR- ABC
146b/rno-miR- 146b 30b/rno-miR-30b-5p
hsa-miR-29b/mmu-miR- hsa-miR- 142-5p/mmu-miR- ABC
29b/rno-miR-29b 142-5p/rno-miR- I 42-5p
hsa-miR-22/rnmu-miR- hsa-miR-34b/mmu-miR-34b-3p ABC
22/rno-miR-22
hsa-miR-21 /mmu-miR- hsa-miR- 16/mmu-miR- 16/rno- ABC
21 /rno-miR-21 miR- 16
hsa-miR-768-3p hsa-miR-30c/mmu-miR- ABC
30c/rno-miR-30c
hsa-miR- 145/mmu-miR- hsa-let-7c/mmu-let-7c/rno-let- ABC
145/rno-miR- 145 7c
hsa-miR-29a/mmu-miR- hsa-miR-550 ABC
29a/rno-miR-29a
hsa-miR-30e/mmu-miR- hsa-miR-921 BL
30e/rno-miR-30e
hsa-miR-26a mrnu-miR- hsa-miR-30c-2*/mmu-miR- BL
26a/rno-miR-26a 30c-2*/rno-miR-30c-2*
hsa-miR- 101 /mmu-miR- hsa-miR-933 BL l O l a/rno-miR- l O l a
hsa-miR-24/mmu-rniR- hsa-miR-658 BL
24/rno-miR-24
hsa-miR-26b/rnmu-miR- hsa-miR-628-3p BL
26b/rno-miR-26b
hsa-miR-27a/mmu-miR- hsa-miR-503 BL
27a/rno-miR-27a
hsa-rniR-27b/mmu-miR- hsa-miR- 193a-5p BL
27b/rno-miR-27b
hsa-miR-23b/mrnu-miR- hsa-miR-30b* BL
23b/rno-miR-23b
hsa-miR-23a/mmu-miR- hsa-miR-93/mmu-miR-93/rno- BL
23a/rno-miR-23a miR-93
hsa-miR- 125b/mmu-miR- hsa-miR- 18b BL
125b-5p/rno-miR- 125b-5p
hsa-miR-30a/mmu-miR- hsa-miR- 18a/mmu-miR- BL
30a/rno-miR-30a 1 8a/rno-miR- 18a
hsa-miR-874/mmu-miR- BL 874/rno-miR-874
Table 18: Predictor microRNAs that distinguish activated B-cell (ABC) DLBCL from chronic lymphocytic leukemia
ABC vs CLL Higher ABC vs CLL (con't) Higher ABC vs CLL (con't) High in in in hsa-miR- 125b/mmu-miR- hsa-miR- 142- hsa-miR-340/mmu- *
125b-5p/rno-miR- 125b-5p 5p/mmu-miR- 142- miR-340-5p/rno-miR-
ABC 5p/rno-miR- 142-5p CLL 340-5p CLL hsa-miR- 126/mmu-miR- hsa-miR- 101 /mmu- hsa-miR-33 1 -
126-3p/rno-miR- 126 miR- l Ol a/rno-miR- 3p/mmu-miR-331 -
ABC 101 a CLL 3p/rno-miR-331 CLL hsa-miR- 199a-3p/hsa- hsa-miR- 185/mmu- hsa-miR- 151 - miR- 199b-3p/mmu-miR- miR- 185/rno-miR- 185 5p/mmu-miR- 151 -
199a-3p/mmu-miR- 5p/rno-miR- 1 51
199b/rno-miR- 199a-3p ABC CLL CLL hsa-miR- 145/mmu-miR- hsa-miR-888* hsa-miR-636
145/rno-miR- 145 ABC CLL CLL hsa-miR- 143/mmu-miR- hsa-miR- 199a- hsa-miR-33a/mmu-
143/rno-miR- 143 5p/mmu-miR- 199a- miR-33/rno-miR-33
ABC 5p/rno-miR- 199a-5p CLL CLL hsa-miR-637 hsa-miR-668/mmu- hsa-miR-486-
ABC miR-668 CLL 5p/mmu-miR-486 CLL hsa-miR-371 -5p hsa-miR-549 hsa-miR- 150/mmu- miR- 150/mo-miR-
ABC CLL 150 CLL kshv-miR- 12-6-3p hsa-miR-801 /mmu- hsa-miR-25/mmu-
ABC miR-801 CLL miR-25/rno-miR-25 CLL hsa-miR-628-3p hsa-miR-649 hsa-miR-331 -
ABC CLL 5p/mmu-miR-331 -5p CLL hsa-miR- 126*/mmu-miR- hsa-miR-625* hsa-miR-299-
126-5p/rno-miR- 126* 5p/mmu-miR-
ABC CLL 299*/rno-miR-299 CLL hsa-miR- 193a-5p hsa-miR- 140- hsa-miR-891 a
3p/mmu-miR-
ABC 140*/rno-miR- 140* CLL CLL hsa-miR-21 /mmu-miR- hsa-let-7f/mmu-let- hsa-miR- 144*
21 /rno-miR-21 ABC 7f/rno-let-7f CLL CLL hsa-miR-24/mmu-miR- hsa-miR-768-5p hsa-miR-363*/rno-
24/rno-miR-24 ABC CLL miR-363 * CLL hsa-miR-503 hsa-miR-24- 1 */mmu- hsa-miR-93/mmu- miR-24-1 */rno-miR- miR-93/rno-miR-93
ABC 24- 1 * CLL CLL hsa-miR-23a/mmu-miR- ebv-miR-BART13 hsa-miR-423-
23a/rno-miR-23a 3p/mmu-miR-423-
ABC CLL 3p/rno-miR-423 CLL hsa-miR-23b/rnmu-miR- hsa-miR-339- hsa-let-7g/mmu-let-
23b/rno-miR-23b 5p/mmu-miR-339- 7g
ABC 5p/rno-miR-339-5p CLL CLL hsa-miR-22/mmu-miR- hsa-miR-20b/mmu- hsa-miR-28-5p/mmu-
22/rno-miR-22 miR-20b/rno-miR- miR-28/rno-miR-28
ABC 20b-5p CLL CLL
ABC vs CLL Higher ABC vs CLL (con 't) Higher ABC vs CLL (con't)
in in in iR-665 hsa-miR-335/mmu- hsa-miR-20b*
miR-335-5p/rno-miR-
ABC 335 CLL CLL hsa-let-7c/mmu-let-7c/rno- mghv-miR- l -8 hsa-miR- 140- let-7c 5p/mmu-miR-
ABC CLL 140/rno-miR- 140 CLL sa-miR-658 hsa-miR-30d/mmu- hsa-miR-519d
ABC miR-30d/rno-miR-30d CLL CLL hsa-let-7a/mmu-let-7a/rno- hsa-miR-363/mmu- hsa-miR- 147
let-7a ABC miR-363/rno-miR-363 CLL CLL mghv-miR- l -4 hsa-miR-361 -3p hsa-miR-487b/mmu- miR-487b/rno-miR-
ABC CLL 487b CLL hsa-miR-933 hsa-miR- 107/mmu- hsa-miR-361 - miR- 107/rno-miR- 107 5p/mmu-miR-
ABC CLL 361 /rno-miR-361 CLL hsa-miR-550 hsa-miR- 154/mmu- hsa-miR- 186/mmu- miR- 154/rno-miR- 154 miR- 186/rno-miR-
CLL CLL 186 CLL hsa-miR-30e/mrnu-miR- hsa-miR-638 hsa-miR-32/mmu- 30e/rno-miR-30e CLL CLL miR-32/rno-miR-32 CLL hsa-miR- 129* CLL hsa-miR-30e*/mmu- miR-30e*/rno-miR-
30e* CLL hsa-miR- 196a*/mmu- miR- 196a*/rno-miR- 196a* CLL
Table 19: Predictor microRNAs that distinguish activated B-cell (ABC) DLBCL from follicular lymphoma
ABC vs FL Higher ABC vs FL (con't) Higher ABC vs FL (con 't) Higher in in in hsa-miR-938 hsa-miR-518b hsa-miR-98/mmu-
ABC FL miR-98/rno-miR-98 FL hsa-miR- 1 83*/mmu-miR- hsa-miR- 194/mmu- hsa-let-7g/mmu-let-7g
183* miR- 194/rno-miR-
ABC 194 FL FL hsa-miR- 197/mmu-miR- hsa-miR-647 hsa-miR-302a/mmu- 197 ABC FL miR-302a FL hsa-miR-382/mmu-miR- kshv-miR- 12-6-5p hsa-miR-625 *
382/rno-miR-382 ABC FL FL hsa-miR-20b* ABC hsa-miR-622 FL hsa-miR-30b* FL hsa-miR-524-5p hsa-miR-5 16b hsa-miR-30b/mmu- mi R-3 Ob/rno-mi R-
ABC FL 30b-5p FL hsa-miR-337-3p ABC hsa-miR-675 FL hsa-miR-377* FL hsa-miR-600 hsa-miR-526b hsa-miR- 106b*/mmu- miR- 106b*/rno-miR-
ABC FL 106b* FL hsa-miR-96/mmu-miR- hsa-miR-671 - hsa-miR- 18 l a-2*
96/rno-miR-96 ABC 5p/mmu-miR-671 -5p FL FL mghv-miR-M l -8 hsa-miR-1 8a/mmu- hsa-miR-887
miR-18a/rno-miR-
ABC 18a FL FL hsa-miR-29c*/mmu-miR- hsa-miR- 18b hsa-miR-208a/mmu- 29c*/rno-miR-29c* miR-208a/rno-miR-
ABC FL 208 FL hsa-miR-575 hsa-miR- 1 81 b/mmu- ebv-miR-BART7*
miR- 181 b/rno-miR-
ABC 181 b FL FL hsa-miR-51 8a-3p ABC hsa-miR-215 FL hsa-miR-7-2* FL hsa-miR-361 -5p/mmu-miR- hsa-miR- 1 53/mmu- hsa-miR- 155*
361/rno-miR-361 miR- 153/rno-miR-
ABC 153 FL FL hsa-miR- 193b* ABC hsa-miR-625 FL hsa-miR-513a-3p FL hsa-miR-340*/mmu-miR- hsa-miR-5 10 kshv-miR-K 12-7
340-3p/rno-miR-340-3p ABC FL FL hsa-miR-708/mmu-miR- hsa-miR-519d hsa-miR-299-3p
708/rno-miR-708 ABC FL FL hsa-miR- 129* mghv-miR-M 1 -7-3p hsa-miR-218-2*/mmu- miR-21 8-2*/rno-miR-
ABC FL 21 8* FL hsa-miR-525-5p hsa-miR-485- hsa-miR-1 30b*/mmu- ABC 3p/mmu-miR-485* FL miR- 130b* FL hsa-miR-497/mmu-miR- hsa-miR-483-5p hsa-miR-620
497/rno-miR-497 FL FL FL
ABC vs FL Higher ABC vs FL (con't) Higher ABC vs FL (con't) Hi! in in 1 in hsa-miR-22*/mmu-miR- hsa-miR- 140- hsa-miR-33a/mmu-
22*/rno-miR-22* 5p/mmu-miR- miR-33/rno-miR-33
FL 140/rno-miR- 140 FL FL hsa-miR- 130b/mmu-miR- hsa-miR-921 hsa-miR-7/mmu-miR-
130b/rno-miR- 130b FL FL 7a/rno-miR-7a FL hsa-miR-551 b* hsa-miR- 186/mmu- ebv-miR-BART6-3p
miR- 186/rno-miR-
FL 186 FL FL hsa-miR-331 -3p/mmu-miR- hsa-miR- 196a*/mmu- hsa-miR-22/mmu-
331 -3p/rno-miR-331 miR- 196a*/rno-miR- miR-22/rno-miR-22
FL 196a* FL FL ebv-miR-BART 13 hsa-miR-381/mmu- hsa-miR- 199b-5p
miR-381 /rno-miR-
FL 381 FL FL hsa-miR-877/mmu-miR- hsa-miR-620 hsa-miR-768-3p
877/rno-miR-877 FL FL FL hsa-miR-636 hsa-miR- ί 52/mmu- hsa-miR-494/mmu- miR- I 52/rno-miR- miR-494/rno-miR-494
FL 152 FL FL hsa-miR-922 FL hsa-miR-766 FL hsa-miR-602 FL hsa-miR- 198 mghv-miR-M 1 -7-5p hsa-miR- 125b-2*/rno-
FL FL miR- 125b* FL hsa-miR-342-5p/mmu-miR- hsa-miR-374b/mmu- hsa-miR-300
342-5p/rno-miR-342-5p miR-374/rno-miR-
FL 374 FL FL hsa-miR-585 hsa-let-7c/mmu-let- hsa-let-7e/mmu-let-
FL 7c/rno-let-7c FL 7e/rno-let-7e FL ebv-miR-BART8* FL kshv-miR-K.12-8 FL hsa-miR-298 FL hsa-miR-617 FL mghv-miR-M 1 -3 FL hsa-miR-576-3p FL hsa-miR-221 * FL hsa-miR-920 FL hsa-miR- 187* FL hsa-miR- 125b- 1 Vmmu- hsa-miR-519e* hsa-miR-365/mmu- miR- 125b-3p/rno-miR- miR-365/rno-miR-365
125b-3p FL FL FL hsa-miR-93/mmu-miR- hsa-miR- 147 hsa-miR-518a-5p/hsa-
93/mo-miR-93 FL FL miR-527 FL hsa-miR-363*/rno-miR- hsa-miR-424 hsa-miR-302d*
363* FL FL FL hsa-miR-744/mmu-miR- hsa-miR- 193b hsa-miR- 105
744 FL FL FL hsa-miR-659 ebv-miR-BART 19-3p hsa-miR- 126/mmu- miR- 126-3p/rno-miR-
FL FL 126 FL hsa-miR-490-3p/mmu-miR- hsa-miR- 146b-3p hsa-miR- 107/mmu-
490 FL FL miR- 107/rno-miR- 107 FL hsa-let-7d/mmu-let-7d/rno- hsa-miR-30c/mmu- hsa-miR-299-5p/mmu- let-7d m i R-3 Oc/rno-m i R- miR-299*/rno-miR-
FL 30c FL 299 FL
ABC vs FL Higher ABC vs FL (con't) Higher ABC vs FL (con't) Higher in in in hsa-miR-361 -3p hsa-miR-30a/mmu- hsa-miR-28-3p/rno- miR-30a rno-miR- miR-28*
FL 30a FL FL ebv-miR-BHRF l -1 hsa-miR-939 hsa-miR-21 /mmu- FL FL miR-21 /rno-miR-21 FL hsa-miR-92b/mmu-miR- hsa-let-7a/mmu-let- hsa-miR-27b/mmu- 92b/rno-miR-92b FL 7a/rno-let-7a FL miR-27b/rno-miR-27b FL hsa-miR- 151 -5p/mmu-miR- hsa-miR- 122* hsa-miR-516a-5p
151 -5p/rno-miR- 151 FL FL FL hsa-miR-144* hsa-m i R-206/mm u- hsa-miR- 129-5p/mmu- miR-206/rno-miR- miR- 129-5p/rno-miR-
FL 206 FL 129 FL hsa-miR-425/mmu-miR- ebv-miR-BARTl 8-3p hsa-miR-583
425/rno-miR-425 FL FL FL hsa-miR- 138/mmu-miR- hsa-miR- 183/mmu- hsa-miR-483-3p
138/rno-miR- 138 miR- 183/rno-miR-
FL 183 FL FL hsa-miR-92a/mmu-miR- hsa-miR-9*/mmu- hsa-miR-326/mmu- 92a/rno-miR-92a FL miR-9*/rno-miR-9* FL miR-326/rno-miR-326 FL hsa-miR- 15 l -3p FL kshv-miR- 12- l FL hsa-miR-548d-5p FL hsa-miR-25/mmu-miR- hsa-miR-34c- hsa-miR-629
25/rno-miR-25 5p/mmu-miR-
FL 34c/rno-miR-34c FL FL hsa-miR-509-3-5p FL hsa-miR-934 FL ebv-miR-BART5 FL hsa-miR-30e*/mmu-miR- hsa-miR-890 hsa-miR-665
30e*/rno-miR-30e* FL FL FL hsa-miR-28-5p/mmu-miR- hsa-miR-514 hsa-m iR-493
28/rno-miR-28 FL FL FL hsa-miR-200b*/mmu-miR- hsa-miR-297/mmu- hsa-miR-484/mmu-
200b* FL miR-297a FL miR-484/rno-miR-484 FL hsa-miR- 148b/mmu-miR- hsa-miR-553 hsa-miR-645
148b/rno-miR- 148b-3p FL FL FL hsa-miR-488 FL hsa-miR-765 FL hsa-miR-452 FL hsa-miR-99b/mmu-miR- hsa-let-7b*/mmu-let- hsa-miR-518c*
99b/rno-miR-99b FL 7b*/rno-let-7b* FL FL hsa-miR-339-5p/mmu-miR- hsa-miR-500* hsa-miR-24-2*/mmu-
339-5p/rno-miR-339-5p miR-24-2*/rno-miR-
FL FL 24-2* FL hsv l -miR-H l hsa-miR-601 hsa-miR- 124/mmu- FL FL miR- 124/rno-miR- 124 FL hsa-miR-32/mmu-miR- ebv-miR-BHRFl -3 hsa-miR- 1 84/mmu-
32/rno-miR-32 FL FL miR- 1 84/rno-miR- 1 84 FL hsa-miR-885-5p hsa-miR-296- hsa-miR-27a*/mmu-
3p/mmu-miR-296- niiR-27a*/rno-miR-
FL 3p/rno-miR-296 FL 27a* FL hsa-miR-630 hsa-miR-574- hsa-miR-25*
FL 5p/mmu-miR-574-5p FL FL
ABC vs FL Higher ABC vs FL (con't) Higher ABC vs FL (con't) Higher in in in ebv-miR-BART16 hsa-miR-409- hsa-miR-34b/mmu-
5p/mmu-miR-409- miR-34b-3p
FL 5p/rno-miR-409-5p FL FL hsa-miR-505* FL hsa-miR- 195* FL ebv-miR-BART 17-5p FL hsa-miR-374b* FL hsa-miR-635 FL hsa-miR-658 FL hsa-miR-574-3p/mmu-miR- hsa-miR-542- hsa-miR-212/mmu- 574-3p 3p/mmu-miR-542- miR-212/rno-miR-212
FL 3p/rno-miR-542-3p FL FL hsa-miR-874/mmu-miR- hcmv-miR-US25- l * hsa-miR-99a/mmu-
874/rno-tniR-874 FL FL miR-99a/rno-miR-99a FL hsa-miR-423-3p/mmu-miR- mghv-miR-M l -2 hsa-miR-801 /mmu-
423-3p/rno-miR-423 FL FL miR-801 FL hsa-miR-889 FL hsa-miR-509-5p FL hsa-miR-491 -3p FL hcmv-miR-UL 148D hsa-miR-340/mmu- hsa-miR-551 b/mmu- miR-340-5p/rno- miR-551 b/rno-miR-
FL miR-340-5p FL 551 b FL hsa-miR-487b/mmu-miR- hsa-miR-891 a hsa-miR-214/mmu-
487b/rno-miR-487b FL FL miR-214/rno-miR-214 FL hsa-miR-552 hsa-miR-23a/mmu- hsa-miR-30e/mmu- m i R-23 a/rno-m i R- miR-30e/rno-miR-30e
FL 23a FL FL hsa-miR-220b hsa-miR- 19b/mmu- hsa-miR-888*
miR- 19b/rno-miR-
FL 19b FL FL hsa-miR-551 a hsa-miR-515-5p hsa-miR-505/rno-miR- FL FL 505 FL hsa-let-7d*/mmu-let- hsa-miR-23b/mmu- hsa-miR-27a/mmu- 7d*/rno-let-7d* m i R-23 b/rno-mi R- miR-27a/rno-miR-27a
FL 23b FL
kshv-miR- 12-5 hsa-miR-498 hsa-miR- 15a/mmu- FL FL miR- 15a
hsa-miR-629* hsa-miR-886-5p hsa-m i R-20a/mmu- FL FL miR-20a/rno-miR-20a hsa-miR-99b*/mmu-miR- hsa-miR-220c kshv-miR- 12-3
99b*/rno-miR-99b* FL FL
hsa-miR-61 5-3p/mmu-miR- hsa-miR- 1 Oa/mmu- hsa-miR-455
615-3p m i R- 1 Oa/rno-m i R-
FL 10a-5p FL FL hsa-miR-657 hsa-miR-32* hsa-miR-486-5p/mmu- FL FL miR-486 FL hsa-miR-301 a/mmu-miR- hsa-miR-24/mmu- 301 a/rno-miR-301 a FL miR-24/rno-miR-24 FL
Table 20: Predictor microRNAs that distinguish activated B-cell (ABC) DLBCL from Hodgkin's lymphoma
ABC vs HL Higher ABC vs HL (con't) Higher ABC vs HL (con't) Hig in in ii hsa-miR- 19b/mmu-miR- hsa-miR-934 hsa-miR-488
19b/rno-miR- 19b ABC HL HL hsa-miR-30b/mmu-miR- hsa-miR-328/mmu-miR- hsa-miR- 125a-
30b/mo-miR-30b-5p 328/rno-miR-328 3p/mmu-miR- 125a-
ABC HL 3p/rno-miR- 125a-3p HL hsa-miR-142-3p/mmu- hsa-miR- 187* hsa-miR-24-2*/mmu- miR- 142-3p/rno-miR- 142- miR-24-2*/rno-miR-
3p ABC HL 24-2* HL hsa-miR-768-3p kshv-miR-K.12-3 hsa-miR-484/mmu- miR-484/rno-miR-
ABC HL 484 HL hsa-miR-30c/mmu-miR- hsa-miR-373 * hsa-miR- 106b*/mmu-
30c/rno-miR-30c miR- 106b*/rno-miR-
ABC HL 106b* HL hsa-miR-29b/mmu-miR- hsa-miR-96/mmu-miR- hsa-miR-600
29b/rno-miR-29b ABC 96/rno-miR-96 HL HL hsa-miR-24/mmu-miR- hsa-miR- 186/mmu-miR- hsa-let-7b*/mmu-let-
24/rno-miR-24 ABC 186/mo-miR- 1 86 HL 7b*/rno-let-7b* HL hsa-miR-22/mmu-miR- hsa-miR-886-5p hsa^miR-302c*
22/rno-miR-22 ABC HL HL hsa-miR-30e/mmu-miR- hsa-miR-424 hsa-miR-20b* .
30e/rno-miR-30e ABC HL HL hsa-miR-30a/mmu-miR- hsa-miR- 147 hsa-miR-524-5p
30a/rno-miR-30a ABC HL HL hsa-miR-26b/mmu-miR- hsa-miR-340/mmu-miR- hsa-miR-505 *
26b/rno-miR-26b ABC 340-5p/rno-miR-340-5p HL HL hsa-rniR-26a/rnmu-miR- hsa-miR- 129-5p/mmu- hsa-miR-542-
26a/rno-miR-26a miR- 129-5p/rno-miR- 129 5p/mmu-miR-542-
ABC HL 5p/rno-miR-542-5p HL hsa-miR- 15a/mmu-miR- hsa-miR-25* hsa-miR-557
15a ABC HL HL hsa-miR- 16/mmu-miR- hsa-miR- 193b hsa-miR- 183/mmu-
16/rno-miR-16 miR- 183/rno-miR-
ABC HL 183 HL hsa-miR-142-5p/mmu- hsa-miR-574-5p/mmu- hsa-miR- 122*
miR- 142-5p/rno-miR- 142- miR-574-5p
5p ABC HL HL hsa-miR-29a/mmu-miR- hsa-miR-589 hsa-miR-675
29a/rno-miR-29a ABC HL HL hsa-miR- 101 /mmu-miR- hsa-miR-339-5p/mmu- hsv l -miR-H l
l O l a/rno-miR- l O l a miR-339-5p/rno-miR-
ABC 339-5p HL HL hsa-miR- 126/mmu-miR- hsa-miR-34c-5p/mmu- hsa-m i R-99b/mmu-
126-3p/rno-miR- 126 miR-34c/rno-miR-34c miR-99b/rno-miR-
ABC HL 99b HL
ABC vs HL Higher ABC vs H L (con't) Higher ABC vs HL (con't) Higher in in in hsa-miR-45 ] /mmu-miR- hsa-miR-891 a hsa-miR-766
45 l/rno-miR-45 I ABC HL HL hsa-let-7a/mmu-let-7a/rno- hsa-miR- 18a/mmu-miR- hsa-miR-409- let-7a 18a rno-miR- 1 8a 5p/mmu-miR-409-
ABC HL 5p/rno-miR-409-5p HL hsa-miR-23b/mmu-miR- hsa-miR- 196a*/mmu- ebv-miR-BART20-3p
23b/rno-miR-23b miR- 196a*/rno-miR-
ABC 196a* HL HL hsa-miR-21 /mmu-miR- hsa-miR-17*/rno-miR- hsa-miR- 129*
21 /rno-miR-21 ABC 17-3p HL HL hsa-miR-29c/mmu-miR- hsa-miR-296-5p/mmu- mghv-miR- 1 -7-5p
29c/rno-miR-29c miR-296-5p/rno-miR-
ABC 296* HL HL hsa-miR-20a/mmu-miR- hsa-miR-25/mmu-miR- hsa-miR-671 -
20a/rno-miR-20a ABC 25/rno-miR-25 HL 5p/mmu-miR-671 -5p HL hsa-miR-27b/mmu-miR- hsa-miR-509-5p hsa-miR-629
27b/rno-miR-27b ABC HL HL hsa-miR-23a/mmu-miR- hsa-miR-550* hsa-miR-553
23a/rno-miR-23a ABC HL HL hsa-miR-27a/mmu-miR- hsa-miR-708/mmu-miR- hsa-let-7d*/mmu-let-
27a/rno-miR-27a ABC 708/rno-miR-708 HL 7d*/rno-let-7d* HL hsa-miR-550 ABC hsa-miR- 146b-3p HL hsa-miR-601 HL hsa-let-7c/mmu-let-7c/rno- hsa-miR-625* hsa-miR-645
let-7c ABC HL HL hsa-miR-34b/mmu-miR- hsa-miR-210/mmu-miR- hsa-miR-221 *
34b-3p ABC 210/rno-miR-210 HL HL hsa-miR-933 hsa-miR-93/mmu-miR- hsa-miR-874/mmu- 93/rno-miR-93 miR-874/mo-miR-
HL HL 874 HL hsa-miR-30c-2*/mmu- hsa-miR-548b-3p hsa-miR-890
miR-30c-2*/rno-miR-30c-
2* HL HL HL hsa-miR-503 hsa-miR-652/mmu-miR- hsa-miR-492
HL 652/rno-miR-652 HL HL hsa-miR-765 hsa-miR- 153/mmu-miR- hsa-miR-629*
HL 153/rno-miR- 1 53 HL HL hsa-miR-658 HL mghv-miR-M l -3 HL hsa-miR-635 HL hsa-miR-620 hsa-miR- 194* hsa-miR- 130b/mmu- miR- 130b/rno-miR-
HL HL 130b HL hsa-miR-921 hsa-miR-23a*/rno-miR- hsa-miR- 197/mmu-
HL 23a* HL miR- 197 HL hsa-miR-30b* HL hsa-miR-943 HL hsa-miR-654-5p HL mghv-miR-M l -4 hsa-let-7d/mmu-let- hsa-miR-518b
HL 7d/rno-let-7d HL HL hsa-miR-939 HL hsa-miR-498 HL hsa-miR-889 HL hsa-miR-494/mmu hsa-miR-381 /mmu-miR- hsa-miR-584
494/rno-miR-494 HL 381 /rno-miR-381 HL HL hsa-miR-32* HL hsa-miR-586 HL hsa-miR- 198 HL
ABC vs HL Higher ABC vs HL (con't) Higher ABC vs HL (con't) Higher in in in hsa-miR-491 -3p hsa-miR- 137/mmu-miR- hsa-miR-636
HL 137/rno-miR- 137 HL HL hsa-miR- 1 Oa/mmu-miR- hsa-miR-610 hsa-miR-630
1 Oa/rno-miR- 10a-5p HL HL HL hsa-miR-33a mmu-miR- hsa-miR-920 hsa-miR-490-5p
33/rno-miR-33 HL HL HL hsa-miR-99a/mmu-miR- hsa-miR-936 hsa-miR-663
99a/rno-miR-99a HL HL HL hsa-miR- 199b-5p hsa-miR-744/mmu-miR- hcmv-miR-UL 148D
HL 744 HL HL hsa-miR-365/mmu-miR- ebv-miR-BART5 hsa-miR-337-3p
365/rno-miR-365 HL HL HL hsa-miR-520d-5p hsa-miR-21 * hsa-miR-9*/mmu-
HL HL miR-9*/rno-miR-9* HL hsa-miR-51 8c* hsa-miR-516a-5p hsa-miR-200b*/mmu-
HL HL miR-200b* HL hsa-miR-32/mmu-miR- hsa-miR-576-5p ebv-miR-BART9*
32/rno-miR-32 HL HL HL hsa-miR-214/mmu-miR- mghv-miR-M l -6 hsa-miR-342- 214/rno-miR-214 5p/mmu-miR-342-
HL HL 5p/rno-miR-342-5p HL hsa-miR-98/mmu-miR- hsa-miR-425/mmu-miR- hsa-miR-206/mmu- 98/rno-miR-98 425/rno-miR-425 miR-206/rno-miR-
HL HL 206 HL hsa-miR-302d* HL hsa-miR-220c HL hcmv-miR-US25- l * HL hsa-miR-30e*/mmu-miR- hsa-miR-10a*/mmu-miR- hsa-miR-659
30e*/rno-miR-30e* HL 10a*/rno-miR- 10a-3p HL HL hsa-miR-374b/mmu-miR- hsa-miR-452 hsa-miR-514
374/rno-miR-374 HL HL HL hsa-miR-29a*/mmu-miR- hsa-miR-345 kshv-miR-K 12-6-5p
29a*/rno-miR-29a* HL HL HL hsa-miR-532-5p/mmu- hsa-miR-29c*/mmu-miR- hsa-miR-508-5p
miR-532-5p/rno-miR-532- 29c*/rno-miR-29c*
5p HL HL HL hsa-miR- 149* HL hsa-miR-887 HL hsa-miR-377* HL hsa-miR-422a HL hsa-miR-7-2* HL ebv-miR-BART 16 HL ebv-miR-BHRF 1 -2 hsa-miR-363*/rno-miR- hsa-miR- 181 b/mmu- 363 * miR- 181 b/rno-miR-
HL HL 181 b HL hsa-miR-634 hsa-rniR-22*/mmu-miR- hsa-miR-622
HL 22*/rno-miR-22* HL HL hsa-miR- 143* HL hsa-miR-922 HL kshv-miR- 12- l HL hsa-miR-620 hsa-miR-92b* hsa-miR-490-
HL HL 3p/mmu-miR-490 HL hsa-miR-660 hsa-miR-526a/hsa-miR- hsa-miR- 125b- 520c-5p/hsa-miR-518d- l */mmu-miR- 125b-
HL 5p HL 3p/rno-miR- 125b-3p HL
ABC vs HL Higher ABC vs HL (con't) Higher ABC vs HL (con't) Hig in in ii hsa-miR-140-5p/mmu- hsa-miR-574-3p/mmu- hsa-miR- 124/mmu- miR- 140/rno-miR- 140 miR-574-3p miR- 124/rno-miR-
HL HL 124 HL hsa-miR-28-5p/mmu-miR- hsa-miR-92a/mmu-miR- hsa-miR-657
28/rno-miR-28 HL 92a/rno-miR-92a HL HL hsa-miR-519c-5p/hsa- hsa-miR-423-3p/mmu- ebv-miR-BHRF l -3 miR-519b-5p/hsa-miR- miR-423-3p/rno-miR-423
523*/hsa-miR-518e*/hsa- miR-522*/hsa-miR-519a* HL HL HL hsa-miR-505/rno-miR-505 HL hsa-miR-526b HL kshv-miR-K12-5 HL hsa-miR- 184/mmu-miR- hsa-miR-526b* hsa-miR-487b/mmu-
184/rno-miR- 184 miR-487b/rno-miR-
HL HL 487b HL hsa-miR- 107/mmu-miR- ebv-miR-BART6-3p hsa-miR- 1 83*/mmu-
107/rno-miR- 107 HL HL miR- 1 83 * HL hsa-miR-298 hsa-miR-92b/mmu-miR- hsa-miR-297/mmu-
HL 92b/rno-miR-92b HL miR-297a HL hsa-miR-455-3p HL hsa-miR-519e* HL hsa-miR-885-5p HL hsa-miR-638 hiv l -miR-H l hsa-miR-296- 3p/mmu-miR-296-
HL HL 3p/rno-miR-296 HL hsa-miR-502-3p HL hsa-miR-623 HL ebv-miR-BARTl 9-3p HL hsa-miR- 149/mmu-miR- hsa-miR-483-5p hsa-miR-617
149 HL HL HL hsa-miR-583 HL mghv-miR-M l -2 HL hsa-miR-519d HL hsa-miR- 105 HL mghv-miR-M 1 -7-3p HL hsa-miR- 195* HL hsa-miR- 128/mmu-miR- hsa-miR-5 19e hsa-miR-575
128/rno-miR-128 HL HL HL hsa-miR-656 hsa-miR-361 -5p/mmu- hsa-miR-208a/mmu- miR-361 /rno-miR-361 miR-208a/rno-miR-
HL HL 208 HL hsa-miR-497/mmu-miR- hsa-miR-650 hsa-miR-647
497/rno-miR-497 HL HL HL hsa-miR- 152/mmu-miR- hsa-miR-361 -3 p hsa-miR-525-5p
152/rno-miR-152 HL HL HL hsa-miR- 151 -5p/mmu- hsa-miR-374b* ebv-miR-BART8* miR- 15 1 -5p/rno-miR- 1 51 HL HL HL hsa-miR- 148b/mmu-miR- kshv-miR- 12-8 hsa-miR-340*/mmu-
148b/rno-miR- 148b-3p miR-340-3p/rno-miR-
HL HL 340-3p HL hsa-miR-300 hsa-miR-1 50*/mmu-miR- hsa-miR-220b
HL 150* HL HL hsa-miR- 144* hsa-miR-425*/mmu-miR- hsa-miR-382/mmu- 425* miR-382/rno-miR-
HL HL 382 HL hsa-miR- 145*/mmu-miR- hsa-miR-135a*/mmu- hsa-miR-585
145* HL miR- 135a* HL HL
ABC vs HL Higher ABC vs HL (con't) Higher ABC vs HL (con't) Higher in in in
-miR-UL70-3p hsa-miR-612 hsa-miR-877/mmu- miR-877/rno-miR-
HL HL 877 HL hsa-miR-28-3p/rno-miR- hsa-miR-212/mmu-miR- hsa-miR-99b*/mmu- 28* 212/rno-miR-212 miR-99b*/rno-miR-
HL HL 99b* HL hsa-miR-27a*/mmu-miR- hsa-miR- 125b-2*/rno- ebv-miR-BHRF l - 1
27a*/rno-miR-27a* HL miR- 125b* HL HL hsa-miR- 194/mmu-miR- hcmv-miR-UL l 12 hsa-miR-326/mmu- 194/rno-miR- 194 miR-326/mo-miR-
HL HL 326 HL hsa-miR- 130b*/mmu-miR- hsa-miR-500 ebv-miR-BART7*
130b* HL HL HL hsa-miR-548d-5p hsa-miR-502-5p hsa-miR-615-
HL HL 3p/mmu-miR-615-3p HL hsa-miR-937 HL ebv-miR-BARTl 8-3p HL mghv-miR-M l -8 HL hsa-miR-7/mmu-miR- hsa-miR-625 hsa-miR- 193b*
7a/rno-miR-7a HL HL HL hsa-miR-518a-5p/hsa- hsa-miR-138/mmu-miR- ebv-miR-BART13
miR-527 HL 138/rno-miR- 138 HL HL hsa-miR-323-3p/mmu- hsa-miR-500* hsa-miR-433/mmu- miR-323-3p/rno-miR-323 miR-433/mo-miR-
HL HL 433 HL hsa-miR-215 hsa-miR- 124*/mmu-miR- hsa-miR-202
HL 124*/rno-miR- 124* HL HL hsa-miR-513a-3p HL hsa-miR-516b HL hsa-miR-551 b* HL hsa-miR-595 hsa-miR-30c- l */mmu- hsa-miR-551 a
miR-30c- 1 */rno-miR-
HL 30c- 1 * HL HL hsa-miR-515-5p hsa-miR-33 1 -5p/mmu- hsa-miR-542- miR-331 -5p 3p/mmu-miR-542-
HL HL 3p/rno-miR-542-3p HL hsa-miR-483-3p hsa-miR-510 hsa-miR-338-
5p/mmu-miR-338-
HL HL 5p/rno-miR-338* HL hsa-miR-330-5p/mmu- hsa-miR-376a* hsa-miR-299-3p
miR-330/rno-miR-330 HL HL HL hsa-miR- 18b HL hsa-miR-640 HL hsa-miR-51 8a-3p HL hsa-miR-509-3p hsa-miR-331 -3p/mmu- hsa-miR- 18 l a-2*
HL miR-331 -3p/rno-miR-331 HL HL hsa-miR- 151 -3p HL hsa-miR-602 HL hsa-miR-938 HL hsa-miR-485-3p/mmu- hsa-miR-509-3-5p
miR-485 * HL HL hsa-miR-552 HL
Table 21 : Predictor microRNAs that distinguish germinal center B-cell like (GCB) DLBCL from Burkitt lymphoma
GCBvsBL Higher in GCB vs BL (con't) Higher in hsa-miR- 129* hsa-m R- 140-3 p/mmu-miR- 140*/rno-
GCB miR- 140* GCB hsa-miR-28-5p/mmu-miR-28/rno- . hsa-m R- 148a/mmu-miR- 148a
miR-28 GCB GCB hsa-miR- 155 hsa-m R-365/mmu-miR-365/rno-rniR-
GCB 365 GCB hsa-miR- 196a*/mmu-miR- 196a*/rno- hsa-m R-29c/mmu-miR-29c/rno-miR- miR- 196a* GCB 29c GCB hsa-miR- 146a/mmu-miR- 146a/rno- hsa-m R-30d/mmu-miR-30d/rno-miR- miR- 146a GCB 30d GCB hsa-miR-33 1 -3p/mmu-miR-33 1 - hsa-m R-214/mmu-miR-214/rno-miR- 3p/rno-miR-33 1 GCB 214 GCB hsa-miR-215 hsa-m R- 146b-5p/mmu-miR- 146b/rno-
GCB miR- l 46b GCB hsa-miR-600 hsa-m R-342-3p/mmu-miR-342-3p/rno-
GCB miR-342-3p GCB mghv-miR-M 1 -7-3p GCB hsa-m R-374a GCB hsa-miR- 107/mmu-miR- 107/rno- hsa-m R-223/rnmu-miR-223/rno-miR- miR- 107 GCB 223 GCB hsa-miR-886-3p hsa-m R-29b/mmu-miR-29b/rno-miR-
GCB 29b GCB hsa-miR- 140-5 p/mmu-miR- 140/rno- hsa-m R-21 /mmu-miR-21 /rno-miR-21
miR-140 GCB GCB hsa-miR- 154/mmu-miR- 154/rno- hsa-m R-29a/mm u-m i R-29a/rno-m i R- miR- 1 54 GCB 29a GCB hsa-miR- 103/mmu-miR- 103/rno- hsa-m R-23b/mmu-rniR-23b/rno-miR- miR- 1 03 GCB 23b GCB hsa-let-7g/mmu-let-7g GCB hsa-m R-24/mmu-m i R-24/rno-miR-24 GCB hsa-miR-222/mmu-miR-222/rno- hsa-m R-26a/mmu-miR-26a/rno-miR- miR-222 GCB 26a GCB hsa-miR-221 /mmu-miR-221 /rno- hsa-m R-26b/mmu-miR-26b/rno-miR- miR-221 GCB 26b GCB hsa-miR-320/mmu-miR-320/rno- hsa-m R-34b/mmu-miR-34b-3p
miR-320 GCB GCB hsa-m R-503 BL hsa-m R-30b* BL
Table 22: Predictor microRNAs that distinguish germinal center B-cell like (GCB) DLBCL from chronic lymphocytic leukemia
GCBvsCLL Higher GCB vs CLL (con't) Higher GCB vs CLL (con't) Higher in in in
hsa-miR- 181 a/mmu- hsa-miR- 100/mmu- hsa-miR-374a
miR-181a/rno-miR- miR-lOO/rno-miR-100
181a GCB GCB CLL hsa-miR-886-5p hsa-miR-371-5p hsa-miR- 142-5p/mmu- miR- 142-5p/rno-miR-
GCB GCB 142-5p CLL mghv-miR-M 1 -7-3p hsa-miR- 193a-5p hsa-m i R-29c/mmu- GCB GCB miR-29c/rno-miR-29c CLL hsa-miR-934 hsa-miR-628-3p hsa-miR- 140-3p/mmu- miR-140*/rno-miR-
GCB GCB 140* CLL mghv-miR-M 1-3 hsa-miR-185* hsa-miR-30e/mmu- GCB GCB miR-30e/rno-miR-30e CLL hsa-miR-485- hsa-miR- 1 Ob/mmu- hsa-miR-801 /mmu-
3p/mmu-miR-485* GCB miR-lOb/rno-miR-1 GCB miR-801 CLL hsa-miR-125b/mmu- hsa-miR-665 hsa-miR-768-3p
miR-125b-5p/rno- miR-125b-5p GCB GCB CLL hsa-miR-637 GCB hsa-miR-503 GCB hsa-miR-549 CLL hsa-miR-365/mmu- hsa-miR-642 hsa-miR- 199a-5p/mmu- miR-365/rno-miR- miR-199a-5p/rno-miR-
365 GCB GCB 199a-5p CLL hsa-miR-505* hsa-miR-658 hsa-miR-223/mmu- GCB GCB miR-223/rno-miR-223 CLL hsa-miR- 199a- hsa-miR-21/mmu- hsa-miR- 101 /mmu-
3p/hsa-miR-199b- miR-21/rno-miR-21 miR- 101 a/rno-miR-
3p/mmu-miR-199a- 101a
3p/mmu-miR-
199b/rno-miR-199a-
3p GCB GCB CLL hsa-miR-675 hsa-miR-23ammu- hsa-miR-888*
GCB m i R-23a/rno-miR-23a GCB CLL hsa-miR-424 hsa-miR- 125a- hsa-miR-24-l*/mmu- 5p/mmu-miR- 125a- miR-24-l*/rno-miR-24-
GCB 5p/rno-miR-125a-5p GCB 1* CLL ebv-miR-BHRFl-2 hsa-miR-24/mmu- hsa-miR-519d
GCB miR-24/rno-miR-24 GCB CLL hsa-miR-519c- hsa-miR-23b/mmu- hsa-miR- 154/mmu-
5p/hsa-miR-519b- miR-23b/rno-miR-23b miR-154/rno-miR-154
5p/hsa-miR-
523*/hsa-miR-
518e*/hsa-miR-
522*hsa-miR-
519a* GCB GCB CLL
GCB vs CLL Higher GCB vs CLL (con't) Higher GCB vs CLL (con't) Higher in in in
hsa-miR- 130a/mmu- hsa-miR-620 hsa-miR-638
miR- 130a/rno-miR- 130a GCB GCB CLL hsa-miR-943 hsa-miR-933 hsa-miR-668/mmu- GCB GCB miR-668 CLL hsa-miR- 126/mmu- hsa-miR-30b* hsa-miR-891 a
miR- 126-3p/rno- miR- 126 GCB GCB CLL hsa-miR- 193b hsa-miR-22/mmu- hsa-miR-768-5p
GCB miR-22/rno-miR-22 GCB CLL hsa-miR- 198 hsa-let-7e/mmu-let- hsa-miR- 140-5p/mmu- GCB 7e/rno-let-7e GCB miR- 140/rno-miR- 140 CLL hsa-miR- mghv-miR-M l -4 hsa-miR- 196a*/mmu-
200b*/mmu-miR- miR- 196a*/rno-miR-
200b* GCB GCB 196a* CLL kshv-miR- 12-6-3p hsa-miR- 149* hsa-miR- 150/mmu-
GCB GCB miR- 150/rno-miR- 150 CLL hsa-miR-220c GCB hsa-miR-765 GCB hsa-let-7g/mmu-let-7g CLL hsa-miR-374b* hsa-let-7c/mmu-let- hsa-miR-363/mmu-
GCB 7c/rno-let-7c GCB miR-363/rno-miR-363 CLL hsa-miR-518b hsa-miR-423- hsa-miR-486-5p/mmu-
GCB 5p/mmu-miR-423-5p CLL miR-486 CLL hsa-miR-920 hsa-miR-32* hsa-miR-32/mmu-miR-
GCB CLL 32/rno-miR-32 CLL hsa-miR- 125b- hsa-miR-34b/mmu- hsa-miR- 147
l */mmu-miR- 125b- miR-34b-3p
3p/rno-miR- 125b-3p GCB CLL CLL ebv-miR-BART8* hsa-miR-551 b/mmu- hsa-miR-20b*
miR-551 b/rno-miR-
GCB 55 1 b CLL CLL ebv-miR-BART16 hsa-let-7i/mmu-let- hsa-miR-487b/mmu- 7i/rno-let-7i miR-487b/rno-miR-
GCB CLL 487b CLL hsa-miR-630 hsa-miR-29a/mmu- hsa-miR-636
GCB miR-29a/rno-miR-29a CLL CLL hsa-miR-483-5p hsa-miR- 138- hsa-miR- 144*
1 */mmu-miR-
GCB 138*/rno-miR- 138* CLL CLL hsa-miR-422a hsa-miR-29b/mmu- hsa-miR- 1 86/mmu- GCB miR-29b/rno-miR-29b CLL miR- 186/rno-miR- 186 CLL hsa-miR-526b hsa-miR- 191 /mmu- hsa-miR-30e*/mmu- miR- 191 /rno-miR- 191 miR-30e*/rno-miR-
GCB CLL 30e* CLL hsa-miR- 145/mmu- hsa-miR-26b/mmu- hsa-miR-33 1 -5p/mmu- miR- 145/rno-miR- miR-26b/rno-miR-26b miR-331 -5p
145 GCB CLL CLL hsa-miR- 126*/mmu- hsa-miR-26a/mmu- miR- 126-5p/rno- miR-26a/mo-miR-26a
miR- 126* GCB CLL
GCB vs CLL Higher GCB vs CLL (con't) Higher GCB vs CLL (con't) Higher in in in
hsa-miR- 143/mmu- hsa-miR-550
miR- 143/rno-miR-
143 GCB CLL
Table 23: Predictor microRNAs that distinguish germinal center B-cell like (GCB) DLBCL from follicular lymphoma
GCB vs FL Higher GCB vs FL (con't) Higher GCB vs FL (con't) Higher in in in hsa-miR-378/mmu- hcmv-miR-UL 148D hsa-miR-425/mmu- miR-378/rno-miR-378 GCB FL miR-425/rno-miR-425 FL hsa-miR-20b/mmu- hsa-miR-497/mmu-miR- hsa-miR-99b*/mmu- miR-20b/rno-miR-20b- 497/rno-miR-497 miR-99b*/rno-miR-
5p GCB FL 99b* FL hsa-miR- 19b/mmu- ebv-miR-BART13 hsa-miR-513a-3p
miR- 19b/rno-miR- 19b GCB FL FL hsa-miR- 106a ebv-miR-BART 16 hsa-miR-206/mmu- GCB FL miR-206/rno-miR-206 FL hsa-miR- 17/mmu-miR- hsa-miR- 125b-2*/rno- hsa-miR- 155*
17/rno-miR- 17-5p/rno- miR- 125b*
miR- 17 GCB FL FL hsa-miR-93/mmu-miR- hsa-miR-490-3p/mmu- hsa-miR- 1 81 b/mmu- 93/rno-miR-93 miR-490 miR- 181 b/rno-miR-
GCB FL 181 b FL hsa-miR-20a/mmu- hsa-miR-99b/mmu-miR- hsa-miR-299-3p
miR-20a/rno-miR-20a GCB 99b/rno-miR-99b FL FL hsa-miR-23b/mmu- hsa-miR-339-5p/mmu- hsa-miR-218-2*/mmu- miR-23b/rno-miR-23b miR-339-5p/rno-miR- miR-218-2*/rno-miR-
GCB 339-5p FL 21 8* FL hsa-miR-23a/mmu- hsa-m i R-574-3 p/mmu- mghv-miR-M l -8
miR-23a/rno-miR-23a GCB miR-574-3p FL FL hsa-miR-22/mmu-miR- hsa-miR-5 15-5p ebv-miR-BART l 8-3p
22/rno-miR-22 GCB FL FL hsa-miR- 19a/mmu- hsa-miR-877/mmu-miR- hsa-miR-708/mmu- miR- 19a rno-miR- 19a GCB 877/rno-miR-877 FL miR-708/rno-miR-708 FL hsa-miR-320/mmu- hsa-miR-208a/mmu-miR- hsa-miR-409-5p/mmu- miR-320/rno-miR-320 208a/rno-miR-208 miR-409-5p/rno-miR-
GCB FL 409-5p FL hsa-miR- 106b/mmu- hcmv-miR-US25- l * hsa-miR-553
miR- 106b/rno-miR- 106b GCB FL FL hsa-miR- 103/mmu- hsa-miR-326/mmu-miR- hsa-miR-361 -3p
miR- 103/rno-miR- 103 GCB 326/rno-miR-326 FL FL hsa-miR-30c/mmu- hsa-miR-488 hsa-miR-296-3p/mmu- miR-30c/rno-miR-30c miR-296-3p/rno-miR-
GCB FL 296 FL ebv-miR-BHRF l -2 GCB hsa-miR-629 FL ebv-miR-BHRF l -3 FL
GCB vs FL Higher GCB vs FL (con't) Higher GCB vs FL (con't) Higher in in in hsa-miR- 125a- hsa-miR-24-2*/mmu- hsa-miR-34c-5p/mmu-
5p/mmu-miR- 125a- miR-24-2*/rno-miR-24- miR-34c/rno-miR-34c
5p/rno-miR- 125a-5p GCB 2* - FL FL hsa-let-7a/mmu-let- hsa-miR- 124/mmu-miR- hsa-let-7b*/mmu-let-
7a/rno-let-7a GCB 124/rno-miR- 124 FL 7b*/rno-let-7b* FL hsa-miR-628-3p hsa-miR-493 hsa-miR-301 a/mmu- miR-301 a/rno-miR-
GCB FL 301 a FL hsa-let^C/mmit-let- hsv l -miR-H l hsa-miR- 122*
7c/rno-let-7c GCB FL FL hsa-miR-423-5p/mmu- hsa-miR-484/mmu-miR- hsa-miR- 183/mmu- miR-423-5p FL 484/rno-miR-484 FL miR- 183/rno-miR- 183 FL hsa-miR-24- 1 */mmu- hsa-miR-483-3p kshv-miR- 12-5
miR-24- l */rno-miR-
24- 1 * FL FL FL ebv-miR-BART2-3p hsa-miR-27a*/mmu-miR- kshv-miR- 12-7
FL 27a*/rno-miR-27a* FL FL hsa-miR- 138- 1 */mmu- hsa-miR- 144* hsa-miR-552
miR- 138*/rno-miR-
138* FL FL FL hsa-miR-768-5p FL hsa-miR-617 FL hsa-miR- 1 51 -3p FL hsa-miR-30b* hsa-miR-377* hsa-miR- 1 4/mmu-
FL FL miR- 194/rno-miR- 194 FL hsa-miR-494/mmu- hsa-miR-363*/rno-miR- hsa-miR-585
miR-494/rno-miR-494 FL 363* FL FL hsa-miR-583 hsa-miR- 148b/mmu-miR- hsa-miR-340*/mmu- 148b/rno-miR- 148b-3p miR-340-3p/rno-miR-
FL FL 340-3p FL hsa-miR- 1 85/mmu- kshv-miR- 12- l hsa-let-7d*/mmu-let- miR- 185/rno-miR- 185 FL FL 7d*/rno-let-7d* FL hsa-miR-765 hsa-miR-7/mmu-miR- hsa-miR-622
FL 7a/rno-miR-7a FL FL hsa-miR-34b/mmu- hsa-miR- 193b* hsa-miR-575
miR-34b-3p FL FL FL hsa-miR-921 hsa-miR-542-3p/mmu- hsa-miR-514
miR-542-3p/rno-miR-
FL 542-3p FL FL hsa-miR-55 1 b/mmu- hsa-miR-601 hsa-miR-92b/mmu- miR-55 1 b/rno-miR- miR-92b/rno-miR-92b
55 1 b FL FL FL hsa-miR-549 · hsa-miR- 106b*/mmu- hsa-miR-55 l a
miR- 106b*/rno-miR-
FL 106b* FL FL hsa-miR-939 FL hsa-miR-7-2* FL hsa-miR-221 * FL hsa-miR-302d* FL kshv-miR- 12-6-5p FL hsa-miR-922 FL ebv-miR-BARTl 7-5p FL hsa-miR-645 FL hsa-miR-938 FL hsa-miR-801/mmu- hsa-miR-524-5p hsa-miR-615-3p/
miR-801 FL FL miR-615-3p FL hsa-miR-888* FL hsa-miR-548d-5p FL hsa-miR-220b FL
GCB vs FL Higher GCB vs FL (con't) Higher GCB vs FL (con't) Higher in in in hsa-miR-620 hsa-miR-9*/mmu-miR- hsa-miR-744/mmu-
FL 9*/rno-miR-9* FL miR-744 FL hsa-miR-576-3p hsa-miR-92a mmu-miR- hsa-miR-657
FL 92a/rno-miR-92a FL FL hsa-miR-32* hsa-miR-22*/mmu-miR- hsa-miR-382/mmu- FL 22*/rno-miR-22* FL miR-382/rno-miR-382 FL hsa-miR-574-5p/mmu- hsa-miR-500* hsa-miR-518a-3p
miR-574-5p FL FL FL hsa-miR-505/rno-miR- hsa-miR-890 hsa-miR- 138/mmu- 505 FL FL miR- 138/rno-miR- 138 FL hsa-miR-885-5p hsa-miR-297/mmu-miR- hsa-miR-636
FL 297a FL FL hsa-miR-455-3p hsa-miR- 197/mmu-miR- hsa-miR-96/mmu- FL 197 FL miR-96/rno-miR-96 FL hsa-miR- 1 52/mmu- hsa-miR-20b* hsa-miR-509-3-5p
miR- 152/rno-miR- 152 FL FL FL hsa-miR-200b*/mmu- hsa-miR-629* hsa-miR-337-3p
miR-200b* FL FL FL mghv-miR-M l -2 hsa-miR-887 hsa-miR-342-5p/mmu- miR-342-5p/rno-miR-
FL FL 342-5p FL
Table 24: Predictor microRNAs that distinguish germinal center B-cell like (GCB) DLBCL from Hodgkin's lymphoma
GCB vs HL Higher GCB vs HL (con't) Higher GCB vs HL (con't) Hi h' in in in hsa-miR- 19b/mmu-miR- hsa-miR- 1 30b/mmu- hsa-miR-744/mmu-
19b/rno-miR- 19b GCB miR- 130b/rno-miR- 130b HL miR-744 HL hsa-miR- 19a/mmu-miR- hsa-miR-671 -5p/mmu- kshv-miR- 12-6-5p
19a/rno-miR- 19a GCB miR-671 -5p HL HL hsa-miR- 106a GCB hsa-miR-525-5p HL hcmv-miR-US25- l * HL hsa-miR-20b/mmu-miR- hsa-miR-505/rno-miR- hsa-miR-21 *
20b/rno-miR-20b-5p GCB 505 HL HL hsa-miR- 17/mmu-miR- hsa-miR-488 mghv-miR-M 1 -6
17/rno-miR- 17-5p/rno- miR-17 GCB HL HL hsa-miR- 15b/mmu-miR- hsa-miR-766 mghv-miR-M 1 -8
15b/rno-miR- 15b GCB HL HL hsa-miR-20a/mmu-miR- hsa-miR-20b* hsa-miR- 10a*/mmu-
20a/rno-miR-20a miR- 10a*/rno-miR-
GCB HL 10a-3p HL hsa-miR-30b/mmu-miR- hsa-miR-339-5p/mmu- hsa-miR-345
30b/rno-miR-30b-5p miR-339-5p/rno-miR-
GCB 339-5p HL HL hsa-miR- 142-3p/mmu-miR- hsa-miR-524-5p hsa-miR-887
142-3p/rno-miR- 142-3p GCB HL HL
GCB ys HL Higher GCB vs HL (con't) Higher GCB vs HL (con't) Higher in in in hsa-miR-30c/mmu-miR- hsa-miR-455-3p hsa-miR- 193b*
30c/rno-miR-30c GCB HL HL hsa-miR-378/mmu-miR- hsa-miR-92a/mmu-miR- hsa-miR- 122*
378/rno-miR-378 GCB 92a rno-miR-92a HL HL hsa-miR-93/mmu-miR- hsa-miR-502-3p kshv-miR- 12-5
93/rno-miR-93 GCB HL HL hsa-miR- 106b/mmu-miR- hsa-miR-210/mmu-miR- hsa-miR-92b*
106b/rno-miR- 106b GCB 210/rno-miR-210 HL HL hsa-miR-374a GCB hsv l -miR-H l HL hsa-miR-526b* HL hsa-miR-24/mmu-miR- ebv-miR-BART6-3p hsa-miR-553
24/rno-miR-24 GCB HL HL hsa-miR-29b/mmu-miR- hsa-miR-490-3p/mmu- hsa-miR-601
29b/rno-miR-29b GCB miR-490 HL HL hsa-miR-22/mmu-miR- hsa-miR- 149/mmu-miR- hiv l -miR-H l
22/rno-miR-22 GCB 149 HL HL hsa-miR- 142-5p/mmu-miR- hsa-miR- 128/mmu-miR- hsa-miR-623
142-5p/rno-miR- 142-5p GCB 128/rno-miR- 128 HL HL hsa-miR-30e/mmu-miR- hsa-miR-635 hsa-miR-519e
30e/rno-miR-30e GCB HL HL hsa-miR-30a/rnmu-miR- hcmv-miR-UL 148D hsa-miR-650
30a/rno-miR-30a GCB HL HL hsa-miR-30d/mmu-miR- hsa-miR-373 * " hsa-miR-575
30d/rno-miR-30d GCB HL HL hsa-miR-23b/mmu-miR- hsa-miR-647 hsa-miR-629*
23b/rno-miR-23b GCB HL HL hsa-miR- 16/mmu-miR- hsa-miR- 197/mmu-miR- hsa-miR-890
16/rno-miR- 16 GCB 197 HL HL hsa-miR- 191 /mmu-miR- hsa-miR-602 hsa-miR-
191 /rno-miR- 191 150*/mmu-miR-
GCB HL 1 50* HL hsa-miR- 15a/mmu-miR- hsa-miR-656 hsa-miR- '
15a 425*/mmu-miR-
GCB HL 425* HL hsa-miR-26b/mmu-miR- hsa-miR-874/mmu-miR- hsa-miR- 26b/rno-miR-26b 874/rno-miR-874 1 35a*/mmu-miR-
GCB HL 135a* HL hsa-miR-23a/mmu-miR- ebv-miR-BART 19-3p hsa-miR-612
23a/rno-miR-23a GCB HL HL hsa-let-7a/mmu-let-7a/rno- hsa-miR-551 b* hsa-miR-636
let-7a GCB HL HL hsa-miR- 103/mmu-miR- hsa-miR-96/rnmu-miR- hsa-miR-500
103/rno-miR- 103 GCB 96/rno-miR-96 HL HL hsa-miR- 140-3 p/mmu-miR- hsa-miR-889 hsa-miR-502-5p
140*/mo-miR- 140* GCB HL HL hsa-miR- 154/mmu-miR- hsa-miR-425/mmu-miR- hsa-miR-9*/mmu- 154/rno-miR- 154 GCB 425/rno-miR-425 HL miR-9*/rno-miR-9* HL hsa-miR-320/mmu-miR- hsa-miR-34c-5p/mmu- hsa-miR-500*
320/rno-miR-320 GCB miR-34c/rno-miR-34c HL HL
GCB vs HL Higher GCB vs HL (con't) Higher GCB vs HL (con't) Higher in in in hsa-miR-550 hcmv-miR-UL70-3p hsa-miR- 124*/mmu-miR-
GCB HL 124*/rno-miR- 124* HL hsa-miR- 125a-5p/mmu- hsa-miR-27a*/mmu- hsa-miR-30c- miR-125a-5p/rno-miR- miR-27a*/rno-miR-27a* l */mmu-miR-30c-
125a-5p GCB HL l */rno-miR-30c- l * HL hsa-let-7c/mmu-let-7c/rno- hsa-miR- 194/mmu-miR- hsa-miR- let-7c 194/rno-miR- 194 99b*/mmu-miR-
GCB HL 99b*/rno-miR-99b* HL hsa-miR- 185/mmu-miR- hsa-miR- 17*/rno-miR- hsa-miR-331 -
185/rno-miR- 185 17-3p 5p/mmu-miR-33 1 -
HL HL 5p HL hsa-miR-658 hsa-miR-548d-5p hsa-miR-206/mmu- miR-206/rno-miR-
HL HL 206 HL hsa-miR-549 hsa-miR-7/mmu-miR- hsa-miR-376a*
HL 7a/rno-miR-7a HL HL hsa-miR-634 hsa-miR-877/mmu-miR- hsa-miR-585
HL 877/rno-miR-877 HL HL hsa-miR-551 b/mmu-miR- hsa-miR-22*/mmu-miR- hsa-miR-640
55 1 b/rno-miR-551 b HL 22*/mo-miR-22* HL HL hsa-miR-51 8c* hsa-miR-323-3p/mmu- hsa-miR-377*
miR-323-3p/rno-miR-
HL 323 HL HL hsa-miR-888* hsa-miR-708/mmu-miR- hsa-miR- 125a- 708/rno-miR-708 3p/mmu-miR- 125a-
HL HL 3p/rno-miR- 125a-3p HL hsa-miR-765 hsa-miR-513a-3p hsa-miR-24- 2*/mmu-miR-24-
HL HL 2*/rno-miR-24-2* HL hsa-miR-423-5p/mmu-miR- hsa-miR-595 hsa-miR-484/mmu-
423-5p miR-484/rno-miR-
HL HL 484 HL hsa-miR-30c-2*/mmu-miR- hsa-miR-922 hsa-miR-
30c-2*/rno-miR-30c-2* 106b*/mmu-miR- 106b*/rno-miR-
HL HL 106b* HL hsa-miR-503 hsa-miR-515-5p hsa-let-7b*/mmu-
HL HL let-7b*/rno-let-7b* HL hsa-miR-921 hsa-miR-99b/mmu-miR- hsa-miR-302c*
HL 99b/rno-miR-99b HL HL hsa-miR-520d-5p hsa-miR-483-3p hsa-miR-542- 5p/mmu-miR-542-
HL HL 5p/rno-miR-542-5p HL hsa-miR-574-5p/mmu-miR- hsa-miR-330-5p/mmu- hsa-miR-622
574-5p HL miR-330/rno-miR-330 HL HL hsa-miR-32* HL hsa-miR-509-3p HL ebv-miR-BHRF l -3 HL hsa-miR-939 HL hsa-miR- 151 -3p HL hsa-miR- 181 a-2* HL
GCB vs HL Higher GCB vs HL (con't) Higher GCB vs HL (con't) Hig in in
ebv-miR-BART2-3p ebv-miR-BART l 3 hsa-miR- 1 83/mmu- miR- 183/rno-miR-
HL HL 1 83 HL ebv-miR-BHRF l -2 hsa-miR-617 hsa-miR-409- 5p/mmu-miR-409-
HL HL 5p/rno-miR-409-5p HL hsa-miR-583 hsa-miR-328/mmu-miR- ebv-miR-BART20-
HL 328/rno-miR-328 HL 3p HL hsa-miR-30b* HL hsa-miR-361 -3p HL hsa-miR-629 HL hsa-miR- 149* . hsa-miR- 138/mmu-miR- hsa-let-7d*/mmu-
HL 138/rno-miR- 138 HL let-7d*/rno-let-7d* HL mghv-miR-M l -4 HL ebv-miR-BART7* HL hsa-miR-645 HL hsa-miR-513a-5p HL hsa-miR-589 HL hsa-miR-492 HL hsa-miR-494/mmu-miR- hsa-miR-576-5p hsa-miR-654-5p
494/rno-miR-494 HL HL HL hsa-miR-498 hsa-miR-452 hsa-miR-208a/mmu- miR-208a/rno-miR-
HL HL 208 HL hsa-miR-485-3p/mmu-miR- hsa-miR-7-2* hsa-miR-584
485* HL HL HL hsa-miR- 129-5 p/mmu-miR- hsa-miR-296-5p/mmu- hsa-miR-382/mmu-
129-5p/rno-miR- 129 miR-296-5p/rno-miR- miR-382/rno-miR-
HL 296* HL 382 HL hsa-miR-25* hsa-miR-550* hsa-miR-
340*/mmu-miR-
340-3p/rno-miR-
HL HL 340-3p HL hsa-miR-923 hsa-miR-92b/mmu-miR- hsa-miR-490-5p
HL 92b/rno-miR-92b HL HL hsa-miR-519d HL kshv-miR- 12- l HL hsa-miR-663 HL hsa-miR-516a-5p hsa-miR-526a/hsa-miR- hsa-miR-337-3p
520c-5p/hsa-miR-518d-
HL 5p HL HL hsa-miR-99a/mmu-miR- mghv-miR- 1 -2 hsa-miR-518a-3p
99a/rno-miR-99a HL HL HL hsa-miR-943 HL hsa-miR-548b-3p HL ebv-miR-BART9* HL hsa-miR-885-5p hsa-miR-297/mmu-miR- hsa-miR-342- 297a 5p/mmu-miR-342-
HL HL 5p/rno-miR-342-5p HL ebv-miR-BHRF l - 1 HL hsa-miR- 195* HL hsa-miR-514 HL hsa-miR- 152/mmu-miR- hsa-miR-652/mmu-miR- hsa-miR-508-5p
152/rno-miR- 1 52 HL 652/rno-miR-652 HL HL ebv-miR-BART8* hsa-miR-221 * hsa-miR- 124/mmu- miR- 124/mo-miR-
HL HL 124 HL hsa-miR-200b*/mmu-miR- hsa-miR- 194* hsa-miR-657
200b* HL HL HL
GCB vs HL Higher GCB vs HL (con't) Higher GCB vs HL (con't) Higher in in in hsa-miR- 125b- l */mmu- hsa-miR-23a*/rno-miR- hsa-miR-938
miR- 125b-3p/rno-miR- 23a*
125b-3p HL HL HL hsa-miR-526b hsa-miR- 125b-2*/rno- hsa-miR-296- miR- 125b* 3p/mmu-miR-296-
HL HL 3p/rno-miR-296 HL hsa-miR-29a*/mmu-miR- hsa-miR-212/mmu-miR- hsa-miR-551 a
29a*/rno-miR-29a* HL 212/rno-miR-212 HL HL hsa-miR-532-5p/mmu-miR- ebv-miR-BART 18-3p hsa-miR-542-
532-5p/rno-miR-532-5p 3p/mmu-miR-542-
HL HL 3p/rno-miR-542-3p HL hsa-miR- 1 83*/mmu-miR- hsa-miR-586 hsa-miR-220b
1 83* HL HL HL hsa-miR-659 hsa-miR- 137/mmu-miR- hsa-miR-326/mmu- 137/rno-miR- 137 miR-326/rno-miR-
HL HL 326 HL hsa-miR- 145*/mmu-miR- hsa-miR-610 hsa-miR-615-
145* 3p/mmu-miR-61 5-
HL HL 3p HL mghv-miR-M 1 -7-5p hcmv-miR-UL 1 12 hsa-miR-433/mmu- miR-433/mo-miR-
HL HL 433 HL hsa-miR- 143* hsa-miR- 1 81 b/mmu- hsa-miR-202
HL miR- 181 b/mo-miR- 181 b HL HL hsa-miR-660 hsa-miR-936 hsa-miR-338- 5p/mmu-miR-338-
HL HL 5p/rno-miR-338* HL hsa-miR-552 HL hsa-miR-299-3p HL hsa-miR-509-3-5p HL
Table 25: Predictor microRNAs that distinguish Burkitt lymphoma from chromic lymphocytic leukemia
BL vs CLL Higher BL vs CLL (con't) Higher BL vs CLL (con't) Higher in in in hsa-miR-874/mmu- hsa-miR-30b/mmu-miR- hsa-miR-361 -5p/mmu- miR-874/rno-miR-874 BL 30b/rno-miR-30b-5p CLL miR-361 /rno-miR-361 CLL hsa-miR- 125b/mmu- hsa-miR-34b/mmu-miR- hsa-miR-29c/mmu- miR- 125b-5p/rno-miR- 34b-3p miR-29c/rno-miR-29c
125b-5p BL CLL CLL hsa-miR- 126/mmu- hsa-miR-801 /mmu-miR- hsa-miR- 147
miR- 126-3p/rno-miR- 801
126 BL CLL CLL ebv-miR-BHRF 1 -2 hsa-miR-26b/mmu-miR- hsa-miR-361 -3p
BL 26b/rno-miR-26b CLL CLL
BL vs CLL Higher BL vs CLL (con't) Higher BL vs CLL (con't) Higher in in in hsa-miR- 193b hsa-let-7b/mmu-let- hsa-miR- 140-3p/mmu- 7b/rno-let-7b miR- 140*/rno-miR-
BL CLL 140* CLL hsa-miR-371 -5p hsa-miR- 142-5p/mmu- hsa-miR-486-5p/mmu- miR- 142-5p/rno-miR- miR-486
BL 142-5p CLL CLL hsa-miR- 193a-5p hsa-miR-26a/mmu-miR- hsa-miR-33a/mmu-
BL 26a/rno-miR-26a CLL miR-33/rno-miR-33 CLL hsa-miR-628-3p hsa-miR-29a/mmu-miR- hsa-miR-636
BL 29a/rno-miR-29a CLL CLL hsa-miR- 185* hsa-miR-768-3p hsa-miR-24-1 */mmu- miR-24-l */rno-miR-24-
BL CLL 1 * CLL hsa-miR-503 hsa-miR- 199a-5p/mmu- hsa-miR- 144*
miR- 199a-5p/rno-miR-
BL 199a-5p CLL CLL hsa-miR- 199a-3 p/hsa- hsa-miR-30e/mmu-miR- hsa-miR-668/mmu- miR- 199b-3p/mmu- 30e/rno-miR-30e miR-668
miR- 199a-3p/mmu- miR- 199b/rno-miR-
199a-3p BL CLL CLL hsa-miR- 143/mmu- hsa-miR-29b/mmu-miR- hsa-miR-768-5p
miR-143/rno-miR- 143 BL 29b/rno-miR-29b CLL CLL hsa-miR- 130a/mmu- hsa-miR- 101 /mmu-miR- hsa-miR-363/mmu- miR-130a/rno-miR- l O l a/rno-miR- l Ol a miR-363/rno-miR-363
130a BL CLL CLL hsa-miR- 145/mmu- hsa-miR- 138- 1 */mmu- hsa-miR- 150/mmu- miR- 145/rno-miR- 145 BL miR- 138*/rno-miR- 138* CLL miR- 150/rno-miR- 150 CLL hsa-miR-30b* hsa-miR- 195/mmu-miR- hsa-miR-519d
BL 195/rno-miR-195 CLL CLL hsa-miR-665 BL hsa-miR-549 CLL hsa-miR-891 a CLL hsa-miR-658 hsa-miR- 103/mmu-miR- hsa-miR- 186/mmu-
BL 103/rno-miR- 103 CLL miR- 186/rno-miR-186 CLL hsa-miR-933 hsa-miR-649 hsa-miR-331 -5p/mmu-
BL CLL miR-33 1 -5p CLL hsa-miR-30c-2*/mmu- hsa-miR-335/mmu-miR- hsa-miR-28-5p/mmu- miR-30c-2*/rno-miR- 335-5p/rno-miR-335 miR-28/rno-miR-28
30c-2* BL CLL CLL hsa-miR-765 hsa-miR-342-3p/mmu- hsa-miR- 154/mmu- miR-342-3p/rno-miR- miR- 154/rno-miR- 1 54
BL 342-3p CLL CLL hsa-miR-620 hsa-miR-423-3p/mmu- hsa-miR- 155
miR-423-3p/rno-miR-
BL 423 CLL CLL hsa-miR-520d-5p hsa-miR-222/mmu-miR- hsa-miR-363*/rno-miR- BL 222/rno-miR-222 CLL 363 * CLL hsa-miR-494/mmu- hsa-miR-374a hsa-miR-32/mmu-miR- miR-494/rno-miR-494 BL CLL 32/rno-miR-32 CLL
BL vs CLL Higher BL vs CLL (con't) Higher BL vs CLL (con't) Higher in in in hsa-miR-551 b/mmu- hsa-miR-888* hsa-miR-30e*/mmu- miR-551 b/rno-miR- miR-30e*/rno-miR- 551 b CLL CLL 30e* CLL hsa-miR- 106b/mmu- hsa-miR-30d/mmu-miR- hsa-miR- 140-5p/mmu- miR- 106b/rno-miR- 30d/rno-miR-30d miR- 140/rno-miR- 140
106b CLL CLL CLL hsa-miR-30c/mmu- hsa-miR-299-5p/mmu- hsa-let-7g/mmu-let-7g miR-30c/rno-miR-30c CLL miR-299*/rno-miR-299 CLL CLL hsa-miR- 16/mmu-miR- hsa-miR- 107/mmu-miR- hsa-miR-20b*
16/rno-miR- 16 CLL 107/rno-miR-107 CLL CLL hsa-miR-27a/mmu- hsa-miR- 105 hsa-miR- 129*
miR-27a/rno-miR-27a CLL CLL CLL hsa-miR-27b/mmu- hsa-let-7f/mmu-let- hsa-miR- 196a*/mmu- miR-27b/rno-miR-27b 7f/rno-let-7f miR- 196a*/rno-miR-
CLL CLL 196a* CLL hsa-miR-550 hsa-miR- 191 /mm u-miR- hsa-miR-487b/mmu- 191/rno-miR-191 miR-487b/rno-miR-
CLL CLL 487b CLL hsa-miR-30a/mmu- hsa-miR-223/mmu-miR- miR-30a/rno-miR-30a CLL 223/rno-miR-223 CLL
Table 26: Predictor microRNAs that distinguish Burkitt lymphoma from follicular lymphoma
BL vs FL Higher BL vs FL (con't) Higher BL vs FL (con't) Higher in in in hsa-miR- 17/mmu-miR- hsa-miR-493 hsa-miR-574-3p/mmu-
17/rno-miR- 1 7-5p/rno- miR-574-3p
miR- 17 BL FL FL hsa-miR- 106a hsa-miR-24- 1 */mmu- hsa-miR-615-3p/mmu- miR-24- l */rno-miR- miR-615-3p
BL 24- 1 * FL FL hsa-miR- 19b/mmu-miR- hsa-miR-200b*/mmu- hsa-miR-28-5p/mmu-
19b/rno-miR- 19b BL miR-200b* FL miR-28/rno-miR-28 FL hsa-miR-20a/mmu-miR- hsa-miR-484/mmu- hsa-miR-934
20a/rno-miR-20a BL miR-484/rno-miR-484 FL FL hsa-miR- 19a/mmu-miR- hsa-miR-483-3p hsa-miR- 1 51 -5p/mmu-
19a/rno-miR- 19a miR-1 1 -5p/rno-miR-
BL FL 151 FL hsa-miR-628-3p BL hsa-miR-516b FL hsa-miR-885-5p FL hsa-miR-503 hsa-miR- 125b-2*/rno- hsa-miR-409-5p/mmu- miR- 125b* miR-409-5p/rno-miR-
BL FL 409-5p FL hsa-miR-371 -5p hsa-miR-490-3p/mmu- hsa-let-7d*/mmu-let-
BL miR-490 FL 7d*/rno-let-7d* FL hsa-miR- 106b/mmu- / hsa-miR-140-5p/mmu- hsa-miR- 155
miR- 106b/rno-miR-l 06b BL miR- 140/rno-miR- 140 FL FL
BL vs FL Higher BL vs FL (con't) Higher BL vs FL (con't) Higher in in in hsa-miR-30c-2*/mmu- hsa-miR-877/mmu- hsa-let-7b*/mmu-let- miR-30c-2*/rno-miR- miR-877/rno-miR-877 7b*/rno-let-7b*
30c-2* BL FL FL ebv-miR-BART2-3p hsa-miR-381 /mmu- hsa-miR-7-2*
FL miR-381 /rno-miR-381 FL FL hsa-let-7e/mmu-let- hsa-miR- 193b* hsa-miR-221 *
7e/rno-let-7e FL FL FL hsa-miR-55 1 b/mmu- hsa-miR-635 hsa-miR-9*/mmu-miR- miR-551 b/rno-miR-551 b FL FL 9*/rno-miR-9* FL hsa-miR-26b/mmu-miR- hsa-miR-542-3p/mmu- hsa-miR- 122*
26b/rno-miR-26b miR-542-3p/rno-miR-
FL 542-3p FL FL hsa-miR-26a mmu-miR- hsa-miR- 1 81 a-2* hsa-miR- 130b/mmu- 26a rno-miR-26a miR- 130b/rno-miR-
FL FL 130b FL hsa-miR-620 hsa-miR-32/mmu- hsa-miR- 1 83/mmu-
FL miR-32/rno-miR-32 FL miR- l 83/rno-miR- 1 83 FL hsa-miR-801 /mmu-miR- hsa-miR- 105 hsa-miR-92a/mmu- 801 FL FL miR-92a/rno-miR-92a FL ebv-miR-BARTl 7-5p FL hsa-miR-488 FL hsa-miR-890 FL hsa-miR-29a/mmu-miR- hsa-miR-505* hsa-miR-938
29a/rno-miR-29a FL FL FL hsa-miR-34b/mmu-miR- ebv-miR-BARTl 6 kshv-miR-K 12-7
34b-3p FL FL FL hsa-miR-32* FL hsa-miR-891 a FL hsa-miR-629* FL hsa-miR-29b/mmu-miR- hsa-miR-221/mmu- hsa-miR-922
29b/rno-miR-29b FL miR-221 /rno-miR-221 FL FL hsa-miR-649 hsa-miR-7/mmu-miR- kshv-miR- 12-5
FL 7a/rno-miR-7a FL FL hsa-miR-576-3p hsa-miR-299-3p hsa-miR- 197/mmu-
FL FL miR- 197 FL hsa-miR-302a/mmu- hsa-miR-575 hsa-miR-552
miR-302a FL FL FL hsa-miR-365/mmu-miR- hsa-miR-585 hsa-miR- 151 -3p
365/rno-miR-365 FL FL FL hsa-miR- 148a/mmu- hsa-miR-30e*/mmu- hsa-miR- 194/mmu- miR- 148a miR-30e*/rno-miR- miR- 194/rno-miR- 194
FL 30e* FL FL hsa-miR-146b-5p/mmu- hcmv-miR-US25- l * hsa-miR-218-2*/mmu- miR- 146b/rno-miR- 146b miR-218-2*/rno-miR-
FL FL 21 8* FL hsa-miR-505/rno-miR- hsa-miR-708/mmu- hsa-miR- 181 b/mmu- 505 miR-708/rno-miR-708 miR- 181 b/rno-miR-
FL FL 181 b FL hsa-miR-33a/mmu-miR- hsv l -miR-H l ebv-miR-BART l 8-3p
33/rno-miR-33 FL FL FL hsa-miR-455-3p hsa-let-7g/mmu-let-7g hsa-miR-34c-5p/mmu- FL FL miR-34c/rno-miR-34c FL
BL vs FL Higher BL vs FL (con't) Higher BL vs FL (con't) Higher in in in hsa-miR-374b/mmu- hsa-miR- 146a/mmu- hsa-miR-622
miR-374/rno-miR-374 miR- 146a/rno-miR-
FL 146a FL FL hsa-miR-214/mmu-miR- ebv-miR-BART8* hsa-miR-514
214/rno-miR-214 FL FL FL hsa-miR-138- 1 */mmu- hsa-miR- 106b*/mmu- hsa-miR-657
miR- 138*/rno-miR-138* miR- 106b*/rno-miR-
FL 106b* FL FL hsa-miR- 140-3p/mmu- hsa-miR-601 hsa-miR-51 8a-3p
miR- 140*/rno-miR-140* FL FL FL hsa-miR-212/mmu-miR- hsa-miR-553 hsa-miR-647
212/rno-miR-212 FL FL FL hsa-miR-29c/mmu-miR- hsa-miR-51 8b hsa-miR-22*/mmu-
29c/rno-miR-29c FL FL miR-22*/rno-miR-22* FL hsa-miR-888* hsa-miR-548d-5p hsa-miR- 196a*/mmu- miR- 196a*/rno-miR-
FL FL 196a* FL hsa-miR-222/mmu-miR- hsa-miR-382/mmu- kshv-miR- 12- l
222/rno-miR-222 FL miR-382/rno-miR-382 FL FL hsa-miR- 1 52/mmu-miR- hsa-miR-630 hsa-miR-425/mmu-
152/rno-miR- 152 FL FL miR-425/rno-miR-425 FL hsa-miR- 1 83*/mmu- hsa-miR- 144* hsa-miR-361 -3p
miR- 183 * FL FL FL hsa-miR-768-5p FL hsa-miR-519d FL hsa-miR-220b FL hsa-miR- 107/mmu-miR- mghv-miR-M l -3 hsa-miR-744/mmu-
107/rno-miR- 107 FL FL miR-744 FL hsa-miR-574-5p/mmu- hsa-miR-497/mmu- hsa-miR-551 a
miR-574-5p FL miR-497/rno-miR-497 FL FL hsa-miR- 154/mmu-miR- hsa-miR-524-5p hsa-miR-301 a/mmu- 154/rno-miR- 154 miR-301 a/rno-miR-
FL FL 301 a FL hsa-miR-620 hsa-miR-500* hsa-miR-92b/mmu- FL FL miR-92b/rno-miR-92b FL hsa-miR-886-5p hsa-miR-920 hsa-miR-487b/mmu- miR-487b/rno-miR-
FL FL 487b FL hsa-miR-208a/mmu- hsa-miR-297/mmu- hsa-miR-363 */rno-miR- miR-208a/rno-miR-208 FL miR-297a FL 363* FL hsa-miR-374b* FL hsa-miR-509-3-5p FL hsa-miR-337-3p FL hsa-miR-525-5p hsa-miR-340*/mmu- hsa-miR-636
miR-340-3p/rno-miR-
FL 340-3p FL FL hsa-miR-363/mmu-miR- hsa-miR-99b*/mmu- hsa-miR-600
363/rno-miR-363 miR-99b*/rno-miR-
FL 99b* FL FL hsa-miR-99b/mmu-miR- hsa-miR-887 hsa-m i R- 138/mmu- 99b/rno-miR-99b FL FL miR- 138/rno-miR- 138 FL
BL vs FL Higher BL vs FL (con't) Higher BL vs FL (con't) Higher in in in hsa-miR- 148b/mmu- hsa-miR-33 1 -3p/mmu- hsa-miR-96/mmu-miR- miR- 148b/rno-miR- miR-33 l -3p/rno-miR- 96/rno-miR-96
148b-3p FL 33 1 FL FL kshv-miR- 12-6-5p hsa-miR-206/mmu- hsa-miR-20b*
FL miR-206/rno-miR-206 FL FL hsa-miR- 125b- 1 */mmu- hsa-miR-377* hsa-miR-342-5p/mmu- m i R- 125 b-3 p/rno-m i R- miR-342-5p/rno-miR-
125b-3p FL FL 342-5p FL hsa-miR-526b FL mghv-miR-M l -8 FL hsa-miR-215 FL hsa-miR-629 FL hsa-miR-513a-3p FL hsa-miR- 129* FL hsa-miR-617 FL hsa-miR- 146b-3p FL
hsa-miR- 124/mmu-miR- hsa-miR- 155*
124/rno-miR- 124 FL FL
Table 27: Predictor microRNAs that distinguish Burkitt lymphoma from Hodgkin's lymphoma
BL vs HL Higher BL vs HL (con't) Higher BL vs HL (con't) Higher in in in hsa-miR- 19b/mmu-miR- hsa-miR-937 hsa-miR-526a/hsa- 19b/rno-miR- 19b miR-520c-5p/hsa-
BL HL miR-518d-5p HL hsa-miR- 19a/mmu-miR- ebv-miR-BART 13 kshv-miR-K 12-5
19a/rno-miR- 19a BL HL HL hsa-miR- 17/mmu-miR- hsa-miR-7/mmu-miR- hsa-miR- 17/rno-miR- l 7-5p/rno- 7a/rno-miR-7a 340*/mmu-miR- miR- 17 340-3p/rno-miR-
BL HL 340-3p HL hsa-miR- 106a hsa-miR-210/mmu-miR- hsa-let-7d*/mmu- BL 210/rno-miR-210 HL let-7d*/mo-let-7d* HL hsa-miR-20a/mmu-miR- hsa-miR-490-3p/mmu- hsa-miR-92b/mmu- 20a/rno-miR-20a miR-490 miR-92b/rno-miR-
BL HL 92b HL hsa-miR- 106b/mmu-miR- hsa-miR-221 * hsa-miR-518b
106b/mo-miR- 106b BL HL HL hsa-miR-30c/mmu-miR- hsa-miR-92a/mmu-miR- hiv l -miR-H l
30c/mo-miR-30c BL 92a/rno-miR-92a HL HL hsa-miR-551 b/mmu-miR- hsa-miR-183 */mmu-miR- hsa-miR-623
551 b/rno-miR-551 b HL 183* HL HL hsa-miR-921 HL hsa-miR-5.13a-3p HL hsa-miR-645 HL ebv-miR-BART2-3p HL hsa-miR-575 HL hsa-miR-601 HL hsa-miR-32* HL hsa-miR-595 HL hsa-miR-519e HL hsa-miR-494/mmu-miR- hsa-miR-920 hsa-miR-650
494/rno-miR-494 HL HL HL hsa-miR-29c/mmu-miR- hsa-miR-483-3p hsa-miR-361 -3p
29c/rno-miR-29c HL HL HL hsa-miR-923 hsa-miR-330-5p/mmu- hsa-miR- miR-330/rno-miR-330 150*/mmu-miR-
HL HL 1 50* HL
BL vs HL Higher BLvsHL(con't) Higher BL vs HL(con't) Higher in in in hsa-miR- 199b-5p hsa-miR-525-5p hsa-miR-
425*/mmu-miR-
HL HL 425* HL hsa-miR- 148a/mmu-miR- hsa-miR-99b/mmu-miR- hsa-miR- 148a 99b/rno-miR-99b 135a*/mmu-miR-
HL HL 135a* HL hsa-miR- 130a/mmu-miR- hsa-miR-509-3p hsa-miR-518a-3p
130a/rno-miR-130a HL HL HL hsa-miR- 154/mmu-miR- hsa-miR-151 -3p hsa-miR-612
154/rno-miR-154 HL HL HL hsa-miR- 151-5p/mmu- ebv-miR-BHRFl-1 hsa-miR-212/mmu- miR-151-5p/rno-miR-15I miR-212/rno-miR-
HL HL 212 HL hsa-miR-28-5p/mmu- hsa-miR-630 hsa-miR-125b- miR-28/rno-miR-28 HL HL 2*/rno-miR-125b* HL hsa-miR-365/mrnu-miR- mghv-miR-M 1 -7-3p hsa-miR-500
365/rno-miR-365 HL HL HL hsa-miR-602 hsa-miR-328/mmu-mi'R- hsa-miR-663
HL 328/rno-miR-328 HL HL hsa-miR-222/mmu-miR- hsa-miR-452 hsa-miR-647
222/rno-miR-222 HL HL HL hsa-miR-214/mmu-miR- hsa-miR-635 hsa-miR-502-5p
214/rno-miR-214 HL HL HL hsa-miR- 144* ebv-miR-BART5 ebv-miR-BART18- HL HL 3p HL hsa-miR- 107/mmu-miR- hsa-miR-373* hsa-miR- 107/rno-miR-107 99b*/mmu-miR-
HL HL 99b*/rno-miR-99b* HL hsa-miR-497/mmu-miR- hsa-miR-96/mmu-miR- ebv-miR-BART7*
497/rno-miR-497 HL 96/rno-miR-96 HL HL hsa-let-7g/mmu-let-7g hsa-miR-382/mmu-miR- hsa-miR-500*
HL 382/rno-miR-382 HL HL hsa-miR-146a/mmu-miR- hsa-miR-155 hsa-miR- 146a/rno-miR-146a 124*/mmu-miR-
HL HL 124*/rno-miR-124* HL hsa-miR-186/mmu-miR- hsa-miR-197/mmu-miR- hsa-miR-206/mmu- 186/rno-miR-186 197 m i R-206/rno-mi R-
HL HL 206 HL hsa-miR-886-5p kshv-miR-K12-6-5p hsa-miR-615-
3p/mmu-miR-615-
HL HL 3p HL hsa-miR- 152/mmu-miR- hcmv-miR-ULl 12 hsa-miR-30c- 152/rno-miR-152 l*/mmu-miR-30c-
HL HL l*/rno-miR-30c-l* HL hsa-miR-29a*/mmu-miR- hsa-miR-551b* hsa-miR-331- 29a*/rno-miR-29a* 5p/mmu-miR-331-
HL HL 5p HL hsa-miR- 140-5p/mmu- hsa-miR-877/mmu hcmv-miR-US25-l* miR-140/rno-miR-140 HL 877/rno-miR-877 HL HL
BL vs HL Higher BL vs HL (con't) Higher BL vs HL (con't) Hig in in ii hsa-miR-532-5p/mmu- hsa-miR-589 hsa-miR-326/mmu- miR-532-5p/rno-miR- miR-326/rno-miR-
532-5p HL HL 326 HL hsa-miR- 145*/mmu-miR- hsa-miR-936 hsa-miR-
145* 1 81 b/mmu-miR-
HL HL 1 81 b/rno-miR- 181 b HL hsa-miR-51 -5p hsa-miR-34c-5p/mmu- hsa-miR-376a*
HL miR-34c/rno-miR-34c HL HL hsa-miR- 153/mmu-miR- hsa-miR-885-5p hsa-miR-433/mmu-
153/rno-miR-153 miR-433/rno-miR-
HL HL 433 HL hsa-miR-5 I 3a-5p HL ebv-miR-BART6-3p HL hsa-miR-640 HL hsa-miR-516a-5p HL hsa-miR-585 HL hsa-miR-938 HL hsa-miR-660 HL hsa-miR-302c* HL hsa-miR-508-5p HL hsa-miR-29c*/mmu-rniR- hsa-miR- 196a*/mmu- hsa-miR-484/mmu-
29c*/rno-miR-29c* miR- 196a*/rno-miR- miR-484/mo-miR-
HL 196a* HL 484 HL hsa-miR-505/rno-miR- hsa-miR- 195* hsa-miR-
505 106b*/mmu-miR- 106b*/rno-miR-
HL HL 106b* HL hsa-miR-455-3p hsa-miR- 17*/rno-miR- 17- hsa-miR-600
HL 3p HL HL hsa-miR-519e* hsa-miR-296-5p/mmu- hsa-let-7b*/mmu- miR-296-5p/rno-miR- let-7b*/rno-let-7b*
HL 296* HL HL hsa-miR-502-3p HL hsa-miR-550* HL hsa-miR-20b* HL hsa-miR-922 HL ebv-miR-BHRFl -3 HL hsa-miR-622 HL hsa-miR-524-5p hsa-miR-296-3p/mmu- hsa-miR-657
HL miR-296-3p/rno-miR-296 HL HL hsa-miR-483-5p hsa-miR-526b* hsa-miR- 183/mmu- miR- 183/mo-miR-
HL HL 183 HL hsa-miR-708/mmu-miR- hsa-miR-548b-3p hsa-miR-409-
708/rno-miR-708 5p/mmu-miR-409-
HL HL 5p/rno-miR-409-5p HL hsa-miR-498 hsa-miR-652/mmu-miR- ebv-miR-BART20-
HL 652/rno-miR-652 HL 3p HL ebv-miR-BART 19-3p hsa-miR-297/mmu-miR- ebv-miR-BART8*
HL 297a HL HL hsa-miR- 149/mmu-miR- hsa-miR-553 hsa-miR- 129*
149 HL HL HL hsa-miR-574-3p/mmu- hsa-miR- 1 94* hsa-miR-629
miR-574-3p HL HL HL hsa-miR-659 hsa-miR-23a*/rno-miR- hsa-miR-890
HL 23a* HL HL hsa-miR-331 -3p/mmu- hsa-miR- 130b/mmu-miR- hsa-miR-208a/mmu- miR-33 1 -3p/rno-miR-33 1 130b/rno-miR- 130b miR-208a/rno-miR-
HL HL 208 HL
BL vs HL Higher BL vs H L (con't) BL vs HL (con't) Higher in in hsa-miR- 105 HL hsa-miR-586 HL hsa-miR-492 HL hsa-miR- 128/mmu-miR- hsa-miR- 137/mmu-miR- hsa-miR-629*
128/rno-miR- 128 HL 137/rno-miR- 137 HL HL hsa-miR-200b*/mmu- hsa-miR-610 hsa-miR-654-5p
miR-200b* HL HL HL hsa-miR-381 /mrnu-miR- mghv-miR-M 1 -8 hsa-miR-584
381/rno-miR-381 HL HL HL hsa-miR-766 HL hsa-miR- 193b* HL hsa-miR-636 HL hsa-miR-557 HL hsa-miR-5 19d HL hsa-miR-490-5p HL ebv-miR-BART 16 hsa-miR- 125b- 1 */mmu- hsa-miR-337-3p
miR- 125b-3p/rno-miR-
HL 125b-3p HL HL hsa-miR-488 hsa-miR-744/mmu-miR- hsa-miR-9*/mmu-
HL 744 HL miR-9*/rno-miR-9* HL hsa-miR-516b hsa-miR- 138/mmu-miR- ebv-miR-BART9*
HL 138/rno-miR-138 HL HL mghv-miR-M 1 -2 HL hsa-miR-21 * HL hsa-miR-509-3-5p HL hsa-miR-891 a hsa-miR-576-5p hsa-miR-342- 5p/mmu-miR-342-
HL HL 5 p/rn o-miR-342-5p HL hsa-miR-221 /mmu- hsa-miR- 125a-3p/mmu- hsa-miR-514
221 /rno-miR-221 miR- 125a-3p/rno-miR-
HL 125a-3p HL HL hsa-miR- 146b-3p HL mghv-miR-M 1 -6 HL hsa-miR-377* HL hsa-miR-526b hsa-miR-425/mmu-miR- kshv-miR- 12- l
HL 425/rno-miR-425 HL HL mghv-miR-M l -3 hsa-miR- 10a*/mmu-miR- hsa-miR- 124/mmu- 10a*/rno-miR- 10a-3p miR- 124/rno-miR-
HL HL 124 HL hsa-miR-505* hsa-miR-215 hsa-miR-542-
3p/mmu-miR-542-
HL HL 3p/rno-miR-542-3p HL hsv l -miR-H l HL hsa-miR-345 HL hsa-miR-220b HL hcmv-miR-UL70-3p HL hsa-miR-887 HL hsa-miR-299-3p HL hsa-miR-24-2*/mmu- hsa-miR-7-2* hsa-miR- 181 a-2*
m i R-24-2 */rno-mi R-24- 2* HL HL HL hsa-miR-617 HL hsa-miR- 122* HL hsa-miR-202 HL hsa-miR- 194/mmu-miR- hsa-miR-363*/rno-miR- hsa-miR-
1 4/rno-miR- 194 363* 487b/mmu-miR-
HL HL 487b/rno-miR-487b HL hsa-miR-934 hsa-rniR-22*/mmu-miR- hsa-miR-551 a
HL 22*/rno-miR-22* HL HL hsa-miR-220c hsa-miR-542-5p/mmu- hsa-miR-338- miR-542-5p/rno-miR- 5p/mmu-miR-338-
HL 542-5p HL 5p/rno-miR-338* HL hsa-miR-548d-5p HL hsa-miR-92b* HL hsa-miR-552 HL
Table 28: Predictor microRNAs that distinguish chronic lymphocytic leukemia from follicular lymphoma
CLL vs FL Higher CLL vs FL (con't) Higher CLL vs FL (con't) Hi, in in i hsa-miR-331-5p/mmu- hsa-miR-620 hsa-miR-9*/mmu- miR-331-5p CLL FL miR-97rno-miR-9* FL hsa-miR-144/mmu-miR- hsa-miR-99a/mmu- hsa-miR-509-3-5p
144/rno-miR-144 miR-99a/rno-miR-
CLL 99a FL FL hsa-miR-150/mmu-miR- hsa-miR-371-5p hsa-miR-518b
150/rno-miR-150 CLL FL FL hsa-miR-140-5p/mmu- hsa-miR-452 hsa-miR-183*/mmu- miR-140/rno-miR-140 CLL FL miR-183* FL hsa-miR-335/mmu-miR- hsa-miR-1267mmu- hsa-miR-125b-
335-5p/rno-miR-335 miR-126-5p/rno- 1 */mmu-miR-125b-
CLL miR-126* FL 3p/rno-miR-125b-3p FL hsa-miR-186/mmu-miR- hsa-miR-298 hsa-miR-183/mmu-
186/rno-miR-186 miR-183/rno-miR-
CLL FL 183 FL hsa-miR-486-5p/mmu- hsa-miR-193a-5p hsa-miR-890
miR-486 CLL FL FL hsa-miR-154/mmu-miR- hsa-miR-583 hsa-miR-153/mmu-
154/rno-miR-154 miR-153/rno-miR-
CLL FL 153 FL hsa-miR-223/mmu-miR- hsa-miR-143/mmu- hsa-miR-874/mmu-
223/rno-miR-223 miR-143/rno-miR- miR-874/rno-miR-
CLL 143 FL 874 FL hsa-miR-299-5p/mmu- hsa-miR-665 hsa-miR-220c
miR-299*/rno-miR-299 CLL FL FL hsa-let-7g/mmu-let-7g hsa-miR-505/rno- hsa-miR-99b7mmu- miR-505 miR-99b7rno-miR-
CLL FL 99b* FL hsa-miR-32/mmu-miR- hsa-miR-199b-5p hsa-miR-193b*
32/rno-miR-32 CLL FL FL hsa-miR-30e*/mmu-miR- hsa-miR-28-3p/rno- hsa-miR-629*
30e*/rno-miR-30e* CLL miR-28* FL FL hsa-miR-147 CLL hsa-miR-422a FL hcmv-miR-UL148D FL hsa-miR-20b/mmu-miR- hsa-rriiR-515-5p ebv-miR-BART7*
20b/rno-miR-20b-5p CLL FL FL hsa-miR-101/mmu-miR- hsa-miR-455-3p hsa-miR-99b/mmu-
101a/rno-miR-101a miR-99b/rno-miR-
CLL FL 99b FL hsa-let-7f/mmu-let-7f/rno- hsa-miR-1 Oa/mmu- hsa-miR-206/mmu- let-7f miR-10a/rno-miR- miR-206/rno-miR-
CLL 10a-5p FL 206 FL hsa-miR-30e/mmu-miR- hsa-miR-300 hsa-miR-381/mmu-
30e/rno-miR-30e miR-381/rno-miR-
CLL FL 381 FL hsa-miR-668/mmu-miR- ebv-miR-BART5 hsa-miR-194/mmu-
668 miR-194/rno-miR-
CLL FL 194 FL hsa-miR-768-5p hsa-miR-1 Ob/mmu- hsa-miR-525-5p
miR-10b/rno-miR-
CLL 10b FL FL
CLL vs FL Higher CLL vs FL (con't) Higher CLL vs FL (con't) Higher in in in hsa-miR-19a/mmu-miR- hsa-miR-212/mmu- hsa-miR-193b
19a/rno-miR-19a miR-212/rno-miR-
CLL 212 FL FL hsa-miR-199a-5p/mmu- hsa-miR-145/mmu- hsa-miR-497/mmu- miR-199a-5p/rno-miR- miR-145/rno-miR- miR-497/rno-miR-
199a-5p CLL 145 FL 497 FL hsa-miR-638 hsa-miR-187* ebv-miR-BART18-
CLL FL 3p FL hsa-miR-196a7mmu-miR- ebv-miR-BHRF1-1 hsa-miR-424
196a*/rno-miR-196a* CLL FL FL hsa-miR-19b/mmu-miR- ebv-miR-BHRF1-2 hsa-miR-553
19b/rno-miR-19b CLL FL FL hsa-miR-30d/mmu-miR- hsa-miR-126/mmu- hsa-let-7d*/mmu-let-
30d/rno-miR-30d miR-126-3p/rno- 7d*/rno-let-7d*
CLL miR-126 FL FL hsa-miR-363/mmu-miR- hsa-miR- hsa-miR-34c-
363/rno-miR-363 130b*/mmu-miR- 5p/mmu-miR-
CLL 130b* FL 34c/rno-miR-34c FL hsa-miR-374a hsa-miR-326/mmu- ebv-miR-BHRF1-3
miR-326/rno-miR-
CLL 326 FL FL hsa-miR-140-3p/mmu- mghv-miR-M1 -2 kshv-miR- 12-6-5p miR-140*/rno-miR-140* CLL FL FL hsa-miR-185/mmu-miR- kshv-miR-K12-6-3p hsa-miR-551 a
185/rno-miR-185 CLL FL FL hsa-miR-106b/mmu-miR- hsa-miR-516b · hsa-miR-195*
106b/rno-miR-106b CLL FL FL hsa-miR-106a CLL hsa-miR-519e* FL hsa-miR-551 b* FL hsa-miR-191/mmu-miR- mghv-miR-M1-7-3p hsa-miR-514
191/rno-miR-191 CLL FL FL hsa-miR-17/mmu-miR- hsa-miR-629 hsa-miR-552
17/rno-miR-17-5p/rno- miR-17 CLL FL FL hsa-let-7i/mmu-let-7i/rno- hsa-miR-24-2*/mmu- hsa-miR-122*
let-7i miR-24-2*/rno-miR-
CLL 24-2* FL FL hsa-miR-20a/mmu-miR- hsa-miR-943 hsa-miR-92b/mmu-
20a/rno-miR-20a miR-92b/rno-miR-
CLL FL 92b FL hsa-miR-142-5p/mmu- hsa-miR-124/mmu- hsa-miR-22*/mmu- miR-142-5p/rno-miR-142- miR-124/rno-miR- miR-22*/rno-miR-
5p CLL 124 FL 22* FL hsa-miR-768-3p hsa-miR-365/mmu- hsa-miR-635
miR-365/rno-miR-
CLL 365 FL FL hsa-miR-30b/mmu-miR- hsa-miR-493 kshv-miR-K12-1
30b/rno-miR-30b-5p CLL FL FL hsa-miR-891 a hsa-miR-29c*/mmu- hsa-miR-483-5p
miR-29c*/rno-miR-
CLL 29c* FL FL hsa-miR-24-1 */mmu-miR- hsa-miR-602 hsa-miR-340*/mmu-
24-1*/rno-miR-24-1* miR-340-3p/rno-
CLL FL miR-340-3p FL
CLL vs FL Higher CLL vs FL (con't) Higher CLL vs FL (con't) Higher in in in hsa-miR-29c/mmu-miR- hsa-miR-484/mmu- hsa-miR-615-
29c/rno-miR-29c miR-484/rno-miR- 3p/mmu-miR-615-3p
CLL 484 FL FL hsa-miR-28-5p/mmu-miR- hsa-miR-483-3p hsa-miR-505*
28/rno-miR-28 CLL FL FL hsa-miR-30a/mmu-miR- hsa-miR-125b- hsa-miR-622
30a/rno-miR-30a CLL 2*/rno-miR-125b* FL FL hsa-miR-155 hsa-miR-675 hsa-miR-181 b/mmu- miR-181 b/rno-miR-
CLL FL 181b FL hsa-miR-361-5p/mmu- mghv-miR-M1-7-5p hsa-miR-886-5p
miR-361/rno-miR-361 CLL FL FL hsa-miR-15a/mmu-miR- hsa-miR-152/mmu- hsa-miR-885-5p
15a miR-152/rno-miR-
CLL 152 FL FL hsa-miR-26a/mmu-miR- hsa-miR-27a7mmu- hsa-miR-220b
26a/rno-miR-26a miR-27a*/rno-miR-
CLL 27a* FL FL hsa-miR-30c/mmu-miR- hsa-miR-542- hsa-miR-524-5p
30c/rno-miR-30c 3p/mmu-miR-542-
CLL 3p/rno-miR-542-3p FL FL hsa-miR-541 * hsa-miR-100/mmu- hsa-miR-382/mmu- miR-100/rno-miR- miR-382/rno-miR-
CLL 100 FL 382 FL hsa-miR-26b/mmu-miR- hsa-miR-208a/mmu- hsa-miR-744/mmu-
26b/rno-miR-26b miR-208a/rno-miR- miR-744
CLL 208 FL FL hsa-miR-519d CLL hsa-miR-766 FL hsv1-miR-H1 FL hsa-miR- 15b/mmu-miR- hsa-miR-637 hsa-miR-526b
15b/rno-miR-15b CLL FL FL hsa-miR-550 hsa-miR-519c- hsa-miR-657
5p/hsa-miR-519b-
5p/hsa-miR-
523*/hsa-miR-
518e*/hsa-miR-
CLL 522*/hsa-miR-519a* FL FL hsa-miR-29b/mmu-miR- hsa-miR-409- hsa-miR-130b/mmu-
29b/rno-miR-29b 5p/mmu-miR-409- miR-130b/rno-miR-
CLL 5p/rno-miR-409-5p FL 130b FL hsa-miR-29a/mmu-miR- hsa-miR-199a- hsa-miR-181 a/mmu-
29a/rno-miR-29a 3p/hsa-miR-199b- miR-181a/rno-miR- 3p/mmu-miR-199a- 181 a
3p/mmu-miR- 199b/rno-miR-199a-
CLL 3p FL FL hsa-miR-103/mmu-miR- hsa-miR- hsa-miR-301a/mmu-
103/rno-miR-103 106b*/mmu-miR- miR-301a/rno-miR- 106b*/rno-miR- 301a
CLL 106b* FL FL hsa-miR-423-3p/mmu- hsa-miR-130a/mmu- hsa-miR-490- miR-423-3p/rno-miR-423 miR-130a/rno-miR- 3p/mmu-miR-490
CLL 130a FL FL hsa-miR-549 hsa-miR-645 hsa-miR-485-
CLL FL 3p/mmu-miR-485* FL
CLL vs FL CLL vs FL (con't) Higher CLL vs FL (con't) Higher in hsa-miR-107/mmu-miR- hsa-miR-548d-5p hsa-miR-297/mmu-
107/rno-miR-107 CLL FL miR-297a FL hsa-miR-888* hsa-miR-671- hsa-miR-630
CLL 5p/mmu-miR-671 -5p FL FL sa-miR-801 /mmu-miR- hsa-miR-574- sa-miR-877/mmu- 801 3p/mmu-miR-574-3p miR-877/rno-miR-
CLL FL 877 FL hsa-miR-149* hsa-miR-125b/mmu- kshv-miR-K12-5
miR-125b-5p/rno-
FL miR-125b-5p FL FL hsa-miR-634 FL hsa-miR-500* FL hsa-miR-617 FL ebv-miR-BART2-3p hsa-miR-425/mmu- mghv-miR-M1-3
miR-425/rno-miR-
FL 425 FL FL hsa-miR-921 FL ebv-miR-BART8* FL hsa-miR-920 FL hsa-miR-494/mmu-miR- sa-miR-377* hsa-miR-585
494/rno-miR-494 FL FL FL hsa-miR-933 FL hsa-miR-513a-3p FL hsa-miR-374b* FL mghv-miR-M1-4 FL hsa-miR-181a-2* FL hsa-miR-215 FL hsa-let-7e/mmu-let-7e/rno- hsa-miR-938 hsa-miR-342- let-7e 5p/mmu-miR-342-
FL FL 5p/rno-miR-342-5p FL hsa-miR-939 FL hsa-miR-155* FL hsa-miR-934 FL hsa-miR-518c* hsa-miR-218- hsa-miR-575
27mmu-miR-218-
FL 27rno-miR-218* FL FL hsa-miR-32* FL hsa-miR-198 FL hsa-miR-488 FL hsa-miR-491-3p FL hsa-miR-151-3p FL ebv-miR-BART16 FL hsa-miR-185/mmu-miR- hsa-miR-299-3p hsa-miR-647
185/rno-miR-185 FL FL FL hsa-miR-765 hcmv-miR-US25-r hsa-miR-138/mmu- miR-138/rno-miR-
FL FL 138 FL ebv-miR-BART17-5p hsa-miR-708/mmu- sa-miR-221 *
miR-708/rno-miR- FL 708 FL FL hsa-miR-576-3p hsa-miR-659 hsa-miR-
200b*/mmu-miR-
FL FL 200b* FL hsa-miR-658 FL hsa-miR-600 FL hsa-miR-337-3p FL hsa-miR-503 FL hsa-miR-601 FL hsa-miR-922 FL hsa-miR-30b* hsa-miR-296- hsa-miR-197/mmu-
3p/mmu-miR-296- miR-197
FL 3p/rno-miR-296 FL FL hsa-miR-302a/mmu-miR- hsa-let-7b7mmu-let- hsa-miR-96/mmu- 302a FL 7b7rno-let-7b* FL miR-96/rno-miR-96 FL hsa-miR-628-3p FL ebv-miR-BART6-3p FL hsa-miR-518a-3p FL hsa-miR-642 FL hsa-miR-7-2* FL
Table 29: Predictor microRNAs that distinguish Burkitt lymphoma from Hodgkin's lymphoma
CLL s HL Higher CLL vs HL (con't) Higher CLL vs HL (con't) Hii in in in hsa-miR-32/mmu-miR- hsa-miR-145/mmu- hsa-miR-886-5p
32/rno-miR-32 miR-145/rno-miR-
CLL 145 HL HL hsa-miR-30e*/mmu-miR- hsa-miR-128/mmu- hsa-miR-500
30e7rno-miR-30e* miR-128/rno-miR-
CLL 128 HL HL hsa-let-7g/mmu-let-7g hsa-miR-532- hsa-miR-502-5p
5p/mmu-miR-532-
CLL 5p/mo-miR-532-5p HL HL hsa-miR-144/mmu-miR- hsa-miR-143* . ebv-miR-BART18-
144/rno-miR-144 CLL HL 3p HL hsa-miR-140-5p/mmu- hsa-miR-28-3p/rno- hsa-miR-198
miR-140/rno-miR-140 CLL miR-28* HL HL hsa-miR-19a/mmu-miR- hsa-miR- hsa-miR-500*
19a/rno-miR-19a 130b*/mmu-miR-
CLL 130b* HL HL hsa-miR-154/mmu-miR- hsa-miR-505/rno- hsa-miR-342-
154/rno-miR-154 miR-505 5p/mmu-miR-342-
CLL HL 5p/rno-miR-342-5p HL hsa-miR-150/mmu-miR- hsa-miR-25* hsa-miR-124*/mmu-
150/rno-miR-150 miR-124*/rno-miR-
CLL HL 124* HL hsa-miR-28-5p/mmu- hsa-miR-574- hsa-miR-30c- miR-28/rno-miR-28 3p/mmu-miR-574-3p 1 */mmu-miR-30c-
CLL HL 1 */rno-miR-30c-1* HL hsa-miR-363/mmu-miR- hsa-miR-455-3p hsa-miR-220c
363/rno-miR-363 CLL HL HL hsa-miR-101/mmu-miR- kshv-miR-K12-3 hsa-miR-376a*
101a/rno-miR-101a CLL HL HL hsa-miR-299-5p/mmu- hsa-miR-516b hsa-miR-640
miR-299*/rno-miR-299 CLL HL HL hsa-miR-768-5p CLL kshv-miR-K12-8 HL hcmv-miR-UL148D HL hsa-miR-19b/mmu-miR- hsa-miR-502-3p hsa-miR-659
19b/rno-miR-19b CLL HL HL hsa-miR-30e/mmu-miR- kshv-miR-K12-6-3p hsa-miR-934
30e/rno-miR-30e CLL HL HL hsa-miR-20b/mmu-miR- hsa-miR-129- hsa-miR-125a-
20b/rno-miR-20b-5p 5p/mmu-miR-129- 3p/mmu-miR-125a-
CLL 5p/rno-miR-129 HL 3p/rno-miR-125a-3p HL hsa-miR-374a CLL hsa-miR-5 5-5p HL hsa-miR-885-5p HL hsa-let-7f/mmu-let-7f/rno- hsa-miR-199a- hsa-miR-24- let-7f 3p/hsa-miR-199b- 2*/mmu-miR-24-
3p/mmu-miR-199a- 2*/rno-miR-24-2*
3p/mmu-miR-
199b/rno-miR-199a-
CLL 3p HL HL hsa-miR-335/mmu-miR- hsa-miR-149/mmu- hsa-miR-484/mmu-
335-5p/rno-miR-335 miR-149 miR-484/mo-miR-
CLL HL 484 HL
CLL vs HL Higher CLL vs HL (con't) Higher CLL vs HL (con't) Higher in in in hsa-miR-142-5p/mmu- hsa-miR-889 hsa-miR- miR-142-5p/rno-miR-142- 106b*/mmu-miR-
5p 106b*/rno-miR-
CLL HL 106b* HL hsa-miR-486-5p/mmu- hsa-miR-637 hsa-miR-505*
miR-486 CLL HL HL hsa-miR-33a/mmu-miR- hsa-miR-600 hsa-let-7b*/mmu-let-
33/rno-miR-33 CLL HL 7b*/rno-let-7b* HL hsa-miR-30b/mmu-miR- hsa-miR-151 -3p hsa-miR-302c*
30b/rno-miR-30b-5p CLL HL HL hsa-miR-768-3p hsa-miR-656 hsa-miR-542- 5p/mmu-miR-542-
CLL HL 5p/rno-miR-542-5p HL hsa-miR-668/mmu-miR- hsa-miR-497/mmu- hsv1 -miR-H1
668 miR-497/rno-miR-
CLL 497 HL HL hsa-miR-15b/mmu-miR- hsa-miR-152/mmu- mghv-miR-M1 -3
15b/rno-miR-15b miR-152/rno-miR-
CLL 152 HL HL hsa-miR-196a*/mmu- hsa-miR-100/mmu- hsa-miR-183/mmu- miR-196a*/rno-miR-196a* miR-100/rno-miR- miR-183/mo-miR-
CLL 100 HL 183 HL hsa-miR-140-3p/mmu- hsa-miR-425/mmu- hsa-miR-122*
miR-140*/rno-miR-140* miR-425/rno-miR-
CLL 425 HL HL hsa-miR-29b/mmu-miR- hsa-miR-145*/mmu- hsa-miR-183*/mmu-
29b/rno-miR-29b CLL miR-145* HL miR-183* HL hsa-miR-29c/mmu-miR- hsa-miR-365/mmu- hsa-miR-675
29c/rno-miR-29c miR-365/rno-miR-
CLL 365 HL HL hsa-miR-186/mmu-miR- hsa-miR-422a hsa-miR-99b/mmu-
186/rno-miR-186 miR-99b/rno-miR-
CLL HL 99b HL hsa-miR- 06a hcmv-miR-UL70-3p hsa-miR-874/mmu- miR-874/rno-miR-
CLL HL 874 HL hsa-miR-26a/mmu-miR- hsa-miR-27a*/mmu- ebv-miR-BART20-
26a/rno-miR-26a miR-27a*/rno-miR- 3p
CLL 27a* HL HL hsa-miR-106b/mmu-miR- hsa-miR-194/mmu- hsa-miR-483-5p
106b/rno-miR-106b miR-194/rno-miR-
CLL 194 HL HL hsa-miR-17/mmu-miR- hsa-miR-548d-5p hsa-miR-671 -
17/rno-miR- 17-5p/rno- 5p/mmu-miR-671 -5p miR-17 CLL HL HL hsa-miR-191/mmu-miR- hsa-miR-187* hsa-miR-629
191/rno-miR-191 CLL HL HL hsa-miR-20a/mmu-miR- hsa-miR-323- hsa-miR-553
20a/rno-miR-20a 3p/mmu-miR-323-
CLL 3p/rno-miR-323 HL HL hsa-miR-30c/mmu-miR- hsa-miR-708/mmu- hsa-let-7d*/mmu-let-
30c/rno-miR-30c miR-708/rno-miR- 7d*/rno-let-7d*
CLL 708 HL HL
CLL vs HL Higher CLL vs HL (con't) Higher CLL vs HL (con't) Higher in in in hsa-miR-26b/mmu-miR- hsa-miR-29c*/mmu- hsa-miR-601
26b/rno-miR-26b miR-29c7rno-miR-
CLL 29c* HL HL hsa-miR-147 CLL hsa-miR-513a-3p HL hsa-miR-645 HL hsa-miR-15a/mmu-miR- hsa-miR-595 hsa-miR-920
15a CLL HL HL hsa-miR-30d/mmu-miR- hsa-miR-483-3p hsa-miR-525-5p
30d/rno-miR-30d CLL HL HL hsa-miR-199a-5p/mmu- hsa-miR-330- hsa-miR-221*
miR-199a-5p/rno-miR- 5p/mmu-miR-
199a-5p CLL 330/rno-miR-330 HL HL hsa-miR-29a/mmu-miR- hsa-miR-519e* hsa-miR-89.0
29a/rno-miR-29a CLL HL HL hsa-miR-223/mmu-miR- hsa-miR-509-3p hsa-miR-492
223/rno-miR-223 CLL HL HL hsa-miR-30a/mmu-miR- hsa-miR-328/mmu- hsa-miR-629*
30a/rno-miR-30a miR-328/rno-miR-
CLL 328 HL HL hsa-miR-16/mmu-miR- hsa-miR-373* hsa-miR-635
16/rno-miR-16 CLL HL HL hsa-miR-451/mmu-miR- hsa-miR-96/mmu- hsa-miR-130b/mmu-
451/rno-miR-451 miR-96/rno-miR-96 miR-130b/rno-miR-
CLL HL 130b HL hsa-miR-24-1 */mmu-miR- hsa-miR-215 hsa-miR-197/mmu-
24-1*/rno-miR-24-1* CLL HL miR-197 HL hsa-miR-550 CLL hsa-miR-589 HL hsa-miR-654-5p HL hsa-miR-342-3p/mmu- hsa-miR-34c- hsa-miR-518b
miR-342-3p/rno-miR-342- 5p/mmu-miR-
3p CLL 34c/rno-miR-34c HL HL hsa-miR-195/mmu-miR- hsa-miR-125b/mmu- hsa-miR-382/mmu-
195/rno-miR-195 miR-125b-5p/rno- miR-382/rno-miR-
CLL miR-125b-5p HL 382 HL hsa-miR-801/mmu-miR- hsa-miR-130a/mmu- hsa-miR-584
801 miR-130a/rno-miR-
CLL 130a HL HL hsa-miR-541 * hsa-miR-519c- hsa-miR-99b7mmu-
5p/hsa-miR-519b- miR-99b*/rno-miR-
5p/hsa-miR- 99b*
5237hsa-miR-
518e*/hsa-miR-
CLL 522*/hsa-miR-519a* HL HL hsa-let-7i/mmu-let-7i/rnc- mghv-miR-M1-7-5p hsa-miR-630
let-7i CLL HL HL hsa-miR-155 CLL hsa-miR-516a-5p HL hsa-miR-490-5p HL hsa-miR-185/mmu-miR- hsa-miR-424 hsa-miR-663
185/rno-miR-185 CLL HL HL hsa-miR-891a hsa-miR-177rno- hsa-miR-337-3p
CLL miR-17-3p HL HL hsa-miR-138-1 */mmu- hsa-miR-296- hsa-miR-9*/mmu- miR-1387rno-miR-138* 5p/mmu-miR-296- miR-9*/rno-miR-9*
CLL 5p/rno-miR-296* HL HL hsa-miR-27b/mmu-miR- hsa-miR-550* hsa-miR-202
27b/rno-miR-27b CLL HL HL
CLL vs HL Higher CLL vs HL (con't) Higher CLL vs HL (con't) Higher in in in hsa-miR-361-5p/mmu- hsa-miR-210/mmu- ebv-miR-BART16 miR-361/rno-miR-361 miR-210/rno-miR-
CLL 210 HL HL hsa-miR-129* hsa-miR-92b/mmu- ebv-miR-BART9*
mi'R-92b/rno-miR-
CLL 92b HL HL hsa-miR-638 CLL hsa-miR-548b-3p HL hsa-miR-193b* HL hsa-miR-34b/mmu-miR- hsa-miR-652/mmu- ebv-miR-BART8*
34b-3p miR-652/rno-miR-
CLL 652 HL HL hsa-miR-107/mmu-miR- hsa-miR-138/mmu- hsa-miR-206/mmu-
107/rno-miR-107 miR-138/rno-miR- miR-206/rno-miR-
CLL 138 HL 206 HL hsa-miR-549 CLL hsa-miR-194* HL hcmv-miR-US25-1* HL hsa-miR-888* hsa-miR-23a*/rno- hsa-miR-514
CLL miR-23a* HL HL hsa-miR-423-3p/mmu- hsa-miR-153/mmu- kshv-miR-K12-6-5p miR-423-3p/rno-miR-423 miR-153/rno-miR-
CLL 153 HL HL hsa-let-7e/mmu-let- hsa-miR-586 hsa-miR-488
7e/rno-let-7e HL HL HL hsa-miR-125a-5p/mmu- hsa-miR-137/mmu- hsa-miR-508-5p
miR-125a-5p/rno-miR- miR-137/rno-miR-
125a-5p HL 137 HL HL hsa-miR-576-3p HL hsa-miR-610 HL hsa-miR-551 b* HL hsa-miR-513a-5p hsa-miR-381/mmu- hsa-miR-377*
miR-381/rno-miR-
HL 381 HL HL ebv-miR-BART17-5p HL hsa-miR-936 HL ebv-miR-BART6-3p HL hsa-miR-185/mmu-miR- hsa-miR-744/mmu- hsa-miR-181 b/mmu-
185/rno-miR-185 miR-744 miR-181 b/rno-miR-
HL HL 181 b HL hsa-miR-921 HL ebv-miR-BART5 HL hsa-miR-526b HL hsa-miR-518c* HL ebv-miR-BHRF1-1 HL hsa-miR-622 HL hsa-miR-520d-5p HL hsa-miR-21* HL kshv-miR-K12-1 HL hsa-miR-939 hsa-miR-576-5p hsa-miR-485-
HL HL 3p/mmu-miR-485* HL hsa-miR-634 mghv-miR-M1-6 hsa-miR-490-
HL HL 3p/mmu-miR-490 HL hsa-miR-491-3p hsa-miR-193b hsa-miR-125b- 1 */mmu-miR-125b-
HL HL 3p/rno-miR-125b-3p HL ebv-miR-BART2-3p hsa-miR-10a*/mmu- hsa-miR-124/mmu- miR-10a*/rno-miR- miR-124/rno-miR-
HL 10a-3p HL 124 HL hsa-miR-30c-27mmu- hsa-miR-524-5p hsa-miR-657
miR-30c-27rno-miR-30c-
2* HL HL HL hsa-miR-765 HL hsa-miR-452 HL ebv-miR-BHRF1-3 HL hsa-miR-923 hsa-miR-345 hsa-miR-542- 3p/mmu-miR-542-
HL HL 3p/rno-miR-542-3p HL hsa-miR-620 HL hsa-miR-7-2* HL kshv-miR-K12-5 HL
CLL vs HL Higher CLL vs HL (con't) Higher CLL vs HL (con't) Hij in in i hsa-miR-933 hsa-miR-409- hsa-miR-943
5p/mmu-miR-409-
HL 5p/rno-miR-409-5p HL HL hsa-miR-143/mmu-miR- hsa-miR-557 hsa-miR-551 a
143/rno-miR-143 HL HL HL hsa-miR-494/mmu-miR- hsa-miR-181 a/mmu- hsa-miR-297/mmu-
494/rno-miR-494 miR-181a/rno-miR- miR-297a
HL 181 a HL HL hsa-miR-665 hsa-miR-227mmu- hsa-miR-296- miR-227rno-miR-22* 3p/mmu-miR-296-
HL HL 3p/rno-miR-296 HL hsa-miR-642 HL hsa-miR-922 HL hsa-miR-61 HL hsa-miR-1267mmu-miR- hsa-miR-92b* hsa-miR-195*
126-5p/rno-miR-126* HL HL HL hsa-miR-658 HL hsa-miR-938 HL hsa-miR-575 HL hsa-miR-149* hsa-miR-526a/hsa- hsa-miR-208a/mmu- miR-520c-5p/hsa- miR-208a/rno-miR-
HL miR-518d-5p HL 208 HL hsa-miR-30b* HL hsa-miR-526b* HL hsa-miR-647 HL mghv-miR-M1-4 HL ebv-miR-BHRF1-2 HL hsa-miR-509-3-5p HL hsa-miR-99a/mmu-miR- hiv1-miR-H1 hsa-miR-3407mmu-
99a/mo-miR-99a miR-340-3p/rno-
HL HL miR-340-3p HL sa-miR-193a-5p HL hsa-miR-623 HL hsa-miR-220b HL hsa-miR-498 mghv-miR-M1-2 hsa-miR-
200b7mmu-miR-
HL HL 200b* HL hsa-miR-628-3p HL mghv-miR-M1-7-3p HL hsa-miR-585 HL hsa-miR-185* hsa-miR-519e hsa-miR-877/mmu- miR-877/rno-miR-
HL HL 877 HL hsa-miR-371-5p hsa-miR-650 hsa-miR-326/mmu- miR-326/rno-miR-
HL HL 326 HL hsa-miR-199b-5p HL hsa-miR-766 HL ebv-miR-BART7* HL hsa-miR-126/mmu-miR- hsa-miR-602 hsa-miR-615-
126-3p/rno-miR-126 HL HL 3p/mmu-miR-615-3p HL hsa-miR-503 hsa-miR-425*/mmu- hsa-miR-433/mmu- miR-425* miR-433/rno-miR-
HL HL 433 HL hsa-miR-1 Oa/mmu-miR- hsa-miR- hsa-miR-338-
10a/rno-miR-10a-5p 135a*/mmu-miR- 5p/mmu-miR-338-
HL 135a* HL 5p/rno-miR-338* HL hsa-miR-300 HL hsa-miR-612 HL hsa-miR-299-3p HL hsa-miR-583 hsa-miR-212/mmu- hsa-miR-518a-3p
miR-212/rno-miR-
HL 212 HL HL hsa-miR-518a-5p/hsa- hsa-miR-125b- hsa-miR-181 a-2* miR-527 HL 2*/rno-miR-125b* HL HL hsa-miR-1 Ob/mmu-miR- hcmv-miR-UL1 12 hsa-miR-552
10b/rno-miR-10b HL HL HL hsa-miR-374b* HL
Table 30: Predictor microRNAs that distinguish follicular lymphoma from Hodgkin's lymphoma
FL vs HL Higher FL vs HL (con't) Higher FL vs HL (con't) Hi{ in in 1 hsa-miR-301a/mmu-miR- mghv-miR-M 1 -7-5p ebv-miR-BHRF1-2
301a/rno-miR-301a FL HL HL kshv-miR-K12-7 hsa-miR-498 hsa-miR-145*/mmu-
FL HL miR-145* HL hsa-miR-96/mmu-miR- hsa-miR-525-5p hsa-miR-296-5p/mmu-
96/rno-miR-96 miR-296-5p/rno-miR-
FL HL 296* HL hsa-miR-151 -5p/mmu- hsa-miR-520d-5p hsa-miR-17*/rno-miR- miR-151-5p/rno-miR-151 FL HL 17-3p HL hsa-miR-28-5p/mmu-miR- hsa-miR-551 b* hsa-miR-452
28/rno-miR-28 FL HL HL hsa-miR-302a/mmu-miR- hsa-miR-340*/mmu- hsa-miR-943
302a mi'R-340-3p/rno-
FL miR-340-3p HL HL hsa-miR-215 hsa-miR-889 hsa-miR-326/mmu-miR-
FL HL 326/rno-miR-326 HL hsa-miR-15b/mmu-miR- hsa-miR-494/mmu- hsa-miR-652/mmu-miR-
15b/rno-miR-15b miR-494/rno-miR- 652/rno-miR-652
FL 494 HL HL hsa-miR-29b/mmu-miR- hsa-miR-874/mmu- hsa-miR-623
29b/rno-miR-29b miR-874/rno-miR-
FL 874 HL HL hsa-miR-138/mmu-miR- hsa-miR-30c- hsa-miR-194*
138/rno-miR-138 2*/mmu-miR-30c-
FL 2*/rno-miR-30c-2* HL HL hsa-miR-363/mmu-miR- hsa-miR-183*/mmu- hsa-miR-557
363/mo-miR-363 FL miR-183* HL HL hsa-miR-142-5p/mmu- hsa-miR-25* hsa-miR-125a-3p/mmu- miR-142-5p/rno-miR-142- miR-125a-3p/rno-miR-
5p FL HL 125a-3p HL hsa-miR-19a/mmu-miR- hsa-miR-513a-5p hsa-miR-425*/mmu-
19a/rno-miR-19a FL HL miR-425* HL hsa-miR-497/mmu-miR- hsa-miR-198 hsa-miR-10a*/mmu-
497/rno-miR-497 miR-10a*/rno-miR-10a-
FL HL 3p HL hsa-miR-144* hsa-miR-659 hsa-miR-323-3p/mmu- miR-323-3p/rno-miR-
FL HL 323 HL hsa-miR-16/mmu-miR- mghv-miR-M 1-4 hsa-miR-519e
16/rno-miR-16 FL HL HL hsa-miR-138-1 */mmu- hsa-miR-129- hsa-miR-502-5p
miR-1387rno-miR-138* 5p/mmu-miR-129-
FL 5p/rno-miR-129 HL HL hsa-miR-768-5p ebv-miR-BART13 hsa-miR-124*/mmu-
FL HL miR-124*/rno-miR-124* HL hsa-miR-30c/mmu-miR- hsa-miR-193b* hsa-miR-345
30c/rno-miR-30c FL HL HL hsa-miR-129* FL hsa-miR-422a HL hsa-miR-584 HL hsa-miR-801/mmu-miR- hsa-miR-503 hsa-miR-654-5p
801 FL HL HL
FL vs HL Higher FL vs HL (con't) Higher FL s HL (con't) Higher in in in hsa-miR-34b/mmu-miR- kshv-miR-K12-3 hsa-miR-331-5p/mmu-
34b-3p FL HL miR-331-5p HL hsa-miR-363*/rno-miR- hsa-miR-766 hsa-miR-650
363* FL HL HL hsa-miR-20b* FL hsa-miR-516a-5p HL hsa-miR-202 HL hsa-miR-550 hsa-miR-125b- hsa-miR-548b-3p
1*/mmu-miR-125b-
FL 3p/rno-miR-125b-3p HL HL hsa-miR-600 FL hsa-miR-149* HL hsa-miR-492 HL hsa-miR-196a*/mmu- ebv-miR-BART6-3p hsa-miR-135a*/mmu- miR-196a*/rno-miR-196a* FL HL miR-135a* HL hsa-miR-574-3p/mmu- ebv-miR-BART19-3p ebv-miR-BART20-3p
miR-574-3p FL HL HL hsa-miR-620 hsa-miR-671 - hsa-miR-586
FL 5p/mmu-miR-671-5p HL HL hsa-miR-331-3p/mmu- ebv-miR-BART8* hsa-miR-338-5p/mmu- i7iiR-331-3p/rno-miR-331 miR-338-5p/rno-miR-
FL HL 338* HL hsa-let-7e/mmu-let- hsa-miR-509-3-5p hsa-miR-92b*
7e/rno-let-7e FL HL HL hsa-miR-524-5p FL hsa-miR-602 HL hiv1-miR-H1 HL hsa-miR-197/mmu-miR- ebv-miR-BHRF1-1 hsa-miR-508-5p
197 FL HL HL hsa-miR-24-1*/mmu-miR- mghv-miR-M1-7-3p hsa-miR-542-5p/mmu-
24-1*/rno-miR-24-1* miR-542-5p/rno-miR-
FL HL 542-5p HL hsa-miR-519e* HL mghv-miR-M1-2 HL hsa-miR-490-5p HL hsa-miR-628-3p HL hsa-miR-675 HL hsa-miR-663 HL hsa-miR-433/mmu-miR-
433/rno-miR-433 HL
Claims
1. An isolated nucleic acid molecule having at least 80% sequence identity to any one of SEQ ID NOs: 763-1350 or 1565 or a complementary sequence thereof.
2. The isolated nucleic acid molecule of claim 1, wherein the sequence identity is at least 90%.
3. The isolated nucleic acid molecule of claim 1, wherein the sequence identity is at least 95%.
4. The isolated nucleic acid molecule of claim 1, wherein the nucleic acid sequence comprises any one of SEQ ID NOs: 763-1350 or 1565 or a complementary sequence thereof.
5. The nucleic acid molecule of any of claims 1-4, which is a miRNA precursor molecule having the sequence of SEQ ID NOs: 763-1350 or 1565, or a DNA molecule coding the miRNA.
6. The nucleic acid molecule of any of claims 1-4, which is single-stranded.
7. The nucleic acid molecule of any of claims 1-4, which is at least partially double- stranded.
8. The nucleic acid molecule of any of claims 1-4, which is selected from RNA or DNA molecules.
9. The isolated nucleic acid molecule of any of claims 1-4, wherein the nucleic acid molecule is a cDNA that corresponds to any one of SEQ ID NOs: 763-1350 or 1565.
10. The nucleic acid molecule of claim 8, comprising at least one modified nucleotide analog.
11. A composition comprising at least one nucleic acid molecule of any of claims 1-10 and a carrier or vehicle.
12. The composition of claim 11 wherein the carrier or vehicle is a pharmaceutically acceptable carrier or vehicle suitable for diagnostic applications.
13. The composition of claims 11-12 wherein carrier or vehicle is a pharmaceutically acceptable carrier or vehicle is suitable for therapeutic applications.
14. The composition of claim 12, wherein the nucleic acid molecule is suitable as a marker or a modulator of a B cell malignancy.
15. A recombinant expression vector comprising at least one nucleic acid molecule of any of claims 1-10.
16. A cell comprising the recombinant expression vector of claim 15.
17. A method of determining the B cell stage of a B cell malignancy in a subject comprising determining the level of expression of at least one microRNA in a sample comprising a B cell taken from the subject relative the level of expression of the at least one microRNA in a control sample, wherein the at least one microRNA is selected from the microRNAs listed in Table 4.
18. The method of claim 17, wherein at least one microRNA selected from the microRNAs in Table 4 has a q value of less than 5 in at least one of the last three columns of Table 4.
19. A method of identifying a B cell malignancy in a subject comprising determining the level of expression of at least one microRNA in a sample comprising a B cell taken from the subject relative the level of expression of the at least one microRNA in a control sample, wherein the at least one microRNA is selected from the microRNAs listed in Table 4.
20. A method of diagnosing a B cell malignancy in a subject comprising determining the level of expression of at least one microRNA in a sample comprising a B cell taken from the subject relative the level of expression of the at least one microRNA in a control sample, wherein the at least one microRNA is selected from the microRNAs listed in Table 4.
21. The method of claim 20, wherein the B cell malignancy is one of at least two potential B cell malignancies, wherein at least two of the potential B cell malignancies are derived from different B cell stages.
22. A method of identifying a B cell malignancy in a subject comprising determining the level of expression of at least one microRNA in a sample comprising a B cell taken from the subject relative the level of expression of the at least one microRNA in a control sample, wherein the at least one microRNA is selected from the microRNAs listed in any one of Tables 7 to 35.
23. The method of claim 22, wherein the B cell malignancy is selected from chronic lymphocytic leukemia, follicular lymphoma, Hodgkin's lymphoma, activated B-cell diffuse large B cell lymphoma (DLBCL), germinal center-like DLBCL, and Burkitt lymphoma.
24. A method of diagnosing a B cell malignancy in a subject comprising determining the level of expression of at least one microRNA in a sample comprising a B cell taken from the subject relative to the level of expression of the at least one microRNA in a control sample, wherein the at least one microRNA is selected from the microRNAs listed in any one of Tables 7 to 35.
25. The method of claim 24, wherein the B cell malignancy is selected from chronic lymphocytic leukemia, follicular lymphoma, Hodgkin's lymphoma, activated B-cell diffuse large B cell lymphoma (DLBCL), germinal center-like DLBCL, and Burkitt lymphoma.
26. A method of determining whether a B cell malignancy in a sample is Burkitt lymphoma, activated B cell-like diffuse large B cell lymphoma (DLBCL), or germinal center-like DLBCL, comprising determining the level of expression of at least one microRNA in the sample relative to the level of expression of the at least one microRNA in a control sample, wherein the at least one microRNA is selected from the microRNAs listed in Table 10, column "BL miRNA list"; Table 14, column "BL High"; Table 11 ; Table 14, column "ABC High"; Table 10, column "GCB miRNA list"; Table 14, column "GCB High"; Table 32, or Table 35.
27. The method of claim 26, comprising determining the level of expression of at least one microRNA selected from the microRNAs listed in Table 10, column "BL miRNA list", and Table 14, column "BL High"; determining the level of expression of at least one microRNA selected from the microRNAs listed in Table 11 and Table 14, column "ABC High"; and determining the level of expression of at least one microRNA selected from the microRNAs listed in Table 10, column "GCB miRNA list", and Table 14, column "GCB High".
28. A method of determining whether a B cell malignancy in a sample is Burkitt lymphoma, activated B cell-like diffuse large B cell lymphoma (DLBCL), or germinal center-like DLBCL, comprising determining the level of expression of at least one microRNA in the sample relative to the level of expression of the at least one microRNA in a control sample, wherein the at least one microRNA is selected from the microRNAs listed in at least one column labeled "GCBvsBL" or "GCBvsABC" in Table 7 or "ABCvsBL" in Table 8.
29. The method of claim 28, wherein at least one microRNA is listed in no more than two columns selected from the columns labeled "GCBvsBL" or "GCBvsABC" in Table 7 or "ABCvsBL" in Table 8.
30. The method of claim 27, wherein at least one microRNA is listed in only one column selected from the columns labeled "GCBvsBL" or "GCBvsABC" in Table 7 or "ABCvsBL" in Table 8.
31. A method of determining whether a B cell malignancy in a sample is activated B cell-like diffuse large B cell lymphoma (DLBCL), or germinal center-like DLBCL, comprising determining the level of expression of at least one microRNA in the sample relative to the level of expression of the at least one microR A in a control sample, wherein the at least one microRNA is selected from the microRNAs listed in Table 35.
32. A microarray comprising miRNA-specific probe oligonucleotides wherein at least one miRNA- specific probe oligonucleotide is specific for a sequence of SEQ ID NOs: 763-1350 or 1565, or any combination thereof.
33. The microarray of claim 32 wherein the microarray further comprises miRNA-specific probes oligonucleotides for the miRNA sequences in Tables 4 or 7-35.
34. The microarray of claim 32 wherein the microarray comprises miRNA-specific probes oligonucleotides for SEQ ID NOs: 763-1350 or 1565.
35. A kit comprising at least one primer sequence that can detect any one of SEQ ID NOs: 763-1350 or 1565, or a combination thereof.
36. A kit comprising at least one isolated nucleic acid molecule having a sequence of any one of SEQ ID NOs: 1351-1564.
37. The kit of either of claims 35-36, further comprising enzymes and reagents that are adequate for performing an RT-PCR reaction.
38. A kit comprising the isolated nucleic acid molecule of any of claims 1-10.
39. A DNA library comprising at least one isolated nucleic acid molecule of any one of SEQ ID NOs: 763-1350 or 1565.
40. A DNA library comprising the nucleic acid sequences listed in Table 32.
41. The DNA library of any of claims 39-40 comprising at least one cDNA sequence corresponding to an RNA of SEQ ID NOs: 763-1350 or 1565, or any combination thereof.
Priority Applications (2)
| Application Number | Priority Date | Filing Date | Title |
|---|---|---|---|
| US13/513,757 US20120302626A1 (en) | 2009-12-04 | 2010-12-03 | Microrna and use thereof in identification of b cell malignancies |
| US14/317,879 US10047400B2 (en) | 2009-12-04 | 2014-06-27 | Microrna and use thereof in identification of B cell malignancies |
Applications Claiming Priority (2)
| Application Number | Priority Date | Filing Date | Title |
|---|---|---|---|
| US26673309P | 2009-12-04 | 2009-12-04 | |
| US61/266,733 | 2009-12-04 |
Related Child Applications (2)
| Application Number | Title | Priority Date | Filing Date |
|---|---|---|---|
| US13/513,757 A-371-Of-International US20120302626A1 (en) | 2009-12-04 | 2010-12-03 | Microrna and use thereof in identification of b cell malignancies |
| US14/317,879 Division US10047400B2 (en) | 2009-12-04 | 2014-06-27 | Microrna and use thereof in identification of B cell malignancies |
Publications (2)
| Publication Number | Publication Date |
|---|---|
| WO2011069100A2 true WO2011069100A2 (en) | 2011-06-09 |
| WO2011069100A3 WO2011069100A3 (en) | 2011-07-28 |
Family
ID=44115523
Family Applications (1)
| Application Number | Title | Priority Date | Filing Date |
|---|---|---|---|
| PCT/US2010/058952 WO2011069100A2 (en) | 2009-12-04 | 2010-12-03 | Microrna and use thereof in identification of b cell malignancies |
Country Status (2)
| Country | Link |
|---|---|
| US (2) | US20120302626A1 (en) |
| WO (1) | WO2011069100A2 (en) |
Cited By (6)
| Publication number | Priority date | Publication date | Assignee | Title |
|---|---|---|---|---|
| CN102676526A (en) * | 2012-05-16 | 2012-09-19 | 北京旷博生物技术有限公司 | Breast cancer molecular marker miR-30c-1-3p |
| WO2013150303A1 (en) * | 2012-04-03 | 2013-10-10 | Reneuron Limited | Stem cell microparticles |
| WO2014013258A1 (en) * | 2012-07-19 | 2014-01-23 | Reneuron Limited | Stem cell microparticles |
| WO2014125276A1 (en) * | 2013-02-12 | 2014-08-21 | Reneuron Limited | Stem cell microparticles and mirna |
| EP3114238A4 (en) * | 2014-03-04 | 2017-11-08 | MedImmune, LLC | Compositions and methods for identifying b cell malignancies responsive to b cell depleting therapy |
| US10406182B2 (en) | 2013-10-09 | 2019-09-10 | Reneuron Limited | Stem cell microparticles and miRNA |
Families Citing this family (19)
| Publication number | Priority date | Publication date | Assignee | Title |
|---|---|---|---|---|
| DK177532B1 (en) | 2009-09-17 | 2013-09-08 | Bio Bedst Aps | Medical use of sPLA2 hydrolysable liposomes |
| WO2011069100A2 (en) | 2009-12-04 | 2011-06-09 | Duke University | Microrna and use thereof in identification of b cell malignancies |
| WO2012009508A2 (en) * | 2010-07-15 | 2012-01-19 | Emory University | Microrna compositions and methods related thereto |
| WO2014106012A1 (en) * | 2012-12-27 | 2014-07-03 | The Trustees Of Columbia University In The City Of New York | Methods of modulating proliferation and uses thereof |
| EP3198035B1 (en) | 2014-09-26 | 2022-11-02 | Allarity Therapeutics Europe ApS | Methods for predicting drug responsiveness |
| US20160199399A1 (en) * | 2015-01-09 | 2016-07-14 | Medical Prognosis Institute A/S | Methods for predicting drug responsiveness in cancer patients |
| CN107454843B (en) * | 2015-02-25 | 2021-07-30 | 柏业公司 | Pharmaceutical composition for treating cancer comprising microribonucleic acid as active ingredient |
| US20180201937A1 (en) | 2015-08-04 | 2018-07-19 | The University Of Chicago | Inhibitors of cacna1a/alpha1a subunit internal ribosomal entry site (ires) and methods of treating spinocerebellar ataxia type 6 |
| US11459612B2 (en) * | 2015-12-01 | 2022-10-04 | Centro Nacional De Investigaciones Cardiovasculares Carlos Iii (F.S.P.) | Method for diagnosing cardiomyopathies |
| US11021756B2 (en) * | 2016-01-04 | 2021-06-01 | Yang Zuozhang | MiRNA markers for the diagnosis of osteosarcoma |
| WO2018030450A1 (en) * | 2016-08-09 | 2018-02-15 | 東レ株式会社 | Pharmaceutical composition for treating and/or preventing cancer |
| US9725769B1 (en) | 2016-10-07 | 2017-08-08 | Oncology Venture ApS | Methods for predicting drug responsiveness in cancer patients |
| AU2017258901A1 (en) | 2016-12-30 | 2018-07-19 | Allarity Therapeutics Europe ApS | Methods for predicting drug responsiveness in cancer patients |
| US11251880B2 (en) * | 2018-07-19 | 2022-02-15 | Futurewei Technologies, Inc. | CA power measurement |
| CN111909999B (en) * | 2019-05-07 | 2023-03-07 | 上海交通大学医学院附属瑞金医院 | MiRNA combination and application thereof in preparation of marker for DLBCL prognosis |
| CN110643607B (en) * | 2019-10-28 | 2023-08-18 | 沈阳农业大学 | microRNA related to reproductive function of Liaoyu white cattle and obtaining method thereof |
| WO2021178668A1 (en) * | 2020-03-04 | 2021-09-10 | University Of Massachusetts | Compositions and methods for modulating rpgr expression |
| CA3174286A1 (en) * | 2020-04-02 | 2021-10-07 | Robert PLACE | Targeted inhibition using engineered oligonucleotides |
| CN112609002B (en) * | 2021-01-11 | 2023-04-25 | 中国医科大学 | Peripheral blood miRNA colon cancer diagnosis marker combination and detection kit thereof |
Citations (2)
| Publication number | Priority date | Publication date | Assignee | Title |
|---|---|---|---|---|
| US20060199233A1 (en) * | 2005-02-11 | 2006-09-07 | Wisconsin Alumni Research Foundation | miR-155 assay |
| US20090143326A1 (en) * | 2007-10-04 | 2009-06-04 | Santaris Pharma A/S | MICROMIRs |
Family Cites Families (7)
| Publication number | Priority date | Publication date | Assignee | Title |
|---|---|---|---|---|
| AU2006242154B2 (en) * | 2005-05-02 | 2011-11-03 | Cold Spring Harbor Laboratory | Composition and methods for cancer diagnosis utilizing the mir 17-92 cluster |
| US8362230B2 (en) * | 2006-01-10 | 2013-01-29 | Koninklijke Nederlandse Akademie Van Wetenschappen | Nucleic acid molecules and collections thereof, their application and modification |
| WO2007112753A2 (en) | 2006-04-03 | 2007-10-11 | Santaris Pharma A/S | Pharmaceutical composition comprising anti-mirna antisense oligonucleotides |
| US7803784B2 (en) * | 2006-10-24 | 2010-09-28 | The Board Of Trustees Of The Leland Stanford Junior University | Modulation of T cell signaling threshold and T cell sensitivity to antigens |
| WO2009012263A2 (en) * | 2007-07-18 | 2009-01-22 | The Trustees Of Columbia University In The City Of New York | Tissue-specific micrornas and compositions and uses thereof |
| CN101842484B (en) * | 2007-09-14 | 2015-07-29 | 俄亥俄州立大学研究基金会 | MIRNA in human peripheral blood microvesicles expresses and its purposes |
| WO2011069100A2 (en) | 2009-12-04 | 2011-06-09 | Duke University | Microrna and use thereof in identification of b cell malignancies |
-
2010
- 2010-12-03 WO PCT/US2010/058952 patent/WO2011069100A2/en active Application Filing
- 2010-12-03 US US13/513,757 patent/US20120302626A1/en not_active Abandoned
-
2014
- 2014-06-27 US US14/317,879 patent/US10047400B2/en active Active
Patent Citations (2)
| Publication number | Priority date | Publication date | Assignee | Title |
|---|---|---|---|---|
| US20060199233A1 (en) * | 2005-02-11 | 2006-09-07 | Wisconsin Alumni Research Foundation | miR-155 assay |
| US20090143326A1 (en) * | 2007-10-04 | 2009-06-04 | Santaris Pharma A/S | MICROMIRs |
Cited By (13)
| Publication number | Priority date | Publication date | Assignee | Title |
|---|---|---|---|---|
| WO2013150303A1 (en) * | 2012-04-03 | 2013-10-10 | Reneuron Limited | Stem cell microparticles |
| CN102676526A (en) * | 2012-05-16 | 2012-09-19 | 北京旷博生物技术有限公司 | Breast cancer molecular marker miR-30c-1-3p |
| CN102676526B (en) * | 2012-05-16 | 2013-05-29 | 北京旷博生物技术有限公司 | Breast cancer molecular marker miR-30c-1-3p |
| JP2015529450A (en) * | 2012-07-19 | 2015-10-08 | リニューロン・リミテッドReNeuron Limited | Stem cell microparticles |
| CN104703609A (en) * | 2012-07-19 | 2015-06-10 | 兰诺龙有限公司 | Stem cell microparticles |
| WO2014013258A1 (en) * | 2012-07-19 | 2014-01-23 | Reneuron Limited | Stem cell microparticles |
| CN104703609B (en) * | 2012-07-19 | 2019-02-19 | 兰诺龙有限公司 | Stem cell particle |
| WO2014125276A1 (en) * | 2013-02-12 | 2014-08-21 | Reneuron Limited | Stem cell microparticles and mirna |
| CN105120879A (en) * | 2013-02-12 | 2015-12-02 | 兰诺龙有限公司 | Stem cell microparticles and mirna |
| JP2016513095A (en) * | 2013-02-12 | 2016-05-12 | リニューロン・リミテッドReNeuron Limited | Stem cell microparticles and miRNA |
| EP2956146B1 (en) | 2013-02-12 | 2018-11-07 | Reneuron Limited | Stem cell microparticles and mirna |
| US10406182B2 (en) | 2013-10-09 | 2019-09-10 | Reneuron Limited | Stem cell microparticles and miRNA |
| EP3114238A4 (en) * | 2014-03-04 | 2017-11-08 | MedImmune, LLC | Compositions and methods for identifying b cell malignancies responsive to b cell depleting therapy |
Also Published As
| Publication number | Publication date |
|---|---|
| US20120302626A1 (en) | 2012-11-29 |
| WO2011069100A3 (en) | 2011-07-28 |
| US20150057165A1 (en) | 2015-02-26 |
| US10047400B2 (en) | 2018-08-14 |
Similar Documents
| Publication | Publication Date | Title |
|---|---|---|
| US10047400B2 (en) | Microrna and use thereof in identification of B cell malignancies | |
| US20190017122A1 (en) | Mirnas as diagnostic biomarkers to distinguish benign from malignant thyroid tumors | |
| US20180208997A1 (en) | METHODS, COMPOSITIONS, AND DEVICES UTILIZING MicroRNA TO DETERMINE PHYSIOLOGICAL CONDITIONS | |
| AU2011329772B2 (en) | miRNAs as biomarkers for distinguishing benign from malignant thyroid neoplasms | |
| US9822416B2 (en) | miRNA in the diagnosis of ovarian cancer | |
| US20100202973A1 (en) | Microrna molecules associated with inflammatory skin disorders | |
| AU2012265177B2 (en) | Methods and devices for prognosis of cancer relapse | |
| US20110107440A1 (en) | Skin cancer associated micrornas | |
| US20120088687A1 (en) | MicroRNAs (miRNA) as Biomarkers for the Identification of Familial and Non-Familial Colorectal Cancer | |
| US20070065844A1 (en) | Solution-based methods for RNA expression profiling | |
| US20160076098A1 (en) | Methods of diagnosing and treating chronic pain | |
| CA2853136A1 (en) | Methods of diagnosing and treating idiopathic pulmonary fibrosis | |
| US20160138106A1 (en) | Circulating Non-coding RNA Profiles for Detection of Cardiac Transplant Rejection | |
| WO2014114802A1 (en) | Non-invasive prenatal genetic diagnostic methods | |
| WO2011154008A1 (en) | Microrna classification of thyroid follicular neoplasia | |
| US8859239B2 (en) | Methods for small RNA sequencing | |
| KR101762143B1 (en) | microRNAs for identification of human exposure to ethylbenzene and the method of identification using thereof |
Legal Events
| Date | Code | Title | Description |
|---|---|---|---|
| 121 | Ep: the epo has been informed by wipo that ep was designated in this application |
Ref document number: 10835211 Country of ref document: EP Kind code of ref document: A1 |
|
| NENP | Non-entry into the national phase in: |
Ref country code: DE |
|
| WWE | Wipo information: entry into national phase |
Ref document number: 13513757 Country of ref document: US |
|
| 122 | Ep: pct application non-entry in european phase |
Ref document number: 10835211 Country of ref document: EP Kind code of ref document: A2 |