WO2009158521A2 - Blood transcriptional signature of mycobacterium tuberculosis infection - Google Patents

Blood transcriptional signature of mycobacterium tuberculosis infection Download PDF

Info

Publication number
WO2009158521A2
WO2009158521A2 PCT/US2009/048698 US2009048698W WO2009158521A2 WO 2009158521 A2 WO2009158521 A2 WO 2009158521A2 US 2009048698 W US2009048698 W US 2009048698W WO 2009158521 A2 WO2009158521 A2 WO 2009158521A2
Authority
WO
WIPO (PCT)
Prior art keywords
active
genes
latent
infection
patients
Prior art date
Application number
PCT/US2009/048698
Other languages
French (fr)
Other versions
WO2009158521A3 (en
Inventor
Jacques F. Banchereau
Damien Chaussabel
Anne O'garra
Matthew Berry
Onn Min Kon
Original Assignee
Baylor Research Institute
The National Institute For Medical Research
Imperial College Healthcare Nhs Trust
Priority date (The priority date is an assumption and is not a legal conclusion. Google has not performed a legal analysis and makes no representation as to the accuracy of the date listed.)
Filing date
Publication date
Priority to MX2010014556A priority Critical patent/MX2010014556A/en
Priority to CA2729000A priority patent/CA2729000A1/en
Priority to EP09771053A priority patent/EP2300823A4/en
Priority to AU2009262112A priority patent/AU2009262112A1/en
Application filed by Baylor Research Institute, The National Institute For Medical Research, Imperial College Healthcare Nhs Trust filed Critical Baylor Research Institute
Priority to JP2011516672A priority patent/JP2011526152A/en
Priority to NZ590341A priority patent/NZ590341A/en
Priority to CN2009801334543A priority patent/CN102150043A/en
Priority to AP2011005546A priority patent/AP2011005546A0/en
Priority to EA201170088A priority patent/EA201170088A1/en
Priority to US12/602,488 priority patent/US20110196614A1/en
Publication of WO2009158521A2 publication Critical patent/WO2009158521A2/en
Publication of WO2009158521A3 publication Critical patent/WO2009158521A3/en
Priority to IL210121A priority patent/IL210121A0/en
Priority to ZA2010/09307A priority patent/ZA201009307B/en
Priority to US14/024,142 priority patent/US20140080732A1/en

Links

Classifications

    • CCHEMISTRY; METALLURGY
    • C12BIOCHEMISTRY; BEER; SPIRITS; WINE; VINEGAR; MICROBIOLOGY; ENZYMOLOGY; MUTATION OR GENETIC ENGINEERING
    • C12QMEASURING OR TESTING PROCESSES INVOLVING ENZYMES, NUCLEIC ACIDS OR MICROORGANISMS; COMPOSITIONS OR TEST PAPERS THEREFOR; PROCESSES OF PREPARING SUCH COMPOSITIONS; CONDITION-RESPONSIVE CONTROL IN MICROBIOLOGICAL OR ENZYMOLOGICAL PROCESSES
    • C12Q1/00Measuring or testing processes involving enzymes, nucleic acids or microorganisms; Compositions therefor; Processes of preparing such compositions
    • C12Q1/68Measuring or testing processes involving enzymes, nucleic acids or microorganisms; Compositions therefor; Processes of preparing such compositions involving nucleic acids
    • C12Q1/6876Nucleic acid products used in the analysis of nucleic acids, e.g. primers or probes
    • C12Q1/6883Nucleic acid products used in the analysis of nucleic acids, e.g. primers or probes for diseases caused by alterations of genetic material
    • GPHYSICS
    • G01MEASURING; TESTING
    • G01NINVESTIGATING OR ANALYSING MATERIALS BY DETERMINING THEIR CHEMICAL OR PHYSICAL PROPERTIES
    • G01N33/00Investigating or analysing materials by specific methods not covered by groups G01N1/00 - G01N31/00
    • G01N33/48Biological material, e.g. blood, urine; Haemocytometers
    • G01N33/50Chemical analysis of biological material, e.g. blood, urine; Testing involving biospecific ligand binding methods; Immunological testing
    • G01N33/53Immunoassay; Biospecific binding assay; Materials therefor
    • G01N33/569Immunoassay; Biospecific binding assay; Materials therefor for microorganisms, e.g. protozoa, bacteria, viruses
    • G01N33/56911Bacteria
    • G01N33/5695Mycobacteria
    • CCHEMISTRY; METALLURGY
    • C12BIOCHEMISTRY; BEER; SPIRITS; WINE; VINEGAR; MICROBIOLOGY; ENZYMOLOGY; MUTATION OR GENETIC ENGINEERING
    • C12QMEASURING OR TESTING PROCESSES INVOLVING ENZYMES, NUCLEIC ACIDS OR MICROORGANISMS; COMPOSITIONS OR TEST PAPERS THEREFOR; PROCESSES OF PREPARING SUCH COMPOSITIONS; CONDITION-RESPONSIVE CONTROL IN MICROBIOLOGICAL OR ENZYMOLOGICAL PROCESSES
    • C12Q2600/00Oligonucleotides characterized by their use
    • C12Q2600/112Disease subtyping, staging or classification
    • CCHEMISTRY; METALLURGY
    • C12BIOCHEMISTRY; BEER; SPIRITS; WINE; VINEGAR; MICROBIOLOGY; ENZYMOLOGY; MUTATION OR GENETIC ENGINEERING
    • C12QMEASURING OR TESTING PROCESSES INVOLVING ENZYMES, NUCLEIC ACIDS OR MICROORGANISMS; COMPOSITIONS OR TEST PAPERS THEREFOR; PROCESSES OF PREPARING SUCH COMPOSITIONS; CONDITION-RESPONSIVE CONTROL IN MICROBIOLOGICAL OR ENZYMOLOGICAL PROCESSES
    • C12Q2600/00Oligonucleotides characterized by their use
    • C12Q2600/158Expression markers
    • GPHYSICS
    • G01MEASURING; TESTING
    • G01NINVESTIGATING OR ANALYSING MATERIALS BY DETERMINING THEIR CHEMICAL OR PHYSICAL PROPERTIES
    • G01N2800/00Detection or diagnosis of diseases
    • G01N2800/60Complex ways of combining multiple protein biomarkers for diagnosis

Definitions

  • the present invention relates in general to the field of Mycobacterium tuberculosis infection, and more particularly, to a system, method and apparatus for the diagnosis, prognosis and monitoring of latent and active Mycobacterium tuberculosis infection and disease progression before, during and after treatment.
  • Pulmonary tuberculosis is a major and increasing cause of morbidity and mortality worldwide caused by Mycobacterium tuberculosis (M. tuberculosis).
  • M. tuberculosis Mycobacterium tuberculosis
  • WHO active immune response
  • M. tuberculosis Arthritis with anti-TNF antibodies, results in improvement of autoimmune symptoms, but on the other hand causes reactivation of TB in patients previously in contact with M. tuberculosis (Keane).
  • the immune response to M. tuberculosis is multifactorial and includes genetically determined host factors, such as TNF, and IFN- ⁇ and IL-12, of the ThI axis (Reviewed in Casanova, Ann Rev; Newport).
  • TNF tumor necrosis
  • IFN- ⁇ and IL-12 of the ThI axis
  • IFN- ⁇ therapy does not help to ameliorate disease (Reviewed in Reljic, 2007, J Interferon & Cyt Res., 27, 353-63), suggesting that a broader number of host immune factors are involved in protection against M. tuberculosis and the maintenance of latency.
  • a knowledge of host factors induced in latent versus active TB may provide information with respect to the immune response which can control infection with M. tuberculo
  • assays have been developed demonstrating immunoreactivity to specific M. tuberculosis antigens, which are absent in BCG. Reactivity to these M. tuberculosis antigens, as measured by production of IFN- ⁇ by blood cells in Interferon Gamma Release Assays (IGRA), however, does not differentiate latent from active disease.
  • Latent TB is defined in the clinic by a delayed type hypersensitivity reaction when the patient is intradermally challenged with PPD, together with an IGRA positive result, in the absence of clinical symptoms or signs, or radiology suggestive of active disease.
  • TB latent/dormant tuberculosis
  • the present invention includes methods and kits for the identification of latent versus active tuberculosis (TB) patients, as compared to healthy controls.
  • microarray analysis of blood of a distinct and reciprocal immune signature is used to determine, diagnose, track and treat latent versus active tuberculosis (TB) patients.
  • the present invention includes methods, systems and kits for distinguishing between active and latent Mycobacterium tuberculosis infection in a patient suspected of being infected with Mycobacterium tuberculosis, the method including the steps of: obtaining a gene expression dataset from a whole blood sample from the patient; determining the differential expression of one or more transcriptional gene expression modules that distinguish between infected patients and non-infected individuals, wherein the dataset demonstrates an aggregate change in the levels of polynucleotides in the one or more transcriptional gene expression modules as compared to matched non-infected individuals, and distinguishing between active and latent Mycobacterium tuberculosis (TB) infection based on the one or more transcriptional gene expression modules that differentiate between active and latent infection.
  • the invention may also include the step of using the determined comparative gene product information to formulate a diagnosis
  • the method may also include the step of using the determined comparative gene product information to formulate a prognosis or the step of using the determined comparative gene product information to formulate a treatment plan
  • the method may include the step of distinguishing patients with latent TB from active TB patients.
  • the module may include a dataset of the genes in modules Ml 2, M1.3, M1.4, M1.5, Ml .8, M2 1, M2.4, M2.8, M3.1, M3.2, M3 3, M3.4, M3 6, M3 7, M3.8 or M3.9 to detect active pulmonary infection.
  • the module may include a dataset of the genes in modules M 1.5, M2.1, M2.6, M2.10, M3 2 or M3 3 to detect a latent infection
  • the following genes are down-regulated m active pulmonary infection CD3, CTLA-4, CD28, ZAP-70, IL-7R, CD2, SLAM, CCR7 and GATA-3
  • the expression profile of the modules m Figure 9 is indicative of active pulmonary infection and the expression profile of the modules m Figure 10 is indicative of latent infection It has been found that the underexpression of genes m modules M3 4, M3 6, M3 7, M3 8 and M3 9 is indicative of active infection It has also been found that the overexpression of genes m modules M3 1 is indicative of active infection
  • the method may also include the step of distinguishing TB infection from other bacterial infections by determining the gene expression m modules M2 2, M2 3 and M3 5, which are overexpressed by the pe ⁇ pheral blood mononuclear cells or whole blood in mfection other than Mycobacterium
  • the method may include the step of distinguishing the differential and reciprocal transc ⁇ ptional signatures m the blood of latent and active TB patients using two or more of the following modules Ml 3, Ml 4, Ml 5, Ml 8, M2 1, M2 4, M2 8, M3 1, M3 2, M3 3, M3 4, M3 6, M3 7, M3 8 or M3 9 for active pulmonary infection and modules Ml 5, M2 1, M2 6, M2 10, M3 2 or M3 3 for a latent infection
  • the genes that are upregulated in active pulmonary TB mfection versus a healthy patient are selected from Tables 7A, 7D, 71, 7 J and 7K Further examples of the genes that are downregulated m active
  • Another embodiment of the present invention is a method for distinguishing between active and latent Mycobacterium tuberculosis infection in a patient suspected of being infected with Mycobacterium tuberculosis, the method including the steps of obtaining a first gene expression dataset obtained from a first clinical group with active Mycobacterium tuberculosis infection, a second gene expression dataset obtained from a second clinical group with a latent Mycobacterium tuberculosis infection patient and a third gene expression dataset obtained from a clinical group of non mfected individuals, generating a gene cluster dataset comprising the differential expression of genes between any two of the first, second and third datasets, and determining a unique pattern of expression/representation that is indicative of latent infection, active infection or being healthy
  • each clinical group is separated into a unique pattern of expression/representation for each of the 1 19 genes of Table 6
  • values for the first and third datasets are compared and the values for the dataset from the third dataset are subtracted therefrom.
  • the method may further comprise the step of using the determined comparative gene product information to formulate a diagnosis or a prognosis.
  • the method includes the step of using the determined comparative gene product information to formulate a treatment plan.
  • the method may also include the step of distinguishing patients with latent TB from active TB patients by analyzing the expression/representation of genes in the gene and patient clusters.
  • the method may further include the step of determining the expression levels of the genes: ST3GAL6, PAD14, TNFRSF12A, VAMP3, BRl 3, RGS19, PILRA, NCFl, LOC652616, PLAUR(CD87), SIGLEC5, B3GALT7, IBRDC3(NKLAM), ALOX5AP(FLAP), MMP9, ANPEP(APN), NALP 12, CSF2RA, ILOR(CD 126), RASGRP4, TNFSF14(CD258), NCF4, HK2, ARID3A, PGLYRPl(PGRP), which are underexpressed/underrepresented in the blood of Latent TB patients but not in the blood of Healthy individuals or Active TB patients.
  • the method may further include the step of determining the expression levels of the genes: ABCGl, SREBFl, RBP7(CRBP4), C22orf5, FAMlOlB, SlOOP, LOC649377, UBTDl, PSTPIP- I, RENBP, PGM2, SULF2, FAM7A1, HOM- TES-103, NDUFAFl, CESl, CYP27A1, FLJ33641, GPR177, MID IIP 1(MIG- 12), PSD4, SF3A1, NOV(CCN3), SGK(SGKl), CDK5R1, LOC642035, which are overexpressed/overrepresented in the blood of Healthy control individuals but were underexpressed/underrepresented in the blood of Latent TB patients, and underexpressed/underrepresented in the blood of Active TB patients.
  • the method may further include the step of determining the expression levels of the genes: ARSG, LOC284757, MDM4, CRNKLl, IL8, LOC389541, CD300LB, NIN, PHKG2, HIPl, which are overexpressed/overrepresented in the blood of Healthy individuals, are underexpressed/underrepresented in the blood of both Latent and Active TB patients.
  • the method may further include the step of determining the expression levels of the genes: PSMB8(LMP7), APOL6, GBP2, GBP5, GBP4, ATF3, GCHl, VAMP5, WARS, LIMKl, NPC2, IL- 15, LMTK2, STX1 1(FHL4), which are overexpressed/overrepresented in the blood of Active TB, and underexpressed/underrepresented in the blood of Latent TB patients and Healthy control individuals.
  • the method may further include the step of determining the expression levels of the genes: FLJl 1259(DRAM), JAK2, GSDMDC 1(DF5L)(FKSG 10), SIPAILl, [2680400](KIAA1632), ACTA2(ACTSA), KCNMBl(SLO- BETA), which are overexpressed/overrepresented in blood from Active TB patients, and underexpressed/underrepresented in the blood from Latent TB patients and Healthy control individuals.
  • the method may further include the step of determining the expression levels of the genes: SPTANI, KIAAD 179(Nnp I)(RRPl), FAM84B(NSE2), SELM, IL27RA, MRPS34, [6940246](IL23A), PRKCA(PKCA), CCDC41, CD52(CDW52), [3890241](ZN404), MCCCl (MCCA/B), SOX8, SYNJ2, FLJ21 127, FHIT, which are underexpressed/underrepresented in the blood of Active TB patients but not in the blood of Latent TB patients or Healthy Control individuals.
  • the method may further include the step of determining the expression levels of the genes: CDKLl(p42), MICALCL, MBNL3, RHD, ST7(RAY1), PPR3R1, [360739](PIP5K2A), AMFR, FLJ22471, CRAT(CATl), PLA2G4C, ACOT7(ACT)(ACH1), RNF 182, KLRC3(NKG2E), HLA-DPBl, which are underexpressed/underrepresented in the blood of Healthy Control individuals, overexpressed/overrepresented in the blood of the Latent TB patients, and overexpressed/overrepresented in the blood of Active TB patients.
  • Yet another embodiment of the present invention is a method for distinguishing between active and latent mycobacterium tuberculosis infection in a patient suspected of being infected with Mycobacterium tuberculosis, the method including the steps of: obtaining a gene expression dataset from a whole blood sample; sorting the gene expression dataset into one or more transcriptional gene expression modules; and mapping the differential expression of the one or more transcriptional gene expression modules that distinguish between active and latent Mycobacterium tuberculosis infection, thereby distinguishing between active and latent Mycobacterium tuberculosis infection.
  • the dataset includes TRIM genes.
  • the dataset includes TRIM genes, specifically, TRIM 5, 6, 19(PML), 21, 22, 25, 68 are overrepresented/expressed in active pulmonary TB.
  • the dataset of TRIM genes includes TRIM 28, 32, 51, 52, 68, are underepresented/expressed in active pulmonary TB.
  • Another embodiment of the present invention is a method of diagnosing a patient with active and latent Mycobacterium tuberculosis infection in a patient suspected of being infected with mycobacterium tuberculosis, the method comprising detecting differential expression of one or more transcriptional gene expression modules that distinguish between infected and non-infected patients obtained from whole blood, wherein whole blood demonstrates an aggregate change in the levels of polynucleotides in the one or more transcriptional gene expression modules as compared to matched non-infected patients, thereby distinguishing between active and latent mycobacterium tuberculosis infection.
  • the method includes one or more of the step of: using the determined comparative gene product information to formulate a diagnosis, the step of using the determined comparative gene product information to formulate a prognosis and the step of using the determined comparative gene product information to formulate a treatment plan.
  • the method may include the step of distinguishing patients with latent TB from active TB patients.
  • the module may include a dataset of the genes in modules M1.2, M1.3, M1.4, Ml .5, Ml .8, M2.1, M2.4, M2.8, M3.1, M3.2, M3.3, M3.4, M3.6, M3.7, M3.8 or M3.9 to detect active pulmonary infection.
  • the module may include a dataset of the genes in modules Ml.5, M2.1, M2.6, M2.10, M3.2 or M3.3 to detect a latent infection.
  • the following genes are down-regulated in active pulmonary infection CD3, CTLA-4, CD28, ZAP-70, IL-7R, CD2, SLAM, CCR7 and GAT A-3.
  • the expression profile of the modules m Figure 9 is indicative of active pulmonary infection and the expression profile of the modules in Figure 10 is indicative of latent infection. It has been found that the underexpression of genes in modules M3.4, M3.6, M3.7, M3.8 and M3.9 is indicative of active infection. It has also been found that the overexpression of genes in modules M3.1 is indicative of active infection.
  • the method may also include the step of distinguishing TB infection from other bacterial infections by determining the gene expression in modules M2.2, M2.3 and M3.5, which are overexpressed by the peripheral blood mononuclear cells or whole blood in infection other than Mycobacterium.
  • the method may include the step of distinguishing the differential and reciprocal transcriptional signatures in the blood of latent and active TB patients using two or more of the following modules: M1.3, M1.4, Ml.5, Ml .8, M2.1, M2.4, M2.8, M3.1, M3.2, M3.3, M3.4, M3.6, M3.7, M3.8 or M3.9 for active pulmonary infection and modules M1.5, M2.1, M2.6, M2.10, M3.2 or M3.3 for a latent infection.
  • genes that are upregulated in active pulmonary TB infection versus a healthy patient are selected from Tables 7 A, 7D, 71, 7J and 7K. Further examples of the genes that are downregulated in active pulmonary TB infection versus a healthy patient are selected from Tables 7B, 7 C, 7E, 7F, 7G, 7H, 7L, 7M, 7N, 70 and 7P. In one specific aspect, the genes that are upregulated in latent TB infection versus a healthy patient may be selected from Table 8B. In another specific aspect, the genes that are downregulated in latent TB infection versus a healthy patient may be selected from Tables 8A, 8C, 8D, 8E and 8F.
  • kits for diagnosing a patient with active and latent mycobacterium tuberculosis infection in a patient suspected of being infected with Mycobacterium tuberculosis the kit that includes a gene expression detector for obtaining a gene expression dataset from the patient; and a processor capable of comparing the gene expression to pre-defined gene module dataset that distinguish between infected and non-infected patients obtained from whole blood, wherein whole blood demonstrates an aggregate change in the levels of polynucleotides in the one or more transcriptional gene expression modules as compared to matched non-infected patients, thereby distinguishing between active and latent Mycobacterium tuberculosis infection.
  • Yet another embodiment includes a system of diagnosing a patient with active and latent Mycobacterium tuberculosis infection comprising: a gene expression dataset from the patient; and a processor capable of comparing the gene expression to pre-defined gene module dataset that distinguish between infected and non-infected patients obtained from whole blood, wherein whole blood demonstrates an aggregate change in the levels of polynucleotides in the one or more transcriptional gene expression modules as compared to matched non-infected patients, thereby distinguishing between active and latent Mycobacterium tuberculosis infection, wherein the modules are selected from M1.3, M1.4, M1.5, Ml.8, M2.1, M2.4, M2.8, M3.1, M3.2, M3.3, M3.4, M3.6, M3.7, M3.8 or M3.9 for active pulmonary infection and modules Ml.5, M2.1, M2.6, M2.10, M3.2 or M3.3 for a latent infection.
  • Figure 1 shows the gene array expression results from 42 participants, genes present in at least 2 samples (PAL2), genes 2 folds over or under represented compared with median, clustered by Pearson Correlation comparing active PTB, latent TB, healthy BCG non- vaccinated controls and healthy BCG vaccinated controls;
  • Figure 2 shows the gene array expression results from PAL2, 2 folds up or down expressed, filtered for statistically significant differences in expression between clinical groups using a non-parametric test (Kruskal-Wallis), P ⁇ 0.01, with Benjamini-Hochberg correction (1473 genes) and independently clustered using Pearson correlation comparing active PTB, latent TB and healthy controls;
  • Figures 3A - 3D show the gene array expression results from PAL2, 2 folds up or down expressed, filtered for statistically significant differences in expression between clinical groups using a non-parametric test (Kruskal-Wallis), P ⁇ 0.01, with Benjamini-Hochberg correction, and then filtered for the presence of the gene ontology term for biological process "immune response" in the gene annotation and independently clustered using Pearson correlation (158 genes). These 158 genes are shown separated into 4 figures (3A - 3D) for legibility.
  • Figure 3 A shows gene array expression results comparing active PTB, latent TB, healthy BCG non- vaccinated controls and healthy BCG vaccinated controls;
  • Figure 3B shows gene array expression results comparing active PTB, latent TB, healthy BCG non- vaccinated controls and healthy BCG vaccinated controls;
  • Figure 3 C shows gene array expression results comparing active PTB, latent TB, healthy BCG non- vaccinated controls and healthy BCG vaccinated controls;
  • Figure 3D shows gene array expression results comparing active PTB, latent TB, healthy BCG non- vaccinated controls and healthy BCG vaccinated controls;
  • Figure 4 shows the gene array expression results from 42 participants, genes present in at least 2 samples (PALI), genes 2 folds over or under represented compared with median, Genes selected as TRIMs - clustered by Pearson Correlation comparing active PTB, latent TB, healthy BCG non-vaccinated controls and healthy BCG vaccinated controls;
  • Figure 5A shows detail from the gene array expression results from 42 participants, genes present in at least 2 samples (PAL2), genes 2 folds over or under represented compared with median, clustered by Pearson Correlation comparing active PTB, latent TB, healthy BCG non-vaccinated controls and healthy BCG vaccinated controls, showing that inhibitory immunoregulatory ligands (PDL1/CD274, PDL2/CD273) are overexpressed in active TB patients.
  • PAL2 PAL2
  • PDL1/CD274, PDL2/CD273 inhibitory immunoregulatory ligands
  • Figure 5B shows the unfiltered gene array expression results that demonstrate that PDLl is only expressed in active TB patients
  • Figure 6 shows the gene array expression results filtered for genes present in at least 2 samples, 2 folds up or down 'represented' compared to median, statistically significantly differentially expressed across groups (P ⁇ 0.1 , Kruskal-Wallis non-parametric test with Bonferroni correction) (46 genes) independently clustered using Pearson correlation, comparing active PTB, latent TB, healthy BCG non-vaccinated controls and healthy BCG vaccinated controls;
  • Figure 7 shows the gene array expression results filtered for genes present in at least 2 samples, 2 folds up or down 'represented' compared to median, statistically significantly differentially expressed across groups (P ⁇ 0.05, Kruskal-Wallis non-parametric test with Bonferroni correction) (18 genes) independently clustered using Pearson correlation, comparing active PTB, latent TB, healthy BCG non-vaccinated controls and healthy BCG vaccinated controls;
  • Figure 8A shows that the results of merging different statistical filters applied to the list of genes filtered present in at least 2 samples, 2 folds up or down 'represented' compared to median, discriminates between all three clinical groups.
  • the transcripts shown are statistically significantly differentially expressed between Latent and healthy (P ⁇ 0.005, Wilcoxon-Mann- Whitney non-parametric test with no correction) plus the transcripts statistically significantly differentially expressed between Active and healthy (P ⁇ 0.5, Wilcoxon- Mann- Whitney non-parametric test with Bonferroni correction) - 119 genes in total independently clustered using Pearson correlation (clusters of patients/clinical groups are presented horizontally and clusters of genes are presented vertically);
  • These 1 19 genes are shown separated into 5 further figures (8B -8F) for legibility and to show that subgroups of these genes may also be used to distinguish between different clinical groups (i.e. between Active, Latent and Healthy).
  • Figure 8B shows the gene array expression results filtered for genes present in at least 2 samples, 2 folds up or down 'represented' compared to median, transcripts statistically significantly differentially expressed between Latent and healthy (P ⁇ 0.005, Wilcoxon-Mann- Whitney non-parametric test with no correction) PLUS transcripts statistically significantly differentially expressed between Active and healthy (P ⁇ 0.5, Wilcoxon-Mann- Whitney non-parametric test with Bonferroni correction) (clusters of patients/clinical groups are presented horizontally and clusters of genes are presented vertically);
  • Figure 8C shows the gene array expression results filtered for genes present in at least 2 samples, 2 folds up or down 'represented' compared to median, transcripts statistically significantly differentially expressed between Latent and healthy (P ⁇ 0.005, Wilcoxon-Mann- Whitney non-parametric test with no correction) PLUS transcripts statistically significantly differentially expressed between Active and healthy (P ⁇ 0.5, Wilcoxon-Mann- Whitney non-parametric test with Bonferroni correction);
  • Figure 8D shows the gene array expression results filtered for genes present in at least 2 samples, 2 folds up or down 'represented' compared to median, transcripts statistically significantly differentially expressed between Latent and healthy (P ⁇ 0.005, Wilcoxon-Mann- Whitney non-parametric test with no correction) PLUS transcripts statistically significantly differentially expressed between Active and healthy (P ⁇ 0.5, Wilcoxon-Mann- Whitney non-parametric test with Bonferroni correction) (clusters of patients/clinical groups are presented horizontally and clusters of genes are presented vertically);
  • Figure 8E shows the gene array expression results filtered for genes present in at least 2 samples, 2 folds up or down 'represented' compared to median, transcripts statistically significantly differentially expressed between Latent and healthy (P ⁇ 0.005, Wilcoxon-Mann- Whitney non-parametric test with no correction) PLUS transcripts statistically significantly differentially expressed between Active and healthy (P ⁇ 0.5, Wilcoxon-Mann- Whitney non-parametric test with Bonferroni correction) (clusters of patients/clinical groups are presented horizontally and clusters of genes are presented vertically);
  • Figure 8F shows the gene array expression results filtered for genes present in at least 2 samples, 2 folds up or down 'represented' compared to median, transcripts statistically significantly differentially expressed between Latent and healthy (P ⁇ 0.005, Wilcoxon-Mann- Whitney non-parametric test with no correction) PLUS transcripts statistically significantly differentially expressed between Active and healthy (P ⁇ 0.5, Wilcoxon-Mann- Whitney non-parametric test with Bonferroni correction) (clusters of patients/clinical groups
  • Figure 9 shows the gene array expression results from a gene module analysis of PTB(9) vs Control(6): from 5281 genes, filtered for PAL2, statistically significantly differentially expressed between active PTB and healthy controls by Wilcoxon-Mann- Whitney-test, p ⁇ 0.05, with no multi-test correction; and
  • Figure 10 shows the gene array expression results from from a gene module analysis of LTB(9) vs Control(6): from - 3137 genes, filtered for PAL2, statistically significantly differentially expressed between active PTB and healthy controls by Wilcoxon-Mann- Whitney-test, p ⁇ 0.05, with no multi-test correction.
  • an "object” refers to any item or information of interest (generally textual, including noun, verb, adjective, adverb, phrase, sentence, symbol, numeric characters, etc.). Therefore, an object is anything that can form a relationship and anything that can be obtained, identified, and/or searched from a source.
  • Objects include, but are not limited to, an entity of interest such as gene, protein, disease, phenotype, mechanism, drug, etc. In some aspects, an object may be data, as further described below.
  • a "relationship” refers to the co-occurrence of objects within the same unit (e.g., a phrase, sentence, two or more lines of text, a paragraph, a section of a webpage, a page, a magazine, paper, book, etc.). It may be text, symbols, numbers and combinations, thereof
  • Meta data content refers to information as to the organization of text in a data source.
  • Meta data can comprise standard metadata such as Dublin Core metadata or can be collection-specific.
  • metadata formats include, but are not limited to, Machine Readable Catalog (MARC) records used for library catalogs, Resource Description Format (RDF) and the Extensible Markup Language (XML). Meta objects may be generated manually or through automated information extraction algorithms.
  • MARC Machine Readable Catalog
  • RDF Resource Description Format
  • XML Extensible Markup Language
  • an “engine” refers to a program that performs a core or essential function for other programs.
  • an engine may be a central program in an operating system or application program that coordinates the overall operation of other programs.
  • the term "engine” may also refer to a program containing an algorithm that can be changed.
  • a knowledge discovery engine may be designed so that its approach to identifying relationships can be changed to reflect new rules of identifying and ranking relationships.
  • “semantic analysis” refers to the identification of relationships between words that represent similar concepts, e.g., though suffix removal or stemming or by employing a thesaurus. "Statistical analysis” refers to a technique based on counting the number of occurrences of each term (word, word root, word stem, n-gram, phrase, etc.). In collections unrestricted as to subject, the same phrase used in different contexts may represent different concepts. Statistical analysis of phrase co-occurrence can help to resolve word sense ambiguity. "Syntactic analysis” can be used to further decrease ambiguity by part-of-speech analysis.
  • AI Artificial intelligence
  • a non-human device such as a computer
  • tasks that humans would deem noteworthy or “intelligent.” Examples include identifying pictures, understanding spoken words or written text, and solving problems.
  • data is the most fundamental unit that is an empirical measurement or set of measurements. Data is compiled to contribute to information, but it is fundamentally independent of it and may be combined into a dataset, that is, a set of data. Information, by contrast, is derived from interests, e.g., data (the unit) may be gathered on ethnicity, gender, height, weight and diet for the purpose of finding variables correlated with risk of cardiovascular disease. However, the same data could be used to develop a formula or to create "information" about dietary preferences, i.e., likelihood that certain products in a supermarket have a higher likelihood of selling.
  • database refers to repositories for raw or compiled data, even if various informational facets can be found within the data fields.
  • a database may include one or more datasets.
  • a database is typically organized so its contents can be accessed, managed, and updated (e.g., the database is dynamic).
  • database and “source” are also used interchangeably in the present invention, because primary sources of data and information are databases.
  • a “source database” or “source data” refers in general to data, e.g., unstructured text and/or structured data that are input into the system for identifying objects and determining relationships.
  • a source database may or may not be a relational database.
  • a system database usually includes a relational database or some equivalent type of database which stores values relating to relationships between objects.
  • a "system database” and “relational database” are used interchangeably and refer to one or more collections of data organized as a set of tables containing data fitted into predefined categories.
  • a database table may comprise one or more categories defined by columns (e.g. attributes), while rows of the database may contain a unique object for the categories defined by the columns.
  • an object such as the identity of a gene might have columns for its presence, absence and/or level of expression of the gene.
  • a row of a relational database may also be referred to as a "set” and is generally defined by the values of its columns.
  • a "domain" in the context of a relational database is a range of valid values a field such as a column may include.
  • a "domain of knowledge” refers to an area of study over which the system is operative, for example, all biomedical data. It should be pointed out that there is advantage to combining data from several domains, for example, biomedical data and engineering data, for this diverse data can sometimes link things that cannot be put together for a normal person that is only familiar with one area or research/study (one domain).
  • a “distributed database” refers to a database that may be dispersed or replicated among different points in a network.
  • information refers to a data set that may include numbers, letters, sets of numbers, sets of letters, or conclusions resulting or derived from a set of data.
  • Data is then a measurement or statistic and the fundamental unit of information.
  • Information may also include other types of data such as words, symbols, text, such as unstructured free text, code, etc.
  • Knowledge is loosely defined as a set of information that gives sufficient understanding of a system to model cause and effect. To extend the previous example, information on demographics, gender and prior purchases may be used to develop a regional marketing strategy for food sales while information on nationality could be used by buyers as a guideline for importation of products. It is important to note that there are no strict boundaries between data, information, and knowledge; the three terms are, at times, considered to be equivalent. In general, data comes from examining, information comes from correlating, and knowledge comes from modeling.
  • a program or “computer program” refers generally to a syntactic unit that conforms to the rules of a particular programming language and that is composed of declarations and statements or instructions, divisible into, “code segments” needed to solve or execute a certain function, task, or problem.
  • a programming language is generally an artificial language for expressing programs.
  • a “system” or a “computer system” generally refers to one or more computers, peripheral equipment, and software that perform data processing.
  • a “user” or “system operator” in general includes a person, that uses a computer network accessed through a “user device” (e.g., a computer, a wireless device, etc) for the purpose of data processing and information exchange.
  • a “computer” is generally a functional unit that can perform substantial computations, including numerous arithmetic operations and logic operations without human intervention.
  • application software or an “application program” refers generally to software or a program that is specific to the solution of an application problem.
  • An "application problem” is generally a problem submitted by an end user and requiring information processing for its solution.
  • a "natural language” refers to a language whose rules are based on current usage without being specifically prescribed, e.g., English, Spanish or Chinese.
  • an “artificial language” refers to a language whose rules are explicitly established prior to its use, e.g., computer-programming languages such as C, C++, Java, BASIC, FORTRAN, or COBOL.
  • “statistical relevance” refers to using one or more of the ranking schemes (O/E ratio, strength, etc.), where a relationship is determined to be statistically relevant if it occurs significantly more frequently than would be expected by random chance.
  • the terms “coordinately regulated genes” or “transcriptional modules” are used interchangeably to refer to grouped, gene expression profiles (e.g., signal values associated with a specific gene sequence) of specific genes.
  • Each transcriptional module correlates two key pieces of data, a literature search portion and actual empirical gene expression value data obtained from a gene microarray.
  • the set of genes that is selected into a transcriptional modules is based on the analysis of gene expression data (module extraction algorithm described above). Additional steps are taught by Chaussabel, D. & Sher, A. Mining microarray expression data by literature profiling.
  • a disease or condition of interest e.g., Systemic Lupus erythematosus, arthritis, lymphoma, carcinoma, melanoma, acute infection, autoimmune disorders, autoinflammatory disorders, etc.
  • Module ID "M 2 8” genes and signals for those genes associated with T cell activation are described hereinbelow as Module ID "M 2 8" in which certain keywords (e g., Lymphoma, T-cell, CD4, CD8, TCR, Thymus, Lymphoid, IL2) were used to identify key T-cell associated genes, e.g., T-cell surface markers (CD5, CD6, CD7, CD26, CD28, CD96); molecules expressed by lymphoid lineage cells (lymphotoxin beta, IL2-inducible T-cell kinase, TCF7; and T-cell differentiation protein mal, GAT A3, STAT5B).
  • T-cell surface markers CD5, CD6, CD7, CD26, CD28, CD96
  • lymphoid lineage cells lymphotoxin beta, IL2-inducible T-cell kinase, TCF7
  • T-cell differentiation protein mal GAT A3, STAT5B
  • the complete module is developed by correlating data from a patient population for these genes (regardless of platform, presence/absence and/or up or downregulation) to generate the transcriptional module.
  • the gene profile does not match (at this time) any particular clustering of genes for these disease conditions and data, however, certain physiological pathways (e.g., cAMP signaling, zinc-finger proteins, cell surface markers, etc.) are found within the "Underdetermined" modules.
  • the gene expression data set may be used to extract genes that have coordinated expression prior to matching to the keyword search, i.e., either data set may be correlated prior to cross-referencing with the second data set. Table 1. Transcriptional Modules
  • array refers to a solid support or substrate with one or more peptides or nucleic acid probes attached to the support. Arrays typically have one or more different nucleic acid or peptide probes that are coupled to a surface of a substrate in different, known locations. These arrays, also described as “microarrays” or “gene-chips” that may have 10,000; 20,000, 30,000; or 40,000 different identifiable genes based on the known genome, e.g., the human genome.
  • pan-arrays are used to detect the entire "transcriptome” or transcriptional pool of genes that are expressed or found in a sample, e.g., nucleic acids that are expressed as RNA, mRNA and the like that may be subjected to RT and/or RT-PCR to made a complementary set of DNA replicons.
  • Arrays may be produced using mechanical synthesis methods, light directed synthesis methods and the like that incorporate a combination of non-lithographic and/or photolithographic methods and solid phase synthesis methods.
  • Various techniques for the synthesis of these nucleic acid arrays have been described, e.g., fabricated on a surface of virtually any shape or even a multiplicity of surfaces.
  • Arrays may be peptides or nucleic acids on beads, gels, polymeric surfaces, fibers such as fiber optics, glass or any other appropriate substrate. Arrays may be packaged in such a manner as to allow for diagnostics or other manipulation of an all inclusive device, see for example, U.S. Pat. No. 6,955,788, relevant portions incorporated herein by reference.
  • the term "disease” refers to a physiological state of an organism with any abnormal biological state of a cell. Disease includes, but is not limited to, an interruption, cessation or disorder of cells, tissues, body functions, systems or organs that may be inherent, inherited, caused by an infection, caused by abnormal cell function, abnormal cell division and the like.
  • a disease that leads to a "disease state” is generally detrimental to the biological system, that is, the host of the disease.
  • any biological state such as an infection (e.g., viral, bacterial, fungal, helminthic, etc.), inflammation, autoinflammation, autoimmunity, anaphylaxis, allergies, premalignancy, malignancy, surgical, transplantation, physiological, and the like that is associated with a disease or disorder is considered to be a disease state.
  • a pathological state is generally the equivalent of a disease state.
  • Disease states may also be categorized into different levels of disease state.
  • the level of a disease or disease state is an arbitrary measure reflecting the progression of a disease or disease state as well as the physiological response upon, during and after treatment. Generally, a disease or disease state will progress through levels or stages, wherein the affects of the disease become increasingly severe. The level of a disease state may be impacted by the physiological state of cells in the sample.
  • the terms "therapy” or “therapeutic regimen” refer to those medical steps taken to alleviate or alter a disease state, e.g., a course of treatment intended to reduce or eliminate the affects or symptoms of a disease using pharmacological, surgical, dietary and/or other techniques.
  • a therapeutic regimen may include a prescribed dosage of one or more drugs or surgery. Therapies will most often be beneficial and reduce the disease state but in many instances the effect of a therapy will have non-desirable or side-effects. The effect of therapy will also be impacted by the physiological state of the host, e.g., age, gender, genetics, weight, other disease conditions, etc.
  • the term "pharmacological state" or "pharmacological status” refers to those samples that will be, are and/or were treated with one or more drugs, surgery and the like that may affect the pharmacological state of one or more nucleic acids in a sample, e.g., newly transcribed, stabilized and/or destabilized as a result of the pharmacological intervention.
  • the pharmacological state of a sample relates to changes in the biological status before, during and/or after drug treatment and may serve a diagnostic or prognostic function, as taught herein. Some changes following drug treatment or surgery may be relevant to the disease state and/or may be unrelated side-effects of the therapy. Changes in the pharmacological state are the likely results of the duration of therapy, types and doses of drugs prescribed, degree of compliance with a given course of therapy, and/or un-prescribed drugs ingested.
  • biological state refers to the state of the transcriptome (that is the entire collection of RNA transcripts) of the cellular sample isolated and purified for the analysis of changes in expression.
  • the biological state reflects the physiological state of the cells in the sample by measuring the abundance and/or activity of cellular constituents, characterizing according to morphological phenotype or a combination of the methods for the detection of transcripts.
  • the term "expression profile" refers to the relative abundance of RNA, DNA or protein abundances or activity levels.
  • the expression profile can be a measurement for example of the transcriptional state or the translational state by any number of methods and using any of a number of gene- chips, gene arrays, beads, multiplex PCR, quantitiative PCR, run-on assays, Northern blot analysis, Western blot analysis, protein expression, fluorescence activated cell sorting (FACS), enzyme linked immunosorbent assays (ELISA), chemiluminescence studies, enzymatic assays, proliferation studies or any other method, apparatus and system for the determination and/or analysis of gene expression that are readily commercially available.
  • FACS fluorescence activated cell sorting
  • ELISA enzyme linked immunosorbent assays
  • transcriptional state of a sample includes the identities and relative abundances of the RNA species, especially mRNAs present in the sample.
  • the entire transcriptional state of a sample that is the combination of identity and abundance of RNA, is also referred to herein as the transcriptome.
  • the transcriptome Generally, a substantial fraction of all the relative constituents of the entire set of RNA species in the sample are measured.
  • module transcriptional vectors refers to transcriptional expression data that reflects the "proportion of differentially expressed genes.” For example, for each module the proportion of transcripts differentially expressed between at least two groups (e.g. healthy subjects vs patients). This vector is derived from the comparison of two groups of samples. The first analytical step is used for the selection of disease-specific sets of transcripts within each module. Next, there is the "expression level.” The group comparison for a given disease provides the list of differentially expressed transcripts for each module. It was found that different diseases yield different subsets of modular transcripts. With this expression level it is then possible to calculate vectors for each module(s) for a single sample by averaging expression values of disease-specific subsets of genes identified as being differentially expressed.
  • This approach permits the generation of maps of modular expression vectors for a single sample, e.g., those described in the module maps disclosed herein.
  • These vector module maps represent an averaged expression level for each module (instead of a proportion of differentially expressed genes) that can be derived for each sample.
  • the present invention it is possible to identify and distinguish diseases not only at the module-level, but also at the gene-level; i.e., two diseases can have the same vector (identical proportion of differentially expressed transcripts, identical "polarity"), but the gene composition of the vector can still be disease- specific.
  • Gene-level expression provides the distinct advantage of greatly increasing the resolution of the analysis.
  • the present invention takes advantage of composite transcriptional markers.
  • composite transcriptional markers refers to the average expression values of multiple genes (subsets of modules) as compared to using individual genes as markers (and the composition of these markers can be disease-specific).
  • the composite transcriptional markers approach is unique because the user can develop multivariate microarray scores to assess disease severity in patients with, e.g., SLE, or to derive expression vectors disclosed herein. Most importantly, it has been found that using the composite modular transcriptional markers of the present invention the results found herein are reproducible across microarray platform, thereby providing greater reliability for regulatory approval.
  • Gene expression monitoring systems for use with the present invention may include customized gene arrays with a limited and/or basic number of genes that are specific and/or customized for the one or more target diseases.
  • the present invention provides for not only the use of these general pan-arrays for retrospective gene and genome analysis without the need to use a specific platform, but more importantly, it provides for the development of customized arrays that provide an optimal gene set for analysis without the need for the thousands of other, non-relevant genes.
  • One distinct advantage of the optimized arrays and modules of the present invention over the existing art is a reduction in the financial costs (e.g., cost per assay, materials, equipment, time, personnel, training, etc.), and more importantly, the environmental cost of manufacturing pan-arrays where the vast majority of the data is irrelevant.
  • the modules of the present invention allow for the first time the design of simple, custom arrays that provide optimal data with the least number of probes while maximizing the signal to noise ratio.
  • By eliminating the total number of genes for analysis it is possible to, e.g., eliminate the need to manufacture thousands of expensive platinum masks for photolithography during the manufacture of pan-genetic chips that provide vast amounts of irrelevant data.
  • the limited probe set(s) of the present invention are used with, e.g., digital optical chemistry arrays, ball bead arrays, beads (e.g., Luminex), multiplex PCR, quantitative PCR, run-on assays, Northern blot analysis, or even, for protein analysis, e.g., Western blot analysis, 2-D and 3-D gel protein expression, MALDI, MALDI-TOF, fluorescence activated cell sorting (FACS) (cell surface or intracellular), enzyme linked immunosorbent assays (ELISA), chemiluminescence studies, enzymatic assays, proliferation studies or any other method, apparatus and system for the determination and/or analysis of gene expression that are readily commercially available.
  • digital optical chemistry arrays e.g., ball bead arrays, beads (e.g., Luminex), multiplex PCR, quantitative PCR, run-on assays, Northern blot analysis, or even, for protein analysis, e.g., Western blot analysis,
  • the "molecular fingerprinting system" of the present invention may be used to facilitate and conduct a comparative analysis of expression in different cells or tissues, different subpopulations of the same cells or tissues, different physiological states of the same cells or tissue, different developmental stages of the same cells or tissue, or different cell populations of the same tissue against other diseases and/or normal cell controls.
  • the normal or wild-type expression data may be from samples analyzed at or about the same time or it may be expression data obtained or culled from existing gene array expression databases, e.g., public databases such as the NCBI Gene Expression Omnibus database.
  • the term “differentially expressed” refers to the measurement of a cellular constituent (e.g., nucleic acid, protein, enzymatic activity and the like) that varies in two or more samples, e.g., between a disease sample and a normal sample.
  • the cellular constituent may be on or off (present or absent), upregulated relative to a reference or downregulated relative to the reference.
  • differential gene expression of nucleic acids e.g., mRNA or other RNAs (miRNA, siRNA, hnRNA, rRNA, tRNA, etc.) may be used to distinguish between cell types or nucleic acids.
  • RT quantitative reverse transcriptase
  • RT-PCR quantitative reverse transcriptase-polymerase chain reaction
  • the present invention avoids the need to identify those specific mutations or one or more genes by looking at modules of genes of the cells themselves or, more importantly, of the cellular RNA expression of genes from immune effector cells that are acting within their regular physiologic context, that is, during immune activation, immune tolerance or even immune anergy. While a genetic mutation may result in a dramatic change in the expression levels of a group of genes, biological systems often compensate for changes by altering the expression of other genes. As a result of these internal compensation responses, many perturbations may have minimal effects on observable phenotypes of the system but profound effects to the composition of cellular constituents.
  • the actual copies of a gene transcript may not increase or decrease, however, the longevity or half-life of the transcript may be affected leading to greatly increases protein production.
  • the present invention eliminates the need of detecting the actual message by, in one embodiment, looking at effector cells (e.g., leukocytes, lymphocytes and/or sub-populations thereof) rather than single messages and/or mutations.
  • samples may be obtained from a variety of sources including, e.g., single cells, a collection of cells, tissue, cell culture and the like.
  • RNA may be obtained from cells found in, e.g., urine, blood, saliva, tissue or biopsy samples and the like.
  • enough cells and/or RNA may be obtained from: mucosal secretion, feces, tears, blood plasma, peritoneal fluid, interstitial fluid, intradural, cerebrospinal fluid, sweat or other bodily fluids.
  • the nucleic acid source may include a tissue biopsy sample, one or more sorted cell populations, cell culture, cell clones, transformed cells, biopies or a single cell.
  • the tissue source may include, e.g., brain, liver, heart, kidney, lung, spleen, retina, bone, neural, lymph node, endocrine gland, reproductive organ, blood, nerve, vascular tissue, and olfactory epithelium.
  • the present invention includes the following basic components, which may be used alone or in combination, namely, one or more data mining algorithms; one or more module-level analytical processes; the characterization of blood leukocyte transcriptional modules; the use of aggregated modular data in multivariate analyses for the molecular diagnostic/prognostic of human diseases; and/or visualization of module-level data and results.
  • one or more data mining algorithms one or more module-level analytical processes
  • the characterization of blood leukocyte transcriptional modules the use of aggregated modular data in multivariate analyses for the molecular diagnostic/prognostic of human diseases
  • visualization of module-level data and results Using the present invention it is also possible to develop and analyze composite transcriptional markers, which may be further aggregated into a single multivariate score.
  • microarray-based research is facing significant challenges with the analysis of data that are notoriously "noisy,” that is, data that is difficult to interpret and does not compare well across laboratories and platforms.
  • a widely accepted approach for the analysis of microarray data begins with the identification of subsets of genes differentially expressed between study groups. Next, the users try subsequently to "make sense” out of resulting gene lists using pattern discovery algorithms and existing scientific knowledge.
  • the method includes the identification of the transcriptional components characterizing a given biological system for which an improved data mining algorithm was developed to analyze and extract groups of coordinately expressed genes, or transcriptional modules, from large collections of data.
  • Pulmonary tuberculosis is a major and increasing cause of morbidity and mortality worldwide caused by Mycobacterium tuberculosis (M. tuberculosis) .
  • M. tuberculosis Mycobacterium tuberculosis
  • Blood is the pipeline of the immune system, and as such is the ideal biologic material from which the health and immune status of an individual can be established.
  • using microarray technology to assess the activity of the entire genome in blood cells we identified distinct and reciprocal blood transcriptional biomarker signatures in patients with active pulmonary tuberculosis and latent tuberculosis.
  • the signature of latent tuberculosis which showed an over-representation of immune cytotoxic gene expression in whole blood, may help to determine protective immune factors against M. tuberculosis infection, since these patients are infected but most do not develop overt disease.
  • This distinct transcriptional biomarker signature from active and latent TB patients may be also used to diagnose infection, and to monitor response to treatment with anti-mycobacterial drugs.
  • the signature in active tuberculosis patients will help to determine factors involved in immunopathogenesis and possibly lead to strategies for immune therapeutic intervention.
  • This invention relates to a previous application that claimed the use of blood transcriptional biomarkers for the diagnosis of infections. However, this previous application did not disclose the existence of biomarkers for active and latent tuberculosis and focused rather on children with other acute infections (Ramillo, Blood, 2007).
  • the present identification of a transcriptional signature in blood from latent versus active TB patients can be used to test for patients with suspected Mycobacterium tuberculosis infection as well as for health screening/early detection of the disease.
  • the invention also permits the evaluation of the response to treatment with anti-mycobacterial drugs. In this context, a test would also be particularly valuable in the context of drug trials, and particularly to assess drug treatments in Multi-Drug Resistant patients.
  • the present invention may be used to obtain immediate, intermediate and long term data from the immune signature of latent tuberculosis to better define a protective immune response during vaccination trials.
  • the signature in active tuberculosis patients will help to determine factors involved in immunopathogenesis and possibly lead to strategies for immune therapeutic intervention.
  • Blood represents a reservoir and a migration compartment for cells of the innate and the adaptive immune systems, including either neutrophils, dendritic cells and monocytes, or B and T lymphocytes, respectively, which during infection will have been exposed to infectious agents in the tissue.
  • whole blood from infected individuals provides an accessible source of clinically relevant material where an unbiased molecular phenotype can be obtained using gene expression microarrays as previously described for the study of cancer in tissues (Alizadeh AA., 2000; Golub, TR., 1999; Bittner, 2000), and autoimmunity (Bennet, 2003; Baechler, EC, 2003; Burczynski, ME, 2005; Chaussabel, D., 2005; Cobb, JP., 2005; Kaizer, EC, 2007; Allantaz, 2005; Allantaz, 2007), and inflammation (Thach, DC, 2005) and infectious disease (Ramillo, Blood, 2007) in blood or tissue (Bleharski, JR et al., 2003).
  • Microarrays were used to analyze the whole genome and subsequent data mining revealed a large number of genes found to be differentially expressed at a statistically significant level across all groups of patients, including active and latent TB patients and healthy controls
  • a novel approach based on a modular data mining strategy was used, this approach provided a basis for the selection of clinically-relevant transcriptional biomarkers for the analysis of blood microarray transcriptional profiles in SLE and other diseases, and improved our understanding of disease pathogenesis (Chaussabel, 2008, Immunity).
  • the module maps defined in this study provide a means to organize and reduce the dimension of complex data, whilst still retaining the large number of genes expressed in human blood, thus allowing visualization of specific disease fingerprints (Chaussabel, 2008, Immunity).
  • Participant recruitment and Patient characterization Participants were recruited from St. Mary's Hospital TB Clinic, Imperial College Healthcare NHS Trust, London, with healthy controls recruited from volunteers at the National Institute for Medical Research (NIMR), Mill Hill, London. The study was approved by the local NHS Research Ethics Committee at St Marys Hospital (LREC), London, UK. All participants (aged 18 and over) gave written informed consent. Strict clinical criteria were satisfied before recruited participants had their provisional study grouping confirmed and were only then allocated to the final group for analysis. The patient and control cohorts were as follows: (i) Active PTB based on clinical diagnosis subsequently confirmed by laboratory isolation of M.
  • Latent TB - defined by a positive tuberculin skin test (TST, Using 2TU tuberculin (Serum Statens Institute, Copenhagen, Denmark) >6mm if BCG unvaccinated, >15mm if BCG vaccinated, together with a positive result using an Interferon Gamma Release Assay (IGRA, specifically the Quantiferon-TB Gold In-tube assay, Cellestis, Australia).
  • TST positive tuberculin skin test
  • IGRA Interferon Gamma Release Assay
  • This IGRA assay measured reactivity to antigens (ESAT-6/CFP-10/TB 7.7 - present in M. tuberculosis but not in most environmental mycobacteria or the M. bovis BCG vaccine) by IFN- ⁇ release from whole blood.
  • Latent TB patients also had to have evidence of exposure to infectious TB cases, either through close household or workplace contact, or as recent 'new entrants' from endemic areas; Patients with incidental findings of TST positivity without evidence of exposure to infected persons, were not eligible for inclusion in the study (iii) Healthy volunteer controls (BCG vaccinated and unvaccinated, ⁇ 14 mm or ⁇ 5 mm by TST respectively; and negative by IGRA). Participants who were pregnant, known to be immunosuppressed, taking immunosuppressive therapies or have diabetes, or autoimmune disease were also ineligible and excluded from this initial study. HIV positive individuals (Only 1% of the TB patients in London present with previously undiagnosed HIV) were excluded from the study. Blood from active and latent PTB patients was collected for the study before any anti-mycobacterial drugs were administered, and then subsequently at set time intervals for the longitudinal part of the study for later study.
  • RNA sampling, extraction, processing for microarray Whole blood from the above patient cohorts was collected into Tempus tubes (Applied Biosystems, Foster City, CA, USA) and stored between -20°C and - 80 0 C before RNA extraction. Total RNA was isolated using the PerfectPure RNA Blood kit (5 PRIME Inc, Gaithersburg, MD, USA). Samples were homogenized with 100% cold ethanol, vortexed, then centrifuged at 400Og for 60 minutes at 0 0 C, and the supernatant discarded. 300 ⁇ l lysis solution was then added to the pellet and vortexed. RNA binding, Dnase treatment, wash and RNA elution steps were then performed according to the manufacturer's instructions.
  • RNA Isolated total RNA was then globin reduced using the GLOBINclearTM 96- well format kit (Ambion, Austin, TX, USA) according to the manufacturer's instructions. Total and globin- reduced RNA integrity was assessed using an Agilent 2100 Bioanalyzer (Agilent, Palo Alto, CA). One sample from an active TB patient did not yield sufficient globin reduced RNA after processing to proceed and was therefore excluded from the final analysis. Biotinylated, amplified RNA targets (cRNA) were then prepared from the globin-reduced RNA using the Illumina CustomPrep RNA amplification kit (Ambion, Austin, TX, USA).
  • cRNA Biotinylated, amplified RNA targets
  • Labeled cRNA was hybridized overnight to Sentrix Human-6 V2 BeadChip array (>48,000 probes, Illumina Inc, San Diego, CA, USA), washed, blocked, stained and scanned on an Illumina BeadStation 500 following the manufacturer's protocols.
  • Illumina's BeadStudio version 2 software was used to generate signal intensity values from the scans, substract background, and scale each microarray to the median average intensity for all samples (per-chip normalization). This normalized data was used for all subsequent data analysis.
  • Microarray data analysis A gene expression analysis software program, Genespring, version 7.1.3 (Agilent), was used to perform statistical analysis and hierarchical clustering of samples. Differentially expressed genes were selected and clustered as described in Results and Figure legends.
  • Blood signatures distinguish active and latent TB patients from each other, and from healthy control individuals: To determine whether blood sampled from patients with active and latent TB carry gene expression signatures that allow discrimination between active and latent TB as compared to healthy controls, a step-wise analysis was conducted. After filtering out undetected transcripts and genes with a deviation from the median of less than 2 fold, i.e. with a flat profile, 6269 genes were used for unsupervised clustering analyses by Pearson correlation of the expression profiles obtained from the whole blood RNA samples from active and latent TB and healthy controls (Figure 1).
  • IFN-associated/inducible genes for example interferon (IFN)-inducible genes, e.g., SOCS l, STATl, PML (TRIM 19), TRIM22, many guanylate binding proteins, and many other IFN-inducible genes as indicated in Table 2, as expected in active TB, but interestingly these were not evident in latent TB patients, although these patients representation/expression of IFN- ⁇ transcripts in whole blood was in fact higher than the active TB patients. To focus in on this, certain families of genes, some of which are known to be upregulated by IFNs and others not, were further studied, including the TRIM family.
  • IFN interferon
  • TRIMS tripartite motif family of proteins are characterized by a discreet structure (Reymond, A., EMBO J., 2001) and have been shown to have multiple functions, including E3 ubiquitm hgases activity, induction of cellular proliferation, differentiation and apoptosis, immune cell signalling (Meroni, G., Bioessays, 2005). Their involvement has been implicated in protein-protein interactions, autoimmunity and development (Meroni, G., Bioessays, 2005). Furthermore, a number of TRIM proteins have been found to have anti-viral activity and are possibly involved in innate immunity (Nisole, F, 2005, Nat. Rev.
  • TRIM transcripts (some overlapping probes) were shown to be expressed in active TB, with some also expressed in latent TB and healthy control blood ( Figure 4; Table 3).
  • the majority of these TRIMs have been previously shown to be expressed in both human macrophages and mouse macrophages and dendritic cells (Rajsbaum, 2008, EJI; Martinez, FO., J. Imm., 2006) and regulated by IFNs, whereas TRIMs shown to be constitutively expressed in DC or in T cells (Rajsbaum, 2008, EJI) were not detected or were not found to be differentially expressed in active or latent TB versus healthy control blood.
  • TRIM 5, 6, 19(PML), 21, 22, 25, 68 are overrepresented/expressed; while the others are underepreresented/expressed: TRIM 28, 32, 51, 52, 68.
  • a group of TRIMs was highly expressed in active TB, but low to undetectable in latent TB and healthy controls, and four of these (TRIM 5, 6, 21, 22) have been show to cluster on human chromosome 11, and reported to have anti- viral activity (Song, B., 2005, J. Virol.); Li, X, Virology, 2007).
  • TRIMs were found to be under- expressed in the blood of active TB patients versus that of latent TB and healthy controls, including TRIM 28, 32, 51, 52 68, and these have been reported to either not be expressed in human blood-derived macrophages (TRIM 51) or only expressed in undifferentiated monocytes (TRIM-28, 52) or non-activated macrophages or alternately activated macrophages (TRIM-32), or only upregulated to a low level in activated macrophages differentiated from human blood (TRIM-68) (Martinez, FO., J. Imm., 2006).
  • TRIM genes differentially expressed in active pulmonary tuberculosis, latent tuberculosis and healthy controls.
  • CD28 CD28, ZAP-70 (T, NK and B cells), IL-7R, CD2 (also on B cells), SLAM (also on NK cells), CCR7,
  • GATA-3 also in NK cells. This could indicate that gene expression was down-regulated in T, NK and B cells during active PTB, or that the cells had been recruited elsewhere (e.g., the lung) as a result of infection with M. tuberculosis. This is currently under investigation using flow cytometric analysis of blood from the different patient groups, as well as by transcriptional analysis of purified populations of T cells from the different patient groups.
  • This pattern of expression/representation of the whole list of 1 19 genes now allows discrimination of all three clinical groups from each other: i.e., allows discrimination of Active TB, Latent TB and Healthy individuals from each other, each clinical group exhibiting a unique pattern of expression/representation of these 1 19 genes or subgroups thereof.
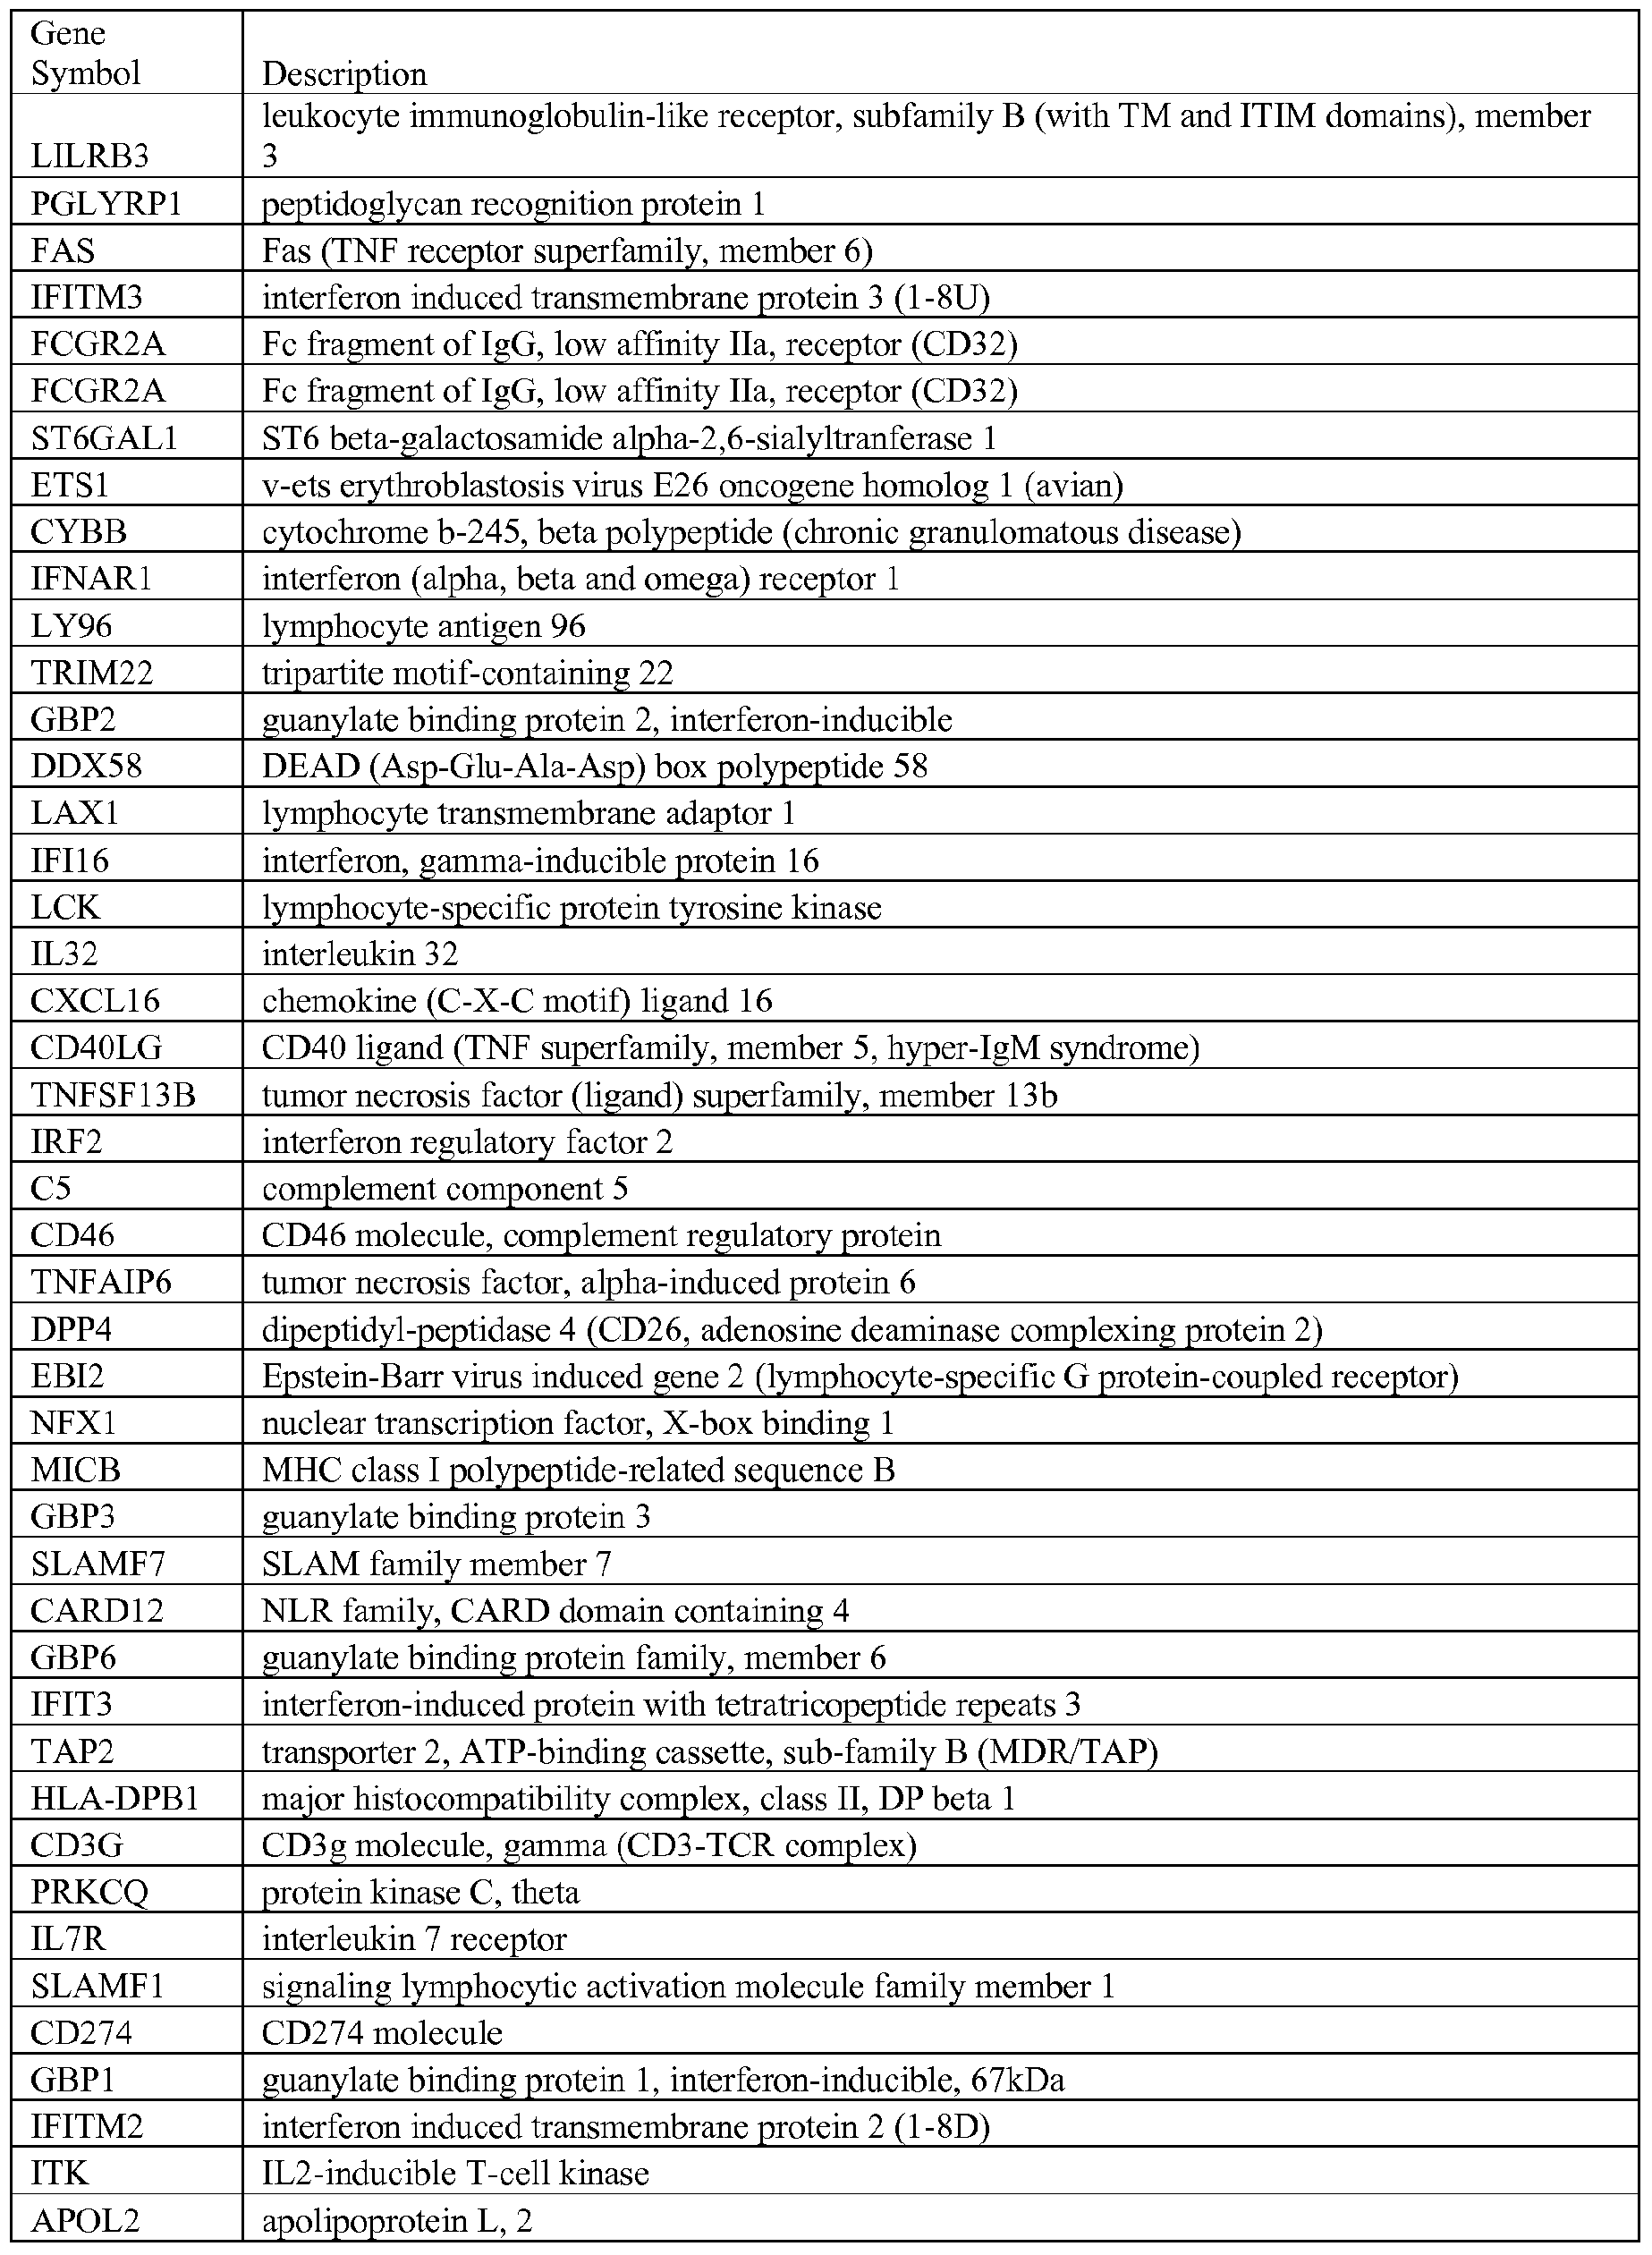
  • the skilled artisan will recognize that 1, 2, 3, 4, 5, 6, 7, 8, 10, 12, 15, 20, 25, 30, 35 or more genes may be placed in a dataset that represents a cluster of genes that may be compared across clusters of clinical groups A (Healthy), B (Latent), C (Active), and that either alone or in combination with other such clusters, each clinical group can exhibit a unique pattern of expression/representation obtained from these 119 genes.
  • Figure 8B demonstrates that the genes ST3GAL6, PAD14, TNFRSF12A, VAMP3, BR13, RGS19, PILRA, NCFl, LOC652616, PLAUR(CD87), SIGLEC5, B3GALT7, IB RD C 3 (NKLAM), ALOX5 AP(FLAP), MMP9, ANPEP(APN), NALP 12, CSF2RA, ILoR(CD 126), RASGRP4, TNFSF 14(CD258), NCF4, HK2, ARID3A, PGLYRPl(PGRP) are underexpressed/underrepresented in the blood of Latent TB patients but not in the blood of Healthy individuals or of Active TB patients.
  • LIMKl, NPC2, IL-15, LMTK2, STX1 1(FHL4) were shown to be overexpressed/overrepresented in the blood of Active TB, but underexpressed/underrepresented in the blood of Latent TB patients and Healthy control individuals.
  • spots are aligned on a grid, with each position corresponding to a different module based on their original definition
  • Spot intensity indicates proportion of differentially expressed transcripts changing in the direction shown out of the total number of transcripts detected for that module, while spot color indicates the polarity of the change (red: overexpressed/represented, blue: underexpressed/represented).
  • modules' coordinates can be associated to functional annotations to facilitate data interpretation (Chaussabel, Immunity, 2008; and Figures 9 and 10).
  • a modular map of active TB compared to healthy control (Figure 9, Table 7A - P; and Table 8) was shown to be distinct to the map of latent TB as compared to healthy controls ( Figure 10, Table 7A - F; and Table 9).
  • these independently derived module maps from active TB and latent TB show an inverse pattern of gene expression/representation, in modules which show changes in both disease states when compared with healthy controls.
  • Genes in module M2.1 associated with cytotoxic cells were underexpressed/represented (36% - 18 genes underexpressed/represented out of 50 detected in the module, genes listed in Table 6F) in active TB and yet overexpressed/represented (43% - 22 genes overexpressed/represented out of 51 detected in the module, genes listed in Table 7B) in latent TB.
  • genes in M3.2 and M3.3 (“inflammation”) (genes listed in Tables 6 J and 6K) were overexpressed/represented in active TB patients but underexpressed/represented in latent TB patients (genes listed in Table 7E and 7F).
  • genes in Ml.5 (“myeloid lineage”) were overexpressed/represented in active TB (genes listed in Table 6D) whereas they were underexpressed/represented in latent TB (genes listed in Table 7A).
  • TRAM toll-like receptor adaptor
  • Table 8A M 1.5 LTB v. Control, Genes Underrepresented in Latent TB.
  • the active TB group showed 5281 genes to be differentially expressed as compared to healthy controls, as compared to the latent group, which showed only differential expression of 3137 genes as compared to controls, possibly reflective of a more subdued, although clearly active immune response as shown by overexpression/representation of genes in the cytotoxic module.
  • these results probably explain the observation that changes in additional modules were seen in active TB patients as compared to controls, but not in latent TB as compared to controls.
  • Genes in module M2 4 under-expressed/represented (genes listed in Table 7G) included transcripts encoding ribosomal protein family members whose expression is altered in acute infection and sepsis (Calvano, 2005; Thach, 2005), and genes in this module have also been shown to be underexpressed in SLE, liver transplant patients and those infected with Streptococcus (S). pneumoniae (Chaussabel, Immunity, 2005).
  • active TB patients could be distinguished from latent TB patients. Furthermore, comparison of the modular map obtained for active TB in this study with other modular maps created for different diseases, it is clear that active TB patients have a distinct global transcriptional profile (Figure 9), than observed in patients with SLE, transplant, melanoma or S. pneumoniae patients (Chaussabel, 2008, Immunity). Certain modules may be common to a number of diseases such as M2.4, included transcripts encoding ribosomal protein family members, which is underexpressed in active TB, SLE, liver transplant patients and those infected with S. pneumoniae.
  • genes in other modules are less widely affected, such as M3.1 (IFN-inducible), which although overexpressed in active TB ( Figure 9) and SLE (Chaussabel, 2008, Immunity), but not other diseases, particularly S. pneumoniae, which shows no differential gene expression in M3.1 as compared to controls Transcriptional profiles in SLE differ from active TB with respect to over or underexpession of genes in a number of other modules.
  • M3 2 and M3.3 inflammatory
  • Ml 2 platelets
  • Ml .5 myeloid
  • the present invention identifies a discreet differential and reciprocal dataset of transcriptional signatures in the blood of latent and active TB patients.
  • active TB patients showed an over- expression/representation of genes in functional IFN-inducible, inflammatory and myeloid modules, which on the other hand were down-regulated/under-represented in latent TB.
  • Active TB patients showed and increased expression/over-representation of immunomodulatory genes PDL-I and PDL-2, which may contribute to the immunopathogenesis in TB.
  • Blood from latent TB patients showed an over- expression/representation of genes within a cytotoxic module, which may contribute to the protective response that contains the infection with M.
  • tuberculosis in these patients and could provide biomarkers for testing efficacy of vaccinations in clinical trials.
  • Such findings will be of value as diagnostics of latent and active TB, may yield insights into the potential mechanisms of immune protection (Latent TB) versus immune pathogenesis (Active TB), underlying these transcriptional differences, and the design of novel therapies for protection or in the design of immune therapeutics in active TB to achieve more rapid cure with anti-mycobacterial drugs.
  • compositions of the invention can be used to achieve methods of the invention.
  • the words “comprising” (and any form of comprising, such as “comprise” and “comprises”), “having” (and any form of having, such as “have” and “has”), "including” (and any form of including, such as “includes” and “include”) or “containing” (and any form of containing, such as “contains” and “contain”) are inclusive or open-ended and do not exclude additional, unrecited elements or method steps.
  • A, B, C, or combinations thereof refers to all permutations and combinations of the listed items preceding the term.
  • A, B, C, or combinations thereof is intended to include at least one of: A, B, C, AB, AC, BC, or ABC, and if order is important in a particular context, also BA, CA, CB, CBA, BCA, ACB, BAC, or CAB.
  • expressly included are combinations that contain repeats of one or more item or term, such as BB, AAA, MB, BBC, AAABCCCC, CBBAAA, CABABB, and so forth.
  • the skilled artisan will understand that typically there is no limit on the number of items or terms in any combination, unless otherwise apparent from the context.
  • compositions and/or methods disclosed and claimed herein can be made and executed without undue experimentation in light of the present disclosure. While the compositions and methods of this invention have been described in terms of preferred embodiments, it will be apparent to those of skill in the art that variations may be applied to the compositions and/or methods and in the steps or in the sequence of steps of the method described herein without departing from the concept, spirit and scope of the invention.

Landscapes

  • Life Sciences & Earth Sciences (AREA)
  • Health & Medical Sciences (AREA)
  • Chemical & Material Sciences (AREA)
  • Engineering & Computer Science (AREA)
  • Immunology (AREA)
  • Molecular Biology (AREA)
  • Organic Chemistry (AREA)
  • Proteomics, Peptides & Aminoacids (AREA)
  • Analytical Chemistry (AREA)
  • Pathology (AREA)
  • Biomedical Technology (AREA)
  • Hematology (AREA)
  • Urology & Nephrology (AREA)
  • Zoology (AREA)
  • Wood Science & Technology (AREA)
  • Genetics & Genomics (AREA)
  • Physics & Mathematics (AREA)
  • Biotechnology (AREA)
  • Biochemistry (AREA)
  • General Health & Medical Sciences (AREA)
  • Microbiology (AREA)
  • General Physics & Mathematics (AREA)
  • Medicinal Chemistry (AREA)
  • Virology (AREA)
  • Biophysics (AREA)
  • Tropical Medicine & Parasitology (AREA)
  • Food Science & Technology (AREA)
  • Cell Biology (AREA)
  • Bioinformatics & Cheminformatics (AREA)
  • General Engineering & Computer Science (AREA)
  • Measuring Or Testing Involving Enzymes Or Micro-Organisms (AREA)

Abstract

The present invention includes methods, systems and kits for distinguishing between active and latent mycobacterium tuberculosis infection in a patient suspected of being infected with mycobacterium tuberculosis, and distinguishing such patients from uninfected individuals, the method including the steps of obtaining a gene expression dataset from a whole blood obtained sample from the patient and determining the differential expression of one or more transcriptional gene expression modules that distinguish between infected and non-infected patients, wherein the dataset demonstrates an aggregate change in the levels of polynucleotides in the one or more transcriptional gene expression modules as compared to matched non- infected patients, thereby distinguishing between active and latent mycobacterium tuberculosis infection.

Description

BLOOD TRANSCRIPTIONAL SIGNATURE OF MYCOBACTERIUM TUBERCULOSIS
INFECTION
TECHNICAL FIELD OF THE INVENTION
The present invention relates in general to the field of Mycobacterium tuberculosis infection, and more particularly, to a system, method and apparatus for the diagnosis, prognosis and monitoring of latent and active Mycobacterium tuberculosis infection and disease progression before, during and after treatment.
LENGTHY TABLE
The patent application contains a lengthy table section. A copy of the table is available in electronic form from the USPTO web site (http://seqdata.uspto.gov/). An electronic copy of the table will also be available from the USPTO upon request and payment of the fee set forth in 37 CFR 1.19(b)(3).
BACKGROUND OF THE INVENTION
Without limiting the scope of the invention, its background is described in connection with the identification and treatment of Mycobacterium tuberculosis infection.
Pulmonary tuberculosis (PTB) is a major and increasing cause of morbidity and mortality worldwide caused by Mycobacterium tuberculosis (M. tuberculosis). However, the majority of individuals infected with M. tuberculosis remain asymptomatic, retaining the infection in a latent form and it is thought that this latent state is maintained by an active immune response (WHO; Kaufmann, SH & McMichael, AJ., Nat Med,
2005). This is supported by reports showing that treatment of patients with Crohn's Disease or Rheumatoid
Arthritis with anti-TNF antibodies, results in improvement of autoimmune symptoms, but on the other hand causes reactivation of TB in patients previously in contact with M. tuberculosis (Keane). The immune response to M. tuberculosis is multifactorial and includes genetically determined host factors, such as TNF, and IFN-γ and IL-12, of the ThI axis (Reviewed in Casanova, Ann Rev; Newport). However, immune cells from adult pulmonary TB patients can produce IFN-γ, IL-12 and TNF, and IFN-γ therapy does not help to ameliorate disease (Reviewed in Reljic, 2007, J Interferon & Cyt Res., 27, 353-63), suggesting that a broader number of host immune factors are involved in protection against M. tuberculosis and the maintenance of latency. Thus, a knowledge of host factors induced in latent versus active TB may provide information with respect to the immune response which can control infection with M. tuberculosis.
The diagnosis of PTB can be difficult and problematic for a number of reasons. Firstly demonstrating the presence of typical M. tuberculosis bacilli in the sputum by microscopy examination (smear positive) has a sensitivity of only 50 - 70%, and positive diagnosis requires isolation of M. tuberculosis by culture, which can take up to 8 weeks. In addition, some patients are smear negative on sputum or are unable to produce sputum, and thus additional sampling is required by bronchoscopy, an invasive procedure. Due to these limitations in the diagnosis of PTB, smear negative patients are sometimes tested for tuberculin (PPD) skin reactivity (Mantoux). However, tuberculin (PPD) skin reactivity cannot distinguish between BCG vaccination, latent or active TB. In response to this problem, assays have been developed demonstrating immunoreactivity to specific M. tuberculosis antigens, which are absent in BCG. Reactivity to these M. tuberculosis antigens, as measured by production of IFN-γ by blood cells in Interferon Gamma Release Assays (IGRA), however, does not differentiate latent from active disease. Latent TB is defined in the clinic by a delayed type hypersensitivity reaction when the patient is intradermally challenged with PPD, together with an IGRA positive result, in the absence of clinical symptoms or signs, or radiology suggestive of active disease. The reactivation of latent/dormant tuberculosis (TB) presents a major health hazard with the risk of transmission to other individuals, and thus biomarkers reflecting differences in latent and active TB patients would be of use in disease management, particularly since anti-mycobacterial drug treatment is arduous and can result in serious side-effects.
SUMMARY OF THE INVENTION
The present invention includes methods and kits for the identification of latent versus active tuberculosis (TB) patients, as compared to healthy controls. In one embodiment, microarray analysis of blood of a distinct and reciprocal immune signature is used to determine, diagnose, track and treat latent versus active tuberculosis (TB) patients.
In one embodiment, the present invention includes methods, systems and kits for distinguishing between active and latent Mycobacterium tuberculosis infection in a patient suspected of being infected with Mycobacterium tuberculosis, the method including the steps of: obtaining a gene expression dataset from a whole blood sample from the patient; determining the differential expression of one or more transcriptional gene expression modules that distinguish between infected patients and non-infected individuals, wherein the dataset demonstrates an aggregate change in the levels of polynucleotides in the one or more transcriptional gene expression modules as compared to matched non-infected individuals, and distinguishing between active and latent Mycobacterium tuberculosis (TB) infection based on the one or more transcriptional gene expression modules that differentiate between active and latent infection. In one aspect, the invention may also include the step of using the determined comparative gene product information to formulate a diagnosis
In another aspect, the method may also include the step of using the determined comparative gene product information to formulate a prognosis or the step of using the determined comparative gene product information to formulate a treatment plan In one alternative aspect, the method may include the step of distinguishing patients with latent TB from active TB patients. In one aspect, the module may include a dataset of the genes in modules Ml 2, M1.3, M1.4, M1.5, Ml .8, M2 1, M2.4, M2.8, M3.1, M3.2, M3 3, M3.4, M3 6, M3 7, M3.8 or M3.9 to detect active pulmonary infection. In another aspect, the module may include a dataset of the genes in modules M 1.5, M2.1, M2.6, M2.10, M3 2 or M3 3 to detect a latent infection In yet another aspect, the following genes are down-regulated m active pulmonary infection CD3, CTLA-4, CD28, ZAP-70, IL-7R, CD2, SLAM, CCR7 and GATA-3 In one specific aspect, the expression profile of the modules m Figure 9 is indicative of active pulmonary infection and the expression profile of the modules m Figure 10 is indicative of latent infection It has been found that the underexpression of genes m modules M3 4, M3 6, M3 7, M3 8 and M3 9 is indicative of active infection It has also been found that the overexpression of genes m modules M3 1 is indicative of active infection
In yet another aspect of the present invention, the method may also include the step of distinguishing TB infection from other bacterial infections by determining the gene expression m modules M2 2, M2 3 and M3 5, which are overexpressed by the peπpheral blood mononuclear cells or whole blood in mfection other than Mycobacterium Alternatively, the method may include the step of distinguishing the differential and reciprocal transcπptional signatures m the blood of latent and active TB patients using two or more of the following modules Ml 3, Ml 4, Ml 5, Ml 8, M2 1, M2 4, M2 8, M3 1, M3 2, M3 3, M3 4, M3 6, M3 7, M3 8 or M3 9 for active pulmonary infection and modules Ml 5, M2 1, M2 6, M2 10, M3 2 or M3 3 for a latent infection Examples of the genes that are upregulated in active pulmonary TB mfection versus a healthy patient are selected from Tables 7A, 7D, 71, 7 J and 7K Further examples of the genes that are downregulated m active pulmonary TB infection versus a healthy patient are selected from Tables 7B, 7C, 7E, 7F, 7G, 7H, 7L, 7M, 7N, 70 and 7P In one specific aspect, the genes that are upregulated m latent TB infection versus a healthy patient may be selected from Table 8B In another specific aspect, the genes that are downregulated m latent TB infection versus a healthy patient may be selected from Tables 8A, 8C, 8D, 8E and 8F
Another embodiment of the present invention is a method for distinguishing between active and latent Mycobacterium tuberculosis infection in a patient suspected of being infected with Mycobacterium tuberculosis, the method including the steps of obtaining a first gene expression dataset obtained from a first clinical group with active Mycobacterium tuberculosis infection, a second gene expression dataset obtained from a second clinical group with a latent Mycobacterium tuberculosis infection patient and a third gene expression dataset obtained from a clinical group of non mfected individuals, generating a gene cluster dataset comprising the differential expression of genes between any two of the first, second and third datasets, and determining a unique pattern of expression/representation that is indicative of latent infection, active infection or being healthy In one aspect, each clinical group is separated into a unique pattern of expression/representation for each of the 1 19 genes of Table 6 In another aspect, values for the first and third datasets are compared and the values for the dataset from the third dataset are subtracted therefrom In another specific aspect, the values for the second and third datasets are compared and the values for the dataset from the third dataset are subtracted therefrom In one specific embodiment, the method may further include the step of comparing values for two different datasets and subtracting the values for the remaining dataset to distinguish between a patient with a latent infection, a patient with an active infection and a non- infected individual. In one aspect, the method may further comprise the step of using the determined comparative gene product information to formulate a diagnosis or a prognosis. In yet another aspect, the method includes the step of using the determined comparative gene product information to formulate a treatment plan. The method may also include the step of distinguishing patients with latent TB from active TB patients by analyzing the expression/representation of genes in the gene and patient clusters.
In one specific aspect, the method may further include the step of determining the expression levels of the genes: ST3GAL6, PAD14, TNFRSF12A, VAMP3, BRl 3, RGS19, PILRA, NCFl, LOC652616, PLAUR(CD87), SIGLEC5, B3GALT7, IBRDC3(NKLAM), ALOX5AP(FLAP), MMP9, ANPEP(APN), NALP 12, CSF2RA, ILOR(CD 126), RASGRP4, TNFSF14(CD258), NCF4, HK2, ARID3A, PGLYRPl(PGRP), which are underexpressed/underrepresented in the blood of Latent TB patients but not in the blood of Healthy individuals or Active TB patients. In another specific aspect, the method may further include the step of determining the expression levels of the genes: ABCGl, SREBFl, RBP7(CRBP4), C22orf5, FAMlOlB, SlOOP, LOC649377, UBTDl, PSTPIP- I, RENBP, PGM2, SULF2, FAM7A1, HOM- TES-103, NDUFAFl, CESl, CYP27A1, FLJ33641, GPR177, MID IIP 1(MIG- 12), PSD4, SF3A1, NOV(CCN3), SGK(SGKl), CDK5R1, LOC642035, which are overexpressed/overrepresented in the blood of Healthy control individuals but were underexpressed/underrepresented in the blood of Latent TB patients, and underexpressed/underrepresented in the blood of Active TB patients. In another specific aspect, the method may further include the step of determining the expression levels of the genes: ARSG, LOC284757, MDM4, CRNKLl, IL8, LOC389541, CD300LB, NIN, PHKG2, HIPl, which are overexpressed/overrepresented in the blood of Healthy individuals, are underexpressed/underrepresented in the blood of both Latent and Active TB patients. In one specific aspect, the method may further include the step of determining the expression levels of the genes: PSMB8(LMP7), APOL6, GBP2, GBP5, GBP4, ATF3, GCHl, VAMP5, WARS, LIMKl, NPC2, IL- 15, LMTK2, STX1 1(FHL4), which are overexpressed/overrepresented in the blood of Active TB, and underexpressed/underrepresented in the blood of Latent TB patients and Healthy control individuals. In one specific aspect, the method may further include the step of determining the expression levels of the genes: FLJl 1259(DRAM), JAK2, GSDMDC 1(DF5L)(FKSG 10), SIPAILl, [2680400](KIAA1632), ACTA2(ACTSA), KCNMBl(SLO- BETA), which are overexpressed/overrepresented in blood from Active TB patients, and underexpressed/underrepresented in the blood from Latent TB patients and Healthy control individuals. In one specific aspect, the method may further include the step of determining the expression levels of the genes: SPTANI, KIAAD 179(Nnp I)(RRPl), FAM84B(NSE2), SELM, IL27RA, MRPS34, [6940246](IL23A), PRKCA(PKCA), CCDC41, CD52(CDW52), [3890241](ZN404), MCCCl (MCCA/B), SOX8, SYNJ2, FLJ21 127, FHIT, which are underexpressed/underrepresented in the blood of Active TB patients but not in the blood of Latent TB patients or Healthy Control individuals. In one specific aspect, the method may further include the step of determining the expression levels of the genes: CDKLl(p42), MICALCL, MBNL3, RHD, ST7(RAY1), PPR3R1, [360739](PIP5K2A), AMFR, FLJ22471, CRAT(CATl), PLA2G4C, ACOT7(ACT)(ACH1), RNF 182, KLRC3(NKG2E), HLA-DPBl, which are underexpressed/underrepresented in the blood of Healthy Control individuals, overexpressed/overrepresented in the blood of the Latent TB patients, and overexpressed/overrepresented in the blood of Active TB patients.
Yet another embodiment of the present invention is a method for distinguishing between active and latent mycobacterium tuberculosis infection in a patient suspected of being infected with Mycobacterium tuberculosis, the method including the steps of: obtaining a gene expression dataset from a whole blood sample; sorting the gene expression dataset into one or more transcriptional gene expression modules; and mapping the differential expression of the one or more transcriptional gene expression modules that distinguish between active and latent Mycobacterium tuberculosis infection, thereby distinguishing between active and latent Mycobacterium tuberculosis infection. In one aspect, the dataset includes TRIM genes. In one aspect, the dataset includes TRIM genes, specifically, TRIM 5, 6, 19(PML), 21, 22, 25, 68 are overrepresented/expressed in active pulmonary TB. In one aspect, the dataset of TRIM genes, includes TRIM 28, 32, 51, 52, 68, are underepresented/expressed in active pulmonary TB.
Another embodiment of the present invention is a method of diagnosing a patient with active and latent Mycobacterium tuberculosis infection in a patient suspected of being infected with mycobacterium tuberculosis, the method comprising detecting differential expression of one or more transcriptional gene expression modules that distinguish between infected and non-infected patients obtained from whole blood, wherein whole blood demonstrates an aggregate change in the levels of polynucleotides in the one or more transcriptional gene expression modules as compared to matched non-infected patients, thereby distinguishing between active and latent mycobacterium tuberculosis infection. In another aspect, the method includes one or more of the step of: using the determined comparative gene product information to formulate a diagnosis, the step of using the determined comparative gene product information to formulate a prognosis and the step of using the determined comparative gene product information to formulate a treatment plan. In one alternative aspect, the method may include the step of distinguishing patients with latent TB from active TB patients. In one aspect, the module may include a dataset of the genes in modules M1.2, M1.3, M1.4, Ml .5, Ml .8, M2.1, M2.4, M2.8, M3.1, M3.2, M3.3, M3.4, M3.6, M3.7, M3.8 or M3.9 to detect active pulmonary infection. In another aspect, the module may include a dataset of the genes in modules Ml.5, M2.1, M2.6, M2.10, M3.2 or M3.3 to detect a latent infection. In yet another aspect, the following genes are down-regulated in active pulmonary infection CD3, CTLA-4, CD28, ZAP-70, IL-7R, CD2, SLAM, CCR7 and GAT A-3. In one specific aspect, the expression profile of the modules m Figure 9 is indicative of active pulmonary infection and the expression profile of the modules in Figure 10 is indicative of latent infection. It has been found that the underexpression of genes in modules M3.4, M3.6, M3.7, M3.8 and M3.9 is indicative of active infection. It has also been found that the overexpression of genes in modules M3.1 is indicative of active infection. In yet another aspect of the present invention, the method may also include the step of distinguishing TB infection from other bacterial infections by determining the gene expression in modules M2.2, M2.3 and M3.5, which are overexpressed by the peripheral blood mononuclear cells or whole blood in infection other than Mycobacterium. Alternatively, the method may include the step of distinguishing the differential and reciprocal transcriptional signatures in the blood of latent and active TB patients using two or more of the following modules: M1.3, M1.4, Ml.5, Ml .8, M2.1, M2.4, M2.8, M3.1, M3.2, M3.3, M3.4, M3.6, M3.7, M3.8 or M3.9 for active pulmonary infection and modules M1.5, M2.1, M2.6, M2.10, M3.2 or M3.3 for a latent infection. Examples of the genes that are upregulated in active pulmonary TB infection versus a healthy patient are selected from Tables 7 A, 7D, 71, 7J and 7K. Further examples of the genes that are downregulated in active pulmonary TB infection versus a healthy patient are selected from Tables 7B, 7 C, 7E, 7F, 7G, 7H, 7L, 7M, 7N, 70 and 7P. In one specific aspect, the genes that are upregulated in latent TB infection versus a healthy patient may be selected from Table 8B. In another specific aspect, the genes that are downregulated in latent TB infection versus a healthy patient may be selected from Tables 8A, 8C, 8D, 8E and 8F.
Another embodiment of the present invention is a kit for diagnosing a patient with active and latent mycobacterium tuberculosis infection in a patient suspected of being infected with Mycobacterium tuberculosis, the kit that includes a gene expression detector for obtaining a gene expression dataset from the patient; and a processor capable of comparing the gene expression to pre-defined gene module dataset that distinguish between infected and non-infected patients obtained from whole blood, wherein whole blood demonstrates an aggregate change in the levels of polynucleotides in the one or more transcriptional gene expression modules as compared to matched non-infected patients, thereby distinguishing between active and latent Mycobacterium tuberculosis infection.
Yet another embodiment includes a system of diagnosing a patient with active and latent Mycobacterium tuberculosis infection comprising: a gene expression dataset from the patient; and a processor capable of comparing the gene expression to pre-defined gene module dataset that distinguish between infected and non-infected patients obtained from whole blood, wherein whole blood demonstrates an aggregate change in the levels of polynucleotides in the one or more transcriptional gene expression modules as compared to matched non-infected patients, thereby distinguishing between active and latent Mycobacterium tuberculosis infection, wherein the modules are selected from M1.3, M1.4, M1.5, Ml.8, M2.1, M2.4, M2.8, M3.1, M3.2, M3.3, M3.4, M3.6, M3.7, M3.8 or M3.9 for active pulmonary infection and modules Ml.5, M2.1, M2.6, M2.10, M3.2 or M3.3 for a latent infection.
BRIEF DESCRIPTION OF THE DRAWINGS
For a more complete understanding of the features and advantages of the present invention, reference is now made to the detailed description of the invention along with the accompanying figures and in which: Figure 1 shows the gene array expression results from 42 participants, genes present in at least 2 samples (PAL2), genes 2 folds over or under represented compared with median, clustered by Pearson Correlation comparing active PTB, latent TB, healthy BCG non- vaccinated controls and healthy BCG vaccinated controls; Figure 2 shows the gene array expression results from PAL2, 2 folds up or down expressed, filtered for statistically significant differences in expression between clinical groups using a non-parametric test (Kruskal-Wallis), P < 0.01, with Benjamini-Hochberg correction (1473 genes) and independently clustered using Pearson correlation comparing active PTB, latent TB and healthy controls;
Figures 3A - 3D show the gene array expression results from PAL2, 2 folds up or down expressed, filtered for statistically significant differences in expression between clinical groups using a non-parametric test (Kruskal-Wallis), P < 0.01, with Benjamini-Hochberg correction, and then filtered for the presence of the gene ontology term for biological process "immune response" in the gene annotation and independently clustered using Pearson correlation (158 genes). These 158 genes are shown separated into 4 figures (3A - 3D) for legibility. Figure 3 A shows gene array expression results comparing active PTB, latent TB, healthy BCG non- vaccinated controls and healthy BCG vaccinated controls;
Figure 3B shows gene array expression results comparing active PTB, latent TB, healthy BCG non- vaccinated controls and healthy BCG vaccinated controls;
Figure 3 C shows gene array expression results comparing active PTB, latent TB, healthy BCG non- vaccinated controls and healthy BCG vaccinated controls;
Figure 3D shows gene array expression results comparing active PTB, latent TB, healthy BCG non- vaccinated controls and healthy BCG vaccinated controls;
Figure 4 shows the gene array expression results from 42 participants, genes present in at least 2 samples (PALI), genes 2 folds over or under represented compared with median, Genes selected as TRIMs - clustered by Pearson Correlation comparing active PTB, latent TB, healthy BCG non-vaccinated controls and healthy BCG vaccinated controls;
Figure 5A shows detail from the gene array expression results from 42 participants, genes present in at least 2 samples (PAL2), genes 2 folds over or under represented compared with median, clustered by Pearson Correlation comparing active PTB, latent TB, healthy BCG non-vaccinated controls and healthy BCG vaccinated controls, showing that inhibitory immunoregulatory ligands (PDL1/CD274, PDL2/CD273) are overexpressed in active TB patients.
Figure 5B shows the unfiltered gene array expression results that demonstrate that PDLl is only expressed in active TB patients; Figure 6 shows the gene array expression results filtered for genes present in at least 2 samples, 2 folds up or down 'represented' compared to median, statistically significantly differentially expressed across groups (P<0.1 , Kruskal-Wallis non-parametric test with Bonferroni correction) (46 genes) independently clustered using Pearson correlation, comparing active PTB, latent TB, healthy BCG non-vaccinated controls and healthy BCG vaccinated controls;
Figure 7 shows the gene array expression results filtered for genes present in at least 2 samples, 2 folds up or down 'represented' compared to median, statistically significantly differentially expressed across groups (P<0.05, Kruskal-Wallis non-parametric test with Bonferroni correction) (18 genes) independently clustered using Pearson correlation, comparing active PTB, latent TB, healthy BCG non-vaccinated controls and healthy BCG vaccinated controls;
Figure 8A shows that the results of merging different statistical filters applied to the list of genes filtered present in at least 2 samples, 2 folds up or down 'represented' compared to median, discriminates between all three clinical groups. The transcripts shown are statistically significantly differentially expressed between Latent and healthy (P<0.005, Wilcoxon-Mann- Whitney non-parametric test with no correction) plus the transcripts statistically significantly differentially expressed between Active and healthy (P<0.5, Wilcoxon- Mann- Whitney non-parametric test with Bonferroni correction) - 119 genes in total independently clustered using Pearson correlation (clusters of patients/clinical groups are presented horizontally and clusters of genes are presented vertically); These 1 19 genes are shown separated into 5 further figures (8B -8F) for legibility and to show that subgroups of these genes may also be used to distinguish between different clinical groups (i.e. between Active, Latent and Healthy).
Figure 8B shows the gene array expression results filtered for genes present in at least 2 samples, 2 folds up or down 'represented' compared to median, transcripts statistically significantly differentially expressed between Latent and healthy (P<0.005, Wilcoxon-Mann- Whitney non-parametric test with no correction) PLUS transcripts statistically significantly differentially expressed between Active and healthy (P<0.5, Wilcoxon-Mann- Whitney non-parametric test with Bonferroni correction) (clusters of patients/clinical groups are presented horizontally and clusters of genes are presented vertically);
Figure 8C shows the gene array expression results filtered for genes present in at least 2 samples, 2 folds up or down 'represented' compared to median, transcripts statistically significantly differentially expressed between Latent and healthy (P<0.005, Wilcoxon-Mann- Whitney non-parametric test with no correction) PLUS transcripts statistically significantly differentially expressed between Active and healthy (P<0.5, Wilcoxon-Mann- Whitney non-parametric test with Bonferroni correction);
Figure 8D shows the gene array expression results filtered for genes present in at least 2 samples, 2 folds up or down 'represented' compared to median, transcripts statistically significantly differentially expressed between Latent and healthy (P<0.005, Wilcoxon-Mann- Whitney non-parametric test with no correction) PLUS transcripts statistically significantly differentially expressed between Active and healthy (P<0.5, Wilcoxon-Mann- Whitney non-parametric test with Bonferroni correction) (clusters of patients/clinical groups are presented horizontally and clusters of genes are presented vertically);
Figure 8E shows the gene array expression results filtered for genes present in at least 2 samples, 2 folds up or down 'represented' compared to median, transcripts statistically significantly differentially expressed between Latent and healthy (P<0.005, Wilcoxon-Mann- Whitney non-parametric test with no correction) PLUS transcripts statistically significantly differentially expressed between Active and healthy (P<0.5, Wilcoxon-Mann- Whitney non-parametric test with Bonferroni correction) (clusters of patients/clinical groups are presented horizontally and clusters of genes are presented vertically); Figure 8F shows the gene array expression results filtered for genes present in at least 2 samples, 2 folds up or down 'represented' compared to median, transcripts statistically significantly differentially expressed between Latent and healthy (P<0.005, Wilcoxon-Mann- Whitney non-parametric test with no correction) PLUS transcripts statistically significantly differentially expressed between Active and healthy (P<0.5, Wilcoxon-Mann- Whitney non-parametric test with Bonferroni correction) (clusters of patients/clinical groups are presented horizontally and clusters of genes are presented vertically);
Figure 9 shows the gene array expression results from a gene module analysis of PTB(9) vs Control(6): from 5281 genes, filtered for PAL2, statistically significantly differentially expressed between active PTB and healthy controls by Wilcoxon-Mann- Whitney-test, p<0.05, with no multi-test correction; and
Figure 10 shows the gene array expression results from from a gene module analysis of LTB(9) vs Control(6): from - 3137 genes, filtered for PAL2, statistically significantly differentially expressed between active PTB and healthy controls by Wilcoxon-Mann- Whitney-test, p<0.05, with no multi-test correction.
DETAILED DESCRIPTION OF THE INVENTION
While the making and using of various embodiments of the present invention are discussed in detail below, it should be appreciated that the present invention provides many applicable inventive concepts that can be embodied in a wide variety of specific contexts. The specific embodiments discussed herein are merely illustrative of specific ways to make and use the invention and do not delimit the scope of the invention.
To facilitate the understanding of this invention, a number of terms are defined below. Terms defined herein have meanings as commonly understood by a person of ordinary skill in the areas relevant to the present invention. Terms such as "a", "an" and "the" are not intended to refer to only a singular entity, but include the general class of which a specific example may be used for illustration. The terminology herein is used to describe specific embodiments of the invention, but their usage does not delimit the invention, except as outlined in the claims. Unless defined otherwise, all technical and scientific terms used herein have the meaning commonly understood by a person skilled in the art to which this invention belongs. The following references provide one of skill with a general definition of many of the terms used in this invention: Singleton et al., Dictionary of Microbiology and Molecular Biology (2d ed. 1994); The Cambridge Dictionary of Science and Technology (Walker ed., 1988); The Glossary of Genetics, 5TH ED., R. Rieger et al. (eds.), Springer Verlag (1991); and Hale & Marham, The Harper Collins Dictionary of Biology (1991). Various biochemical and molecular biology methods are well known in the art. For example, methods of isolation and purification of nucleic acids are described in detail in WO 97/10365; WO 97/27317; Chapter 3 of Laboratory Techniques in Biochemistry and Molecular Biology: Hybridization with Nucleic Acid Probes, Part I. Theory and Nucleic Acid Preparation, (P. Tijssen, ed.) Elsevier, N. Y. (1993); Sambrook, et al., Molecular Cloning: A Laboratory Manual, Cold Spring Harbor Press, N.Y., (1989); and Current Protocols in Molecular Biology, (Ausubel, F. M. et al., eds.) John Wiley & Sons, Inc., New York (1987-1999), including supplements.
BIOΓNFORMATICS DEFINITIONS
As used herein, an "object" refers to any item or information of interest (generally textual, including noun, verb, adjective, adverb, phrase, sentence, symbol, numeric characters, etc.). Therefore, an object is anything that can form a relationship and anything that can be obtained, identified, and/or searched from a source. "Objects" include, but are not limited to, an entity of interest such as gene, protein, disease, phenotype, mechanism, drug, etc. In some aspects, an object may be data, as further described below.
As used herein, a "relationship" refers to the co-occurrence of objects within the same unit (e.g., a phrase, sentence, two or more lines of text, a paragraph, a section of a webpage, a page, a magazine, paper, book, etc.). It may be text, symbols, numbers and combinations, thereof
As used herein, "meta data content" refers to information as to the organization of text in a data source. Meta data can comprise standard metadata such as Dublin Core metadata or can be collection-specific. Examples of metadata formats include, but are not limited to, Machine Readable Catalog (MARC) records used for library catalogs, Resource Description Format (RDF) and the Extensible Markup Language (XML). Meta objects may be generated manually or through automated information extraction algorithms.
As used herein, an "engine" refers to a program that performs a core or essential function for other programs. For example, an engine may be a central program in an operating system or application program that coordinates the overall operation of other programs. The term "engine" may also refer to a program containing an algorithm that can be changed. For example, a knowledge discovery engine may be designed so that its approach to identifying relationships can be changed to reflect new rules of identifying and ranking relationships.
As used herein, "semantic analysis" refers to the identification of relationships between words that represent similar concepts, e.g., though suffix removal or stemming or by employing a thesaurus. "Statistical analysis" refers to a technique based on counting the number of occurrences of each term (word, word root, word stem, n-gram, phrase, etc.). In collections unrestricted as to subject, the same phrase used in different contexts may represent different concepts. Statistical analysis of phrase co-occurrence can help to resolve word sense ambiguity. "Syntactic analysis" can be used to further decrease ambiguity by part-of-speech analysis. As used herein, one or more of such analyses are referred to more generally as "lexical analysis." "Artificial intelligence (AI)" refers to methods by which a non-human device, such as a computer, performs tasks that humans would deem noteworthy or "intelligent." Examples include identifying pictures, understanding spoken words or written text, and solving problems.
Terms such "data", "dataset" and "information" are often used interchangeably, as are "information" and "knowledge." As used herein, "data" is the most fundamental unit that is an empirical measurement or set of measurements. Data is compiled to contribute to information, but it is fundamentally independent of it and may be combined into a dataset, that is, a set of data. Information, by contrast, is derived from interests, e.g., data (the unit) may be gathered on ethnicity, gender, height, weight and diet for the purpose of finding variables correlated with risk of cardiovascular disease. However, the same data could be used to develop a formula or to create "information" about dietary preferences, i.e., likelihood that certain products in a supermarket have a higher likelihood of selling.
As used herein, the term "database" refers to repositories for raw or compiled data, even if various informational facets can be found within the data fields. A database may include one or more datasets. A database is typically organized so its contents can be accessed, managed, and updated (e.g., the database is dynamic). The term "database" and "source" are also used interchangeably in the present invention, because primary sources of data and information are databases. However, a "source database" or "source data" refers in general to data, e.g., unstructured text and/or structured data that are input into the system for identifying objects and determining relationships. A source database may or may not be a relational database. However, a system database usually includes a relational database or some equivalent type of database which stores values relating to relationships between objects.
As used herein, a "system database" and "relational database" are used interchangeably and refer to one or more collections of data organized as a set of tables containing data fitted into predefined categories. For example, a database table may comprise one or more categories defined by columns (e.g. attributes), while rows of the database may contain a unique object for the categories defined by the columns. Thus, an object such as the identity of a gene might have columns for its presence, absence and/or level of expression of the gene. A row of a relational database may also be referred to as a "set" and is generally defined by the values of its columns. A "domain" in the context of a relational database is a range of valid values a field such as a column may include. As used herein, a "domain of knowledge" refers to an area of study over which the system is operative, for example, all biomedical data. It should be pointed out that there is advantage to combining data from several domains, for example, biomedical data and engineering data, for this diverse data can sometimes link things that cannot be put together for a normal person that is only familiar with one area or research/study (one domain). A "distributed database" refers to a database that may be dispersed or replicated among different points in a network.
As used herein, "information" refers to a data set that may include numbers, letters, sets of numbers, sets of letters, or conclusions resulting or derived from a set of data. "Data" is then a measurement or statistic and the fundamental unit of information. "Information" may also include other types of data such as words, symbols, text, such as unstructured free text, code, etc. "Knowledge" is loosely defined as a set of information that gives sufficient understanding of a system to model cause and effect. To extend the previous example, information on demographics, gender and prior purchases may be used to develop a regional marketing strategy for food sales while information on nationality could be used by buyers as a guideline for importation of products. It is important to note that there are no strict boundaries between data, information, and knowledge; the three terms are, at times, considered to be equivalent. In general, data comes from examining, information comes from correlating, and knowledge comes from modeling.
As used herein, "a program" or "computer program" refers generally to a syntactic unit that conforms to the rules of a particular programming language and that is composed of declarations and statements or instructions, divisible into, "code segments" needed to solve or execute a certain function, task, or problem. A programming language is generally an artificial language for expressing programs.
As used herein, a "system" or a "computer system" generally refers to one or more computers, peripheral equipment, and software that perform data processing. A "user" or "system operator" in general includes a person, that uses a computer network accessed through a "user device" (e.g., a computer, a wireless device, etc) for the purpose of data processing and information exchange. A "computer" is generally a functional unit that can perform substantial computations, including numerous arithmetic operations and logic operations without human intervention.
As used herein, "application software" or an "application program" refers generally to software or a program that is specific to the solution of an application problem. An "application problem" is generally a problem submitted by an end user and requiring information processing for its solution. As used herein, a "natural language" refers to a language whose rules are based on current usage without being specifically prescribed, e.g., English, Spanish or Chinese. As used herein, an "artificial language" refers to a language whose rules are explicitly established prior to its use, e.g., computer-programming languages such as C, C++, Java, BASIC, FORTRAN, or COBOL. As used herein, "statistical relevance" refers to using one or more of the ranking schemes (O/E ratio, strength, etc.), where a relationship is determined to be statistically relevant if it occurs significantly more frequently than would be expected by random chance.
As used herein, the terms "coordinately regulated genes" or "transcriptional modules" are used interchangeably to refer to grouped, gene expression profiles (e.g., signal values associated with a specific gene sequence) of specific genes. Each transcriptional module correlates two key pieces of data, a literature search portion and actual empirical gene expression value data obtained from a gene microarray. The set of genes that is selected into a transcriptional modules is based on the analysis of gene expression data (module extraction algorithm described above). Additional steps are taught by Chaussabel, D. & Sher, A. Mining microarray expression data by literature profiling. Genome Biol 3, RESEARCH0055 (2002), (httpV/genomebiology com/2002/3/10/research/0055) relevant portions incorporated herein by reference and expression data obtained from a disease or condition of interest, e.g., Systemic Lupus erythematosus, arthritis, lymphoma, carcinoma, melanoma, acute infection, autoimmune disorders, autoinflammatory disorders, etc.) The Table below lists examples of keywords that were used to develop the literature search portion or contribution to the transcription modules. The skilled artisan will recognize that other terms may easily be selected for other conditions, e.g., specific cancers, specific infectious disease, transplantation, etc. For example, genes and signals for those genes associated with T cell activation are described hereinbelow as Module ID "M 2 8" in which certain keywords (e g., Lymphoma, T-cell, CD4, CD8, TCR, Thymus, Lymphoid, IL2) were used to identify key T-cell associated genes, e.g., T-cell surface markers (CD5, CD6, CD7, CD26, CD28, CD96); molecules expressed by lymphoid lineage cells (lymphotoxin beta, IL2-inducible T-cell kinase, TCF7; and T-cell differentiation protein mal, GAT A3, STAT5B). Next, the complete module is developed by correlating data from a patient population for these genes (regardless of platform, presence/absence and/or up or downregulation) to generate the transcriptional module. In some cases, the gene profile does not match (at this time) any particular clustering of genes for these disease conditions and data, however, certain physiological pathways (e.g., cAMP signaling, zinc-finger proteins, cell surface markers, etc.) are found within the "Underdetermined" modules. In fact, the gene expression data set may be used to extract genes that have coordinated expression prior to matching to the keyword search, i.e., either data set may be correlated prior to cross-referencing with the second data set. Table 1. Transcriptional Modules
Figure imgf000014_0001
Figure imgf000015_0001
Figure imgf000016_0001
BIOLOGICAL DEFINITIONS
As used herein, the term "array" refers to a solid support or substrate with one or more peptides or nucleic acid probes attached to the support. Arrays typically have one or more different nucleic acid or peptide probes that are coupled to a surface of a substrate in different, known locations. These arrays, also described as "microarrays" or "gene-chips" that may have 10,000; 20,000, 30,000; or 40,000 different identifiable genes based on the known genome, e.g., the human genome. These pan-arrays are used to detect the entire "transcriptome" or transcriptional pool of genes that are expressed or found in a sample, e.g., nucleic acids that are expressed as RNA, mRNA and the like that may be subjected to RT and/or RT-PCR to made a complementary set of DNA replicons. Arrays may be produced using mechanical synthesis methods, light directed synthesis methods and the like that incorporate a combination of non-lithographic and/or photolithographic methods and solid phase synthesis methods. Various techniques for the synthesis of these nucleic acid arrays have been described, e.g., fabricated on a surface of virtually any shape or even a multiplicity of surfaces. Arrays may be peptides or nucleic acids on beads, gels, polymeric surfaces, fibers such as fiber optics, glass or any other appropriate substrate. Arrays may be packaged in such a manner as to allow for diagnostics or other manipulation of an all inclusive device, see for example, U.S. Pat. No. 6,955,788, relevant portions incorporated herein by reference. As used herein, the term "disease" refers to a physiological state of an organism with any abnormal biological state of a cell. Disease includes, but is not limited to, an interruption, cessation or disorder of cells, tissues, body functions, systems or organs that may be inherent, inherited, caused by an infection, caused by abnormal cell function, abnormal cell division and the like. A disease that leads to a "disease state" is generally detrimental to the biological system, that is, the host of the disease. With respect to the present invention, any biological state, such as an infection (e.g., viral, bacterial, fungal, helminthic, etc.), inflammation, autoinflammation, autoimmunity, anaphylaxis, allergies, premalignancy, malignancy, surgical, transplantation, physiological, and the like that is associated with a disease or disorder is considered to be a disease state. A pathological state is generally the equivalent of a disease state.
Disease states may also be categorized into different levels of disease state. As used herein, the level of a disease or disease state is an arbitrary measure reflecting the progression of a disease or disease state as well as the physiological response upon, during and after treatment. Generally, a disease or disease state will progress through levels or stages, wherein the affects of the disease become increasingly severe. The level of a disease state may be impacted by the physiological state of cells in the sample.
As used herein, the terms "therapy" or "therapeutic regimen" refer to those medical steps taken to alleviate or alter a disease state, e.g., a course of treatment intended to reduce or eliminate the affects or symptoms of a disease using pharmacological, surgical, dietary and/or other techniques. A therapeutic regimen may include a prescribed dosage of one or more drugs or surgery. Therapies will most often be beneficial and reduce the disease state but in many instances the effect of a therapy will have non-desirable or side-effects. The effect of therapy will also be impacted by the physiological state of the host, e.g., age, gender, genetics, weight, other disease conditions, etc.
As used herein, the term "pharmacological state" or "pharmacological status" refers to those samples that will be, are and/or were treated with one or more drugs, surgery and the like that may affect the pharmacological state of one or more nucleic acids in a sample, e.g., newly transcribed, stabilized and/or destabilized as a result of the pharmacological intervention. The pharmacological state of a sample relates to changes in the biological status before, during and/or after drug treatment and may serve a diagnostic or prognostic function, as taught herein. Some changes following drug treatment or surgery may be relevant to the disease state and/or may be unrelated side-effects of the therapy. Changes in the pharmacological state are the likely results of the duration of therapy, types and doses of drugs prescribed, degree of compliance with a given course of therapy, and/or un-prescribed drugs ingested.
As used herein, the term "biological state" refers to the state of the transcriptome (that is the entire collection of RNA transcripts) of the cellular sample isolated and purified for the analysis of changes in expression. The biological state reflects the physiological state of the cells in the sample by measuring the abundance and/or activity of cellular constituents, characterizing according to morphological phenotype or a combination of the methods for the detection of transcripts.
As used herein, the term "expression profile" refers to the relative abundance of RNA, DNA or protein abundances or activity levels. The expression profile can be a measurement for example of the transcriptional state or the translational state by any number of methods and using any of a number of gene- chips, gene arrays, beads, multiplex PCR, quantitiative PCR, run-on assays, Northern blot analysis, Western blot analysis, protein expression, fluorescence activated cell sorting (FACS), enzyme linked immunosorbent assays (ELISA), chemiluminescence studies, enzymatic assays, proliferation studies or any other method, apparatus and system for the determination and/or analysis of gene expression that are readily commercially available.
As used herein, the term "transcriptional state" of a sample includes the identities and relative abundances of the RNA species, especially mRNAs present in the sample. The entire transcriptional state of a sample, that is the combination of identity and abundance of RNA, is also referred to herein as the transcriptome. Generally, a substantial fraction of all the relative constituents of the entire set of RNA species in the sample are measured.
As used herein, the term "modular transcriptional vectors" refers to transcriptional expression data that reflects the "proportion of differentially expressed genes." For example, for each module the proportion of transcripts differentially expressed between at least two groups (e.g. healthy subjects vs patients). This vector is derived from the comparison of two groups of samples. The first analytical step is used for the selection of disease-specific sets of transcripts within each module. Next, there is the "expression level." The group comparison for a given disease provides the list of differentially expressed transcripts for each module. It was found that different diseases yield different subsets of modular transcripts. With this expression level it is then possible to calculate vectors for each module(s) for a single sample by averaging expression values of disease-specific subsets of genes identified as being differentially expressed. This approach permits the generation of maps of modular expression vectors for a single sample, e.g., those described in the module maps disclosed herein. These vector module maps represent an averaged expression level for each module (instead of a proportion of differentially expressed genes) that can be derived for each sample.
Using the present invention it is possible to identify and distinguish diseases not only at the module-level, but also at the gene-level; i.e., two diseases can have the same vector (identical proportion of differentially expressed transcripts, identical "polarity"), but the gene composition of the vector can still be disease- specific. Gene-level expression provides the distinct advantage of greatly increasing the resolution of the analysis. Furthermore, the present invention takes advantage of composite transcriptional markers. As used herein, the term "composite transcriptional markers" refers to the average expression values of multiple genes (subsets of modules) as compared to using individual genes as markers (and the composition of these markers can be disease-specific). The composite transcriptional markers approach is unique because the user can develop multivariate microarray scores to assess disease severity in patients with, e.g., SLE, or to derive expression vectors disclosed herein. Most importantly, it has been found that using the composite modular transcriptional markers of the present invention the results found herein are reproducible across microarray platform, thereby providing greater reliability for regulatory approval. Gene expression monitoring systems for use with the present invention may include customized gene arrays with a limited and/or basic number of genes that are specific and/or customized for the one or more target diseases. Unlike the general, pan-genome arrays that are in customary use, the present invention provides for not only the use of these general pan-arrays for retrospective gene and genome analysis without the need to use a specific platform, but more importantly, it provides for the development of customized arrays that provide an optimal gene set for analysis without the need for the thousands of other, non-relevant genes. One distinct advantage of the optimized arrays and modules of the present invention over the existing art is a reduction in the financial costs (e.g., cost per assay, materials, equipment, time, personnel, training, etc.), and more importantly, the environmental cost of manufacturing pan-arrays where the vast majority of the data is irrelevant. The modules of the present invention allow for the first time the design of simple, custom arrays that provide optimal data with the least number of probes while maximizing the signal to noise ratio. By eliminating the total number of genes for analysis, it is possible to, e.g., eliminate the need to manufacture thousands of expensive platinum masks for photolithography during the manufacture of pan-genetic chips that provide vast amounts of irrelevant data. Using the present invention it is possible to completely avoid the need for microarrays if the limited probe set(s) of the present invention are used with, e.g., digital optical chemistry arrays, ball bead arrays, beads (e.g., Luminex), multiplex PCR, quantitative PCR, run-on assays, Northern blot analysis, or even, for protein analysis, e.g., Western blot analysis, 2-D and 3-D gel protein expression, MALDI, MALDI-TOF, fluorescence activated cell sorting (FACS) (cell surface or intracellular), enzyme linked immunosorbent assays (ELISA), chemiluminescence studies, enzymatic assays, proliferation studies or any other method, apparatus and system for the determination and/or analysis of gene expression that are readily commercially available. The "molecular fingerprinting system" of the present invention may be used to facilitate and conduct a comparative analysis of expression in different cells or tissues, different subpopulations of the same cells or tissues, different physiological states of the same cells or tissue, different developmental stages of the same cells or tissue, or different cell populations of the same tissue against other diseases and/or normal cell controls. In some cases, the normal or wild-type expression data may be from samples analyzed at or about the same time or it may be expression data obtained or culled from existing gene array expression databases, e.g., public databases such as the NCBI Gene Expression Omnibus database.
As used herein, the term "differentially expressed" refers to the measurement of a cellular constituent (e.g., nucleic acid, protein, enzymatic activity and the like) that varies in two or more samples, e.g., between a disease sample and a normal sample. The cellular constituent may be on or off (present or absent), upregulated relative to a reference or downregulated relative to the reference. For use with gene-chips or gene-arrays, differential gene expression of nucleic acids, e.g., mRNA or other RNAs (miRNA, siRNA, hnRNA, rRNA, tRNA, etc.) may be used to distinguish between cell types or nucleic acids. Most commonly, the measurement of the transcriptional state of a cell is accomplished by quantitative reverse transcriptase (RT) and/or quantitative reverse transcriptase-polymerase chain reaction (RT-PCR), genomic expression analysis, post-translational analysis, modifications to genomic DNA, translocations, in situ hybridization and the like.
For some disease states it is possible to identify cellular or morphological differences, especially at early levels of the disease state. The present invention avoids the need to identify those specific mutations or one or more genes by looking at modules of genes of the cells themselves or, more importantly, of the cellular RNA expression of genes from immune effector cells that are acting within their regular physiologic context, that is, during immune activation, immune tolerance or even immune anergy. While a genetic mutation may result in a dramatic change in the expression levels of a group of genes, biological systems often compensate for changes by altering the expression of other genes. As a result of these internal compensation responses, many perturbations may have minimal effects on observable phenotypes of the system but profound effects to the composition of cellular constituents. Likewise, the actual copies of a gene transcript may not increase or decrease, however, the longevity or half-life of the transcript may be affected leading to greatly increases protein production. The present invention eliminates the need of detecting the actual message by, in one embodiment, looking at effector cells (e.g., leukocytes, lymphocytes and/or sub-populations thereof) rather than single messages and/or mutations.
The skilled artisan will appreciate readily that samples may be obtained from a variety of sources including, e.g., single cells, a collection of cells, tissue, cell culture and the like. In certain cases, it may even be possible to isolate sufficient RNA from cells found in, e.g., urine, blood, saliva, tissue or biopsy samples and the like. In certain circumstances, enough cells and/or RNA may be obtained from: mucosal secretion, feces, tears, blood plasma, peritoneal fluid, interstitial fluid, intradural, cerebrospinal fluid, sweat or other bodily fluids. The nucleic acid source, e.g., from tissue or cell sources, may include a tissue biopsy sample, one or more sorted cell populations, cell culture, cell clones, transformed cells, biopies or a single cell. The tissue source may include, e.g., brain, liver, heart, kidney, lung, spleen, retina, bone, neural, lymph node, endocrine gland, reproductive organ, blood, nerve, vascular tissue, and olfactory epithelium. The present invention includes the following basic components, which may be used alone or in combination, namely, one or more data mining algorithms; one or more module-level analytical processes; the characterization of blood leukocyte transcriptional modules; the use of aggregated modular data in multivariate analyses for the molecular diagnostic/prognostic of human diseases; and/or visualization of module-level data and results. Using the present invention it is also possible to develop and analyze composite transcriptional markers, which may be further aggregated into a single multivariate score.
An explosion in data acquisition rates has spurred the development of mining tools and algorithms for the exploitation of microarray data and biomedical knowledge. Approaches aimed at uncovering the modular organization and function of transcriptional systems constitute promising methods for the identification of robust molecular signatures of disease. Indeed, such analyses can transform the perception of large scale transcriptional studies by taking the conceptualization of microarray data past the level of individual genes or lists of genes.
The present inventors have recognized that current microarray-based research is facing significant challenges with the analysis of data that are notoriously "noisy," that is, data that is difficult to interpret and does not compare well across laboratories and platforms. A widely accepted approach for the analysis of microarray data begins with the identification of subsets of genes differentially expressed between study groups. Next, the users try subsequently to "make sense" out of resulting gene lists using pattern discovery algorithms and existing scientific knowledge.
Rather than deal with the great variability across platforms, the present inventors have developed a strategy that emphasized the selection of biologically relevant genes at an early stage of the analysis. Briefly, the method includes the identification of the transcriptional components characterizing a given biological system for which an improved data mining algorithm was developed to analyze and extract groups of coordinately expressed genes, or transcriptional modules, from large collections of data.
Pulmonary tuberculosis (PTB) is a major and increasing cause of morbidity and mortality worldwide caused by Mycobacterium tuberculosis (M. tuberculosis) . However, the majority of individuals infected with M. tuberculosis remain asymptomatic, retaining the infection in a latent form and it is thought that this latent state is maintained by an active immune response. Blood is the pipeline of the immune system, and as such is the ideal biologic material from which the health and immune status of an individual can be established. Here, using microarray technology to assess the activity of the entire genome in blood cells, we identified distinct and reciprocal blood transcriptional biomarker signatures in patients with active pulmonary tuberculosis and latent tuberculosis. These signatures were also distinct from those in control individuals. The signature of latent tuberculosis, which showed an over-representation of immune cytotoxic gene expression in whole blood, may help to determine protective immune factors against M. tuberculosis infection, since these patients are infected but most do not develop overt disease. This distinct transcriptional biomarker signature from active and latent TB patients may be also used to diagnose infection, and to monitor response to treatment with anti-mycobacterial drugs. In addition the signature in active tuberculosis patients will help to determine factors involved in immunopathogenesis and possibly lead to strategies for immune therapeutic intervention. This invention relates to a previous application that claimed the use of blood transcriptional biomarkers for the diagnosis of infections. However, this previous application did not disclose the existence of biomarkers for active and latent tuberculosis and focused rather on children with other acute infections (Ramillo, Blood, 2007).
The present identification of a transcriptional signature in blood from latent versus active TB patients can be used to test for patients with suspected Mycobacterium tuberculosis infection as well as for health screening/early detection of the disease. The invention also permits the evaluation of the response to treatment with anti-mycobacterial drugs. In this context, a test would also be particularly valuable in the context of drug trials, and particularly to assess drug treatments in Multi-Drug Resistant patients. Furthermore, the present invention may be used to obtain immediate, intermediate and long term data from the immune signature of latent tuberculosis to better define a protective immune response during vaccination trials. Also, the signature in active tuberculosis patients will help to determine factors involved in immunopathogenesis and possibly lead to strategies for immune therapeutic intervention.
Blood represents a reservoir and a migration compartment for cells of the innate and the adaptive immune systems, including either neutrophils, dendritic cells and monocytes, or B and T lymphocytes, respectively, which during infection will have been exposed to infectious agents in the tissue. For this reason whole blood from infected individuals provides an accessible source of clinically relevant material where an unbiased molecular phenotype can be obtained using gene expression microarrays as previously described for the study of cancer in tissues (Alizadeh AA., 2000; Golub, TR., 1999; Bittner, 2000), and autoimmunity (Bennet, 2003; Baechler, EC, 2003; Burczynski, ME, 2005; Chaussabel, D., 2005; Cobb, JP., 2005; Kaizer, EC, 2007; Allantaz, 2005; Allantaz, 2007), and inflammation (Thach, DC, 2005) and infectious disease (Ramillo, Blood, 2007) in blood or tissue (Bleharski, JR et al., 2003). Microarray analyses of gene expression in blood leucocytes have identified diagnostic and prognostic gene expression signatures, which have led to a better understanding of mechanisms of disease onset and responses to treatment (Bennet, L 2003; Rubins, KH., 2004; Baechler, EC, 2003; Pascual, V., 2005; Allantaz, F., 2007; Allantaz, F., 2007). These microarray approaches have been attempted for the study of active and latent TB but as yet have yielded small numbers of differentially expressed genes only (Jacobsen, M., Kaufmann, SH., 2006; Mistry, R, Lukey, PT, 2007), and in relatively small numbers of patients (Mistry, R., 2007), which may not be robust enough to distinguish between other inflammatory and infectious diseases.
To define an immune signature in TB, the blood of active and latent TB patients and controls were analyzed; patients were selected using very stringent clinical criteria. Patients were recruited from London, UK, where numbers of active TB cases are increasing, and most importantly where the risk of confounding coinfections is minimal, to yield a robust signature that may distinguish latent from active TB. Microarrays were used to analyze the whole genome and subsequent data mining revealed a large number of genes found to be differentially expressed at a statistically significant level across all groups of patients, including active and latent TB patients and healthy controls Next, a novel approach based on a modular data mining strategy was used, this approach provided a basis for the selection of clinically-relevant transcriptional biomarkers for the analysis of blood microarray transcriptional profiles in SLE and other diseases, and improved our understanding of disease pathogenesis (Chaussabel, 2008, Immunity). The module maps defined in this study provide a means to organize and reduce the dimension of complex data, whilst still retaining the large number of genes expressed in human blood, thus allowing visualization of specific disease fingerprints (Chaussabel, 2008, Immunity). Using this modular approach clearly defined modular transcriptional signatures were obtained that are distinct and reciprocal in the whole blood of active and latent TB patients, and which also differ from healthy controls. The biomarkers described herein are improve the diagnosis of PTB, and furthermore will help to define host factors important in the protection against M. tuberculosis in latent TB patients, and those involved in the immunopathogenesis of active TB, and thus be used to reduce and manage TB disease.
PATIENTS, MATERIALS AND METHODS.
Participant recruitment and Patient characterization: Participants were recruited from St. Mary's Hospital TB Clinic, Imperial College Healthcare NHS Trust, London, with healthy controls recruited from volunteers at the National Institute for Medical Research (NIMR), Mill Hill, London. The study was approved by the local NHS Research Ethics Committee at St Marys Hospital (LREC), London, UK. All participants (aged 18 and over) gave written informed consent. Strict clinical criteria were satisfied before recruited participants had their provisional study grouping confirmed and were only then allocated to the final group for analysis. The patient and control cohorts were as follows: (i) Active PTB based on clinical diagnosis subsequently confirmed by laboratory isolation of M. tuberculosis on mycobacterial culture; (ii) Latent TB - defined by a positive tuberculin skin test (TST, Using 2TU tuberculin (Serum Statens Institute, Copenhagen, Denmark) >6mm if BCG unvaccinated, >15mm if BCG vaccinated, together with a positive result using an Interferon Gamma Release Assay (IGRA, specifically the Quantiferon-TB Gold In-tube assay, Cellestis, Australia). This IGRA assay measured reactivity to antigens (ESAT-6/CFP-10/TB 7.7 - present in M. tuberculosis but not in most environmental mycobacteria or the M. bovis BCG vaccine) by IFN-γ release from whole blood. Latent TB patients also had to have evidence of exposure to infectious TB cases, either through close household or workplace contact, or as recent 'new entrants' from endemic areas; Patients with incidental findings of TST positivity without evidence of exposure to infected persons, were not eligible for inclusion in the study (iii) Healthy volunteer controls (BCG vaccinated and unvaccinated, <14 mm or < 5 mm by TST respectively; and negative by IGRA). Participants who were pregnant, known to be immunosuppressed, taking immunosuppressive therapies or have diabetes, or autoimmune disease were also ineligible and excluded from this initial study. HIV positive individuals (Only 1% of the TB patients in London present with previously undiagnosed HIV) were excluded from the study. Blood from active and latent PTB patients was collected for the study before any anti-mycobacterial drugs were administered, and then subsequently at set time intervals for the longitudinal part of the study for later study.
Detailed clinical information was collected prospectively for every participant and has been entered into a web-accessible database developed by the present inventors. Using this recorded clinical data, and immune- based assays as described above, 15 out of 58 participants were excluded from the study as they did not meet the standard criteria for the study. This resulted in cohorts of 6 BCG unvaccinated healthy volunteers; 6 BCG vaccinated healthy volunteers, 17 latent TB patients and 14 active PTB patients, all of these samples were then used for RNA isolation. One sample from an active TB patient did not yield sufficient globin reduced RNA after processing to proceed and was therefore excluded from the final analysis.
RNA sampling, extraction, processing for microarray: Whole blood from the above patient cohorts was collected into Tempus tubes (Applied Biosystems, Foster City, CA, USA) and stored between -20°C and - 800C before RNA extraction. Total RNA was isolated using the PerfectPure RNA Blood kit (5 PRIME Inc, Gaithersburg, MD, USA). Samples were homogenized with 100% cold ethanol, vortexed, then centrifuged at 400Og for 60 minutes at 00C, and the supernatant discarded. 300μl lysis solution was then added to the pellet and vortexed. RNA binding, Dnase treatment, wash and RNA elution steps were then performed according to the manufacturer's instructions. Isolated total RNA was then globin reduced using the GLOBINclear™ 96- well format kit (Ambion, Austin, TX, USA) according to the manufacturer's instructions. Total and globin- reduced RNA integrity was assessed using an Agilent 2100 Bioanalyzer (Agilent, Palo Alto, CA). One sample from an active TB patient did not yield sufficient globin reduced RNA after processing to proceed and was therefore excluded from the final analysis. Biotinylated, amplified RNA targets (cRNA) were then prepared from the globin-reduced RNA using the Illumina CustomPrep RNA amplification kit (Ambion, Austin, TX, USA). Labeled cRNA was hybridized overnight to Sentrix Human-6 V2 BeadChip array (>48,000 probes, Illumina Inc, San Diego, CA, USA), washed, blocked, stained and scanned on an Illumina BeadStation 500 following the manufacturer's protocols. Illumina's BeadStudio version 2 software was used to generate signal intensity values from the scans, substract background, and scale each microarray to the median average intensity for all samples (per-chip normalization). This normalized data was used for all subsequent data analysis.
Microarray data analysis: A gene expression analysis software program, Genespring, version 7.1.3 (Agilent), was used to perform statistical analysis and hierarchical clustering of samples. Differentially expressed genes were selected and clustered as described in Results and Figure legends.
RESULTS AND DISCUSSION.
Blood signatures distinguish active and latent TB patients from each other, and from healthy control individuals: To determine whether blood sampled from patients with active and latent TB carry gene expression signatures that allow discrimination between active and latent TB as compared to healthy controls, a step-wise analysis was conducted. After filtering out undetected transcripts and genes with a deviation from the median of less than 2 fold, i.e. with a flat profile, 6269 genes were used for unsupervised clustering analyses by Pearson correlation of the expression profiles obtained from the whole blood RNA samples from active and latent TB and healthy controls (Figure 1). This unsupervised analysis identified distinct signatures, which were found to correspond to distinct clinical phenotypes: in patients with active pulmonary TB (active PTB); and: in individuals with latent tuberculosis (latent TB). The grouping of samples was not perfect (10 of 13 patients with active TB, and 1 1 of 17 patients with latent TB). Nonetheless, the majority of active PTB and latent TB patients in this group from the training set of patients appeared to have clear and distinct transcriptional signatures. Importantly these signatures appeared to be represented across the broad number of ethnicities collected for the study, including White, Black African, Asian Indian, Asian Bangladeshi, Asian Other, White Irish, Mixed White, Black Caribbean (details of this data are not shown).
This list of 6269 genes was then further analysed using a non-parametric statistical group comparison (Kruskal-Wallis test) to identify genes that were significantly differentially expressed between groups. Using a moderately stringent multiple comparison correction for controlling Type I error (Benjamini-Hochberg correction), 1473 genes were differentially expressed/represented across the active TB and latent TB, and healthy controls (P< 0.01) (Figure 2; and listing of 1473 genes in LENGHTY TABLE, filed herewith). These clusters of genes were then correlated with relevant findings in the literature. Filtering of these genes for the ontological term "Immune response" generated a list of 158 such genes (Figures 3A-D; Table 2). This pattern of expression/representation of 158 genes (Figure 3 A - 3D) allows discrimination of the group of Active TB patients from the Latent TB patients and from the Healthy control individuals. Table 2. List of 158 genes annotated with gene ontology term biological process: immune response and found to be significantly differentially expressed (p<0.01) between active TB and other clinical groups.
Figure imgf000026_0001
Figure imgf000027_0001
Figure imgf000028_0001
Figure imgf000029_0001
Genes over-expressed/represented in active TB: Of interest is that a large number of IFN- associated/inducible genes were expressed: for example interferon (IFN)-inducible genes, e.g., SOCS l, STATl, PML (TRIM 19), TRIM22, many guanylate binding proteins, and many other IFN-inducible genes as indicated in Table 2, as expected in active TB, but interestingly these were not evident in latent TB patients, although these patients representation/expression of IFN-γ transcripts in whole blood was in fact higher than the active TB patients. To focus in on this, certain families of genes, some of which are known to be upregulated by IFNs and others not, were further studied, including the TRIM family.
A subset of TRIMS are over-expressed/represented in Active TB: The tripartite motif (TRIM) family of proteins are characterized by a discreet structure (Reymond, A., EMBO J., 2001) and have been shown to have multiple functions, including E3 ubiquitm hgases activity, induction of cellular proliferation, differentiation and apoptosis, immune cell signalling (Meroni, G., Bioessays, 2005). Their involvement has been implicated in protein-protein interactions, autoimmunity and development (Meroni, G., Bioessays, 2005). Furthermore, a number of TRIM proteins have been found to have anti-viral activity and are possibly involved in innate immunity (Nisole, F, 2005, Nat. Rev. Microbiol.; Gack, MU., 2007, Nature). Interestingly, 30 TRIM transcripts (some overlapping probes) were shown to be expressed in active TB, with some also expressed in latent TB and healthy control blood (Figure 4; Table 3). The majority of these TRIMs have been previously shown to be expressed in both human macrophages and mouse macrophages and dendritic cells (Rajsbaum, 2008, EJI; Martinez, FO., J. Imm., 2006) and regulated by IFNs, whereas TRIMs shown to be constitutively expressed in DC or in T cells (Rajsbaum, 2008, EJI) were not detected or were not found to be differentially expressed in active or latent TB versus healthy control blood. Interestingly, it was found that TRIM 5, 6, 19(PML), 21, 22, 25, 68 are overrepresented/expressed; while the others are underepreresented/expressed: TRIM 28, 32, 51, 52, 68. Of interest a group of TRIMs was highly expressed in active TB, but low to undetectable in latent TB and healthy controls, and four of these (TRIM 5, 6, 21, 22) have been show to cluster on human chromosome 11, and reported to have anti- viral activity (Song, B., 2005, J. Virol.); Li, X, Virology, 2007). A group of TRIMs however, were found to be under- expressed in the blood of active TB patients versus that of latent TB and healthy controls, including TRIM 28, 32, 51, 52 68, and these have been reported to either not be expressed in human blood-derived macrophages (TRIM 51) or only expressed in undifferentiated monocytes (TRIM-28, 52) or non-activated macrophages or alternately activated macrophages (TRIM-32), or only upregulated to a low level in activated macrophages differentiated from human blood (TRIM-68) (Martinez, FO., J. Imm., 2006).
Table 3. TRIM genes differentially expressed in active pulmonary tuberculosis, latent tuberculosis and healthy controls.
Figure imgf000030_0001
Figure imgf000031_0001
Selective over-expression/representation of specific immunomodulatory ligands in Active TB Patients: Analysis of the distinct transcriptional profiles revealed that transcripts from the genes CD274 (PDLl) and PCDLG2 (PDL2, CD273) are expressed only in the active TB patients (Figures 5A and B). These molecules have been previously shown to be involved in the regulation of the immune response to both acute and chronic viral infection (A Sharpe, Ann. Rev. Imm.). These molecules act as inhibitory co-stimulatory receptors for the molecule PD 1 in interactions between T cells and APCs, and blockade of this pathway has been shown to restore the proliferative and effector functions of antigen specific T cells in HIV, Hepatitis B and C infection.
Genes under-expressed/represented in active TB: Strikingly, a number of genes known to be expressed in T cells (some also on NK and B cells), were found to be profoundly down-regulated/under-represented in the blood of active TB patients (Figure 3D), (but not in latent TB or healthy controls, including, CD3, CTLA-4,
CD28, ZAP-70 (T, NK and B cells), IL-7R, CD2 (also on B cells), SLAM (also on NK cells), CCR7,
GATA-3 (also in NK cells). This could indicate that gene expression was down-regulated in T, NK and B cells during active PTB, or that the cells had been recruited elsewhere (e.g., the lung) as a result of infection with M. tuberculosis. This is currently under investigation using flow cytometric analysis of blood from the different patient groups, as well as by transcriptional analysis of purified populations of T cells from the different patient groups.
Higher Stringency Statistical analysis of transcriptional profiles in latent and active TB patients versus healthy controls. Statistical group comparison was further performed as before by identifying differentially expressed genes between the groups using the non-parametric Kruskal-Wallis test, but now using the most stringent multiple comparison correction for controlling Type I error (Bonferroni correction). With this increased stringency 46 genes (P<0.1) and 18 genes (P < 0.05) were identified as differentially expressed between groups (Figures 6 and 7; Tables 4 and 5). Of the 46 genes a large number of IFN-inducible genes, such as STAT-I, GBP and IRF-I were still observed to be over-expressed/represented in the blood from active TB patients, and either down-regulated or unchanged in the latent patients or healthy controls. A number of these genes were also found to be over-expressed/represented in the blood of active TB patients, even with the highest stringency analysis which still extracted genes (Bonferroni correction, P<0.05). Only 3 transcripts in active TB were still observed to be down-regulated/under-represented within the 46 gene group, including IL-7R (expressed in T cells), the chemokine receptor CXCR3 (lost at higher statistical stringency) and alpha II-spectrin. The underexpression/representation of CXCR3 is of interest since this chemokine receptor has been shown to be highly expressed in ThI cells required for protection against mycobacterial infection, which may reflect their suppression or migration out of blood to infected tissue. Table 5 includes 18 genes, with IL7R and SPTANl being underrepresented/expressed in active PTB, and all others being overrepresented/expressed and diagnostic for active disease.
Table 4. Genes significantly differentially expressed between active TB and other clinical groups.
Figure imgf000032_0001
Figure imgf000033_0001
Improved discrimination between patients with active and latent TB and healthy controls: The approaches described above although able to discriminate active TB from latent TB and healthy controls are less able to discriminate between all three clinical groups. To select discriminating genes the following approach was used. First, genes expressed in blood from healthy individuals were compared versus latent TB patients, using the Wilcoxon-Mann- Whitney test at a p<0.005, which yielded 89 discriminatory genes. Genes expressed in blood from healthy individuals versus active TB patients were then compared, again using the Wilcoxon-Mann- Whitney test but with a p<0.5, and the most stringent Bonferroni correction factor, which yielded a list of 30 discriminatory genes. This list was combined to give a total list of 1 19 discriminating genes (Table 6). This list of genes was then used to interrogate the dataset of all clinical groups using unsupervised clustering analysis by Pearson correlation. This analysis generated three distinct clusters of clinical groups (Figures 8A to 8F): one cluster is composed of 11 out of 13 of the active TB patients (Figure 8, Cluster C); a second cluster is composed of 16 out of 17 latent TB patients, and 1 active TB patient (Figure 8, Cluster B); a third cluster contains all 12 healthy controls included in the study, plus 1 active TB and 1 latent TB outlier (Figure 8, Cluster A). For each of Figures 8A to 8F, clusters of patients/clinical groups are presented horizontally and clusters of genes are presented vertically. This pattern of expression/representation of the whole list of 1 19 genes (Figure 8A) now allows discrimination of all three clinical groups from each other: i.e., allows discrimination of Active TB, Latent TB and Healthy individuals from each other, each clinical group exhibiting a unique pattern of expression/representation of these 1 19 genes or subgroups thereof. The skilled artisan will recognize that 1, 2, 3, 4, 5, 6, 7, 8, 10, 12, 15, 20, 25, 30, 35 or more genes may be placed in a dataset that represents a cluster of genes that may be compared across clusters of clinical groups A (Healthy), B (Latent), C (Active), and that either alone or in combination with other such clusters, each clinical group can exhibit a unique pattern of expression/representation obtained from these 119 genes.
Specifically, Figure 8B demonstrates that the genes ST3GAL6, PAD14, TNFRSF12A, VAMP3, BR13, RGS19, PILRA, NCFl, LOC652616, PLAUR(CD87), SIGLEC5, B3GALT7, IB RD C 3 (NKLAM), ALOX5 AP(FLAP), MMP9, ANPEP(APN), NALP 12, CSF2RA, ILoR(CD 126), RASGRP4, TNFSF 14(CD258), NCF4, HK2, ARID3A, PGLYRPl(PGRP) are underexpressed/underrepresented in the blood of Latent TB patients but not in the blood of Healthy individuals or of Active TB patients.
The genes presented in Figure 8C, ABCGl, SREBFl, RBP7(CRBP4), C22orf5, FAMlOlB, SlOOP, LOC649377, UBTDl, PSTPIP-I, RENBP, PGM2, SULF2, FAM7A1, HOM-TES-103, NDUFAFl, CES l, CYP27A1, FLJ33641, GPR177, MID IIP 1(MIG- 12), PSD4, SF3A1, NOV(CCN3), SGK(SGKl), CDK5R1, LOC642035, are shown to be overexpressed/overrepresented in the blood of Healthy control individuals but were underexpressed/underrepresented in the blood of Latent TB patients, and to a great extent were underexpressed/underrepresented in the blood of Active TB patients.
The pattern of genes in Figure 8D, ARSG, LOC284757, MDM4, CRNKLl, IL8, LOC389541, CD300LB, NIN, PHKG2, HIP 1 , were shown to be overexpressed/overrepresented in the blood of Healthy individuals but were underexpressed/underrepresented in the blood of both Latent and Active TB patients. Conversely, the genes in Figure 8D, PSMB8(LMP7), APOL6, GBP2, GBP5, GBP4, ATF3, GCHl, VAMP5, WARS,
LIMKl, NPC2, IL-15, LMTK2, STX1 1(FHL4), were shown to be overexpressed/overrepresented in the blood of Active TB, but underexpressed/underrepresented in the blood of Latent TB patients and Healthy control individuals.
The pattern of genes in Figure 8E, of FLJl 1259(DRAM), JAK2, GSDMDCl (DF 5 L) (FKSG 10), SIPAILl, [268040O](KIAAl 632), ACTA2(ACTSA), KCNMBl (SLO-BETA), were all overexpressed/overrepresented in blood from Active TB patients but not represented or even underexpressed/underrepresented in the blood from Latent TB patients and Healthy control individuals. Conversely, the genes SPTANI, KIAAD179(Nnpl)(RRPl), FAM84B(NSE2), SELM, IL27RA, MRPS34, [6940246] (IL23 A), PRKCA(PKCA), CCDC41, CD52(CDW52), [3890241](ZN404), MCCCl(MCCAyB), SOX8, SYNJ2, FLJ21127, FHIT, were underexpressed/underrepresented in the blood of Active TB patients but not in the blood of Latent TB patients or Healthy Control individuals, where they were overexpressed/overrepresented. Many of the genes (within these 119 genes selected by this method described above) found to be overexpressed/overrepresented in the blood of Active TB patients listed in Figures 8D and 8E, were common to those identified by the alternative method using Higher Stringency Analysis of transcriptional profiles in active, latent TB patients and healthy controls described earlier (genes shown as underlined above from Figures 8D and 8E are contained in list of genes in Figure 7, Table 5, 18 genes p<0.05; genes shown as italicised above from Figures 8D and 8E are contained in list of genes in Figure 6, Table 4, 46 genes P<0.1).
The pattern of genes shown in Figure 8F, CD52(CDW52), [3890241](ZNF404), MCCC1(MCCA/B), SOX8, SYNJ2, FLJ21127, FHIT, were underexpressed/underrepresented m the blood of Active TB patients but not in the blood of Latent TB patients or Healthy Control individuals, where they were if anything overexpressed/overrepresented. This is also presented (overlap) in Figure 8E. Genes CDKLl(p42), MICALCL, MBNL3, RHD, ST7(RAY1), PPR3R1, [360739](PIP5K2A), AMFR, FLJ22471, CRAT(CATl), PLA2G4C, ACOT7(ACT)(ACH1), RNF 182, KLRC3(NKG2E), HLA-DPB l, were underexpressed/underrepresented in the blood of Healthy Control individuals, but were overexpressed/overrepresented in the blood of the Latent TB patients, and overexpressed/overrepresented in the blood of most Active TB patients (Figure 8F) To conclude, the aggregate pattern of expression of the total of 1 19 genes in Figure 8A (broken down for legibility of genes and specificity between clinical states in Figures 8B - 8F) that distinguishes between infected (Active TB and Latent TB) patients from non-infected patients (Healthy Controls) and additionally, distinguishes between the two groups of infected patients, that is Active and Latent TB patients. Many of the genes overexpressed in the blood of active TB patients via this method were the same genes as those identified using the strictest statistical filtering (shown in Figure 7, Table 6), and many were IFN-inducible and/or involved in endocytic cellular traffic and/or lipid metabolism.
Table 6. Genes found to be significantly differentially expressed between latent and healthy or between active and healthy, which when used in combination differentiate between active, healthy and latent using unsupervised pearson correlation clustering algorithms (119 genes).
Figure imgf000035_0001
Figure imgf000036_0001
Figure imgf000037_0001
Figure imgf000038_0001
Different and reciprocal immune signatures in active and latent TB are revealed using a modular approach. To yield further information on pathogenesis, the normalised per chip data was then further analyzed using a recently described stable modular analysis framework based on pre-defined clusters of genes transcripts shown to be coordinately expressed across a wide range of diseases, and often representing a cluster of molecules or cells related at a function level (Chaussabel et al., 2008, Immunity).
As the aim of this analysis was to yield functional information about genes contained within the transcriptional signatures for each group, the analysis was focused on subsets of patients found to cluster tightly together in our previous analyses, excluding outliers, reasoning that such groups would be more likely to reveal common pathways and processes involved in the disease process. Nine patients with active TB, six healthy controls and nine patients with latent TB were selected and used in the modular analysis. Each comparison was performed separately, thus nine active TB patients were compared with six healthy controls in one analysis, and then nine latent TB patients were compared with the same six healthy controls in a separate analysis. Transcripts were filtered to exclude any not detected in at least two individuals from either group being compared. Statistical comparisons between patient and healthy control groups were then performed (Non parametric Wilcoxon-Mann- Whitney test, P < 0.05), in order to identify genes that were differentially expressed between the patient group and healthy controls. These differentially expressed genes were then separated into those upregulated / overrepresented in disease group compared with control, and those down-regulated/underrepresented in disease group compared with control. These lists are then analysed on a module by module basis. Differentially expressed genes are either predominantly over-expressed or predominantly under-expressed in each module. To ensure validity each module must have >25% of the total genes change in the direction represented and the number of genes changing in a particular direction must be >10. To graphically present the global transcriptional changes, in active TB versus healthy control, or latent TB versus healthy controls, spots are aligned on a grid, with each position corresponding to a different module based on their original definition Spot intensity indicates proportion of differentially expressed transcripts changing in the direction shown out of the total number of transcripts detected for that module, while spot color indicates the polarity of the change (red: overexpressed/represented, blue: underexpressed/represented). In addition, modules' coordinates can be associated to functional annotations to facilitate data interpretation (Chaussabel, Immunity, 2008; and Figures 9 and 10).
A modular map of active TB compared to healthy control (Figure 9, Table 7A - P; and Table 8) was shown to be distinct to the map of latent TB as compared to healthy controls (Figure 10, Table 7A - F; and Table 9). In fact these independently derived module maps from active TB and latent TB show an inverse pattern of gene expression/representation, in modules which show changes in both disease states when compared with healthy controls. Genes in module M2.1 associated with cytotoxic cells were underexpressed/represented (36% - 18 genes underexpressed/represented out of 50 detected in the module, genes listed in Table 6F) in active TB and yet overexpressed/represented (43% - 22 genes overexpressed/represented out of 51 detected in the module, genes listed in Table 7B) in latent TB. On the other hand, a number of genes in M3.2 and M3.3 ("inflammation") (genes listed in Tables 6 J and 6K) were overexpressed/represented in active TB patients but underexpressed/represented in latent TB patients (genes listed in Table 7E and 7F). Likewise genes in Ml.5 ("myeloid lineage") were overexpressed/represented in active TB (genes listed in Table 6D) whereas they were underexpressed/represented in latent TB (genes listed in Table 7A). Genes in a module M2.10, which did not form a coherent functional module but consisted of an apparently diverse set of genes, were underexpressed/represented in latent TB (genes listed in Table 7D) but not over or underexpressed/represented in active TB as compared to controls. One of these genes is the toll-like receptor adaptor, TRAM, which is downstream of TLR-4 (LPS) and TLR-3 (dsRNA) signalling (Akira, Nat. Rev. Imm.).
For Tables 7A to 70, relative normalized expression for active TB is given as expression in active patients relative to control. In Tables 8A to 8F, relative normalized expression for latent TB is given as expression in healthy controls relative to latent patients.
Table 7A Ml 2 PTB v Control, Genes Overrepresented in Active TB.
Figure imgf000039_0001
Figure imgf000040_0001
Table 7B Ml .3 PTB v. Control, Genes Underrepresented in Active TB.
Figure imgf000040_0002
Figure imgf000041_0001
Table 7C Ml.4 PTB v. Control, Genes Underrepresented in Active TB.
Figure imgf000041_0002
Table 7D Ml .5 PTB v. Control, Genes Overrepresented in Active TB.
Figure imgf000042_0001
Figure imgf000043_0001
Figure imgf000044_0001
Figure imgf000045_0001
Table 7G M2.4 PTB v. Control, Genes Underrepresented in Active TB.
Figure imgf000045_0002
Figure imgf000046_0001
Table 7H M2.8 PTB v. Control, Genes Underrepresented in Active TB.
Figure imgf000046_0002
Figure imgf000047_0001
Figure imgf000048_0001
Table 71 M3.1 PTB v. Control, Genes Overrepresented in Active TB.
Figure imgf000049_0001
Figure imgf000050_0001
Figure imgf000051_0001
Figure imgf000052_0001
Table 7K M3.3 PTB v. Control, Genes Overrepresented in Active TB.
Figure imgf000052_0002
Figure imgf000053_0001
Figure imgf000054_0001
Table 7L M3.4 PTB v. Control, Genes Underrepresented in Active TB
Figure imgf000054_0002
Figure imgf000055_0001
Figure imgf000056_0001
Table 7M M3.6 PTB v. Control, Genes Underrepresented in Active TB.
Figure imgf000057_0001
Figure imgf000058_0001
Table 7N M3.7 PTB v. Control, Genes Underrepresented in Active TB.
Figure imgf000058_0002
Figure imgf000059_0001
Figure imgf000060_0001
Figure imgf000061_0001
Figure imgf000062_0001
Table 7P M3.9 PTB v. Control, Genes Underrepresented in Active TB.
Figure imgf000062_0002
Figure imgf000063_0001
Figure imgf000064_0001
Figure imgf000065_0001
Table 8A M 1.5 LTB v. Control, Genes Underrepresented in Latent TB.
Figure imgf000065_0002
Figure imgf000066_0001
Figure imgf000067_0001
Table 8C M2.6 LTB v. Control, Genes Underrepresented in Latent TB.
Figure imgf000067_0002
Figure imgf000068_0001
Figure imgf000069_0001
Table 8D M2.10 LTB v. Control, Genes Underrepresented in Latent TB.
Figure imgf000069_0002
Figure imgf000070_0001
Table 8E M3.2 LTB v. Control, Genes Underrepresented in Latent TB.
Figure imgf000070_0002
Figure imgf000071_0001
Figure imgf000072_0001
Table 8F M3.3 LTB v. Control, Genes Underrepresented in Latent TB.
Figure imgf000072_0002
Figure imgf000073_0001
Figure imgf000074_0001
Figure imgf000075_0001
The active TB group showed 5281 genes to be differentially expressed as compared to healthy controls, as compared to the latent group, which showed only differential expression of 3137 genes as compared to controls, possibly reflective of a more subdued, although clearly active immune response as shown by overexpression/representation of genes in the cytotoxic module. As an explanation, and not a limitation of the present invention, these results probably explain the observation that changes in additional modules were seen in active TB patients as compared to controls, but not in latent TB as compared to controls. These included overexpressed/represented genes in M 1.2 (platelets, genes listed in Table 7A), and underexpressed/represented genes in Ml .3 (B cells, genes listed in Table 7B), and M2.8 (T cells, genes listed in Table 7H), the latter perhaps being expected since in the T cells response to M. tuberculosis infection, it is possible that T cells are recruited to the site of infection and/or are suppressed during chronic infection. Genes in module M2 4, under-expressed/represented (genes listed in Table 7G) included transcripts encoding ribosomal protein family members whose expression is altered in acute infection and sepsis (Calvano, 2005; Thach, 2005), and genes in this module have also been shown to be underexpressed in SLE, liver transplant patients and those infected with Streptococcus (S). pneumoniae (Chaussabel, Immunity, 2005). The largest set of overexpressed genes (66 genes out of 90 detected, Table 71) in active TB was observed in module, M3.1, (IFN-inducible), and is in keeping with a role of IFN-γ in protection, however genes in this module were not differentially expressed in latent TB patients, who control the infection, as compared to controls In active TB genes were underexpressed in a number of modules (M3.4, M3.6, M3.7, M3.8 and M3.9, genes listed in Tables 7L - 7P) containing genes, which did not present a coherent functional module but consisted of an apparently diverse set of genes, and had also been observed to be underexpressed in liver transplant recipients (Chaussabel., 2008, Immunity). Based on transcriptional analysis of whole blood and using this modular map approach active TB patients could be distinguished from latent TB patients. Furthermore, comparison of the modular map obtained for active TB in this study with other modular maps created for different diseases, it is clear that active TB patients have a distinct global transcriptional profile (Figure 9), than observed in patients with SLE, transplant, melanoma or S. pneumoniae patients (Chaussabel, 2008, Immunity). Certain modules may be common to a number of diseases such as M2.4, included transcripts encoding ribosomal protein family members, which is underexpressed in active TB, SLE, liver transplant patients and those infected with S. pneumoniae. However, genes in other modules are less widely affected, such as M3.1 (IFN-inducible), which although overexpressed in active TB (Figure 9) and SLE (Chaussabel, 2008, Immunity), but not other diseases, particularly S. pneumoniae, which shows no differential gene expression in M3.1 as compared to controls Transcriptional profiles in SLE differ from active TB with respect to over or underexpession of genes in a number of other modules. Likewise, although overexpression of genes in modules M3 2 and M3.3 ("inflammatory"), Ml 2 (platelets) and Ml .5 ("myeloid"), and underexpression of genes in M3.4, 5, 6, 7, 8 and 9 (non-fiinctionally coherent modules) is observed in active TB and S. pneumoniae these diseases can still be distinguished by this method since genes in modules M2.2 (neutrophils), M2.3 (erythrocytes), M3.5 (non-functionally coherent module) are overexpressed in S. pneumoniae as compared to controls but not differentially affected in active TB. Thus by retaining the complexity and magnitude of the data, yet organizing and reducing the dimension of the complex data, it is possible to distinguish different infectious and inflammatory diseases by transcriptional profiles of blood (Chaussabel, 2008, Immunity).
The present invention identifies a discreet differential and reciprocal dataset of transcriptional signatures in the blood of latent and active TB patients. Specifically, active TB patients showed an over- expression/representation of genes in functional IFN-inducible, inflammatory and myeloid modules, which on the other hand were down-regulated/under-represented in latent TB. Active TB patients showed and increased expression/over-representation of immunomodulatory genes PDL-I and PDL-2, which may contribute to the immunopathogenesis in TB. Blood from latent TB patients showed an over- expression/representation of genes within a cytotoxic module, which may contribute to the protective response that contains the infection with M. tuberculosis in these patients and could provide biomarkers for testing efficacy of vaccinations in clinical trials. We believe the success of our preliminary study is achieved by the strict clinical criteria we have employed, accompanying immune reactivity studies to support attribution of latency, improved quality of RNA collection and isolation, advanced high throughput whole genome microarray platform, and sophisticated data mining tools to retain the magnitude of the gene expression but with an accessible format (Chaussabel et al., submitted). Such findings will be of value as diagnostics of latent and active TB, may yield insights into the potential mechanisms of immune protection (Latent TB) versus immune pathogenesis (Active TB), underlying these transcriptional differences, and the design of novel therapies for protection or in the design of immune therapeutics in active TB to achieve more rapid cure with anti-mycobacterial drugs.
It is contemplated that any embodiment discussed in this specification can be implemented with respect to any method, kit, reagent, or composition of the invention, and vice versa. Furthermore, compositions of the invention can be used to achieve methods of the invention.
It will be understood that particular embodiments described herein are shown by way of illustration and not as limitations of the invention. The principal features of this invention can be employed in various embodiments without departing from the scope of the invention. Those skilled in the art will recognize, or be able to ascertain using no more than routine experimentation, numerous equivalents to the specific procedures described herein. Such equivalents are considered to be within the scope of this invention and are covered by the claims. All publications and patent applications mentioned in the specification are indicative of the level of skill of those skilled in the art to which this invention pertains. All publications and patent applications are herein incorporated by reference to the same extent as if each individual publication or patent application was specifically and individually indicated to be incorporated by reference.
The use of the word "a" or "an" when used in conjunction with the term "comprising" in the claims and/or the specification may mean "one," but it is also consistent with the meaning of "one or more," "at least one," and "one or more than one." The use of the term "or" in the claims is used to mean "and/or" unless explicitly indicated to refer to alternatives only or the alternatives are mutually exclusive, although the disclosure supports a definition that refers to only alternatives and "and/or." Throughout this application, the term
"about" is used to indicate that a value includes the inherent variation of error for the device, the method being employed to determine the value, or the variation that exists among the study subjects.
As used in this specification and claim(s), the words "comprising" (and any form of comprising, such as "comprise" and "comprises"), "having" (and any form of having, such as "have" and "has"), "including" (and any form of including, such as "includes" and "include") or "containing" (and any form of containing, such as "contains" and "contain") are inclusive or open-ended and do not exclude additional, unrecited elements or method steps.
The term "or combinations thereof as used herein refers to all permutations and combinations of the listed items preceding the term. For example, "A, B, C, or combinations thereof is intended to include at least one of: A, B, C, AB, AC, BC, or ABC, and if order is important in a particular context, also BA, CA, CB, CBA, BCA, ACB, BAC, or CAB. Continuing with this example, expressly included are combinations that contain repeats of one or more item or term, such as BB, AAA, MB, BBC, AAABCCCC, CBBAAA, CABABB, and so forth. The skilled artisan will understand that typically there is no limit on the number of items or terms in any combination, unless otherwise apparent from the context.
All of the compositions and/or methods disclosed and claimed herein can be made and executed without undue experimentation in light of the present disclosure. While the compositions and methods of this invention have been described in terms of preferred embodiments, it will be apparent to those of skill in the art that variations may be applied to the compositions and/or methods and in the steps or in the sequence of steps of the method described herein without departing from the concept, spirit and scope of the invention.
All such similar substitutes and modifications apparent to those skilled in the art are deemed to be within the spirit, scope and concept of the invention as defined by the appended claims.
REFERENCES
Alizadeh, A. A., Eisen, M. B., Davis, R. E., Ma, C, Lossos, I. S., Rosenwald, A., Boldrick, J. C, Sabet, H., Tran, T., Yu, X., et al. (2000). Distinct types of diffuse large Bcell lymphoma identified by gene expression profiling. Nature 403, 503-51 1. Allantaz, F., Chaussabel, D., Stichweh, D., Bennett, L., Allman, W., Mejias, A., Ardura, M., Chung, W., Wise, C, Palucka, K., et al. (2007). Blood leukocyte microarrays to diagnose systemic onset juvenile idiopathic arthritis and follow the response to IL- 1 blockade. J Exp Med 204, 2131-2144.
Allantaz F, Chaussabel D, Banchereau J, Pascual V (2007) Microarray-based identification of novel biomarkers in IL- 1 -mediated diseases. Curr Opin Immunol 19: 623-632. Baechler, E. C, Batliwalla, F. M., Karypis, G., Gaffhey, P. M., Ortmann, W. A., Espe, K. J., Shark, K. B., Grande, W. J., Hughes, K. M., Kapur, V., et al. (2003). Interferon inducible gene expression signature in peripheral blood cells of patients with severe lupus. Proc Natl Acad Sci U S A 100, 2610-2615.
Bennett, L., Palucka, A. K., Arce, E., Cantrell, V., Borvak, J., Banchereau, J., and Pascual, V. (2003). Interferon and granulopoiesis signatures in systemic lupus erythematosus blood. J Exp Med 197, 711-723. Bittner, M., Meltzer, P., Chen, Y., Jiang, Y., Seftor, E., Hendrix, M., Radmacher, M., Simon, R., Yakhini, Z., Ben-Dor, A., et al. (2000). Molecular classification of cutaneous malignant melanoma by gene expression profiling. Nature 406, 536-540.
Bleharski, J.R., H. Li, C. Meinken, T.G. Graeber, M.T. Ochoa, M. Yamamura, A. Burdick, E.N. Sarno, M. Wagner, M. Rollinghoff, T.H. Rea, M. Colonna, S. Stenger, B.R. Bloom, D. Eisenberg, and R.L. Modlin. Use of genetic profiling in leprosy to discriminate clinical forms of the disease. Science (New York, N. Y 2003.301 : 1527-1530. Burczynski, M. E., Twine, N. C, Dukart, G., Marshall, B., Hidalgo, M., Stadler, W. M., Logan, T., Dutcher, J., Hudes, G., Trepicchio, W. L., et al. (2005). Transcriptional profiles in peripheral blood mononuclear cells prognostic of clinical outcomes in patients with advanced renal cell carcinoma. Clin Cancer Res 11, 1181- 1 189. Casanova, J.L., and L. Abel. Genetic dissection of immunity to mycobacteria: the human model. Annual review of immunology 2002.20:581-620.
Chaussabel, D., Allman, W., Mejias, A., Chung, W., Bennett, L., Ramilo, O., Pascual, V., Palucka, A. K., and Banchereau, J. (2005). Analysis of significance patterns identifies ubiquitous and disease-specific gene- expression signatures in patient peripheral blood leukocytes. Ann N Y Acad Sci 1062, 146-154. Chaussabel, C, Quinn, C, Shen, J., Patel, P, Glaser, C, Baldwin, N., Stichweh, D., Blankenship, D., Li, L., Munagala, L, Bennett, L., Allantaz, F., Mejias, A., Ardura, M., Kaizer, E., Monnet, L., Allman, W., Randall, H., Johnson, D., Lanier, A., Punar, M., Wittkowski, K. M., White, P., Fay, J., Klintmalm, G., Ramilo, O., Palucka, A. K., Banchereau, J., and Pascual, V. (2008). A Modular Framework for Biomarker and Knowledge Discovery from Blood Transcriptional Profiling Studies: Application to Systemic Lupus Erythematosus. Immunity. In press.
Cobb, J. P., Mindrinos, M. N., Miller-Graziano, C, Calvano, S. E., Baker, H. V., Xiao, W., Laudanski, K., Brownstein, B. H., Elson, C. M., Hayden, D. L., et al. (2005). Application of genome -wide expression analysis to human health and disease. Proc Natl Acad Sci U S A 102, 4801-4806.
Gack, M.U., Y.C. Shin, CH. Joo, T. Urano, C. Liang, L. Sun, O. Takeuchi, S. Akira, Z. Chen, S. Inoue, and J.U. Jung. TRIM25 RING-finger E3 ubiquitin ligase is essential for RIG-I-mediated antiviral activity. Nature 2007.446:916-920.
Greenwald, R.J., Y. E. Latchman, and A.H. Sharpe. Negative co-receptors on lymphocytes. Current opinion in immunology 2002.14:391-396.
Golub, T. R., Slonim, D. K., Tamayo, P., Huard, C, Gaasenbeek, M., Mesirov, J. P., Coller, H., Loh, M. L., Downing, J. R., Caligiuri, M. A., et al. (1999). Molecular classification of cancer: class discovery and class prediction by gene expression monitoring. Science 286, 531-537.
Jacobsen, M., J. Mattow, D. Repsilber, and S.H. Kaufmann. Novel strategies to identify biomarkers in tuberculosis. Biological chemistry 2008.
Jacobsen, M., D. Repsilber, A. Gutschmidt, A. Neher, K. Feldmann, HJ. Mollenkopf, A. Ziegler, and S.H. Kaufmann. Candidate biomarkers for discrimination between infection and disease caused by Mycobacterium tuberculosis. Journal of molecular medicine (Berlin, Germany) 2007.85:613-621. Kaizer, E. C, Glaser, C. L., Chaussabel, D., Banchereau, J., Pascual, V., and White, P. C. (2007). Gene expression in peripheral blood mononuclear cells from children with diabetes. J Clin Endocrinol Metab 92, 3705-3711.
Kaufmann, S. H., and AJ. McMichael. Annulling a dangerous liaison: vaccination strategies against AIDS and tuberculosis. Nature medicine 2005.1 1 :S33-44.
Keane, J. TNF-blocking agents and tuberculosis: new drugs illuminate an old topic. Rheumatology (Oxford, England) 2005.44:714-720.
Li, X., B. Gold, C. O'Huigin, F. Diaz-Griffero, B. Song, Z. Si, Y. Li, W. Yuan, M. Stremlau, C. Mische, H. Javanbakht, M. Scally, C. Winkler, M. Dean, and J. Sodroski. Unique features of TRIM5alpha among closely related human TRIM family members. Virology 2007.360:419-433.
Martinez, F.O., S. Gordon, M. Locati, and A. Mantovani. Transcriptional profiling of the human monocyte- to-macrophage differentiation and polarization: new molecules and patterns of gene expression. J Immunol
2006.177:7303-7311.
Meroni, G., and G. Diez-Roux. TRIM/RBCC, a novel class of 'single protein RING finger' E3 ubiquitin ligases. Bioessays 2005.27: 1 147-1157.
Mistry, R., J.M. Cliff, CL. Clayton, N. Beyers, Y.S. Mohamed, P.A. Wilson, H.M. Dockrell, D.M. Wallace, P.D. van Helden, K. Duncan, and P.T. Lukey. Gene-expression patterns in whole blood identify subjects at risk for recurrent tuberculosis. The Journal of infectious diseases 2007.195:357-365.
Nisole, S., J.P. Stoye, and A. Saib. TRIM family proteins: retroviral restriction and antiviral defence. Nat Rev Microbiol 2005.3:799-^
Pascual V, Allantaz F, Arce E, Punaro M, Banchereau J (2005) Role of interleukin-1 (IL-I) in the pathogenesis of systemic onset juvenile idiopathic arthritis and clinical response to IL-I blockade. J Exp Med 201 : 1479-1486.
Rajsbaum, R., J.P. Stoye, and A. O'Garra. Type I interferon- dependent and -independent expression of tripartite motif proteins in immune cells. European journal of immunology 2008.38:619-630.
Ramilo, O., Allman, W., Chung, W., Mejias, A., Ardura, M., Glaser, C, Wittkowski, K. M., Piqueras, B., Banchereau, J., Palucka, A. K., and Chaussabel, D. (2007). Gene expression patterns in blood leukocytes discriminate patients with acute infections. Blood 109, 2066-2077.
Reljic, R. IFN-gamma therapy of tuberculosis and related infections. J Interferon Cytokine Res 2007.27:353- 364. Reymond, A., G. Meroni, A. Fantozzi, G. Merla, S. Cairo, L. Luzi, D. Riganelli, E. Zanaria, S. Messali, S. Cainarca, A. Guffanti, S. Minucci, P. G. Pelicci, and A. Ballabio. The tripartite motif family identifies cell compartments. Embo J 2001.20:2140-2151.
Rubins, K.H., L.E. Hensley, P.B. Jahrling, A.R. Whitney, T.W. Geisbert, J.W. Huggins, A. Owen, J.W. Leduc, P.O. Brown, and D.A. Relman. The host response to smallpox: analysis of the gene expression program in peripheral blood cells in a nonhuman primate model. Proceedings of the National Academy of Sciences of the United States of America 2004.101 : 15190-15195.
Song, B., B. Gold, C. O'Huigin, H. Javanbakht, X. Li, M. Stremlau, C. Winkler, M. Dean, and J. Sodroski. The B30.2(SPRY) domain of the retroviral restriction factor TRIM5alpha exhibits lineage-specific length and sequence variation in primates. J Virol 2005.79:61 11-6121.
Thach, D. C, Agan, B. K., Olsen, C, Diao, J., Lin, B., Gomez, J., Jesse, M., Jenkins, M., Rowley, R., Hanson, E., et al. (2005). Surveillance of transcriptomes in basic military trainees with normal, febrile respiratory illness, and convalescent phenotypes. Genes Immun. 6(7): 588-95.

Claims

What is claimed is:
1. A method for distinguishing between active and latent Mycobacterium tuberculosis infection in a patient suspected of being infected with Mycobacterium tuberculosis, the method comprising: obtaining a gene expression dataset from a whole blood sample from the patient; determining the differential expression of one or more transcriptional gene expression modules that distinguish between infected patients and non-infected individuals, wherein the dataset demonstrates an aggregate change in the levels of polynucleotides in the one or more transcriptional gene expression modules as compared to matched non-infected individuals, and distinguishing between active and latent Mycobacterium tuberculosis (TB) infection based on the one or more transcriptional gene expression modules that differentiate between active and latent infection.
2. The method of claim 1, further comprising the step of using the determined comparative gene product information to formulate a diagnosis.
3. The method of claim 1, further comprising the step of using the determined comparative gene product information to formulate a prognosis.
4. The method of claim 1, further comprising the step of using the determined comparative gene product information to formulate a treatment plan.
5. The method of claim 1, further comprising the step of distinguishing patients with latent TB from active TB patients.
6. The method of claim 1, wherein the module comprises a dataset of the genes in modules M1.2, Ml .3, M1.4, M1.5, Ml .8, M2.1, M2.4, M2.8, M3.1, M3.2, M3.3, M3.4, M3.6, M3.7, M3.8 or M3.9 to detect active pulmonary infection.
7. The method of claim 1, wherein the module comprises a dataset of the genes in modules Ml .5, M2.1, M2.6, M2.10, M3.2 or M3.3 to detect a latent infection.
8. The method of claim 1, wherein the following genes are down- regulated in active pulmonary infection CD3, CTLA-4, CD28, ZAP-70, IL-7R, CD2, SLAM, CCR7 and GATA-3.
9. The method of claim 1, wherein the expression profile of Figure 9 is indicative of active pulmonary infection.
10. The method of claim 1, wherein the expression profile of Figure 10 is indicative of latent infection.
1 1. The method of claim 1, wherein the underexpression of genes in modules M3.4, M3.6, M3.7, M3.8 and M3.9 is indicative of active infection.
12 The method of claim 1, wherein the overexpression of genes m modules M3 1 is indicative of active infection
13 The method of claim 1, further comprising the step of distinguishing TB infection from other bacteπal infections by determining the gene expression in modules M2 2, M2 3 and M3 5, which are overexpressed by the peripheral blood mononuclear cells or whole blood m infection other than
Mycobacterium
14 The method of claim 1, further comprising the step of distinguishing the differential and reciprocal transcriptional signatures m the blood of latent and active TB patients using two or more of the following modules Ml 3, Ml 4, Ml 5, Ml 8, M2 1, M2 4, M2 8, M3 1, M3 2, M3 3, M3 4, M3 6, M3 7, M3 8 or M3 9 for active pulmonary infection and modules Ml 5, M2 1, M2 6, M2 10, M3 2 or M3 3 for a latent infection
15 The method of claim 1 , wherein the genes that are upregulated m active pulmonary TB infection versus a healthy patient are selected from Tables 7 A, 7D, 71, 7J and 7K
16 The method of claim 1, wherein the genes that are downregulated in active pulmonary TB infection versus a healthy patient are selected from Tables 7B, 1C, 7E, IV, IG, IU, IL, IM, 7N, 70 and 7P 17 The method of claim 1, wherein the genes that are upregulated in latent TB infection versus a healthy patient are selected from Table 8B
18 The method of claim 1 , wherein the genes that are downregulated m latent TB infection versus a healthy patient are selected from Tables 8A, 8C, 8D, 8E and 8F
19 A method for distinguishing between active and latent Mycobacterium tuberculosis infection in a patient suspected of being infected with Mycobacterium tuberculosis, the method comprising obtaining a first gene expression dataset obtained from a first clinical group with active Mycobacterium tuberculosis infection, a second gene expression dataset obtained from a second clinical group with a latent Mycobacterium tuberculosis infection patient and a third gene expression dataset obtained from a clinical group of non infected individuals, generating a gene cluster dataset comprising the differential expression of genes between any two of the first, second and third datasets, and determining a unique pattern of expression/representation that is indicative of latent infection, active infection or being healthy
20 The method of claim 19, wherein each clinical group is separated into a unique pattern of expression/representation for each of the 119 genes of Table 6
21. The method of claim 19, wherein values for the first and third datasets are compared and the values for the dataset from the third dataset are subtracted therefrom.
22. The method of claim 19, wherein values for the second and third datasets are compared and the values for the dataset from the third dataset are subtracted therefrom.
23. The method of claim 19, further comprising the step of comparing values for two different datasets and subtracting the values for the remaining dataset to distinguish between a patient with a latent infection, a patient with an active infection and a non-infected individual.
24. The method of claim 19, further comprising the step of using the determined comparative gene product information to formulate a diagnosis or a prognosis.
25. The method of claim 19, further comprising the step of using the determined comparative gene product information to formulate a treatment plan.
26. The method of claim 19, further comprising the step of distinguishing patients with latent TB from active TB patients.
27. The method of claim 19, further comprising of determining the expression levels of the genes: ST3GAL6, PAD14, TNFRSF12A, VAMP3, BR13, RGS19, PILRA, NCFl, LOC652616, PLAUR(CD87),
SIGLEC5, B3GALT7, IBRDC3(NKLAM), ALOX5 AP(FLAP), MMP9, ANPEP(APN), NALP12, CSF2RA, IL6R(CD126), RASGRP4, TNFSF 14(CD258), NCF4, HK2, ARID3A, PGLYRPl (PGRP), which are underexpressed/underrepresented in the blood of Latent TB patients but not in the blood of Healthy individuals or Active TB patients.
28. The method of claim 19, further comprising of determining the expression levels of the genes: ABCGl, SREBFl, RBP7(CRBP4), C22orf5, FAMlOlB, S lOOP, LOC649377, UBTDl, PSTPIP-I, RENBP, PGM2, SULF2, FAM7A1, HOM-TES- 103, NDUFAFl, CESl, CYP27A1, FLJ33641, GPR177, MID IIP 1(MIG- 12), PSD4, SF3A1, NOV(CCN3), SGK(SGKl), CDK5R1, LOC642035, which are overexpressed/overrepresented in the blood of Healthy control individuals but were underexpressed/underrepresented in the blood of Latent TB patients, and underexpressed/underrepresented in the blood of Active TB patients.
29. The method of claim 19, further comprising of determining the expression levels of the genes: ARSG, LOC284757, MDM4, CRNKLl, IL8, LOC389541, CD300LB, NIN, PHKG2, HIPl, which are overexpressed/overrepresented in the blood of Healthy individuals, are underexpressed/underrepresented in the blood of both Latent and Active TB patients.
30. The method of claim 19, further comprising of determining the expression levels of the genes: PSMB8(LMP7), APOL6, GBP2, GBP5, GBP4, ATF3, GCHl, VAMP5, WARS, LIMKl, NPC2, IL-15, LMTK2, STX1 1(FHL4), which are overexpressed/overrepresented in the blood of Active TB, and underexpressed/underrepresented in the blood of Latent TB patients and Healthy control individuals.
31. The method of claim 19, further comprising of determining the expression levels of the genes: FLJl 1259(DRAM), JAK2, GSDMDC 1(DF5L)(FKSG 10), SIPAILl, [2680400](KIAA1632), ACTA2(ACTSA), KCNMB 1 (SLO-BETA), which are overexpressed/overrepresented in blood from Active TB patients, and underexpressed/underrepresented in the blood from Latent TB patients and Healthy control individuals.
32. The method of claim 19, further comprising of determining the expression levels of the genes: SPTANI, KIAAD 179(Nnp I)(RRPl), FAM84B(NSE2), SELM, IL27RA, MRPS34, [6940246](IL23A), PRKCA(PKCA), CCDC41, CD52(CDW52), [3890241](ZN404), MCCC1(MCCA/B), SOX8, SYNJ2, FLJ21127, FHIT, which are underexpressed/underrepresented in the blood of Active TB patients but not in the blood of Latent TB patients or Healthy Control individuals
33. The method of claim 19, further comprising of determining the expression levels of the genes: CDKLl(p42), MICALCL, MBNL3, RHD, ST7(RAY1), PPR3R1, [360739](PIP5K2A), AMFR, FLJ22471, CRAT(CATl), PLA2G4C, ACOT7(ACT)(ACH1), RNF182, KLRC3(NKG2E), HLA-DPBl, which are underexpressed/underrepresented in the blood of Healthy Control individuals, overexpressed/overrepresented in the blood of the Latent TB patients, and overexpressed/overrepresented in the blood of Active TB patients.
34. A method for distinguishing between active and latent mycobacterium tuberculosis infection in a patient suspected of being infected with Mycobacterium tuberculosis, the method comprising: obtaining a gene expression dataset from a whole blood sample; sorting the gene expression dataset into one or more transcriptional gene expression modules; and mapping the differential expression of the one or more transcriptional gene expression modules that distinguish between active and latent Mycobacterium tuberculosis infection, thereby distinguishing between active and latent Mycobacterium tuberculosis infection
35. The method of claim 34, wherein the dataset comprises TRIM genes.
36. The method of claim 34, wherein the dataset comprises TRIM genes, and TRIM 5, 6, 19(PML), 21, 22, 25, 68 are overrepresented/expressed in active pulmonary TB.
37. The method of claim 34, wherein the dataset comprises TRIM genes, and TRIM 28, 32, 51, 52, 68, are underepresented/expressed in active pulmonary TB.
38. A method of diagnosing a patient with active and latent Mycobacterium tuberculosis infection in a patient suspected of being infected with mycobacterium tuberculosis, the method comprising detecting differential expression of one or more transcriptional gene expression modules that distinguish between infected and non-infected patients obtained from whole blood, wherein whole blood demonstrates an aggregate change in the levels of polynucleotides in the one or more transcriptional gene expression modules as compared to matched non-infected patients, thereby distinguishing between active and latent mycobacterium tuberculosis infection.
39. The method of claim 38, further comprising the step of using the determined comparative gene product information to formulate a diagnosis.
40. The method of claim 38, further comprising the step of using the determined comparative gene product information to formulate a prognosis.
41. The method of claim 38, further comprising the step of using the determined comparative gene product information to formulate a treatment plan.
42. The method of claim 38, wherein the module comprises a dataset of the genes in modules Ml .2, M1.3, M1.4, Ml .5, Ml .8, M2.1, M2.4, M2.8, M3.1, M3.2, M3.3, M3.4, M3.6, M3.7, M3.8 or M3.9 to detect active pulmonary infection.
43. The method of claim 38, wherein the module comprises a dataset of the genes in modules Ml .5, M2.1, M2.6, M2.10, M3.2 or M3.3 to detect a latent infection.
44. The method of claim 38, wherein the following genes are down-regulated in active pulmonary infection CD3, CTLA-4, CD28, ZAP-70, IL-7R, CD2, SLAM, CCR7 and GATA-3.
45. The method of claim 38, wherein the expression profile of modules of Figure 9 is diagnostic of active pulmonary infection.
46. The method of claim 38, wherein the expression profile of modules of Figure 10 is diagnostic of latent infection.
47. The method of claim 38, wherein the underexpression of genes in modules M3.4, M3.6, M3.7, M3.8 and M3.9 is indicative of active infection.
48. The method of claim 38, wherein the overexpression of genes in modules M3.1 is indicative of active infection.
49. The method of claim 38, further comprising the step of distinguishing TB infection from other bacterial infections by determining the gene expression in modules M2.2, M2.3 and M3.5, which are overexpressed by the peripheral blood mononuclear cells or whole blood in infection other than Mycobacterium.
50. The method of claim 38, further comprising the step of distinguishing the differential and reciprocal transcriptional signatures in the blood of latent and active TB patients using two or more of the following modules Ml 3, Ml 4, Ml 5, Ml 8, M2 1, M2 4, M2 8, M3 1, M3 2, M3 3, M3 4, M3 6, M3 7, M3 8 or M3 9 for active pulmonary infection and modules Ml 5, M2 1, M2 6, M2 10, M3 2 or M3 3 for a latent infection
51 A kit for diagnosing a patient with active and latent mycobacteπum tuberculosis infection m a patient suspected of being infected with Mycobacterium tuberculosis , the kit comprising a gene expression detector for obtaining a gene expression dataset from the patient, and a processor capable of comparing the gene expression to pre-defined gene module dataset that distinguish between infected and non-infected patients obtained from whole blood, wherein whole blood demonstrates an aggregate change in the levels of polynucleotides in the one or more transcriptional gene expression modules as compared to matched non-mfected patients, thereby distinguishing between active and latent Mycobacterium tuberculosis infection
52 A system of diagnosing a patient with active and latent Mycobacterium tuberculosis infection comprising a gene expression dataset from the patient, and a processor capable of comparing the gene expression to pre-defined gene module dataset that distinguish between infected and non-infected patients obtained from whole blood, wherein whole blood demonstrates an aggregate change in the levels of polynucleotides in the one or more transcriptional gene expression modules as compared to matched non-mfected patients, thereby distinguishing between active and latent
Mycobacterium tuberculosis infection, wherein the modules are selected from Ml 3, Ml 4, Ml 5, Ml 8,
M2 1, M2 4, M2 8, M3 1, M3 2, M3 3, M3 4, M3 6, M3 7, M3 8 or M3 9 for active pulmonary infection and modules Ml 5, M2 1, M2 6, M2 10, M3 2 or M3 3 for a latent infection
PCT/US2009/048698 2008-06-25 2009-06-25 Blood transcriptional signature of mycobacterium tuberculosis infection WO2009158521A2 (en)

Priority Applications (13)

Application Number Priority Date Filing Date Title
NZ590341A NZ590341A (en) 2008-06-25 2009-06-25 Blood transcriptional signature of mycobacterium tuberculosis infection
EP09771053A EP2300823A4 (en) 2008-06-25 2009-06-25 Blood transcriptional signature of mycobacterium tuberculosis infection
AU2009262112A AU2009262112A1 (en) 2008-06-25 2009-06-25 Blood transcriptional signature of mycobacterium tuberculosis infection
AP2011005546A AP2011005546A0 (en) 2008-06-25 2009-06-25 Blood transcriptional signature of mycobacterium tuberculosis infection.
JP2011516672A JP2011526152A (en) 2008-06-25 2009-06-25 Blood transcription signature of Mycobacterium tuberculosis infection
CA2729000A CA2729000A1 (en) 2008-06-25 2009-06-25 Blood transcriptional signature of mycobacterium tuberculosis infection
CN2009801334543A CN102150043A (en) 2008-06-25 2009-06-25 Blood transcriptional signature of mycobacterium tuberculosis infection
MX2010014556A MX2010014556A (en) 2008-06-25 2009-06-25 Blood transcriptional signature of mycobacterium tuberculosis infection.
EA201170088A EA201170088A1 (en) 2008-06-25 2009-06-25 TRANSCRIPTION SIGNATURE OF BLOOD INFECTION MYCOBACTERIUM TUBERCULOSIS
US12/602,488 US20110196614A1 (en) 2008-06-25 2009-06-25 Blood transcriptional signature of mycobacterium tuberculosis infection
IL210121A IL210121A0 (en) 2008-06-25 2010-12-20 Blood transcriptional signature of mycobacterium tuberculosis infection
ZA2010/09307A ZA201009307B (en) 2008-06-25 2010-12-23 Blood transcriptional signature of mycobacterium tuberculosis infection
US14/024,142 US20140080732A1 (en) 2008-06-25 2013-09-11 Blood transcriptional signature of active versus latent mycobacterium tuberculosis infection

Applications Claiming Priority (2)

Application Number Priority Date Filing Date Title
US7572808P 2008-06-25 2008-06-25
US61/075,728 2008-06-25

Related Child Applications (2)

Application Number Title Priority Date Filing Date
US12/602,488 A-371-Of-International US20110196614A1 (en) 2008-06-25 2009-06-25 Blood transcriptional signature of mycobacterium tuberculosis infection
US12/628,148 Continuation-In-Part US20110129817A1 (en) 2008-06-25 2009-11-30 Blood transcriptional signature of active versus latent mycobacterium tuberculosis infection

Publications (2)

Publication Number Publication Date
WO2009158521A2 true WO2009158521A2 (en) 2009-12-30
WO2009158521A3 WO2009158521A3 (en) 2010-05-14

Family

ID=41445303

Family Applications (1)

Application Number Title Priority Date Filing Date
PCT/US2009/048698 WO2009158521A2 (en) 2008-06-25 2009-06-25 Blood transcriptional signature of mycobacterium tuberculosis infection

Country Status (17)

Country Link
US (1) US20110196614A1 (en)
EP (1) EP2300823A4 (en)
JP (1) JP2011526152A (en)
KR (1) KR20110036590A (en)
CN (1) CN102150043A (en)
AP (1) AP2011005546A0 (en)
AU (1) AU2009262112A1 (en)
CA (1) CA2729000A1 (en)
EA (1) EA201170088A1 (en)
IL (1) IL210121A0 (en)
MX (1) MX2010014556A (en)
NZ (1) NZ590341A (en)
PE (1) PE20110386A1 (en)
SG (1) SG182951A1 (en)
TW (1) TW201022492A (en)
WO (1) WO2009158521A2 (en)
ZA (1) ZA201009307B (en)

Cited By (48)

* Cited by examiner, † Cited by third party
Publication number Priority date Publication date Assignee Title
US8236503B2 (en) 2008-11-07 2012-08-07 Sequenta, Inc. Methods of monitoring conditions by sequence analysis
EP2519652A2 (en) * 2009-11-30 2012-11-07 Baylor Research Institute Blood transcriptional signature of active versus latent mycobacterium tuberculosis infection
WO2013112103A1 (en) * 2012-01-27 2013-08-01 Peas Institut Ab Method of detecting tuberculosis
WO2013190321A1 (en) * 2012-06-22 2013-12-27 Nottingham Trent University Biomarkers for determining the m. tuberculosis infection status
US8628927B2 (en) 2008-11-07 2014-01-14 Sequenta, Inc. Monitoring health and disease status using clonotype profiles
US8691510B2 (en) 2008-11-07 2014-04-08 Sequenta, Inc. Sequence analysis of complex amplicons
WO2014067943A1 (en) * 2012-10-30 2014-05-08 Imperial Innovations Limited Method of detecting active tuberculosis in children in the presence of a|co-morbidity
WO2015033136A1 (en) 2013-09-04 2015-03-12 Imperial Innovations Limited Methods and kits for determining tuberculosis infection status
US9043160B1 (en) 2009-11-09 2015-05-26 Sequenta, Inc. Method of determining clonotypes and clonotype profiles
EP2825671A4 (en) * 2012-03-13 2015-08-26 Baylor Res Inst Early detection of tuberculosis treatment response
US9150905B2 (en) 2012-05-08 2015-10-06 Adaptive Biotechnologies Corporation Compositions and method for measuring and calibrating amplification bias in multiplexed PCR reactions
US9181590B2 (en) 2011-10-21 2015-11-10 Adaptive Biotechnologies Corporation Quantification of adaptive immune cell genomes in a complex mixture of cells
WO2015170108A1 (en) * 2014-05-07 2015-11-12 The Secretary Of State For Health Biomarkers and combinations thereof for diagnosising tuberculosis
US9365901B2 (en) 2008-11-07 2016-06-14 Adaptive Biotechnologies Corp. Monitoring immunoglobulin heavy chain evolution in B-cell acute lymphoblastic leukemia
US9499865B2 (en) 2011-12-13 2016-11-22 Adaptive Biotechnologies Corp. Detection and measurement of tissue-infiltrating lymphocytes
US9506119B2 (en) 2008-11-07 2016-11-29 Adaptive Biotechnologies Corp. Method of sequence determination using sequence tags
US9512487B2 (en) 2008-11-07 2016-12-06 Adaptive Biotechnologies Corp. Monitoring health and disease status using clonotype profiles
US9528160B2 (en) 2008-11-07 2016-12-27 Adaptive Biotechnolgies Corp. Rare clonotypes and uses thereof
US9708657B2 (en) 2013-07-01 2017-07-18 Adaptive Biotechnologies Corp. Method for generating clonotype profiles using sequence tags
US9709565B2 (en) 2010-04-21 2017-07-18 Memed Diagnostics Ltd. Signatures and determinants for distinguishing between a bacterial and viral infection and methods of use thereof
US9726668B2 (en) 2012-02-09 2017-08-08 Memed Diagnostics Ltd. Signatures and determinants for diagnosing infections and methods of use thereof
US9809813B2 (en) 2009-06-25 2017-11-07 Fred Hutchinson Cancer Research Center Method of measuring adaptive immunity
US9824179B2 (en) 2011-12-09 2017-11-21 Adaptive Biotechnologies Corp. Diagnosis of lymphoid malignancies and minimal residual disease detection
US10066265B2 (en) 2014-04-01 2018-09-04 Adaptive Biotechnologies Corp. Determining antigen-specific t-cells
US10077478B2 (en) 2012-03-05 2018-09-18 Adaptive Biotechnologies Corp. Determining paired immune receptor chains from frequency matched subunits
US10150996B2 (en) 2012-10-19 2018-12-11 Adaptive Biotechnologies Corp. Quantification of adaptive immune cell genomes in a complex mixture of cells
US10209260B2 (en) 2017-07-05 2019-02-19 Memed Diagnostics Ltd. Signatures and determinants for diagnosing infections and methods of use thereof
US10221461B2 (en) 2012-10-01 2019-03-05 Adaptive Biotechnologies Corp. Immunocompetence assessment by adaptive immune receptor diversity and clonality characterization
US10246701B2 (en) 2014-11-14 2019-04-02 Adaptive Biotechnologies Corp. Multiplexed digital quantitation of rearranged lymphoid receptors in a complex mixture
US10303846B2 (en) 2014-08-14 2019-05-28 Memed Diagnostics Ltd. Computational analysis of biological data using manifold and a hyperplane
US10323276B2 (en) 2009-01-15 2019-06-18 Adaptive Biotechnologies Corporation Adaptive immunity profiling and methods for generation of monoclonal antibodies
US10385475B2 (en) 2011-09-12 2019-08-20 Adaptive Biotechnologies Corp. Random array sequencing of low-complexity libraries
US10392663B2 (en) 2014-10-29 2019-08-27 Adaptive Biotechnologies Corp. Highly-multiplexed simultaneous detection of nucleic acids encoding paired adaptive immune receptor heterodimers from a large number of samples
US10408847B2 (en) 2012-04-13 2019-09-10 Somalogic, Inc. Tuberculosis biomarkers and uses thereof
US10428325B1 (en) 2016-09-21 2019-10-01 Adaptive Biotechnologies Corporation Identification of antigen-specific B cell receptors
US10788493B2 (en) 2015-09-01 2020-09-29 Jw Bioscience Composition for diagnosing infectious diseases or infectious complications by using tryptophanyl-tRNA synthetase and method for detecting diagnostic marker
US10859574B2 (en) 2014-10-14 2020-12-08 Memed Diagnostics Ltd. Signatures and determinants for diagnosing infections in non-human subjects and methods of use thereof
US11041202B2 (en) 2015-04-01 2021-06-22 Adaptive Biotechnologies Corporation Method of identifying human compatible T cell receptors specific for an antigenic target
US11047008B2 (en) 2015-02-24 2021-06-29 Adaptive Biotechnologies Corporation Methods for diagnosing infectious disease and determining HLA status using immune repertoire sequencing
US11066705B2 (en) 2014-11-25 2021-07-20 Adaptive Biotechnologies Corporation Characterization of adaptive immune response to vaccination or infection using immune repertoire sequencing
US11131671B2 (en) 2016-07-10 2021-09-28 Memed Diagnostics Ltd. Protein signatures for distinguishing between bacterial and viral infections
US11248253B2 (en) 2014-03-05 2022-02-15 Adaptive Biotechnologies Corporation Methods using randomer-containing synthetic molecules
US11254980B1 (en) 2017-11-29 2022-02-22 Adaptive Biotechnologies Corporation Methods of profiling targeted polynucleotides while mitigating sequencing depth requirements
US11340223B2 (en) 2016-07-10 2022-05-24 Memed Diagnostics Ltd. Early diagnosis of infections
US11353456B2 (en) 2016-09-29 2022-06-07 Memed Diagnostics Ltd. Methods of risk assessment and disease classification for appendicitis
US11385241B2 (en) 2016-09-29 2022-07-12 Memed Diagnostics Ltd. Methods of prognosis and treatment
US11466331B2 (en) 2016-03-03 2022-10-11 Memed Diagnostics Ltd. RNA determinants for distinguishing between bacterial and viral infections
WO2022238515A1 (en) * 2021-05-11 2022-11-17 University College Dublin, Rna markers for tuberculosis and methods of detecting thereof

Families Citing this family (24)

* Cited by examiner, † Cited by third party
Publication number Priority date Publication date Assignee Title
EP2809813B1 (en) * 2012-02-03 2018-08-08 California Institute of Technology Signal encoding and decoding in multiplexed biochemical assays
GB201213567D0 (en) * 2012-07-31 2012-09-12 Proteinlogic Ltd Biomarkers
EP2931923A1 (en) * 2012-12-13 2015-10-21 Baylor Research Institute Blood transcriptional signatures of active pulmonary tuberculosis and sarcoidosis
WO2014130364A1 (en) * 2013-02-25 2014-08-28 The Research Foundation Of State University Of New York Collection of probes for autistic spectrum disorders and their use
DK2962100T3 (en) * 2013-02-28 2021-11-01 Caprion Proteomics Inc TUBERCULOSEBIOMARKEARS AND USES THEREOF
GB201401603D0 (en) 2014-01-30 2014-03-19 Proteinlogic Ltd Biomarkers
EP3132270A4 (en) * 2014-04-15 2017-09-13 Stellenbosch University A method for diagnosing tuberculous meningitis
CN107076745A (en) * 2014-08-29 2017-08-18 贝克顿·迪金森公司 The method and composition that tuberculosis is evaluated is obtained in subject
CN104459129A (en) * 2015-01-05 2015-03-25 复旦大学附属华山医院 Diagnostic kit for distinguishing active and latent mycobacterium tuberculosis infection
CN116218988A (en) * 2015-10-14 2023-06-06 斯坦福大学托管董事会 Method for diagnosing tuberculosis
CN107312823A (en) * 2016-04-26 2017-11-03 安徽祥升生物科技有限公司 A kind of real-time fluorescence PCR assay kit of TNFRSF12A genes
EP3907300A1 (en) * 2016-06-08 2021-11-10 University Of Iowa Research Foundation Compositions for detecting predisposition to cardiovascular disease
JP6306124B2 (en) * 2016-11-01 2018-04-04 国立大学法人高知大学 Tuberculosis testing biomarker
CN107267659B (en) * 2017-08-21 2020-10-16 首都医科大学附属北京胸科医院 Application of product for detecting TRIM gene and/or protein level
CN107653313B (en) * 2017-09-12 2021-07-09 首都医科大学附属北京胸科医院 Application of RETN and KLK1 as tuberculosis detection markers
CN107523626B (en) * 2017-09-21 2021-04-13 顾万君 Group of peripheral blood gene markers for noninvasive diagnosis of active tuberculosis
CN109609614B (en) * 2017-09-30 2022-07-15 首都医科大学附属北京胸科医院 Application of detecting TRIM2, TRIM4, TRIM32 and/or TRIM46 gene or protein product
CN107653315B (en) * 2017-10-16 2020-06-05 苏州大学附属第一医院 Application of lncRNAs as specific markers of active pulmonary tuberculosis
CN108387745B (en) * 2018-03-02 2020-12-15 首都医科大学附属北京胸科医院 Application of CD4+ T lymphocyte characteristic protein in identification of latent tuberculosis infection and active tuberculosis
CN108828235A (en) * 2018-08-23 2018-11-16 中国人民解放军第三〇九医院 Application of the PGLYRP1 albumen as marker in diagnostic activities tuberculosis
CN109061191B (en) * 2018-08-23 2021-08-24 中国人民解放军第三〇九医院 Application of S100P protein as marker in diagnosis of active tuberculosis
CN111172269B (en) * 2019-12-13 2022-12-16 南方医科大学 Application of reagent for detecting CALM2 gene expression level
CN112725434B (en) * 2021-01-20 2022-05-03 首都医科大学附属北京胸科医院 Rifampicin-resistant tuberculosis molecular marker, detection reagent and application thereof
CN113817776A (en) * 2021-10-25 2021-12-21 中国人民解放军军事科学院军事医学研究院 Application of GBP2 in regulating and controlling mesenchymal stem cell osteogenic differentiation

Family Cites Families (10)

* Cited by examiner, † Cited by third party
Publication number Priority date Publication date Assignee Title
US6627198B2 (en) * 1997-03-13 2003-09-30 Corixa Corporation Fusion proteins of Mycobacterium tuberculosis antigens and their uses
US20020086289A1 (en) * 1999-06-15 2002-07-04 Don Straus Genomic profiling: a rapid method for testing a complex biological sample for the presence of many types of organisms
US6713257B2 (en) * 2000-08-25 2004-03-30 Rosetta Inpharmatics Llc Gene discovery using microarrays
US7393540B2 (en) * 2001-07-04 2008-07-01 Health Protection Agency Mycobacterial antigens expressed during latency
KR20030028059A (en) * 2001-09-27 2003-04-08 (주)시로텍코리아 Diagnostic test kit of tuberculosis antigen including anti-tuberculous antibody
AU2003241055A1 (en) * 2002-06-20 2004-01-06 Glaxo Group Limited Surrogate markers for the determination of the disease status of an individual infected by mycobacterium tuberculosis
US20040157220A1 (en) * 2003-02-10 2004-08-12 Purnima Kurnool Methods and apparatus for sample tracking
CN101374964B (en) * 2005-12-09 2013-07-17 贝勒研究院 Module-level analysis of peripheral blood leukocyte transcriptional profiles
EP2228651A1 (en) * 2006-09-05 2010-09-15 Hvidovre Hospital IP-10 Based Immunological Monitoring
CN101196526A (en) * 2006-12-06 2008-06-11 许洋 Mass spectrometry reagent kit and method for rapid tuberculosis diagnosis

Non-Patent Citations (1)

* Cited by examiner, † Cited by third party
Title
See references of EP2300823A4 *

Cited By (84)

* Cited by examiner, † Cited by third party
Publication number Priority date Publication date Assignee Title
US9347099B2 (en) 2008-11-07 2016-05-24 Adaptive Biotechnologies Corp. Single cell analysis by polymerase cycling assembly
US9528160B2 (en) 2008-11-07 2016-12-27 Adaptive Biotechnolgies Corp. Rare clonotypes and uses thereof
US8236503B2 (en) 2008-11-07 2012-08-07 Sequenta, Inc. Methods of monitoring conditions by sequence analysis
US10246752B2 (en) 2008-11-07 2019-04-02 Adaptive Biotechnologies Corp. Methods of monitoring conditions by sequence analysis
US10266901B2 (en) 2008-11-07 2019-04-23 Adaptive Biotechnologies Corp. Methods of monitoring conditions by sequence analysis
US8507205B2 (en) 2008-11-07 2013-08-13 Sequenta, Inc. Single cell analysis by polymerase cycling assembly
US9228232B2 (en) 2008-11-07 2016-01-05 Sequenta, LLC. Methods of monitoring conditions by sequence analysis
US8628927B2 (en) 2008-11-07 2014-01-14 Sequenta, Inc. Monitoring health and disease status using clonotype profiles
US8691510B2 (en) 2008-11-07 2014-04-08 Sequenta, Inc. Sequence analysis of complex amplicons
US9523129B2 (en) 2008-11-07 2016-12-20 Adaptive Biotechnologies Corp. Sequence analysis of complex amplicons
US8795970B2 (en) 2008-11-07 2014-08-05 Sequenta, Inc. Methods of monitoring conditions by sequence analysis
US10760133B2 (en) 2008-11-07 2020-09-01 Adaptive Biotechnologies Corporation Monitoring health and disease status using clonotype profiles
US9512487B2 (en) 2008-11-07 2016-12-06 Adaptive Biotechnologies Corp. Monitoring health and disease status using clonotype profiles
US9506119B2 (en) 2008-11-07 2016-11-29 Adaptive Biotechnologies Corp. Method of sequence determination using sequence tags
US10519511B2 (en) 2008-11-07 2019-12-31 Adaptive Biotechnologies Corporation Monitoring health and disease status using clonotype profiles
US9416420B2 (en) 2008-11-07 2016-08-16 Adaptive Biotechnologies Corp. Monitoring health and disease status using clonotype profiles
US9365901B2 (en) 2008-11-07 2016-06-14 Adaptive Biotechnologies Corp. Monitoring immunoglobulin heavy chain evolution in B-cell acute lymphoblastic leukemia
US10155992B2 (en) 2008-11-07 2018-12-18 Adaptive Biotechnologies Corp. Monitoring health and disease status using clonotype profiles
US9217176B2 (en) 2008-11-07 2015-12-22 Sequenta, Llc Methods of monitoring conditions by sequence analysis
US10323276B2 (en) 2009-01-15 2019-06-18 Adaptive Biotechnologies Corporation Adaptive immunity profiling and methods for generation of monoclonal antibodies
US11214793B2 (en) 2009-06-25 2022-01-04 Fred Hutchinson Cancer Research Center Method of measuring adaptive immunity
US9809813B2 (en) 2009-06-25 2017-11-07 Fred Hutchinson Cancer Research Center Method of measuring adaptive immunity
US9043160B1 (en) 2009-11-09 2015-05-26 Sequenta, Inc. Method of determining clonotypes and clonotype profiles
EP2519652A2 (en) * 2009-11-30 2012-11-07 Baylor Research Institute Blood transcriptional signature of active versus latent mycobacterium tuberculosis infection
JP2013511981A (en) * 2009-11-30 2013-04-11 ベイラー リサーチ インスティテュート Blood transcript signatures contrast active TB infection with latent M. infection
EP2519652A4 (en) * 2009-11-30 2013-05-01 Baylor Res Inst Blood transcriptional signature of active versus latent mycobacterium tuberculosis infection
US9791446B2 (en) 2010-04-21 2017-10-17 Memed Diagnostics Ltd. Signatures and determinants for distinguishing between a bacterial and viral infection and methods of use thereof
US9709565B2 (en) 2010-04-21 2017-07-18 Memed Diagnostics Ltd. Signatures and determinants for distinguishing between a bacterial and viral infection and methods of use thereof
US10385475B2 (en) 2011-09-12 2019-08-20 Adaptive Biotechnologies Corp. Random array sequencing of low-complexity libraries
US9279159B2 (en) 2011-10-21 2016-03-08 Adaptive Biotechnologies Corporation Quantification of adaptive immune cell genomes in a complex mixture of cells
US9181590B2 (en) 2011-10-21 2015-11-10 Adaptive Biotechnologies Corporation Quantification of adaptive immune cell genomes in a complex mixture of cells
US9824179B2 (en) 2011-12-09 2017-11-21 Adaptive Biotechnologies Corp. Diagnosis of lymphoid malignancies and minimal residual disease detection
US9499865B2 (en) 2011-12-13 2016-11-22 Adaptive Biotechnologies Corp. Detection and measurement of tissue-infiltrating lymphocytes
WO2013112103A1 (en) * 2012-01-27 2013-08-01 Peas Institut Ab Method of detecting tuberculosis
US9726668B2 (en) 2012-02-09 2017-08-08 Memed Diagnostics Ltd. Signatures and determinants for diagnosing infections and methods of use thereof
US11175291B2 (en) 2012-02-09 2021-11-16 Memed Diagnostics Ltd. Signatures and determinants for diagnosing infections and methods of use thereof
US10502739B2 (en) 2012-02-09 2019-12-10 Memed Diagnostics Ltd. Signatures and determinants for diagnosing infections and methods of use thereof
US10077478B2 (en) 2012-03-05 2018-09-18 Adaptive Biotechnologies Corp. Determining paired immune receptor chains from frequency matched subunits
EP2825671A4 (en) * 2012-03-13 2015-08-26 Baylor Res Inst Early detection of tuberculosis treatment response
US10408847B2 (en) 2012-04-13 2019-09-10 Somalogic, Inc. Tuberculosis biomarkers and uses thereof
US10214770B2 (en) 2012-05-08 2019-02-26 Adaptive Biotechnologies Corp. Compositions and method for measuring and calibrating amplification bias in multiplexed PCR reactions
US9371558B2 (en) 2012-05-08 2016-06-21 Adaptive Biotechnologies Corp. Compositions and method for measuring and calibrating amplification bias in multiplexed PCR reactions
US10894977B2 (en) 2012-05-08 2021-01-19 Adaptive Biotechnologies Corporation Compositions and methods for measuring and calibrating amplification bias in multiplexed PCR reactions
US9150905B2 (en) 2012-05-08 2015-10-06 Adaptive Biotechnologies Corporation Compositions and method for measuring and calibrating amplification bias in multiplexed PCR reactions
WO2013190321A1 (en) * 2012-06-22 2013-12-27 Nottingham Trent University Biomarkers for determining the m. tuberculosis infection status
US10221461B2 (en) 2012-10-01 2019-03-05 Adaptive Biotechnologies Corp. Immunocompetence assessment by adaptive immune receptor diversity and clonality characterization
US11180813B2 (en) 2012-10-01 2021-11-23 Adaptive Biotechnologies Corporation Immunocompetence assessment by adaptive immune receptor diversity and clonality characterization
US10150996B2 (en) 2012-10-19 2018-12-11 Adaptive Biotechnologies Corp. Quantification of adaptive immune cell genomes in a complex mixture of cells
WO2014067943A1 (en) * 2012-10-30 2014-05-08 Imperial Innovations Limited Method of detecting active tuberculosis in children in the presence of a|co-morbidity
US10077473B2 (en) 2013-07-01 2018-09-18 Adaptive Biotechnologies Corp. Method for genotyping clonotype profiles using sequence tags
US10526650B2 (en) 2013-07-01 2020-01-07 Adaptive Biotechnologies Corporation Method for genotyping clonotype profiles using sequence tags
US9708657B2 (en) 2013-07-01 2017-07-18 Adaptive Biotechnologies Corp. Method for generating clonotype profiles using sequence tags
US10883990B2 (en) 2013-09-04 2021-01-05 Mjo Innovation Limited Methods and kits for determining tuberculosis infection status
US10041944B2 (en) 2013-09-04 2018-08-07 Mjo Innovation Limited Methods and kits for determining tuberculosis infection status
US11204352B2 (en) 2013-09-04 2021-12-21 MJO Innovations Limited Methods and kits for determining tuberculosis infection status
WO2015033136A1 (en) 2013-09-04 2015-03-12 Imperial Innovations Limited Methods and kits for determining tuberculosis infection status
US11248253B2 (en) 2014-03-05 2022-02-15 Adaptive Biotechnologies Corporation Methods using randomer-containing synthetic molecules
US10435745B2 (en) 2014-04-01 2019-10-08 Adaptive Biotechnologies Corp. Determining antigen-specific T-cells
US10066265B2 (en) 2014-04-01 2018-09-04 Adaptive Biotechnologies Corp. Determining antigen-specific t-cells
US11261490B2 (en) 2014-04-01 2022-03-01 Adaptive Biotechnologies Corporation Determining antigen-specific T-cells
US11674188B2 (en) 2014-05-07 2023-06-13 The Secretary Of State For Health Biomarkers and combinations thereof for diagnosing tuberculosis
CN107075569A (en) * 2014-05-07 2017-08-18 英国卫生部 Biomarker for diagnosis of tuberculosis and combinations thereof
CN107075569B (en) * 2014-05-07 2022-01-07 英国卫生与社会保障部 Biomarkers and combinations thereof for diagnosing tuberculosis
WO2015170108A1 (en) * 2014-05-07 2015-11-12 The Secretary Of State For Health Biomarkers and combinations thereof for diagnosising tuberculosis
US10303846B2 (en) 2014-08-14 2019-05-28 Memed Diagnostics Ltd. Computational analysis of biological data using manifold and a hyperplane
US11081206B2 (en) 2014-08-14 2021-08-03 Memed Diagnostics Ltd. Computational analysis of biological data using manifold and a hyperplane
US11776658B2 (en) 2014-08-14 2023-10-03 Memed Diagnostics Ltd. Computational analysis of biological data using manifold and a hyperplane
US11450406B2 (en) 2014-08-14 2022-09-20 Memed Diagnostics Ltd. Computational analysis of biological data using manifold and a hyperplane
US10859574B2 (en) 2014-10-14 2020-12-08 Memed Diagnostics Ltd. Signatures and determinants for diagnosing infections in non-human subjects and methods of use thereof
US10392663B2 (en) 2014-10-29 2019-08-27 Adaptive Biotechnologies Corp. Highly-multiplexed simultaneous detection of nucleic acids encoding paired adaptive immune receptor heterodimers from a large number of samples
US10246701B2 (en) 2014-11-14 2019-04-02 Adaptive Biotechnologies Corp. Multiplexed digital quantitation of rearranged lymphoid receptors in a complex mixture
US11066705B2 (en) 2014-11-25 2021-07-20 Adaptive Biotechnologies Corporation Characterization of adaptive immune response to vaccination or infection using immune repertoire sequencing
US11047008B2 (en) 2015-02-24 2021-06-29 Adaptive Biotechnologies Corporation Methods for diagnosing infectious disease and determining HLA status using immune repertoire sequencing
US11041202B2 (en) 2015-04-01 2021-06-22 Adaptive Biotechnologies Corporation Method of identifying human compatible T cell receptors specific for an antigenic target
US10788493B2 (en) 2015-09-01 2020-09-29 Jw Bioscience Composition for diagnosing infectious diseases or infectious complications by using tryptophanyl-tRNA synthetase and method for detecting diagnostic marker
US11466331B2 (en) 2016-03-03 2022-10-11 Memed Diagnostics Ltd. RNA determinants for distinguishing between bacterial and viral infections
US11131671B2 (en) 2016-07-10 2021-09-28 Memed Diagnostics Ltd. Protein signatures for distinguishing between bacterial and viral infections
US11340223B2 (en) 2016-07-10 2022-05-24 Memed Diagnostics Ltd. Early diagnosis of infections
US10428325B1 (en) 2016-09-21 2019-10-01 Adaptive Biotechnologies Corporation Identification of antigen-specific B cell receptors
US11353456B2 (en) 2016-09-29 2022-06-07 Memed Diagnostics Ltd. Methods of risk assessment and disease classification for appendicitis
US11385241B2 (en) 2016-09-29 2022-07-12 Memed Diagnostics Ltd. Methods of prognosis and treatment
US10209260B2 (en) 2017-07-05 2019-02-19 Memed Diagnostics Ltd. Signatures and determinants for diagnosing infections and methods of use thereof
US11254980B1 (en) 2017-11-29 2022-02-22 Adaptive Biotechnologies Corporation Methods of profiling targeted polynucleotides while mitigating sequencing depth requirements
WO2022238515A1 (en) * 2021-05-11 2022-11-17 University College Dublin, Rna markers for tuberculosis and methods of detecting thereof

Also Published As

Publication number Publication date
CA2729000A1 (en) 2009-12-30
IL210121A0 (en) 2011-02-28
WO2009158521A3 (en) 2010-05-14
MX2010014556A (en) 2011-07-28
SG182951A1 (en) 2012-08-30
PE20110386A1 (en) 2011-07-03
AP2011005546A0 (en) 2011-02-28
US20110196614A1 (en) 2011-08-11
EA201170088A1 (en) 2011-10-31
EP2300823A2 (en) 2011-03-30
JP2011526152A (en) 2011-10-06
ZA201009307B (en) 2012-10-31
NZ590341A (en) 2012-07-27
AU2009262112A1 (en) 2009-12-30
KR20110036590A (en) 2011-04-07
CN102150043A (en) 2011-08-10
TW201022492A (en) 2010-06-16
EP2300823A4 (en) 2012-03-14

Similar Documents

Publication Publication Date Title
WO2009158521A2 (en) Blood transcriptional signature of mycobacterium tuberculosis infection
AU2010325179B2 (en) Blood transcriptional signature of active versus latent Mycobacterium tuberculosis infection
US20070238094A1 (en) Diagnosis, prognosis and monitoring of disease progression of systemic lupus erythematosus through blood leukocyte microarray analysis
AU2007347118B2 (en) Diagnosis of metastatic melanoma and monitoring indicators of immunosuppression through blood leukocyte microarray analysis
Du et al. Genomic profiles for human peripheral blood T cells, B cells, natural killer cells, monocytes, and polymorphonuclear cells: comparisons to ischemic stroke, migraine, and Tourette syndrome
US20140179807A1 (en) Module-level analysis of peripheral blood leukocyte transcriptional profiles
JP2010500038A (en) Gene expression signatures in blood leukocytes enable differential diagnosis of acute infection
AU2015203028A1 (en) Blood transcriptional signature of active versus latent mycobacterium tuberculosis infection
WO2018085897A1 (en) Transplant rejection assay
WO2003016476A2 (en) Gene expression profiles in glomerular diseases

Legal Events

Date Code Title Description
WWE Wipo information: entry into national phase

Ref document number: 200980133454.3

Country of ref document: CN

121 Ep: the epo has been informed by wipo that ep was designated in this application

Ref document number: 09771053

Country of ref document: EP

Kind code of ref document: A2

WWE Wipo information: entry into national phase

Ref document number: 210121

Country of ref document: IL

ENP Entry into the national phase

Ref document number: 2729000

Country of ref document: CA

WWE Wipo information: entry into national phase

Ref document number: MX/A/2010/014556

Country of ref document: MX

ENP Entry into the national phase

Ref document number: 2011516672

Country of ref document: JP

Kind code of ref document: A

WWE Wipo information: entry into national phase

Ref document number: 001182-2010

Country of ref document: PE

NENP Non-entry into the national phase

Ref country code: DE

WWE Wipo information: entry into national phase

Ref document number: 12010502931

Country of ref document: PH

WWE Wipo information: entry into national phase

Ref document number: 2009262112

Country of ref document: AU

Ref document number: 590341

Country of ref document: NZ

WWE Wipo information: entry into national phase

Ref document number: 2009771053

Country of ref document: EP

WWE Wipo information: entry into national phase

Ref document number: 525/DELNP/2011

Country of ref document: IN

ENP Entry into the national phase

Ref document number: 20117001755

Country of ref document: KR

Kind code of ref document: A

WWE Wipo information: entry into national phase

Ref document number: 201170088

Country of ref document: EA

ENP Entry into the national phase

Ref document number: 2009262112

Country of ref document: AU

Date of ref document: 20090625

Kind code of ref document: A

WWE Wipo information: entry into national phase

Ref document number: 12602488

Country of ref document: US

REG Reference to national code

Ref country code: BR

Ref legal event code: B01E

Ref document number: PI0914727

Country of ref document: BR

ENPW Started to enter national phase and was withdrawn or failed for other reasons

Ref document number: PI0914727

Country of ref document: BR