WO2008144345A2 - Biomarkers and methods for determining sensitivity to insulin growth factor-1 receptor modulators - Google Patents
Biomarkers and methods for determining sensitivity to insulin growth factor-1 receptor modulators Download PDFInfo
- Publication number
- WO2008144345A2 WO2008144345A2 PCT/US2008/063621 US2008063621W WO2008144345A2 WO 2008144345 A2 WO2008144345 A2 WO 2008144345A2 US 2008063621 W US2008063621 W US 2008063621W WO 2008144345 A2 WO2008144345 A2 WO 2008144345A2
- Authority
- WO
- WIPO (PCT)
- Prior art keywords
- igflr
- compound
- cells
- biomarker
- cell lines
- Prior art date
Links
- 239000000090 biomarker Substances 0.000 title claims abstract description 160
- 238000000034 method Methods 0.000 title claims abstract description 69
- 230000035945 sensitivity Effects 0.000 title claims description 60
- 230000012010 growth Effects 0.000 title description 14
- NOESYZHRGYRDHS-UHFFFAOYSA-N insulin Chemical compound N1C(=O)C(NC(=O)C(CCC(N)=O)NC(=O)C(CCC(O)=O)NC(=O)C(C(C)C)NC(=O)C(NC(=O)CN)C(C)CC)CSSCC(C(NC(CO)C(=O)NC(CC(C)C)C(=O)NC(CC=2C=CC(O)=CC=2)C(=O)NC(CCC(N)=O)C(=O)NC(CC(C)C)C(=O)NC(CCC(O)=O)C(=O)NC(CC(N)=O)C(=O)NC(CC=2C=CC(O)=CC=2)C(=O)NC(CSSCC(NC(=O)C(C(C)C)NC(=O)C(CC(C)C)NC(=O)C(CC=2C=CC(O)=CC=2)NC(=O)C(CC(C)C)NC(=O)C(C)NC(=O)C(CCC(O)=O)NC(=O)C(C(C)C)NC(=O)C(CC(C)C)NC(=O)C(CC=2NC=NC=2)NC(=O)C(CO)NC(=O)CNC2=O)C(=O)NCC(=O)NC(CCC(O)=O)C(=O)NC(CCCNC(N)=N)C(=O)NCC(=O)NC(CC=3C=CC=CC=3)C(=O)NC(CC=3C=CC=CC=3)C(=O)NC(CC=3C=CC(O)=CC=3)C(=O)NC(C(C)O)C(=O)N3C(CCC3)C(=O)NC(CCCCN)C(=O)NC(C)C(O)=O)C(=O)NC(CC(N)=O)C(O)=O)=O)NC(=O)C(C(C)CC)NC(=O)C(CO)NC(=O)C(C(C)O)NC(=O)C1CSSCC2NC(=O)C(CC(C)C)NC(=O)C(NC(=O)C(CCC(N)=O)NC(=O)C(CC(N)=O)NC(=O)C(NC(=O)C(N)CC=1C=CC=CC=1)C(C)C)CC1=CN=CN1 NOESYZHRGYRDHS-UHFFFAOYSA-N 0.000 title description 8
- 102000004877 Insulin Human genes 0.000 title description 4
- 108090001061 Insulin Proteins 0.000 title description 4
- 229940125396 insulin Drugs 0.000 title description 4
- 206010028980 Neoplasm Diseases 0.000 claims abstract description 111
- 201000011510 cancer Diseases 0.000 claims abstract description 73
- 241000124008 Mammalia Species 0.000 claims abstract description 60
- 239000000523 sample Substances 0.000 claims description 31
- 239000012472 biological sample Substances 0.000 claims description 12
- 238000012544 monitoring process Methods 0.000 abstract description 11
- 101001034652 Homo sapiens Insulin-like growth factor 1 receptor Proteins 0.000 abstract description 7
- 102100039688 Insulin-like growth factor 1 receptor Human genes 0.000 abstract description 7
- 210000004027 cell Anatomy 0.000 description 247
- 108090000623 proteins and genes Proteins 0.000 description 157
- 230000014509 gene expression Effects 0.000 description 98
- 238000011282 treatment Methods 0.000 description 83
- 102000004169 proteins and genes Human genes 0.000 description 79
- 229940125904 compound 1 Drugs 0.000 description 70
- 235000018102 proteins Nutrition 0.000 description 69
- 239000003112 inhibitor Substances 0.000 description 62
- 239000003814 drug Substances 0.000 description 60
- 229940079593 drug Drugs 0.000 description 58
- 150000001875 compounds Chemical class 0.000 description 49
- 108090000765 processed proteins & peptides Proteins 0.000 description 45
- 230000000694 effects Effects 0.000 description 40
- 230000037361 pathway Effects 0.000 description 30
- 229940125782 compound 2 Drugs 0.000 description 28
- 230000002596 correlated effect Effects 0.000 description 26
- 102000004196 processed proteins & peptides Human genes 0.000 description 24
- 230000004044 response Effects 0.000 description 22
- 230000019491 signal transduction Effects 0.000 description 21
- 150000003384 small molecules Chemical class 0.000 description 21
- 238000012360 testing method Methods 0.000 description 21
- 206010039491 Sarcoma Diseases 0.000 description 20
- 241000282414 Homo sapiens Species 0.000 description 19
- 238000002493 microarray Methods 0.000 description 19
- 238000004458 analytical method Methods 0.000 description 18
- 238000002560 therapeutic procedure Methods 0.000 description 16
- IAZDPXIOMUYVGZ-UHFFFAOYSA-N Dimethylsulphoxide Chemical compound CS(C)=O IAZDPXIOMUYVGZ-UHFFFAOYSA-N 0.000 description 15
- 150000002500 ions Chemical class 0.000 description 15
- 229920001184 polypeptide Polymers 0.000 description 15
- 208000037265 diseases, disorders, signs and symptoms Diseases 0.000 description 14
- 230000005764 inhibitory process Effects 0.000 description 14
- 206010059866 Drug resistance Diseases 0.000 description 13
- 102100032864 General transcription factor IIH subunit 2 Human genes 0.000 description 13
- 230000018109 developmental process Effects 0.000 description 13
- 201000010099 disease Diseases 0.000 description 13
- 101710185585 General transcription factor IIH subunit 2 Proteins 0.000 description 12
- 230000004663 cell proliferation Effects 0.000 description 12
- 238000011161 development Methods 0.000 description 12
- 108091000080 Phosphotransferase Proteins 0.000 description 11
- 230000008859 change Effects 0.000 description 11
- 102000052116 epidermal growth factor receptor activity proteins Human genes 0.000 description 11
- 108700015053 epidermal growth factor receptor activity proteins Proteins 0.000 description 11
- 230000007246 mechanism Effects 0.000 description 11
- YOHYSYJDKVYCJI-UHFFFAOYSA-N n-[3-[[6-[3-(trifluoromethyl)anilino]pyrimidin-4-yl]amino]phenyl]cyclopropanecarboxamide Chemical compound FC(F)(F)C1=CC=CC(NC=2N=CN=C(NC=3C=C(NC(=O)C4CC4)C=CC=3)C=2)=C1 YOHYSYJDKVYCJI-UHFFFAOYSA-N 0.000 description 11
- 102000020233 phosphotransferase Human genes 0.000 description 11
- 102000005962 receptors Human genes 0.000 description 11
- 108020003175 receptors Proteins 0.000 description 11
- 230000004083 survival effect Effects 0.000 description 11
- DTQVDTLACAAQTR-UHFFFAOYSA-N Trifluoroacetic acid Chemical compound OC(=O)C(F)(F)F DTQVDTLACAAQTR-UHFFFAOYSA-N 0.000 description 10
- 230000006907 apoptotic process Effects 0.000 description 10
- 239000012634 fragment Substances 0.000 description 10
- 238000000338 in vitro Methods 0.000 description 10
- 239000000243 solution Substances 0.000 description 10
- 230000008685 targeting Effects 0.000 description 10
- QTBSBXVTEAMEQO-UHFFFAOYSA-N Acetic acid Chemical compound CC(O)=O QTBSBXVTEAMEQO-UHFFFAOYSA-N 0.000 description 9
- 101000599951 Homo sapiens Insulin-like growth factor I Proteins 0.000 description 9
- 102100037852 Insulin-like growth factor I Human genes 0.000 description 9
- KFZMGEQAYNKOFK-UHFFFAOYSA-N Isopropanol Chemical compound CC(C)O KFZMGEQAYNKOFK-UHFFFAOYSA-N 0.000 description 9
- 101001055320 Myxine glutinosa Insulin-like growth factor Proteins 0.000 description 9
- 230000027455 binding Effects 0.000 description 9
- 238000011223 gene expression profiling Methods 0.000 description 9
- 238000004895 liquid chromatography mass spectrometry Methods 0.000 description 9
- 108020004999 messenger RNA Proteins 0.000 description 9
- 238000003068 pathway analysis Methods 0.000 description 9
- 201000009410 rhabdomyosarcoma Diseases 0.000 description 9
- 210000001519 tissue Anatomy 0.000 description 9
- 210000004881 tumor cell Anatomy 0.000 description 9
- 150000001413 amino acids Chemical group 0.000 description 8
- 102000028416 insulin-like growth factor binding Human genes 0.000 description 8
- 108091022911 insulin-like growth factor binding Proteins 0.000 description 8
- 230000035772 mutation Effects 0.000 description 8
- 230000011664 signaling Effects 0.000 description 8
- 238000007619 statistical method Methods 0.000 description 8
- 230000002195 synergetic effect Effects 0.000 description 8
- OZFAFGSSMRRTDW-UHFFFAOYSA-N (2,4-dichlorophenyl) benzenesulfonate Chemical compound ClC1=CC(Cl)=CC=C1OS(=O)(=O)C1=CC=CC=C1 OZFAFGSSMRRTDW-UHFFFAOYSA-N 0.000 description 7
- 239000012591 Dulbecco’s Phosphate Buffered Saline Substances 0.000 description 7
- 108010010038 Gamma-protocadherins Proteins 0.000 description 7
- 206010029260 Neuroblastoma Diseases 0.000 description 7
- 238000000692 Student's t-test Methods 0.000 description 7
- 230000004913 activation Effects 0.000 description 7
- -1 e.g. Chemical class 0.000 description 7
- 239000003446 ligand Substances 0.000 description 7
- 238000012353 t test Methods 0.000 description 7
- WEVYAHXRMPXWCK-UHFFFAOYSA-N Acetonitrile Chemical compound CC#N WEVYAHXRMPXWCK-UHFFFAOYSA-N 0.000 description 6
- 206010006187 Breast cancer Diseases 0.000 description 6
- 208000026310 Breast neoplasm Diseases 0.000 description 6
- 108091034117 Oligonucleotide Proteins 0.000 description 6
- 238000001574 biopsy Methods 0.000 description 6
- 230000010261 cell growth Effects 0.000 description 6
- 239000003795 chemical substances by application Substances 0.000 description 6
- 230000003993 interaction Effects 0.000 description 6
- 230000002018 overexpression Effects 0.000 description 6
- 210000002381 plasma Anatomy 0.000 description 6
- 230000001225 therapeutic effect Effects 0.000 description 6
- 206010009944 Colon cancer Diseases 0.000 description 5
- 101000611943 Homo sapiens Programmed cell death protein 4 Proteins 0.000 description 5
- 102000004374 Insulin-like growth factor binding protein 3 Human genes 0.000 description 5
- 108090000965 Insulin-like growth factor binding protein 3 Proteins 0.000 description 5
- 241001465754 Metazoa Species 0.000 description 5
- 102100040992 Programmed cell death protein 4 Human genes 0.000 description 5
- 238000001516 cell proliferation assay Methods 0.000 description 5
- 230000002068 genetic effect Effects 0.000 description 5
- 210000004408 hybridoma Anatomy 0.000 description 5
- AICOOMRHRUFYCM-ZRRPKQBOSA-N oxazine, 1 Chemical compound C([C@@H]1[C@H](C(C[C@]2(C)[C@@H]([C@H](C)N(C)C)[C@H](O)C[C@]21C)=O)CC1=CC2)C[C@H]1[C@@]1(C)[C@H]2N=C(C(C)C)OC1 AICOOMRHRUFYCM-ZRRPKQBOSA-N 0.000 description 5
- 238000004885 tandem mass spectrometry Methods 0.000 description 5
- 102000004172 Cathepsin L Human genes 0.000 description 4
- 108090000624 Cathepsin L Proteins 0.000 description 4
- AOJJSUZBOXZQNB-TZSSRYMLSA-N Doxorubicin Chemical compound O([C@H]1C[C@@](O)(CC=2C(O)=C3C(=O)C=4C=CC=C(C=4C(=O)C3=C(O)C=21)OC)C(=O)CO)[C@H]1C[C@H](N)[C@H](O)[C@H](C)O1 AOJJSUZBOXZQNB-TZSSRYMLSA-N 0.000 description 4
- 108091054455 MAP kinase family Proteins 0.000 description 4
- 102000043136 MAP kinase family Human genes 0.000 description 4
- 102000004022 Protein-Tyrosine Kinases Human genes 0.000 description 4
- 108090000412 Protein-Tyrosine Kinases Proteins 0.000 description 4
- NKANXQFJJICGDU-QPLCGJKRSA-N Tamoxifen Chemical compound C=1C=CC=CC=1C(/CC)=C(C=1C=CC(OCCN(C)C)=CC=1)/C1=CC=CC=C1 NKANXQFJJICGDU-QPLCGJKRSA-N 0.000 description 4
- 235000001014 amino acid Nutrition 0.000 description 4
- 239000002246 antineoplastic agent Substances 0.000 description 4
- 230000008901 benefit Effects 0.000 description 4
- 230000000875 corresponding effect Effects 0.000 description 4
- 238000010790 dilution Methods 0.000 description 4
- 239000012895 dilution Substances 0.000 description 4
- 239000000890 drug combination Substances 0.000 description 4
- 238000005516 engineering process Methods 0.000 description 4
- 150000002632 lipids Chemical class 0.000 description 4
- 239000000463 material Substances 0.000 description 4
- 238000005259 measurement Methods 0.000 description 4
- 238000010208 microarray analysis Methods 0.000 description 4
- 239000002773 nucleotide Substances 0.000 description 4
- 125000003729 nucleotide group Chemical group 0.000 description 4
- 230000009467 reduction Effects 0.000 description 4
- 230000002829 reductive effect Effects 0.000 description 4
- 230000001105 regulatory effect Effects 0.000 description 4
- UCSJYZPVAKXKNQ-HZYVHMACSA-N streptomycin Chemical compound CN[C@H]1[C@H](O)[C@@H](O)[C@H](CO)O[C@H]1O[C@@H]1[C@](C=O)(O)[C@H](C)O[C@H]1O[C@@H]1[C@@H](NC(N)=N)[C@H](O)[C@@H](NC(N)=N)[C@H](O)[C@H]1O UCSJYZPVAKXKNQ-HZYVHMACSA-N 0.000 description 4
- DIGQNXIGRZPYDK-WKSCXVIASA-N (2R)-6-amino-2-[[2-[[(2S)-2-[[2-[[(2R)-2-[[(2S)-2-[[(2R,3S)-2-[[2-[[(2S)-2-[[2-[[(2S)-2-[[(2S)-2-[[(2R)-2-[[(2S,3S)-2-[[(2R)-2-[[(2S)-2-[[(2S)-2-[[(2S)-2-[[2-[[(2S)-2-[[(2R)-2-[[2-[[2-[[2-[(2-amino-1-hydroxyethylidene)amino]-3-carboxy-1-hydroxypropylidene]amino]-1-hydroxy-3-sulfanylpropylidene]amino]-1-hydroxyethylidene]amino]-1-hydroxy-3-sulfanylpropylidene]amino]-1,3-dihydroxypropylidene]amino]-1-hydroxyethylidene]amino]-1-hydroxypropylidene]amino]-1,3-dihydroxypropylidene]amino]-1,3-dihydroxypropylidene]amino]-1-hydroxy-3-sulfanylpropylidene]amino]-1,3-dihydroxybutylidene]amino]-1-hydroxy-3-sulfanylpropylidene]amino]-1-hydroxypropylidene]amino]-1,3-dihydroxypropylidene]amino]-1-hydroxyethylidene]amino]-1,5-dihydroxy-5-iminopentylidene]amino]-1-hydroxy-3-sulfanylpropylidene]amino]-1,3-dihydroxybutylidene]amino]-1-hydroxy-3-sulfanylpropylidene]amino]-1,3-dihydroxypropylidene]amino]-1-hydroxyethylidene]amino]-1-hydroxy-3-sulfanylpropylidene]amino]-1-hydroxyethylidene]amino]hexanoic acid Chemical compound C[C@@H]([C@@H](C(=N[C@@H](CS)C(=N[C@@H](C)C(=N[C@@H](CO)C(=NCC(=N[C@@H](CCC(=N)O)C(=NC(CS)C(=N[C@H]([C@H](C)O)C(=N[C@H](CS)C(=N[C@H](CO)C(=NCC(=N[C@H](CS)C(=NCC(=N[C@H](CCCCN)C(=O)O)O)O)O)O)O)O)O)O)O)O)O)O)O)N=C([C@H](CS)N=C([C@H](CO)N=C([C@H](CO)N=C([C@H](C)N=C(CN=C([C@H](CO)N=C([C@H](CS)N=C(CN=C(C(CS)N=C(C(CC(=O)O)N=C(CN)O)O)O)O)O)O)O)O)O)O)O)O DIGQNXIGRZPYDK-WKSCXVIASA-N 0.000 description 3
- 108091032973 (ribonucleotides)n+m Proteins 0.000 description 3
- 102000004225 Cathepsin B Human genes 0.000 description 3
- 108090000712 Cathepsin B Proteins 0.000 description 3
- 102000003908 Cathepsin D Human genes 0.000 description 3
- 108090000258 Cathepsin D Proteins 0.000 description 3
- 208000001333 Colorectal Neoplasms Diseases 0.000 description 3
- 108020004414 DNA Proteins 0.000 description 3
- 238000002965 ELISA Methods 0.000 description 3
- WSFSSNUMVMOOMR-UHFFFAOYSA-N Formaldehyde Chemical compound O=C WSFSSNUMVMOOMR-UHFFFAOYSA-N 0.000 description 3
- PEDCQBHIVMGVHV-UHFFFAOYSA-N Glycerine Chemical compound OCC(O)CO PEDCQBHIVMGVHV-UHFFFAOYSA-N 0.000 description 3
- 101001077600 Homo sapiens Insulin receptor substrate 2 Proteins 0.000 description 3
- 101150088952 IGF1 gene Proteins 0.000 description 3
- 102100025092 Insulin receptor substrate 2 Human genes 0.000 description 3
- 102000003792 Metallothionein Human genes 0.000 description 3
- 108090000157 Metallothionein Proteins 0.000 description 3
- 102000015636 Oligopeptides Human genes 0.000 description 3
- 108010038807 Oligopeptides Proteins 0.000 description 3
- 108700020796 Oncogene Proteins 0.000 description 3
- 206010035226 Plasma cell myeloma Diseases 0.000 description 3
- JLCPHMBAVCMARE-UHFFFAOYSA-N [3-[[3-[[3-[[3-[[3-[[3-[[3-[[3-[[3-[[3-[[3-[[5-(2-amino-6-oxo-1H-purin-9-yl)-3-[[3-[[3-[[3-[[3-[[3-[[5-(2-amino-6-oxo-1H-purin-9-yl)-3-[[5-(2-amino-6-oxo-1H-purin-9-yl)-3-hydroxyoxolan-2-yl]methoxy-hydroxyphosphoryl]oxyoxolan-2-yl]methoxy-hydroxyphosphoryl]oxy-5-(5-methyl-2,4-dioxopyrimidin-1-yl)oxolan-2-yl]methoxy-hydroxyphosphoryl]oxy-5-(6-aminopurin-9-yl)oxolan-2-yl]methoxy-hydroxyphosphoryl]oxy-5-(6-aminopurin-9-yl)oxolan-2-yl]methoxy-hydroxyphosphoryl]oxy-5-(6-aminopurin-9-yl)oxolan-2-yl]methoxy-hydroxyphosphoryl]oxy-5-(6-aminopurin-9-yl)oxolan-2-yl]methoxy-hydroxyphosphoryl]oxyoxolan-2-yl]methoxy-hydroxyphosphoryl]oxy-5-(5-methyl-2,4-dioxopyrimidin-1-yl)oxolan-2-yl]methoxy-hydroxyphosphoryl]oxy-5-(4-amino-2-oxopyrimidin-1-yl)oxolan-2-yl]methoxy-hydroxyphosphoryl]oxy-5-(5-methyl-2,4-dioxopyrimidin-1-yl)oxolan-2-yl]methoxy-hydroxyphosphoryl]oxy-5-(5-methyl-2,4-dioxopyrimidin-1-yl)oxolan-2-yl]methoxy-hydroxyphosphoryl]oxy-5-(6-aminopurin-9-yl)oxolan-2-yl]methoxy-hydroxyphosphoryl]oxy-5-(6-aminopurin-9-yl)oxolan-2-yl]methoxy-hydroxyphosphoryl]oxy-5-(4-amino-2-oxopyrimidin-1-yl)oxolan-2-yl]methoxy-hydroxyphosphoryl]oxy-5-(4-amino-2-oxopyrimidin-1-yl)oxolan-2-yl]methoxy-hydroxyphosphoryl]oxy-5-(4-amino-2-oxopyrimidin-1-yl)oxolan-2-yl]methoxy-hydroxyphosphoryl]oxy-5-(6-aminopurin-9-yl)oxolan-2-yl]methoxy-hydroxyphosphoryl]oxy-5-(4-amino-2-oxopyrimidin-1-yl)oxolan-2-yl]methyl [5-(6-aminopurin-9-yl)-2-(hydroxymethyl)oxolan-3-yl] hydrogen phosphate Polymers Cc1cn(C2CC(OP(O)(=O)OCC3OC(CC3OP(O)(=O)OCC3OC(CC3O)n3cnc4c3nc(N)[nH]c4=O)n3cnc4c3nc(N)[nH]c4=O)C(COP(O)(=O)OC3CC(OC3COP(O)(=O)OC3CC(OC3COP(O)(=O)OC3CC(OC3COP(O)(=O)OC3CC(OC3COP(O)(=O)OC3CC(OC3COP(O)(=O)OC3CC(OC3COP(O)(=O)OC3CC(OC3COP(O)(=O)OC3CC(OC3COP(O)(=O)OC3CC(OC3COP(O)(=O)OC3CC(OC3COP(O)(=O)OC3CC(OC3COP(O)(=O)OC3CC(OC3COP(O)(=O)OC3CC(OC3COP(O)(=O)OC3CC(OC3COP(O)(=O)OC3CC(OC3COP(O)(=O)OC3CC(OC3COP(O)(=O)OC3CC(OC3CO)n3cnc4c(N)ncnc34)n3ccc(N)nc3=O)n3cnc4c(N)ncnc34)n3ccc(N)nc3=O)n3ccc(N)nc3=O)n3ccc(N)nc3=O)n3cnc4c(N)ncnc34)n3cnc4c(N)ncnc34)n3cc(C)c(=O)[nH]c3=O)n3cc(C)c(=O)[nH]c3=O)n3ccc(N)nc3=O)n3cc(C)c(=O)[nH]c3=O)n3cnc4c3nc(N)[nH]c4=O)n3cnc4c(N)ncnc34)n3cnc4c(N)ncnc34)n3cnc4c(N)ncnc34)n3cnc4c(N)ncnc34)O2)c(=O)[nH]c1=O JLCPHMBAVCMARE-UHFFFAOYSA-N 0.000 description 3
- 230000005775 apoptotic pathway Effects 0.000 description 3
- 238000013459 approach Methods 0.000 description 3
- 238000003556 assay Methods 0.000 description 3
- 230000000903 blocking effect Effects 0.000 description 3
- 210000004369 blood Anatomy 0.000 description 3
- 239000008280 blood Substances 0.000 description 3
- 208000029742 colonic neoplasm Diseases 0.000 description 3
- 238000002648 combination therapy Methods 0.000 description 3
- 239000002299 complementary DNA Substances 0.000 description 3
- 208000037765 diseases and disorders Diseases 0.000 description 3
- 229940121647 egfr inhibitor Drugs 0.000 description 3
- 238000003306 harvesting Methods 0.000 description 3
- 238000004128 high performance liquid chromatography Methods 0.000 description 3
- 230000001976 improved effect Effects 0.000 description 3
- 238000001727 in vivo Methods 0.000 description 3
- 238000004519 manufacturing process Methods 0.000 description 3
- 201000000050 myeloid neoplasm Diseases 0.000 description 3
- 229920001542 oligosaccharide Polymers 0.000 description 3
- 150000002482 oligosaccharides Chemical class 0.000 description 3
- 238000011275 oncology therapy Methods 0.000 description 3
- 239000013610 patient sample Substances 0.000 description 3
- 102000040430 polynucleotide Human genes 0.000 description 3
- 108091033319 polynucleotide Proteins 0.000 description 3
- 239000002157 polynucleotide Substances 0.000 description 3
- 238000003757 reverse transcription PCR Methods 0.000 description 3
- 238000012216 screening Methods 0.000 description 3
- 230000004614 tumor growth Effects 0.000 description 3
- 238000007492 two-way ANOVA Methods 0.000 description 3
- 238000001262 western blot Methods 0.000 description 3
- KDCGOANMDULRCW-UHFFFAOYSA-N 7H-purine Chemical compound N1=CNC2=NC=NC2=C1 KDCGOANMDULRCW-UHFFFAOYSA-N 0.000 description 2
- 102100021663 Baculoviral IAP repeat-containing protein 5 Human genes 0.000 description 2
- 241000283690 Bos taurus Species 0.000 description 2
- 108091003079 Bovine Serum Albumin Proteins 0.000 description 2
- CURLTUGMZLYLDI-UHFFFAOYSA-N Carbon dioxide Chemical compound O=C=O CURLTUGMZLYLDI-UHFFFAOYSA-N 0.000 description 2
- 208000005623 Carcinogenesis Diseases 0.000 description 2
- 102000014914 Carrier Proteins Human genes 0.000 description 2
- ZBNZXTGUTAYRHI-UHFFFAOYSA-N Dasatinib Chemical compound C=1C(N2CCN(CCO)CC2)=NC(C)=NC=1NC(S1)=NC=C1C(=O)NC1=C(C)C=CC=C1Cl ZBNZXTGUTAYRHI-UHFFFAOYSA-N 0.000 description 2
- 101150029707 ERBB2 gene Proteins 0.000 description 2
- 201000008808 Fibrosarcoma Diseases 0.000 description 2
- VWUXBMIQPBEWFH-WCCTWKNTSA-N Fulvestrant Chemical compound OC1=CC=C2[C@H]3CC[C@](C)([C@H](CC4)O)[C@@H]4[C@@H]3[C@H](CCCCCCCCCS(=O)CCCC(F)(F)C(F)(F)F)CC2=C1 VWUXBMIQPBEWFH-WCCTWKNTSA-N 0.000 description 2
- 229940125497 HER2 kinase inhibitor Drugs 0.000 description 2
- 101001044940 Homo sapiens Insulin-like growth factor-binding protein 2 Proteins 0.000 description 2
- 101000840566 Homo sapiens Insulin-like growth factor-binding protein 5 Proteins 0.000 description 2
- 101000692455 Homo sapiens Platelet-derived growth factor receptor beta Proteins 0.000 description 2
- 101000609215 Homo sapiens Polyadenylate-binding protein 3 Proteins 0.000 description 2
- 108010067060 Immunoglobulin Variable Region Proteins 0.000 description 2
- 102000017727 Immunoglobulin Variable Region Human genes 0.000 description 2
- 108090000723 Insulin-Like Growth Factor I Proteins 0.000 description 2
- 102000004218 Insulin-Like Growth Factor I Human genes 0.000 description 2
- 108090001117 Insulin-Like Growth Factor II Proteins 0.000 description 2
- 102000048143 Insulin-Like Growth Factor II Human genes 0.000 description 2
- 102100022710 Insulin-like growth factor-binding protein 2 Human genes 0.000 description 2
- 102100029225 Insulin-like growth factor-binding protein 5 Human genes 0.000 description 2
- 239000002067 L01XE06 - Dasatinib Substances 0.000 description 2
- 208000018142 Leiomyosarcoma Diseases 0.000 description 2
- 206010027476 Metastases Diseases 0.000 description 2
- 241000699666 Mus <mouse, genus> Species 0.000 description 2
- 241000699670 Mus sp. Species 0.000 description 2
- 108091007491 NSP3 Papain-like protease domains Proteins 0.000 description 2
- 241000283973 Oryctolagus cuniculus Species 0.000 description 2
- 102000038030 PI3Ks Human genes 0.000 description 2
- 108091007960 PI3Ks Proteins 0.000 description 2
- 229930182555 Penicillin Natural products 0.000 description 2
- JGSARLDLIJGVTE-MBNYWOFBSA-N Penicillin G Chemical compound N([C@H]1[C@H]2SC([C@@H](N2C1=O)C(O)=O)(C)C)C(=O)CC1=CC=CC=C1 JGSARLDLIJGVTE-MBNYWOFBSA-N 0.000 description 2
- 102100026547 Platelet-derived growth factor receptor beta Human genes 0.000 description 2
- 102100039425 Polyadenylate-binding protein 3 Human genes 0.000 description 2
- 241000288906 Primates Species 0.000 description 2
- 108091008611 Protein Kinase B Proteins 0.000 description 2
- 102100033810 RAC-alpha serine/threonine-protein kinase Human genes 0.000 description 2
- 241000700159 Rattus Species 0.000 description 2
- 108010002687 Survivin Proteins 0.000 description 2
- 108010065917 TOR Serine-Threonine Kinases Proteins 0.000 description 2
- 102000013530 TOR Serine-Threonine Kinases Human genes 0.000 description 2
- XSQUKJJJFZCRTK-UHFFFAOYSA-N Urea Chemical compound NC(N)=O XSQUKJJJFZCRTK-UHFFFAOYSA-N 0.000 description 2
- 102000005789 Vascular Endothelial Growth Factors Human genes 0.000 description 2
- 108010019530 Vascular Endothelial Growth Factors Proteins 0.000 description 2
- 230000009471 action Effects 0.000 description 2
- 230000000996 additive effect Effects 0.000 description 2
- 230000001093 anti-cancer Effects 0.000 description 2
- 230000001640 apoptogenic effect Effects 0.000 description 2
- 108091008324 binding proteins Proteins 0.000 description 2
- 230000036952 cancer formation Effects 0.000 description 2
- 231100000504 carcinogenesis Toxicity 0.000 description 2
- 230000022131 cell cycle Effects 0.000 description 2
- 239000013592 cell lysate Substances 0.000 description 2
- 230000036755 cellular response Effects 0.000 description 2
- 230000005754 cellular signaling Effects 0.000 description 2
- 238000012512 characterization method Methods 0.000 description 2
- 239000003153 chemical reaction reagent Substances 0.000 description 2
- 238000002512 chemotherapy Methods 0.000 description 2
- 239000000824 cytostatic agent Substances 0.000 description 2
- 230000001085 cytostatic effect Effects 0.000 description 2
- 231100000433 cytotoxic Toxicity 0.000 description 2
- 229940127089 cytotoxic agent Drugs 0.000 description 2
- 230000001472 cytotoxic effect Effects 0.000 description 2
- 229960002448 dasatinib Drugs 0.000 description 2
- 239000003596 drug target Substances 0.000 description 2
- 238000010195 expression analysis Methods 0.000 description 2
- 239000012091 fetal bovine serum Substances 0.000 description 2
- 238000001943 fluorescence-activated cell sorting Methods 0.000 description 2
- 238000004108 freeze drying Methods 0.000 description 2
- 238000003500 gene array Methods 0.000 description 2
- 150000004676 glycans Chemical class 0.000 description 2
- 239000001963 growth medium Substances 0.000 description 2
- 229940022353 herceptin Drugs 0.000 description 2
- 125000003037 imidazol-2-yl group Chemical group [H]N1C([*])=NC([H])=C1[H] 0.000 description 2
- 238000010166 immunofluorescence Methods 0.000 description 2
- 238000007901 in situ hybridization Methods 0.000 description 2
- 238000000099 in vitro assay Methods 0.000 description 2
- PKCDDUHJAFVJJB-VLZXCDOPSA-N linsitinib Chemical compound C1[C@](C)(O)C[C@@H]1C1=NC(C=2C=C3N=C(C=CC3=CC=2)C=2C=CC=CC=2)=C2N1C=CN=C2N PKCDDUHJAFVJJB-VLZXCDOPSA-N 0.000 description 2
- 229950001762 linsitinib Drugs 0.000 description 2
- 206010024627 liposarcoma Diseases 0.000 description 2
- 230000002132 lysosomal effect Effects 0.000 description 2
- 238000012423 maintenance Methods 0.000 description 2
- 230000014759 maintenance of location Effects 0.000 description 2
- 230000003211 malignant effect Effects 0.000 description 2
- 239000002609 medium Substances 0.000 description 2
- 230000009401 metastasis Effects 0.000 description 2
- 229940043363 multi-kinase inhibitor Drugs 0.000 description 2
- 238000002414 normal-phase solid-phase extraction Methods 0.000 description 2
- 102000039446 nucleic acids Human genes 0.000 description 2
- 108020004707 nucleic acids Proteins 0.000 description 2
- 150000007523 nucleic acids Chemical class 0.000 description 2
- 230000004650 oncogenic pathway Effects 0.000 description 2
- 210000000056 organ Anatomy 0.000 description 2
- 150000002894 organic compounds Chemical class 0.000 description 2
- 150000002902 organometallic compounds Chemical class 0.000 description 2
- 229940049954 penicillin Drugs 0.000 description 2
- 239000012071 phase Substances 0.000 description 2
- BASFCYQUMIYNBI-UHFFFAOYSA-N platinum Chemical compound [Pt] BASFCYQUMIYNBI-UHFFFAOYSA-N 0.000 description 2
- 229920001282 polysaccharide Polymers 0.000 description 2
- 239000005017 polysaccharide Substances 0.000 description 2
- 230000008569 process Effects 0.000 description 2
- 238000012545 processing Methods 0.000 description 2
- 238000004393 prognosis Methods 0.000 description 2
- 230000035755 proliferation Effects 0.000 description 2
- 238000000751 protein extraction Methods 0.000 description 2
- 238000011002 quantification Methods 0.000 description 2
- PYWVYCXTNDRMGF-UHFFFAOYSA-N rhodamine B Chemical compound [Cl-].C=12C=CC(=[N+](CC)CC)C=C2OC2=CC(N(CC)CC)=CC=C2C=1C1=CC=CC=C1C(O)=O PYWVYCXTNDRMGF-UHFFFAOYSA-N 0.000 description 2
- 238000013207 serial dilution Methods 0.000 description 2
- 210000002966 serum Anatomy 0.000 description 2
- 210000004988 splenocyte Anatomy 0.000 description 2
- 102000009076 src-Family Kinases Human genes 0.000 description 2
- 108010087686 src-Family Kinases Proteins 0.000 description 2
- 239000011550 stock solution Substances 0.000 description 2
- 229960005322 streptomycin Drugs 0.000 description 2
- 239000000758 substrate Substances 0.000 description 2
- 208000024891 symptom Diseases 0.000 description 2
- 229960001603 tamoxifen Drugs 0.000 description 2
- 238000002626 targeted therapy Methods 0.000 description 2
- 230000005945 translocation Effects 0.000 description 2
- 229960000575 trastuzumab Drugs 0.000 description 2
- XLYOFNOQVPJJNP-UHFFFAOYSA-N water Substances O XLYOFNOQVPJJNP-UHFFFAOYSA-N 0.000 description 2
- YGPSJZOEDVAXAB-UHFFFAOYSA-N (R)-Kynurenine Natural products OC(=O)C(N)CC(=O)C1=CC=CC=C1N YGPSJZOEDVAXAB-UHFFFAOYSA-N 0.000 description 1
- IQFYYKKMVGJFEH-LJTCTKOTSA-N 1-[(2r,4s,5r)-4-hydroxy-5-(hydroxymethyl)oxolan-2-yl]-5-methyl-6-tritiopyrimidine-2,4-dione Chemical compound [3H]C1=C(C)C(=O)NC(=O)N1[C@@H]1O[C@H](CO)[C@@H](O)C1 IQFYYKKMVGJFEH-LJTCTKOTSA-N 0.000 description 1
- JKMHFZQWWAIEOD-UHFFFAOYSA-N 2-[4-(2-hydroxyethyl)piperazin-1-yl]ethanesulfonic acid Chemical compound OCC[NH+]1CCN(CCS([O-])(=O)=O)CC1 JKMHFZQWWAIEOD-UHFFFAOYSA-N 0.000 description 1
- WEVYNIUIFUYDGI-UHFFFAOYSA-N 3-[6-[4-(trifluoromethoxy)anilino]-4-pyrimidinyl]benzamide Chemical compound NC(=O)C1=CC=CC(C=2N=CN=C(NC=3C=CC(OC(F)(F)F)=CC=3)C=2)=C1 WEVYNIUIFUYDGI-UHFFFAOYSA-N 0.000 description 1
- 206010069754 Acquired gene mutation Diseases 0.000 description 1
- 102100039819 Actin, alpha cardiac muscle 1 Human genes 0.000 description 1
- HJCMDXDYPOUFDY-WHFBIAKZSA-N Ala-Gln Chemical compound C[C@H](N)C(=O)N[C@H](C(O)=O)CCC(N)=O HJCMDXDYPOUFDY-WHFBIAKZSA-N 0.000 description 1
- ATRRKUHOCOJYRX-UHFFFAOYSA-N Ammonium bicarbonate Chemical compound [NH4+].OC([O-])=O ATRRKUHOCOJYRX-UHFFFAOYSA-N 0.000 description 1
- 229910000013 Ammonium bicarbonate Inorganic materials 0.000 description 1
- 101100067974 Arabidopsis thaliana POP2 gene Proteins 0.000 description 1
- 101100301828 Arabidopsis thaliana RH41 gene Proteins 0.000 description 1
- 229940122815 Aromatase inhibitor Drugs 0.000 description 1
- 102100027954 BAG family molecular chaperone regulator 3 Human genes 0.000 description 1
- 108091007065 BIRCs Proteins 0.000 description 1
- 241000894006 Bacteria Species 0.000 description 1
- 206010055113 Breast cancer metastatic Diseases 0.000 description 1
- 102100032912 CD44 antigen Human genes 0.000 description 1
- LQVXSNNAFNGRAH-QHCPKHFHSA-N C[C@](CCC1)(C(Nc(cn2)ccc2F)=O)N1c(nc1Nc2n[nH]c(C3CC3)c2)n[n]2c1ccc2 Chemical compound C[C@](CCC1)(C(Nc(cn2)ccc2F)=O)N1c(nc1Nc2n[nH]c(C3CC3)c2)n[n]2c1ccc2 LQVXSNNAFNGRAH-QHCPKHFHSA-N 0.000 description 1
- 102100024153 Cadherin-15 Human genes 0.000 description 1
- 101100439046 Caenorhabditis elegans cdk-2 gene Proteins 0.000 description 1
- OYPRJOBELJOOCE-UHFFFAOYSA-N Calcium Chemical compound [Ca] OYPRJOBELJOOCE-UHFFFAOYSA-N 0.000 description 1
- 241000283707 Capra Species 0.000 description 1
- 102000011937 Cathepsin Z Human genes 0.000 description 1
- 108010061117 Cathepsin Z Proteins 0.000 description 1
- 102000005600 Cathepsins Human genes 0.000 description 1
- 108010084457 Cathepsins Proteins 0.000 description 1
- 102000011682 Centromere Protein A Human genes 0.000 description 1
- 108010076303 Centromere Protein A Proteins 0.000 description 1
- 241000282693 Cercopithecidae Species 0.000 description 1
- 102000000503 Collagen Type II Human genes 0.000 description 1
- 108010041390 Collagen Type II Proteins 0.000 description 1
- 108010047041 Complementarity Determining Regions Proteins 0.000 description 1
- 102000016736 Cyclin Human genes 0.000 description 1
- 108050006400 Cyclin Proteins 0.000 description 1
- 102100036329 Cyclin-dependent kinase 3 Human genes 0.000 description 1
- 101150077031 DAXX gene Proteins 0.000 description 1
- 108091006089 DNA- and RNA-binding proteins Proteins 0.000 description 1
- 102100028559 Death domain-associated protein 6 Human genes 0.000 description 1
- 101710088194 Dehydrogenase Proteins 0.000 description 1
- 102100030091 Dickkopf-related protein 2 Human genes 0.000 description 1
- 102000001301 EGF receptor Human genes 0.000 description 1
- 238000012286 ELISA Assay Methods 0.000 description 1
- 101150076616 EPHA2 gene Proteins 0.000 description 1
- 102000004190 Enzymes Human genes 0.000 description 1
- 108090000790 Enzymes Proteins 0.000 description 1
- 102100030340 Ephrin type-A receptor 2 Human genes 0.000 description 1
- 241000283086 Equidae Species 0.000 description 1
- 241000283073 Equus caballus Species 0.000 description 1
- 208000006168 Ewing Sarcoma Diseases 0.000 description 1
- 102100030431 Fatty acid-binding protein, adipocyte Human genes 0.000 description 1
- 241000282326 Felis catus Species 0.000 description 1
- 102100027844 Fibroblast growth factor receptor 4 Human genes 0.000 description 1
- 102100037362 Fibronectin Human genes 0.000 description 1
- 108010067306 Fibronectins Proteins 0.000 description 1
- 102100026560 Filamin-C Human genes 0.000 description 1
- 238000012413 Fluorescence activated cell sorting analysis Methods 0.000 description 1
- 208000034951 Genetic Translocation Diseases 0.000 description 1
- 102000018884 Golgi Matrix Proteins Human genes 0.000 description 1
- 108010052778 Golgi Matrix Proteins Proteins 0.000 description 1
- 102100032564 Golgin subfamily A member 2 Human genes 0.000 description 1
- 241000282412 Homo Species 0.000 description 1
- 101000959247 Homo sapiens Actin, alpha cardiac muscle 1 Proteins 0.000 description 1
- 101000697871 Homo sapiens BAG family molecular chaperone regulator 3 Proteins 0.000 description 1
- 101000868273 Homo sapiens CD44 antigen Proteins 0.000 description 1
- 101000762242 Homo sapiens Cadherin-15 Proteins 0.000 description 1
- 101000945639 Homo sapiens Cyclin-dependent kinase inhibitor 3 Proteins 0.000 description 1
- 101000864647 Homo sapiens Dickkopf-related protein 2 Proteins 0.000 description 1
- 101100118549 Homo sapiens EGFR gene Proteins 0.000 description 1
- 101001062864 Homo sapiens Fatty acid-binding protein, adipocyte Proteins 0.000 description 1
- 101000917134 Homo sapiens Fibroblast growth factor receptor 4 Proteins 0.000 description 1
- 101000913557 Homo sapiens Filamin-C Proteins 0.000 description 1
- 101000655398 Homo sapiens General transcription factor IIH subunit 2 Proteins 0.000 description 1
- 101001014629 Homo sapiens Golgin subfamily A member 2 Proteins 0.000 description 1
- 101001053716 Homo sapiens Inhibitor of growth protein 3 Proteins 0.000 description 1
- 101001076292 Homo sapiens Insulin-like growth factor II Proteins 0.000 description 1
- 101000840582 Homo sapiens Insulin-like growth factor-binding protein 6 Proteins 0.000 description 1
- 101000840577 Homo sapiens Insulin-like growth factor-binding protein 7 Proteins 0.000 description 1
- 101000635895 Homo sapiens Myosin light chain 4 Proteins 0.000 description 1
- 101001022780 Homo sapiens Myosin light chain kinase, smooth muscle Proteins 0.000 description 1
- 101000613490 Homo sapiens Paired box protein Pax-3 Proteins 0.000 description 1
- 101001000631 Homo sapiens Peripheral myelin protein 22 Proteins 0.000 description 1
- 101001082860 Homo sapiens Peroxisomal membrane protein 2 Proteins 0.000 description 1
- 101000741790 Homo sapiens Peroxisome proliferator-activated receptor gamma Proteins 0.000 description 1
- 101000728117 Homo sapiens Plasma membrane calcium-transporting ATPase 4 Proteins 0.000 description 1
- 101000688582 Homo sapiens SH3 domain-containing kinase-binding protein 1 Proteins 0.000 description 1
- 101000881168 Homo sapiens SPARC Proteins 0.000 description 1
- 101000664408 Homo sapiens Sarcolemmal membrane-associated protein Proteins 0.000 description 1
- 101000835083 Homo sapiens Tissue factor pathway inhibitor 2 Proteins 0.000 description 1
- 101001137337 Homo sapiens Transcriptional activator protein Pur-alpha Proteins 0.000 description 1
- 101000760337 Homo sapiens Urokinase plasminogen activator surface receptor Proteins 0.000 description 1
- 235000003332 Ilex aquifolium Nutrition 0.000 description 1
- 241000209027 Ilex aquifolium Species 0.000 description 1
- 108060003951 Immunoglobulin Proteins 0.000 description 1
- 108010054477 Immunoglobulin Fab Fragments Proteins 0.000 description 1
- 102000001706 Immunoglobulin Fab Fragments Human genes 0.000 description 1
- 108010021625 Immunoglobulin Fragments Proteins 0.000 description 1
- 102000008394 Immunoglobulin Fragments Human genes 0.000 description 1
- 102000055031 Inhibitor of Apoptosis Proteins Human genes 0.000 description 1
- 102100024070 Inhibitor of growth protein 3 Human genes 0.000 description 1
- 108010034219 Insulin Receptor Substrate Proteins Proteins 0.000 description 1
- 102000009433 Insulin Receptor Substrate Proteins Human genes 0.000 description 1
- 102100025947 Insulin-like growth factor II Human genes 0.000 description 1
- 102000004372 Insulin-like growth factor binding protein 2 Human genes 0.000 description 1
- 108090000964 Insulin-like growth factor binding protein 2 Proteins 0.000 description 1
- 102000004371 Insulin-like growth factor binding protein 5 Human genes 0.000 description 1
- 108090000961 Insulin-like growth factor binding protein 5 Proteins 0.000 description 1
- 102100029180 Insulin-like growth factor-binding protein 6 Human genes 0.000 description 1
- 102100029228 Insulin-like growth factor-binding protein 7 Human genes 0.000 description 1
- 239000005551 L01XE03 - Erlotinib Substances 0.000 description 1
- 239000002136 L01XE07 - Lapatinib Substances 0.000 description 1
- 108700041567 MDR Genes Proteins 0.000 description 1
- FYYHWMGAXLPEAU-UHFFFAOYSA-N Magnesium Chemical compound [Mg] FYYHWMGAXLPEAU-UHFFFAOYSA-N 0.000 description 1
- 102000002151 Microfilament Proteins Human genes 0.000 description 1
- 101150097381 Mtor gene Proteins 0.000 description 1
- 102100030739 Myosin light chain 4 Human genes 0.000 description 1
- 102100035044 Myosin light chain kinase, smooth muscle Human genes 0.000 description 1
- 206010061309 Neoplasm progression Diseases 0.000 description 1
- 238000000636 Northern blotting Methods 0.000 description 1
- 108091028043 Nucleic acid sequence Proteins 0.000 description 1
- 206010033128 Ovarian cancer Diseases 0.000 description 1
- 206010061535 Ovarian neoplasm Diseases 0.000 description 1
- 238000012879 PET imaging Methods 0.000 description 1
- 102100040891 Paired box protein Pax-3 Human genes 0.000 description 1
- 238000010220 Pearson correlation analysis Methods 0.000 description 1
- 241001494479 Pecora Species 0.000 description 1
- 102000035195 Peptidases Human genes 0.000 description 1
- 108091005804 Peptidases Proteins 0.000 description 1
- 102100030564 Peroxisomal membrane protein 2 Human genes 0.000 description 1
- 102100038825 Peroxisome proliferator-activated receptor gamma Human genes 0.000 description 1
- 241000009328 Perro Species 0.000 description 1
- 102100029743 Plasma membrane calcium-transporting ATPase 4 Human genes 0.000 description 1
- 101000621511 Potato virus M (strain German) RNA silencing suppressor Proteins 0.000 description 1
- 239000004365 Protease Substances 0.000 description 1
- 102000001253 Protein Kinase Human genes 0.000 description 1
- 108091034057 RNA (poly(A)) Proteins 0.000 description 1
- 239000012979 RPMI medium Substances 0.000 description 1
- SDCUWFRXMLQNCS-LFAPAAFUSA-N RU 58668 Chemical compound C1([C@H]2C[C@]3([C@H]([C@H]4[C@H]2C2=CC=C(O)C=C2CC4)CC[C@@H]3O)C)=CC=C(OCCCCCS(=O)(=O)CCCC(F)(F)C(F)(F)F)C=C1 SDCUWFRXMLQNCS-LFAPAAFUSA-N 0.000 description 1
- 208000037323 Rare tumor Diseases 0.000 description 1
- 102100029986 Receptor tyrosine-protein kinase erbB-3 Human genes 0.000 description 1
- 101710100969 Receptor tyrosine-protein kinase erbB-3 Proteins 0.000 description 1
- 239000006146 Roswell Park Memorial Institute medium Substances 0.000 description 1
- 238000010847 SEQUEST Methods 0.000 description 1
- 102100024244 SH3 domain-containing kinase-binding protein 1 Human genes 0.000 description 1
- 108091006968 SLC35E3 Proteins 0.000 description 1
- 102100037599 SPARC Human genes 0.000 description 1
- 101100123851 Saccharomyces cerevisiae (strain ATCC 204508 / S288c) HER1 gene Proteins 0.000 description 1
- 102100038582 Sarcolemmal membrane-associated protein Human genes 0.000 description 1
- VYPSYNLAJGMNEJ-UHFFFAOYSA-N Silicium dioxide Chemical compound O=[Si]=O VYPSYNLAJGMNEJ-UHFFFAOYSA-N 0.000 description 1
- 108020004459 Small interfering RNA Proteins 0.000 description 1
- 206010068771 Soft tissue neoplasm Diseases 0.000 description 1
- 208000021712 Soft tissue sarcoma Diseases 0.000 description 1
- 102100030114 Solute carrier family 35 member E3 Human genes 0.000 description 1
- 108010017622 Somatomedin Receptors Proteins 0.000 description 1
- 102000004584 Somatomedin Receptors Human genes 0.000 description 1
- 102100024174 Syntaxin-7 Human genes 0.000 description 1
- 102000007614 Thrombospondin 1 Human genes 0.000 description 1
- 108010046722 Thrombospondin 1 Proteins 0.000 description 1
- IQFYYKKMVGJFEH-XLPZGREQSA-N Thymidine Chemical compound O=C1NC(=O)C(C)=CN1[C@@H]1O[C@H](CO)[C@@H](O)C1 IQFYYKKMVGJFEH-XLPZGREQSA-N 0.000 description 1
- 208000033781 Thyroid carcinoma Diseases 0.000 description 1
- 208000024770 Thyroid neoplasm Diseases 0.000 description 1
- 102100026134 Tissue factor pathway inhibitor 2 Human genes 0.000 description 1
- 102000003929 Transaminases Human genes 0.000 description 1
- 108090000340 Transaminases Proteins 0.000 description 1
- 102100035715 Transcriptional activator protein Pur-alpha Human genes 0.000 description 1
- 108090001012 Transforming Growth Factor beta Proteins 0.000 description 1
- 102100030742 Transforming growth factor beta-1 proprotein Human genes 0.000 description 1
- 102000004142 Trypsin Human genes 0.000 description 1
- 108090000631 Trypsin Proteins 0.000 description 1
- 108010040002 Tumor Suppressor Proteins Proteins 0.000 description 1
- 102000001742 Tumor Suppressor Proteins Human genes 0.000 description 1
- 102100024689 Urokinase plasminogen activator surface receptor Human genes 0.000 description 1
- 230000001594 aberrant effect Effects 0.000 description 1
- 230000002159 abnormal effect Effects 0.000 description 1
- 108091000387 actin binding proteins Proteins 0.000 description 1
- 238000007792 addition Methods 0.000 description 1
- 239000000654 additive Substances 0.000 description 1
- 230000001464 adherent effect Effects 0.000 description 1
- 229940009456 adriamycin Drugs 0.000 description 1
- 150000001299 aldehydes Chemical class 0.000 description 1
- 230000001668 ameliorated effect Effects 0.000 description 1
- 125000000539 amino acid group Chemical group 0.000 description 1
- 235000012538 ammonium bicarbonate Nutrition 0.000 description 1
- 239000001099 ammonium carbonate Substances 0.000 description 1
- 230000003321 amplification Effects 0.000 description 1
- 238000000540 analysis of variance Methods 0.000 description 1
- 230000003042 antagnostic effect Effects 0.000 description 1
- 230000008485 antagonism Effects 0.000 description 1
- 230000003527 anti-angiogenesis Effects 0.000 description 1
- 230000009949 anti-apoptotic pathway Effects 0.000 description 1
- 229940046836 anti-estrogen Drugs 0.000 description 1
- 230000001833 anti-estrogenic effect Effects 0.000 description 1
- 230000000692 anti-sense effect Effects 0.000 description 1
- 230000000259 anti-tumor effect Effects 0.000 description 1
- 239000000427 antigen Substances 0.000 description 1
- 108091007433 antigens Proteins 0.000 description 1
- 102000036639 antigens Human genes 0.000 description 1
- 229940041181 antineoplastic drug Drugs 0.000 description 1
- 239000003886 aromatase inhibitor Substances 0.000 description 1
- 238000003491 array Methods 0.000 description 1
- QVGXLLKOCUKJST-UHFFFAOYSA-N atomic oxygen Chemical compound [O] QVGXLLKOCUKJST-UHFFFAOYSA-N 0.000 description 1
- 230000003190 augmentative effect Effects 0.000 description 1
- 230000006399 behavior Effects 0.000 description 1
- IQFYYKKMVGJFEH-UHFFFAOYSA-N beta-L-thymidine Natural products O=C1NC(=O)C(C)=CN1C1OC(CO)C(O)C1 IQFYYKKMVGJFEH-UHFFFAOYSA-N 0.000 description 1
- 238000003236 bicinchoninic acid assay Methods 0.000 description 1
- 230000004071 biological effect Effects 0.000 description 1
- 230000008512 biological response Effects 0.000 description 1
- 230000015572 biosynthetic process Effects 0.000 description 1
- 210000001185 bone marrow Anatomy 0.000 description 1
- 210000000481 breast Anatomy 0.000 description 1
- 229910052791 calcium Inorganic materials 0.000 description 1
- 239000011575 calcium Substances 0.000 description 1
- 230000008777 canonical pathway Effects 0.000 description 1
- 238000004850 capillary HPLC Methods 0.000 description 1
- 239000004202 carbamide Substances 0.000 description 1
- 150000001720 carbohydrates Chemical class 0.000 description 1
- 239000001569 carbon dioxide Substances 0.000 description 1
- 229910002092 carbon dioxide Inorganic materials 0.000 description 1
- 230000021164 cell adhesion Effects 0.000 description 1
- 230000006369 cell cycle progression Effects 0.000 description 1
- 230000009087 cell motility Effects 0.000 description 1
- 230000001413 cellular effect Effects 0.000 description 1
- 208000019065 cervical carcinoma Diseases 0.000 description 1
- 229960005395 cetuximab Drugs 0.000 description 1
- USVCWSAJUAARAL-MEMLXQNLSA-N chembl551064 Chemical compound C1=2C(N)=NC=NC=2N([C@@H]2C[C@H](C2)N2CCC2)C=C1C(C=1)=CC=CC=1OCC1=CC=CC=C1 USVCWSAJUAARAL-MEMLXQNLSA-N 0.000 description 1
- 230000035572 chemosensitivity Effects 0.000 description 1
- 230000000973 chemotherapeutic effect Effects 0.000 description 1
- 230000005929 chemotherapeutic response Effects 0.000 description 1
- 238000000546 chi-square test Methods 0.000 description 1
- WORJEOGGNQDSOE-UHFFFAOYSA-N chloroform;methanol Chemical compound OC.ClC(Cl)Cl WORJEOGGNQDSOE-UHFFFAOYSA-N 0.000 description 1
- 210000000349 chromosome Anatomy 0.000 description 1
- 239000000356 contaminant Substances 0.000 description 1
- 238000012937 correction Methods 0.000 description 1
- 239000012228 culture supernatant Substances 0.000 description 1
- 210000004748 cultured cell Anatomy 0.000 description 1
- 238000012258 culturing Methods 0.000 description 1
- 210000004292 cytoskeleton Anatomy 0.000 description 1
- 230000001086 cytosolic effect Effects 0.000 description 1
- 239000002254 cytotoxic agent Substances 0.000 description 1
- 231100000599 cytotoxic agent Toxicity 0.000 description 1
- 238000007405 data analysis Methods 0.000 description 1
- 238000012217 deletion Methods 0.000 description 1
- 230000037430 deletion Effects 0.000 description 1
- 238000001514 detection method Methods 0.000 description 1
- 238000001784 detoxification Methods 0.000 description 1
- 238000003745 diagnosis Methods 0.000 description 1
- 230000029087 digestion Effects 0.000 description 1
- 208000035475 disorder Diseases 0.000 description 1
- 238000002224 dissection Methods 0.000 description 1
- 238000009826 distribution Methods 0.000 description 1
- 230000003828 downregulation Effects 0.000 description 1
- 229960004679 doxorubicin Drugs 0.000 description 1
- 229940000406 drug candidate Drugs 0.000 description 1
- 238000007876 drug discovery Methods 0.000 description 1
- 238000002651 drug therapy Methods 0.000 description 1
- 230000004064 dysfunction Effects 0.000 description 1
- 230000002900 effect on cell Effects 0.000 description 1
- 239000003480 eluent Substances 0.000 description 1
- 239000002158 endotoxin Substances 0.000 description 1
- 230000002255 enzymatic effect Effects 0.000 description 1
- 230000004076 epigenetic alteration Effects 0.000 description 1
- 229960001433 erlotinib Drugs 0.000 description 1
- AAKJLRGGTJKAMG-UHFFFAOYSA-N erlotinib Chemical compound C=12C=C(OCCOC)C(OCCOC)=CC2=NC=NC=1NC1=CC=CC(C#C)=C1 AAKJLRGGTJKAMG-UHFFFAOYSA-N 0.000 description 1
- 239000000328 estrogen antagonist Substances 0.000 description 1
- 210000003527 eukaryotic cell Anatomy 0.000 description 1
- 230000008622 extracellular signaling Effects 0.000 description 1
- 229940087861 faslodex Drugs 0.000 description 1
- 230000002349 favourable effect Effects 0.000 description 1
- 238000000684 flow cytometry Methods 0.000 description 1
- 125000002485 formyl group Chemical group [H]C(*)=O 0.000 description 1
- 229960002258 fulvestrant Drugs 0.000 description 1
- 230000004927 fusion Effects 0.000 description 1
- 210000004602 germ cell Anatomy 0.000 description 1
- 230000013595 glycosylation Effects 0.000 description 1
- 238000006206 glycosylation reaction Methods 0.000 description 1
- 239000003102 growth factor Substances 0.000 description 1
- 210000003780 hair follicle Anatomy 0.000 description 1
- 206010073071 hepatocellular carcinoma Diseases 0.000 description 1
- 231100000844 hepatocellular carcinoma Toxicity 0.000 description 1
- 238000009396 hybridization Methods 0.000 description 1
- 208000026278 immune system disease Diseases 0.000 description 1
- 238000003018 immunoassay Methods 0.000 description 1
- 238000003119 immunoblot Methods 0.000 description 1
- 230000002163 immunogen Effects 0.000 description 1
- 102000018358 immunoglobulin Human genes 0.000 description 1
- 229940072221 immunoglobulins Drugs 0.000 description 1
- 238000003364 immunohistochemistry Methods 0.000 description 1
- 238000010348 incorporation Methods 0.000 description 1
- 238000011534 incubation Methods 0.000 description 1
- 230000006698 induction Effects 0.000 description 1
- 230000000977 initiatory effect Effects 0.000 description 1
- 108010008598 insulin-like growth factor binding protein-related protein 1 Proteins 0.000 description 1
- 230000002452 interceptive effect Effects 0.000 description 1
- 230000009545 invasion Effects 0.000 description 1
- 229960004891 lapatinib Drugs 0.000 description 1
- BCFGMOOMADDAQU-UHFFFAOYSA-N lapatinib Chemical compound O1C(CNCCS(=O)(=O)C)=CC=C1C1=CC=C(N=CN=C2NC=3C=C(Cl)C(OCC=4C=C(F)C=CC=4)=CC=3)C2=C1 BCFGMOOMADDAQU-UHFFFAOYSA-N 0.000 description 1
- 201000005264 laryngeal carcinoma Diseases 0.000 description 1
- 229960003881 letrozole Drugs 0.000 description 1
- HPJKCIUCZWXJDR-UHFFFAOYSA-N letrozole Chemical compound C1=CC(C#N)=CC=C1C(N1N=CN=C1)C1=CC=C(C#N)C=C1 HPJKCIUCZWXJDR-UHFFFAOYSA-N 0.000 description 1
- 230000000670 limiting effect Effects 0.000 description 1
- 230000029226 lipidation Effects 0.000 description 1
- 229920006008 lipopolysaccharide Chemical class 0.000 description 1
- 239000007788 liquid Substances 0.000 description 1
- 238000011068 loading method Methods 0.000 description 1
- 208000037841 lung tumor Diseases 0.000 description 1
- 239000006166 lysate Substances 0.000 description 1
- 229910052749 magnesium Inorganic materials 0.000 description 1
- 239000011777 magnesium Substances 0.000 description 1
- 201000010893 malignant breast melanoma Diseases 0.000 description 1
- 208000006178 malignant mesothelioma Diseases 0.000 description 1
- 201000005282 malignant pleural mesothelioma Diseases 0.000 description 1
- 239000003550 marker Substances 0.000 description 1
- 238000001819 mass spectrum Methods 0.000 description 1
- 230000002503 metabolic effect Effects 0.000 description 1
- 230000021592 metal ion homeostasis Effects 0.000 description 1
- 230000001394 metastastic effect Effects 0.000 description 1
- 206010061289 metastatic neoplasm Diseases 0.000 description 1
- 238000012775 microarray technology Methods 0.000 description 1
- 230000005012 migration Effects 0.000 description 1
- 238000013508 migration Methods 0.000 description 1
- 230000002297 mitogenic effect Effects 0.000 description 1
- 238000002156 mixing Methods 0.000 description 1
- 150000002772 monosaccharides Chemical class 0.000 description 1
- 230000004899 motility Effects 0.000 description 1
- 238000011228 multimodal treatment Methods 0.000 description 1
- 230000031942 natural killer cell mediated cytotoxicity Effects 0.000 description 1
- 208000002154 non-small cell lung carcinoma Diseases 0.000 description 1
- 238000003199 nucleic acid amplification method Methods 0.000 description 1
- 210000004940 nucleus Anatomy 0.000 description 1
- 238000002966 oligonucleotide array Methods 0.000 description 1
- 102000027450 oncoproteins Human genes 0.000 description 1
- 108091008819 oncoproteins Proteins 0.000 description 1
- 230000004792 oxidative damage Effects 0.000 description 1
- 229910052760 oxygen Inorganic materials 0.000 description 1
- 239000001301 oxygen Substances 0.000 description 1
- 230000008506 pathogenesis Effects 0.000 description 1
- 230000035778 pathophysiological process Effects 0.000 description 1
- 239000008188 pellet Substances 0.000 description 1
- 210000003819 peripheral blood mononuclear cell Anatomy 0.000 description 1
- 230000002974 pharmacogenomic effect Effects 0.000 description 1
- 229910052697 platinum Inorganic materials 0.000 description 1
- 229920000642 polymer Polymers 0.000 description 1
- 102000054765 polymorphisms of proteins Human genes 0.000 description 1
- 238000010837 poor prognosis Methods 0.000 description 1
- 230000003389 potentiating effect Effects 0.000 description 1
- 238000007781 pre-processing Methods 0.000 description 1
- 238000011045 prefiltration Methods 0.000 description 1
- 238000002360 preparation method Methods 0.000 description 1
- 239000000047 product Substances 0.000 description 1
- 239000000092 prognostic biomarker Substances 0.000 description 1
- 230000002062 proliferating effect Effects 0.000 description 1
- 230000001737 promoting effect Effects 0.000 description 1
- 108060006633 protein kinase Proteins 0.000 description 1
- 230000005855 radiation Effects 0.000 description 1
- 238000001959 radiotherapy Methods 0.000 description 1
- 230000003938 response to stress Effects 0.000 description 1
- 230000004043 responsiveness Effects 0.000 description 1
- 230000002441 reversible effect Effects 0.000 description 1
- 210000003296 saliva Anatomy 0.000 description 1
- 150000003839 salts Chemical class 0.000 description 1
- 238000007423 screening assay Methods 0.000 description 1
- 230000009758 senescence Effects 0.000 description 1
- 238000000926 separation method Methods 0.000 description 1
- 238000012163 sequencing technique Methods 0.000 description 1
- 210000003491 skin Anatomy 0.000 description 1
- 238000002415 sodium dodecyl sulfate polyacrylamide gel electrophoresis Methods 0.000 description 1
- 230000037439 somatic mutation Effects 0.000 description 1
- 238000001228 spectrum Methods 0.000 description 1
- 230000000638 stimulation Effects 0.000 description 1
- 238000006467 substitution reaction Methods 0.000 description 1
- 230000004654 survival pathway Effects 0.000 description 1
- 230000009885 systemic effect Effects 0.000 description 1
- 201000002510 thyroid cancer Diseases 0.000 description 1
- 208000013077 thyroid gland carcinoma Diseases 0.000 description 1
- 239000003104 tissue culture media Substances 0.000 description 1
- 230000009466 transformation Effects 0.000 description 1
- 239000012588 trypsin Substances 0.000 description 1
- 230000005751 tumor progression Effects 0.000 description 1
- 239000000225 tumor suppressor protein Substances 0.000 description 1
- 108010002164 tyrosine receptor Proteins 0.000 description 1
- 230000003827 upregulation Effects 0.000 description 1
- 210000002700 urine Anatomy 0.000 description 1
- 239000003643 water by type Substances 0.000 description 1
Classifications
-
- C—CHEMISTRY; METALLURGY
- C12—BIOCHEMISTRY; BEER; SPIRITS; WINE; VINEGAR; MICROBIOLOGY; ENZYMOLOGY; MUTATION OR GENETIC ENGINEERING
- C12Q—MEASURING OR TESTING PROCESSES INVOLVING ENZYMES, NUCLEIC ACIDS OR MICROORGANISMS; COMPOSITIONS OR TEST PAPERS THEREFOR; PROCESSES OF PREPARING SUCH COMPOSITIONS; CONDITION-RESPONSIVE CONTROL IN MICROBIOLOGICAL OR ENZYMOLOGICAL PROCESSES
- C12Q1/00—Measuring or testing processes involving enzymes, nucleic acids or microorganisms; Compositions therefor; Processes of preparing such compositions
- C12Q1/68—Measuring or testing processes involving enzymes, nucleic acids or microorganisms; Compositions therefor; Processes of preparing such compositions involving nucleic acids
- C12Q1/6876—Nucleic acid products used in the analysis of nucleic acids, e.g. primers or probes
- C12Q1/6883—Nucleic acid products used in the analysis of nucleic acids, e.g. primers or probes for diseases caused by alterations of genetic material
- C12Q1/6886—Nucleic acid products used in the analysis of nucleic acids, e.g. primers or probes for diseases caused by alterations of genetic material for cancer
-
- C—CHEMISTRY; METALLURGY
- C12—BIOCHEMISTRY; BEER; SPIRITS; WINE; VINEGAR; MICROBIOLOGY; ENZYMOLOGY; MUTATION OR GENETIC ENGINEERING
- C12Q—MEASURING OR TESTING PROCESSES INVOLVING ENZYMES, NUCLEIC ACIDS OR MICROORGANISMS; COMPOSITIONS OR TEST PAPERS THEREFOR; PROCESSES OF PREPARING SUCH COMPOSITIONS; CONDITION-RESPONSIVE CONTROL IN MICROBIOLOGICAL OR ENZYMOLOGICAL PROCESSES
- C12Q2600/00—Oligonucleotides characterized by their use
- C12Q2600/118—Prognosis of disease development
-
- C—CHEMISTRY; METALLURGY
- C12—BIOCHEMISTRY; BEER; SPIRITS; WINE; VINEGAR; MICROBIOLOGY; ENZYMOLOGY; MUTATION OR GENETIC ENGINEERING
- C12Q—MEASURING OR TESTING PROCESSES INVOLVING ENZYMES, NUCLEIC ACIDS OR MICROORGANISMS; COMPOSITIONS OR TEST PAPERS THEREFOR; PROCESSES OF PREPARING SUCH COMPOSITIONS; CONDITION-RESPONSIVE CONTROL IN MICROBIOLOGICAL OR ENZYMOLOGICAL PROCESSES
- C12Q2600/00—Oligonucleotides characterized by their use
- C12Q2600/158—Expression markers
Definitions
- the present invention relates generally to the field of pharmacogenomics, and more specifically, to methods and procedures used to monitor response or determine sensitivity in patients to allow the identification of individualized genetic profiles which will aid in treating diseases and disorders.
- Cancer is a disease with extensive histoclinical heterogeneity. Although conventional histological and clinical features have been correlated to prognosis, the same apparent prognostic type of tumors varies widely in its responsiveness to therapy and consequent survival of the patient. New prognostic and predictive markers, which would facilitate an individualization of therapy for each patient, are needed to accurately predict patient response to treatments, such as small molecule or biological molecule drugs, in the clinic. The problem may be solved by the identification of new parameters that could better predict the patient's sensitivity to treatment. The classification of patient samples is a crucial aspect of cancer diagnosis and treatment.
- the association of a patient's response to a treatment with molecular and genetic markers can open up new opportunities for treatment development in non-responding patients, or distinguish a treatment's indication among other treatment choices because of higher confidence in the efficacy. Further, the pre-selection of patients who are likely to respond well to a medicine, drug, or combination therapy may reduce the number of patients needed in a clinical study or accelerate the time needed to complete a clinical development program (M. Cockett et al, Current Opinion in Biotechnology, 11 :602-609 (2000)).
- PCT Application No. PCT/US2006/034201 provides biomarkers useful for identifying a mammal that will respond therapeutically to a method of treating cancer comprising administering an IGFlR modulator.
- the invention provides methods and procedures for determining patient sensitivity or monitor response at the molecular level to one or more insulin growth factor 1 receptor (IGFlR) modulators.
- the invention also provides methods of determining or predicting whether an individual requiring therapy for a disease state such as cancer will or will not respond to treatment, prior to administration of the treatment, wherein the treatment comprises administration of one or more IGFlR modulators.
- the one or more IGFlR modulators are compounds that can be selected from, for example, one or more IGFlR specific ligands, one or more small molecule IGFlR inhibitors, or one or more IGFlR binding monoclonal antibodies.
- the invention provides a method for predicting the likelihood a mammal will respond therapeutically to a method of treating cancer comprising administering an IGFlR modulator, wherein the method comprises: (a) measuring in the mammal the level of at least one biomarker selected from the biomarkers of Tables 2-8; (b) exposing a biological sample from said mammal to the IGFlR modulator; (c) following the exposing of step (b), measuring in said biological sample the level of the at least one biomarker, wherein an increase in the level of the at least one biomarker measured in step (c) compared to the level of the at least one biomarker measured in step (a), indicates an increased likelihood that the mammal will respond therapeutically to said method of treating cancer when said at least one biomarker is a sensitivity biomarker, and indicates an increased likelihood that the mammal will not respond therapeutically to said method of treating cancer when said at least one biomarker is a resistance biomarker.
- the invention provides a method for identifying a mammal that will respond therapeutically to a method of treating cancer comprising administering an IGFlR modulator, wherein the method comprises: (a) measuring in the mammal the level of at least one biomarker selected from the biomarkers of Tables 2-8; (b) exposing a biological sample from the mammal to the IGFlR modulator; (c) following the exposing in step (b), measuring in said biological sample the level of the at least one biomarker and using said measurement to determine whether the mammal is likely to respond therapeutically to said method of treating cancer.
- a difference in the level of the biomarker that is sufficient to indicate whether the mammal will or will not respond therapeutically to the method of treating cancer can be readily determined by one of skill in the art using known techniques.
- the increase or decrease in the level of the biomarker can be correlated to determine whether the difference is sufficient to identify a mammal that will respond therapeutically.
- the difference in the level of the biomarker that is sufficient can, in one aspect, be predetermined prior to determining whether the mammal will respond therapeutically to the treatment.
- the difference in the level of the biomarker is a difference in the mRNA level (measured, for example, by RT-PCR or a microarray), such as at least a two-fold difference, at least a three-fold difference, or at least a four- fold difference in the level of expression.
- the difference in the level of the biomarker is determined by IHC.
- the difference in the level of the biomarker refers to a p-value of ⁇ 0.05 in Anova analysis.
- the difference is determined in an ELISA assay.
- respond therapeutically refers to the alleviation or abrogation of the cancer. This means that the life expectancy of an individual affected with the cancer will be increased or that one or more of the symptoms of the cancer will be reduced or ameliorated.
- the term encompasses a reduction in cancerous cell growth or tumor volume. Whether a mammal responds therapeutically can be measured by many methods well known in the art, such as PET imaging.
- the mammal can be, for example, a human, rat, mouse, dog rabbit, pig sheep, cow, horse, cat, primate, or monkey.
- the method of the invention can be, for example, an in vitro method wherein the step of measuring in the mammal the level of at least one biomarker comprises taking a biological sample from the mammal and then measuring the level of the biomarker(s) in the biological sample.
- the biological sample can comprise, for example, at least one of serum, whole fresh blood, peripheral blood mononuclear cells, frozen whole blood, fresh plasma, frozen plasma, urine, saliva, skin, hair follicle, bone marrow, or tumor tissue.
- the level of the at least one biomarker can be, for example, the level of protein and/or mRNA transcript of the biomarker(s).
- the invention provides a method for identifying a mammal that will respond therapeutically to a method of treating cancer comprising administering an IGFlR modulator, wherein the method comprises: (a) exposing a biological sample from the mammal to the IGFlR modulator; (b) following the exposing of step (a), measuring in said biological sample the level of at least one biomarker selected from the biomarkers of Tables 2-8, wherein a difference in the level of the at least one biomarker measured in step (b), compared to the level of the biomarker in a mammal that has not been exposed to said IGFlR modulator, indicates that the mammal will respond therapeutically to said method of treating cancer.
- the invention provides a method for testing or predicting whether a mammal will respond therapeutically to a method of treating cancer comprising administering an IGFlR modulator, wherein the method comprises: (a) measuring in the mammal the level of at least one biomarker selected from the biomarkers of Tables 2-8; (b) exposing the mammal to the IGFlR modulator; (c) following the exposing of step (b), measuring in the mammal the level of the at least one biomarker, wherein a difference in the level of the at least one biomarker measured in step (c) compared to the level of the at least one biomarker measured in step (a) indicates that the mammal will respond therapeutically to said method of treating cancer.
- the invention provides a method for determining whether a compound inhibits IGFlR activity in a mammal, comprising: (a) exposing the mammal to the compound; and (b) following the exposing of step (a), measuring in the mammal the level of at least one biomarker selected from the biomarkers of Tables 2-8, wherein a difference in the level of said biomarker measured in step (b), compared to the level of the biomarker in a mammal that has not been exposed to said compound, indicates that the compound inhibits IGFlR activity in the mammal.
- the invention provides a method for determining whether a mammal has been exposed to a compound that inhibits IGFlR activity, comprising (a) exposing the mammal to the compound; and (b) following the exposing of step (a), measuring in the mammal the level of at least one biomarker selected from the biomarkers of Tables 2-8, wherein a difference in the level of said biomarker measured in step (b), compared to the level of the biomarker in a mammal that has not been exposed to said compound, indicates that the mammal has been exposed to a compound that inhibits IGFlR activity.
- the invention provides a method for determining whether a mammal is responding to a compound that inhibits IGFlR activity, comprising (a) exposing the mammal to the compound; and (b) following the exposing of step (a), measuring in the mammal the level of at least one biomarker selected from the biomarkers of Tables 2-8, wherein a difference in the level of the at least one biomarker measured in step (b), compared to the level of the at least one biomarker in a mammal that has not been exposed to said compound, indicates that the mammal is responding to the compound that inhibits IGFlR activity.
- responding encompasses responding by way of a biological and cellular response, as well as a clinical response (such as improved symptoms, a therapeutic effect, or an adverse event), in a mammal
- the invention also provides an isolated biomarker selected from the biomarkers of Tables 2-8.
- the biomarkers of the invention comprise sequences selected from the nucleotide and amino acid sequences provided in Tables 2-8 and the Sequence Listing, as well as fragments and variants thereof.
- the invention also provides a biomarker set comprising two or more biomarkers selected from the biomarkers of Tables 2-8.
- the invention also provides kits for determining or predicting whether a patient would be susceptible or resistant to a treatment that comprises one or more IGFlR modulators.
- the patient may have a cancer or tumor such as, for example, a colon cancer or tumor.
- the kit comprises a suitable container that comprises one or more specialized microarrays of the invention, one or more IGFlR modulators for use in testing cells from patient tissue specimens or patient samples, and instructions for use.
- the kit may further comprise reagents or materials for monitoring the expression of a biomarker set at the level of mRNA or protein.
- the invention provides a kit comprising two or more biomarkers selected from the biomarkers of Tables 2-8.
- the invention provides a kit comprising at least one of an antibody and a nucleic acid for detecting the presence of at least one of the biomarkers selected from the biomarkers of Tables 2-8.
- the kit further comprises instructions for determining whether or not a mammal will respond therapeutically to a method of treating cancer comprising administering a compound that inhibits IGFlR activity.
- the instructions comprise the steps of (a) measuring in the mammal the level of at least one biomarker selected from the biomarkers of Tables 2-8, (b) exposing the mammal to the compound, (c) following the exposing of step (b), measuring in the mammal the level of the at least one biomarker, wherein a difference in the level of the at least one biomarker measured in step (c) compared to the level of the at least one biomarker measured in step (a) indicates that the mammal will respond therapeutically to said method of treating cancer.
- the invention also provides screening assays for determining if a patient will be susceptible or resistant to treatment with one or more IGFlR modulators.
- the invention also provides a method of monitoring the treatment of a patient having a disease, wherein said disease is treated by a method comprising administering one or more IGFlR modulators.
- the invention also provides individualized genetic profiles which are necessary to treat diseases and disorders based on patient response at a molecular level.
- the invention also provides specialized microarrays, e.g., oligonucleotide microarrays or cDNA microarrays, comprising one or more biomarkers having expression profiles that correlate with either sensitivity or resistance to one or more IGFlR modulators.
- the invention also provides antibodies, including polyclonal or monoclonal, directed against one or more biomarkers of the invention.
- Embodiments of the invention include measuring changes in the levels of secreted proteins, or plasma biomarkers, which represent one category of biomarker.
- plasma samples which represent a readily accessible source of material, serve as surrogate tissue for biomarker analysis.
- the invention provides biomarkers that respond to the modulation of a specific signal transduction pathway and also correlate with IGFlR modulator sensitivity or resistance. These biomarkers can be employed for predicting and monitoring response to one or more IGFlR modulators.
- the biomarkers of the invention are those provided in Tables 2-8 and the Sequence Listing, including both polynucleotide and polypeptide sequences.
- the biomarkers of the invention are nucleotide sequences that, due to the degeneracy of the genetic code, encodes for a polypeptide sequence provided in the sequence listing. The biomarkers serve as useful molecular tools for predicting and monitoring response to IGFlR modulators that affect IGFlR activity or the IGFlR signal transduction pathway.
- IGFlR insulin-like growth factor receptor
- PI3K-Akt/mTor insulin-like growth factor receptor
- IGFlR overexpression and/or enhanced activity have been observed in diverse tumor types suggesting that the potential therapeutic use of agents targeting this pathway is broad.
- IGFlR provides a critical survival signal in multiple tumor types. The expression of this receptor is an indicator of poor prognosis, thus, it has emerged as an attractive and compelling target for cancer therapy to inhibit the progression of multiple tumor types in cancer patients.
- Various drug discovery approaches have been explored in recent years to modulate the function of IGFlR. Approaches aimed at the reduction of receptor number or enzymatic activity using a variety of strategies in preclinical models have been shown to reverse the malignant phenotype in tumor cells. These strategies include antisense (L.
- cultured cancer cell lines can be used as models to identify biomarkers that correlate with response to a therapy assuming these markers identified in vitro are ultimately applicable in clinical studies to select targeted patient population.
- gene expression profiles of a pair of sensitive and acquired resistant cell lines were compared to identify genes correlated with the acquired resistance. These genes were then compared to the genes over expressed in the resistant cell lines at basal level (correlated with the de novo resistance to the drug). Common mechanism of de novo resistance and acquired resistance to IGFlR inhibitor compound 1 was explored. Furthermore, genes/proteins modulated by drug treatment of compound 1 were identified and linked to the possible mechanisms of the drug action. These markers could be useful to monitor the biological effects of the drug and to select the optimal dose in the clinical studies.
- IGFlR modulator is intended to mean a compound or drug that is a biological molecule or a small molecule that directly or indirectly modulates IGFlR activity or the IGFlR signal transduction pathway.
- compounds or drugs as used herein is intended to include both small molecules and biological molecules.
- Direct or indirect modulation includes activation or inhibition of IGFlR activity or the IGFlR signal transduction pathway.
- inhibition refers to inhibition of the binding of IGFlR to an IGFlR ligand such as, for example, VEGF.
- inhibition refers to inhibition of the kinase activity of IGF IR.
- IGFlR modulators include, for example, IGFlR specific ligands, small molecule IGFlR inhibitors, and IGFlR monoclonal antibodies.
- the IGF 1 R modulator inhibits IGF 1 R activity and/or inhibits the IGF 1 R signal transduction pathway.
- the IGFlR modulator is an IGFlR monoclonal antibody that inhibits IGFlR activity and/or inhibits the IGFlR signal transduction pathway.
- IGFlR modulators include biological molecules or small molecules.
- Biological molecules include all lipids and polymers of monosaccharides, amino acids, and nucleotides having a molecular weight greater than 450.
- biological molecules include, for example, oligosaccharides and polysaccharides; oligopeptides, polypeptides, peptides, and proteins; and oligonucleotides and polynucleotides.
- Oligonucleotides and polynucleotides include, for example, DNA and RNA.
- Biological molecules further include derivatives of any of the molecules described above.
- derivatives of biological molecules include lipid and glycosylation derivatives of oligopeptides, polypeptides, peptides, and proteins.
- Derivatives of biological molecules further include lipid derivatives of oligosaccharides and polysaccharides, e.g., lipopolysaccharides.
- biological molecules are antibodies, or functional equivalents of antibodies.
- Functional equivalents of antibodies have binding characteristics comparable to those of antibodies, and inhibit the growth of cells that express IGFlR.
- Such functional equivalents include, for example, chimerized, humanized, and single chain antibodies as well as fragments thereof.
- Functional equivalents of antibodies also include polypeptides with amino acid sequences substantially the same as the amino acid sequence of the variable or hypervariable regions of the antibodies.
- An amino acid sequence that is substantially the same as another sequence, but that differs from the other sequence by means of one or more substitutions, additions, and/or deletions, is considered to be an equivalent sequence.
- Preferably, less than 50%, more preferably less than 25%, and still more preferably less than 10%, of the number of amino acid residues in a sequence are substituted for, added to, or deleted from the protein.
- the functional equivalent of an antibody is preferably a chimerized or humanized antibody.
- a chimerized antibody comprises the variable region of a non- human antibody and the constant region of a human antibody.
- a humanized antibody comprises the hypervariable region (CDRs) of a non-human antibody.
- the variable region other than the hypervariable region, e.g., the framework variable region, and the constant region of a humanized antibody are those of a human antibody.
- Suitable variable and hypervariable regions of non-human antibodies may be derived from antibodies produced by any non-human mammal in which monoclonal antibodies are made. Suitable examples of mammals other than humans include, for example, rabbits, rats, mice, horses, goats, or primates.
- Functional equivalents further include fragments of antibodies that have binding characteristics that are the same as, or are comparable to, those of the whole antibody.
- Suitable fragments of the antibody include any fragment that comprises a sufficient portion of the hypervariable (i.e., complementarity determining) region to bind specifically, and with sufficient affinity, to IGFlR tyrosine kinase to inhibit growth of cells that express such receptors.
- Such fragments may, for example, contain one or both Fab fragments or the F(ab')2 fragment.
- the antibody fragments may contain all six complementarity determining regions of the whole antibody, although functional fragments containing fewer than all of such regions, such as three, four, or five CDRs, are also included.
- the fragments are single chain antibodies, or Fv fragments.
- Single chain antibodies are polypeptides that comprise at least the variable region of the heavy chain of the antibody linked to the variable region of the light chain, with or without an interconnecting linker.
- Fv fragment comprises the entire antibody combining site.
- These chains may be produced in bacteria or in eukaryotic cells.
- the antibodies and functional equivalents may be members of any class of immunoglobulins, such as IgG, IgM, IgA, IgD, or IgE, and the subclasses thereof.
- the antibodies are members of the IgGl subclass.
- the functional equivalents may also be equivalents of combinations of any of the above classes and subclasses.
- the IGFlR antibody is provided in PCT publication nos. WO2005/016970, WO02/53596, WO2004/71529, WO2005/16967, WO2004/83248, WO03/106621, WO03/100008, WO03/59951, WO2004/87756, or WO2005/05635.
- the IGFlR modulator is derived from fibronectin, such as an
- AdNectin (Adnexus Therapeutics) (See, PCT publication nos. WO00/34784, WOO 1/64942, WO02/32925).
- the IGFlR modulators useful in the invention may also be small molecules. Any molecule that is not a biological molecule is considered herein to be a small molecule. Some examples of small molecules include organic compounds, organometallic compounds, salts of organic and organometallic compounds, saccharides, amino acids, and nucleotides. Small molecules further include molecules that would otherwise be considered biological molecules, except their molecular weight is not greater than 450. Thus, small molecules may be lipids, oligosaccharides, oligopeptides, and oligonucleotides and their derivatives, having a molecular weight of 450 or less. It is emphasized that small molecules can have any molecular weight.
- the IGFlR modulator is a small molecule that inhibits the growth of tumor cells that express IGFlR. In another embodiment, the IGFlR modulator is a small molecule that inhibits the growth of refractory tumor cells that express IGFlR.
- the IGFlR modulator is selected from PCT publication nos.
- the IGFlR modulator is selected from (S)-4-(2-(3- chlorophenyl)-2-hydroxyethylamino)-3-(4-methyl-6-morpholino-lH- benzo [ ⁇ i]imidazol-2-yl)-pyridin-2( 1 - ⁇ )-one and (2S)-I -(4-((5 -cyclopropyl- 1 H- pyrazol-3-yl)amino)pyrrolo[2,l-f][l,2,4]triazin-2-yl)-N-(6-fluoro-3-pyridinyl)-2- methyl-2-pyrrolidinecarboxamide.
- the IGFlR modulator is selected from XL-228 (Exelixis), AEW-541 (Novartis), and OSI-906 (OSI).
- BIOMARKERS AND BIOMARKER SETS
- the invention includes individual biomarkers and biomarker sets having both diagnostic and prognostic value in disease areas in which signaling through IGFlR or the IGFlR pathway is of importance, e.g., in cancers or tumors, in immunological disorders, conditions or dysfunctions, or in disease states in which cell signaling and/or cellular proliferation controls are abnormal or aberrant.
- the biomarker sets comprise a plurality of biomarkers such as, for example, a plurality of the biomarkers provided in Tables 2-8 that highly correlate with resistance or sensitivity to one or more IGFlR modulators.
- the biomarkers and biomarker sets of the invention enable one to predict or reasonably foretell the likely effect of one or more IGFlR modulators in different biological systems or for cellular responses.
- the biomarkers and biomarker sets can be used in in vitro assays of IGFlR modulator response by test cells to predict in vivo outcome.
- the various biomarkers and biomarker sets described herein, or the combination of these biomarker sets with other biomarkers or markers can be used, for example, to predict and monitor how patients with cancer might respond to therapeutic intervention with one or more IGFlR modulators.
- a biomarker and biomarker set of cellular gene expression patterns correlating with sensitivity or resistance of cells following exposure of the cells to one or more IGFlR modulators provides a useful tool for screening one or more tumor samples before treatment with the IGFlR modulator.
- the screening allows a prediction of cells of a tumor sample exposed to one or more IGFlR modulators, based on the expression results of the biomarker and biomarker set, as to whether or not the tumor, and hence a patient harboring the tumor, will or will not respond to treatment with the IGFlR modulator.
- the biomarker or biomarker set can also be used as described herein for monitoring the progress of disease treatment or therapy in those patients undergoing treatment for a disease involving an IGFlR modulator.
- the biomarkers also serve as targets for the development of therapies for disease treatment. Such targets may be particularly applicable to treatment of cancer, such as, for example, hepatocellular carcinoma, colorectal cancer (CRC), NSCLC, and metastatic breast cancer.
- cancer such as, for example, hepatocellular carcinoma, colorectal cancer (CRC), NSCLC, and metastatic breast cancer.
- biomarkers are differentially expressed in sensitive and resistant cells, their expression patterns are correlated with relative intrinsic sensitivity of cells to treatment with IGFlR modulators. Accordingly, the biomarkers highly expressed in resistant cells may serve as targets for the development of new therapies for the tumors which are resistant to IGFlR modulators, particularly IGFlR inhibitors.
- the level of biomarker protein and/or mRNA can be determined using methods well known to those skilled in the art. For example, quantification of protein can be carried out using methods such as ELISA, 2-dimensional SDS PAGE, Western blot, immunopreciptation, immunohistochemistry, fluorescence activated cell sorting (FACS), or flow cytometry. Quantification of mRNA can be carried out using methods such as PCR, array hybridization, Northern blot, in-situ hybridization, dot- blot, Taqman, or RNAse protection assay.
- the invention also includes specialized microarrays, e.g., oligonucleotide microarrays or cDNA microarrays, comprising one or more biomarkers, showing expression profiles that correlate with either sensitivity or resistance to one or more IGFlR modulators.
- microarrays can be employed in in vitro assays for assessing the expression level of the biomarkers in the test cells from tumor biopsies, and determining whether these test cells are likely to be resistant or sensitive to
- a specialized microarray can be prepared using all the biomarkers, or subsets thereof, as described herein and shown in Tables 2-8.
- Cells from a tissue or organ biopsy can be isolated and exposed to one or more of the IGFlR modulators.
- the pattern of gene expression of the tested cells can be determined and compared with that of the biomarker pattern from the control panel of cells used to create the biomarker set on the microarray. Based upon the gene expression pattern results from the cells that underwent testing, it can be determined if the cells show a resistant or a sensitive profile of gene expression. Whether or not the tested cells from a tissue or organ biopsy will respond to one or more of the IGFlR modulators and the course of treatment or therapy can then be determined or evaluated based on the information gleaned from the results of the specialized microarray analysis.
- the invention also includes antibodies, including polyclonal or monoclonal, directed against one or more of the polypeptide biomarkers.
- antibodies can be used in a variety of ways, for example, to purify, detect, and target the biomarkers of the invention, including both in vitro and in vivo diagnostic, detection, screening, and/or therapeutic methods.
- the invention also includes kits for determining or predicting whether a patient would be susceptible or resistant to a treatment that comprises one or more IGFlR modulators.
- the patient may have a cancer or tumor such as, for example, a breast cancer or tumor.
- kits would be useful in a clinical setting for use in testing a patient's biopsied tumor or cancer samples, for example, to determine or predict if the patient's tumor or cancer will be resistant or sensitive to a given treatment or therapy with an IGFlR modulator.
- the kit comprises a suitable container that comprises: one or more microarrays, e.g., oligonucleotide microarrays or cDNA microarrays, that comprise those biomarkers that correlate with resistance and sensitivity to IGFlR modulators, particularly IGFlR inhibitors; one or more IGFlR modulators for use in testing cells from patient tissue specimens or patient samples; and instructions for use.
- one or more microarrays e.g., oligonucleotide microarrays or cDNA microarrays, that comprise those biomarkers that correlate with resistance and sensitivity to IGFlR modulators, particularly IGFlR inhibitors
- IGFlR modulators particularly IGFlR inhibitors
- kits contemplated by the invention can further include, for example, reagents or materials for monitoring the expression of biomarkers of the invention at the level of mRNA or protein, using other techniques and systems practiced in the art such as, for example, RT-PCR assays, which employ primers designed on the basis of one or more of the biomarkers described herein, immunoassays, such as enzyme linked immunosorbent assays (ELISAs), immunoblotting, e.g., Western blots, or in situ hybridization, and the like, as further described herein.
- ELISAs enzyme linked immunosorbent assays
- immunoblotting e.g., Western blots, or in situ hybridization, and the like, as further described herein.
- Biomarkers and biomarker sets may be used in different applications.
- Biomarker sets can be built from any combination of biomarkers listed in Tables 2-8 to make predictions about the likely effect of any IGFlR modulator in different biological systems.
- the various biomarkers and biomarkers sets described herein can be used, for example, as diagnostic or prognostic indicators in disease management, to predict how patients with cancer might respond to therapeutic intervention with compounds that modulate the IGFlR, and to predict how patients might respond to therapeutic intervention that modulates signaling through the entire IGFlR regulatory pathway.
- the biomarkers While the data described herein were generated in cell lines that are routinely used to screen and identify compounds that have potential utility for cancer therapy, the biomarkers have both diagnostic and prognostic value in other diseases areas in which signaling through IGFlR or the IGFlR pathway is of importance, e.g., in immunology, or in cancers or tumors in which cell signaling and/or proliferation controls have gone awry.
- cells from a patient tissue sample e.g., a tumor or cancer biopsy, can be assayed to determine the expression pattern of one or more biomarkers prior to treatment with one or more IGFlR modulators.
- test cells e.g., tumor or cancer biopsy
- the test cells show a biomarker expression profile which corresponds to that of the biomarkers in the control panel of cells which are sensitive to the IGFlR modulator, it is highly likely or predicted that the individual's cancer or tumor will respond favorably to treatment with the IGFlR modulator.
- test cells show a biomarker expression pattern corresponding to that of the biomarkers of the control panel of cells which are resistant to the IGFlR modulator, it is highly likely or predicted that the individual's cancer or tumor will not respond to treatment with the IGFlR modulator.
- the invention also provides a method of monitoring the treatment of a patient having a disease treatable by one or more IGFlR modulators.
- the isolated test cells from the patient's tissue sample e.g., a tumor biopsy or blood sample, can be assayed to determine the expression pattern of one or more biomarkers before and after exposure to an IGFlR modulator wherein, preferably, the IGFlR modulator is an IGFlR inhibitor.
- the resulting biomarker expression profile of the test cells before and after treatment is compared with that of one or more biomarkers as described and shown herein to be highly expressed in the control panel of cells that are either resistant or sensitive to an IGFlR modulator.
- the patient's treatment prognosis can be qualified as favorable and treatment can continue.
- the test cells don't show a change in the biomarker expression profile corresponding to the control panel of cells that are sensitive to the IGFlR modulator, it can serve as an indicator that the current treatment should be modified, changed, or even discontinued.
- This monitoring process can indicate success or failure of a patient's treatment with an IGFlR modulator and such monitoring processes can be repeated as necessary or desired.
- the biomarkers of the invention can be used to predict an outcome prior to having any knowledge about a biological system.
- a biomarker can be considered to be a statistical tool. Biomarkers are useful primarily in predicting the phenotype that is used to classify the biological system. In an embodiment of the invention, the goal of the prediction is to classify cancer cells as having an active or inactive IGFlR pathway. Cancer cells with an inactive IGFlR pathway can be considered resistant to treatment with an IGFlR modulator.
- compound 1 This compound is referred to herein as "compound 1."
- compound 2S)-l-(4-((5-cyclopropyl-lH- pyrazol-3-yl)amino)pyrrolo[2,l-f][l,2,4]triazin-2-yl)-N-(6-fluoro-3-pyridinyl)-2- methyl-2-pyrrolidinecarboxamide was used:
- Proliferation was evaluated by incorporation of [3 H] -thymidine into DNA after exposure to IGFlR inhibitor compound 1 or compound 2 to determine the sensitivity of cell lines to these compounds.
- Cells were plated at an optimized density for each cell line per well in 96-well microtiter Falcon plates, incubated overnight, and then exposed to a serial dilution of drug.
- Ratios Drug Combination method was used in cellular proliferation assays to determine whether there was synergy, additivity or antagonism when two compounds were added simultaneously to a variety of human tumor cells in vitro (R. Tallarida, R. J., Drug Synergism and Dose-Effect Data Analysis. 1st edition ed. Chapman & Hall/CRC (2000)).
- Drug stock solutions for two compounds are combined in ratios of 10: 1, 5: 1, 3: 1, 1: 1, 1:3, 1 :5. These ratios, as well as the individual compound stock solutions, are diluted in a serial manner, using 70%
- GCOS GeneChip® Operating Software
- Protein extraction and tryptic digestion Total protein content for each cell lysate was determined by the bicinchoninic acid assay (Pierce, Rockford, IL). An aliquot from each lysate containing 200 ⁇ g total protein was withdrawn for further processing.
- the normalized samples were chloroform-methanol precipitated using a protein extraction kit (Calbiochem, San Diego, CA). Pellets were solublized in a solution containing 8M urea, 200 mM ammonium bicarbonate, and 40 mM DTT. Samples were diluted 4-fold, trypsin was added at 1 :50 enyzme:substrate ratio and incubated overnight at 37 0 C. Solid phase extraction: Solid phase extraction was performed using an Empore Cl 8 SPE plate (3M, St
- Mass spectra were acquired for the mass range of 300 to 1800 Da. Each acquisition was 80 minutes long, with 1 second scan time and 0.1 second inter scan delay. Accuracy of the mass measurement was typically within 20 parts per million.
- a collection of proprietary algorithms (Extractor, Cluster and Time Adjustment) written in-house were applied to extract and quantify peptide peak information, adjust peaks for retention time shifts that may occur during HPLC separation and match peaks across runs. This preprocessing resulted the raw peptide expression measures for each sample.
- MS/MS tandem mass spectrometry
- the gene expression raw data were normalized by the Robust Multichip Average (RMA, R. Irizarry, et al., Biostatistics;4(2):249-64 (2003)) method and log 2 transformed, while the protein profiling data was quantile normalized and Iog2 transformed.
- RMA Robust Multichip Average
- Iog2 the protein profiling data was quantile normalized and Iog2 transformed.
- two separate statistic analyses were performed. First, a two-sample t-test between the resistant and sensitive cell lines (based on a threshold IC50 cutoff of 0.35 ⁇ M) was performed. Second, Pearson correlation between the normalized expression level of each gene/protein and the log2(IC5o) values of the 29 cell lines was calculated to identify genes/proteins correlated with the drug sensitivity (IC50).
- Pre-filter was applied to both gene and protein expression data. Lowly expressed probe sets with normalized and Iog 2 transformed expression values less than 5 cross all samples were removed resulting probe sets of 10,479 for gene expression data. For peptide, it must be found in at least 15 LCMS experimental runs and for subsequent statistical analysis in at least 20 cell lines. This filter reduced the number of overall peptides to 9022 for further analysis.
- a two-way ANOVA mixed model was applied to each probe set in the gene expression profiling data, as well as each peptide in the protein expression profiling data, separately. The model that was applied to each dataset was nearly identical except for a single term in the model applied to the protein expression data which appropriately accounted for the existence of the technical replicates.
- RMA normalized baseline expression data for 28 sarcoma cell lines was first filtered based on following criteria: 1) Maximal expression level across all samples must be greater than 5; 2) Coefficient of Variation (CV) must by greater than 0.03. These resulted a total of 17276 probe sets for further analysis.
- Globaltest was carried out with Bioconductor (www.bioconductor.org) package (Version 4.4.0) using this filtered dataset and compound 1 resistant/sensitive classification for each cell line against a collection of 183 KEGG pathways. The p value indicating the association between expression values and resistant/sensitive classifications, as well as its multiplicity-adjusted version, FWER (Holm's method), were reported for each pathway.
- Marks indicate with how many standard deviations (under the null hypothesis) the bar exceeds the reference line. Bars are colored based on sensitivity classification. The test statistic for a pathway is the average of the bars for all the genes tested.
- Ingenuity pathway analysis 497 baseline markers correlated with sensitivity to compound 1 were imported into Ingenuity pathway analysis. Network nodes were colored by the fold change between sensitive and resistant cells. For the drug modulated markers, treatment- induced probe sets in the sensitive cell line Rh41 (FDR adjusted treatment effect less than 0.05, or FDR adjusted treatment-time-interaction less than 0.05) were used for pathway analysis. Genes on canonical pathways were colored based on the fold change between cells with compound 1 treatment and DMSO control.
- the sensitivity to IGFlR inhibitors compound 1 and compound 2 for each of the 29 pediatric sarcoma and neuroblastoma cell lines was determined by cellular proliferation assays and expressed in term of drug concentration required for 50% cell proliferation inhibition (IC50). The results are summarized in Table 1, and a wide range of activity in this panel of cancer cell lines was observed for both compound 1 and compound 2 compounds.
- compound 2 is more potent than compound 1 in most of the cell lines tested.
- the IC50 value for each cell line was log-transformed, and the mean of logioflCso) across all cell lines was calculated.
- the sensitivity/resistance phenotype of the cell lines to compound 1 or compound 2 was classified as follows: the cell lines with logioflCso) below the mean logioflCso) of all cell lines were defined as sensitive to the compound, while those with logioflCso) above the mean logioflCso) were considered to be resistant to the compound.
- Rh36 cell line at 6 hr, and these changes mainly reflected the initial stress response to the stimuli the cell encountered.
- the drug had little to no effect at later time points, 36 and 72hrs in Rh36 cells. This makes sense for the given concentration of compound 1 cell treated, Rh36 is highly resistant, so the drug had little effect on cell growth compared to the sensitive cell Rh41, which had dramatic changes in gene/protein expression.
- the genes and protein that were modulated by compound 1 in the sensitive RH41 cell line are listed in Table 6 and Table 7, respectively.
- ANOVA mixed model (Intensity ⁇ Treatment + Time + Treatment x Time + Error) was utilized to identify drug treatment effect as well as treatment and time interaction on the expression of genes.
- the genes identified as modulated by the drug are those with FDR p value ⁇ 0.05 in either the Treatment effect or Treatment x Time interaction and the fold change between treatment group and DMSO control group is greater than
- LC/MS based protein profiling There are biological duplicates and technique duplicates.
- a two-way ANOVA mixed model was utilized to identify drug treatment effect as well as treatment and time interaction on the expression of peptide ions.
- the peptide ions identified as modulated by the drug are those with p value ⁇ 0.05 in either the Treatment effect or Treatment x Time interaction. FDR correction was not applied to the protein profiling data.
- these genes are mainly involved in apoptosis (AIFMl, ACINI, BIRC2, BIRC5, BAD, BAG3, BAX, CARDlO, CIAPINl, DAP, DAXX, DAPKl, PDCDI l and PDCD4), cell growth and proliferation (Ki67, BOPl, GASl and ING3), cell cycles (cyclin family members of B, D, E, G, H, I, K, L; CDK 2 and 7; centromere protein A, B, M, N; CDKN3 and CDKNlB) and multiple tyrosine kinases such as ERBB3, PDGFR, FGFRl, 2 and 4, MET, EPH as well as the down-stream IGFlR signaling pathways: MAPK, PI3K and AKT.
- Analysis software MAS 5.0 to identify genes differentially expressed between these cells.
- a change call of "increase” or “decrease” in gene expression level was assigned for each probe set and the fold change between the resistant RD-I cells and the parental sensitive cells was calculated. The redundant probes were removed and left one as the representative for the gene. The fold change is listed, the positive indicates higher expression in the resistant RD-I, and the negative indicates the higher expression in the sensitive parental RD-I.
- IGF1 insulin-like growth factor binding proteins
- THBSl Thrombospondin 1
- IGF signaling through IGFlR has also been shown to protect cancer cells from the cytotoxic effects of chemotherapy and radiation, and this may be an important factor in tumor cell drug resistance (J. Gooch, et al., Breast Cancer Res. Treat., 56(1): 1-10 (1999), B. Turner, et al., Cancer Res, 57(15):3079-83 (1997)).
- Recent evidence suggests that resistance to Herceptin® in some forms of breast cancer may be due to activation of IGFlR signaling in those cancers (Y. Lu, et al., J. Natl. Cancer Inst., 93(24): 1852-7 (2001)).
- IGFlR inhibitors may have potential to be combined with other therapies in a wide range of tumors to increase the overall survival of patients.
- EGFR, MET, TGFR multiple kniases
- Table 9 summarizes the data for in vitro combination studies in multiple types of tumor cell lines and indicated that the drug combinations resulted in synergistic effects between IGFlR inhibitor compound 1 and various inhibitors of EGFR, including both Herl and/or Her2 inhibitors in the forms of either antibody (cetuximab) or small molecules (gefitnib, erlotinib and lapatinib).
- SRC family members FYN (3 fold) and LYN (11 fold) in the compound 1 acquired resistant RD-I cells may suggest SRC family members act as an alternative signal pathway to play an important role in growth and survival of the acquired resistant cells, and targeting IGFlR in this case is not sufficient enough. Targeting multiple pathways could be one of ways to prevent the acquired resistance.
- Table 9 also demonstrated that synergistic effect observed between IGFlR inhibitor compound 1 and dasatinib, a novel, oral, multi- targeted kinase inhibitor that targets important oncogenic pathways, including SRC family kinases, BCR-ABL, PDGFR, c-KIT and EPHA2 (L. Lombardo, et al., J. Med. Chem.;47:6658-61 (2004), A. Todd, et al., PNAS; 102;l 1011-11016 (2005)).
- trastuzumab and EGFR tyrosine kinase inhibitors have demonstrated that careful measurement of biomarkers is necessary when only a small percentage of patients have receptor-driven tumors. Identification of molecular markers predictive of response to IGFlR inhibitors could assist in clinical development by selecting patients most likely to derive clinical benefit.
- microarray gene expression profiling and LC/MS based "bottom-up" protein profiling technologies and a panel of 29 sarcoma and neuroblastoma cell lines, we identified genes and proteins that differentially expressed between the sensitive and resistant cell lines to IGFlR inhibitors compound 2 and compound 1.
- the top discriminators for Ewing's sarcoma include FVTl, DCC, DKK2, PAX3 and JAKl; for fibrosarcoma are PMP22, PTPRZl, FNl; for RMS are MYL4, FGFR4, TNNl 1, ACTC, FLNC, and CDH15; for liposarcoma are PPARG, FABP4, FALC5, SH3KBP1, H0XA5 and AIMl, for leiomyosarcoma MYLK, CCNl, PBXl and SLMAP.
- the comparison results indicated that none of the subtype specific markers are among the intrinsic sensitivity markers we identified.
- IGFlR plays a role in cell survival and in resistance to the anti-HER2 monoclonal antibody trastuzumab
- the expression patterns of the components of IGFs/IGFIR system were evaluated in this study to see if they have any correlation with the intrinsic sensitivity/resistance to IGFlR inhibitors in the panel of cell lines.
- the results showed that IGFlR expression level was not significantly correlated to the sensitivity of compound 2 and/or compound 1 in the 29 sarcoma cell lines even through some of the sensitive cell lines had higher IGFlR expression, this does not exclude the possibility that the sensitive cell lines have elevated activity of IGFlR or IGFlR is the major player for the growth of these cell lines.
- IGFBPs IGF -binding proteins
- IRS2 was 2 fold and IGFBP2, IGFBP 3, IGFBP 5 and IGFBP 7 were 7 to 15 fold elevated compared to the parent sensitive cells.
- IRS2 is the substrate for IGFlR and can enhance the IGFlR activity associated with a metastatic phenotype which correlated with increased migration and motility (J. Jackson, et al, Oncogene, 20(50): 7318-25 (2001)).
- IGFBPs influenced IGF signaling by modulate the bioavailability and bioactivity of the IGFs.
- IGFBPs are implicated in drug resistance. IGFBP3 and IGFBP5 were reported to be significantly higher from ovarian cancer non-response patients to aromatase inhibitor letrozole compared with responders (G. Walker, et al., Clin. Cancer Res., 13(5): 1438- 44 (2007)). IGFBP-2 mRNA and protein level were found to be overexpressed in resistant cell lines to antiestrogen Faslodex/Fulvestrant, tamoxifen or RU 58,668 (A. Juncker-Jensen, et al., Growth Horm. IGF. Res., 16(4):224-39 (2006)).
- IGFBPs' actions can be modulated by IGFBP proteases, such as cathepsins that cleave IGFBPs.
- IGFBP proteases such as cathepsins that cleave IGFBPs.
- Higher basal expression level (4 to 12 fold) of lysosomal cysteine protease cathepsin B, L and Z and lysosomal aspartyl protease cathepsin D were observed in the resistant cell lines.
- elevated cathepsin B activity correlates to poor therapy outcome.
- drug-resistance e.g., adriamycin
- Cathepsin L acts as a cell survival molecule responsible for initiation of resistance to chemotherapy, inhibition of cathepsin L with siRNA facilitates induction of senescence and reversal of drug resistance (A. Juncker-Jensen, et al., Growth Horm. IGF Res., 16(4):224-39 (2006)).
- IGFlR inhibitors was metallothionein family members (IF, G, H, M, X, 2A), with over-expression (4 to 9 fold) in resistant cell lines.
- Metallothionein family members are cysteine-rich proteins that involved in many pathophysiological processes such as metal ion homeostasis and detoxification, protection against oxidative damage, cell proliferation and apoptosis, chemo-resistance (platinum agents, tamoxifen) and radiotherapy resistance (M. Ebadi, et al., Gen Pharmacol., 25(7): 1297-310 (1994)).
- the basal level overexpression of these family members was also observed in a group of colon cancer lines that are resistant to compound 1 compared to the sensitive cell lines, suggesting the role of metallothionein family members in IGFlR inhibitor drug resistance.
- Rh41 cells harbor a PAX3-FKHR translocation, t(2;13)(q35;ql4), whereas Rh36 cells harbor a EWS-FLI-I translocation, t(l I;22)(q24;ql2).
- Rh36 the drug had little, to no effect especially at later time points, 36 and 72hrs. This makes sense considering the drug concentration of compound 1 used in the study, Rh36 is highly resistant. However, in the sensitive cell Rh41, 30% of genes have significant expression changes upon the drug treatment. These genes are mainly involved in apoptosis, cell growth and proliferation, cell cycles and multiple tyrosine kinases pathways as well as the down-stream IGFlR signaling pathways: MAPK, PI3K and AKT.
- PDCD4 programmed cell death 4
- the expression level of survivin was significantly reduced especially at 36 and 72 hours and programmed cell death 4 (PDCD4) was up-regulated by compound 1 treatment in the sensitive Rh41 cells, but not in resistant Rh36 cells.
- PDCD4 is a tumor suppressor protein and its expression is strongly induced during apoptosis in a number of cell types (O. Afonja, et al, Oncogene, 23(49):8135-45 (2004)).
- up-regulation of PDCD4 expression may suggest apoptosis induced by compound 1 in sensitive cell lines only. This is in agreement with Western blot analysis showed both Rh41 and Rh36 cell lines have high expression of pBad, but only Rh41 cells showed significant reduction in pBad activity by 6 hrs of drug treatment.
- the reduction in pBad activity was accompanied by an increase in apoptosis when cells were exposed to the drugs for 24-48 hrs, followed by a Gl arrest.
- Remarkable but not complete decrease of Ki-67 in compound 1 treated cells may suggest the inhibitor with the cytostatic rather than cytotoxic effect.
- the inhibitor may induce apoptosis and lower the survival threshold of cancer cells thereby augmenting a second apoptotic stimulus by another agent in a combination therapy.
- apoptosis pathway is one of the differences, many genes promoting apoptosis have higher expression levels in the resistant cell lines. Detailed dissection of the pathway is needed to get insights for whether resistant cell lines have higher threshold to be apoptotic due to presence of other growth signaling pathways (e.g., EGFR, MET) in addition to IGFlR pathway, whereas in the sensitive cell lines, IGFlR is probably the dominant growth and survival driver.
- cells expressing an biomarker polypeptide can be administered to an animal to induce the production of sera containing polyclonal antibodies directed to the expressed polypeptides.
- the biomarker protein is prepared and isolated or otherwise purified to render it substantially free of natural contaminants, using techniques commonly practiced in the art. Such a preparation is then introduced into an animal in order to produce polyclonal antisera of greater specific activity for the expressed and isolated polypeptide.
- the antibodies of the invention are monoclonal antibodies (or protein binding fragments thereof).
- Cells expressing the biomarker polypeptide can be cultured in any suitable tissue culture medium, however, it is preferable to culture cells in Earle's modified Eagle's medium supplemented to contain 10% fetal bovine serum (inactivated at about 56 0 C), and supplemented to contain about 10 g/1 nonessential amino acids, about 1,00 U/ml penicillin, and about 100 ⁇ g/ml streptomycin.
- the splenocytes of immunized (and boosted) mice can be extracted and fused with a suitable myeloma cell line.
- any suitable myeloma cell line can be employed in accordance with the invention, however, it is preferable to employ the parent myeloma cell line (SP2/0), available from the ATCC.
- SP2/0 parent myeloma cell line
- the resulting hybridoma cells are selectively maintained in HAT medium, and then cloned by limiting dilution as described by Wands et al. (1981, Gastroenterology, 80:225-232).
- the hybridoma cells obtained through such a selection are then assayed to identify those cell clones that secrete antibodies capable of binding to the polypeptide immunogen, or a portion thereof.
- additional antibodies capable of binding to the biomarker polypeptide can be produced in a two-step procedure using anti-idiotypic antibodies.
- a method makes use of the fact that antibodies are themselves antigens and, therefore, it is possible to obtain an antibody that binds to a second antibody.
- protein specific antibodies can be used to immunize an animal, preferably a mouse.
- the splenocytes of such an immunized animal are then used to produce hybridoma cells, and the hybridoma cells are screened to identify clones that produce an antibody whose ability to bind to the protein-specific antibody can be blocked by the polypeptide.
- Such antibodies comprise anti-idiotypic antibodies to the protein-specific antibody and can be used to immunize an animal to induce the formation of further protein-specific antibodies.
- EXAMPLE 3 - IMMUNOFLUORESCENCE ASSAYS The following immunofluorescence protocol may be used, for example, to verify IGFlR biomarker protein expression on cells or, for example, to check for the presence of one or more antibodies that bind IGFlR biomarkers expressed on the surface of cells. Briefly, Lab-Tek II chamber slides are coated overnight at 4 0 C with 10 micrograms/milliliter ( ⁇ g/ml) of bovine collagen Type II in DPBS containing calcium and magnesium (DPBS++). The slides are then washed twice with cold
- the culture medium is gently removed by aspiration and the adherent cells are washed twice with DPBS++ at ambient temperature.
- the slides are blocked with DPBS++ containing 0.2% BSA (blocker) at 0-4 0 C for one hour.
- the blocking solution is gently removed by aspiration, and 125 ⁇ l of antibody containing solution (an antibody containing solution may be, for example, a hybridoma culture supernatant which is usually used undiluted, or serum/plasma which is usually diluted, e.g., a dilution of about 1/100 dilution).
- the slides are incubated for 1 hour at 0-4 0 C.
- Antibody solutions are then gently removed by aspiration and the cells are washed five times with 400 ⁇ l of ice cold blocking solution. Next, 125 ⁇ l of 1 ⁇ g/ml rhodamine labeled secondary antibody (e.g., anti-human IgG) in blocker solution is added to the cells. Again, cells are incubated for 1 hour at 0-4 0 C.
- rhodamine labeled secondary antibody e.g., anti-human IgG
- the secondary antibody solution is then gently removed by aspiration and the cells are washed three times with 400 ⁇ l of ice cold blocking solution, and five times with cold DPBS++. The cells are then fixed with 125 ⁇ l of 3.7% formaldehyde in
- DPBS++ for 15 minutes at ambient temperature. Thereafter, the cells are washed five times with 400 ⁇ l of DPBS++ at ambient temperature. Finally, the cells are mounted in 50% aqueous glycerol and viewed in a fluorescence microscope using rhodamine filters.
Landscapes
- Chemical & Material Sciences (AREA)
- Life Sciences & Earth Sciences (AREA)
- Health & Medical Sciences (AREA)
- Organic Chemistry (AREA)
- Proteomics, Peptides & Aminoacids (AREA)
- Engineering & Computer Science (AREA)
- Immunology (AREA)
- Pathology (AREA)
- Analytical Chemistry (AREA)
- Zoology (AREA)
- Wood Science & Technology (AREA)
- Genetics & Genomics (AREA)
- Hospice & Palliative Care (AREA)
- Biochemistry (AREA)
- Microbiology (AREA)
- Molecular Biology (AREA)
- Biophysics (AREA)
- Physics & Mathematics (AREA)
- Oncology (AREA)
- Biotechnology (AREA)
- Bioinformatics & Cheminformatics (AREA)
- General Engineering & Computer Science (AREA)
- General Health & Medical Sciences (AREA)
- Measuring Or Testing Involving Enzymes Or Micro-Organisms (AREA)
- Investigating Or Analysing Biological Materials (AREA)
- Pharmaceuticals Containing Other Organic And Inorganic Compounds (AREA)
- Medicines That Contain Protein Lipid Enzymes And Other Medicines (AREA)
Abstract
IGF1R biomarkers useful in a method for identifying and monitoring a mammal that will respond therapeutically to a method of treating cancer comprising administering an IGF1R modulator, wherein the method comprises (a) exposing the mammal to the IGF1R modulator and (b) measuring in the mammal the level of the at least one biomarker, wherein a difference in the level of the at least one biomarker measured in (b) compared to the level of the biomarker in a mammal that has not been exposed to the IGF1R modulator indicates that the mammal will respond therapeutically to the method of treating cancer and (c) wherein the level of the biomarker in a mammal after exposure to a IGF1R modulator indicates that the mammal has responded therapeutically to the method of treating cancer.
Description
BIOMARKERS AND METHODS FOR DETERMINING SENSITIVITY TO INSULIN GROWTH FACTOR-I RECEPTOR MODULATORS
FIELD OF THE INVENTION: The present invention relates generally to the field of pharmacogenomics, and more specifically, to methods and procedures used to monitor response or determine sensitivity in patients to allow the identification of individualized genetic profiles which will aid in treating diseases and disorders.
BACKGROUND OF THE INVENTION:
Cancer is a disease with extensive histoclinical heterogeneity. Although conventional histological and clinical features have been correlated to prognosis, the same apparent prognostic type of tumors varies widely in its responsiveness to therapy and consequent survival of the patient. New prognostic and predictive markers, which would facilitate an individualization of therapy for each patient, are needed to accurately predict patient response to treatments, such as small molecule or biological molecule drugs, in the clinic. The problem may be solved by the identification of new parameters that could better predict the patient's sensitivity to treatment. The classification of patient samples is a crucial aspect of cancer diagnosis and treatment. The association of a patient's response to a treatment with molecular and genetic markers can open up new opportunities for treatment development in non-responding patients, or distinguish a treatment's indication among other treatment choices because of higher confidence in the efficacy. Further, the pre-selection of patients who are likely to respond well to a medicine, drug, or combination therapy may reduce the number of patients needed in a clinical study or accelerate the time needed to complete a clinical development program (M. Cockett et al, Current Opinion in Biotechnology, 11 :602-609 (2000)). The ability to determine which patients are responding to anti-angiogenesis therapies (such as IGFlR modulators) or predict drug sensitivity in patients is particularly challenging because drug responses reflect not only properties intrinsic to the target cells, but also a host's metabolic properties. Efforts to use genetic information to predict or monitor drug response have primarily focused on individual
genes that have broad effects, such as the multidrug resistance genes mdrl and mrpl (P. Sonneveld, J. Intern. Med., 247:521-534 (2000)).
The development of microarray technologies for large scale characterization of gene mRNA expression pattern has made it possible to systematically search for molecular markers and to categorize cancers into distinct subgroups not evident by traditional histopathological methods (J. Khan et al., Cancer Res., 58:5009-5013 (1998); A.A. Alizadeh et al., Nature, 403:503-511 (2000); M. Bittner et al., Nature, 406:536-540 (2000); J. Khan et al., Nature Medicine, 7(6):673-679 (2001); and T.R. Golub et al., Science, 286:531-537 (1999); U. Alon et al., P. N. A. S. USA, 96:6745- 6750 (1999)). Such technologies and molecular tools have made it possible to monitor the expression level of a large number of transcripts within a cell population at any given time (see, e.g., Schena et al., Science, 270:467-470 (1995); Lockhart et al., Nature Biotechnology, 14: 1675-1680 (1996); Blanchard et al., Nature Biotechnology, 14: 1649 (1996); U.S. Patent No. 5,569,588 to Ashby et al.). Recent studies demonstrate that gene expression information generated by microarray analysis of human tumors can predict clinical outcome (LJ. van't Veer et al., Nature, 415:530-536 (2002); M. Shipp et al., Nature Medicine, 8(l):68-74 (2002); G. Glinsky et al., The Journal of Clin. Invest, 113(6):913-923 (2004)). These findings bring hope that cancer treatment will be vastly improved by better predicting and monitoring the response of individual tumors to therapy.
PCT Application No. PCT/US2006/034201 provides biomarkers useful for identifying a mammal that will respond therapeutically to a method of treating cancer comprising administering an IGFlR modulator.
Needed are new and alternative methods and procedures to determine drug sensitivity or monitor response in patients to allow the development of individualized diagnostics which are necessary to treat diseases and disorders based on patient response at a molecular level.
SUMMARY OF THE INVENTION: The invention provides methods and procedures for determining patient sensitivity or monitor response at the molecular level to one or more insulin growth factor 1 receptor (IGFlR) modulators. The invention also provides methods of
determining or predicting whether an individual requiring therapy for a disease state such as cancer will or will not respond to treatment, prior to administration of the treatment, wherein the treatment comprises administration of one or more IGFlR modulators. The one or more IGFlR modulators are compounds that can be selected from, for example, one or more IGFlR specific ligands, one or more small molecule IGFlR inhibitors, or one or more IGFlR binding monoclonal antibodies.
In one aspect, the invention provides a method for predicting the likelihood a mammal will respond therapeutically to a method of treating cancer comprising administering an IGFlR modulator, wherein the method comprises: (a) measuring in the mammal the level of at least one biomarker selected from the biomarkers of Tables 2-8; (b) exposing a biological sample from said mammal to the IGFlR modulator; (c) following the exposing of step (b), measuring in said biological sample the level of the at least one biomarker, wherein an increase in the level of the at least one biomarker measured in step (c) compared to the level of the at least one biomarker measured in step (a), indicates an increased likelihood that the mammal will respond therapeutically to said method of treating cancer when said at least one biomarker is a sensitivity biomarker, and indicates an increased likelihood that the mammal will not respond therapeutically to said method of treating cancer when said at least one biomarker is a resistance biomarker. In another aspect, the invention provides a method for identifying a mammal that will respond therapeutically to a method of treating cancer comprising administering an IGFlR modulator, wherein the method comprises: (a) measuring in the mammal the level of at least one biomarker selected from the biomarkers of Tables 2-8; (b) exposing a biological sample from the mammal to the IGFlR modulator; (c) following the exposing in step (b), measuring in said biological sample the level of the at least one biomarker and using said measurement to determine whether the mammal is likely to respond therapeutically to said method of treating cancer.
A difference in the level of the biomarker that is sufficient to indicate whether the mammal will or will not respond therapeutically to the method of treating cancer can be readily determined by one of skill in the art using known techniques. The increase or decrease in the level of the biomarker can be correlated to determine
whether the difference is sufficient to identify a mammal that will respond therapeutically. The difference in the level of the biomarker that is sufficient can, in one aspect, be predetermined prior to determining whether the mammal will respond therapeutically to the treatment. In one aspect, the difference in the level of the biomarker is a difference in the mRNA level (measured, for example, by RT-PCR or a microarray), such as at least a two-fold difference, at least a three-fold difference, or at least a four- fold difference in the level of expression. In another aspect, the difference in the level of the biomarker is determined by IHC. In another aspect, the difference in the level of the biomarker refers to a p-value of <0.05 in Anova analysis. In yet another aspect, the difference is determined in an ELISA assay.
As used herein, respond therapeutically refers to the alleviation or abrogation of the cancer. This means that the life expectancy of an individual affected with the cancer will be increased or that one or more of the symptoms of the cancer will be reduced or ameliorated. The term encompasses a reduction in cancerous cell growth or tumor volume. Whether a mammal responds therapeutically can be measured by many methods well known in the art, such as PET imaging.
The mammal can be, for example, a human, rat, mouse, dog rabbit, pig sheep, cow, horse, cat, primate, or monkey.
The method of the invention can be, for example, an in vitro method wherein the step of measuring in the mammal the level of at least one biomarker comprises taking a biological sample from the mammal and then measuring the level of the biomarker(s) in the biological sample. The biological sample can comprise, for example, at least one of serum, whole fresh blood, peripheral blood mononuclear cells, frozen whole blood, fresh plasma, frozen plasma, urine, saliva, skin, hair follicle, bone marrow, or tumor tissue.
The level of the at least one biomarker can be, for example, the level of protein and/or mRNA transcript of the biomarker(s).
In another aspect, the invention provides a method for identifying a mammal that will respond therapeutically to a method of treating cancer comprising administering an IGFlR modulator, wherein the method comprises: (a) exposing a biological sample from the mammal to the IGFlR modulator; (b) following the exposing of step (a), measuring in said biological sample the level of at least one
biomarker selected from the biomarkers of Tables 2-8, wherein a difference in the level of the at least one biomarker measured in step (b), compared to the level of the biomarker in a mammal that has not been exposed to said IGFlR modulator, indicates that the mammal will respond therapeutically to said method of treating cancer. In yet another aspect, the invention provides a method for testing or predicting whether a mammal will respond therapeutically to a method of treating cancer comprising administering an IGFlR modulator, wherein the method comprises: (a) measuring in the mammal the level of at least one biomarker selected from the biomarkers of Tables 2-8; (b) exposing the mammal to the IGFlR modulator; (c) following the exposing of step (b), measuring in the mammal the level of the at least one biomarker, wherein a difference in the level of the at least one biomarker measured in step (c) compared to the level of the at least one biomarker measured in step (a) indicates that the mammal will respond therapeutically to said method of treating cancer. In another aspect, the invention provides a method for determining whether a compound inhibits IGFlR activity in a mammal, comprising: (a) exposing the mammal to the compound; and (b) following the exposing of step (a), measuring in the mammal the level of at least one biomarker selected from the biomarkers of Tables 2-8, wherein a difference in the level of said biomarker measured in step (b), compared to the level of the biomarker in a mammal that has not been exposed to said compound, indicates that the compound inhibits IGFlR activity in the mammal.
In yet another aspect, the invention provides a method for determining whether a mammal has been exposed to a compound that inhibits IGFlR activity, comprising (a) exposing the mammal to the compound; and (b) following the exposing of step (a), measuring in the mammal the level of at least one biomarker selected from the biomarkers of Tables 2-8, wherein a difference in the level of said biomarker measured in step (b), compared to the level of the biomarker in a mammal that has not been exposed to said compound, indicates that the mammal has been exposed to a compound that inhibits IGFlR activity. In another aspect, the invention provides a method for determining whether a mammal is responding to a compound that inhibits IGFlR activity, comprising (a) exposing the mammal to the compound; and (b) following the exposing of step (a),
measuring in the mammal the level of at least one biomarker selected from the biomarkers of Tables 2-8, wherein a difference in the level of the at least one biomarker measured in step (b), compared to the level of the at least one biomarker in a mammal that has not been exposed to said compound, indicates that the mammal is responding to the compound that inhibits IGFlR activity.
As used herein, "responding" encompasses responding by way of a biological and cellular response, as well as a clinical response (such as improved symptoms, a therapeutic effect, or an adverse event), in a mammal
The invention also provides an isolated biomarker selected from the biomarkers of Tables 2-8. The biomarkers of the invention comprise sequences selected from the nucleotide and amino acid sequences provided in Tables 2-8 and the Sequence Listing, as well as fragments and variants thereof.
The invention also provides a biomarker set comprising two or more biomarkers selected from the biomarkers of Tables 2-8. The invention also provides kits for determining or predicting whether a patient would be susceptible or resistant to a treatment that comprises one or more IGFlR modulators. The patient may have a cancer or tumor such as, for example, a colon cancer or tumor.
In one aspect, the kit comprises a suitable container that comprises one or more specialized microarrays of the invention, one or more IGFlR modulators for use in testing cells from patient tissue specimens or patient samples, and instructions for use. The kit may further comprise reagents or materials for monitoring the expression of a biomarker set at the level of mRNA or protein.
In another aspect, the invention provides a kit comprising two or more biomarkers selected from the biomarkers of Tables 2-8.
In yet another aspect, the invention provides a kit comprising at least one of an antibody and a nucleic acid for detecting the presence of at least one of the biomarkers selected from the biomarkers of Tables 2-8. In one aspect, the kit further comprises instructions for determining whether or not a mammal will respond therapeutically to a method of treating cancer comprising administering a compound that inhibits IGFlR activity. In another aspect, the instructions comprise the steps of (a) measuring in the mammal the level of at least one biomarker selected from the
biomarkers of Tables 2-8, (b) exposing the mammal to the compound, (c) following the exposing of step (b), measuring in the mammal the level of the at least one biomarker, wherein a difference in the level of the at least one biomarker measured in step (c) compared to the level of the at least one biomarker measured in step (a) indicates that the mammal will respond therapeutically to said method of treating cancer.
The invention also provides screening assays for determining if a patient will be susceptible or resistant to treatment with one or more IGFlR modulators.
The invention also provides a method of monitoring the treatment of a patient having a disease, wherein said disease is treated by a method comprising administering one or more IGFlR modulators.
The invention also provides individualized genetic profiles which are necessary to treat diseases and disorders based on patient response at a molecular level. The invention also provides specialized microarrays, e.g., oligonucleotide microarrays or cDNA microarrays, comprising one or more biomarkers having expression profiles that correlate with either sensitivity or resistance to one or more IGFlR modulators.
The invention also provides antibodies, including polyclonal or monoclonal, directed against one or more biomarkers of the invention.
The invention will be better understood upon a reading of the detailed description of the invention when considered in connection with any accompanying figures.
DETAILED DESCRIPTION OF THE INVENTION:
Identification of biomarkers that provide rapid and accessible readouts of efficacy, drug exposure, or clinical response is increasingly important in the clinical development of drug candidates. Embodiments of the invention include measuring changes in the levels of secreted proteins, or plasma biomarkers, which represent one category of biomarker. In one aspect, plasma samples, which represent a readily accessible source of material, serve as surrogate tissue for biomarker analysis. The invention provides biomarkers that respond to the modulation of a specific signal transduction pathway and also correlate with IGFlR modulator sensitivity or resistance. These biomarkers can be employed for predicting and monitoring response to one or more IGFlR modulators. In one aspect, the biomarkers of the invention are those provided in Tables 2-8 and the Sequence Listing, including both polynucleotide and polypeptide sequences. In another aspect, the biomarkers of the invention are nucleotide sequences that, due to the degeneracy of the genetic code, encodes for a polypeptide sequence provided in the sequence listing. The biomarkers serve as useful molecular tools for predicting and monitoring response to IGFlR modulators that affect IGFlR activity or the IGFlR signal transduction pathway.
In addition to playing an important role in normal cell growth, maintenance and development, insulin-like growth factor receptor (IGFlR) and its ligands are also important in the establishment and maintenance of the malignant phenotype. Binding of IGF-I and IGF-II ligands to the IGFlR initiates a cascade of events leading to activation of mitogenic signaling pathway (Ras/Raf/MAPK) and antiapoptotic/survival pathway (PI3K-Akt/mTor), resulting in proliferation, transformation and survival in tumor cells (D. LeRoith, et al., Cancer Lett., 195(2): 127-37 (2003), R. Baserga, et al., Int. J. Cancer; 107:873-7 (2003)). IGFlR overexpression and/or enhanced activity have been observed in diverse tumor types suggesting that the potential therapeutic use of agents targeting this pathway is broad. IGFlR provides a critical survival signal in multiple tumor types. The expression of this receptor is an indicator of poor prognosis, thus, it has emerged as an attractive and compelling target for cancer therapy to inhibit the progression of multiple tumor types in cancer patients. Various drug discovery approaches have been explored in recent years to modulate the function of IGFlR. Approaches aimed at the reduction
of receptor number or enzymatic activity using a variety of strategies in preclinical models have been shown to reverse the malignant phenotype in tumor cells. These strategies include antisense (L. Long, et al, Cancer Res, 55(5): 1006-9 (1995), D. Andrews et al., J. Clin. Oncol, 19(8):2189-200 (2001)), monoclonal antibody (C. Arteaga, et al., Cancer Res., 49(22):6237-41 (1989)), small molecule inhibitors (M. Wittman, et al., J. Med. Chem., Sep 8;48(18):5639-43 (2005), C. Garcia-Echeverria, et al., Cancer Cell, 5(3):231-9 (2004)), IGF-I mimetic peptides (Z. Pietrzkowski, et al., Cancer Res., 53(5): 1102-6 (1993)) as well as dominant negative mutants that lack enzyme activity (C. D'Ambrosio, et al., Cancer Res, 56(17): 4013-20 (1996)). However, this targeted therapy may only be successful if the receptor is absolutely necessary for pathogenesis and tumor progression. IGFlR and its ligands have been shown to be important in the mesenchymal originated soft tissue sarcomas and neuroblastoma (G. Merlino, et al., Oncogene; 18:5340-8 (1999), K. Scotlandi, et al., Cancer Res.;56:4570-4 (1996), S. Burrow, et al., J. Surg. Oncol.;69:21-7 (1998), D. Yee, et al., J. Clin. Invest., 86(6) : 1806-14 (1990)). These rare tumors have distinctive biological characteristics including aggressive local behavior and a predilection for metastasis. With multimodal treatments and very aggressive chemotherapeutic regimens, the survival rate is disappointingly low and, thus, there is a high unmet medical need for the treatment of patients with these tumor types. Inhibition of IGFlR by antibody or small molecule either alone or in combination with other chemotherapeutic agents have demonstrated antitumor activity in sarcomas (S. Benini, et al., Clinical Cancer Res., 7, 1790-97 (2001), K. Scotlandi, et al., Cancer Res., May l;65(9):3868-76 (2005), M. Manara, et al., Clinical Cancer Res.; 13(4) 1322-30 (2007)). One of the integral goals in the development of these targeted cancer therapies is to identify the targeted patients population who are most likely to benefit from the drug treatment. Utilizing biomarkers has successfully guided the development of Herceptin® and EGFR inhibitors (J. Baselga, et al., J Clin Oncol. 14, 737-744 (2005), T. Lynch, et al., N. Engl. J. Med., 350, 2129-2139 (2004)). More recently, gene expression profiling studies have demonstrated the advantages of molecular "signatures" or marker sets generated by microarray analysis in predicting chemotherapeutic response and guiding the targeted therapies (K. Iwao-Koizumi, et
al., J. Clin. Oncol. ;23:422-31 (2005), H. Dressman, et al., Clin. Cancer Res.; 12:819- 26 (2006), R. Rouzier, et al., Clin. Cancer Res.; 11:5678-85 (2005), K. Hess, et al., J. Clin. Oncol.;24:4236-44 (2006), H. Dressman, et al., J. Clin. Oncol, Feb 10;25(5):517-25 (2007), A. Potti, et al., Nat. Med., Nov; 12(11): 1294-300 (2006)). These findings provide hope that cancer treatments of the future will be vastly improved by using molecular "signatures" to choose the most effective drug for patient targeting. One of the challenges is to determine the targeted patient population for the drug before clinical data is available.
To overcome this challenge, as described previously (F. Huang F, et al., Cancer Res., Mar l;67(5):2226-38 (2007)), cultured cancer cell lines can be used as models to identify biomarkers that correlate with response to a therapy assuming these markers identified in vitro are ultimately applicable in clinical studies to select targeted patient population.
To this end, in this study, the gene and protein profiling by both microarray and LC/MS based "bottom-up" protein profiling (M. Lipton, et al., Proc. Natl. Acad. ScL U S A., Aug 20;99(17): l 1049-54 (2002), H. Prokisch et al., PLoS Biol, Jun;2(6):el60 (2004)) were conduced in parallel using a panel of 29 cell lines to identify genes or proteins whose basal expression levels are correlated with the in vitro sensitivity of cells to compound 1 or compound 2 (as defined below) and potentially could be used as predictive markers. To gain insights of acquired resistance of compound 1, gene expression profiles of a pair of sensitive and acquired resistant cell lines were compared to identify genes correlated with the acquired resistance. These genes were then compared to the genes over expressed in the resistant cell lines at basal level (correlated with the de novo resistance to the drug). Common mechanism of de novo resistance and acquired resistance to IGFlR inhibitor compound 1 was explored. Furthermore, genes/proteins modulated by drug treatment of compound 1 were identified and linked to the possible mechanisms of the drug action. These markers could be useful to monitor the biological effects of the drug and to select the optimal dose in the clinical studies. To explore the relation between these biomarkers and the drug target IGFlR, pathway analyses were performed and cross-talk between the IGFlR and other kinases was evident, this led us to propose the hypothesis for the potential synergistic activity between compound 1 and other
agents targeting these kinases. Drug combination studies of compound 1 with other agents, such as EGFR inhibitors, were performed and synergy in tumor growth inhibition in vitro was observed with combined inhibition of multiple pathways. In this study, we identified the biomarkers of potentially predictive the targeted sub- population of patient with sarcomas that would be benefit from the treatment of IGFlR inhibitor.
IGFlR MODULATORS:
As used herein, the term "IGFlR modulator" is intended to mean a compound or drug that is a biological molecule or a small molecule that directly or indirectly modulates IGFlR activity or the IGFlR signal transduction pathway. Thus, compounds or drugs as used herein is intended to include both small molecules and biological molecules. Direct or indirect modulation includes activation or inhibition of IGFlR activity or the IGFlR signal transduction pathway. In one aspect, inhibition refers to inhibition of the binding of IGFlR to an IGFlR ligand such as, for example, VEGF. In another aspect, inhibition refers to inhibition of the kinase activity of IGF IR.
IGFlR modulators include, for example, IGFlR specific ligands, small molecule IGFlR inhibitors, and IGFlR monoclonal antibodies. In one aspect, the IGF 1 R modulator inhibits IGF 1 R activity and/or inhibits the IGF 1 R signal transduction pathway. In another aspect, the IGFlR modulator is an IGFlR monoclonal antibody that inhibits IGFlR activity and/or inhibits the IGFlR signal transduction pathway.
IGFlR modulators include biological molecules or small molecules. Biological molecules include all lipids and polymers of monosaccharides, amino acids, and nucleotides having a molecular weight greater than 450. Thus, biological molecules include, for example, oligosaccharides and polysaccharides; oligopeptides, polypeptides, peptides, and proteins; and oligonucleotides and polynucleotides. Oligonucleotides and polynucleotides include, for example, DNA and RNA.
Biological molecules further include derivatives of any of the molecules described above. For example, derivatives of biological molecules include lipid and glycosylation derivatives of oligopeptides, polypeptides, peptides, and proteins.
Derivatives of biological molecules further include lipid derivatives of oligosaccharides and polysaccharides, e.g., lipopolysaccharides. Most typically, biological molecules are antibodies, or functional equivalents of antibodies. Functional equivalents of antibodies have binding characteristics comparable to those of antibodies, and inhibit the growth of cells that express IGFlR. Such functional equivalents include, for example, chimerized, humanized, and single chain antibodies as well as fragments thereof.
Functional equivalents of antibodies also include polypeptides with amino acid sequences substantially the same as the amino acid sequence of the variable or hypervariable regions of the antibodies. An amino acid sequence that is substantially the same as another sequence, but that differs from the other sequence by means of one or more substitutions, additions, and/or deletions, is considered to be an equivalent sequence. Preferably, less than 50%, more preferably less than 25%, and still more preferably less than 10%, of the number of amino acid residues in a sequence are substituted for, added to, or deleted from the protein.
The functional equivalent of an antibody is preferably a chimerized or humanized antibody. A chimerized antibody comprises the variable region of a non- human antibody and the constant region of a human antibody. A humanized antibody comprises the hypervariable region (CDRs) of a non-human antibody. The variable region other than the hypervariable region, e.g., the framework variable region, and the constant region of a humanized antibody are those of a human antibody. Suitable variable and hypervariable regions of non-human antibodies may be derived from antibodies produced by any non-human mammal in which monoclonal antibodies are made. Suitable examples of mammals other than humans include, for example, rabbits, rats, mice, horses, goats, or primates.
Functional equivalents further include fragments of antibodies that have binding characteristics that are the same as, or are comparable to, those of the whole antibody. Suitable fragments of the antibody include any fragment that comprises a sufficient portion of the hypervariable (i.e., complementarity determining) region to
bind specifically, and with sufficient affinity, to IGFlR tyrosine kinase to inhibit growth of cells that express such receptors.
Such fragments may, for example, contain one or both Fab fragments or the F(ab')2 fragment. Preferably, the antibody fragments contain all six complementarity determining regions of the whole antibody, although functional fragments containing fewer than all of such regions, such as three, four, or five CDRs, are also included.
In one aspect, the fragments are single chain antibodies, or Fv fragments. Single chain antibodies are polypeptides that comprise at least the variable region of the heavy chain of the antibody linked to the variable region of the light chain, with or without an interconnecting linker. Thus, Fv fragment comprises the entire antibody combining site. These chains may be produced in bacteria or in eukaryotic cells.
The antibodies and functional equivalents may be members of any class of immunoglobulins, such as IgG, IgM, IgA, IgD, or IgE, and the subclasses thereof.
In one aspect, the antibodies are members of the IgGl subclass. The functional equivalents may also be equivalents of combinations of any of the above classes and subclasses.
In one aspect, the IGFlR antibody is provided in PCT publication nos. WO2005/016970, WO02/53596, WO2004/71529, WO2005/16967, WO2004/83248, WO03/106621, WO03/100008, WO03/59951, WO2004/87756, or WO2005/05635. In another aspect, the IGFlR modulator is derived from fibronectin, such as an
AdNectin (Adnexus Therapeutics) (See, PCT publication nos. WO00/34784, WOO 1/64942, WO02/32925).
In addition to the biological molecules discussed above, the IGFlR modulators useful in the invention may also be small molecules. Any molecule that is not a biological molecule is considered herein to be a small molecule. Some examples of small molecules include organic compounds, organometallic compounds, salts of organic and organometallic compounds, saccharides, amino acids, and nucleotides. Small molecules further include molecules that would otherwise be considered biological molecules, except their molecular weight is not greater than 450. Thus, small molecules may be lipids, oligosaccharides, oligopeptides, and oligonucleotides and their derivatives, having a molecular weight of 450 or less.
It is emphasized that small molecules can have any molecular weight. They are merely called small molecules because they typically have molecular weights less than 450. Small molecules include compounds that are found in nature as well as synthetic compounds. In one embodiment, the IGFlR modulator is a small molecule that inhibits the growth of tumor cells that express IGFlR. In another embodiment, the IGFlR modulator is a small molecule that inhibits the growth of refractory tumor cells that express IGFlR.
Numerous small molecules have been described as being useful to inhibit IGFlR. In one aspect, the IGFlR modulator is selected from PCT publication nos.
WO02/79192, WO2004/30620, WO2004/31401 WO2004/63151 , and WO2005/21510, and from U.S. provisional application nos. 60/819,171, 60/870,872, 60/883,601, and 60/912,446.
In another aspect, the IGFlR modulator is selected from (S)-4-(2-(3- chlorophenyl)-2-hydroxyethylamino)-3-(4-methyl-6-morpholino-lH- benzo [<i]imidazol-2-yl)-pyridin-2( 1 -Η)-one and (2S)-I -(4-((5 -cyclopropyl- 1 H- pyrazol-3-yl)amino)pyrrolo[2,l-f][l,2,4]triazin-2-yl)-N-(6-fluoro-3-pyridinyl)-2- methyl-2-pyrrolidinecarboxamide.
In another aspect, the IGFlR modulator is selected from XL-228 (Exelixis), AEW-541 (Novartis), and OSI-906 (OSI).
BIOMARKERS AND BIOMARKER SETS:
The invention includes individual biomarkers and biomarker sets having both diagnostic and prognostic value in disease areas in which signaling through IGFlR or the IGFlR pathway is of importance, e.g., in cancers or tumors, in immunological disorders, conditions or dysfunctions, or in disease states in which cell signaling and/or cellular proliferation controls are abnormal or aberrant. The biomarker sets comprise a plurality of biomarkers such as, for example, a plurality of the biomarkers provided in Tables 2-8 that highly correlate with resistance or sensitivity to one or more IGFlR modulators.
The biomarkers and biomarker sets of the invention enable one to predict or reasonably foretell the likely effect of one or more IGFlR modulators in different
biological systems or for cellular responses. The biomarkers and biomarker sets can be used in in vitro assays of IGFlR modulator response by test cells to predict in vivo outcome. In accordance with the invention, the various biomarkers and biomarker sets described herein, or the combination of these biomarker sets with other biomarkers or markers, can be used, for example, to predict and monitor how patients with cancer might respond to therapeutic intervention with one or more IGFlR modulators.
A biomarker and biomarker set of cellular gene expression patterns correlating with sensitivity or resistance of cells following exposure of the cells to one or more IGFlR modulators provides a useful tool for screening one or more tumor samples before treatment with the IGFlR modulator. The screening allows a prediction of cells of a tumor sample exposed to one or more IGFlR modulators, based on the expression results of the biomarker and biomarker set, as to whether or not the tumor, and hence a patient harboring the tumor, will or will not respond to treatment with the IGFlR modulator.
The biomarker or biomarker set can also be used as described herein for monitoring the progress of disease treatment or therapy in those patients undergoing treatment for a disease involving an IGFlR modulator.
The biomarkers also serve as targets for the development of therapies for disease treatment. Such targets may be particularly applicable to treatment of cancer, such as, for example, hepatocellular carcinoma, colorectal cancer (CRC), NSCLC, and metastatic breast cancer.
Indeed, because these biomarkers are differentially expressed in sensitive and resistant cells, their expression patterns are correlated with relative intrinsic sensitivity of cells to treatment with IGFlR modulators. Accordingly, the biomarkers highly expressed in resistant cells may serve as targets for the development of new therapies for the tumors which are resistant to IGFlR modulators, particularly IGFlR inhibitors. The level of biomarker protein and/or mRNA can be determined using methods well known to those skilled in the art. For example, quantification of protein can be carried out using methods such as ELISA, 2-dimensional SDS PAGE, Western blot, immunopreciptation, immunohistochemistry, fluorescence activated cell sorting (FACS), or flow cytometry. Quantification of mRNA can be carried out using
methods such as PCR, array hybridization, Northern blot, in-situ hybridization, dot- blot, Taqman, or RNAse protection assay.
MICROARRAYS: The invention also includes specialized microarrays, e.g., oligonucleotide microarrays or cDNA microarrays, comprising one or more biomarkers, showing expression profiles that correlate with either sensitivity or resistance to one or more IGFlR modulators. Such microarrays can be employed in in vitro assays for assessing the expression level of the biomarkers in the test cells from tumor biopsies, and determining whether these test cells are likely to be resistant or sensitive to
IGFlR modulators. For example, a specialized microarray can be prepared using all the biomarkers, or subsets thereof, as described herein and shown in Tables 2-8. Cells from a tissue or organ biopsy can be isolated and exposed to one or more of the IGFlR modulators. In one aspect, following application of nucleic acids isolated from both untreated and treated cells to one or more of the specialized microarrays, the pattern of gene expression of the tested cells can be determined and compared with that of the biomarker pattern from the control panel of cells used to create the biomarker set on the microarray. Based upon the gene expression pattern results from the cells that underwent testing, it can be determined if the cells show a resistant or a sensitive profile of gene expression. Whether or not the tested cells from a tissue or organ biopsy will respond to one or more of the IGFlR modulators and the course of treatment or therapy can then be determined or evaluated based on the information gleaned from the results of the specialized microarray analysis.
ANTIBODIES:
The invention also includes antibodies, including polyclonal or monoclonal, directed against one or more of the polypeptide biomarkers. Such antibodies can be used in a variety of ways, for example, to purify, detect, and target the biomarkers of the invention, including both in vitro and in vivo diagnostic, detection, screening, and/or therapeutic methods.
KITS:
The invention also includes kits for determining or predicting whether a patient would be susceptible or resistant to a treatment that comprises one or more IGFlR modulators. The patient may have a cancer or tumor such as, for example, a breast cancer or tumor. Such kits would be useful in a clinical setting for use in testing a patient's biopsied tumor or cancer samples, for example, to determine or predict if the patient's tumor or cancer will be resistant or sensitive to a given treatment or therapy with an IGFlR modulator. The kit comprises a suitable container that comprises: one or more microarrays, e.g., oligonucleotide microarrays or cDNA microarrays, that comprise those biomarkers that correlate with resistance and sensitivity to IGFlR modulators, particularly IGFlR inhibitors; one or more IGFlR modulators for use in testing cells from patient tissue specimens or patient samples; and instructions for use. In addition, kits contemplated by the invention can further include, for example, reagents or materials for monitoring the expression of biomarkers of the invention at the level of mRNA or protein, using other techniques and systems practiced in the art such as, for example, RT-PCR assays, which employ primers designed on the basis of one or more of the biomarkers described herein, immunoassays, such as enzyme linked immunosorbent assays (ELISAs), immunoblotting, e.g., Western blots, or in situ hybridization, and the like, as further described herein.
APPLICATION OF BIOMARKERS AND BIOMARKER SETS:
The biomarkers and biomarker sets may be used in different applications. Biomarker sets can be built from any combination of biomarkers listed in Tables 2-8 to make predictions about the likely effect of any IGFlR modulator in different biological systems. The various biomarkers and biomarkers sets described herein can be used, for example, as diagnostic or prognostic indicators in disease management, to predict how patients with cancer might respond to therapeutic intervention with compounds that modulate the IGFlR, and to predict how patients might respond to therapeutic intervention that modulates signaling through the entire IGFlR regulatory pathway.
While the data described herein were generated in cell lines that are routinely used to screen and identify compounds that have potential utility for cancer therapy,
the biomarkers have both diagnostic and prognostic value in other diseases areas in which signaling through IGFlR or the IGFlR pathway is of importance, e.g., in immunology, or in cancers or tumors in which cell signaling and/or proliferation controls have gone awry. In accordance with the invention, cells from a patient tissue sample, e.g., a tumor or cancer biopsy, can be assayed to determine the expression pattern of one or more biomarkers prior to treatment with one or more IGFlR modulators. Success or failure of a treatment can be determined based on the biomarker expression pattern of the cells from the test tissue (test cells), e.g., tumor or cancer biopsy, as being relatively similar or different from the expression pattern of a control set of the one or more biomarkers. Thus, if the test cells show a biomarker expression profile which corresponds to that of the biomarkers in the control panel of cells which are sensitive to the IGFlR modulator, it is highly likely or predicted that the individual's cancer or tumor will respond favorably to treatment with the IGFlR modulator. By contrast, if the test cells show a biomarker expression pattern corresponding to that of the biomarkers of the control panel of cells which are resistant to the IGFlR modulator, it is highly likely or predicted that the individual's cancer or tumor will not respond to treatment with the IGFlR modulator.
The invention also provides a method of monitoring the treatment of a patient having a disease treatable by one or more IGFlR modulators. The isolated test cells from the patient's tissue sample, e.g., a tumor biopsy or blood sample, can be assayed to determine the expression pattern of one or more biomarkers before and after exposure to an IGFlR modulator wherein, preferably, the IGFlR modulator is an IGFlR inhibitor. The resulting biomarker expression profile of the test cells before and after treatment is compared with that of one or more biomarkers as described and shown herein to be highly expressed in the control panel of cells that are either resistant or sensitive to an IGFlR modulator. Thus, if a patient's response is sensitive to treatment by an IGFlR modulator, based on correlation of the expression profile of the one or biomarkers, the patient's treatment prognosis can be qualified as favorable and treatment can continue. Also, if, after treatment with an IGFlR modulator, the test cells don't show a change in the biomarker expression profile corresponding to the control panel of cells that are sensitive to the IGFlR modulator, it can serve as an
indicator that the current treatment should be modified, changed, or even discontinued. This monitoring process can indicate success or failure of a patient's treatment with an IGFlR modulator and such monitoring processes can be repeated as necessary or desired. The biomarkers of the invention can be used to predict an outcome prior to having any knowledge about a biological system. Essentially, a biomarker can be considered to be a statistical tool. Biomarkers are useful primarily in predicting the phenotype that is used to classify the biological system. In an embodiment of the invention, the goal of the prediction is to classify cancer cells as having an active or inactive IGFlR pathway. Cancer cells with an inactive IGFlR pathway can be considered resistant to treatment with an IGFlR modulator.
EXAMPLES: Methods and Samples: In the following examples, the compound (S)-4-(2-(3-chlorophenyl)-2- hydroxyethylamino)-3-(4-methyl-6-morpholino-lH-benzo[(i]imidazol-2-yl)-pyridin- 2(l-Η)-one was used:

This compound is referred to herein as "compound 1." In the following examples, the compound (2S)-l-(4-((5-cyclopropyl-lH- pyrazol-3-yl)amino)pyrrolo[2,l-f][l,2,4]triazin-2-yl)-N-(6-fluoro-3-pyridinyl)-2- methyl-2-pyrrolidinecarboxamide was used:

This compound is referred to herein as "compound 2."
EXAMPLE l: IDENTIFICATION OF BIOMARKERS Methods and Materials
Cell lines:
All pediatric sarcoma and neuroblastoma cell lines were obtained from Dr. Lee Helman at NIH. All cell lines were grown in RPMI medium supplemented with Glutamax (Gibco/Invitrogen # 61870-036), 10% inactivated fetal bovine serum
(Gibco/Invitrogen # 16140-071), 1OmM Hepes, penicillin and streptomycin. For the baseline profiling study, cells were harvested at 70-80% confluence; and for drug treatment study, two rhabdomyosarcoma (RMS) cell lines Rh36 and Rh41 were treated with 0.35 μM compound 1 for 6, 36 and 72 hours before harvest. To develop the compound 1 -resistant RDl, the sensitive RD-I cells (IC50=0.238 μM to compound 1) were first exposed to the dug at the IC50 concentration and passed as the cultures reached 70-80% confluence. The concentration of compound 1 was increased gradually every other culture passage and the IC50 value for the compound in these cells was measured periodically during this treatment time until the resistance level reached a plateau. The resulted RDl-Resist cells has
 1.999 μM to compound 1, more than 8 fold of the parental RDl. In vitro cellular proliferation assays:
Proliferation was evaluated by incorporation of [3 H] -thymidine into DNA after exposure to IGFlR inhibitor compound 1 or compound 2 to determine the sensitivity of cell lines to these compounds. Cells were plated at an optimized density for each cell line per well in 96-well microtiter Falcon plates, incubated overnight, and then exposed to a serial dilution of drug. After 72 hours incubation with drug at
37 0C, cells were pulsed with 4μCi/ml [6-3H] thymidine (Amersham Pharmacia Biotech, UK) for 3 hours, trypsinized, harvested onto UniFilter-96, GF/B plates (PerkinElmer, Boston, MA) and scintillation was measured on a TopCount NXT (Packard, CT). Results were expressed as an IC50, which is the drug concentration required to inhibit cell proliferation by 50% to that of untreated control cells. The mean IC50 and standard deviation (SD) from multiple tests for each cell line were calculated. Drug combination study:
A Dilution of Ratios Drug Combination method was used in cellular proliferation assays to determine whether there was synergy, additivity or antagonism when two compounds were added simultaneously to a variety of human tumor cells in vitro (R. Tallarida, R. J., Drug Synergism and Dose-Effect Data Analysis. 1st edition ed. Chapman & Hall/CRC (2000)). Drug stock solutions for two compounds, are combined in ratios of 10: 1, 5: 1, 3: 1, 1: 1, 1:3, 1 :5. These ratios, as well as the individual compound stock solutions, are diluted in a serial manner, using 70%
DMSO. These serial dilutions are then mixed with RPMI growth medium, and added to cells to test the IC50 values of single agent as well as two compounds in the cellular proliferation assays. Combination Indexes with 95% confidence intervals were used to determine if the combination results represented synergistic, additive, or antagonistic effect.
Gene expression profiling:
RNA was isolated from the cultured cells using the RNeasy™ kits from Qiagen (Valencia, CA). 10 μg of total RNA from each cell line was used to prepare biotinylated probe according to the Affymetrix Genechip® Expression Analysis Technical Manual, 2001. Targets were hybridized to Affymetrix high density oligonucleotide array human HG-U133A 2.0 GeneChip® (Affymetrix, Santa Clara, CA). The arrays were then washed and stained using the GeneChip® Fluidics station and quantitated with GeneChip® Operating Software (GCOS) V 1.0 according to the manufacture's instructions. Protein extraction and tryptic digestion:
Total protein content for each cell lysate was determined by the bicinchoninic acid assay (Pierce, Rockford, IL). An aliquot from each lysate containing 200 μg total protein was withdrawn for further processing.
The normalized samples were chloroform-methanol precipitated using a protein extraction kit (Calbiochem, San Diego, CA). Pellets were solublized in a solution containing 8M urea, 200 mM ammonium bicarbonate, and 40 mM DTT. Samples were diluted 4-fold, trypsin was added at 1 :50 enyzme:substrate ratio and incubated overnight at 37 0C. Solid phase extraction: Solid phase extraction was performed using an Empore Cl 8 SPE plate (3M, St
Paul, MN) on a Quadr3 liquid handling workstation (Tomtec, Hamden, CT). Sample sequence on the plate was randomized to minimize systemic bias during processing. After sample loading, the SPE plate was washed with 450 μl water in 0.1% trifluoroacetic acid twice and eluted with 300 μl 95% acetonitrile in 0.1% trifluoroacetic acid twice.
Randomization, duplication, and lyophilization:
Samples were then split across two separate 96-well plates (VWR, West Chester, PA) in a separate randomized order. This process generated two technical replicates for each sample. Following lyophilization on a SpeedVac (Thermo Savant, Holbrook, NY), samples were stored at -80 0C before analysis. Liquid chromatography-mass spectrometry:
Samples of tryptic peptides were separated on an Zorbax 300SB-C18 column (0.5 x 150 mm, 3.5μm) from Agilent (Santa Clara, CA) equipped with a 0.5μm pre- column filter (Opti-solve). The mobile phases were delivered at a total flow rate of 12 μl/min by an Agilent 1100 Capillary HPLC system. Mobile phase A was water in 0.2% isopropyl alcohol, 0.1% acetic acid and 0.001% trifluoroacetic acid; Mobile B was 95% acetonitrile in 0.2% isopropyl alcohol, 0.1% acetic acid and 0.001% trifluoroacetic acid. The following gradient was used to separate the peptides:
The peptide ions generated from statistical analyses were sequenced by tandem mass spectrometry (MS/MS). Samples were rerun onto the same LC-MS system in data dependant mode in which the MS survey scan would switch to MSMS product scan when targeted peptide ions were found at the same retention time and mass. MS/MS spectra were generated and submitted to SEQUEST search (J. Eng, et al., J. Am. Soc. Mass. Spectrom., 5: 976-989 (1994)) to yield protein identifications.
Statistical Analysis Analysis of baseline gene and protein expression of 29 cell lines:
The gene expression raw data were normalized by the Robust Multichip Average (RMA, R. Irizarry, et al., Biostatistics;4(2):249-64 (2003)) method and log2 transformed, while the protein profiling data was quantile normalized and Iog2 transformed. To identify genes or proteins whose expression level significantly correlation with the drug sensitivity for the compounds, two separate statistic analyses were performed. First, a two-sample t-test between the resistant and sensitive cell lines (based on a threshold IC50 cutoff of 0.35 μM) was performed. Second, Pearson
correlation between the normalized expression level of each gene/protein and the log2(IC5o) values of the 29 cell lines was calculated to identify genes/proteins correlated with the drug sensitivity (IC50).
Analysis of gene and protein expression data of cells with drug treatment: Pre-filter was applied to both gene and protein expression data. Lowly expressed probe sets with normalized and Iog2 transformed expression values less than 5 cross all samples were removed resulting probe sets of 10,479 for gene expression data. For peptide, it must be found in at least 15 LCMS experimental runs and for subsequent statistical analysis in at least 20 cell lines. This filter reduced the number of overall peptides to 9022 for further analysis. A two-way ANOVA mixed model was applied to each probe set in the gene expression profiling data, as well as each peptide in the protein expression profiling data, separately. The model that was applied to each dataset was nearly identical except for a single term in the model applied to the protein expression data which appropriately accounted for the existence of the technical replicates. The analysis was run using SAS version 9.1 (SAS Institute Inc., Cary, NC, USA). The general form of the model was as follows: (Intensity ~ Treatment + Time + Treatment x Time + Error) where Intensity represents the normalized, Iog2 transformed intensity; Treatment is a term that captures candidates that display significant differential expression upon treatment; Time is a term that captures candidates that display significant differential expression over time; and the Treatment x Time term captures candidates that display significant differential expression upon treatment with compound over time as compared with control. The multiple testing with False Discovery Rate (FDR; Y. Benjamini, et al., J. Roy. Stat. Soc. B.; 57:289-300 (1995)) was apply to each dataset separately, the total of 2056 probe sets with FDR p value<0.05 in either the Treatment effect or Treatment x Time interaction and the fold change between treatment group vs. DMSO control group is greater than 1.2 fold or less than -1.2 fold were selected. Globaltest pathway analysis:
RMA normalized baseline expression data for 28 sarcoma cell lines was first filtered based on following criteria: 1) Maximal expression level across all samples must be greater than 5; 2) Coefficient of Variation (CV) must by greater than 0.03. These resulted a total of 17276 probe sets for further analysis. Globaltest was carried
out with Bioconductor (www.bioconductor.org) package (Version 4.4.0) using this filtered dataset and compound 1 resistant/sensitive classification for each cell line against a collection of 183 KEGG pathways. The p value indicating the association between expression values and resistant/sensitive classifications, as well as its multiplicity-adjusted version, FWER (Holm's method), were reported for each pathway. Gene plots were generated for interesting pathways according to user's guide (J. Geoman, et al, Testing association of a pathway with a clinical variable. Package globaltest. Version 4.4.0. (Oct 2006)) and used to assess the influence of each gene in a specific pathway on the drug sensitivity classification. For Rh41 drug treatment study, expression datasets were first filtered to remove probe sets whose maximal expression level less than 5, which resulted 9269 probe sets. Globaltest was carried out similar as above, with treatment (DMSO control vs. compound 1) as grouping factor. It gives a bar and a reference line for each gene tested. The reference line for each bar gives the expected height under the null hypothesis that the gene is not associated with the sensitivity classification. Marks indicate with how many standard deviations (under the null hypothesis) the bar exceeds the reference line. Bars are colored based on sensitivity classification. The test statistic for a pathway is the average of the bars for all the genes tested. Ingenuity pathway analysis: 497 baseline markers correlated with sensitivity to compound 1 were imported into Ingenuity pathway analysis. Network nodes were colored by the fold change between sensitive and resistant cells. For the drug modulated markers, treatment- induced probe sets in the sensitive cell line Rh41 (FDR adjusted treatment effect less than 0.05, or FDR adjusted treatment-time-interaction less than 0.05) were used for pathway analysis. Genes on canonical pathways were colored based on the fold change between cells with compound 1 treatment and DMSO control.
Results
The Sensitivity classification of the 29 pediatric sarcoma cell lines to IGFlR inhibitors:
The sensitivity to IGFlR inhibitors compound 1 and compound 2 for each of the 29 pediatric sarcoma and neuroblastoma cell lines was determined by cellular
proliferation assays and expressed in term of drug concentration required for 50% cell proliferation inhibition (IC50). The results are summarized in Table 1, and a wide range of activity in this panel of cancer cell lines was observed for both compound 1 and compound 2 compounds.
TABLE 1 - The IC50 of each cell line and sensitive/resistant classification to compounds 2 and 1. "S" means sensitive and "R" means resistant to the corresponding compounds. The cell subtypes are also indicated.

Comparing the IC50 data of these two compounds, compound 2 is more potent than compound 1 in most of the cell lines tested. To classify the cell lines as sensitive or resistant to the compounds, the IC50 value for each cell line was log-transformed, and the mean of logioflCso) across all cell lines was calculated. The sensitivity/resistance phenotype of the cell lines to compound 1 or compound 2 was classified as follows: the cell lines with logioflCso) below the mean logioflCso) of all cell lines were defined as sensitive to the compound, while those with logioflCso) above the mean logioflCso) were considered to be resistant to the compound. As shown in Table 1, 16 cell lines were classified as sensitive and 12 cell lines classified as resistant (ToI 84-T was not tested) for compound 1; whereas 15 and 14 cell lines were classified as either sensitive or resistant to compound 2, respectively. Although the sensitivity/resistance demarcation is arbitrary, apparently, the cut off is around 0.35 μM for both compounds. In general, both compounds have a similar sensitivity/resistance profile in this panel of cell lines with the exception of three cell lines that having IC50 values around the borderline of the sensitive/resistant demarcation: CTR was defined as sensitive to compound 2
 0.2526 μM) but resistant to compound 1
 0.37 μM), whereas JD and SK-NAS were defined as resistant to compound 2 but resistant to compound 1. Relation between the drug sensitivity and cell subtypes:
The correlation between the sensitive/resistant classification and different subtypes of cell lines was further explored. Interestingly, the sensitivity of these cell lines to IGFlR inhibitor compounds was found to be closely related to specific subtypes. As shown in Table 1, most of Ewing's, RMS and neuroblastoma cells are sensitive to the compounds, whereas all fibrosarcoma, leiomyosarcoma, liposarcoma and malignant pleural mesothelioma cells are resistant. The distribution of cell subtypes is significantly different in sensitive and resistant classes with p-value=0.011 for compound 2 and p-value=0.004 for compound 1, respectively in the chi- square test. Although the sample size for each subtype is not big enough to be conclusive, the results may suggest that certain subtypes of sarcoma are more responsive than others,
and these responsive tumor types may represent patient subpopulations to be targeted in clinical studies for IGFlR inhibitors.
Identification of genes/proteins with expression significantly correlated with the sensitivity to IGFlR inhibitors: The expression level of the drug target IGFlR was evaluated and apparently did not significantly correlate to the sensitivity of compound 2 and/or compound 1 in the 29 cancer cell lines, so IGFlR level is not useful to predict response to compound 2 and/or compound 1 in cancer cells or in patients. Other predictive biomarkers are needed for selecting the potential targeted patient population. To identify genes or proteins whose basal expression patterns were strongly correlated with the sensitivity to compounds 1 and 2, gene expression profiling and proteomics were performed in parallel using the 29 pediatric sarcoma and neuroblastoma cancer cell lines (RDES and Rh4 were not included in protein profiling). Two statistical methods were used in analyzing both expression datasets: first, two sample Mest was performed to identify genes differentially expressed between sensitive and resistant cell line groups (p<0.001, 2-fold); second, to avoid the bias of arbitrary cut off for the sensitive/resistant demarcation, the Pearson correlations between the log2(IC5o) value and the expression level of each gene or protein in all cell lines were calculated to identify genes/proteins significantly correlated with the drug sensitivity (p<0.001). The overlap between these two analyses led to selection of genes/proteins that are significantly correlated with the drug sensitivity/resistance classification for compound 1 or compound 2. For gene expression profiling, there are a total of 497 probe sets with 386 unique genes significantly correlated with the sensitivity to compound 1 (Table T), and 368 probe sets with 282 unique genes significantly correlated with the sensitivity to compound 2 (Table 3); and. There are 98 or 124 genes highly expressed in the cell lines sensitive to compound 2 or to compound 1, conversely, 184 or 262 genes are highly expressed in the cell lines resistant to compound 2 or compound 1, respectively, with 227 common markers for these two compounds.
TABLE 2 - Genes correlated with the sensitivity of 28 sarcoma cell lines to compound 1 as identified by Affymetrix gene array. The genes were selected by two
statistic analyses: t-test (p<0.001 and 2 fold between the groups of 16 sensitive cell lines and 12 resistant cell lines) and the Pearson correlations between the log2(IC5o) data and the expression level of each gene in the 28 cell lines (p<0.001). The overlapped genes listed here with p values and fold change indicated. The genes are rank ordered by the fold changes. The positive fold changes indicate the genes have higher expression level in the sensitive cell lines and the negative fold changes indicate the genes have higher expression level in the resistant cell lines.


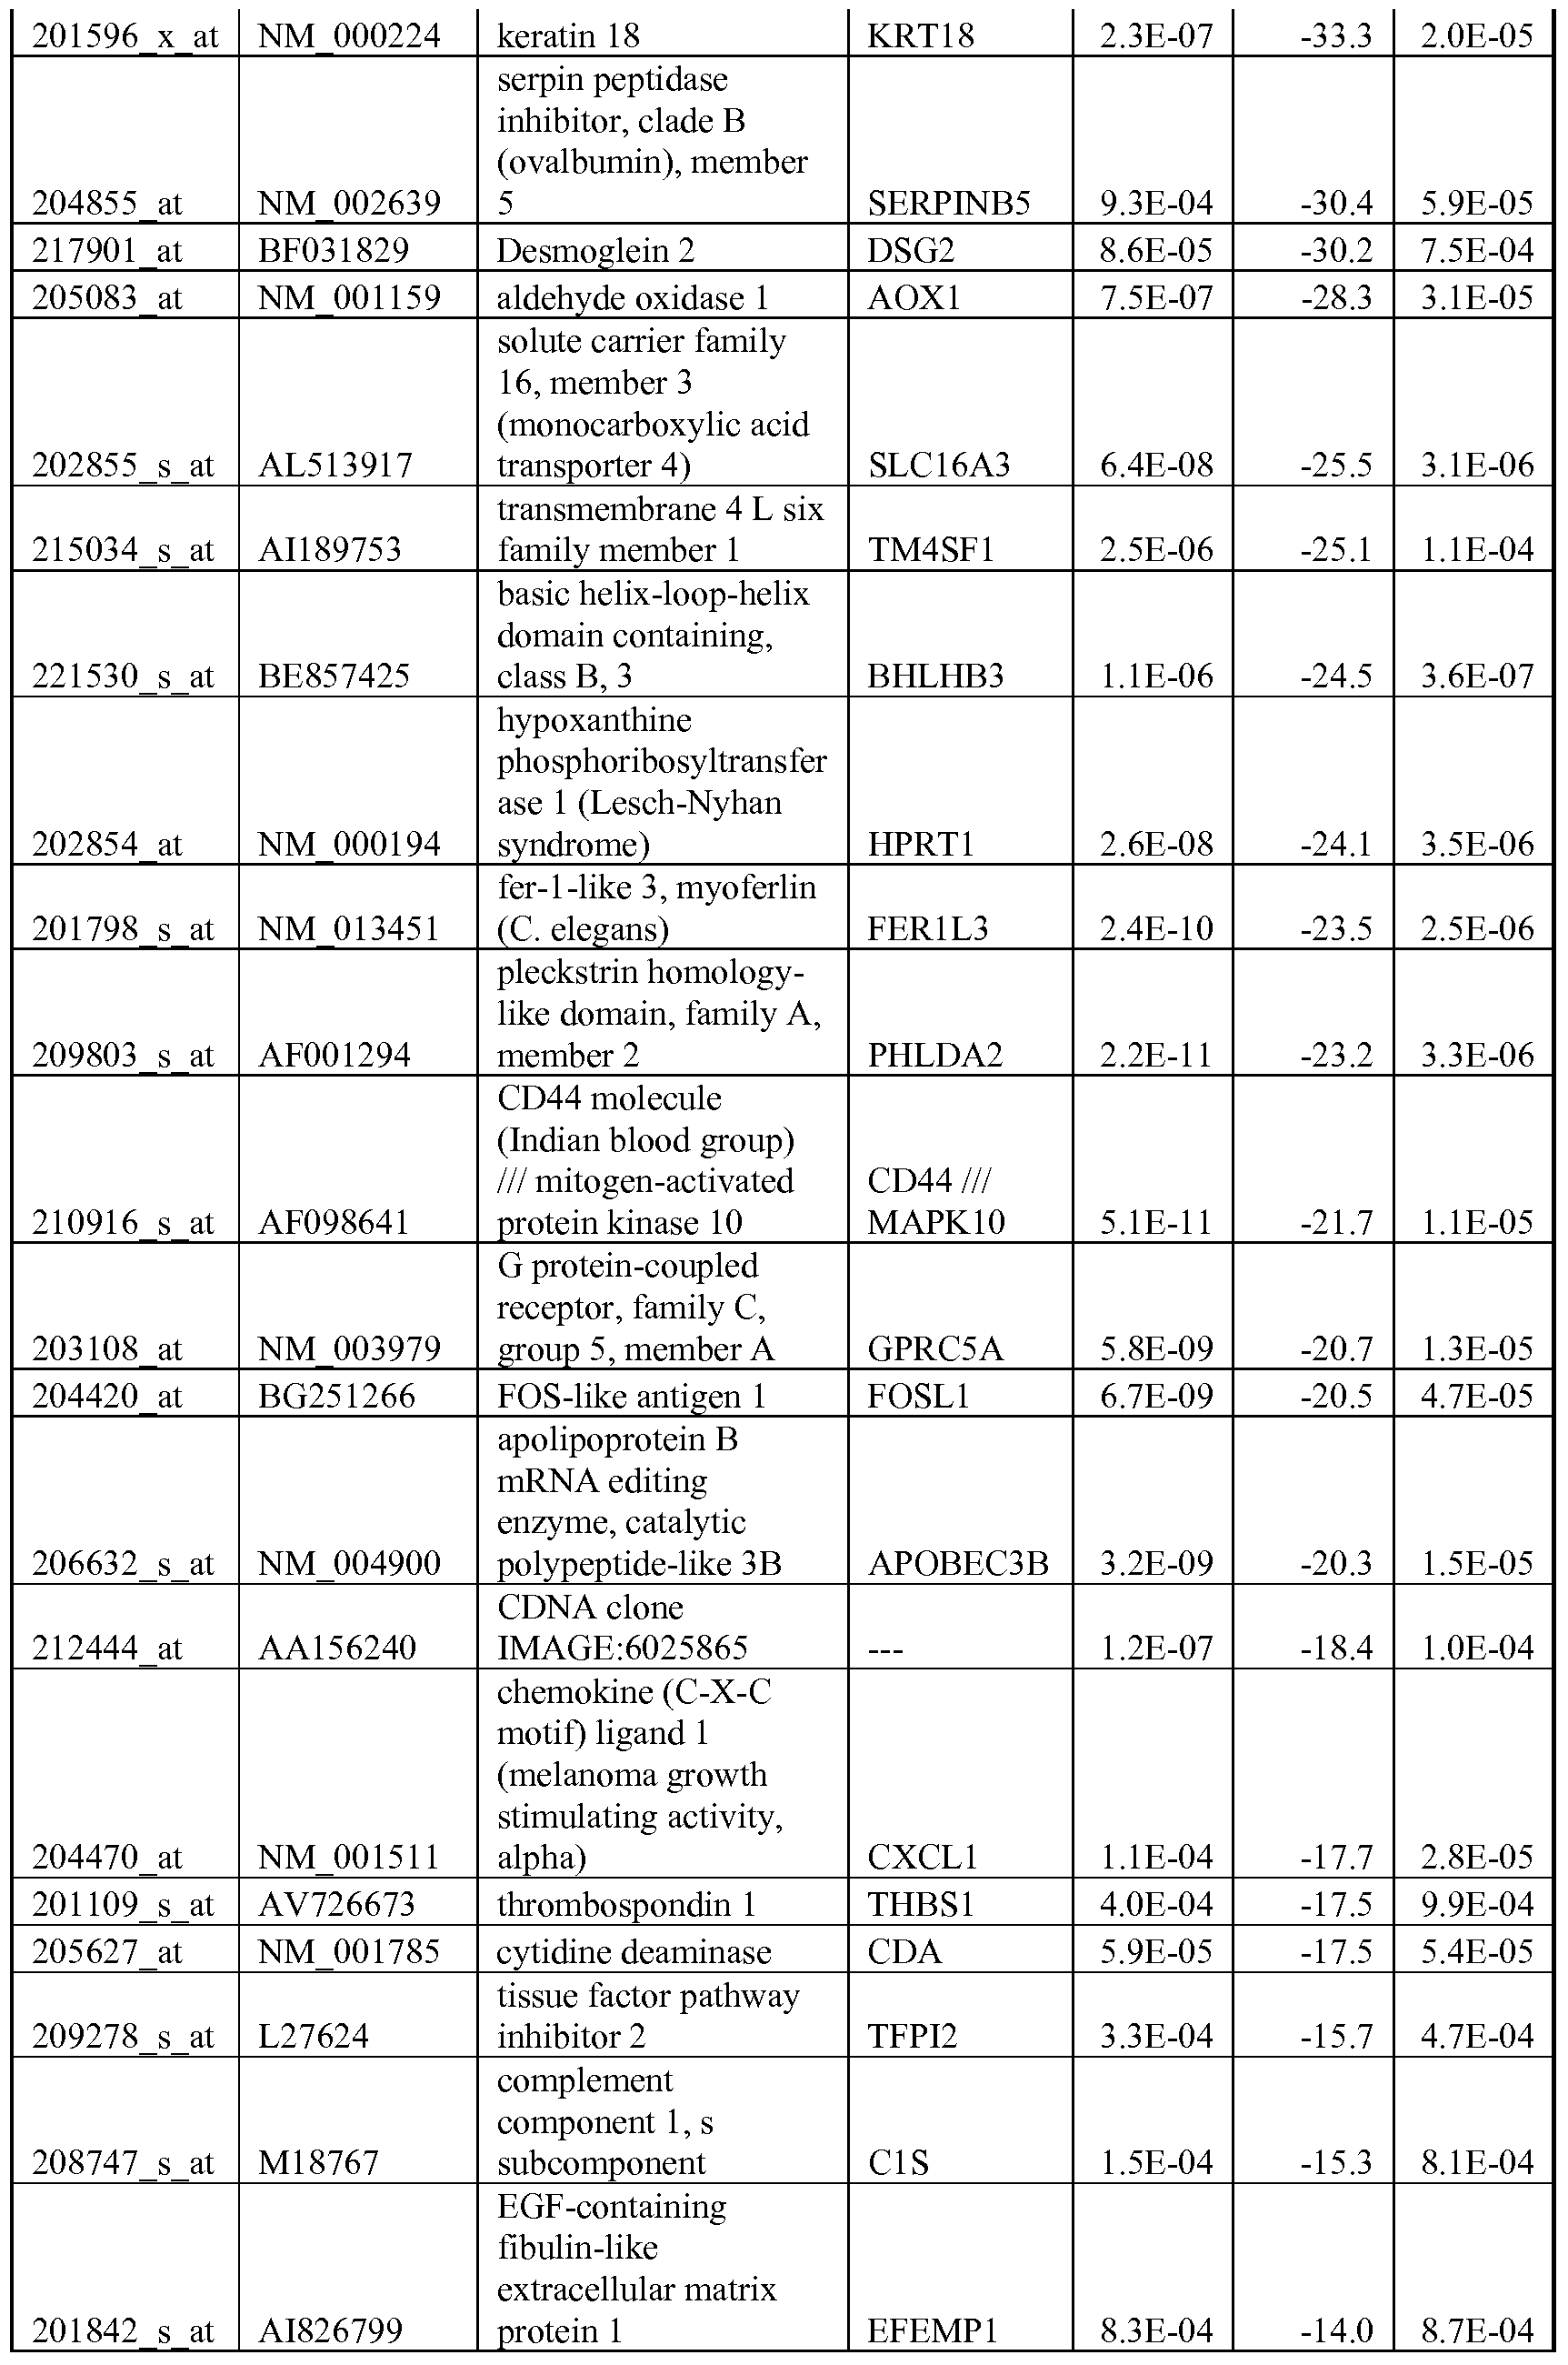


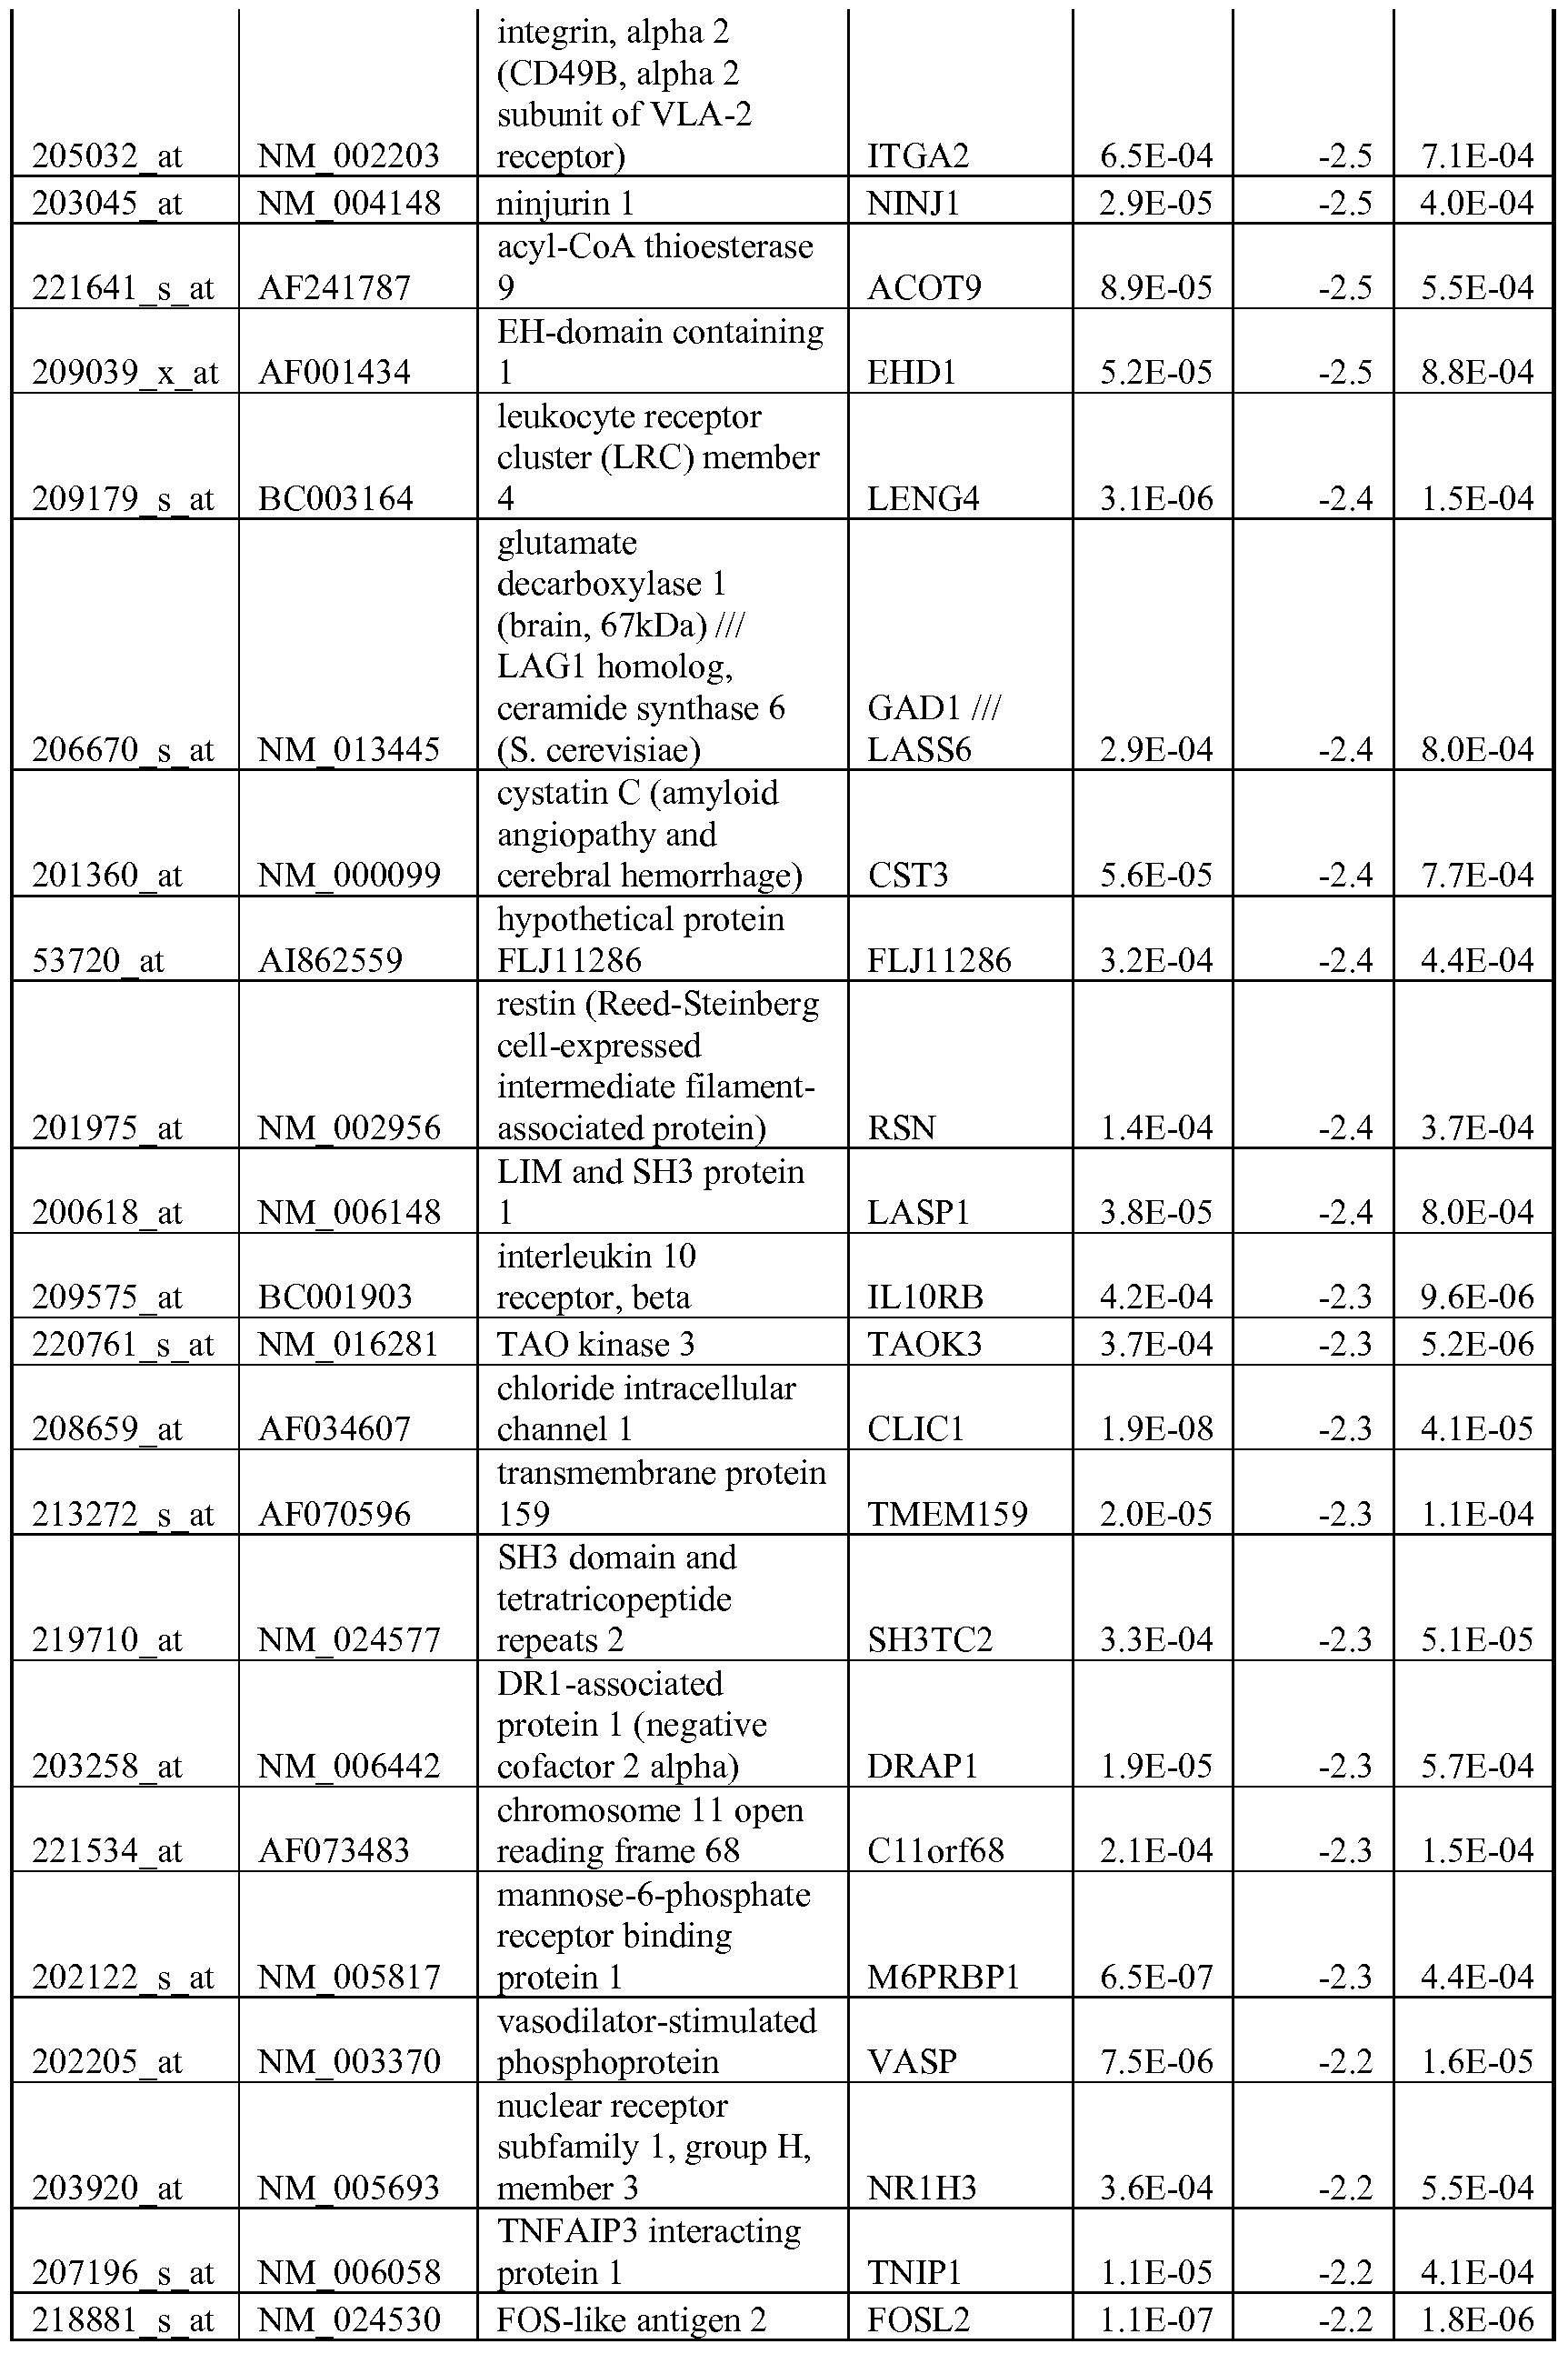


**TABLE 3 - Genes correlated with the sensitivity of 29 sarcoma cell lines to compound 2 as identified by Affymetrix gene array. The genes were selected by two statistic analyses: t-test (p<0.001 and 2 fold between the groups of 15 sensitive cell lines and 14 resistant cell lines) and the Pearson correlations between the log2(IC5o) data and the expression level of each gene in the 29 cell lines (p<0.001). The overlapped genes listed here with p values and fold change indicated. The genes are rank ordered by the fold changes. The positive fold changes indicate the genes have higher expression level in the sensitive cell lines and the negative fold changes indicate the genes have higher expression level in the resistant cell lines.


The same two statistical methods were applied to protein profiling data to identify proteins that correlated with the sensitivity of the cell lines to IGFlR inhibitors. This yielded 251 unique peptide ions for compound 1, and 228 unique peptide ions for compound 2, 153 of which overlap between the two compounds. These unique peptide ions were then sequenced by tandem mass spectrometry to obtain the identity of the corresponding protein markers. As shown in Table 4, 76 peptides were identified to represent 46 proteins that were differentially expressed between the sensitive and resistant cell line groups for compound 1; and 70 peptides representing 45 proteins (Table 5) for compound 2, with 39 proteins common for both compounds.
TABLE 4 - Proteins correlated with the sensitivity of 26 sarcoma cell lines to compound 1 as identified by LC/MS based protein profiling. The peptide ions were selected by the overlaps between the two statistic analyses: t-test (p<0.001 and 2 fold between the groups of 14 sensitive cell lines and 12 resistant cell lines) and the Pearson correlations between the log2(IC5o) data and the expression level of each peptide ion in the 26 cell lines (p<0.001). The peptide ions generated from statistical analyses were sequenced by tandem mass spectrometry to get the identification of the proteins which are listed in this Table. The name of protein and gene, the sequence of
each peptide ion associated with identified protein are listed. The overlap with Affymetrix gene expression results also indicated.


TABLE 5 - Proteins correlated with the sensitivity of 27 sarcoma cell lines to compound 2 as identified by LC/MS based protein profiling. The peptide ions were selected by the overlaps between the two statistic analyses: t-test (p<0.001 and 2 fold between the groups of 13 sensitive cell lines and 14 resistant cell lines) and the
Pearson correlations between the log2(IC5o) data and the expression level of each peptide ion in the 27 cell lines (p<0.001). The peptide ions generated from statistical analyses were sequenced by tandem mass spectrometry to get the identification of the proteins which are listed in this Table. The name of protein and gene, the sequence of
each peptide ion associated with identified protein are listed. The overlap with Affymetrix gene expression results also indicated.


In general, a higher number of genes than proteins was identified using the same statistic analyses due to the complicity of the protein profiling technology. Cross comparing the gene and protein profiling results, the overlaps between identified genes and proteins are significantly large as indicated in Tables 4 and 5. 71.7% (33 out 46) proteins for compound 1 and 73.3% (33 out 45) proteins for
compound 2 also identified in gene expression profiling, respectively, suggesting good concordance between the results detected by the two technologies. For some of the markers identified by the protein profiling, for example, ATP2B4, it was also detected as significantly differentially expressed between the sensitive and resistant cell lines (-2.3 fold and p values are 0.0043 and 0.0016 for t-test and correlation test, respectively) by gene profiling, yet did not meet the stringent statistical cutoff of p values of 0.001. Genes/proteins modulated by IGFlR inhibitor compound 1 treatment:
There is differential sensitivity of compound 1 in a pair of human RMS cell lines, Rh36 (resistant, IC5O=I.6μM) and Rh41 (sensitive, IC5o=O.O69μM). In order to understand the mechanism of the differential sensitivity, both cell lines were evaluated using gene expression profiling and proteomics analyses to search at genomics scale for genes or proteins that are differentially modulated by IGFlR inhibitor compound 1 in a time course study with the drug treatment for 6, 30 and 72 hours. Cell lysates were subjected in parallel to microarray and LC/MS based "bottom-up" protein profiling analyses. A two-way ANOVA mixed model was utilized to identify drug treatment effect as well as treatment and time interaction on the expression of genes and protein. Overall, there were some mRNA transcripts or peptides with expression change upon the drug treatment in Rh36 cell line at 6 hr, and these changes mainly reflected the initial stress response to the stimuli the cell encountered. However, the drug had little to no effect at later time points, 36 and 72hrs in Rh36 cells. This makes sense for the given concentration of compound 1 cell treated, Rh36 is highly resistant, so the drug had little effect on cell growth compared to the sensitive cell Rh41, which had dramatic changes in gene/protein expression. The genes and protein that were modulated by compound 1 in the sensitive RH41 cell line are listed in Table 6 and Table 7, respectively.
TABLE 6 - Genes modulated by compound 1 treatment in Rh41 cells. Cells were treated with 0.35 μM compound 1 for 6, 36 and 72 hours before harvest and subject to Affymetrix gene microarray analysis. Each sample was run in duplicates. A two-way
ANOVA mixed model: (Intensity ~ Treatment + Time + Treatment x Time + Error) was utilized to identify drug treatment effect as well as treatment and time interaction
on the expression of genes. The genes identified as modulated by the drug are those with FDR p value<0.05 in either the Treatment effect or Treatment x Time interaction and the fold change between treatment group and DMSO control group is greater than
1.2 fold or less than -1.2 fold and total of 2056 probe sets were selected and only 1697 representative unique genes are listed in this Table with redundant probe sets removed.

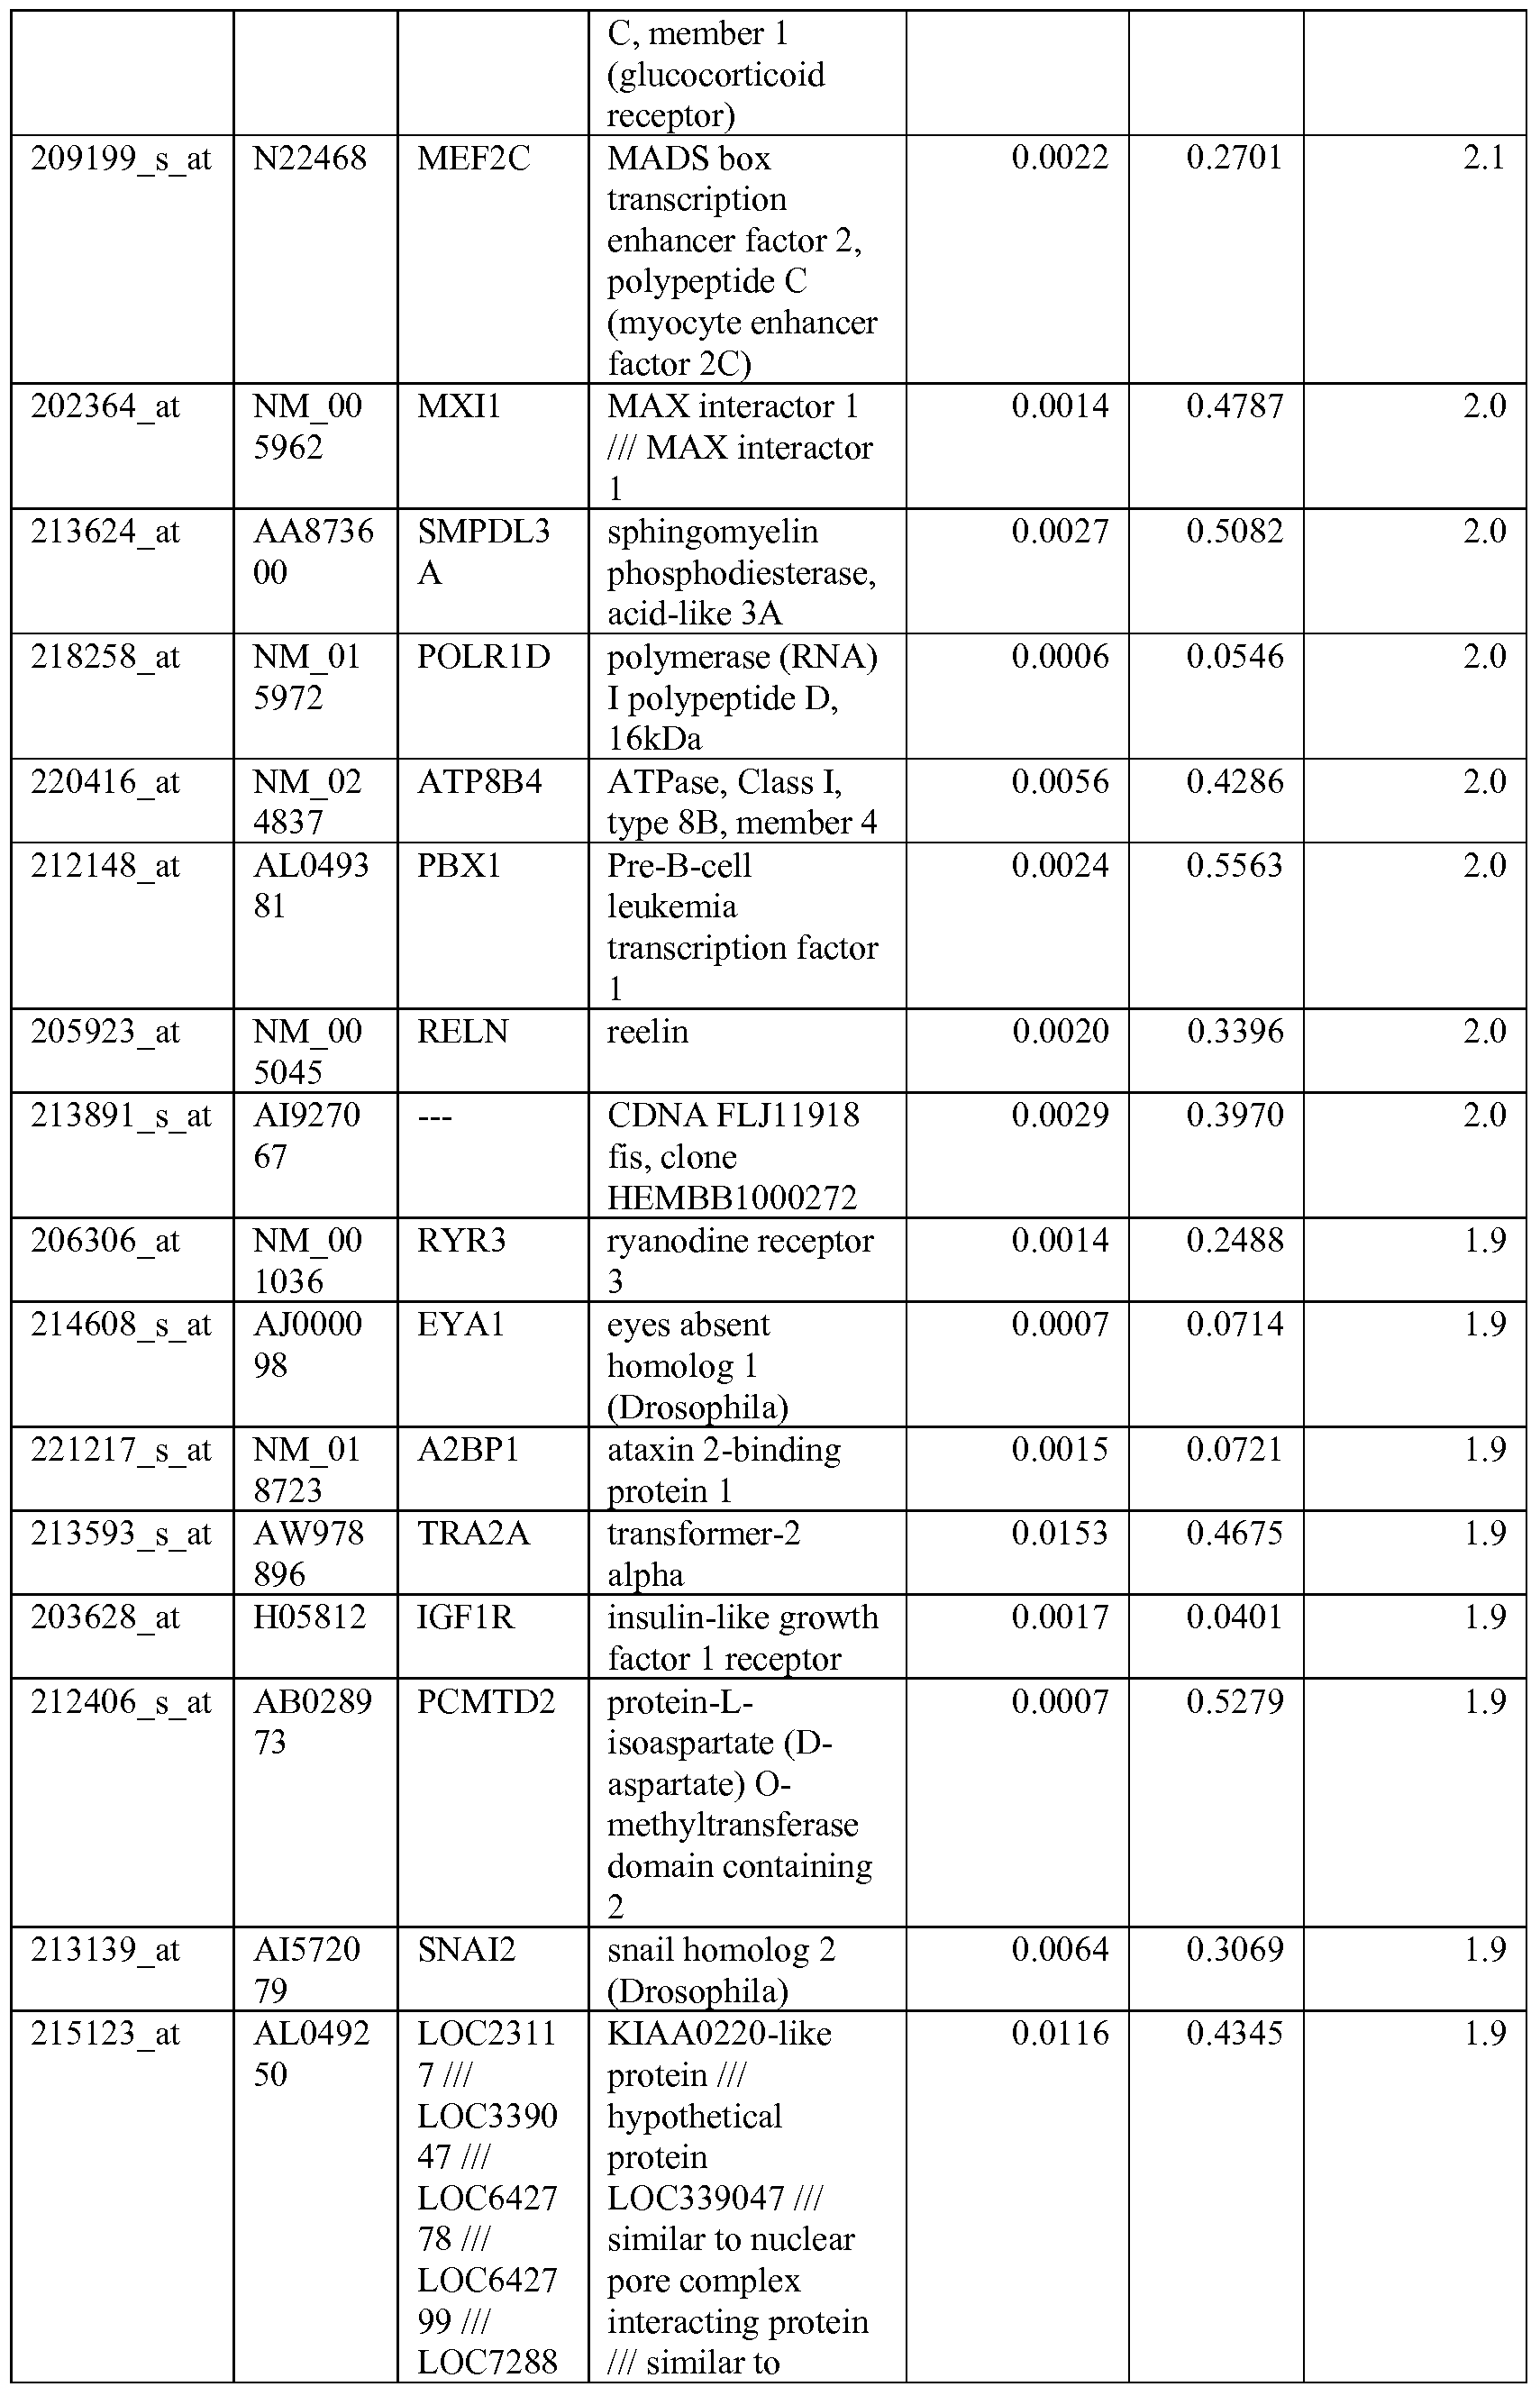


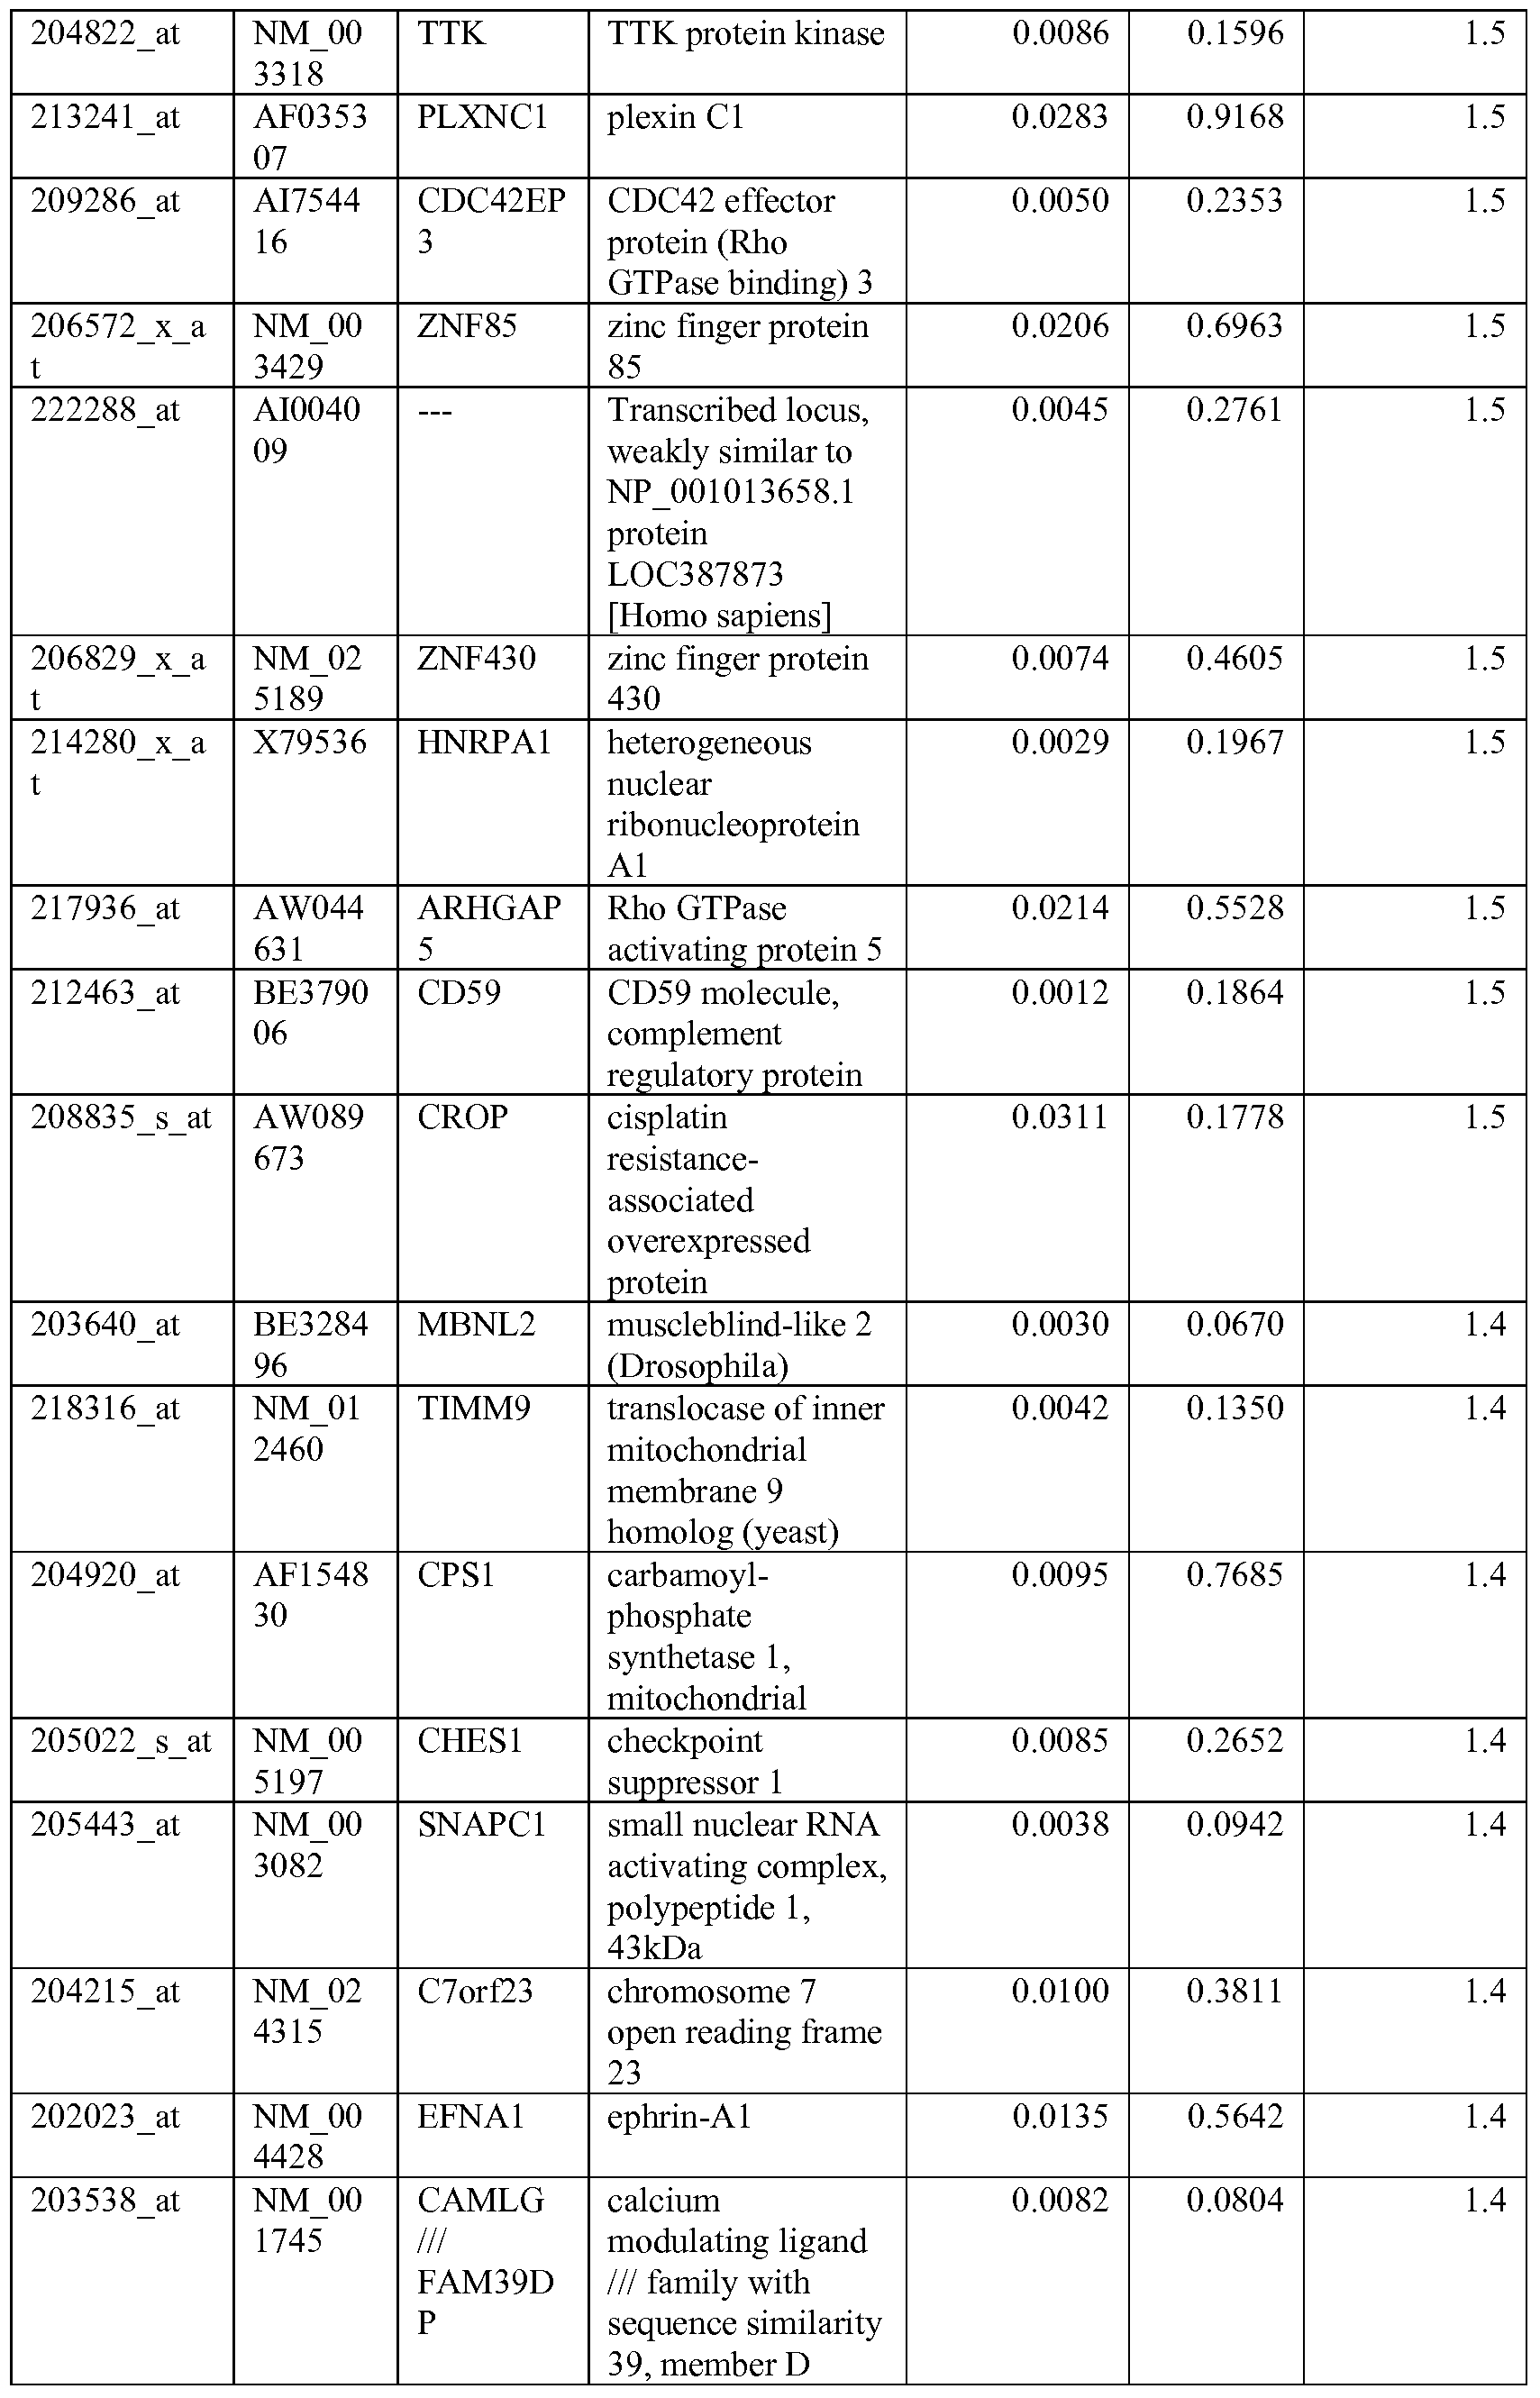


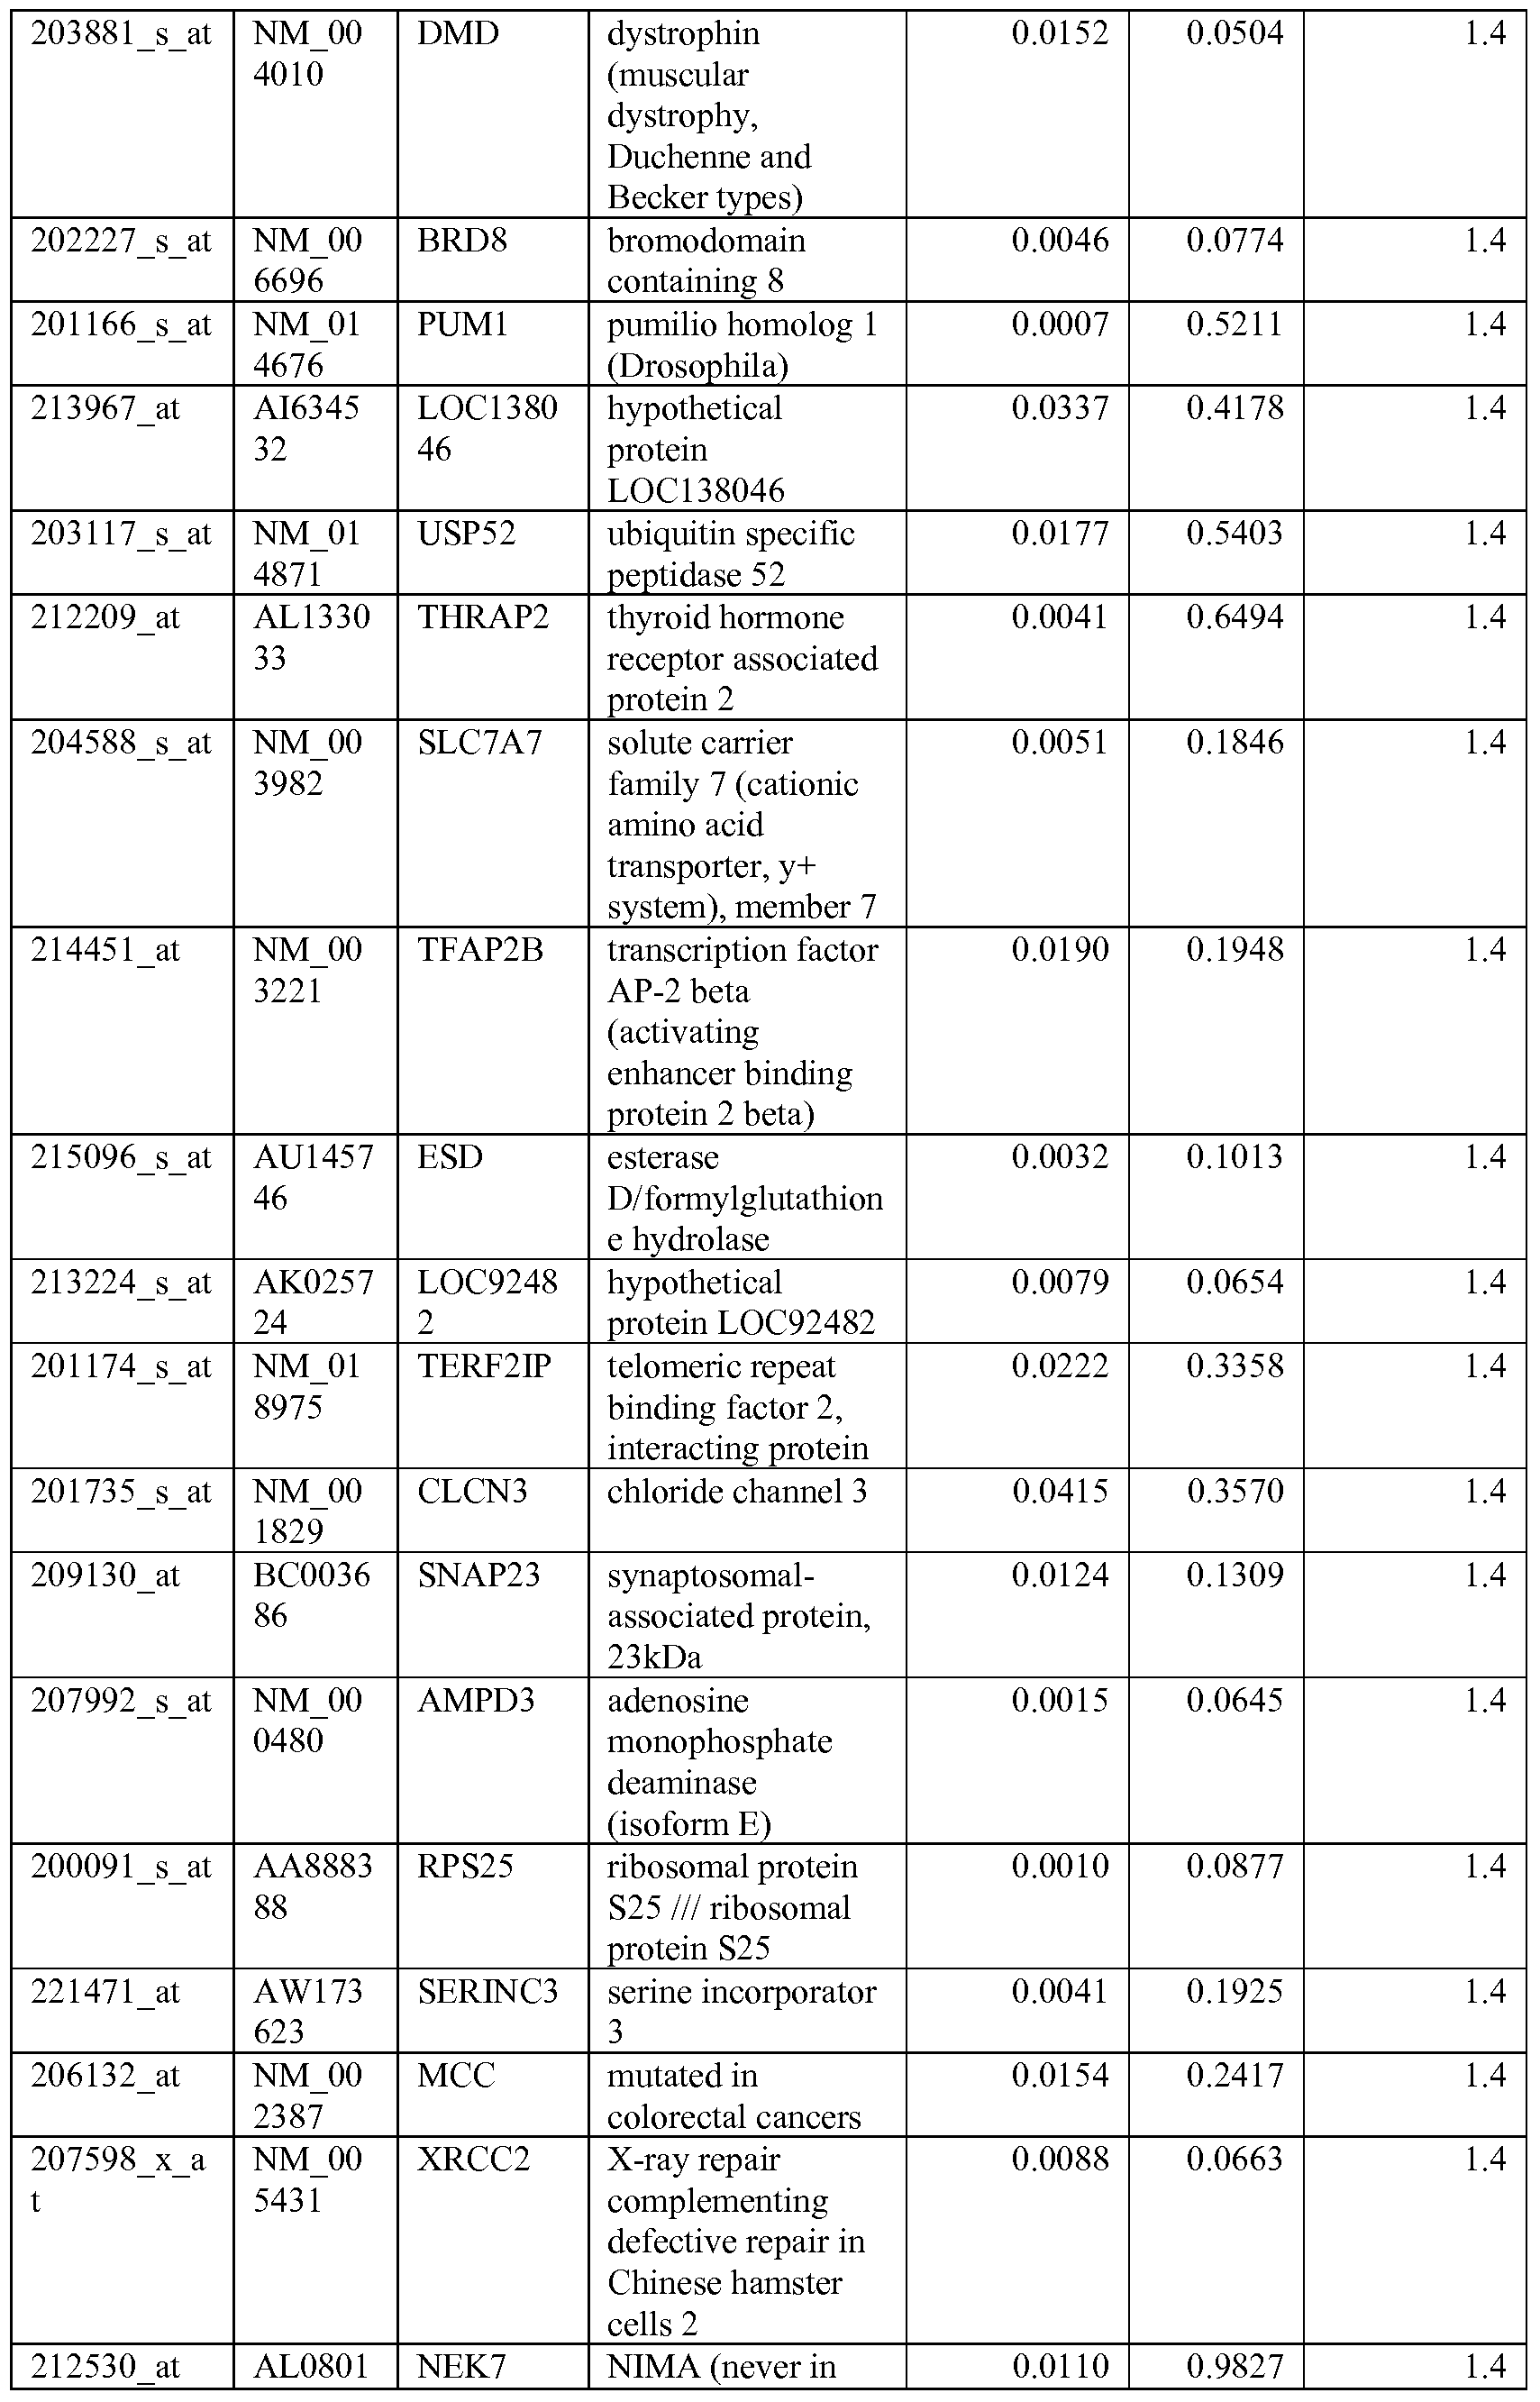


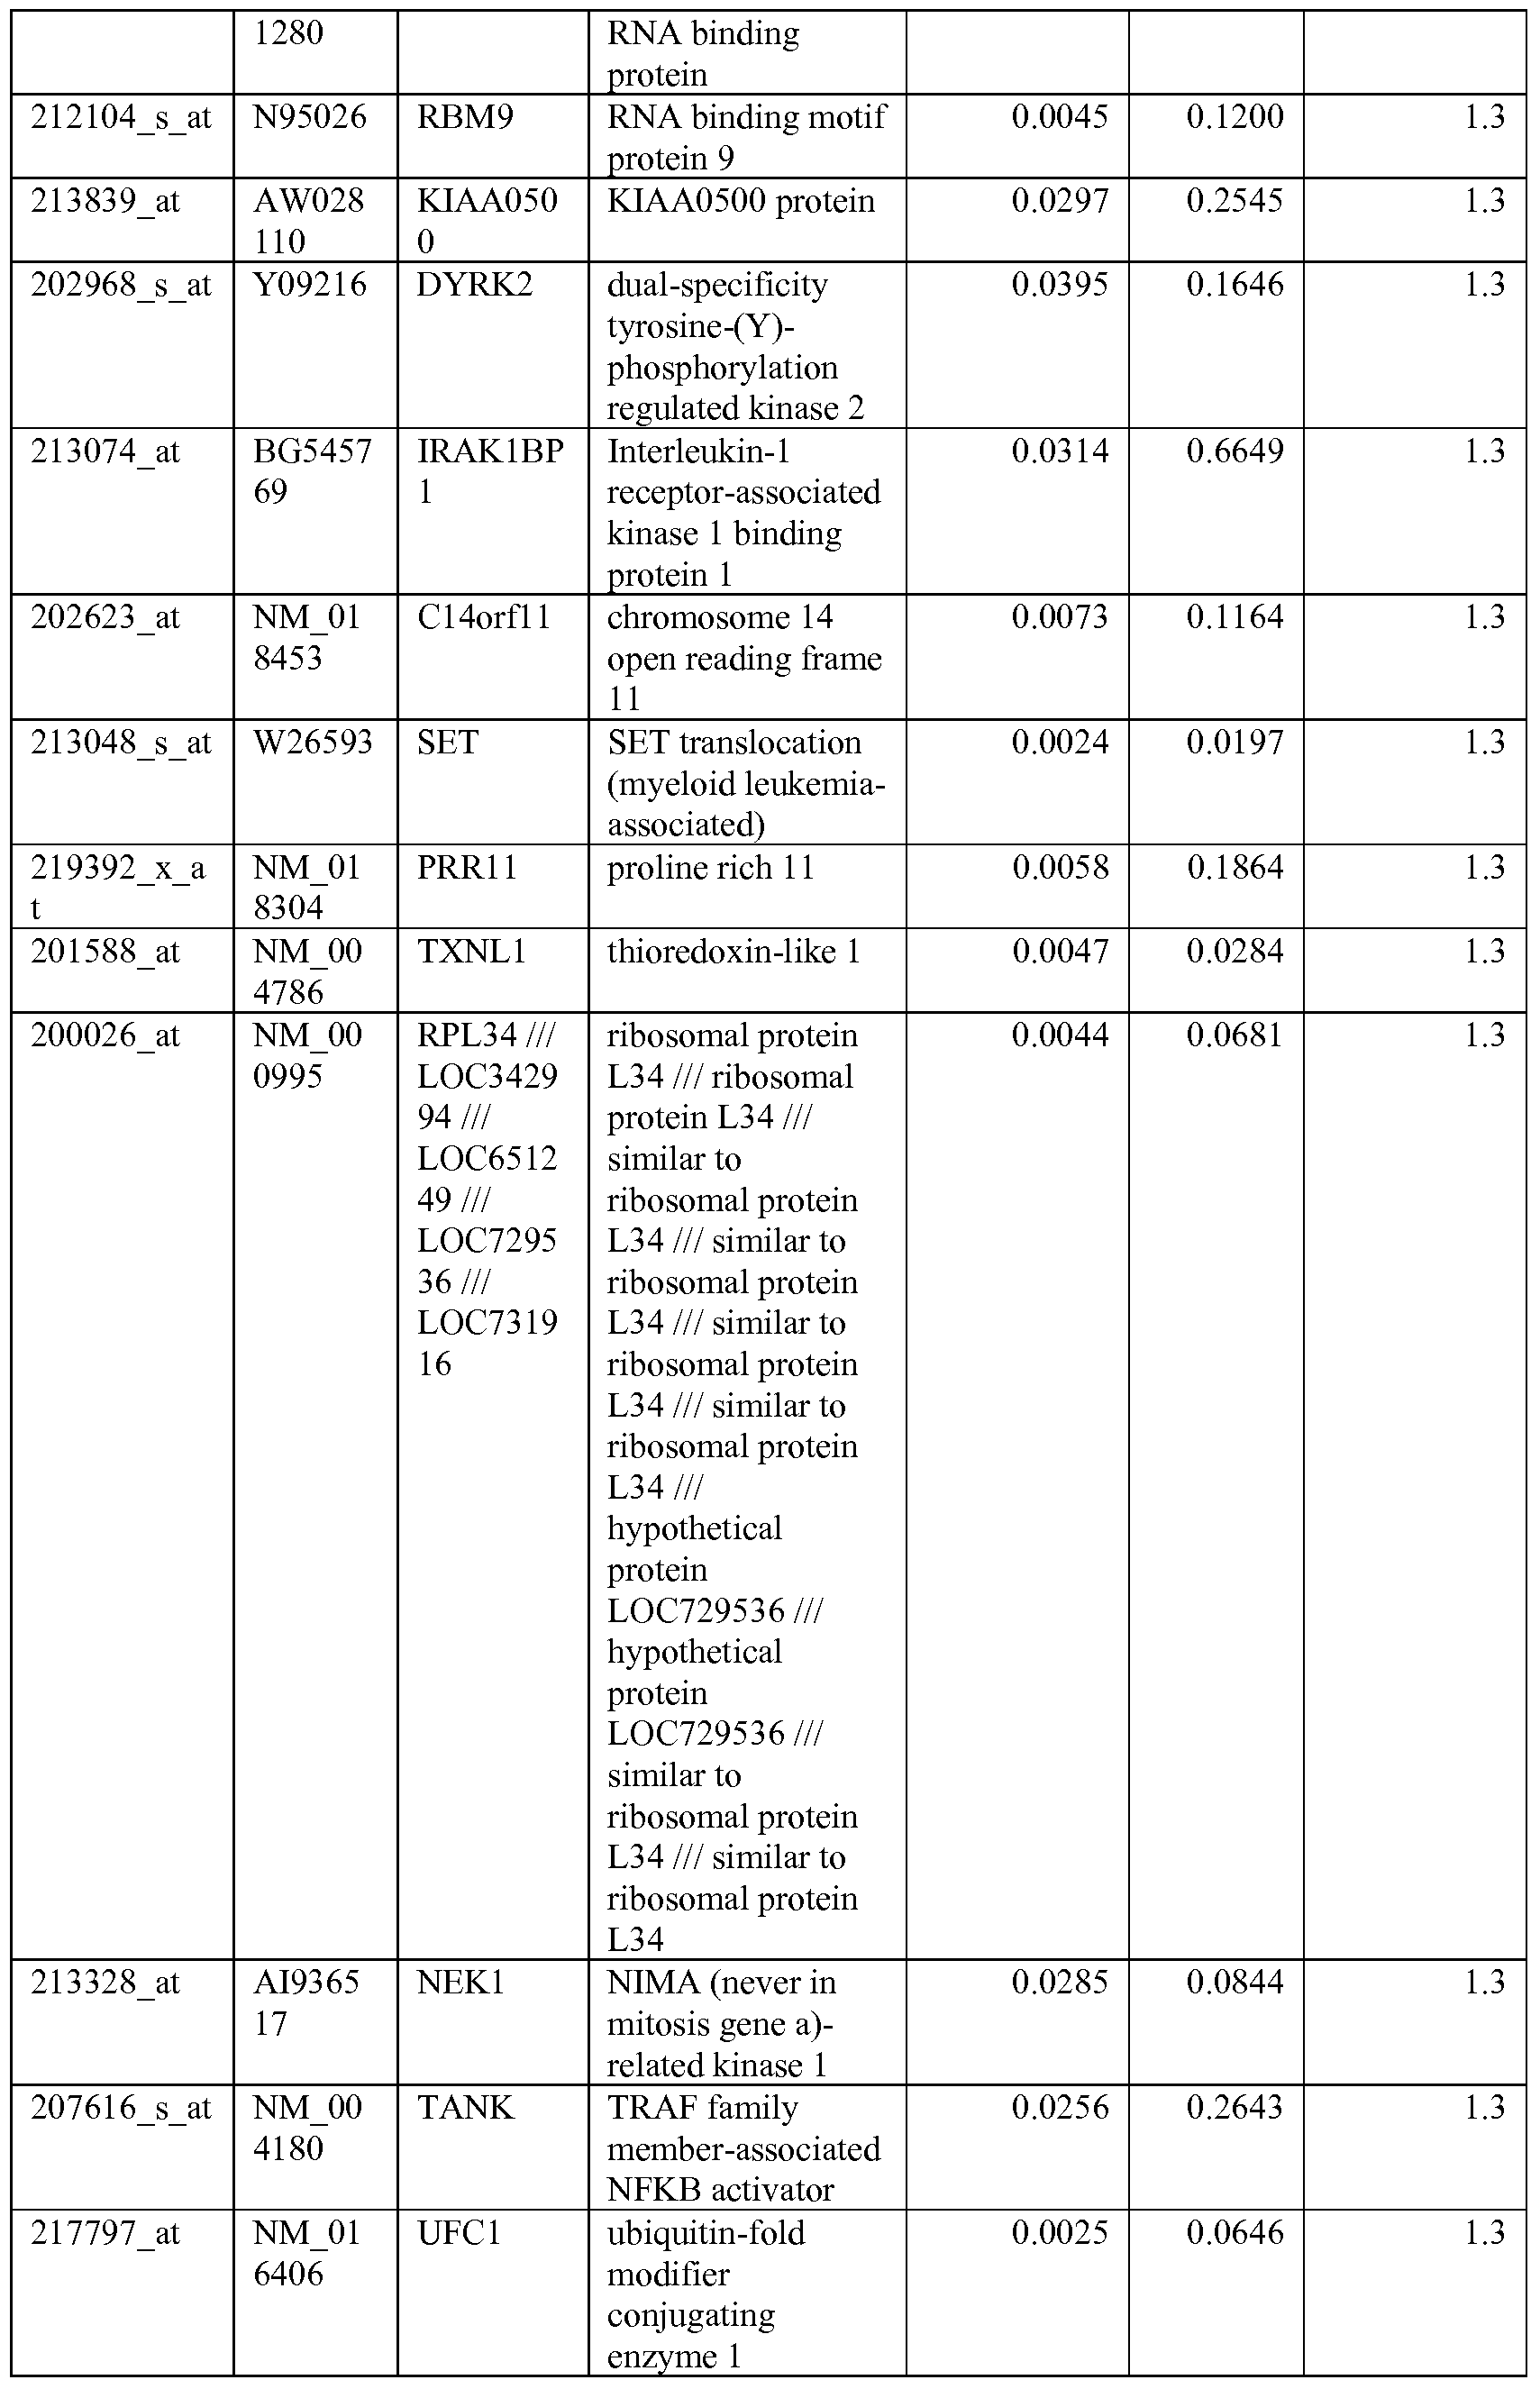


202054 s at NM_00 ALDH3A aldehyde 0.0264 0.2941 1.2 0382 dehydrogenase 3 family, member A2
35436 at L06147 GOLGA2 golgi autoantigen, 0.0143 0.2075 1.2 golgin subfamily a,
218988 at NM_01 SLC35E3 solute carrier 0.0332 0.4575 1.2 8656 family 35, member E3
212632 at N32035 STX7 Syntaxin 7 0.0264 0.4759 1.2
209472 at BC0008 RPI l- kynurenine 0.0347 0.1281 1.2 19 82K18.3 aminotransferase
III
204020 at BF7399 PURA purine-rich element 0.0149 0.0874 1.2
43 binding protein A
208113_x_a NM_03 PABPC3 poly(A) binding 0.0330 0.2927 1.2 t 0979 protein, cytoplasmic 3 /// poly(A) binding protein, cytoplasmic 3


- Ill -


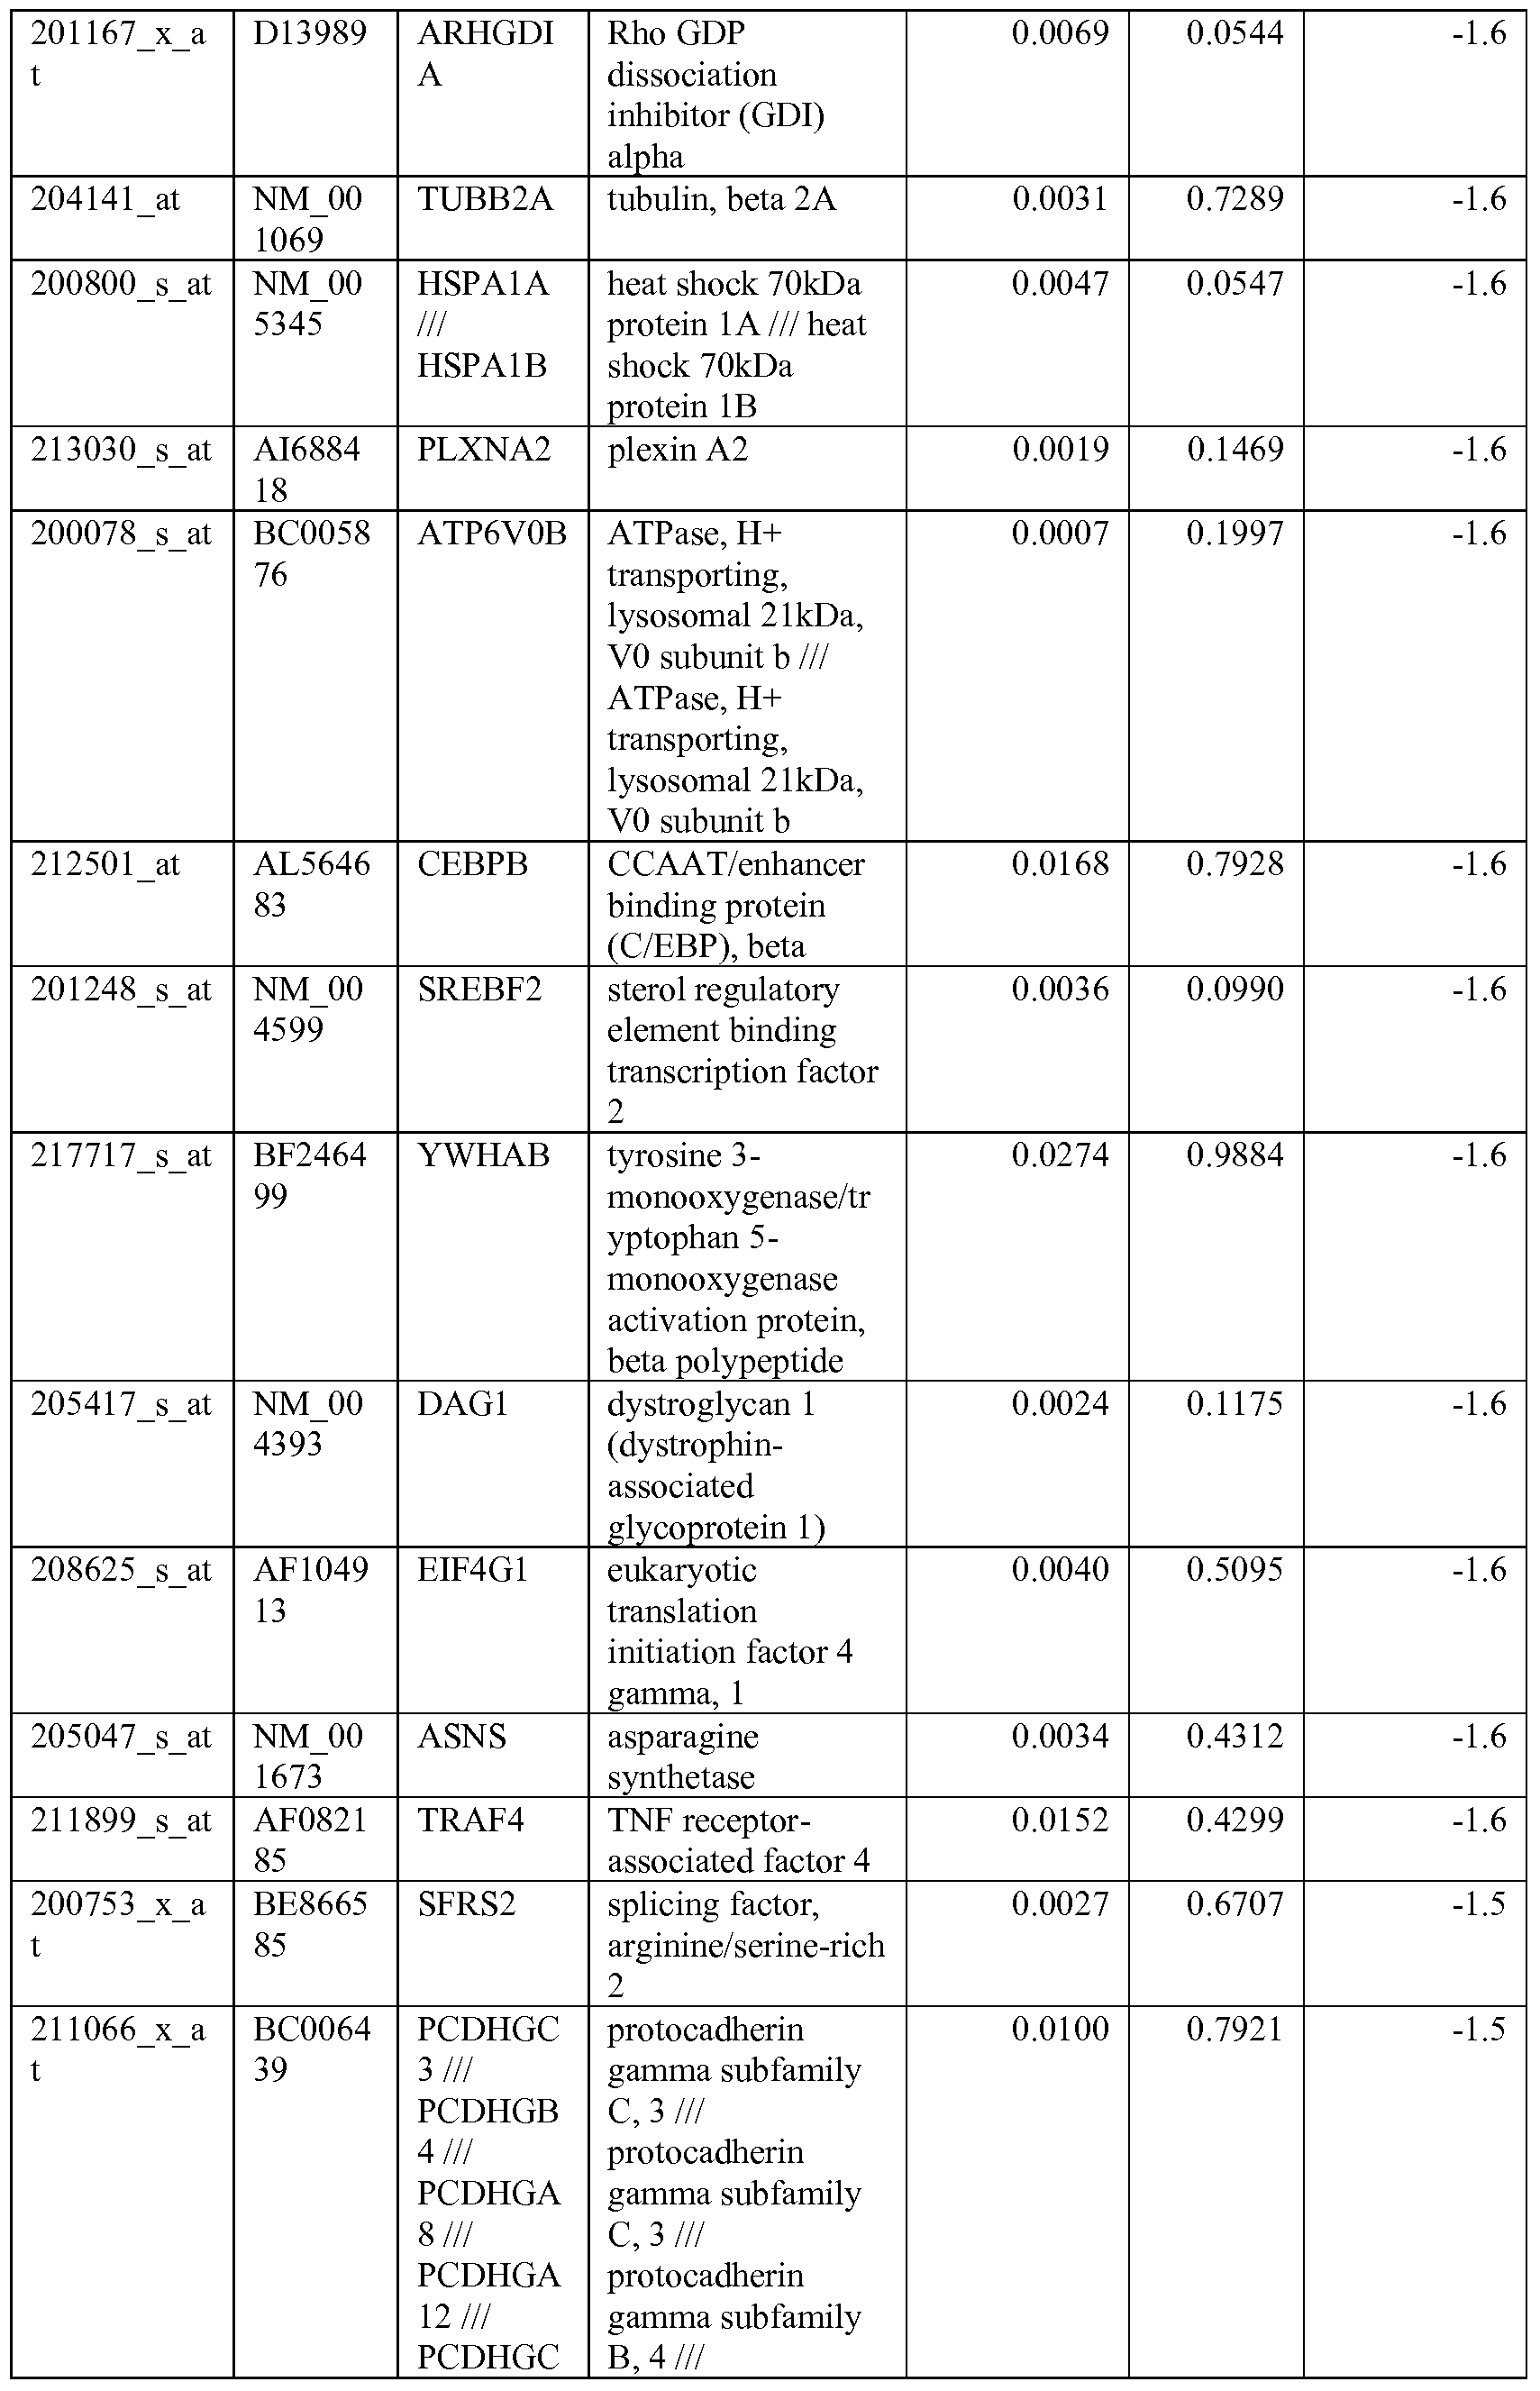 5 111 protocadherin
PCDHGC gamma subfamily
4111 B, 4 ///
PCDHGB protocadherin
1 111 gamma subfamily
PCDHGB A, 8 ///
6 111 protocadherin
PCDHGB gamma subfamily
5 111 A, 8 ///
PCDHGB protocadherin
3 111 gamma subfamily
PCDHGB A, 12 ///
2 111 protocadherin
PCDHGB gamma subfamily
I III A, 12 ///
PCDHGA protocadherin
11 /// gamma subfamily
PCDHGA C, 5 ///
W ill protocadherin
PCDHGA gamma subfamily
9 111 C, 5 ///
PCDHGA protocadherin mi gamma subfamily
PCDHGA C, 4 ///
6111 protocadherin
PCDHGA gamma subfamily
5 111 C, 4 ///
PCDHGA protocadherin
4 111 gamma subfamily
PCDHGA B, 7 ///
3 111 protocadherin
PCDHGA gamma subfamily
2 111 B, 7 ///
PCDHGA protocadherin
1 gamma subfamily
B, 6 /// protocadherin gamma subfamily
B, 6 /// protocadherin gamma subfamily
B, 5 /// protocadherin gamma subfamily
B, 5 /// protocadherin gamma subfamily
B, 3 /// protocadherin gamma subfamily
B, 3 /// protocadherin gamma subfamily
B, 2 /// protocadherin gamma subfamily
B, 2 ///
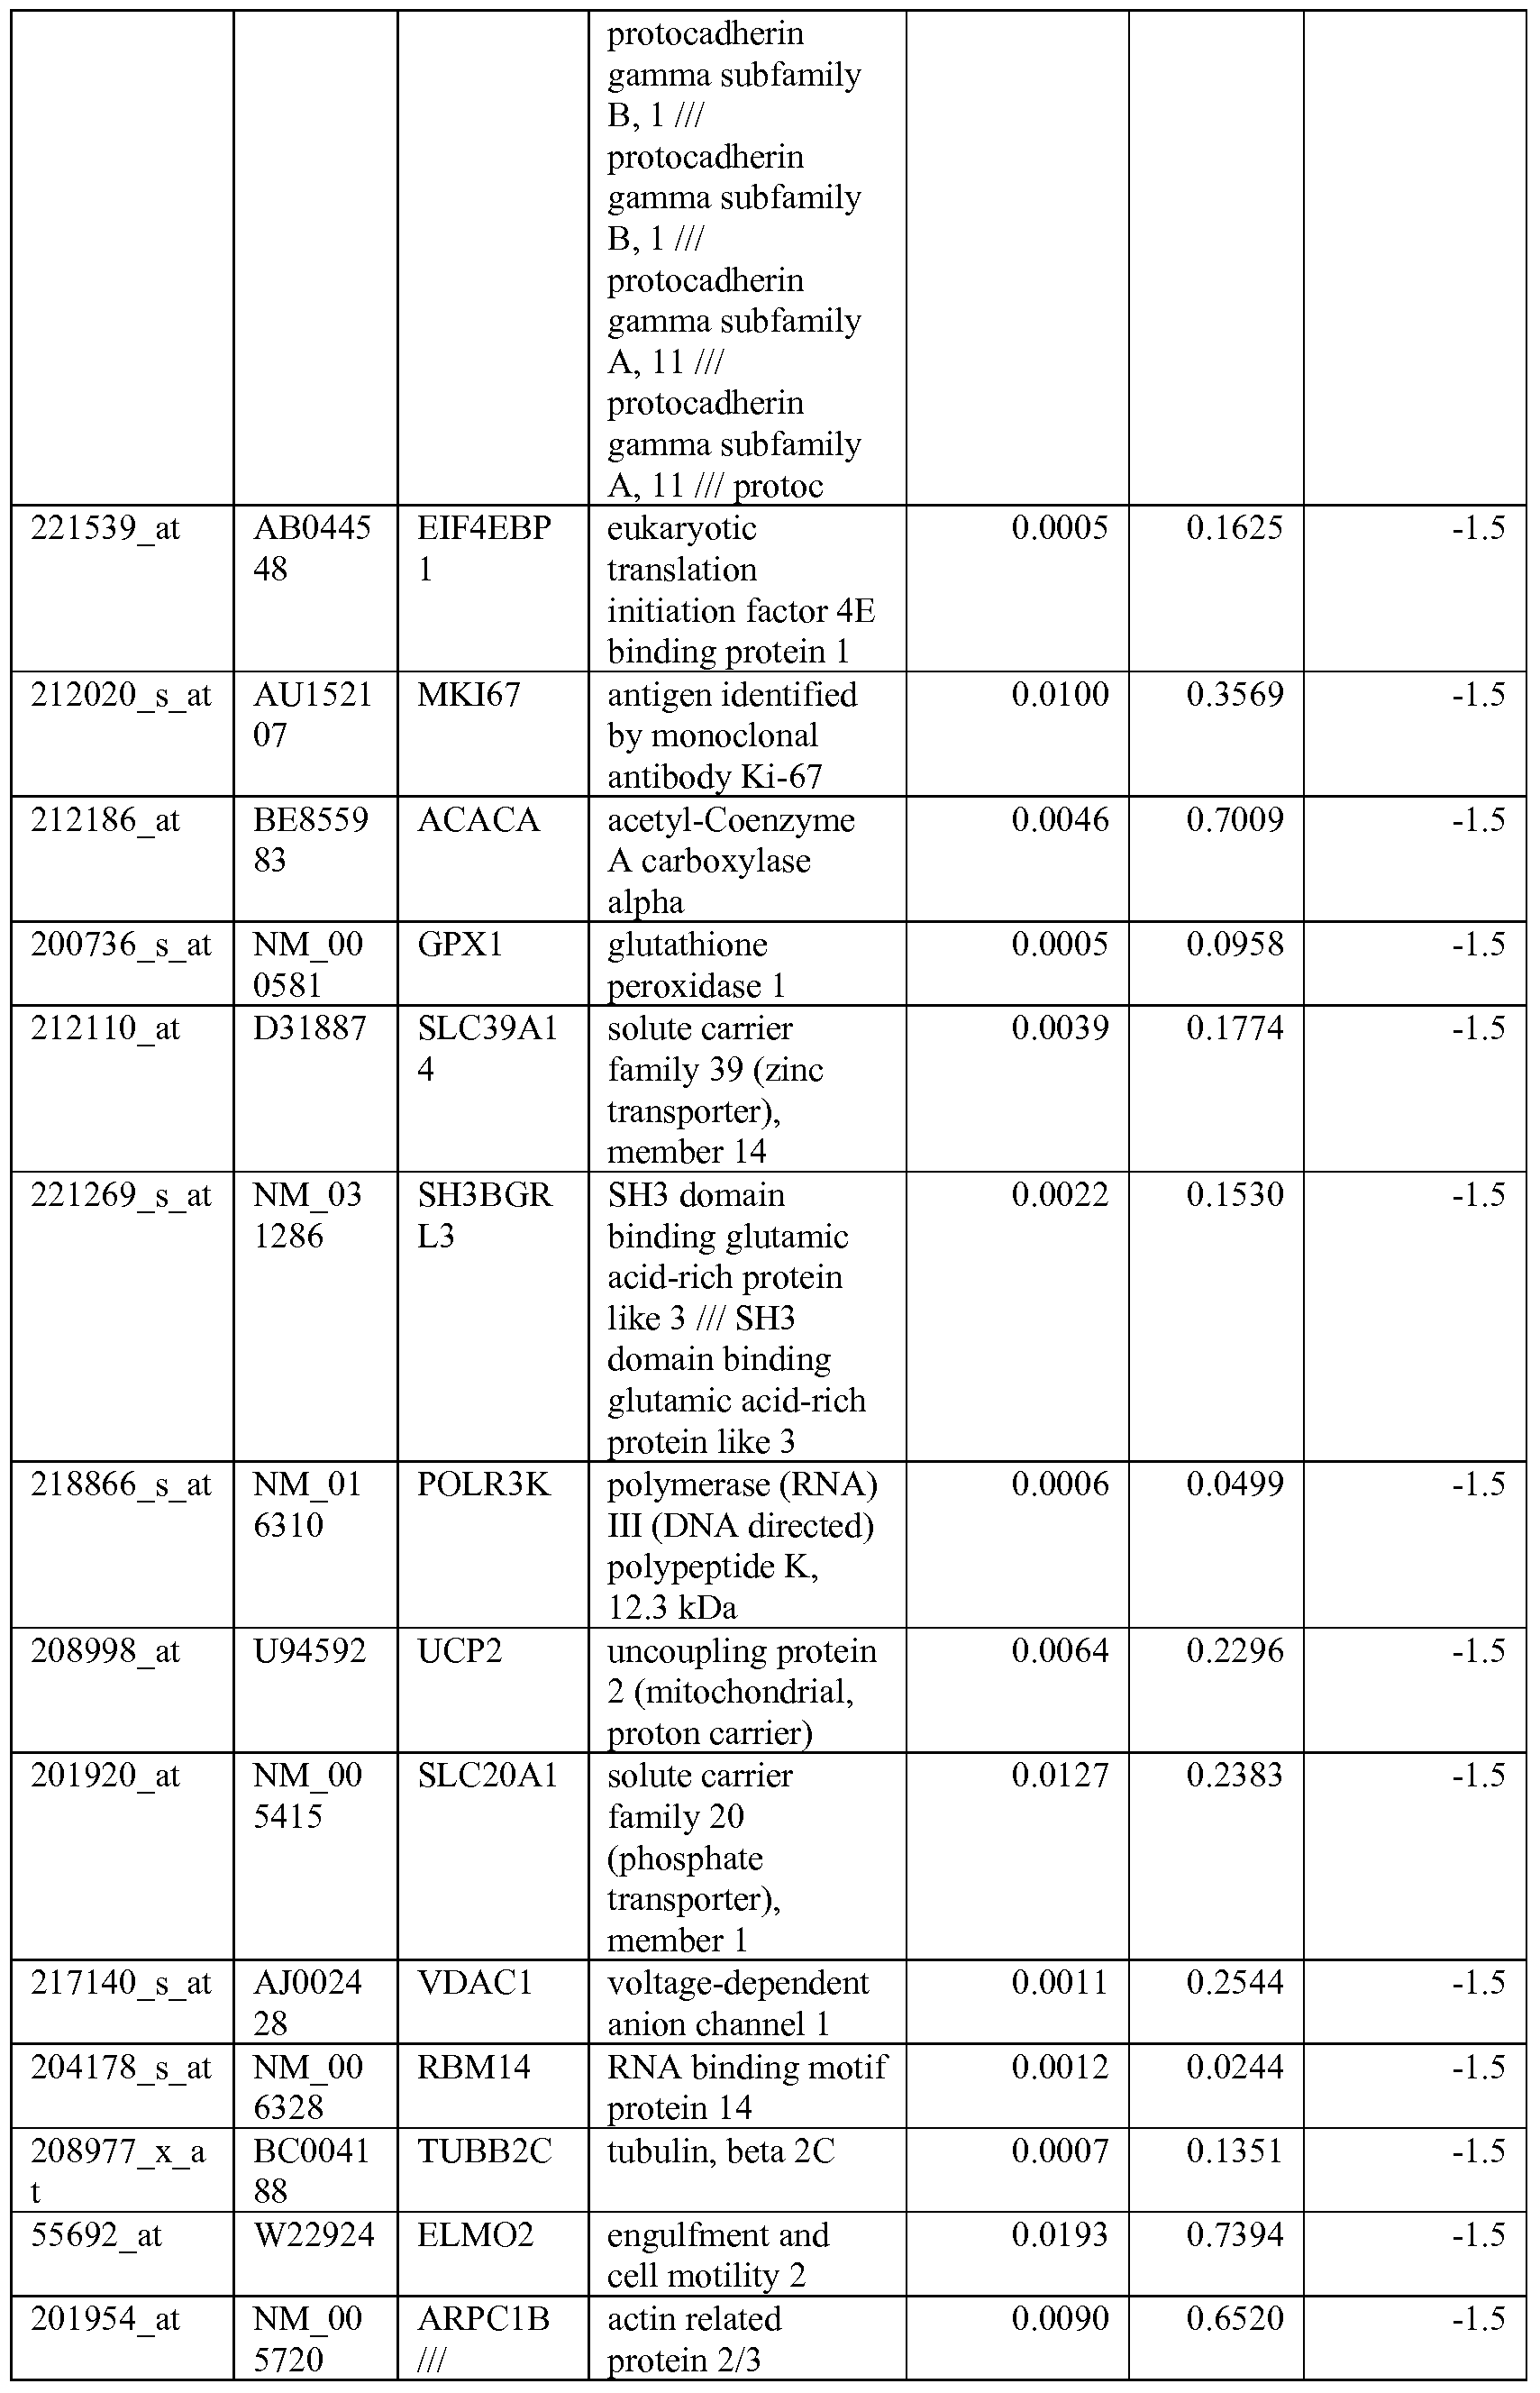


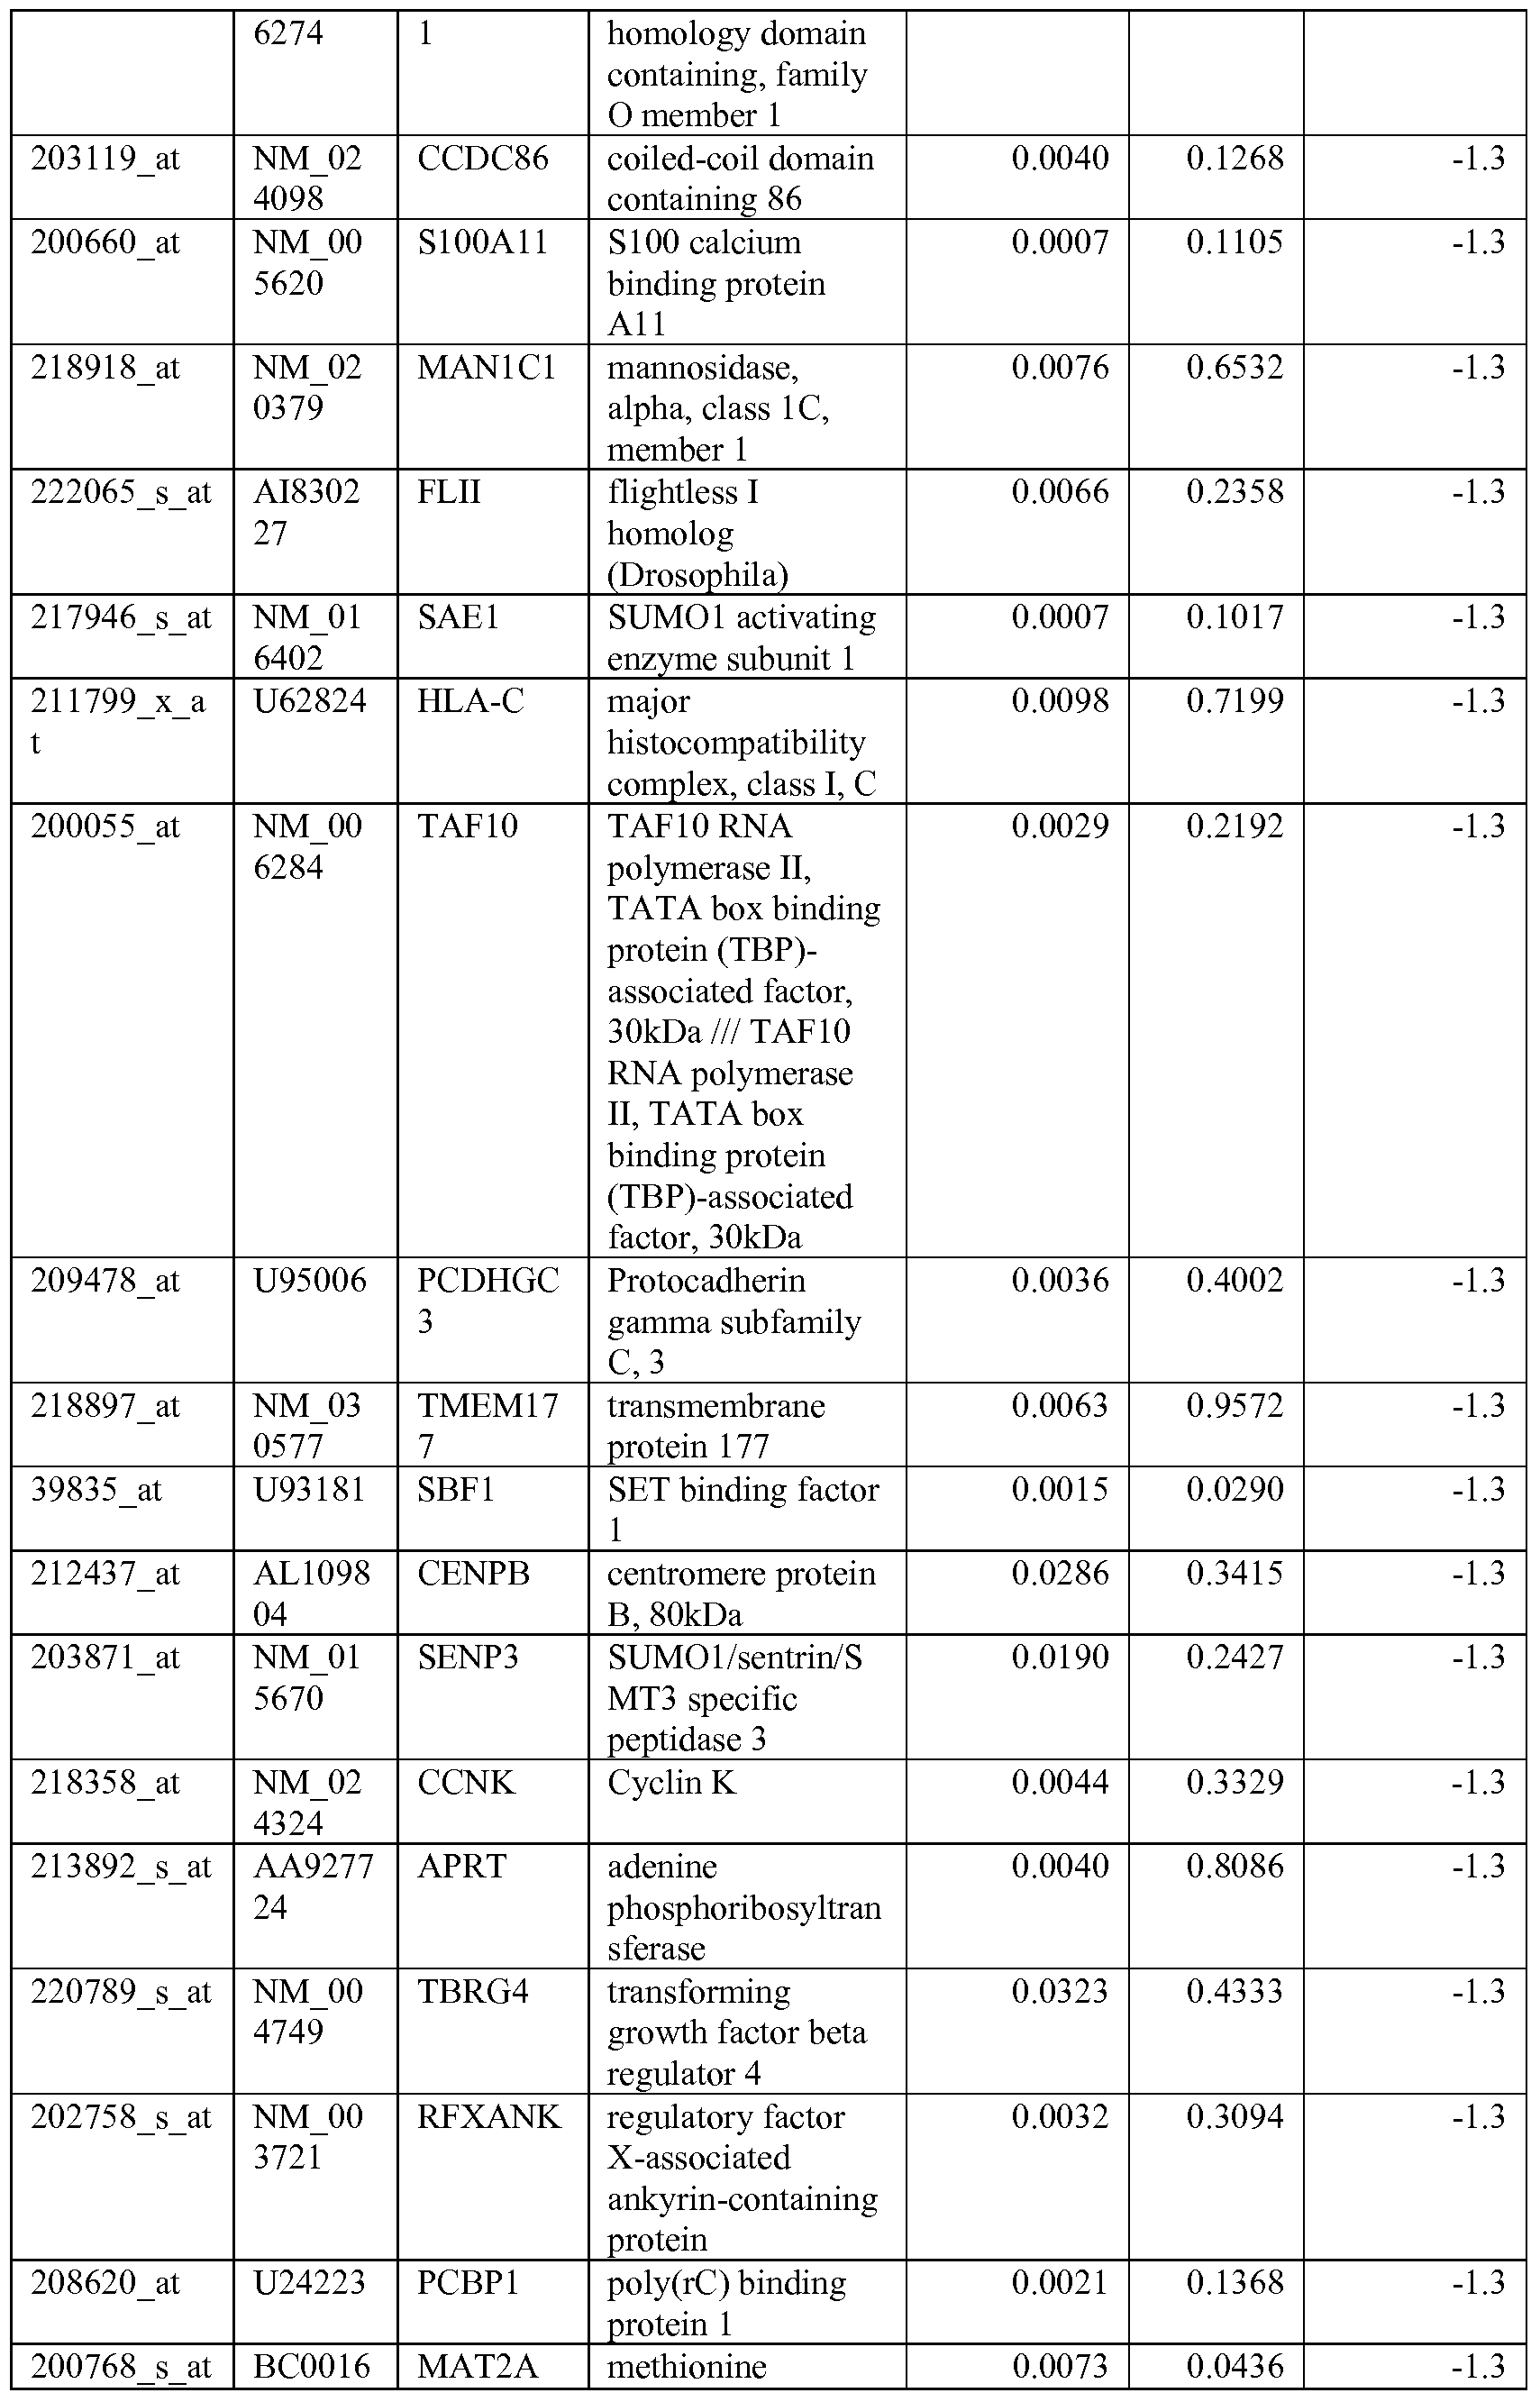


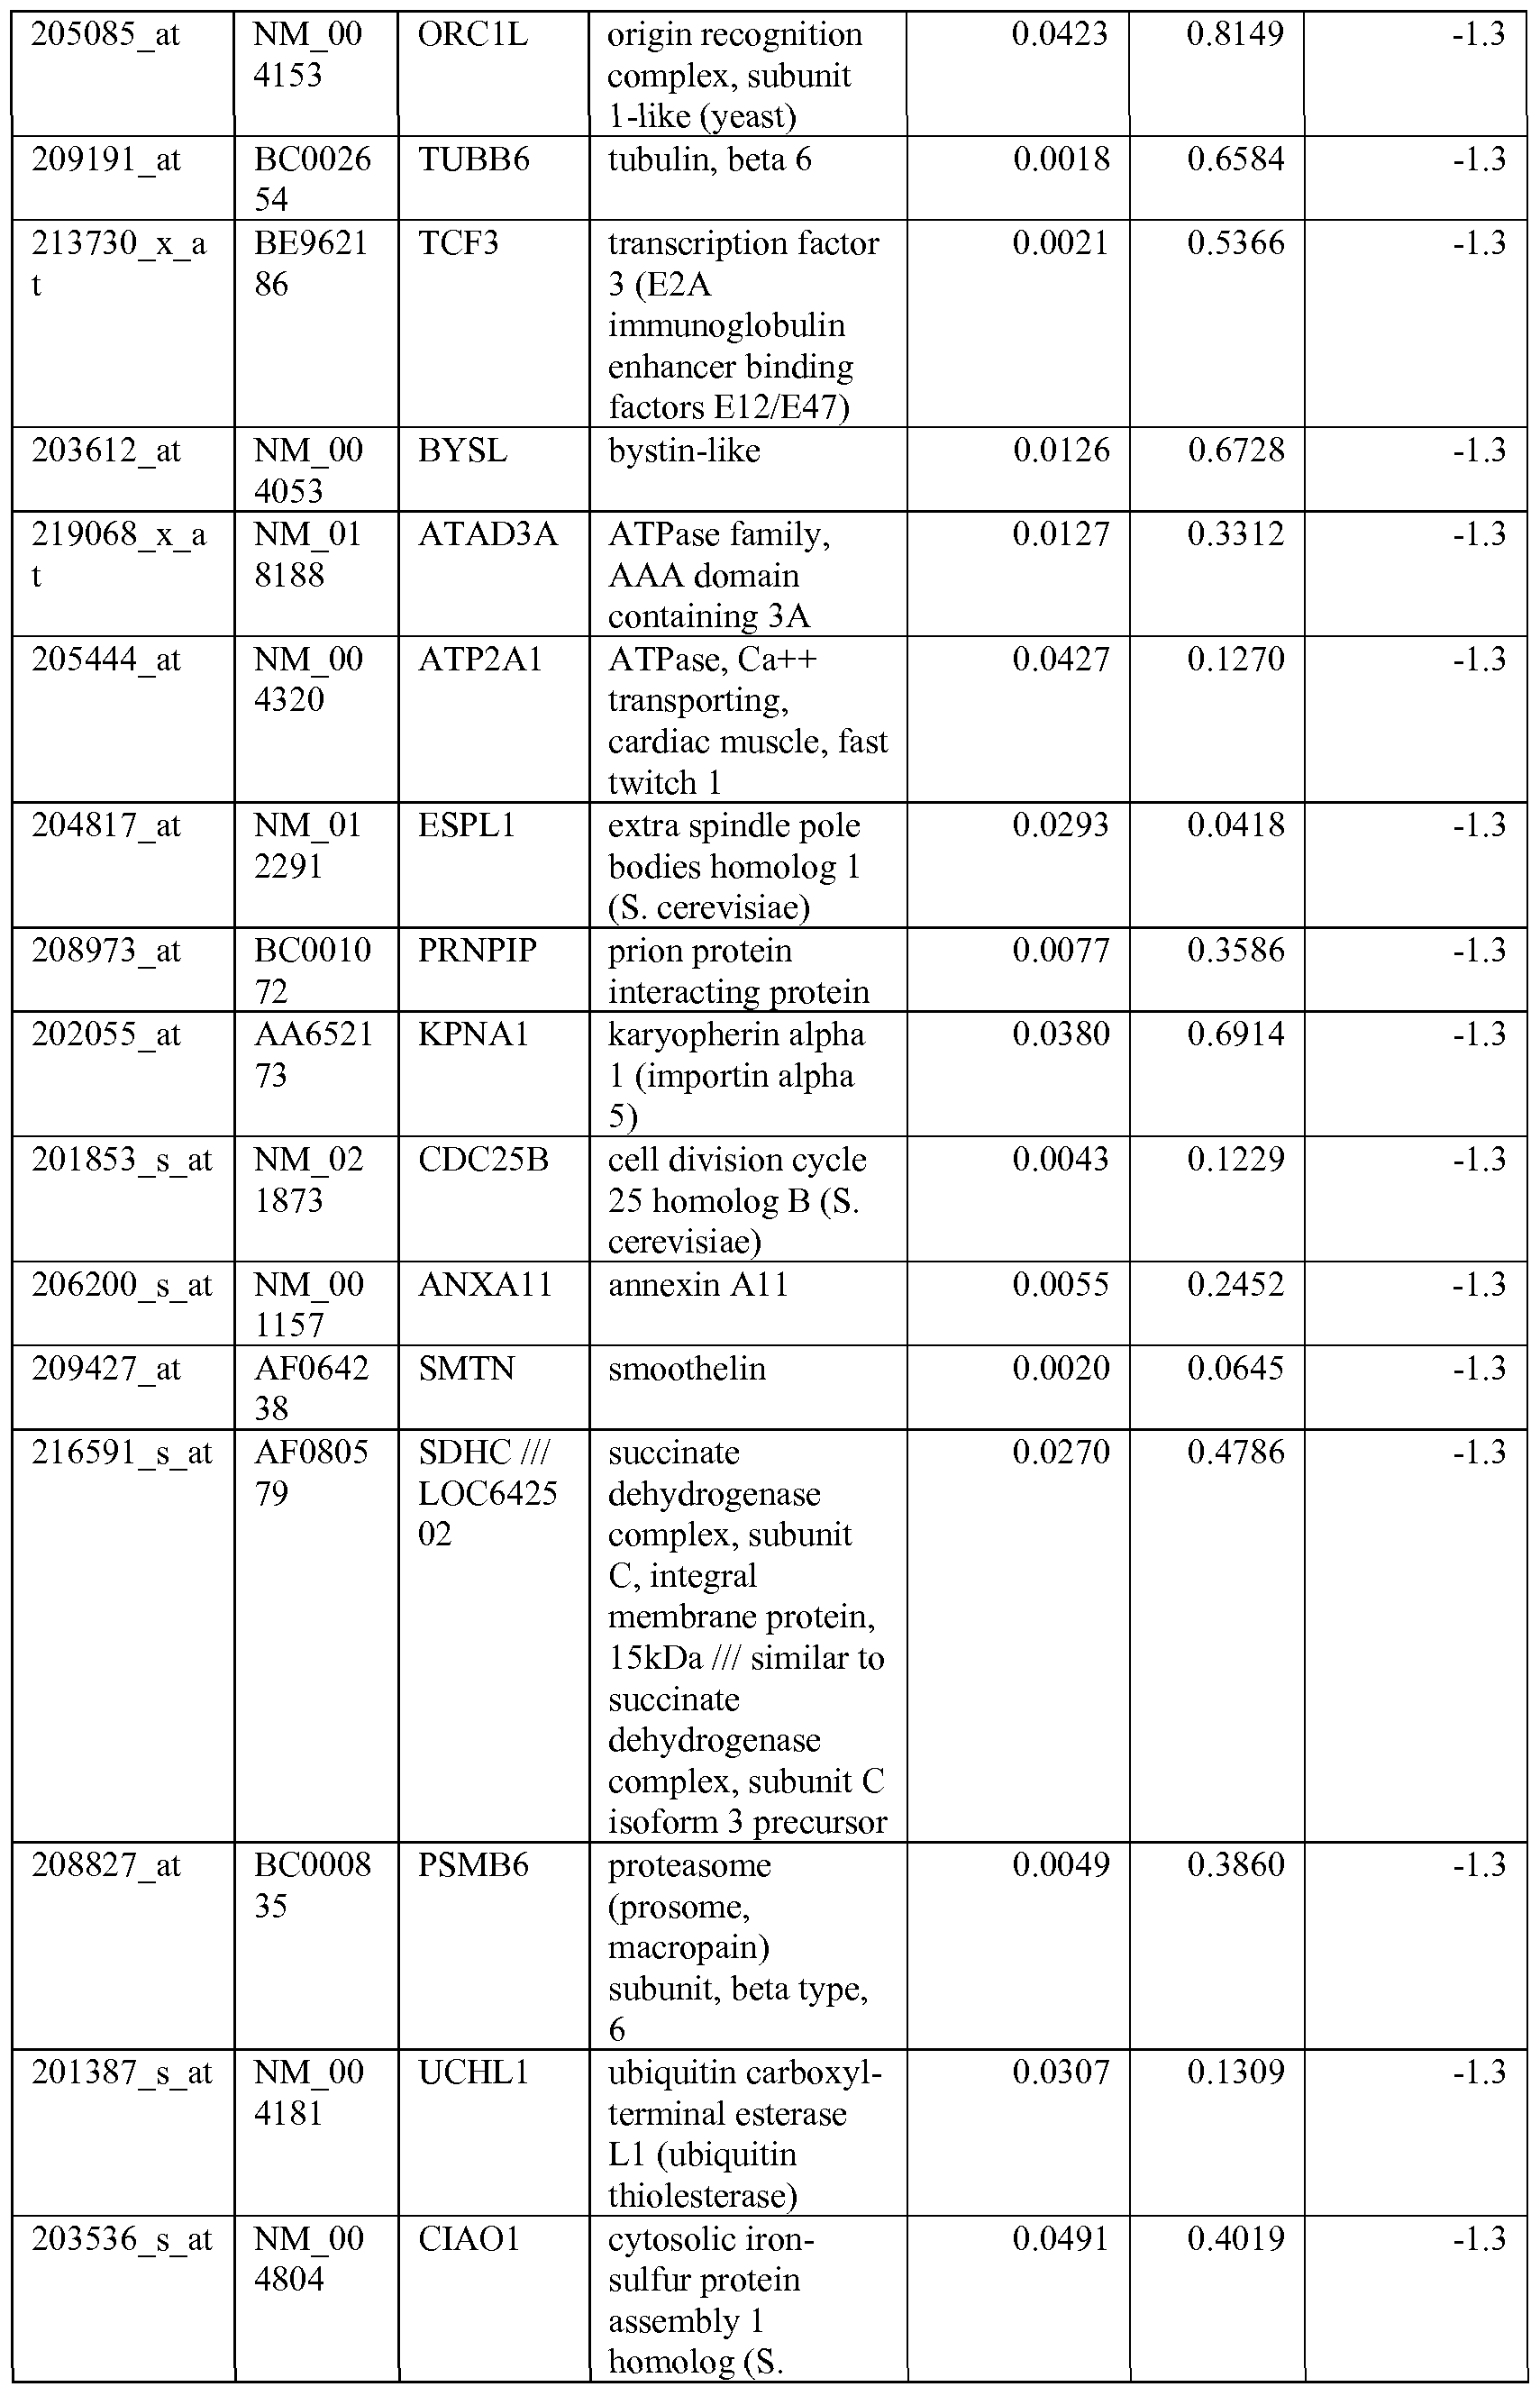


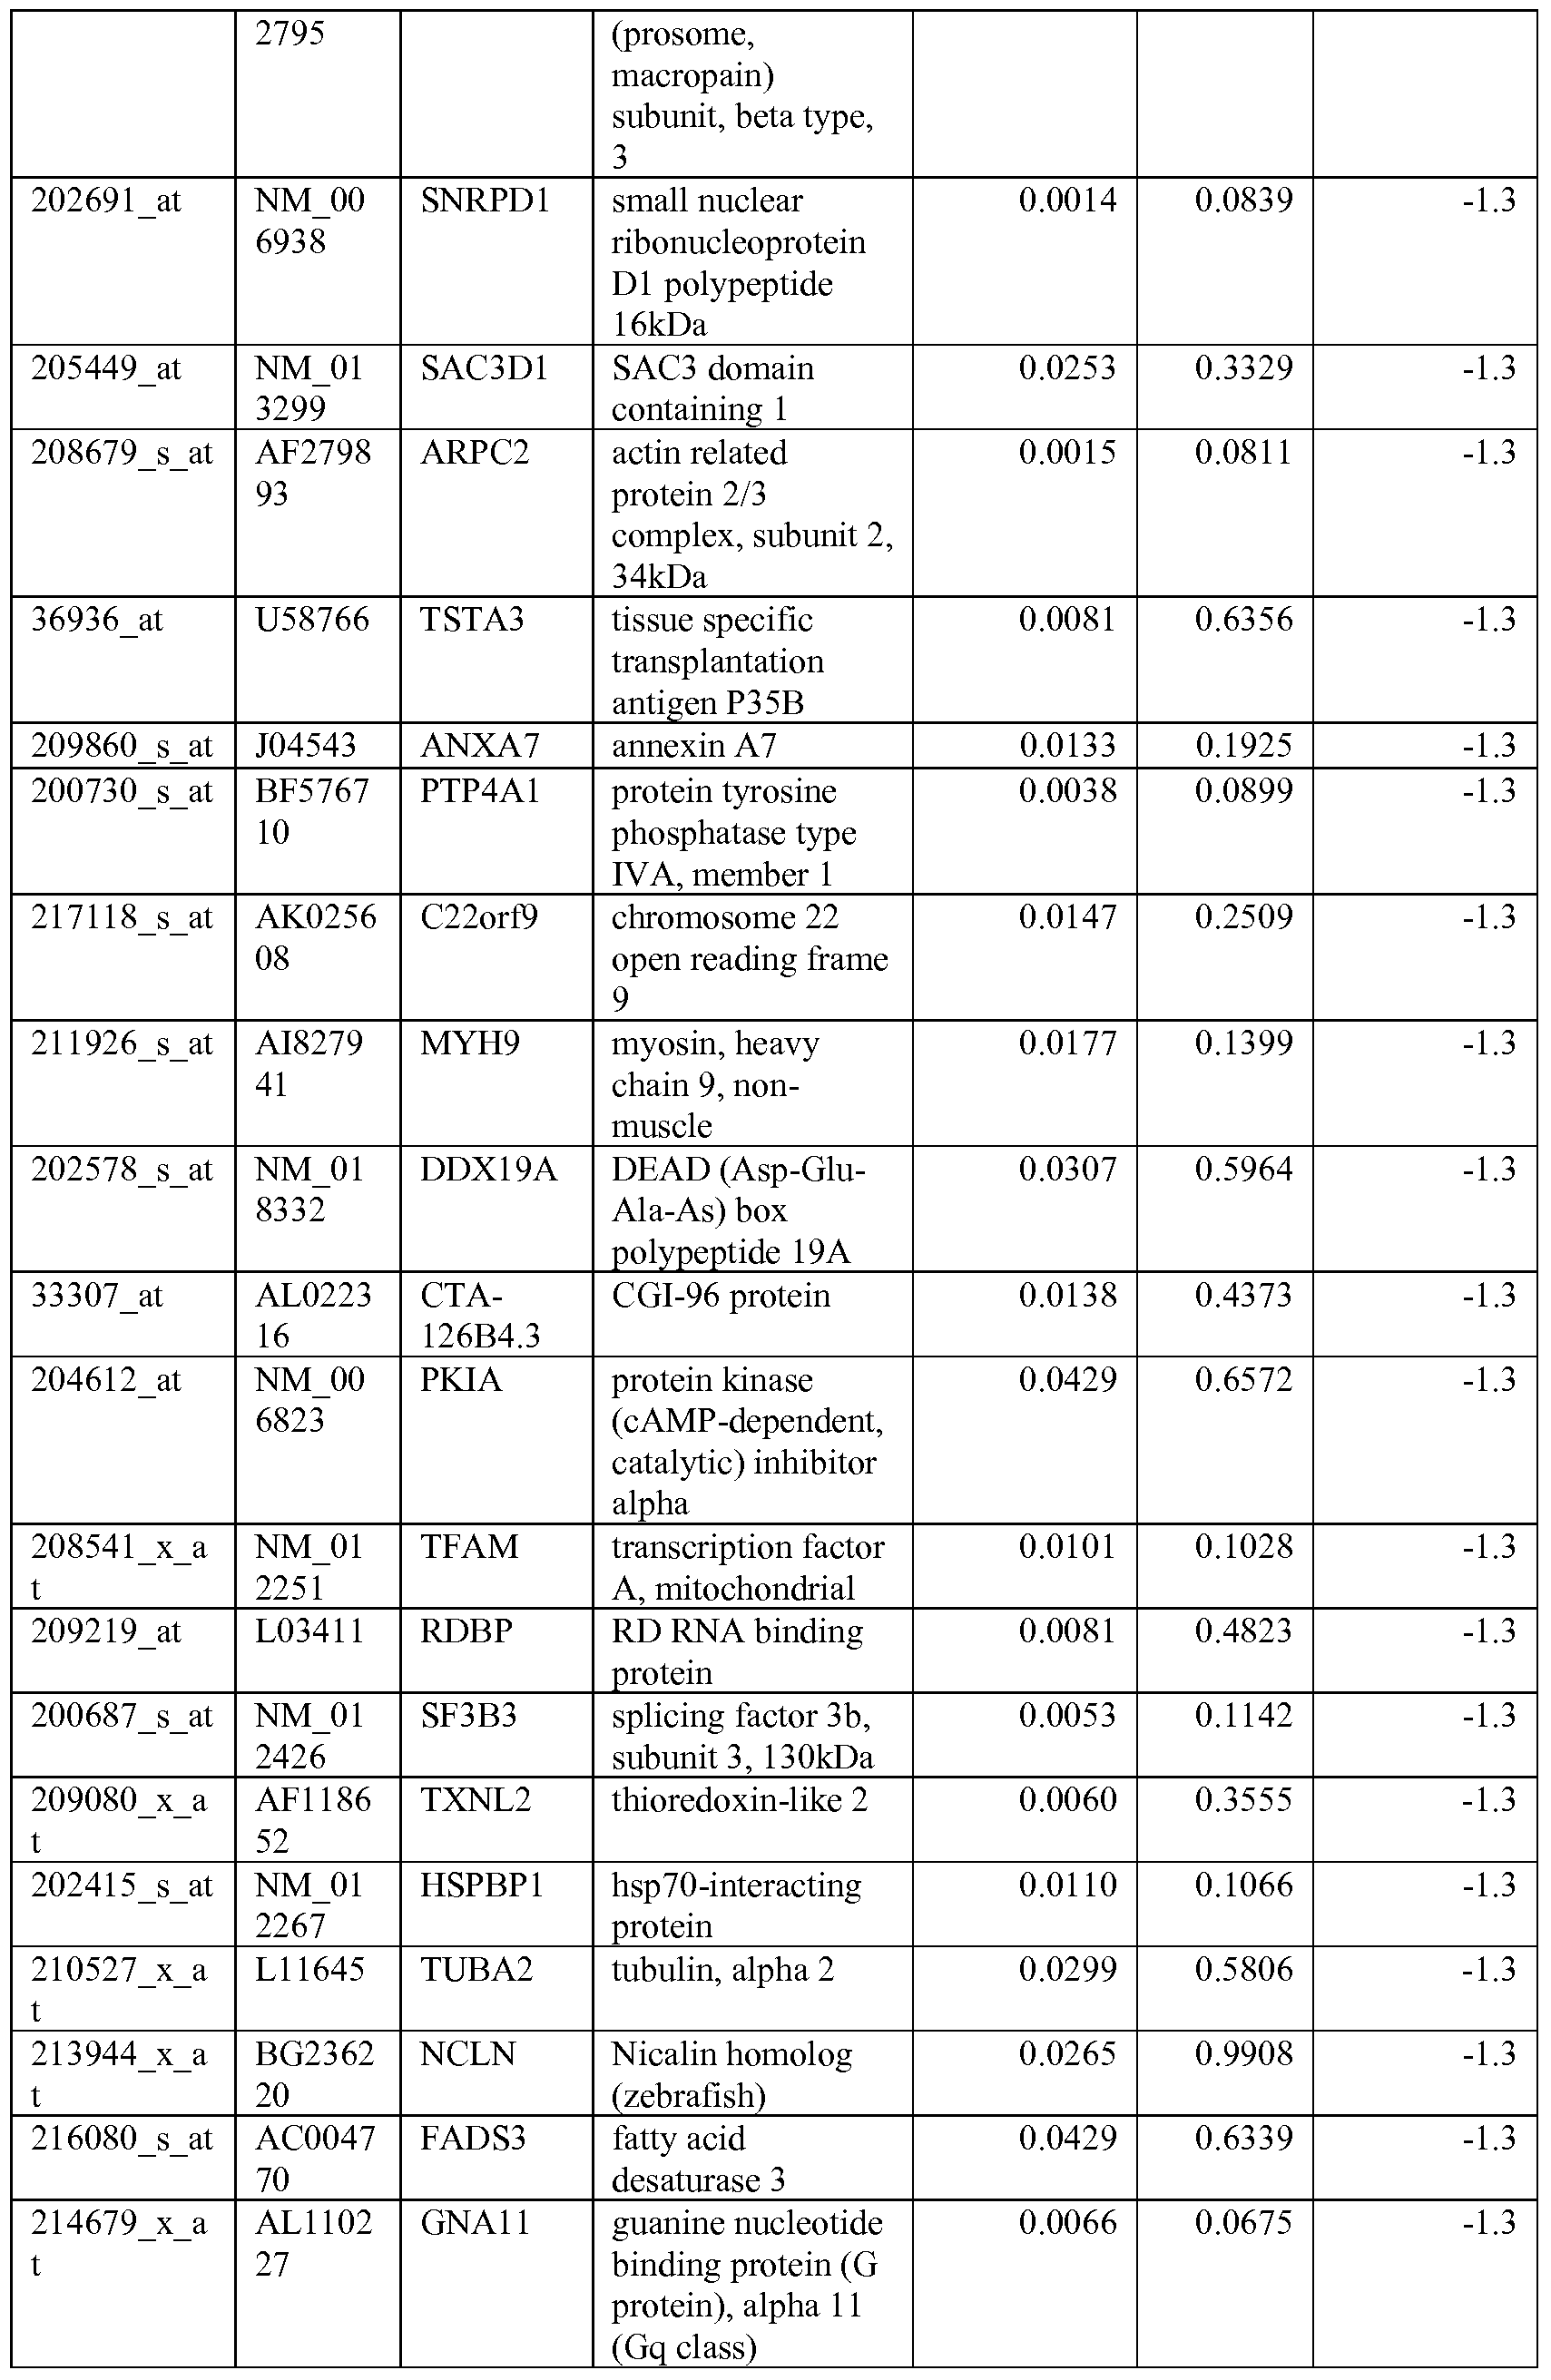


TABLE 7 - Proteins modulated by compound 1 treatment in Rh41 cells. Cells were treated with 0.35 μM compound 1 for 6, 36 and 72 hours before harvest and subject to
LC/MS based protein profiling. There are biological duplicates and technique duplicates. A two-way ANOVA mixed model was utilized to identify drug treatment effect as well as treatment and time interaction on the expression of peptide ions. The peptide ions identified as modulated by the drug are those with p value<0.05 in either the Treatment effect or Treatment x Time interaction. FDR correction was not applied to the protein profiling data.


Remarkably, these genes are mainly involved in apoptosis (AIFMl, ACINI, BIRC2, BIRC5, BAD, BAG3, BAX, CARDlO, CIAPINl, DAP, DAXX, DAPKl, PDCDI l and PDCD4), cell growth and proliferation (Ki67, BOPl, GASl and ING3), cell cycles (cyclin family members of B, D, E, G, H, I, K, L; CDK 2 and 7; centromere protein A, B, M, N; CDKN3 and CDKNlB) and multiple tyrosine kinases such as ERBB3, PDGFR, FGFRl, 2 and 4, MET, EPH as well as the down-stream IGFlR signaling pathways: MAPK, PI3K and AKT. Interestingly, contrary to what was reported with IGFlR antibody (R. Baserga, Expert Opin. Ther. Targets; 9:753-68 (2005)), inhibition of kinase activity by compound 1 did not result in the receptor down-regulation, but rather induced the expression of IGFlR, insulin receptor
substrate 2 (IRS2) and insulin-like growth factor binding protein 3 (IGFBP3). This could be one of the mechanisms by which cells attempt to compensate the reduced activity of the IGFlR caused by the inhibitor, and the feedback loop then restores the inhibited pathway activity. Genes related to acquired resistance to IGFlR inhibitor compound 1 :
Acquired resistance to anti-cancer agents is a major clinical problem. To study the mechanism of acquired resistance to IGFlR inhibitor, we derived resistance cells by culturing a compound 1 sensitive RMS cell line RD-l(IC5o=O.238μM) in the presence of a gradually increased concentration of compound 1 in every other passage to reach the resistance level of plateau. The resulted resistant RDl cells had
 1.999 μM to compound 1, which is 8 fold higher than the IC50 of the parent RDl. In order to identify markers that may contribute to acquired resistance to the IGFlR inhibitor, global gene expression profiles for both parental RDl and resistant RDl were analyzed using Affymetrix gene chip. A statistical analysis was conducted using GeneChip® Expression Analysis software MAS 5.0 to identify the genes differentially expressed between the sensitive and acquired resistant cells (Table 8).
TABLE 8 - Genes related to acquired resistance to compound 1. Gene expression profiles of compound 1 sensitive RMS cell line RD- 1(
 and the acquired resistant RD-I cells has
 1.999 μM) which is more than 8 fold of the parental RDl was compared and analyzed using using GeneChip® Expression
Analysis software MAS 5.0 to identify genes differentially expressed between these cells. A change call of "increase" or "decrease" in gene expression level was assigned for each probe set and the fold change between the resistant RD-I cells and the parental sensitive cells was calculated. The redundant probes were removed and left one as the representative for the gene. The fold change is listed, the positive indicates higher expression in the resistant RD-I, and the negative indicates the higher expression in the sensitive parental RD-I.


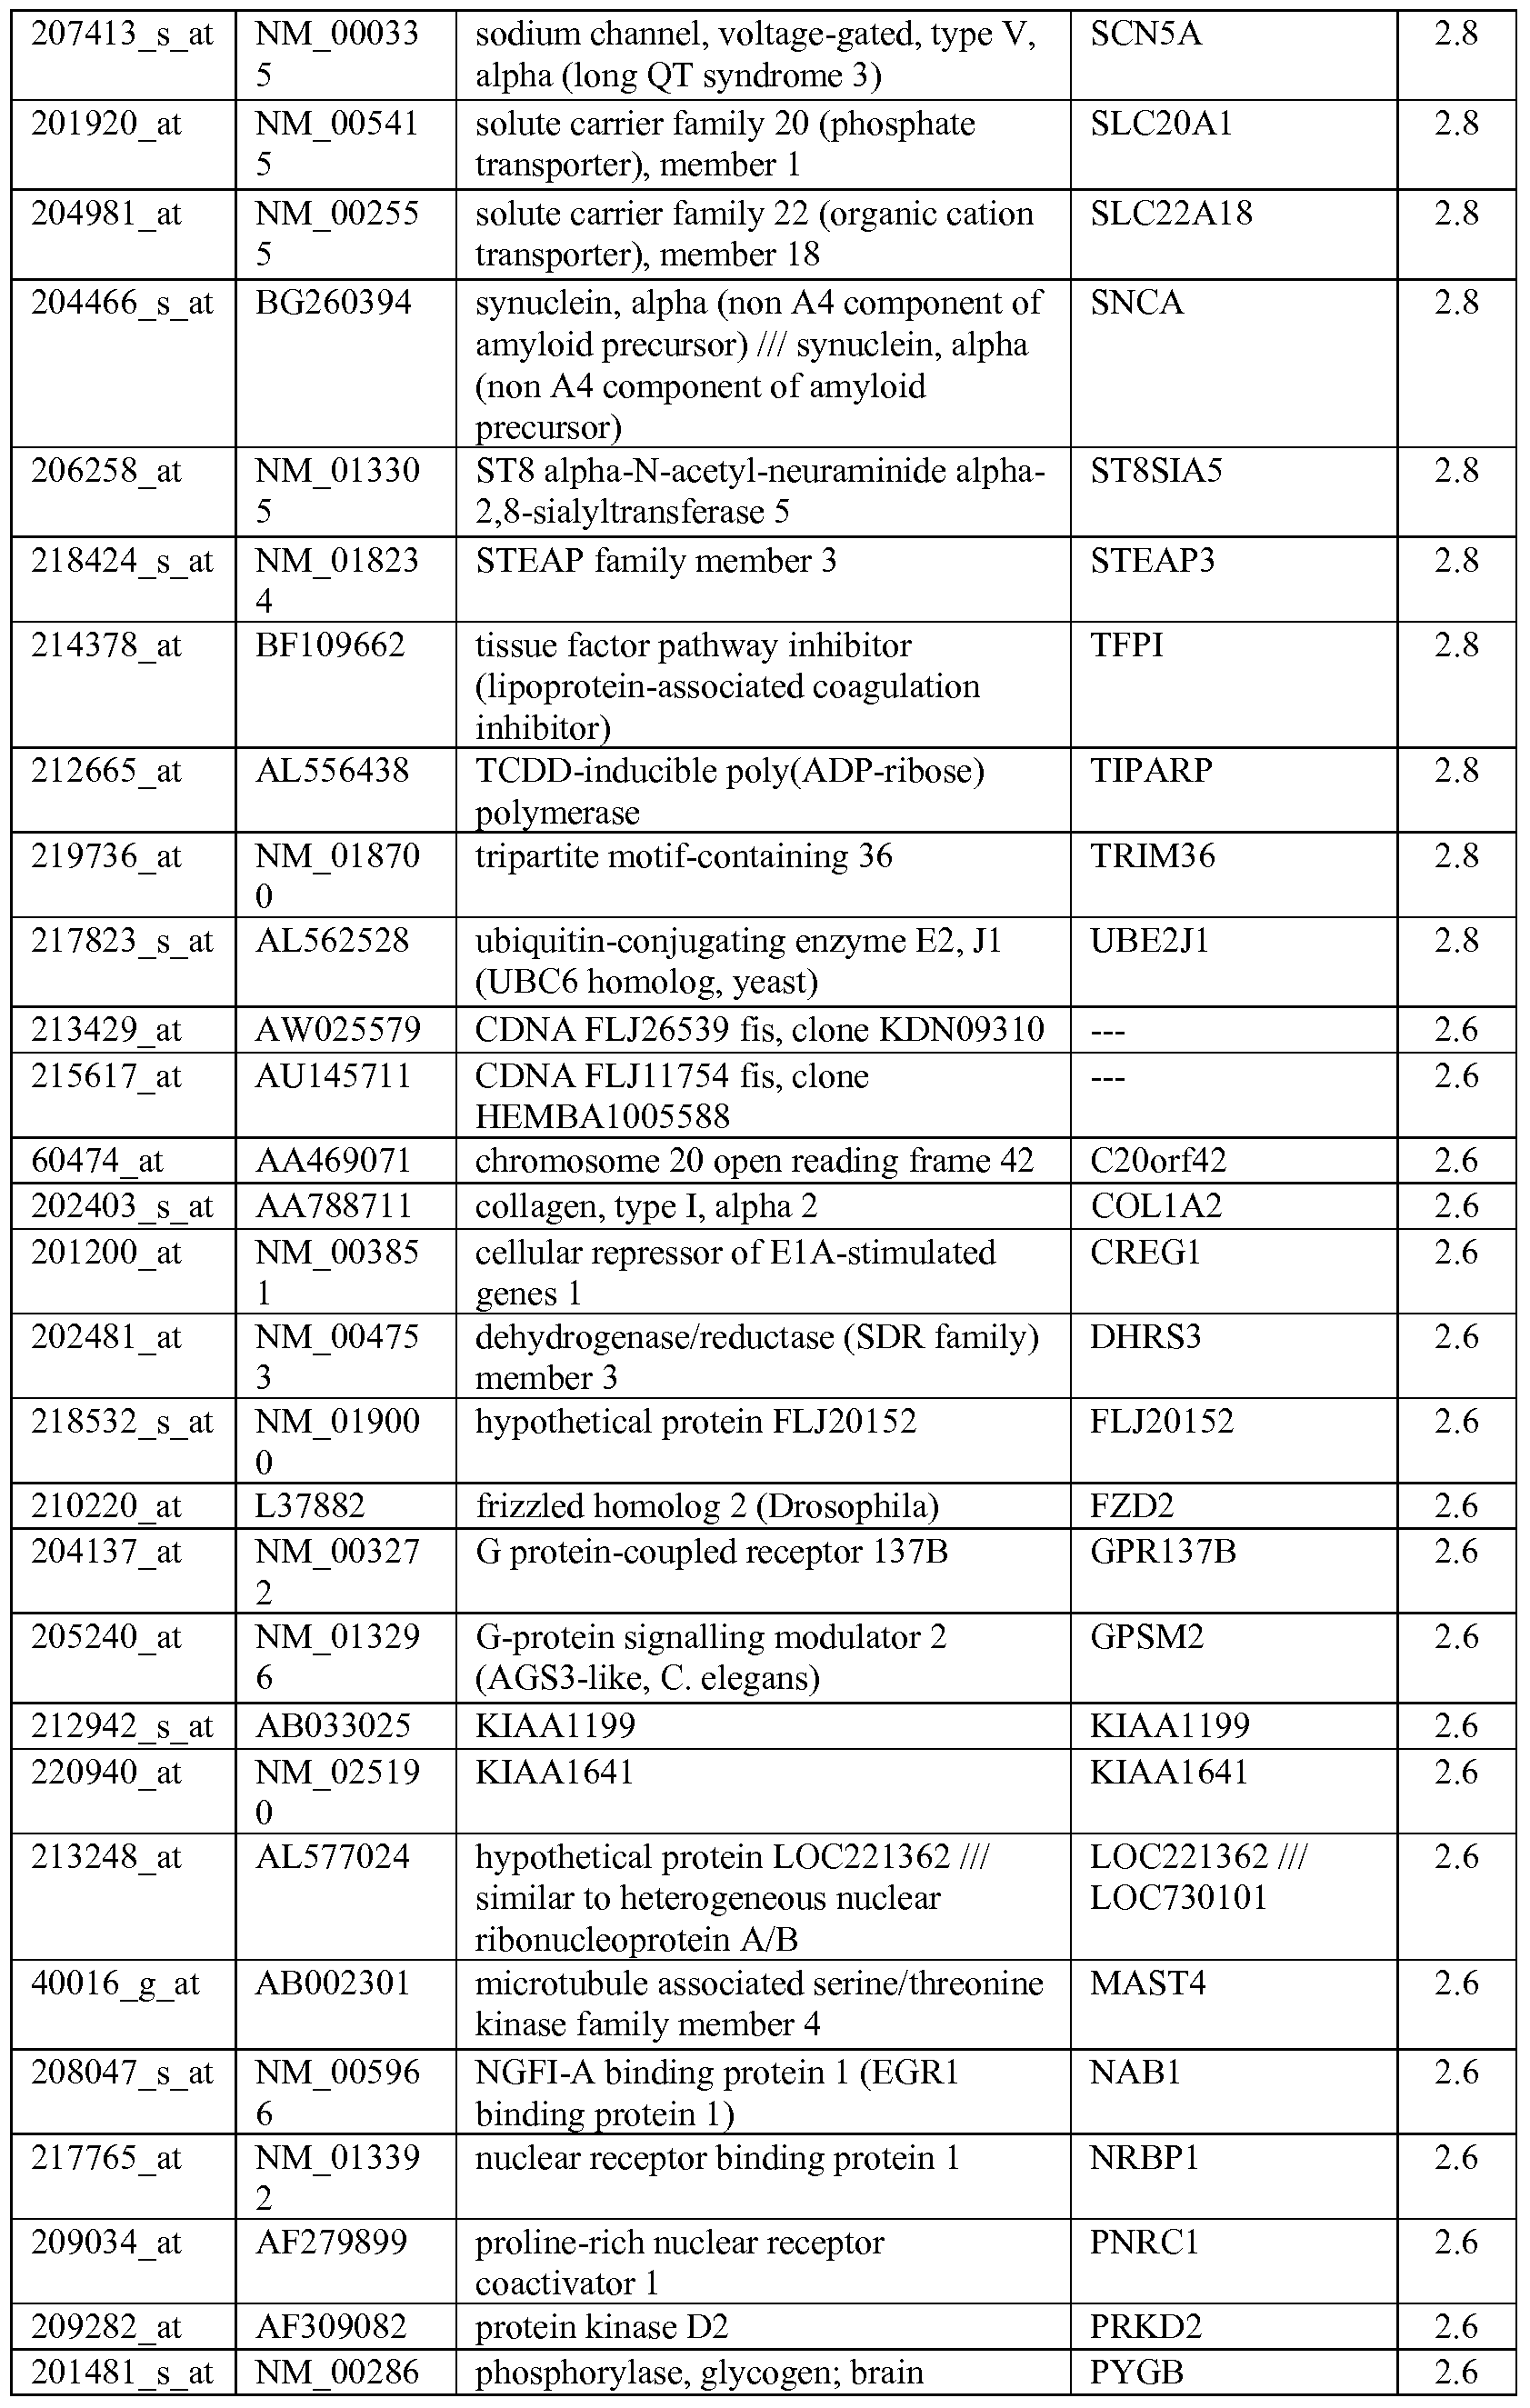


These genes may reflect the mechanism of acquired resistance to IGFlR inhibitor. Interestingly, several insulin-like growth factor binding proteins were expressed at higher level in the acquired resistant cells compared to the sensitive parent RD-I, such as IGFBP2 (10.6 fold), IGFBP3 (6.4 fold), IGFBP5 (4.8 fold), IGFBP7 (15 fold), whereas, IGF2 had conversely expression pattern. SRC family members FYN and LYN also had increased expression levels in the acquired resistant cells. Comparison of the genes correlated with the intrinsic (de novo) resistance (Table 3) to
the ones related to acquired resistance (Table 8), there are common genes, such as CAST, CD44, PLAUR, SPlOO, STKlO, TFPI2 and THBSl with higher expression in both de novo and acquired resistant cells, suggesting there may be some common mechanisms for both types of drug resistance. Thrombospondin 1 (THBSl) was reported to prevent camptothecin- and doxorubicin-induced apoptosis in human thyroid carcinoma cells, this shed new light on a possible role for THBSl in drug resistance (G. Rath, et al, Biochim. Biophys. Acta., Oct;1763(10): 1125-34 (2006)). THBSl was up regulated by IGF stimulation to promote cell survival (data not shown) and over expressed in the resistant cells, and thus may involved in both de novo and acquired resistance to IGFlR inhibitors.
Significant differences in multiple pathways between the sensitive and resistant cell lines at basal level:
Global pathway analysis on the basal gene expression of 28 cell lines using globaltest indicated that 75 out 183 tested pathways were significantly associated with the sensitive/resistant classification to compound 1 (FEW adjusted p value<0.05). Several interesting pathways including apoptosis pathway, and signaling pathways of MAPK, TGFβ, Jak-STAT, insulin, VEGF and natural killer cell mediated cytotoxicity were among those significant pathways that were different between the sensitive and resistant cell lines, while mTOR signaling pathway is different (p value=0.0005) yet slightly higher than the the significance cutoff (FWE adjusted p value= 0.0559). Pathway analysis of expression data for the compound 1 treated Rh41 cell compared to that for the untreated control cells, above mentioned pathways are also different between the cells treated with or without the drug with p value all less than 0.01 but not reach the statistical significant cutoff based on the FWE adjusted p values.
Ingenuity pathway analysis on the 497 probe sets that significantly correlated with the sensitivity of compound 1 in the 28-cell line panel were performed, over expression of multiple kinases (e.g., EGFR, MET, TGFβR2) in the compound 1 resistant cell lines was observed in the most significant network. This may explain why these cell lines are still proliferating and surviving even in presence of the drug, since they use alternative growth signal pathways instead of IGFlR. In this specific situation, targeting multiple pathways may be necessary to sufficiently inhibit the
growth of these cells and synergistic effects with the combination of inhibitors targeting these kinases could be possible.
Synergistic activity between inhibitors of IGFlR and other kinases:
IGF signaling through IGFlR has also been shown to protect cancer cells from the cytotoxic effects of chemotherapy and radiation, and this may be an important factor in tumor cell drug resistance (J. Gooch, et al., Breast Cancer Res. Treat., 56(1): 1-10 (1999), B. Turner, et al., Cancer Res, 57(15):3079-83 (1997)). Recent evidence suggests that resistance to Herceptin® in some forms of breast cancer may be due to activation of IGFlR signaling in those cancers (Y. Lu, et al., J. Natl. Cancer Inst., 93(24): 1852-7 (2001)). Tumor cells rely on alternative receptors for activation of critical signaling pathways, therefore, strategies designed to block signaling from multiple receptors may be advantageous. Due to the wide expression of IGFlR and the potential cross-talk between the IGFlR pathway and the other signaling pathways implicated in oncogenesis (EGFR, Her2 and mTOR), IGFlR inhibitors may have potential to be combined with other therapies in a wide range of tumors to increase the overall survival of patients. Through ingenuity pathway analysis, the overexpression of multiple kniases (EGFR, MET, TGFR) in the compound 1 resistant cell lines was observed to be within the top network. Given the important roles of IGFlR, EGFR and Her2 in cell cycle progression, we carried out combination studies to investigate whether inhibition of multiple targets might result in enhanced inhibition of tumor growth. Table 9 summarizes the data for in vitro combination studies in multiple types of tumor cell lines and indicated that the drug combinations resulted in synergistic effects between IGFlR inhibitor compound 1 and various inhibitors of EGFR, including both Herl and/or Her2 inhibitors in the forms of either antibody (cetuximab) or small molecules (gefitnib, erlotinib and lapatinib).
TABLE 9 - In vitro combination study of compound 1 with other anti-tumor agents in multiple cell lines: IGFlR-sal, Colo205, RDl, HT-29, WiDr, GEO, MDA-PCa-2b, MCF-7, H3396, N-87, BT474, and SKBR3 cell lines. The combination results were analyzed by Isobolograms.
Class / Compound Combination Result |

These results confirmed our hypothesis based on the pathway analysis. In vivo synergistic effects were also observed in selected xenograft models (data not shown). In addition, combination between multiple cytotoxic agents and compound 1 also resulted in additive activity.
Increased expression level of SRC family members FYN (3 fold) and LYN (11 fold) in the compound 1 acquired resistant RD-I cells may suggest SRC family members act as an alternative signal pathway to play an important role in growth and survival of the acquired resistant cells, and targeting IGFlR in this case is not sufficient enough. Targeting multiple pathways could be one of ways to prevent the acquired resistance. The results in Table 9 also demonstrated that synergistic effect observed between IGFlR inhibitor compound 1 and dasatinib, a novel, oral, multi- targeted kinase inhibitor that targets important oncogenic pathways, including SRC family kinases, BCR-ABL, PDGFR, c-KIT and EPHA2 (L. Lombardo, et al., J. Med. Chem.;47:6658-61 (2004), A. Todd, et al., PNAS; 102;l 1011-11016 (2005)).
Discussion
The development of trastuzumab and EGFR tyrosine kinase inhibitors have demonstrated that careful measurement of biomarkers is necessary when only a small percentage of patients have receptor-driven tumors. Identification of molecular markers predictive of response to IGFlR inhibitors could assist in clinical development by selecting patients most likely to derive clinical benefit. In the present
study, by utilizing both microarray gene expression profiling and LC/MS based "bottom-up" protein profiling technologies and a panel of 29 sarcoma and neuroblastoma cell lines, we identified genes and proteins that differentially expressed between the sensitive and resistant cell lines to IGFlR inhibitors compound 2 and compound 1. Realizing the sensitivity/resistance demarcation in the panel of the cell lines is arbitrarily defined and its relevance to the peak range of the drug concentrations in plasma of patients treated with the clinical achievable dose is unclear, we applied Pearson correlation analysis of expression levels with IC50 values to identify genes/protein correlated with the sensitivity of the drugs in combination with two-sample t-test.
There is a correlation between sensitive/resistant classification to IGFlR inhibitors and different sub-types of cell lines. Notably, most of neuroblastoma, Ewing's and RMS cell lines are sensitive to the inhibitors, making these cell types as the preferred targeting population for IGFlR inhibitors. However, it may create potential possibility of the markers identified are the ones reflecting the specific cell types rather than reflecting the sensitivity of cells to the IGFlR inhibitors. This is not the case for two reasons: first, the sensitive cell lines are consisted of three cell types rather than a single one, and vise visa for the resistant cell llines; second, comparing the drug sensitivity markers identified in this study with the signatures for specific subtypes of sarcomas further excluded the possibility.
A number of gene expression profiling studies of soft tissue tumors have identified the signatures for specific subtypes of sarcomas (C. Baer, et al, Int. J. Cancer, 110(5):687-94 (2004), K. Baird, et al., Cancer Res., 65: (20)9226-35 (2005), T. Nielsen, et al., Lancet, 359(9314): 1301-7 (2002)). For example, the top discriminators for Ewing's sarcoma include FVTl, DCC, DKK2, PAX3 and JAKl; for fibrosarcoma are PMP22, PTPRZl, FNl; for RMS are MYL4, FGFR4, TNNl 1, ACTC, FLNC, and CDH15; for liposarcoma are PPARG, FABP4, FALC5, SH3KBP1, H0XA5 and AIMl, for leiomyosarcoma MYLK, CCNl, PBXl and SLMAP. The comparison results indicated that none of the subtype specific markers are among the intrinsic sensitivity markers we identified.
Since IGFlR plays a role in cell survival and in resistance to the anti-HER2 monoclonal antibody trastuzumab, the expression patterns of the components of
IGFs/IGFIR system were evaluated in this study to see if they have any correlation with the intrinsic sensitivity/resistance to IGFlR inhibitors in the panel of cell lines. The results showed that IGFlR expression level was not significantly correlated to the sensitivity of compound 2 and/or compound 1 in the 29 sarcoma cell lines even through some of the sensitive cell lines had higher IGFlR expression, this does not exclude the possibility that the sensitive cell lines have elevated activity of IGFlR or IGFlR is the major player for the growth of these cell lines. On the other hand, one member of the IGF -binding proteins (IGFBPs), IGFBP6, was significantly higher (>10 fold) in the group of resistant cell lines at basal level. Intriguingly, in the compound 1 acquired resistant RD-I cells, IRS2 was 2 fold and IGFBP2, IGFBP 3, IGFBP 5 and IGFBP 7 were 7 to 15 fold elevated compared to the parent sensitive cells. IRS2 is the substrate for IGFlR and can enhance the IGFlR activity associated with a metastatic phenotype which correlated with increased migration and motility (J. Jackson, et al, Oncogene, 20(50): 7318-25 (2001)). IGFBPs influenced IGF signaling by modulate the bioavailability and bioactivity of the IGFs. Several
IGFBPs are implicated in drug resistance. IGFBP3 and IGFBP5 were reported to be significantly higher from ovarian cancer non-response patients to aromatase inhibitor letrozole compared with responders (G. Walker, et al., Clin. Cancer Res., 13(5): 1438- 44 (2007)). IGFBP-2 mRNA and protein level were found to be overexpressed in resistant cell lines to antiestrogen Faslodex/Fulvestrant, tamoxifen or RU 58,668 (A. Juncker-Jensen, et al., Growth Horm. IGF. Res., 16(4):224-39 (2006)). IGFBPs' actions can be modulated by IGFBP proteases, such as cathepsins that cleave IGFBPs. Higher basal expression level (4 to 12 fold) of lysosomal cysteine protease cathepsin B, L and Z and lysosomal aspartyl protease cathepsin D were observed in the resistant cell lines. In cancer patients, elevated cathepsin B activity correlates to poor therapy outcome. Several studies have shown that levels of cathepsin B and/or cathepsin L are correlated with drug-resistance (e.g., adriamycin) (M. Osmak, et al., Anticancer Res., 21(lA):481-3 (2001), P. Scaddan, et al., Invasion Metastasis., 13(6):301-13 (1993)). Cathepsin L acts as a cell survival molecule responsible for initiation of resistance to chemotherapy, inhibition of cathepsin L with siRNA facilitates induction of senescence and reversal of drug resistance (A. Juncker-Jensen, et al., Growth Horm. IGF Res., 16(4):224-39 (2006)). The association between drug-resistance and
cathepsin D was also studied in nine cervical and laryngeal carcinoma cell lines resistant to different cytostatics, and all drug resistant cell lines had increased concentration of cathepsin D (M. Osmak, et al, Anticancer Res., JuI- Aug;19(4B):3193-7 (1999)). Another group of genes involved in the intrinsic (de novo) drug resistance to
IGFlR inhibitors was metallothionein family members (IF, G, H, M, X, 2A), with over-expression (4 to 9 fold) in resistant cell lines. Metallothionein family members are cysteine-rich proteins that involved in many pathophysiological processes such as metal ion homeostasis and detoxification, protection against oxidative damage, cell proliferation and apoptosis, chemo-resistance (platinum agents, tamoxifen) and radiotherapy resistance (M. Ebadi, et al., Gen Pharmacol., 25(7): 1297-310 (1994)). The basal level overexpression of these family members was also observed in a group of colon cancer lines that are resistant to compound 1 compared to the sensitive cell lines, suggesting the role of metallothionein family members in IGFlR inhibitor drug resistance.
Inhibition of oncogenic protein kinases by small molecule inhibitors has proven to be a valuable strategy for the directed and target-specific treatment of an ever- increasing number of cancer types. Unfortunately, initially successful therapy is often hampered by relatively rapid onset of resistance to the drug and subsequent relapse, particularly in patients with advanced disease. In addition to deriving mutations, loss of target dependence due to the activation of parallel signaling pathways has been also reported as cause for acquired drug resistance. Therefore, novel therapeutic approaches are based on concepts to prevent or circumvent drug resistance, e.g., with target-specific novel drugs interfering with signaling and apoptotic pathways. Revelation of mechanistic details of drug resistance also provides the basis for the development of therapies with novel or conventional antitumor drugs in combination with specific inhibitors to re-establish chemosensitivity. From the present study, it is noteworthy that in the cell lines with de novo resistant to IGFlR inhibitors, other tyrosine kinases such as Met and EGFR were overexpressed. Furthermore, SRC family members FYN and LYN also increased expression levels in the compound 1 acquired resistant cells. These observations may suggest that loss of IGFlR dependence due to overexpression of
other kinases and activation of different signal pathways plays an important role as one of the possible mechanisms in the de novo and acquired resistances to IGFlR inhibitors. It is possible that in the IGFlR inhibitor resistant cell lines, MET and EGFR pathways are presumably more activated and are major factors for the growth signaling, so targeting only IGFlR is not sufficient enough to inhibit growth of these cells.
The same hypothesis could be applied to the IGFlR inhibitor acquired resistant cells because SRC family members FYN and LYN elevated their expression level after the IGFlR inhibitor treatment. Based on these observations, we hypothesize that there should be a potential sensitize activity between IGFlR inhibitors and inhibitors for Met, EGFR or SRC pathways. The combination studies in several tumor cell lines (Table 9) actually demonstrated the synergy effects between IGFlR inhibitor compound 1 and multiple HER1/HER2 inhibitors or dasatinib, a multi-targeted kinase inhibitor that targets important oncogenic pathways including SRC family kinases. The same synergy effects were also observed for IGFlR inhibitor compound 2 (data not show). The results further support the observation that co-inhibition of IGFlR and EGFR synergistically sensitizes cancer cells to induce apoptosis (A. Camirand, et al, Breast Cancer Res., 7(4):R570-9 (2005), J. Steinbach, et al., Biochem. Biophys. Res. Commun., 321(3):524-30 (2004)).
Because the mutations in tyrosine receptor kinases have been linked to the efficacy of the inhibitors targeting these kinases, it is reasonable to ask whether mutations or/and single nucleotide polymorphisms (SNPs) in IGFlR would correlate with the response to the IGFlR inhibitors, compound 2 and compound 1. Sequencing of the IGFlR in Rh41 and RD-I (sensitive lines), Rh36 (primary resistant line) and resistant RD-I (acquired resistant line) has shown no mutations or/and SNPs exist that might cause resistance to the IGFlR inhibitors. Interestingly, no specific mutations in IGF receptors or ligands have been identified in human cancers, but there is clear evidence of epigenetic alterations such as the loss of imprinting (LOI) of IGF-II in a variety of human tumors (S. Ranier, et al., Hum. MoI. Genet., 3(2):386 (1994), S. Zhan, et al., Clin. Invest., 94(1): 445-8 (1994)). Furthermore, no SNPs that cause amino acid changes in the IGFlR protein have been reported in the NCBI dbSNP
database, the Japanese SNP database or the Incyte Foundation database. In addition, no human inherited disorders are attributed to mutations in IGFlR. In order to further evaluate potential IGFlR mutations in human cancers, we sequenced the human IGFlR gene from a panel of genomic DNA derived from 24 tumor-derived cell lines and from 48 human primary lung tumors and no germline variations or somatic mutations were identified in these tumor/cell line samples during tumorigenesis, although amplification of the IGFlR locus has been reported in a small number of breast cancer and melanoma specimens (A. Almeida, et al, Genes Chromosomes Cancer, 11(1): 63-5 (1994)). From protein profiles of the baseline expression in 29 cell lines, a strikingly large number of the proteins identified are involved in cell adhesion and cell motility and extracellular signaling regulated processes. Most actin binding proteins found were present in lower levels in the IGFlR sensitive cell lines. The overall goal of this study is to understand the difference in the proteomic signatures of resistant and sensitive cell lines. The pattern emerging from these data is a profile of sensitive cell lines with lower levels of cytoskeleton binding proteins, and overall higher levels of DNA and RNA binding proteins found in the nucleus. The open question is how these features confer the sensitivity to IGFlR inhibitors on the sarcoma cell lines studied here. There is differential sensitivity of compound 2 and compound 1 in a pair of human RMS cells that are sensitive (Rh41) or resistant (Rh36) to the drugs in a cellular proliferation assay (Table 1). These two cell lines have different chromosomal translocations: Rh41 cells harbor a PAX3-FKHR translocation, t(2;13)(q35;ql4), whereas Rh36 cells harbor a EWS-FLI-I translocation, t(l I;22)(q24;ql2). Gene expression revealed that Rh41 cells have a significant higher level of IGFlR but limited expression of IR, the results were confirmed by RT-PCR measurements (IGFIR/IR ratio=445) and by FACS analysis (data not shown). No mutations in the IGFlR were apparent in both cell lines. In general, the level of IGFlR expression has not been correlated with increased sensitivity in multiple cell lines, thus the sensitivity might be due to differential signaling pathways in these cells. In order to better understand the mechanism of the differential sensitivity, the two cell lines were evaluated by drug treatment and global gene/protein profiling to
monitor the differential changes in gene/protein expression. Overall, in Rh36 cells the drug had little, to no effect especially at later time points, 36 and 72hrs. This makes sense considering the drug concentration of compound 1 used in the study, Rh36 is highly resistant. However, in the sensitive cell Rh41, 30% of genes have significant expression changes upon the drug treatment. These genes are mainly involved in apoptosis, cell growth and proliferation, cell cycles and multiple tyrosine kinases pathways as well as the down-stream IGFlR signaling pathways: MAPK, PI3K and AKT. The expression level of survivin was significantly reduced especially at 36 and 72 hours and programmed cell death 4 (PDCD4) was up-regulated by compound 1 treatment in the sensitive Rh41 cells, but not in resistant Rh36 cells. PDCD4 is a tumor suppressor protein and its expression is strongly induced during apoptosis in a number of cell types (O. Afonja, et al, Oncogene, 23(49):8135-45 (2004)). Thus, up-regulation of PDCD4 expression may suggest apoptosis induced by compound 1 in sensitive cell lines only. This is in agreement with Western blot analysis showed both Rh41 and Rh36 cell lines have high expression of pBad, but only Rh41 cells showed significant reduction in pBad activity by 6 hrs of drug treatment. The reduction in pBad activity was accompanied by an increase in apoptosis when cells were exposed to the drugs for 24-48 hrs, followed by a Gl arrest. Remarkable but not complete decrease of Ki-67 in compound 1 treated cells may suggest the inhibitor with the cytostatic rather than cytotoxic effect. The inhibitor may induce apoptosis and lower the survival threshold of cancer cells thereby augmenting a second apoptotic stimulus by another agent in a combination therapy.
There are 41% of 183 total tested KEGG pathways significantly different between the sensitive and resistant cell lines to IGFlR inhibitor. This provides a general clue on what are the main differences conferring the cell's sensitivity to IGFlR inhibitor. For example, apoptosis pathway is one of the differences, many genes promoting apoptosis have higher expression levels in the resistant cell lines. Detailed dissection of the pathway is needed to get insights for whether resistant cell lines have higher threshold to be apoptotic due to presence of other growth signaling pathways (e.g., EGFR, MET) in addition to IGFlR pathway, whereas in the sensitive cell lines, IGFlR is probably the dominant growth and survival driver.
In conclusion, molecular characterization of a panel of soft tissue sarcoma cell lines lead to identified signatures or candidate markers correlating with the intrinsic sensitivity in vitro to IGFlR inhibitors, compound 1 and compound 2. Whether these signatures or markers have the utility in predicting the response to IGFlR inhibitors in the patients with sarcoma needs to be tested in clinic. The possible mechanisms for both intrinsic and acquired drug resistances were explored and could be due to the alternative activation of other parallel signaling pathways besides IGFlR. Based on these possible mechanisms, the combination strategies to target multiple pathways was proposed and tested, synergistic activity of inhibitors for IGFl-R and EGFR, or SRC was observed. This provides some clues on the strategies for developing IGFlR inhibitor and possible combination therapies in clinical trials to achieve synergy between inhibitors for IGFlR and other kinases.
EXAMPLE 2 - PRODUCTION OF ANTIBODIES AGAINST THE BIOMARKERS: Antibodies against the biomarkers can be prepared by a variety of methods.
For example, cells expressing an biomarker polypeptide can be administered to an animal to induce the production of sera containing polyclonal antibodies directed to the expressed polypeptides. In one aspect, the biomarker protein is prepared and isolated or otherwise purified to render it substantially free of natural contaminants, using techniques commonly practiced in the art. Such a preparation is then introduced into an animal in order to produce polyclonal antisera of greater specific activity for the expressed and isolated polypeptide.
In one aspect, the antibodies of the invention are monoclonal antibodies (or protein binding fragments thereof). Cells expressing the biomarker polypeptide can be cultured in any suitable tissue culture medium, however, it is preferable to culture cells in Earle's modified Eagle's medium supplemented to contain 10% fetal bovine serum (inactivated at about 56 0C), and supplemented to contain about 10 g/1 nonessential amino acids, about 1,00 U/ml penicillin, and about 100 μg/ml streptomycin. The splenocytes of immunized (and boosted) mice can be extracted and fused with a suitable myeloma cell line. Any suitable myeloma cell line can be employed in accordance with the invention, however, it is preferable to employ the parent
myeloma cell line (SP2/0), available from the ATCC. After fusion, the resulting hybridoma cells are selectively maintained in HAT medium, and then cloned by limiting dilution as described by Wands et al. (1981, Gastroenterology, 80:225-232). The hybridoma cells obtained through such a selection are then assayed to identify those cell clones that secrete antibodies capable of binding to the polypeptide immunogen, or a portion thereof.
Alternatively, additional antibodies capable of binding to the biomarker polypeptide can be produced in a two-step procedure using anti-idiotypic antibodies. Such a method makes use of the fact that antibodies are themselves antigens and, therefore, it is possible to obtain an antibody that binds to a second antibody. In accordance with this method, protein specific antibodies can be used to immunize an animal, preferably a mouse. The splenocytes of such an immunized animal are then used to produce hybridoma cells, and the hybridoma cells are screened to identify clones that produce an antibody whose ability to bind to the protein-specific antibody can be blocked by the polypeptide. Such antibodies comprise anti-idiotypic antibodies to the protein-specific antibody and can be used to immunize an animal to induce the formation of further protein-specific antibodies.
EXAMPLE 3 - IMMUNOFLUORESCENCE ASSAYS: The following immunofluorescence protocol may be used, for example, to verify IGFlR biomarker protein expression on cells or, for example, to check for the presence of one or more antibodies that bind IGFlR biomarkers expressed on the surface of cells. Briefly, Lab-Tek II chamber slides are coated overnight at 4 0C with 10 micrograms/milliliter (μg/ml) of bovine collagen Type II in DPBS containing calcium and magnesium (DPBS++). The slides are then washed twice with cold
DPB S++ and seeded with 8000 CHO-CCR5 or CHO pC4 transfected cells in a total volume of 125 μl and incubated at 37 0C in the presence of 95% oxygen / 5% carbon dioxide.
The culture medium is gently removed by aspiration and the adherent cells are washed twice with DPBS++ at ambient temperature. The slides are blocked with DPBS++ containing 0.2% BSA (blocker) at 0-4 0C for one hour. The blocking solution is gently removed by aspiration, and 125 μl of antibody containing solution
(an antibody containing solution may be, for example, a hybridoma culture supernatant which is usually used undiluted, or serum/plasma which is usually diluted, e.g., a dilution of about 1/100 dilution). The slides are incubated for 1 hour at 0-4 0C. Antibody solutions are then gently removed by aspiration and the cells are washed five times with 400 μl of ice cold blocking solution. Next, 125 μl of 1 μg/ml rhodamine labeled secondary antibody (e.g., anti-human IgG) in blocker solution is added to the cells. Again, cells are incubated for 1 hour at 0-4 0C.
The secondary antibody solution is then gently removed by aspiration and the cells are washed three times with 400 μl of ice cold blocking solution, and five times with cold DPBS++. The cells are then fixed with 125 μl of 3.7% formaldehyde in
DPBS++ for 15 minutes at ambient temperature. Thereafter, the cells are washed five times with 400 μl of DPBS++ at ambient temperature. Finally, the cells are mounted in 50% aqueous glycerol and viewed in a fluorescence microscope using rhodamine filters.
Claims
1. A method for predicting the likelihood a mammal will respond therapeutically to a method of treating cancer comprising administering an IGFlR modulator, wherein the method comprises:
(a) measuring in the mammal the level of at least one biomarker selected from the biomarkers of Tables 2-8;
(b) exposing a biological sample from said mammal to the IGFlR modulator; (c) following the exposing of step (b), measuring in said biological sample the level of the at least one biomarker, wherein an increase in the level of the at least one biomarker measured in step (c) compared to the level of the at least one biomarker measured in step (a), indicates an increased likelihood that the mammal will respond therapeutically to said method of treating cancer when said at least one biomarker is a sensitivity biomarker, and indicates an increased likelihood that the mammal will not respond therapeutically to said method of treating cancer when said at least one biomarker is a resistance biomarker.
2. The method of claim 1 wherein said biological sample is a tissue sample comprising cancer cells and said tissue is fixed, paraffin-embedded, fresh, or frozen.
Priority Applications (2)
| Application Number | Priority Date | Filing Date | Title |
|---|---|---|---|
| EP08755471A EP2145021A2 (en) | 2007-05-17 | 2008-05-15 | Biomarkers and methods for determining sensitivity to insulin growth factor-1 receptor modulators |
| US12/600,504 US8492328B2 (en) | 2007-05-17 | 2008-05-15 | Biomarkers and methods for determining sensitivity to insulin growth factor-1 receptor modulators |
Applications Claiming Priority (2)
| Application Number | Priority Date | Filing Date | Title |
|---|---|---|---|
| US93857007P | 2007-05-17 | 2007-05-17 | |
| US60/938,570 | 2007-05-17 |
Publications (2)
| Publication Number | Publication Date |
|---|---|
| WO2008144345A2 true WO2008144345A2 (en) | 2008-11-27 |
| WO2008144345A3 WO2008144345A3 (en) | 2009-03-05 |
Family
ID=39862955
Family Applications (1)
| Application Number | Title | Priority Date | Filing Date |
|---|---|---|---|
| PCT/US2008/063621 WO2008144345A2 (en) | 2007-05-17 | 2008-05-15 | Biomarkers and methods for determining sensitivity to insulin growth factor-1 receptor modulators |
Country Status (3)
| Country | Link |
|---|---|
| US (1) | US8492328B2 (en) |
| EP (2) | EP2559771A3 (en) |
| WO (1) | WO2008144345A2 (en) |
Cited By (17)
| Publication number | Priority date | Publication date | Assignee | Title |
|---|---|---|---|---|
| WO2009079587A3 (en) * | 2007-12-18 | 2009-11-12 | Schering Corporation | Biomarkers for sensitivity to anti-igf1r therapy |
| US7939272B2 (en) | 2007-10-03 | 2011-05-10 | Osi Pharmaceuticals, Inc. | Biological markers predictive of anti-cancer response to insulin-like growth factor-1 receptor kinase inhibitors |
| WO2011053779A3 (en) * | 2009-10-30 | 2011-08-11 | Bristol-Myers Squibb Company | Methods for treating cancer in patients having igf-1r inhibitor resistance |
| US8048621B2 (en) | 2007-10-03 | 2011-11-01 | OSI Pharmaceuticals, LLC | Biological markers predictive of anti-cancer response to insulin-like growth factor-1 receptor kinase inhibitors |
| WO2012106556A2 (en) | 2011-02-02 | 2012-08-09 | Amgen Inc. | Methods and compositons relating to inhibition of igf-1r |
| WO2012116040A1 (en) | 2011-02-22 | 2012-08-30 | OSI Pharmaceuticals, LLC | Biological markers predictive of anti-cancer response to insulin-like growth factor-1 receptor kinase inhibitors in hepatocellular carcinoma |
| EP2507392A1 (en) * | 2009-11-30 | 2012-10-10 | Merck Sharp & Dohme Corp. | Methods for the identification and treatment of patients sensitive to anti igf-1r inhibition therapy |
| US8318159B2 (en) | 2008-12-12 | 2012-11-27 | Boehringer Ingelheim International Gmbh | Anti-IGF antibodies |
| WO2013055911A1 (en) * | 2011-10-14 | 2013-04-18 | Dana-Farber Cancer Institute, Inc. | Znf365/zfp365 biomarker predictive of anti-cancer response |
| WO2013056069A1 (en) * | 2011-10-13 | 2013-04-18 | Bristol-Myers Squibb Company | Methods for selecting and treating cancer in patients with igf-1r/ir inhibitors |
| US8580254B2 (en) | 2007-06-19 | 2013-11-12 | Boehringer Ingelheim International Gmbh | Anti-IGF antibodies |
| WO2014002007A1 (en) * | 2012-06-26 | 2014-01-03 | Piramal Enterprises Limited | Method of predicting or monitoring response to igf-1r and ir inhibitors using biomarkers |
| WO2015026909A3 (en) * | 2013-08-23 | 2015-04-16 | Nuclea Biotechnologies, Inc. | Msia-srm assay for biomarker analysis |
| AU2011279555B2 (en) * | 2010-07-14 | 2016-10-20 | Vision Tech Bio Pty Ltd | Diagnostic for colorectal cancer |
| US9896730B2 (en) | 2011-04-25 | 2018-02-20 | OSI Pharmaceuticals, LLC | Use of EMT gene signatures in cancer drug discovery, diagnostics, and treatment |
| US10377828B2 (en) | 2013-03-07 | 2019-08-13 | Boehringer Ingelheim International Gmbh | Combination therapy for neoplasia treatment |
| CN111303267A (en) * | 2020-03-03 | 2020-06-19 | 卓尔康(北京)生物科技有限公司 | Polypeptide with NK cell killing activity enhancement function and application thereof |
Families Citing this family (13)
| Publication number | Priority date | Publication date | Assignee | Title |
|---|---|---|---|---|
| CA2655997A1 (en) * | 2006-06-30 | 2008-01-10 | Schering Corporation | Igfbp2 biomarker |
| WO2010042228A2 (en) * | 2008-10-10 | 2010-04-15 | Cornell University | Methods for predicting disease outcome in patients with colon cancer |
| US8163509B2 (en) * | 2008-10-20 | 2012-04-24 | The Regents Of The University Of Colorado, A Body Corporate | Biological markers predictive of anti-cancer response to insulin-like growth factor-1 receptor kinase inhibitors |
| EP2270510A1 (en) * | 2009-07-02 | 2011-01-05 | EMBL (European Molecular Biology Laboratory) | Diagnostic method for predicting the risk of cancer recurrence based on Histone macroH2A isoforms |
| KR101133243B1 (en) * | 2009-10-29 | 2012-04-06 | 국립암센터 | Use of eIF3m for the Diagnosis and Treatment of Cancer |
| WO2011109584A2 (en) * | 2010-03-03 | 2011-09-09 | OSI Pharmaceuticals, LLC | Biological markers predictive of anti-cancer response to insulin-like growth factor-1 receptor kinase inhibitors |
| NZ703411A (en) | 2012-06-27 | 2017-09-29 | Berg Llc | Use of markers in the diagnosis and treatment of prostate cancer |
| BR112016004242A8 (en) | 2013-08-28 | 2018-06-12 | Stemcentrx Inc | METHODS FOR SITE-SPECIFIC CONJUGATION OF ANTIBODIES AND COMPOSITIONS |
| EA201691683A1 (en) * | 2014-02-21 | 2017-04-28 | ЭББВИ СТЕМСЕНТРКС ЭлЭлСи | ANTIBODIES AGAINST DLL3 AND CONJUGATES ANTIBODY AND MEDICINE FOR USE FOR MELANOMA |
| WO2016011065A1 (en) * | 2014-07-15 | 2016-01-21 | Salk Institute For Biolofical Studies | Detecting dixdc1 (dix domain-containing protein 1) expression to determine if a tumor will respond to fak and src kinase inhibitors |
| EP4242329A3 (en) | 2014-12-08 | 2023-10-25 | Berg LLC | Use of markers including filamin a in the diagnosis and treatment of prostate cancer |
| CN111394463B (en) * | 2020-04-22 | 2021-03-30 | 中国人民解放军联勤保障部队第九六0医院 | Thyroid cancer related molecule and application thereof |
| CN112980948B (en) * | 2020-08-28 | 2023-03-21 | 中山大学附属口腔医院 | Application of NFAT3 as therapeutic target in screening or preparing head and neck squamous cell carcinoma drugs |
Citations (19)
| Publication number | Priority date | Publication date | Assignee | Title |
|---|---|---|---|---|
| US5569588A (en) | 1995-08-09 | 1996-10-29 | The Regents Of The University Of California | Methods for drug screening |
| WO2000034784A1 (en) | 1998-12-10 | 2000-06-15 | Phylos, Inc. | Protein scaffolds for antibody mimics and other binding proteins |
| WO2001064942A1 (en) | 2000-02-29 | 2001-09-07 | Phylos, Inc. | Protein scaffolds for antibody mimics and other binding proteins |
| WO2002032925A2 (en) | 2000-10-16 | 2002-04-25 | Phylos, Inc. | Protein scaffolds for antibody mimics and other binding proteins |
| WO2002053596A2 (en) | 2001-01-05 | 2002-07-11 | Pfizer Inc. | Antibodies to insulin-like growth factor i receptor |
| WO2002079192A1 (en) | 2001-03-28 | 2002-10-10 | Bristol-Myers Squibb Company | Novel tyrosine kinase inhibitors |
| WO2003059951A2 (en) | 2002-01-18 | 2003-07-24 | Pierre Fabre Medicament | Novel anti-igf-ir antibodies and uses thereof |
| WO2003100008A2 (en) | 2002-05-24 | 2003-12-04 | Schering Corporation | Neutralizing human anti-igfr antibody |
| WO2003106621A2 (en) | 2002-06-14 | 2003-12-24 | Immunogen, Inc. | Anti-igf-i receptor antibody |
| WO2004030620A2 (en) | 2002-09-30 | 2004-04-15 | Bristol-Myers Squibb Company | Novel tyrosine kinase inhibitors |
| WO2004031401A2 (en) | 2002-10-02 | 2004-04-15 | Bristol-Myers Squibb Company | Novel tyrosine kinases inhibitors |
| WO2004063151A2 (en) | 2003-01-03 | 2004-07-29 | Bristol-Myers Squibb Company | Novel tyrosine kinase inhibitors |
| WO2004071529A2 (en) | 2003-02-13 | 2004-08-26 | Pfizer Products Inc. | Uses of anti-insulin-like growth factor i receptor antibodies |
| WO2004083248A1 (en) | 2003-03-14 | 2004-09-30 | Pharmacia Corporation | Antibodies to igf-i receptor for the treatment of cancers |
| WO2004087756A2 (en) | 2003-04-02 | 2004-10-14 | F. Hoffmann-La Roche Ag | Antibodies against insulin-like growth factor i receptor and uses thereof |
| WO2005005635A2 (en) | 2003-07-10 | 2005-01-20 | F. Hoffmann-La Roche Ag | Antibodies against insulin-like growth factor i receptor and uses thereof |
| WO2005016970A2 (en) | 2003-05-01 | 2005-02-24 | Imclone Systems Incorporated | Fully human antibodies directed against the human insulin-like growth factor-1 receptor |
| WO2005016967A2 (en) | 2003-08-13 | 2005-02-24 | Pfizer Products Inc. | Modified human igf-1r antibodies |
| WO2005021510A2 (en) | 2003-07-29 | 2005-03-10 | Bristol-Myers Squibb Company | Benzimidazole c-2 heterocycles as kinase inhibitors |
Family Cites Families (9)
| Publication number | Priority date | Publication date | Assignee | Title |
|---|---|---|---|---|
| US7371736B2 (en) * | 2001-11-07 | 2008-05-13 | The Board Of Trustees Of The University Of Arkansas | Gene expression profiling based identification of DKK1 as a potential therapeutic targets for controlling bone loss |
| US7781393B2 (en) | 2004-02-25 | 2010-08-24 | Dana-Farber Cancer Institute, Inc. | Methods for inhibiting tumor cell growth |
| MX2007006640A (en) | 2004-12-03 | 2007-06-19 | Schering Corp | Biomarkers for pre-selection of patients for anti-igf1r therapy. |
| ES2380651T3 (en) * | 2005-09-01 | 2012-05-17 | Bristol-Myers Squibb Company | Biomarkers and procedures to determine the sensitivity to modulators of reciprocator 2 of vascular endothelial growth factor |
| AU2007269163B2 (en) * | 2006-07-07 | 2011-07-28 | Bristol-Myers Squibb Company | Pyrrolotriazine kinase inhibitors |
| CL2007002225A1 (en) * | 2006-08-03 | 2008-04-18 | Astrazeneca Ab | SPECIFIC UNION AGENT FOR A RECEIVER OF THE GROWTH FACTOR DERIVED FROM PLATES (PDGFR-ALFA); NUCLEIC ACID MOLECULA THAT CODIFIES IT; VECTOR AND CELL GUESTS THAT UNDERSTAND IT; CONJUGADO UNDERSTANDING THE AGENT; AND USE OF THE AGENT OF A |
| JP5225288B2 (en) | 2006-12-20 | 2013-07-03 | ブリストル−マイヤーズ スクイブ カンパニー | Thiazolyl compounds useful as kinase inhibitors |
| ATE548364T1 (en) | 2007-01-05 | 2012-03-15 | Bristol Myers Squibb Co | AMINOPYRAZOLE KINASE INHIBITORS |
| CN101687874B (en) | 2007-04-18 | 2013-01-30 | 百时美施贵宝公司 | Pyrrolotriazine kinase inhibitors |
-
2008
- 2008-05-15 EP EP12169969.8A patent/EP2559771A3/en not_active Withdrawn
- 2008-05-15 US US12/600,504 patent/US8492328B2/en not_active Expired - Fee Related
- 2008-05-15 WO PCT/US2008/063621 patent/WO2008144345A2/en active Application Filing
- 2008-05-15 EP EP08755471A patent/EP2145021A2/en not_active Withdrawn
Patent Citations (19)
| Publication number | Priority date | Publication date | Assignee | Title |
|---|---|---|---|---|
| US5569588A (en) | 1995-08-09 | 1996-10-29 | The Regents Of The University Of California | Methods for drug screening |
| WO2000034784A1 (en) | 1998-12-10 | 2000-06-15 | Phylos, Inc. | Protein scaffolds for antibody mimics and other binding proteins |
| WO2001064942A1 (en) | 2000-02-29 | 2001-09-07 | Phylos, Inc. | Protein scaffolds for antibody mimics and other binding proteins |
| WO2002032925A2 (en) | 2000-10-16 | 2002-04-25 | Phylos, Inc. | Protein scaffolds for antibody mimics and other binding proteins |
| WO2002053596A2 (en) | 2001-01-05 | 2002-07-11 | Pfizer Inc. | Antibodies to insulin-like growth factor i receptor |
| WO2002079192A1 (en) | 2001-03-28 | 2002-10-10 | Bristol-Myers Squibb Company | Novel tyrosine kinase inhibitors |
| WO2003059951A2 (en) | 2002-01-18 | 2003-07-24 | Pierre Fabre Medicament | Novel anti-igf-ir antibodies and uses thereof |
| WO2003100008A2 (en) | 2002-05-24 | 2003-12-04 | Schering Corporation | Neutralizing human anti-igfr antibody |
| WO2003106621A2 (en) | 2002-06-14 | 2003-12-24 | Immunogen, Inc. | Anti-igf-i receptor antibody |
| WO2004030620A2 (en) | 2002-09-30 | 2004-04-15 | Bristol-Myers Squibb Company | Novel tyrosine kinase inhibitors |
| WO2004031401A2 (en) | 2002-10-02 | 2004-04-15 | Bristol-Myers Squibb Company | Novel tyrosine kinases inhibitors |
| WO2004063151A2 (en) | 2003-01-03 | 2004-07-29 | Bristol-Myers Squibb Company | Novel tyrosine kinase inhibitors |
| WO2004071529A2 (en) | 2003-02-13 | 2004-08-26 | Pfizer Products Inc. | Uses of anti-insulin-like growth factor i receptor antibodies |
| WO2004083248A1 (en) | 2003-03-14 | 2004-09-30 | Pharmacia Corporation | Antibodies to igf-i receptor for the treatment of cancers |
| WO2004087756A2 (en) | 2003-04-02 | 2004-10-14 | F. Hoffmann-La Roche Ag | Antibodies against insulin-like growth factor i receptor and uses thereof |
| WO2005016970A2 (en) | 2003-05-01 | 2005-02-24 | Imclone Systems Incorporated | Fully human antibodies directed against the human insulin-like growth factor-1 receptor |
| WO2005005635A2 (en) | 2003-07-10 | 2005-01-20 | F. Hoffmann-La Roche Ag | Antibodies against insulin-like growth factor i receptor and uses thereof |
| WO2005021510A2 (en) | 2003-07-29 | 2005-03-10 | Bristol-Myers Squibb Company | Benzimidazole c-2 heterocycles as kinase inhibitors |
| WO2005016967A2 (en) | 2003-08-13 | 2005-02-24 | Pfizer Products Inc. | Modified human igf-1r antibodies |
Non-Patent Citations (41)
| Title |
|---|
| A. POTTI ET AL., NAT. MED., vol. 12, no. 11, November 2006 (2006-11-01), pages 1294 - 300 |
| A.A. ALIZADEH ET AL., NATURE, vol. 403, 2000, pages 503 - 511 |
| BLANCHARD ET AL., NATURE BIOTECHNOLOGY, vol. 14, 1996, pages 1649 |
| C. ARTEAGA ET AL., CANCER RES., vol. 49, no. 22, 1989, pages 6237 - 41 |
| C. D'AMBROSIO ET AL., CANCER RES, vol. 56, no. 17, 1996, pages 4013 - 20 |
| C. GARCIA-ECHEVERRIA ET AL., CANCER CELL, vol. 5, no. 3, 2004, pages 231 - 9 |
| D. ANDREWS ET AL., J. CLIN. ONCOL., vol. 19, no. 8, 2001, pages 2189 - 200 |
| D. LEROITH ET AL., CANCER LETT., vol. 195, no. 2, 2003, pages 127 - 37 |
| D. YEE ET AL., J. CLIN. INVEST., vol. 86, no. 6, 1990, pages 1806 - 14 |
| F. HUANG F ET AL., CANCER RES., vol. 67, no. 5, 1 March 2007 (2007-03-01), pages 2226 - 38 |
| G. GLINSKY ET AL., THE JOURNAL OF CLIN. INVEST., vol. 113, no. 6, 2004, pages 913 - 923 |
| G. MERLINO ET AL., ONCOGENE, vol. 18, 1999, pages 5340 - 8 |
| H. DRESSMAN ET AL., CLIN. CANCER RES., vol. 12, 2006, pages 819 - 26 |
| H. DRESSMAN ET AL., J. CLIN. ONCOL., vol. 25, no. 5, 10 February 2007 (2007-02-10), pages 517 - 25 |
| H. PROKISCH ET AL., PLOS BIOL., vol. 2, no. 6, June 2004 (2004-06-01), pages E 160 |
| J. BASELGA ET AL., J CLIN ONCOL., vol. 14, 2005, pages 737 - 744 |
| J. KHAN ET AL., CANCER RES., vol. 58, 1998, pages 5009 - 5013 |
| J. KHAN ET AL., NATURE MEDICINE, vol. 7, no. 6, 2001, pages 673 - 679 |
| K. HESS ET AL., J. CLIN. ONCOL., vol. 24, 2006, pages 4236 - 44 |
| K. IWAO-KOIZUMI ET AL., J. CLIN. ONCOL., vol. 23, 2005, pages 422 - 31 |
| K. SCOTLANDI ET AL., CANCER RES., vol. 56, 1996, pages 4570 - 4 |
| K. SCOTLANDI ET AL., CANCER RES., vol. 65, no. 9, 1 May 2005 (2005-05-01), pages 3868 - 76 |
| L. LONG ET AL., CANCER RES, vol. 55, no. 5, 1995, pages 1006 - 9 |
| L.J. VAN'T VEER ET AL., NATURE, vol. 415, 2002, pages 530 - 536 |
| LOCKHART ET AL., NATURE BIOTECHNOLOGY, vol. 14, 1996, pages 1675 - 1680 |
| M. BITTNER ET AL., NATURE, vol. 406, 2000, pages 536 - 540 |
| M. COCKETT ET AL., CURRENT OPINION IN BIOTECHNOLOGY, vol. 11, 2000, pages 602 - 609 |
| M. LIPTON ET AL., PROC. NATL. ACAD. SCI. U S A., vol. 99, no. 17, 20 August 2002 (2002-08-20), pages 11049 - 54 |
| M. MANARA ET AL., CLINICAL CANCER RES., vol. 13, no. 4, 2007, pages 1322 - 30 |
| M. SHIPP ET AL., NATURE MEDICINE, vol. 8, no. 1, 2002, pages 68 - 74 |
| M. WITTMAN ET AL., J. MED. CHEM., vol. 48, no. 18, 8 September 2005 (2005-09-08), pages 5639 - 43 |
| P. SONNEVELD, J. INTERN. MED., vol. 247, 2000, pages 521 - 534 |
| R. BASERGA ET AL., INT. J. CANCER, vol. 107, 2003, pages 873 - 7 |
| R. ROUZIER ET AL., CLIN. CANCER RES., vol. 11, 2005, pages 5678 - 85 |
| S. BENINI ET AL., CLINICAL CANCER RES., vol. 7, 2001, pages 1790 - 97 |
| S. BURROW ET AL., J. SURG. ONCOL., vol. 69, 1998, pages 21 - 7 |
| SCHENA ET AL., SCIENCE, vol. 270, 1995, pages 467 - 470 |
| T. LYNCH ET AL., N. ENGL. J. MED., vol. 350, 2004, pages 2129 - 2139 |
| T.R. GOLUB ET AL., SCIENCE, vol. 286, 1999, pages 531 - 537 |
| U. ALON ET AL., P. N. A. S. USA, vol. 96, 1999, pages 6745 - 6750 |
| Z. PIETRZKOWSKI ET AL., CANCER RES., vol. 53, no. 5, 1993, pages 1102 - 6 |
Cited By (23)
| Publication number | Priority date | Publication date | Assignee | Title |
|---|---|---|---|---|
| US8580254B2 (en) | 2007-06-19 | 2013-11-12 | Boehringer Ingelheim International Gmbh | Anti-IGF antibodies |
| US7939272B2 (en) | 2007-10-03 | 2011-05-10 | Osi Pharmaceuticals, Inc. | Biological markers predictive of anti-cancer response to insulin-like growth factor-1 receptor kinase inhibitors |
| US8048621B2 (en) | 2007-10-03 | 2011-11-01 | OSI Pharmaceuticals, LLC | Biological markers predictive of anti-cancer response to insulin-like growth factor-1 receptor kinase inhibitors |
| WO2009079587A3 (en) * | 2007-12-18 | 2009-11-12 | Schering Corporation | Biomarkers for sensitivity to anti-igf1r therapy |
| US11299538B2 (en) | 2008-12-12 | 2022-04-12 | Boehringer Ingelheim International Gmbh | Anti-IGF antibodies |
| US10179810B2 (en) | 2008-12-12 | 2019-01-15 | Boehringer Ingelheim International Gmbh | Anti-IGF antibodies |
| US8318159B2 (en) | 2008-12-12 | 2012-11-27 | Boehringer Ingelheim International Gmbh | Anti-IGF antibodies |
| WO2011053779A3 (en) * | 2009-10-30 | 2011-08-11 | Bristol-Myers Squibb Company | Methods for treating cancer in patients having igf-1r inhibitor resistance |
| EP2507392A1 (en) * | 2009-11-30 | 2012-10-10 | Merck Sharp & Dohme Corp. | Methods for the identification and treatment of patients sensitive to anti igf-1r inhibition therapy |
| US9110082B2 (en) | 2009-11-30 | 2015-08-18 | Merck Sharp & Dohme Corp. | Methods for the identification and treatment of patients sensitive to anti IGF-1R inhibition therapy |
| EP2507392A4 (en) * | 2009-11-30 | 2013-06-05 | Merck Sharp & Dohme | Methods for the identification and treatment of patients sensitive to anti igf-1r inhibition therapy |
| AU2011279555B2 (en) * | 2010-07-14 | 2016-10-20 | Vision Tech Bio Pty Ltd | Diagnostic for colorectal cancer |
| US10877039B2 (en) | 2010-07-14 | 2020-12-29 | Vision Tech Bio Pty. Ltd. | Diagnostic for colorectal cancer |
| WO2012106556A2 (en) | 2011-02-02 | 2012-08-09 | Amgen Inc. | Methods and compositons relating to inhibition of igf-1r |
| WO2012116040A1 (en) | 2011-02-22 | 2012-08-30 | OSI Pharmaceuticals, LLC | Biological markers predictive of anti-cancer response to insulin-like growth factor-1 receptor kinase inhibitors in hepatocellular carcinoma |
| US9896730B2 (en) | 2011-04-25 | 2018-02-20 | OSI Pharmaceuticals, LLC | Use of EMT gene signatures in cancer drug discovery, diagnostics, and treatment |
| WO2013056069A1 (en) * | 2011-10-13 | 2013-04-18 | Bristol-Myers Squibb Company | Methods for selecting and treating cancer in patients with igf-1r/ir inhibitors |
| WO2013055911A1 (en) * | 2011-10-14 | 2013-04-18 | Dana-Farber Cancer Institute, Inc. | Znf365/zfp365 biomarker predictive of anti-cancer response |
| US10378060B2 (en) | 2011-10-14 | 2019-08-13 | Dana-Farber Cancer Institute, Inc. | ZNF365/ZFP365 biomarker predictive of anti-cancer response |
| WO2014002007A1 (en) * | 2012-06-26 | 2014-01-03 | Piramal Enterprises Limited | Method of predicting or monitoring response to igf-1r and ir inhibitors using biomarkers |
| US10377828B2 (en) | 2013-03-07 | 2019-08-13 | Boehringer Ingelheim International Gmbh | Combination therapy for neoplasia treatment |
| WO2015026909A3 (en) * | 2013-08-23 | 2015-04-16 | Nuclea Biotechnologies, Inc. | Msia-srm assay for biomarker analysis |
| CN111303267A (en) * | 2020-03-03 | 2020-06-19 | 卓尔康(北京)生物科技有限公司 | Polypeptide with NK cell killing activity enhancement function and application thereof |
Also Published As
| Publication number | Publication date |
|---|---|
| US20100184125A1 (en) | 2010-07-22 |
| EP2145021A2 (en) | 2010-01-20 |
| EP2559771A3 (en) | 2013-06-12 |
| EP2559771A2 (en) | 2013-02-20 |
| WO2008144345A3 (en) | 2009-03-05 |
| US8492328B2 (en) | 2013-07-23 |
Similar Documents
| Publication | Publication Date | Title |
|---|---|---|
| EP2145021A2 (en) | Biomarkers and methods for determining sensitivity to insulin growth factor-1 receptor modulators | |
| RU2739942C2 (en) | Therapeutic, diagnostic and prognostic methods for bladder cancer | |
| Movva et al. | Multi-platform profiling of over 2000 sarcomas: identification of biomarkers and novel therapeutic targets | |
| EP1751309B1 (en) | Methods for prediction of clinical outcome to epidermal growth factor receptor inhibitors by cancer patients | |
| EP1917528A2 (en) | Biomarkers and methods for determining sensitivity to epidermal growth factor receptor modulators | |
| US20140296248A1 (en) | Methods and compositions for predicting resistance to anticancer treatment | |
| US20100196366A1 (en) | Gefitnib Sensitivity-Related Gene Expression and Products and Methods Related Thereto | |
| EP1735463A2 (en) | Biomarkers and methods for determining sensitivity to epidermal growth factor receptor modulators in non-small cell lung cancer | |
| JP2014531213A (en) | Diagnostic methylation markers for epithelial or mesenchymal phenotype and response to EGFR kinase inhibitors in tumors or tumor cells | |
| KR20110018930A (en) | Identification and use of prognostic and predictive markers in cancer treatment | |
| US20140155397A1 (en) | Emt signatures and predictive markers and method of using the same | |
| CN106661624B (en) | Centromere/kinetochore protein genes for cancer diagnosis, prognosis and therapy selection | |
| US20130224192A1 (en) | Method for the prognosis of the progression of cancer | |
| US20120052079A1 (en) | Compositions, Kits, and Methods for Predicting Anti-Cancer Response to Anthracyclines | |
| US20120220594A1 (en) | Methods for treating cancer in patients having igf-1r inhibitor resistance | |
| Carneiro et al. | Molecular targets and biological modifiers in gastric cancer | |
| JP2014527397A (en) | Methods for predicting clinical response to chemotherapy in cancer patients | |
| WO2008128008A2 (en) | Biomarkers and methods for determining sensitivity to vascular endothelial growth factor receptor-2 modulators | |
| EP2281063B1 (en) | A method for predicting a clinical response of a patient suffering from or at risk of developing cancer towards a given mode of treatment | |
| EP2776043A1 (en) | Biomarkers of response to proteasome inhibitors | |
| WO2012166824A2 (en) | Methods and kits that identify tumors responsive to src inhibitors | |
| EP2508619A1 (en) | Method and kits for the prediction of response/nonresponse to the treatment with an anti-EGFR antibody in patients with colorectal cancer of all UICC stages | |
| EP2034027A1 (en) | Molecular markers to predict response to chemotherapy and EGFR family inhibiton by targeted strategies | |
| WO2023064782A2 (en) | Transcriptional reprogramming differentiates active from inactive esr1 fusions in endocrine therapy-refractory metastatic breast cancer | |
| McVeigh | Investigating the impact of genomic profiling on breast cancer risk prediction, treatment and outcome |
Legal Events
| Date | Code | Title | Description |
|---|---|---|---|
| 121 | Ep: the epo has been informed by wipo that ep was designated in this application |
Ref document number: 08755471 Country of ref document: EP Kind code of ref document: A2 |
|
| WWE | Wipo information: entry into national phase |
Ref document number: 2008755471 Country of ref document: EP |
|
| WWE | Wipo information: entry into national phase |
Ref document number: 12600504 Country of ref document: US |
|
| NENP | Non-entry into the national phase |
Ref country code: DE |