WO2006089233A2 - Methods and systems for diagnosis, prognosis and selection of treatment of leukemia - Google Patents
Methods and systems for diagnosis, prognosis and selection of treatment of leukemia Download PDFInfo
- Publication number
- WO2006089233A2 WO2006089233A2 PCT/US2006/005855 US2006005855W WO2006089233A2 WO 2006089233 A2 WO2006089233 A2 WO 2006089233A2 US 2006005855 W US2006005855 W US 2006005855W WO 2006089233 A2 WO2006089233 A2 WO 2006089233A2
- Authority
- WO
- WIPO (PCT)
- Prior art keywords
- genes
- gene
- expression
- leukemia
- aml
- Prior art date
Links
Classifications
-
- G—PHYSICS
- G01—MEASURING; TESTING
- G01N—INVESTIGATING OR ANALYSING MATERIALS BY DETERMINING THEIR CHEMICAL OR PHYSICAL PROPERTIES
- G01N33/00—Investigating or analysing materials by specific methods not covered by groups G01N1/00 - G01N31/00
- G01N33/48—Biological material, e.g. blood, urine; Haemocytometers
- G01N33/50—Chemical analysis of biological material, e.g. blood, urine; Testing involving biospecific ligand binding methods; Immunological testing
- G01N33/53—Immunoassay; Biospecific binding assay; Materials therefor
- G01N33/574—Immunoassay; Biospecific binding assay; Materials therefor for cancer
- G01N33/57407—Specifically defined cancers
- G01N33/57426—Specifically defined cancers leukemia
-
- C—CHEMISTRY; METALLURGY
- C12—BIOCHEMISTRY; BEER; SPIRITS; WINE; VINEGAR; MICROBIOLOGY; ENZYMOLOGY; MUTATION OR GENETIC ENGINEERING
- C12Q—MEASURING OR TESTING PROCESSES INVOLVING ENZYMES, NUCLEIC ACIDS OR MICROORGANISMS; COMPOSITIONS OR TEST PAPERS THEREFOR; PROCESSES OF PREPARING SUCH COMPOSITIONS; CONDITION-RESPONSIVE CONTROL IN MICROBIOLOGICAL OR ENZYMOLOGICAL PROCESSES
- C12Q1/00—Measuring or testing processes involving enzymes, nucleic acids or microorganisms; Compositions therefor; Processes of preparing such compositions
- C12Q1/68—Measuring or testing processes involving enzymes, nucleic acids or microorganisms; Compositions therefor; Processes of preparing such compositions involving nucleic acids
- C12Q1/6813—Hybridisation assays
- C12Q1/6834—Enzymatic or biochemical coupling of nucleic acids to a solid phase
- C12Q1/6837—Enzymatic or biochemical coupling of nucleic acids to a solid phase using probe arrays or probe chips
-
- C—CHEMISTRY; METALLURGY
- C12—BIOCHEMISTRY; BEER; SPIRITS; WINE; VINEGAR; MICROBIOLOGY; ENZYMOLOGY; MUTATION OR GENETIC ENGINEERING
- C12Q—MEASURING OR TESTING PROCESSES INVOLVING ENZYMES, NUCLEIC ACIDS OR MICROORGANISMS; COMPOSITIONS OR TEST PAPERS THEREFOR; PROCESSES OF PREPARING SUCH COMPOSITIONS; CONDITION-RESPONSIVE CONTROL IN MICROBIOLOGICAL OR ENZYMOLOGICAL PROCESSES
- C12Q1/00—Measuring or testing processes involving enzymes, nucleic acids or microorganisms; Compositions therefor; Processes of preparing such compositions
- C12Q1/68—Measuring or testing processes involving enzymes, nucleic acids or microorganisms; Compositions therefor; Processes of preparing such compositions involving nucleic acids
- C12Q1/6876—Nucleic acid products used in the analysis of nucleic acids, e.g. primers or probes
- C12Q1/6883—Nucleic acid products used in the analysis of nucleic acids, e.g. primers or probes for diseases caused by alterations of genetic material
- C12Q1/6886—Nucleic acid products used in the analysis of nucleic acids, e.g. primers or probes for diseases caused by alterations of genetic material for cancer
-
- G—PHYSICS
- G01—MEASURING; TESTING
- G01N—INVESTIGATING OR ANALYSING MATERIALS BY DETERMINING THEIR CHEMICAL OR PHYSICAL PROPERTIES
- G01N2800/00—Detection or diagnosis of diseases
- G01N2800/52—Predicting or monitoring the response to treatment, e.g. for selection of therapy based on assay results in personalised medicine; Prognosis
Definitions
- the present invention relates to leukemia diagnostic and prognostic genes and methods of using the same for the diagnosis, prognosis; and selection of treatment of AML or other types of leukemia.
- Acute myeloid leukemia is a heterogeneous clonal disorder typified by hyperproliferation of immature leukemic blast cells in the bone marrow. Approximately 90% of all AML cases exhibit proliferation of CD33 + blast cells, and CD33 is a cell surface antigen that appears to be specifically expressed in myeloblasts and myeloid progenitors but is absent from normal hematopoetic stem cells.
- Gemtuzumab ozogamicin (Mylotarg ® or GO) is an anti-CD33 antibody conjugated to calicheamicin specifically designed to target CD33 + blast cells of AML patients for destruction.
- MDR multi-drug resistance
- gemtuzumab ozogamicin exhibits a favorable safety profile in the majority of patients receiving Mylotarg® therapy (Sievers, et ah, J CLIN. ONCOL., 19(13):3244-3254 (2001)), a small but significant number of cases of hepatic veno-occlusive disease have been reported following exposure to this therapy (Neumeister, et ah, ANN. HEMATOL., 80:119-120 (2001)).
- the present invention provides a method for predicting a clinical outcome of a leukemia patient as well as a method for selecting a treatment for a leukemia patient based on pharmacogenomic analysis.
- the present invention provides a method for predicting a clinical outcome in response to a treatment of a leukemia.
- the method includes the following steps: (1) measuring expression levels of one or more prognostic genes of the leukemia in a peripheral blood mononuclear cell sample derived from a patient prior to the treatment; and (2) comparing each of the expression levels to a corresponding control level, wherein the result of the comparison is predictive of a clinical outcome.
- prognostic genes include, but are not limited to, any genes that are differentially expressed in peripheral blood mononuclear cells (PBMCs) or other tissues of leukemia patients with different clinical outcomes.
- prognostic genes include genes whose expression levels in PBMCs or other tissues of leukemia patients are correlated with clinical outcomes of the patients. Exemplary prognostic genes are shown in Table 1, Table 2, Table 3, Table 4, Table 5 and Table 6.
- a "clinical outcome” referred to in the application includes, but is not limited to, any response to any leukemia treatment.
- the present invention is suitable for prognosis of any leukemias, including acute leukemia, chronic leukemia, lymphocytic leukemia or nonlymphocytic leukemia.
- the present invention is suitable for prognosis of acute myeloid leukemia (AML).
- AML acute myeloid leukemia
- the clinical outcome is measured by a response to an anti-cancer therapy.
- the anti-cancer therapy includes administering one or more compounds selected from the group consisting of an anti-CD33 antibody, a daunorubicin, a cytarabine, a gemtuzumab ozogamicin, an anthracycline, and a pyrimidine or purine nucleotide analog.
- the present invention may be used to predict a response to a gemtuzumab ozogamicin (GO) combination therapy.
- GO gemtuzumab ozogamicin
- the one or more prognostic genes suitable for the invention include at least a first gene selected from a first class and a second gene selected from a second class.
- the first class includes genes having higher expression levels in peripheral blood mononuclear cells in patients predicted to have a less desirable clinical outcome in response to the treatment.
- Exemplary first class genes are shown in Table 1 and Table 3.
- the second class includes genes having higher expression levels in peripheral blood mononuclear cells in patients predicted to have a more desirable clinical outcome in response to the treatment.
- Exempary second class genes are shown in Table 2 and 4.
- the first gene is selected from Table 3 and the second gene is selected from Table 4.
- the first gene is selected from the group consisting of zinc finger protein 217, peptide transporter 3, forkhead box O3A, T cell receptor alpha locus and putative chemokine receptor/GTP -binding protein
- the second gene is selected from the group consisting of metallothionein, fatty acid desaturase 1 , an uncharacterized gene corresponding to Affymetrix ID 216336, deformed epidermal autoregulatory factor 1 and growth arrest and DNA-damage-inducible alpha.
- the first gene is serum glucocorticoid regulated kinase and the second gene is metallothionein 1X/1L.
- each of the expression levels of the prognostic genes is compared to the corresponding control level which is a numerical threshold.
- the method of the present invention may be used to predict development of an adverse event in a leukemia patient in response to a treatment.
- the method may be used to assess the possibility of development of veno-occlusive disease (VOD).
- VOD veno-occlusive disease
- Exemplary prognostic genes predictive of VOD are shown in Table 5 and Table 6.
- the expression level of p-selectin ligand is measured to predict the risk for VOD.
- the present invention provides a method for predicting a clinical outcome of a leukemia by talcing the following steps: (1) generating a gene expression profile from a peripheral blood sample of a patient having the leukemia; and (2) comparing the gene expression profile to one or more reference expression profiles, wherein the gene expression profile and the one or more reference expression profiles contain expression patterns of one or more prognostic genes of the leukemia in peripheral blood mononuclear cells, and wherein the difference or similarity between the gene expression profile and the one or more reference expression profiles is indicative of the clinical outcome for the patient.
- the gene expression profile of the one or more prognostic genes may be compared to the one or more reference expression profiles by, for example, a k-nearest neighbor analysis or a weighted voting algorithm.
- the one or more reference expression profiles represent known or determinable clinical outcomes.
- the gene expression profile from the patient may be compared to at least two reference expression profiles, each of which represents a different clinical outcome.
- each reference expression profile may represent a different clinical outcome selected from the group consisting of remission to less than 5% blasts in response to the anti-cancer therapy; remission to no less than 5% blasts in response to the anti-cancer therapy ; and non-remission in response to the anti-cancer therapy.
- the one or more reference expression profiles may include a reference expression profile representing a leukemia-free human.
- the gene expression profile may be generated by using a nucleic acid array.
- the gene expression profile is generated from the peripheral blood sample of the patient prior to the anti-cancer therapy.
- the one or more prognostic genes include one or more genes selected from Table 3 or Table 4. In another embodiment, the one or more prognostic genes include ten or more genes selected from Table 3 or Table 4. In yet another embodiment, the one or more prognostic genes include twenty or more genes selected from Table 3 or Table 4.
- the present invention provides a method for selecting a treatment for a leukemia patient.
- the method includes the following steps: (1) generating a gene expression profile from a peripheral blood sample derived from the leukemia patient; (2) comparing the gene expression profile to a plurality of reference expression profiles, each representing a clinical outcome in response to one of a plurality of treatments; and (3) selecting from the plurality of treatments a treatment which has a favorable clinical outcome for the leukemia patient based on the comparison in step (2), wherein the gene expression profile and the one or more reference expression profiles comprise expression patterns of one or more prognostic genes of the leukemia in peripheral blood mononuclear cells.
- the gene expression profile may be compared to the plurality of reference expression profiles by, for example, a k-nearest neighbor analysis or a weighted voting algorithm.
- the one or more prognostic genes include one or more genes selected from Table 3 or Table 4.
- the one or more prognostic genes include ten or more genes selected from Table 3 or Table 4.
- the one or more prognostic genes include twenty or more genes selected from Table 3 or Table 4.
- the present invention provides a method for diagnosis, or monitoring the occurrence, development, progression or treatment, of a leukemia.
- the method includes the following steps: (1) generating a gene expression profile from a peripheral blood sample of a patient having the leukemia; and (2) comparing the gene expression profile to one or more reference expression profiles, wherein the gene expression profile and the one or more reference expression profiles contain the expression patterns of one or more diagnostic genes of the leukemia in peripheral blood mononuclear cells, and wherein the difference or similarity between the gene expression profile and the one or more reference expression profiles is indicative of the presence, absence, occurrence, development, progression, or effectiveness of treatment of the leukemia in the patient.
- the leukemia is AML.
- Diagnostic genes include, but are not limited to, any genes that are differentially expressed in peripheral blood mononuclear cells (PBMCs) or other tissues of leukemia patients with different disease status, hi particular, diagnostic genes include genes that are differentially expressed in PBMCs or other tissues of leukemia patients relative to PBMCs of leukemia-fee patients. Exemplary diagnostic genes are shown in Table 7, Table 8 and Table 9. Diagonistic genes are also referred to as disease genes in this application.
- PBMCs peripheral blood mononuclear cells
- the one or more reference expression profiles include a reference expression profile representing a disease-free human.
- the one or more diagnostic genes include one or more genes selected from Table 7.
- the one or more diagnostic genes comprise one or more genes selected from Table 8 or Table 9.
- the one or more diagnostic genes include ten or more genes selected from Table 7.
- the one or more diagnostic genes include ten or more genes selected from Table 8 or Table 9.
- the present invention provides an array for use in a method for predicting a clinical outcome for an AML patient.
- the array of the invention includes a substrate having a plurality of addresses, each of which has a distinct probe disposed thereon.
- the plurality of addresses have disposed thereon probes that can specifically detect prognostic genes of AML in peripheral blood mononuclear cells. In some embodiments, at least 30% of the plurality of addresses have disposed thereon probes that can specifically detect prognostic genes of AML in peripheral blood mononuclear cells. In some embodiments, at least 50% of the plurality of addresses have disposed thereon probes that can specifically detect prognostic genes of AML in peripheral blood mononuclear cells. In some embodiments, the prognostic genes are selected from Table I 3 Table 2, Table 3, Table 4, Table 5 or Table 6.
- the probe suitable for the present invention may be a nucleic acid probe. Alternatively, the probe suitable for the invention may be an antibody probe.
- the present invention provides an array for use in a method for diagnosis of AML including a substrate having a plurality of addresses, each of which has a distinct probe disposed thereon.
- at least 15% of the plurality of addresses have disposed thereon probes that can specifically detect diagnostic genes of AML in peripheral blood mononuclear cells.
- at least 30% of the plurality of addresses have disposed thereon probes that can specifically detect diagnostic genes of AML in peripheral blood mononuclear cells.
- at least 50% of the plurality of addresses have disposed thereon probes that can specifically detect diagnostic genes of AML in peripheral blood mononuclear cells.
- the diagnostic genes are selected from Table 7, Table 8 or Table 9.
- the probe suitable for the present invention may be a nucleic acid probe. Alternatively, the probe suitable for the present invention may be an antibody probe.
- the present invention provides a computer- readable medium containing a digitally-encoded expression profile having a plurality of digitally-encoded expression signals, each of which includes a value representing the expression of a prognostic gene of AML in a peripheral blood mononuclear cell.
- each of the plurality of digitally-encoded expression signals has a value representing a prognostic gene selected from Table 1, Table 2, Table 3, Table 4, Table 5 or Table 6.
- each of the plurality of digitally-encoded expression signals has a value representing the expression of the prognostic gene of AML in a peripheral blood mononuclear cell of a patient with a known or determinable clinical outcome.
- the computer-readable medium of the present invention contains a digitally-encoded expression profile including at least ten digitally-encoded expression signals.
- the present invention provides a computer-readable medium containing a digitally-encoded expression profile having a plurality of digitally-encoded expression signals, each of which has a value representing the expression of a diagnostic gene of AML in a peripheral blood mononuclear cell.
- each of the plurality of digitally-encoded expression signals has a value representing a diagnostic gene selected from Table 7, Table 8 or Table 9.
- each of the plurality of digitally-encoded expression signals has a value representing the expression of the diagnostic gene of AML in a peripheral blood mononuclear cell of an AML-free human.
- the computer-readable medium of the present invention contains a digitally-encoded expression profile including at least ten digitally-encoded expression signals.
- the present invention provides a kit for prognosis of a leukemia, e.g., AML.
- the kit includes a) one or more probes that can specifically detect prognostic genes of AML in peripheral blood mononuclear cells; and b) one or more controls, each representing a reference expression level of a prognostic gene detectable by the one or more probes.
- the kit of the present invention includes one or more probes that can specifically detect prognostic genes selected from Table 1, Table 2, Table 3, Table 4, Table 5 or Table 6.
- the present invention provides a kit for diagnosis of a leukemia, e.g., AML.
- the kit includes a) one or more probes that can specifically detect diagnostic genes of AML in peripheral blood mononuclear cells; and b) one or more controls, each representing a reference expression level of a prognostic gene detectable by the one or more probes.
- the kit of the present invention includes one or more probes that can specifically detect diagnostic genes selected from Table 7, Table 8 or Table 9.
- Figure IA demonstrates relative PBMC expression levels of 98 class correlated genes selected from Tables 1 and 2.
- 49 genes had elevated expression levels in PBMCs of patients who responded to Mylotarg combination therapy (R) relative to patients who did not respond to the therapy (NR), and the other 49 genes had elevated expression levels in PBMCs of the non- responding patients (NR) compared to the responding patients (R).
- Figure IB shows cross validation results for each sample using a 154- gene class predictor consisting of the genes in Tables 1 and 2, where a leave-one out cross validation was performed and the prediction strengths were calculated for each sample. Samples are ordered in the same order as in Figure IA.
- Figure 2 illustrates an unsupervised hierarchical clustering of PBMC gene expression profiles from normal patients, patients with AML, or patients with MDS using the 7879 transcripts detected in one or more profiles with a maximal frequency greater than or equal to 10 ppm.
- Data were log transformed and gene expression values were median centered, and profiles were clustered using an average linkage clustering approach with an uncentered correlation similarity metric.
- the two main clusters of normal and non-normal are denoted as clusters 1 and 2.
- the subgroup in cluster 2 possessing a preponderance of AML is indicated as
- MDS-like while the subgroup in cluster 2 possessing a preponderance of MDS is indicated as “MDS-like.”
- Figure 3 illustrates a gene ontology based annotation of transcripts altered during GO combination therapy of AML patients.
- the 52 transcripts exhibiting 3 -fold or greater repression over treatment were annotated into each of the twelve categories listed. Transcripts in the immune response category were most significantly overrepresented in the group of transcripts elevated over therapy, while uncategorized transcripts were most significantly overrepresented in the group of transcripts repressed during therapy.
- Figure 4 illustrates levels of p-selectin ligand transcript in the pretreatment PBMCs of 4 AML patients who eventually experienced veno-occlusive disease (VOD) (left panel) and in pretreatment PBMCs of 32 patients who did not experience VOD (right panel). Frequency (in ppm) based on microarray analysis is plotted on the y-axis and the level of p-selectin ligand in each individual sample in each group is plotted as a discrete symbol.
- VOD veno-occlusive disease
- Figure 5 illustrates levels of MDRl transcript in pretreatment PBMCs of 8 AML patients who failed to respond (NR) and in pretreatment PBMCs of 28 patients who responded (R). Frequency (in ppm) based on microarray analysis is plotted on the y-axis and the level of MDRl transcript in each individual of the 36 pretreatment PBMC samples is indicated by each column. The p-value is based on an unpaired Student's t-test assuming unequal variances.
- Figure 6 illustrates the transcript levels of various ABC cassette transporters in PBMC samples of AML patients prior to therapy.
- Figure 7 illustrates levels of CD33 cell surface antigen transcript in pretreatment PBMCs of 8 patients who failed to respond (NR) and in pretreatment PBMCs of 28 patients who responded (R). Frequency (in ppm) based on microarray analysis is plotted on the y-axis and the level of CD33 transcript in each individual of the 36 pretreatment PBMC samples is indicated by each column. The p-value is based on an unpaired Student's t-test assuming unequal variances.
- Figure 8 illustrates the accuracy of a 10-gene classifier for distinguishing pretreatment PBMCs from eventual responders and eventual nonresponders to therapy.
- Panel A depicts overall accuracy in a 36 member training set for models containing increasing numbers of features (transcript sequences) built using a binary classification approach with a S2N similarity metric that used median values for the class estimate. The smallest classifier (10-gene) yielding the highest overall accuracy is indicated (arrow).
- Panel B depicts ten-fold cross validation accuracy of the 10-gene classifier.
- a weighted voting algorithm was used to assign class membership using the 10-gene classifier. Confidence scores for each prediction call are indicated by columns where a downward deflection indicates a call of "NR" and an upward deflection indicates a call of "R.” True non-responders are indicated by light columns and true responders are indicated by dark columns. In this cross-validation 4/8 non-responders were correctly identified and 24/28 responders were correctly identified. [0040] Figure 9 illustrates the use of the 10-gene classifier to evaluate baseline PBMCs from AML patients from an independent clinical trial. The weighted voting algorithm was used to assign class membership using the 10-gene classifier.
- Panel A represents a two- dimensional plot of Affymetrix-based expression levels (in ppm) of serum/glucocorticoid regulated kinase (Y-axes) and metallothionein IX, IL (X- axes) in PMBC samples from AML patients. Levels of each transcript in each patient are plotted where non-responders are indicated by squares and responders are indicated by circles. The shadow indicates the area of the X-Y plot encompassing the largest number of non-responders and the smallest number of responders, defining the boundaries for this pairwise classifier.
- the present invention provides methods, reagents and systems useful for prognosis or selection of treatment of AML or other types of leukemia. These methods, reagents and systems employ leukemia prognostic genes which are differentially expressed in peripheral blood samples of leukemia patients who have different clinical outcomes.
- the present invention also provides methods, reagents and systems for diagnosis, or monitoring the occurrence, development, progression or treatment, of AML or other types of leukemia. These methods, reagents and systems employ diagnostic genes which are differentially expressed in peripheral blood samples of leukemia patients with different disease status.
- the present invention represents a significant advance in clinical pharmacogenomics and leukemia treatment.
- leukemia that are amenable to the present invention include, but are not limited to, acute leukemia, chronic leukemia, lymphocytic leukemia, or nonlymphocytic leukemia ⁇ e.g., myelogenous, monocytic, or erythroid).
- Acute leukemia includes, for example, AML or ALL (acute lymphoblastic leukemia).
- Chronic leukemia includes, for example, CML (chronic myelogenous leukemia), CLL (chronic lymphocytic leukemia), or hairy cell leukemia.
- MDS myelodysplastic syndromes
- Any leukemia treatment regime can be analyzed according to the present invention.
- leukemia treatments include, but are not limited to, chemotherapy, drug therapy, gene therapy, immunotherapy, biological therapy, radiation therapy, bone marrow transplantation, surgery, or a combination thereof.
- Other conventional, non-conventional, novel or experimental therapies, including treatments under clinical trials, can also be evaluated according to the present invention.
- a variety of anti-cancer agents can be used to treat leukemia.
- alkylators examples include, but are not limited to, busulfan
- anthracyclines include, but are not limited to, doxorubicin (Adriamycin, Doxil, Rubex), mitoxantrone (Novantrone), idarubicin (Idamycin), valrubicin (Valstar), and epirubicin (Ellence).
- antibiotics include, but are not limited to, dactinomycin, actinomycin D (Cosmegen), bleomycin (Blenoxane), and daunorubicin, daunomycin (Cerabidine, DanuoXome).
- biphosphonate inhibitors include, but are not limited to, zoledronate (Zometa).
- folate antagonists include, but are not limited to, methotrexate and tremetrexate.
- inorganic arsenates include, but are not limited to, arsenic trioxide (Trisenox).
- microtubule inhibitors which may inhibit either microtubule assembly or disassembly, include, but are not limited to, vincristine (Oncovin), vinblastine (Velban), paclitaxel (Taxol, Paxene), vinorelbine (Navelbine), docetaxel (Taxotere), epothilone B or D or a derivative of either, and discodermolide or its derivatives.
- nitrosoureas include, but are not limited to, procarbazine (Matulane), lomustine, CCNU (CeeBU), carmustine (BCNU, BiCNU, Gliadel Wafer), and estramustine (Emcyt).
- nucleoside analogs include, but are not limited to, mercaptopurine, 6-MP (Purinethol), fluorouracil, 5-FU (Adrucil), thioguanine, 6-TG (Thioguanine), hydroxyurea (Hydrea), cytarabine (Cytosar-U, DepoCyt), floxuridine (FUDR), fludarabine (Fludara), pentostatin (Nipent), cladribine (Leustatin, 2-CdA), gemcitabine (Gemzar), and capecitabine (Xeloda).
- retinoids include, but are not limited to, tretinoin, ATRA (Vesanoid), alitretinoin (Panretin), and bexarotene (Targretin).
- topoisomerase inhibitors include, but are not limited to, etoposide, VP-16 (Vepesid), teniposide, VM-26 (Vumon), etoposide phosphate (Etopophos), topotecan (Hycamtin), and irinotecan (Camptostar). Therapies including the use of any of these anti-cancer agents can be evaluated according to the present invention.
- Leukemia can also be treated by antibodies that specifically recognize diseased or otherwise unwanted cells.
- Antibodies suitable for this purpose include, but are not limited to, polyclonal, monoclonal, mono-specific, poly-specific, humanized, human, single-chain, chimeric, synthetic, recombinant, hybrid, mutated, grafted, or in vitro generated antibodies. Suitable antibodies can also be Fab, F(ab') 2 , Fv, scFv, Fd, dAb, or other antibody fragments that retain the antigen- binding function.
- an antibody employed in the present invention can bind to a specific antigen on the diseased or unwanted cells (e.g., the CD33 antigen on myeloblasts or myeloid progenitor cells) with a binding affinity of at least 10 "6 M “ ⁇ 10 "7 M '1 , 10 "8 M “1 , 10 “9 M “1 , or stronger.
- cytotoxic or otherwise anticellular agent which can kill or suppress the growth or division of cells.
- cytotoxic or anticellular agents include, but are not limited to, the anti-neoplastic agents described above, and other chemotherapeutic agents, radioisotopes or cytotoxins.
- Two or more different cytotoxic moieties can be coupled to one antibody, thereby accommodating variable or even enhanced anti-cancer activities.
- Linking or coupling one or more cytotoxic moieties to an antibody may be achieved by a variety of mechanisms, for example, covalent binding, affinity binding, intercalation, coordinate binding and complexation.
- Preferred binding methods are those involving covalent binding, such as using chemical cross-linkers, natural peptides or disulfide bonds.
- Covalent binding can be achieved, for example, by direct condensation of existing side chains or by the incorporation of external bridging molecules.
- Many bivalent or polyvalent agents are useful in coupling protein molecules to other proteins, peptides or amine functions. Examples of coupling agents are, without limitation, carbodiimides, diisocyanates, glutaraldehyde, diazobenzenes, and hexamethylene diamines.
- an antibody employed in the present invention is first derivatized before being attaching with a cytotoxic moiety.
- “Derivatize” means chemical modification(s) of the antibody substrate with a suitable cross-linking agent.
- cross-linking agents for use in this manner include the disulfide- bond containing linkers SPDP (N-succinimidyl-3-(2-pyridyldithio)propionate) and SMPT (4-succinimidyl-oxycarbonyl- ⁇ -methyl- ⁇ (2-pyridyldithio)toluene).
- Anti-neoplastic agent(s) employed in a leukemia treatment regime can be administered via any common route so long as the target tissue or cell is available via that route. This includes, but is not limited to, intravenous, catheterization, orthotopic, intradermal, subcutaneous, intramuscular, intraperitoneal intrtumoral, oral, nasal, buccal, rectal, vaginal, or topical administration.
- a leukemia treatment regime can include a combination of different types of therapies, such as chemotherapy plus antibody therapy.
- the present invention contemplates identification of prognostic genes for all types of leukemia treatment regime.
- the present invention features identification of genes that are prognostic of clinical outcome of AML patients who undergo an anti-cancer treatment.
- An AML treatment can include a remission induction therapy, a postremission therapy, or a combination thereof.
- the purpose of the remission induction therapy is to attain remission by killing the leukemia cells in the blood or bone marrow.
- the purpose of the postremission therapy is to maintain remission by killing any remaining leukemia cells that may not be active but could begin to regrow and cause a relapse.
- Standard remission induction therapies for AML patients include, but are not limited to, combination chemotherapy, stem cell transplantation, high-dose combination chemotherapy, all-trans retinoic acid (ATRA) plus chemotherapy, or intrathecal chemotherapy.
- Standard postremission therapies include, but are not limited to, combination chemotherapy, high-dose chemotherapy and stem cell transplantation using donor stem cells, or high-dose chemotherapy and stem cell transplantation using the patient's stem cells with or without radiation therapy.
- standard treatments include, but are not limited to, combination chemotherapy, biologic therapy with monoclonal antibodies, stem cell transplantation, low dose radiation therapy as palliative therapy to relieve symptoms and improve quality of life, or arsenic trioxide therapy.
- Nonstandard therapies, including treatments under clinical trials, are also contemplated by the present invention.
- the treatment regime includes administration of at least one chemotherapy drug and an anti-CD33 antibody conjugated with a cytotoxic agent.
- the chemotherapy drug can be selected, without limitation, from the group consisting of an anthracycline and a pyrimidine or purine nucleoside analog.
- the cytotoxic agent can be, for example, a calicheamicin or an esperamicin.
- Anthracyclines suitable for treating AML or MDS include, but are not limited to, doxorubicin, daunorubicin, idarubicin, aclarubicin, zorubicin, mitoxantrone, epirubicin, carubicin, nogalamycin, menogaril, pitarubicin, and valrubicin.
- Pyrimidine or purine nucleoside analogs useful for treating AML or MDS include, but are not limited to, cytarabine, gemcitabine, trifluridine, ancitabine, enocitabine, azacitidine, doxifluridine, pentostatin, broxuridine, capecitabine, cladribine, decitabine, floxuridine, fludarabine, gougerotin, puromycin, tegafur, tiazofurin, or tubercidin.
- Other anthracyclines and pyrimidine/purine nucleoside analogs can also be used in the present invention.
- the AML/MDS treatment regime includes administration of gemtuzumab ozogamicin (GO), daunorubicin and cytarabine to a patient in need of the treatment.
- Gemtuzumab ozogamicin can be administered, without limitation, in an amount of about 3 mg/m 2 to about 9 mg/m 2 per day, such as about 3, 4, 5, 6, 7, 8 or 9 mg/m per day.
- Daunorubicin can be administered, for example, in an amount of about 45 mg/m to about 60 mg/m per day, such as about 45, 50, 55 or 60 mg/m 2 per day.
- Cytarabine can be administered, without limitation, in an amount of about 100 mg/m 2 to about 200 mg/m 2 per day, such as about 100, 125, 150, 175 or 200 mg/m 2 per day.
- the daunorubicin employed in the treatment regime is daunorubicin hydrochloride.
- Clinical outcome of leukemia patients can be assessed by a number of criteria. Examples of clinical outcome measures include, but are not limited to, complete remission, partial remission, non-remission, survival, development of adverse events, or any combination thereof. Patients with complete remission show less than 5% blast cells in the bone marrow after the treatment.
- the peripheral blood samples used for the identification of the prognostic genes are “baseline” or “pretreatment” samples. These samples are isolated from respective leukemia patients prior to a therapeutic treatment and can be used to identify genes whose baseline peripheral blood expression profiles are correlated with clinical outcome of these leukemia patients in response to the treatment. Peripheral blood samples isolated at other treatment or disease stages can also be used to identify leukemia prognostic genes. [0062] A variety of types of peripheral blood samples can be used in the present invention. In one embodiment, the peripheral blood samples are whole blood samples. In another embodiment, the peripheral blood samples comprise enriched PBMCs. By “enriched,” it means that the percentage of PBMCs in the sample is higher than that in whole blood.
- the PBMC percentage in an enriched sample is at least 1, 2, 3, 4, 5 or more times higher than that in whole blood. In some other cases, the PBMC percentage in an enriched sample is at least 90%, 95%, 98%, 99%, 99.5%, or more.
- Blood samples containing enriched PBMCs can be prepared using any method known in the art, such as Ficoll gradients centrifugation or CPTs (cell purification tubes).
- peripheral blood gene expression profiles and patient outcome can be evaluated by using global gene expression analyses.
- Methods suitable for this purpose include, but are not limited to, nucleic acid arrays (such as cDNA or oligonucleotide arrays), 2-dimensional SDS-polyacrylamide gel electrophoresis/mass spectrometry, and other high throughput nucleotide or polypeptide detection techniques.
- Nucleic acid arrays allow for quantitative detection of the expression levels of a large number of genes at one time.
- nucleic acid arrays examples include, but are not limited to, Genechip ® microarrays from Affymetrix (Santa Clara, CA), cDNA microarrays from Agilent Technologies (Palo Alto, CA), and bead arrays described in U.S. Patent Nos. 6,288,220 and 6,391,562.
- the polynucleotides to be hybridized to a nucleic acid array can be labeled with one or more labeling moieties to allow for detection of hybridized polynucleotide complexes.
- the labeling moieties can include compositions that are detectable by spectroscopic, photochemical, biochemical, bioelectronic, immunochemical, electrical, optical or chemical means.
- labeling moieties include radioisotopes, chemiluminescent compounds, labeled binding proteins, heavy metal atoms, spectroscopic markers such as fluorescent markers and dyes, magnetic labels, linked enzymes, mass spectrometry tags, spin labels, electron transfer donors and acceptors, and the like.
- Unlabeled polynucleotides can also be employed.
- the polynucleotides can be DNA, RNA, or a modified form thereof.
- Hybridization reactions can be performed in absolute or differential hybridization formats. In the absolute hybridization format, polynucleotides derived from one sample, such as PBMCs from a patient in a selected outcome class, are hybridized to the probes on a nucleic acid array.
- polynucleotides derived from two biological samples such as one from a patient in a first outcome class and the other from a patient in a second outcome class, are labeled with different labeling moieties.
- a mixture of these differently labeled polynucleotides is added to a nucleic acid array.
- the nucleic acid array is then examined under conditions in which the emissions from the two different labels are individually detectable.
- the fluorophores Cy3 and Cy5 are used as the labeling moieties for the differential hybridization format.
- nucleic acid array expression signals are scaled or normalized before being subject to further analysis. For instance, the expression signals for each gene can be normalized to take into account variations in hybridization intensities when more than one array is used under similar test conditions. Signals for individual polynucleotide complex hybridization can also be normalized using the intensities derived from internal normalization controls contained on each array.
- genes with relatively consistent expression levels across the samples can be used to normalize the expression levels of other genes.
- the expression levels of the genes are normalized across the samples such that the mean is zero and the standard deviation is one.
- the expression data detected by nucleic acid arrays are subject to a variation filter which excludes genes showing minimal or insignificant variation across all samples.
- Correlation analysis [0068] The gene expression data collected from nucleic acid arrays can be con-elated with clinical outcome using a variety of methods. Methods suitable for this purpose include, but are not limited to, statistical methods (such as Spearman's rank correlation, Cox proportional hazard regression model, ANOVA/t test, or other rank tests or survival models) and class-based correlation metrics (such as nearest- neighbor analysis).
- patients with a specified leukemia are divided into at least two classes based on their responses to a therapeutic treatment.
- the correlation between peripheral blood gene expression ⁇ e.g., PBMC gene expression) and the patient outcome classes is then analyzed by a supervised cluster or learning algorithm.
- Supervised algorithms suitable for this purpose include, but are not limited to, nearest-neighbor analysis, support vector machines, the SAM method, artificial neural networks, and SPLASH.
- clinical outcome of each patient is either known or determinable.
- Genes that are differentially expressed in peripheral blood cells (e.g., PBMCs) of one class of patients relative to another class of patients can be identified. These genes can be used as surrogate markers for predicting clinical outcome of a leukemia patient of interest. Many of the genes thus identified are correlated with a class distinction that represents an idealized expression pattern of these genes in patients of different outcome classes.
- patients with a specified leukemia e.g., a specified leukemia
- AML can be divided into at least two classes based on their peripheral blood gene expression profiles.
- Methods suitable for this purpose include unsupervised clustering algorithms, such as self-organized maps (SOMs), k-means, principal component analysis, and hierarchical clustering.
- SOMs self-organized maps
- k-means principal component analysis
- hierarchical clustering A substantial number (e.g., at least 50%, 60%, 70%, 80%, 90%, or more) of patients in one class may have a first clinical outcome, and a substantial number of patients in another class may have a second clinical outcome.
- Genes that are differentially expressed in the peripheral blood cells of one class of patients relative to another class of patients can be identified. These genes can also be used as prognostic markers for predicting clinical outcome of a leukemia patient of interest.
- patients with a specified leukemia e.g. ,
- AML can be divided into three or more classes based on their clinical outcomes or peripheral blood gene expression profiles.
- Multi-class correlation metrics can be employed to identify genes that are differentially expressed in one class of patients relative to another class.
- Exemplary multi-class correlation metrics include, but are not limited to, those employed by GeneCluster 2 software provided by MIT Center for Genome Research at Whitehead Institute (Cambridge, MA).
- nearest-neighbor analysis also known as neighborhood analysis
- the algorithm for neighborhood analysis is described in Golub, et al, SCIENCE, 286: 531-537 (1999); Slonim, et al., PROCS.
- g (e 1 ⁇ e 2 , e 3 , . . ., e n ), where e; corresponds to the expression level of gene "g" in the ith sample.
- class distinction represents an idealized expression pattern, where the expression level of a gene is uniformly high for samples in one class and uniformly low for samples in the other class.
- the samples used to derive the signal-to-noise scores comprise enriched or purified PBMCs and, therefore, the signal-to-noise score P(g,c) represents a correlation between the class distinction and the expression level of gene "g" in PBMCs.
- the correlation between gene "g” and the class distinction can also be measured by other methods, such as by the Pearson correlation coefficient or the Euclidean distance, as appreciated by those skilled in the art.
- the significance of the correlation between peripheral blood gene expression profiles and the class distinction can be evaluated using a random permutation test. An unusually high density of genes within the neighborhoods of the class distinction, as compared to random patterns, suggests that many genes have expression patterns that are significantly correlated with the class distinction.
- the correlation between genes and the class distinction can be diagrammatically viewed through a neighborhood analysis plot, in which the y-axis represents the number of genes within various neighborhoods around the class distinction and the x-axis indicates the size of the neighborhood (i.e., P(g,c)).
- Curves showing different significance levels for the number of genes within corresponding neighborhoods of randomly permuted class distinctions can also be included in the plot.
- the prognostic genes employed in the present invention are above the median significance level in the neighborhood analysis plot. This means that the correlation measure P(g,c) for each prognostic gene is such that the number of genes within the neighborhood of the class distinction having the size of P(g,c) is greater than the number of genes within the corresponding neighborhoods of randomly permuted class distinctions at the median significance level.
- the prognostic genes employed in the present invention are above the 40%, 30%, 20%, 10%, 5%, 2%, or 1% significance level.
- x% significance level means that x% of random neighborhoods contain as many genes as the real neighborhood around the class distinction.
- Class predictors can be constructed using the prognostic genes of the present invention. These class predictors can be used to assign a leukemia patient of interest to an outcome class.
- the prognostic genes employed in a class predictor are limited to those shown to be significantly correlated with a class distinction by the permutation test, such as those at above the 1%, 2%, 5%, 10%, 20%, 30%, 40%, or 50% significance level.
- the PBMC expression level of each prognostic gene in a class predictor is substantially higher or substantially lower in one class of patients than in another class of patients.
- the prognostic genes in a class predictor have top absolute values of P(g,c).
- the p-value under a Student's /-test e.g., two-tailed distribution, two sample unequal variance
- the p-value suggests the statistical significance of the difference observed between the average PBMC expression profiles of the gene in one class of patients versus another class of patients. Lesser p-values indicate more statistical significance for the differences observed between different classes of leukemia patients.
- the SAM method can also be used to correlate peripheral blood gene expression profiles with different outcome classes.
- the prediction analysis of microarrays (PAM) method can then be used to identify class predictors that can best characterize a predefined outcome class and predict the class membership of new samples. See Tibshirani, et ah, PROC. NATL. ACAD. SCI. U.S.A., 99:6567-6572 (2002).
- a class predictor of the present invention has high prediction accuracy under leave-one-out cross validation, 10-fold cross validation, or 4-fold cross validation.
- a class predictor of the present invention can have at least 50%, 60%, 70%, 80%, 90%, 95%, or 99% accuracy under leave-one-out cross validation, 10-fold cross validation, or 4-fold cross validation.
- k-fold cross validation the data is divided into k subsets of approximately equal size. The model is trained k times, each time leaving out one of the subsets from training and using the omitted subset as the test samples to calculate the prediction error. If k equals the sample size, it becomes the leave-one- out cross validation.
- Other class-based correlation metrics or statistical methods can also be used to identify prognostic genes whose expression profiles in peripheral blood samples are correlated with clinical outcome of leukemia patients.
- each prognostic gene thus identified has at least 2-, 3-, A-, 5-, 10-, or 20-fold difference in the average PBMC expression level between one class of patients and another class of patients.
- the present invention characterized signatures in peripheral blood of AML patients that are indicative of remission in response to a chemotherapy regimen consisting of daunorubicin and cytarabine induction therapy with concomitant administration of GO.
- the present invention employed a pharmacogenomic approach to identify transcriptional patterns in peripheral blood samples taken from AML patients prior to treatment that were correlated with positive response to the therapy regimen.
- Table 1 lists genes which had higher pretreatment PBMC expression levels in AML patients who eventually failed to respond to the GO combination chemotherapy (non-remission or partial remission), compared to AML patients who responded to the therapy (remission to less than 5% blasts). Genes showing greatest fold elevation in non-responding patients at baseline PBMCs are listed in Table 3. Table 2 describes transcripts that had higher pretreatment expression levels in PBMCs of AML patients who eventually respond to the GO combination chemotherapy, compared to AML patients who did not respond to the therapy. Genes showing greatest fold elevation in responding patients at baseline PBMCs are listed in Table 4.
- NRTR Full Change
- R/NR represents the ratio of the mean expression level of a gene in PBMCs of responding AML patients over that in non-responding AML patients.
- R/NR represents the ratio of the mean expression level of a gene in PBMCs of responding AML patients over that in non-responding AML patients.
- the transcripts are presented in order of the signal to noise metric score calculated by the supervised algorithm described in Examples.
- Each gene depicted in Tables 1-4 and the corresponding unigene(s) were identified according to Affymetrix annotations.
- Classifiers consisting of genes selected from Tables 1 and 2 were built and evaluated for class prediction accuracy. Each classifier included the top n gene(s) in Table 1 and the top n gene(s) in Table 2, where n represents an integer no less than 1. For example, a first classifier being evaluated included Gene Nos. 1 and 78, a second classifier included Gene Nos. 1-2 and 78-79, a third classifier included Gene Nos. 1-3 and 78-80, a fourth classifier included Gene Nos. 1-4 and 78-81, and so on. Each classifier thus constructed produced significant prediction accuracy. For instance, a classifier consisting of all of the 154 genes in Tables 1 and 2 yielded 81% overall prediction accuracy by 4-fold cross validation on the peripheral blood profiles used in the present study.
- Veno-occlusive disease is one of the most serious complications following hematopoietic stem cell transplantation and is associated with a very high mortality in its severe form.
- Comparison of pretreatment PBMC profiles from the leukemia patients who experienced VOD with the PBMC profiles from the patients who did not experience VOD identifies significant transcripts that appear to be correlated with this serious adverse event prior to therapy.
- average fold differences between VOD and non-VOD patient profiles were calculated by dividing the mean level of expression in the baseline VOD profiles by the mean level of expression in the baseline non-VOD profiles.
- leukemia diagnostic genes also referred to as disease genes.
- Each of these genes is differentially expressed in PBMCs of leukemia patients relative to PBMCs of leukemia-free or disease-free humans.
- the average PBMC expression level of a leukemia disease gene in leukemia patients is statistically different from that in leukemia-free or disease-free humans.
- the p- value of a Student's t-test for the observed difference can be no more than 0.05, 0.01, 0.005, 0.001, 0.0005, 0.0001, or less.
- the difference between the average PBMC expression levels of a leukemia disease gene in leukemia patients and that in leukemia-free humans is at least 2, 3, 4, 5, 10, 20, or more folds.
- the leukemia disease genes of the present invention can be used to detect the presence or absence, or monitor the development, progression or treatment of leukemia in a human of interest.
- Leukemia disease genes can also be identified by correlating PBMC expression profiles with a class distinction under a class-based correlation metric (e.g., the nearest-neighbor analysis or the significance method of microarrays (SAM) method).
- SAM microarrays
- the correlation between the PBMC expression profile of a leukemia disease gene and the class distinction is above the 1%, 5%, 10%, 25%, or 50% significance level under a permutation test.
- Gene classifiers can be constructed using the leukemia disease genes of the present invention. These classifiers can effectively predict class membership (e.g., leukemia versus leukemia-free) of a human of interest. Identification of AML Diagnosis Genes Using HG-Ul 33A Microarrays
- AML-associated expression patterns in peripheral blood were identified by using the U133A gene chip platform.
- Transcripts showing elevated or decreased levels in PBMCs of AML patients relative to healthy controls were identified. Examples of these transcripts are depicted in Table 7.
- Each transcript in Table 7 has at least 2-fold difference in the mean level of expression between AML PBMCs and disease-free PBMCs ("AML/Disease-Free").
- the p-value of the Student's t-test (unequal variances) for the observed difference (“P- Value") is also shown in Table 7.
- COV refers to coefficient of variance.
- Each HG-U133A qualifier represents an oligonucleotide probe set on the
- RNA transcri ⁇ t(s) of a gene that corresponds to a HG-U133A qualifier can hybridize under nucleic acid array hybridization conditions to at least one oligonucleotide probe (PM or perfect match probe) of the qualifier.
- the RNA transcript(s) of the gene does not hybridize under nucleic acid array hybridization conditions to a mismatch probe (MM) of the PM probe.
- a mismatch probe is identical to the corresponding PM probe except for a single, homomeric substitution at or near the center of the mismatch probe.
- the MM probe has a homomeric base change at the 13th position.
- U 133 A qualifier can hybridize under nucleic acid array hybridization conditions to at least 50%, 60%, 70%, 80%, 90% or 100% of all of the PM probes of the qualifier, but not to the mismatch probes of these PM probes.
- the discrimination score (R) for each of these PM probes is no less than 0.015, 0.02, 0.05, 0.1, 0.2, 0.3, 0.4, 0.5 or greater.
- the RNA transcript(s) of the gene when hybridized to the HG-Ul 33 A gene chip according to the manufacturer's instructions, produces a "present" call under the default settings, i.e., the threshold Tau is 0.015 and the significance level Ot 1 is 0.4.
- the threshold Tau is 0.015
- the significance level Ot 1 is 0.4.
- Each gene described in Tables 7, 8 and 9 and the corresponding unigene(s) are identified based on HG-Ul 33 A genechip annotations.
- a unigene is composed of a non- redundant set of gene-oriented clusters. Each unigene cluster is believed to include sequences that represent a unique gene. Information for each gene listed in Table 7, 8 and 9 and its corresponding unigene(s) can also be obtained from the Entrez Gene and Unigene databases at National Center for Biotechnology Information (NCBI), Bethesda, MD.
- NCBI National Center for Biotechnology Information
- U133A qualifier can be identified by BLAST searching the target sequence of the qualifier against a human genome sequence database.
- Human genome sequence databases suitable for this purpose include, but are not limited to, the NCBI human genome database.
- NCBI also provides BLAST programs, such as "blastn," for searching its sequence databases.
- the BLAST search of the NCBI human genome database is performed by using an unambiguous segment (e.g., the longest unambiguous segment) of the target sequence of the qualifier.
- Gene(s) that aligns to the unambiguous segment with significant sequence identity can be identified. In many cases, the identified gene(s) has at least 95%, 96%, 97%, 98%, 99%, or more sequence identity to the unambiguous segment.
- genes listed in all the Tables encompasse not only the genes that are explicitly depicted, but also genes that are not listed in the table but nonetheless corresponds to a qualifier in the table. All of these genes can be used as biological markers for the diagnosis or monitoring the development, progression or treatment of AML.
- the prognostic genes of the present invention can be used for the prediction of clinical outcome of a leukemia patient of interest.
- the prediction typically involves comparison of the peripheral blood expression profile of one or more prognostic genes in the leukemia patient of interest to at least one reference expression profile.
- Each prognostic gene employed in the present invention is differentially expressed in peripheral blood samples of leukemia patients who have different clinical outcomes.
- the prognostic genes employed for the outcome prediction are selected such that the peripheral blood expression profile of each prognostic gene is correlated with a class distinction under a class-based correlation analysis (such as the nearest-neighbor analysis), where the class distinction represents an idealized expression pattern of the selected genes in peripheral blood samples of leukemia patients who have different clinical outcomes.
- the selected prognostic genes are correlated with the class distinction at above the 50%, 25%, 10%, 5%, or 1% significance level under a random permutation test.
- the prognostic genes can also be selected such that the average expression profile of each prognostic gene in peripheral blood samples of one class of leukemia patients is statistically different from that in another class of leukemia patients. For instance, the p-value under a Student's t-test for the observed difference can be no more than 0.05, 0.01, 0.005, 0.001, or less. In addition, the prognostic genes can be selected such that the average peripheral blood expression level of each prognostic gene in one class of patients is at least 2-, 3-, 4-, 5-, 10-, or 20-fold different from that in another class of patients. [0103]
- the expression profile of a patient of interest can be compared to one or more reference expression profiles. The reference expression profiles can be determined concurrently with the expression profile of the patient of interest. The reference expression profiles can also be predetermined or prerecorded in electronic or other types of storage media.
- the reference expression profiles can include average expression profiles, or individual profiles representing peripheral blood gene expression patterns in particular patients.
- the reference expression profiles include an average expression profile of the prognostic gene(s) in peripheral blood samples of reference leukemia patients who have known or determinable clinical outcome. Any averaging method may be used, such as arithmetic means, harmonic means, average of absolute values, average of log-transformed values, or weighted average.
- the reference leukemia patients have the same clinical outcome.
- the reference leukemia patients can be divided into at least two classes, each class of patients having a different respective clinical outcome.
- the average peripheral blood expression profile in each class of patients constitutes a separate reference expression profile, and the expression profile of the patient of interest is compared to each of these reference expression profiles.
- the reference expression profiles includes a plurality of expression profiles, each of which represents the peripheral blood expression pattern of the prognostic gene(s) in a particular leukemia patient whose clinical outcome is known or determinable. Other types of reference expression profiles can also be used in the present invention.
- the present invention uses a numerical threshold as a control level.
- the expression profile of the patient of interest and the reference expression profile(s) can be constructed in any form.
- the expression profiles comprise the expression level of each prognostic gene used in outcome prediction.
- the expression levels can be absolute, normalized, or relative levels. Suitable normalization procedures include, but are not limited to, those used in nucleic acid array gene expression analyses or those described in Hill, et al, GENOME BlOL, 2:research0055.1-0055.13 (2001).
- the expression levels are normalized such that the mean is zero and the standard deviation is one.
- the expression levels are normalized based on internal or external controls, as appreciated by those skilled in the art.
- the expression levels are normalized against one or more control transcripts with known abundances in blood samples.
- the expression profile of the patient of interest and the reference expression profile(s) are constructed using the same or comparable methodologies.
- each expression profile being compared comprises one or more ratios between the expression levels of different prognostic genes.
- An expression profile can also include other measures that are capable of representing gene expression patterns.
- the peripheral blood samples used in the present invention can be either whole blood samples, or samples comprising enriched PBMCs.
- the peripheral blood samples used for preparing the reference expression profile(s) comprise enriched or purified PBMCs
- the peripheral blood sample used for preparing the expression profile of the patient of interest is a whole blood sample.
- peripheral blood samples employed in outcome prediction comprise enriched or purified PBMCs.
- the peripheral blood samples are prepared from the patient of interest and reference patients using the same or comparable procedures.
- Other types of blood samples can also be employed in the present invention, and the gene expression profiles in these blood samples are statistically significantly correlated with patient outcome.
- the peripheral blood samples used in the present invention can be isolated from respective patients at any disease or treatment stage, and the correlation between the gene expression patterns in these peripheral blood samples and clinical outcome is statistically significant.
- clinical outcome is measured by patients' response to a therapeutic treatment, and all of the blood samples used in outcome prediction are isolated prior to the therapeutic treatment.
- the expression profiles derived from these blood samples are therefore baseline expression profiles for the therapeutic treatment.
- Construction of the expression profiles typically involves detection of the expression level of each prognostic gene used in the outcome prediction. Numerous methods are available for this purpose. For instance, the expression level of a gene can be determined by measuring the level of the RNA transcript(s) of the gene.
- Suitable methods include, but are not limited to, quantitative RT-PCT, Northern Blot, in situ hybridization, slot-blotting, nuclease protection assay, and nucleic acid array (including bead array).
- the expression level of a gene can also be determined by measuring the level of the polypeptide(s) encoded by the gene. Suitable methods include, but are not limited to, immunoassays (such as ELISA, RIA, FACS, or Western blot), 2-dimensional gel electrophoresis, mass spectrometry, or protein arrays.
- the expression level of a prognostic gene is determined by measuring the RNA transcript level of the gene in a peripheral blood sample.
- RNA can be isolated from the peripheral blood sample using a variety of methods. Exemplary methods include guanidine isothiocyanate/acidic phenol method, the TRIZOL® Reagent (Invitrogen), or the Micro-FastTrackTM 2.0 or FastTrackTM 2.0 mRNA Isolation Kits (Invitrogen).
- the isolated RNA can be either total RNA or mRNA.
- the isolated RNA can be amplified to cDNA or cRNA before subsequent detection or quantitation. The amplification can be either specific or non-specific. Suitable amplification methods include, but are not limited to, reverse transcriptase PCR (RT-PCR), isothermal amplification, ligase chain reaction, and Qbeta replicase.
- RT-PCR reverse transcriptase PCR
- ligase chain reaction ligase chain reaction
- Qbeta replicase Qbeta replicase.
- the amplification protocol employs reverse transcriptase.
- the isolated mRNA can be reverse transcribed into cDNA using a reverse transcriptase, and a primer consisting of oligo (dT) and a sequence encoding the phage T7 promoter.
- the cDNA thus produced is single-stranded.
- the second strand of the cDNA is synthesized using a DNA polymerase, combined with an RNase to break up the DNA/RNA hybrid.
- T7 RNA polymerase is added, and cRNA is then transcribed from the second strand of the doubled-stranded cDNA.
- the amplified cDNA or cRNA can be detected or quantitated by hybridization to labeled probes.
- the cDNA or cRNA can also be labeled during the amplification process and then detected or quantitated.
- RT-PCR (such as TaqMan, ABI) is used for detecting or comparing the RNA transcript level of a prognostic gene of interest.
- Quantitative RT-PCR involves reverse transcription (RT) of RNA to cDNA followed by relative quantitative PCR (RT-PCR).
- PCR In PCR, the number of molecules of the amplified target DNA increases by a factor approaching two with every cycle of the reaction until some reagent becomes limiting. Thereafter, the rate of amplification becomes increasingly diminished until there is not an increase in the amplified target between cycles.
- a graph is plotted on which the cycle number is on the X axis and the log of the concentration of the amplified target DNA is on the Y axis, a curved line of characteristic shape can be formed by connecting the plotted points. Beginning with the first cycle, the slope of the line is positive and constant. This is said to be the linear portion of the curve. After some reagent becomes limiting, the slope of the line begins to decrease and eventually becomes zero.
- the concentration of the target DNA in the linear portion of the PCR is proportional to the starting concentration of the target before the PCR is begun.
- concentration of the PCR products of the target DNA in PCR reactions that have completed the same number of cycles and are in their linear ranges, it is possible to determine the relative concentrations of the specific target sequence in the original DNA mixture. If the DNA mixtures are cDNAs synthesized from RNAs isolated from different tissues or cells, the relative abundances of the specific mRNA from which the target sequence was derived may be determined for the respective tissues or cells. This direct proportionality between the concentration of the PCR products and the relative mRNA abundances is true in the linear range portion of the PCR reaction.
- the final concentration of the target DNA in the plateau portion of the curve is determined by the availability of reagents in the reaction mix and is independent of the original concentration of target DNA. Therefore, in one embodiment, the sampling and quantifying of the amplified PCR products are carried out when the PCR reactions are in the linear portion of their curves. In addition, relative concentrations of the amplifiable cDNAs can be normalized to some independent standard, which may be based on either internally existing RNA species or externally introduced RNA species. The abundance of a particular mRNA species may also be determined relative to the average abundance of all mRNA species in the sample. [0118] In one embodiment, the PCR amplification utilizes internal PCR standards that are approximately as abundant as the target.
- This strategy is effective if the products of the PCR amplifications are sampled during their linear phases. If the products are sampled when the reactions are approaching the plateau phase, then the less abundant product may become relatively over-represented. Comparisons of relative abundances made for many different RNA samples, such as is the case when examining RNA samples for differential expression, may become distorted in such a way as to make differences in relative abundances of RNAs appear less than they actually are. This can be improved if the internal standard is much more abundant than the target. If the internal standard is more abundant than the target, then direct linear comparisons may be made between RNA samples.
- RT-PCR is performed as a relative quantitative RT-PCR with an internal standard in which the internal standard is an amplifiable cDNA fragment that is larger than the target cDNA fragment and in which the abundance of the mRNA encoding the internal standard is roughly 5-100 fold higher than the mRNA encoding the target.
- This assay measures relative abundance, not absolute abundance of the respective mRNA species.
- the relative quantitative RT-PCR uses an external standard protocol. Under this protocol, the PCR products are sampled in the linear portion of their amplification curves. The number of PCR cycles that are optimal for sampling can be empirically determined for each target cDNA fragment.
- the reverse transcriptase products of each RNA population isolated from the various samples can be normalized for equal concentrations of amplifiable cDNAs. While empirical determination of the linear range of the amplification curve and normalization of cDNA preparations are tedious and time-consuming processes, the resulting RT-PCR assays may, in certain cases, be superior to those derived from a relative quantitative RT-PCR with an internal standard.
- nucleic acid arrays are used for detecting or comparing the expression profiles of a prognostic gene of interest.
- the nucleic acid arrays can be commercial oligonucleotide or cDNA arrays. They can also be custom arrays comprising concentrated probes for the prognostic genes of the present invention. In many examples, at least 15%, 20%, 25%, 30%, 35%, 40%, 45%, 50%, or more of the total probes on a custom array of the present invention are probes for leukemia prognostic genes. These probes can hybridize under stringent or nucleic acid array hybridization conditions to the RNA transcripts, or the complements thereof, of the corresponding prognostic genes.
- stringent conditions are at least as stringent as, for example, conditions G-L shown in Table 10.
- “Highly stringent conditions” are at least as stringent as conditions A-F shown in Table 10.
- Hybridization is carried out under the hybridization conditions (Hybridization Temperature and Buffer) for about four hours, followed by two 20-minute washes under the corresponding wash conditions (Wash Temp, and Buffer). Table 10.
- the hybrid length is that anticipated for the hybridized region(s) of the hybridizing polynucleotides.
- the hybrid length is assumed to be that of the hybridizing polynucleotide.
- the hybrid length can be determined by aligning the sequences of the polynucleotides and identifying the region or regions of optimal sequence complementarity.
- SSPE (Ix SSPE is 0.15M NaCl, 10 mM NaH 2 PO 4 , and 1.25 mM EDTA, pH 7.4) can be substituted for SSC (Ix SSC is 0.15M NaCl and 15 mM sodium citrate) in the hybridization and wash buffers.
- T m melting temperature
- a nucleic acid array of the present invention includes at least
- the probes for a prognostic gene of the present invention can be a nucleic acid probe, such as, DNA, RNA, PNA, or a modified form thereof.
- the nucleotide residues in each probe can be either naturally occurring residues (such as deoxyadenylate, deoxycytidylate, deoxyguanylate, deoxythymidylate, adenylate, cytidylate, guanylate, and uridylate), or synthetically produced analogs that are capable of forming desired base-pair relationships.
- these analogs include, but are not limited to, aza and deaza pyrimidine analogs, aza and deaza purine analogs, and other heterocyclic base analogs, wherein one or more of the carbon and nitrogen atoms of the purine and pyrimidine rings are substituted by heteroatoms, such as oxygen, sulfur, selenium, and phosphorus.
- the polynucleotide backbones of the probes can be either naturally occurring (such as through 5' to 3' linkage), or modified.
- the nucleotide units can be connected via non-typical linkage, such as 5' to 2' linkage, so long as the linkage does not interfere with hybridization.
- peptide nucleic acids in which the constitute bases are joined by peptide bonds rather than phosphodiester linkages, can be used.
- the probes for the prognostic genes can be stably attached to discrete regions on a nucleic acid array.
- stably attached it means that a probe maintains its position relative to the attached discrete region during hybridization and signal detection.
- the position of each discrete region on the nucleic acid array can be either known or determinable. AU of the methods known in the art can be used to make the nucleic acid arrays of the present invention.
- nuclease protection assays are used to quantitate RNA transcript levels in peripheral blood samples. There are many different versions of nuclease protection assays.
- nuclease protection assays involve hybridization of an antisense nucleic acid with the RNA to be quantified. The resulting hybrid double-stranded molecule is then digested with a nuclease that digests single-stranded nucleic acids more efficiently than double-stranded molecules. The amount of antisense nucleic acid that survives digestion is a measure of the amount of the target RNA species to be quantified.
- suitable nuclease protection assays include the RNase protection assay provided by Ambion, Inc. (Austin, Texas).
- Hybridization probes or amplification primers for the prognostic genes of the present invention can be prepared by using any method known in the art.
- the probes/primers for these genes can be derived from the target sequences of the corresponding qualifiers, or the corresponding EST or mRNA sequences.
- the probes/primers for a prognostic gene significantly diverge from the sequences of other prognostic genes. This can be achieved by checking potential probe/primer sequences against a human genome sequence database, such as the Entrez database at the NCBI.
- a human genome sequence database such as the Entrez database at the NCBI.
- One algorithm suitable for this purpose is the BLAST algorithm. This algorithm involves first identifying high scoring sequence pairs (HSPs) by identifying short words of length W in the query sequence, which either match or satisfy some positive-valued threshold score T when aligned with a word of the same length in a database sequence. T is referred to as the neighborhood word score threshold.
- the initial neighborhood word hits act as seeds for initiating searches to find longer HSPs containing them.
- the word hits are then extended in both directions along each sequence to increase the cumulative alignment score. Cumulative scores are calculated using, for nucleotide sequences, the parameters M (reward score for a pair of matching residues; always >0) and N (penalty score for mismatching residues; always ⁇ 0).
- the BLAST algorithm parameters W, T, and X determine the sensitivity and speed of the alignment. These parameters can be adjusted for different purposes, as appreciated by those skilled in the art.
- the probes for prognostic genes can be polypeptide in nature, such as, antibody probes. The expression levels of the prognostic genes of the present invention are thus determined by measuring the levels of polypeptides encoded by the prognostic genes.
- Methods suitable for this purpose include, but are not limited to, immunoassays such as ELISA, RIA, FACS, dot blot, Western Blot, immunohistochemistry, and antibody-based radioimaging.
- immunoassays such as ELISA, RIA, FACS, dot blot, Western Blot, immunohistochemistry, and antibody-based radioimaging.
- high-throughput protein sequencing 2- dimensional SDS-polyacrylamide gel electrophoresis, mass spectrometry, or protein arrays can be used.
- ELISAs are used for detecting the levels of the target proteins.
- antibodies capable of binding to the target proteins are immobilized onto selected surfaces exhibiting protein affinity, such as wells in a polystyrene or polyvinylchloride microtiter plate. Samples to be tested are then added to the wells. After binding and washing to remove non-specifically bound immunocomplexes, the bound antigen(s) can be detected. Detection can be achieved by the addition of a second antibody which is specific for the target proteins and is linked to a detectable label.
- Detection can also be achieved by the addition of a second antibody, followed by the addition of a third antibody that has binding affinity for the second antibody, with the third antibody being linked to a detectable label.
- a second antibody followed by the addition of a third antibody that has binding affinity for the second antibody, with the third antibody being linked to a detectable label.
- the samples suspected of containing the target proteins are immobilized onto the well surface and then contacted with the antibodies. After binding and washing to remove non-specifically bound immunocomplexes, the bound antigen is detected. Where the initial antibodies are linked to a detectable label, the immunocomplexes can be detected directly. The immunocomplexes can also be detected using a second antibody that has binding affinity for the first antibody, with the second antibody being linked to a detectable label.
- Another exemplary ELISA involves the use of antibody competition in the detection.
- the target proteins are immobilized on the well surface.
- the labeled antibodies are added to the well, allowed to bind to the target proteins, and detected by means of their labels.
- the amount of the target proteins in an unknown sample is then determined by mixing the sample with the labeled antibodies before or during incubation with coated wells. The presence of the target proteins in the unknown sample acts to reduce the amount of antibody available for binding to the well and thus reduces the ultimate signal.
- Different ELISA formats can have certain features in common, such as coating, incubating or binding, washing to remove non-specifically bound species, and detecting the bound immunocomplexes. For instance, in coating a plate with either antigen or antibody, the wells of the plate can be incubated with a solution of the antigen or antibody, either overnight or for a specified period of hours. The wells of the plate are then washed to remove incompletely adsorbed material. Any remaining available surfaces of the wells are then "coated” with a nonspecific protein that is antigenically neutral with regard to the test samples. Examples of these nonspecific proteins include bovine serum albumin (BSA), casein and solutions of milk powder.
- BSA bovine serum albumin
- the coating allows for blocking of nonspecific adsorption sites on the immobilizing surface and thus reduces the background caused by nonspecific binding of antisera onto the surface.
- a secondary or tertiary detection means can be used. After binding of a protein or antibody to the well, coating with a non-reactive material to reduce background, and washing to remove unbound material, the immobilizing surface is contacted with the control or clinical or biological sample to be tested under conditions effective to allow immunocomplex (antigen/antibody) formation.
- These conditions may include, for example, diluting the antigens and antibodies with solutions such as BSA, bovine gamma globulin (BGG) and phosphate buffered saline (PBS)/Tween and incubating the antibodies and antigens at room temperature for about 1 to 4 hours or at 4° C overnight.
- Detection of the immunocomplex is facilitated by using a labeled secondary binding ligand or antibody, or a secondary binding ligand or antibody in conjunction with a labeled tertiary antibody or third binding ligand.
- the contacted surface can be washed so as to remove non-complexed material.
- the surface may be washed with a solution such as PBS/Tween, or borate buffer.
- a solution such as PBS/Tween, or borate buffer.
- the second or third antibody can have an associated label to allow detection.
- the label is an enzyme that generates color development upon incubating with an appropriate chromogenic substrate.
- a urease glucose oxidase
- alkaline phosphatase alkaline phosphatase
- hydrogen peroxidase-conjugated antibody for a period of time and under conditions that favor the development of further immunocomplex formation ⁇ e.g., incubation for 2 hours at room temperature in a PBS- containing solution such as PBS-Tween).
- the amount of label can be quantified, e.g., by incubation with a chromogenic substrate such as urea and bromocresol purple or 2,2'-azido-di-(3-ethyl)- benzthiazoline-6-sulfonic acid (ABTS) and H 2 O 2 , in the case of peroxidase as the enzyme label. Quantitation can be achieved by measuring the degree of color generation, e.g., using a spectrophotometer.
- a chromogenic substrate such as urea and bromocresol purple or 2,2'-azido-di-(3-ethyl)- benzthiazoline-6-sulfonic acid (ABTS) and H 2 O 2 , in the case of peroxidase as the enzyme label.
- Quantitation can be achieved by measuring the degree of color generation, e.g., using a spectrophotometer.
- Another method suitable for detecting polypeptide levels is RIA
- radioimmunoassay An exemplary RIA is based on the competition between radiolabeled- polypeptides and unlabeled polypeptides for binding to a limited quantity of antibodies.
- Suitable radiolabels include, but are not limited to, I 125 .
- a fixed concentration of I 125 -labeled polypeptide is incubated with a series of dilution of an antibody specific to the polypeptide.
- the unlabeled polypeptide is added to the system, the amount of the I 125 -polypeptide that binds to the antibody is decreased.
- a standard curve can therefore be constructed to represent the amount of antibody-bound I 125 - polypeptide as a function of the concentration of the unlabeled polypeptide.
- Suitable antibodies for the present invention include, but are not limited to, polyclonal antibodies, monoclonal antibodies, chimeric antibodies, humanized antibodies, single chain antibodies, Fab fragments, or fragments produced by a Fab expression library. Neutralizing antibodies (i.e., those which inhibit dimer formation) can also be used. Methods for preparing these antibodies are well known in the art.
- the antibodies of the present invention can bind to the corresponding prognostic gene products or other desired antigens with binding affinities of at least 10 4 M “1 , 10 5 M “1 , 10 6 M “1 , 10 7 M “1 , or more.
- the antibodies of the present invention can be labeled with one or more detectable moieties to allow for detection of antibody-antigen complexes.
- the detectable moieties can include compositions detectable by spectroscopic, enzymatic, photochemical, biochemical, bioelectronic, immunochemical, electrical, optical or chemical means.
- the detectable moieties include, but are not limited to, radioisotopes, chemiluminescent compounds, labeled binding proteins, heavy metal atoms, spectroscopic markers such as fluorescent markers and dyes, magnetic labels, linked enzymes, mass spectrometry tags, spin labels, electron transfer donors and acceptors, and the like.
- the antibodies of the present invention can be used as probes to construct protein arrays for the detection of expression profiles of the prognostic genes. Methods for making protein arrays or biochips are well known in the art. In many embodiments, a substantial portion of probes on a protein array of the present invention are antibodies specific for the prognostic gene products. For instance, at least 10%, 20%, 30%, 40%, 50%, or more probes on the protein array can be antibodies specific for the prognostic gene products. [0142] In yet another aspect, the expression levels of the prognostic genes are determined by measuring the biological functions or activities of these genes. Where a biological function or activity of a gene is known, suitable in vitro or in vivo assays can be developed to evaluate the function or activity. These assays can be subsequently used to assess the level of expression of the prognostic gene.
- each prognostic gene is determined, numerous approaches can be employed to compare expression profiles. Comparison of the expression profile of a patient of interest to the reference expression profile(s) can be conducted manually or electronically. In one example, comparison is carried out by comparing each component in one expression profile to the corresponding component in a reference expression profile.
- the component can be the expression level of a prognostic gene, a ratio between the expression levels of two prognostic genes, or another measure capable of representing gene expression patterns.
- the expression level of a gene can have an absolute or a normalized or relative value. The difference between two corresponding components can be assessed by fold changes, absolute differences, or other suitable means.
- Comparison of the expression profile of a patient of interest to the reference expression profile(s) can also be conducted using pattern recognition or comparison programs, such as the ⁇ -nearest-neighbors algorithm as described in Armstrong, et al., NATURE GENETICS, 30:41-47 (2002), or the weighted voting algorithm as described below.
- pattern recognition or comparison programs such as the ⁇ -nearest-neighbors algorithm as described in Armstrong, et al., NATURE GENETICS, 30:41-47 (2002), or the weighted voting algorithm as described below.
- SAGE serial analysis of gene expression
- GEMTOOLS gene expression analysis program Incyte Pharmaceuticals
- the GeneCalling and Quantitative Expression Analysis technology Curagen
- Multiple prognostic genes can be used in the comparison of expression profiles. For instance, 2, 4, 6, 8, 10, 12, 14, or more prognostic genes can be used.
- the prognostic gene(s) used in the comparison can be selected to have relatively small p-values ⁇ e.g., two-sided p-values).
- the p-values indicate the statistical significance of the difference between gene expression levels in different classes of patients.
- the p-values suggest the statistical significance of the correlation between gene expression patterns and clinical outcome.
- the prognostic genes used in the comparison have p-values of no greater than 0.05, 0.01, 0.001, 0.0005, 0.0001, or less. Prognostic genes with p-values of greater than 0.05 can also be used. These genes may be identified, for instance, by using a relatively small number of blood samples.
- Similarity or difference between the expression profile of a patient of interest and a reference expression profile is indicative of the class membership of the patient of interest. Similarity or difference can be determined by any suitable means. The comparison can be qualitative, quantitative, or both.
- a component in a reference profile is a mean value, and the corresponding component in the expression profile of the patient of interest falls within the standard deviation of the mean value.
- the expression profile of the patient of interest may be considered similar to the reference profile with respect to that particular component.
- Other criteria such as a multiple or fraction of the standard deviation or a certain degree of percentage increase or decrease, can be used to measure similarity.
- at least 50% (e.g., at least 60%, 70%, 80%, 90%, or more) of the components in the expression profile of the patient of interest are considered similar to the corresponding components in a reference profile. Under these circumstances, the expression profile of the patient of interest may be considered similar to the reference profile.
- the prognostic gene(s) and the similarity criteria can be selected such that the accuracy of outcome prediction (the ratio of correct calls over the total of correct and incorrect calls) is relatively high. For instance, the accuracy of prediction can be at least 50%, 60%, 70%, 80%, 90%, or more.
- the effectiveness of outcome prediction can also be assessed by sensitivity and specificity.
- the prognostic genes and the comparison criteria can be selected such that both the sensitivity and specificity of outcome prediction are relatively high.
- the sensitivity and specificity can be at least 50%, 60%, 70%, 80%, 90%, 95%, or more.
- sensitivity refers to the ratio of correct positive calls over the total of true positive calls plus false negative calls
- specificity refers to the ratio of correct negative calls over the total of true negative calls plus false positive calls.
- the expression profile of a patient of interest is compared to at least two reference expression profiles.
- Each reference expression profile can include an average expression profile, or a set of individual expression profiles each of which represents the peripheral blood gene expression pattern in a particular AML patient or disease-free human.
- Suitable methods for comparing one expression profile to two or more reference expression profiles include, but are not limited to, the weighted voting algorithm or the ⁇ -nearest-neighbors algorithm.
- Softwares capable of performing these algorithms include, but are not limited to, GeneCluster 2 software. GeneCluster 2 software is available from MIT Center for Genome Research at Whitehead Institute (e.g., www- genome.wi.mit.edu/cancer/software/genecluster2/gc2.html).
- the effectiveness of class assignment is evaluated by leave-one-out cross validation or k- fold cross validation.
- the prediction accuracy under these cross validation methods can be, for instance, at least 50%, 60%, 70%, 80%, 90%, 95%, or more.
- the prediction sensitivity or specificity under these cross validation methods can also be at least 50%, 60%, 70%, 80%, 90%, 95%, or more.
- Prognostic genes or class predictors with low assignment sensitivity/specificity or low cross validation accuracy, such as less than 50%, can also be used in the present invention.
- each gene in a class predictor casts a weighted vote for one of the two classes (class 0 and class 1).
- a positive v g indicates a vote for class 0, and a negative v g indicates a vote for class 1.
- VO denotes the sum of all positive votes
- Vl denotes the absolute value of the sum of all negative votes.
- a prediction strength near "0" suggests narrow margin of victory, and a prediction strength close to "1" or "-1" indicates wide margin of victory. See Slonim, et ah, PROCS .
- Suitable prediction strength (PS) thresholds can be assessed by plotting the cumulative cross-validation error rate against the prediction strength. In one embodiment, a positive predication is made if the absolute value of PS for the sample of interest is no less than 0.3. Other PS thresholds, such as no less than 0.1, 0.2, 0.4 or 0.5, can also be selected for class prediction. In many embodiments, a threshold is selected such that the accuracy of prediction is optimized and the incidence of both false positive and false negative results is minimized. [0156] Any class predictor constructed according to the present invention can be used for the class assignment of a leukemia patient of interest.
- a class predictor employed in the present invention includes n prognostic genes identified by the neighborhood analysis, where n is an integer greater than 1. A half of these prognostic genes has the largest P(g,c) scores, and the other half has the largest -P(g,c) scores. The number n therefore is the only free parameter in defining the class predictor.
- the expression profile of a patient of interest can also be compared to two or more reference expression profiles by other means.
- the reference expression profiles can include an average peripheral blood expression profile for each class of patients. The fact that the expression profile of a patient of interest is more similar to one reference profile than to another suggests that the patient of interest is more likely to have the clinical outcome associated with the former reference profile than that associated with the latter reference profile.
- the present invention features prediction of clinical outcome of an AML patient of interest.
- AML patients can be divided into at least two classes based on their responses to a specified treatment regime.
- One class of patients (responders) has complete remission in response to the treatment, and the other class of patients (non-responders) has non-remission or partial remission in response to the treatment.
- AML prognostic genes that are correlated with a class distinction between these two classes of patients can be identified and then used to assign the patient of interest to one of these two outcome classes. Examples of AML prognostic genes suitable for this purpose are depicted in Tables 1 and 2.
- the treatment regime includes administration of at least one chemotherapy agent (e.g., daunorubicin or cytarabine) and an anti-CD33 antibody conjugated with a cytotoxic agent (e.g., gemtuzumab ozogamicin), and the expression profile of an AML patient of interest is compared to two or more reference expression profiles by using a weighted voting or A;-nearest-neighbors algorithm. All of these expression profiles are baseline profiles representing peripheral blood gene expression patterns prior to the treatment regime.
- a classifier including at least one gene selected from Table 1 and at least one gene selected from Table 2 can be employed for the outcome prediction.
- a classifier can include at least 1, 2, 3, 4, 5, 10, 15, 20, 25, 30, 35, 40, 45, 50, 55, 60, 65, 70, 75 or more genes selected from Table 1, and at least 1, 2, 3, 4, 5, 10, 15, 20, 25, 30, 35, 40, 45, 50, 55, 60, 65, 70, 75 or more genes selected from Table 2.
- the total number of genes selected from Table 1 can be equal to, or different from, that selected from Table 2.
- Prognostic genes or class predictors capable of distinguishing three or more outcome classes can also be employed in the present invention. These prognostic genes can be identified using multi-class correlation metrics. Suitable programs for carrying out multi-class correlation analysis include, but are not limited to, GeneCluster 2 software (MIT Center for Genome Research at Whitehead Institute, Cambridge, MA). Under the analysis, patients having a specified type of leukemia are divided into at least three classes, and each class of patients has a different respective clinical outcome. The prognostic genes identified under multi-class correlation analysis are differentially expressed in PBMCs of one class of patients relative to PBMCs of other classes of patients.
- the identified prognostic genes are correlated with a class distinction at above the 1%, 5%, 10%, 25%, or 50% significance level under a permutation test.
- the class distinction represents an idealized expression pattern of the identified genes in peripheral blood samples of patients who have different clinical outcomes.
- Figures IA and IB illustrate the identification and cross validation of gene classifiers for distinction of PBMCs from patients who did or did not respond to Mylotarg combination therapy.
- Figures IA shows the relative expression levels of 98 class-correlated genes. As graphically presented, 49 genes were elevated in responding patient PBMCs relative to non-responding patient PBMCs and the other 49 genes were elevated in non-responding patient PBMCs relative to responding patient PBMCs.
- Figure IB demonstrates cross validation results for each sample using a class predictor consisting of the 154 genes depicted in Tables 1 and 2. A leave-one out cross validation was performed and the prediction strengths were calculated for each sample. Samples are ordered in the same order as the nearest neighbor analysis in Figure IA.
- the 154-gene classifier exhibited a sensitivity of 82%, correctly identifying 24 of the 28 true responders in the study.
- the gene classifier also exhibited a specificity of 75%, correctly identifying 6 of the 8 true non-responders in the study. Similar sensitivities, specificities and overall accuracies were observed with optimal gene classifiers identified by 10-fold and leave-one-out cross validation approaches.
- the above investigation evaluated expression patterns in peripheral blood samples of AML patients prior to therapy and identified transcriptional signatures correlated with initial response to therapy. The result of this study demonstrates that pharmacogenomic peripheral blood profiling strategies enable identification of patients with high likelihoods of positive or negative outcomes in response to GO combination therapy.
- Diagnosis or monitoring the development, progression or treatment of AML can be readily adapted for the diagnosis or monitoring the development, progression or treatment of AML. This can be achieved by comparing the expression profile of one or more AML disease genes in a subject of interest to at least one reference expression profile of the AML disease gene(s).
- the reference expression profile(s) can include an average expression profile, or a set of individual expression profiles each of which represents the peripheral blood gene expression of the AML disease gene(s) in a particular AML patient or disease- free human. Similarity between the expression profile of the subject of interest and the reference expression profile(s) is indicative of the presence or absence or the disease state of AML.
- the disease genes employed for AML diagnosis are selected from Table 7.
- One or more AML disease genes selected from Table 7 can be used for AML diagnosis or disease monitoring.
- each AML disease gene has a p-value of less than 0.01, 0.005, 0.001, 0.0005, 0.0001, or less.
- the AML disease genes comprise at least one gene having an "AML/Disease-Free" ratio of no less than 2 and at least one gene having an "AML/Disease-Free" ratio of no more than 0.5.
- the leukemia disease genes of the present invention can be used alone, or in combination with other clinical tests, for leukemia diagnosis or disease monitoring.
- the present invention also features electronic systems useful for the prognosis, diagnosis or selection of treatment of AML or other leukemias. These systems include an input or communication device for receiving the expression profile of a patient of interest or the reference expression profile(s).
- the reference expression profile(s) can be stored in a database or other media.
- the comparison between expression profiles can be conducted electronically, such as through a processor or a computer.
- the processor or computer can execute one or more programs which compare the expression profile of the patient of interest to the reference expression profile(s).
- the programs can be stored in a memory or downloaded from another source, such as an internet server.
- the programs include a ⁇ -nearest-neighbors or weighted voting algorithm.
- the electronic system is coupled to a nucleic acid array and can receive or process expression data generated by the nucleic acid array.
- kits for prognosis, diagnosis or selection of treatment of leukemia include or consists essentially of at least one probe for a leukemia prognosis or disease gene ⁇ e.g., a gene selected from Tables 1, 2, 3, 4, 5, 6, 7, 8 or 9). Reagents or buffers that facilitate the use of the kit can also be included. Any type of probe can be using in the present invention, such as hybridization probes, amplification primers, or antibodies.
- a kit of the present invention includes or consists essentially of at least 1, 2, 3, 4, 5, 6, 7, 8, 9, 10, or more polynucleotide probes or primers. Each probe/primer can hybridize under stringent conditions or nucleic acid array hybridization conditions to a different respective leukemia prognosis or disease gene.
- a polynucleotide can hybridize to a gene if the polynucleotide can hybridize to an RNA transcript, or the complement thereof, of the gene.
- a kit of the present invention includes one or more antibodies, each of which is capable of binding to a polypeptide encoded by a different respective leukemia prognosis or disease gene.
- a kit of the present invention includes or consists essentially of probes (e.g., hybridization or PCR amplification probes or antibodies) for at least 1, 2, 3, 4, 5, 10, 15, 20, 25, 30, 35, 40, 45, 50, 55, 60, 65, 70, 75 or more genes selected from Table 2a, and probes for at least 1, 2, 3, 4, 5, 10, 15, 20, 25, 30, 35, 40, 45, 50, 55, 60, 65, 70, 75 or more genes selected from Table 2b.
- the total number of probes for the genes selected from Table 2a can be identical to, or different from, that for the genes selected from Table 2b.
- the probes employed in the present invention can be either labeled or unlabeled.
- Labeled probes can be detectable by spectroscopic, photochemical, biochemical, bioelectronic, immunochemical, electrical, optical, chemical, or other suitable means.
- Exemplary labeling moieties for a probe include radioisotopes, chemiluminescent compounds, labeled binding proteins, heavy metal atoms, spectroscopic markers, such as fluorescent markers and dyes, magnetic labels, linked enzymes, mass spectrometry tags, spin labels, electron transfer donors and acceptors, and the like.
- kits of the present invention can also have containers containing buffer(s) or reporter means.
- the kits can include reagents for conducting positive or negative controls.
- the probes employed in the present invention are stably attached to one or more substrate supports. Nucleic acid hybridization or immunoassays can be directly carried out on the substrate support(s). Suitable substrate supports for this purpose include, but are not limited to, glasses, silica, ceramics, nylons, quartz wafers, gels, metals, papers, beads, tubes, fibers, films, membranes, column matrices, or microtiter plate wells.
- kits of the present invention may also contain one or more controls, each representing a reference expression level of a prognostic or diagnostic gene detectable by one or more probes contained in the kits.
- the present invention also allows for personalized treatment of AML or other leukemias. Numerous treatment options or regimes can be analyzed according to the present invention to identify prognostic genes for each treatment regime.
- the peripheral blood expression profiles of these prognostic genes in a patient of interest are indicative of the clinical outcome of the patient and, therefore, can be used for the selection of treatments that have favorable prognoses for the patient.
- a "favorable" prognosis is a prognosis that is better than the prognoses of the majority of all other available treatments for the patient of interest.
- Treatment selection can be conducted manually or electronically.
- Reference expression profiles or gene classifiers can be stored in a database.
- Programs capable of performing algorithms such as the ⁇ -nearest-neighbors or weighted voting algorithms can be used to compare the peripheral blood expression profile of a patient of interest to the database to determine which treatment should be used for the patient.
- AML patients 13 females and 23 males were exclusively of Caucasian descent and had a median age of 45 years (range of 19-66 years).
- Inclusion criteria for AML patients included blasts in excess of 20% in the bone marrow, morphologic diagnosis of AML according to the FAB classification system and flow cytometry analysis indicating positive CD33+ status. Participation in the clinical trial required concordant pathological diagnosis of AML by both an onsite pathologist following histological evaluation of bone marrow aspirates.
- Table 11 Cytogenetic characteristics of PG consented AML patients contributing baseline samples in 0903B1-206-US.
- RNA extraction was performed according to a modified RNeasy mini kit method (Qiagen, Valencia, CA, USA). Briefly, PBMC pellets were digested in RLT lysis buffer containing 0.1% beta-mercaptoethanol and processed for total RNA isolation using the RNeasy mini kit. A phenol: chloroform extraction was then performed, and the RNA was repurified using the Rneasy mini kit reagents. Eluted RNA was quantified using a Spectramax 96 well plate UV reader (Molecular Devices, Sunnyvale, CA, USA) monitoring A260/280 OD values. The quality of each RNA sample was assessed by gel electrophoresis.
- RNA Amplification and Generation ofGeneChip Hybridization Probe [0180] ⁇ Labeled targets for oligonucleotide arrays were prepared according to a standard laboratory method. In brief, two micrograms of total RNA were converted to cDNA using an oligo-(dT)24 primer containing a T7 DNA polymerase promoter at the 5' end. The cDNA was used as the template for in vitro transcription using a T7 DNA polymerase kit (Ambion, Woodlands, TX, USA) and biotinylated CTP and UTP (Enzo, Farmingdale, NY, USA).
- Labeled cRNA was fragmented in 40 mM Tris-acetate pH 8.0, 100 mM KOAc, 30 mM MgOAc for 35 min at 94 0 C in a final volume of 40 mL.
- Ten micrograms of labeled target were diluted in IX MES buffer with 100 mg/mL herring sperm DNA and 50 mg/mL acetylated BSA.
- IX MES buffer 100 mg/mL herring sperm DNA and 50 mg/mL acetylated BSA.
- In vitro synthesized transcripts of 11 bacterial genes were included in each hybridization reaction. The abundance of these transcripts ranged from 1 :300000 (3 ppm) to 1:1000 (1000 ppm) stated in terms of the number of control transcripts per total transcripts..
- HG_U133A oligonucleotide arrays comprised of over 22000 human genes (Affymetrix, Santa Clara, CA, USA) according to the Affymetrix GeneChip Analysis Suite User Guide (Affymetrix). Arrays were hybridized for 16h at 45° C with rotation at 60 rpm. After hybridization, the hybridization mixtures were removed and stored, and the arrays were washed and stained with streptavidin R-phycoerythrin
- Array images were processed using the Affymetrix MicroArray Suite (MAS5) software such that raw array image data (.dat) files produced by the array scanner were reduced to probe feature-level intensity summaries (.eel files) using the desktop version of MAS5.
- GEDS Gene Expression Data System
- EPIKS Expression Profiling Information and Knowledge System
- the database processes then invoked the MAS 5 software to create probeset summary values; probe intensities were summarized for each sequence using the Affymetrix Affy Signal algorithm and the Affymetrix Absolute Detection metric (Absent, Present, or Marginal) for each probeset.
- MAS5 was also used for the first pass normalization by scaling the trimmed mean to a value of 100.
- the "average difference" values for each transcript were normalized to "frequency" values using the scaled frequency normalization method (Hill, et al, Genome Biol., 2(12):research0055.1-0055.13 (2001)) in which the average differences for 11 control cRNAs with known abundance spiked into each hybridization solution were used to generate a global calibration curve.
- This calibration was then used to convert average difference values for all transcripts to frequency estimates, stated in units of parts per million ranging from 1 : 300,000 (3 parts per million (ppm)) to 1 :1000 (1000 ppm)
- the database processes also calculated a series of chip quality control metrics and stored all the raw data and quality control calculations in the database. Only hybridized samples passing QC criteria were included in the analysis.
- Example 2 Disease-associated transcripts in AML PBMCs
- U133A-derived transcriptional profiles of the 36 AML PBMC samples were co-normalized using the scaled frequency normalization method with 20 MDS PBMC and 45 healthy volunteer PBMC.
- a total of 7879 transcripts were detected in one or more profiles with a maximal frequency greater than or equal to 10 ppm (denoted as IP, 1 > 10 ppm) across the profiles.
- IP 10 ppm
- AML and normal PBMCs were calculated by dividing the mean level of expression in the AML profiles by the mean level of expression in normal profiles.
- a Student's t-test (two- sample, unequal variance) was used to assess the significance of the difference in expression between the groups.
- the 7879 transcripts meeting the expression filter IP 1 > 10 ppm were used.
- Data were log transformed and gene expression values were median centered, and profiles were clustered using an average linkage clustering approach with an uncentered correlation similarity metric.
- transcripts exhibiting at least a 2-fold average difference between normal and AML PBMCs at increasing levels of significance are presented in Table 12.
- a total of 660 transcripts possessed at least an average 2-fold difference between the AML profiles and normal PBMC profiles and a significance in an unpaired Student's t-test less than 0.001.
- These transcripts are presented in Table 7, above.
- 382 transcripts exhibited a mean elevated level of expression 2 fold or higher in AML and the fifty genes with the greatest fold elevation are presented in Table 8.
- a total of 278 transcripts exhibited a mean reduced level of expression 2-fold or lower in AML and the fifty genes with the greatest fold reduction in AML are presented in Table 9.
- transcripts are known to be specifically expressed and/or linked to disease-processes in immature or leukemic blasts (myeloperoxidase, v-myb myeloblastosis proto-oncogene, v-kit proto-oncogene, fms-related tyrosine kinase 3, CD34).
- many of the transcripts with the highest level of expression in AML PBMCs are at undetectable or extremely low levels in purified populations of monocytes, B-cells, T- cells, and neutrophils (data not shown) and were classified as low expressors in a healthy volunteer observational study.
- transcripts observed to present in higher quantitites in AML PBMCs do not appear to be mainly due to transcriptional activation but rather due to the presence of leukemic blasts in the circulation of AML patients.
- disease-associated transcripts at significantly lower levels in AML PBMCs appear to be transcripts exhibiting high levels of expression in one or more of the normal types of cells typically isolated by cell-purification tubes (monocytes, B-cells, T- cells, and copurifying neutrophils).
- monocytes, B-cells, T- cells, and copurifying neutrophils eight of the top ten transcripts at lower levels in AML PBMCs possess average levels of expression in their respective purified cell type of greater than 50 ppm, and were classified as high expressors in a healthy volunteer observational study.
- the majority of transcripts observed to be present in lower quantities in AML PBMCs do not appear to be mainly due to transcriptional repression but rather due to the decreased presence of normal mononuclear cells in the blast-rich circulation of
- a total of 27 AML patients provided evaluable baseline and Day 36 post- treatment PBMC samples.
- the U133A-derived transcriptional profiles of the 27 paired AML PBMC samples were co-normalized using the scaled frequency normalization method.
- a total of 8809 transcripts were detected in one or more profiles with a maximal frequency greater than or equal to 10 ppm (denoted as IP, 1 > 10 ppm) across the profiles.
- IP denoted as IP, 1 > 10 ppm
- the numbers of transcripts exhibiting at least a 2-fold average difference between baseline and post-treatment PBMCs with increasing levels of significance are presented in Table 13.
- 348 transcripts exhibited a mean reduced level of expression 2-fold or greater over the course of therapy and the fifty genes with the greatest fold reduction following GO therapy are presented in Table 14.
- transcripts up-regulated following the GO regimen were transcripts associated with normal mononuclear cell expression.
- TGF -beta induced protein (68kDa), thrombomodulin, putative lymphocyte G0/G1 switch gene, and the majority of other transcripts are likely due to the disappearance of leukemic blasts and repopulation of normal cells in the circulation, rather than direct transcriptional effects of the chemotherapy regimen.
- transcriptional activation or repression may be the cause for differences in transcript levels.
- cytochrome P4501 Al (CYPl Al) is induced following therapy but is not significantly associated with normal mononuclear cell expression (i.e., CYPlAl was not significantly repressed in AML PBMCs compared to normal PBMCs).
- CYPlAl is involved in the metabolism of daunorubicin, and daunorubicin is a mechanism-based inactivator of CYPlAl activity.
- the elevation of CYP IAl mPvNA may represent a feedback transcriptional response to the present therapeutic regimen.
- Interferon-inducible proteins were also elevated during the course of therapy (interferon-inducible protein 30, interferon-induced transmembrane protein 2), and these effects may also represent transcriptional inductions of interferon-dependent signaling pathways activated during the course of therapy.
- TGF-beta induces cell cycle arrest and antagonizes FLT3 -induced proliferation of leukemic cells, and a TGF-beta induced protein was the most strongly upregulated transcript (> 7 fold elevated) in PBMCs during the course of therapy.
- Example 4 Pretreatment expression patterns associated with veno-occlusive disease
- U133A-derived transcriptional profiles of the 36 AML PBMC samples were co-normalized using the scaled frequency normalization method. A total of 7405 transcripts were detected in one or more profiles with a maximal frequency greater than or equal to 10 ppm (denoted as IP, 1 > 10 ppm) across the profiles.
- VOD Veno-occlusive disease
- Example 5 Pretreatment transcriptional patterns associated with clinical response
- 7405 transcripts detected with a maximal frequency greater than or equal to 10 ppm in one or more profiles were selected for further evaluation.
- average fold differences between NR and R patient profiles were calculated by dividing the mean level of expression in the eight baseline NR profiles by the mean level of expression in the 28 baseline R profiles.
- a Student's t-test (two-sample, unequal variance) was used to assess the significance of the difference in expression between the groups.
- transcripts exhibiting at least a 2-fold average difference between R and NR baseline PBMCs with increasing levels of significance are presented in Table 17.
- a total of 113 transcripts possessed at least an average 2-fold difference between the baseline R and NR samples, and significance in a paired Student's t-test of less than 0.05.
- 6 transcripts exhibited a mean elevated level of expression 2-fold or higher in non-responder PBMCs at baseline.
- These and forty-four other transcripts showing less than 2-fold but exhibiting the greatest fold elevation in responding patients at baseline are presented in Table 3.
- a total of 107 transcripts exhibited a mean reduced level of expression 2-fold or greater in non-responder PBMCs at baseline, and the fifty genes with the greatest fold reduction are presented in Table 4.
- the ten gene classifier demonstrated an overall prediction accuracy of 78%, a sensitivity of 100%, a specificity of 57%, a positive predictive value of 70% and a negative predictive value of 100%.
- Table 18 Transcripts in the 10-gene classifier associated with elevated PBMC levels in responders (top panel) or non-responders (bottom panel) prior to therapy.
- the two gene classifier employing metallothionein IX/ IL and serum glucocorticoid regulated kinase was selected on the basis of their 1) significantly elevated or repressed fold differences between responder and non-responder categories, respectively; and 2) known annotation.
- the individual expression values (in terms of ppm) of each transcript in each baseline AML sample were plotted to identify cutoffs for expression that gave the highest sensitivity and specificity for class assignment. From the original 36 patients, six of the eight non- responders had serum glucocorticoid regulated kinase levels ⁇ 30 ppm and metallothionein lX/lL levels > 30 ppm. Only 2 of the 28 responders possessed similar levels of gene expression. For these 36 sample, the 2-gene classifier therefore exhibited an apparent 88% overall accuracy, a sensitivity of 93%, a specificity of 75%, a positive predictive value of 93% and a negative predictive value of 75%.
- This 2-gene classifier (serum glucocorticoid regulated kinase ⁇ 30 ppm, metallothionein IX 5 IL > 30 ppm) was also applied to the 14 untested profiles from the independent clinical trial in which GO plus daunorubicin composed the therapy regimen (Figure 10, panel B). In that study, the 2-gene classifier demonstrated identical overall performance as the 10-gene classifier, with an overall prediction accuracy of 78%, a sensitivity of 100%, a specificity of 57%, a positive predictive value of 70% and a negative predictive value of 100%. [0207] Apparent performance characteristics of both the 10-gene and 2-gene classifiers for the first dataset of 36 samples and actual performance characteristics of both classifiers in the evaluation of the 14 independent samples are listed in Table 20.
- Table 20 Performance characteristics of the 2-gene and 10-gene classifiers by cross-validation and in a test set.
- transcriptional profiling was applied to baseline peripheral blood samples to characterize transcriptional patterns that might provide insights into, or biomarkers for, AML patients' abilities to respond or fail to respond to a GO combination chemotherapy regimen.
- the largest percentage of patients in this study possessed a normal karyotype (33%), while other chromosomal abnormalities were relatively evenly distributed among the remaining patients.
- This heterogeneity of cytogenetic backgrounds allowed us to analyze the entire group of AML profiles without segregating them into karyotype-based groups, which in turn enabled us to search for transcriptional patterns that might be correlated with response to the GO combination regimen regardless of the molecular abnormalities involved in this complex disease.
- An objective of the present study was not necessarily to identify generally prognostic profiles associated with overall survival, but rather to identify a transcriptional pattern in peripheral blood that, if validated, could allow identification of patients who would or would not benefit (i.e., achieve initial remission) from a GO combination chemotherapy regimen.
- Comparison of responder (i.e. remission) and non-responder profiles at baseline identified a number of transcripts significantly altered between the groups.
- Transcripts present at higher levels in responding patients prior to therapy included T-cell receptor alpha locus, serum/glucocorticoid regulated kinase, aquaporin 9, forkhead box 03, IL8, TOSO (regulator of fas-induced apoptosis), ILl receptor antagonist, p21/cipl, a specific subset of IFN-inducible transcripts, and other regulatory molecules.
- the list of transcripts elevated in responder peripheral blood appears to contain markers of both normal peripheral blood cells (lymphocytes, monocytes and neutrophils) and blast- specific transcripts alike. A higher percentage of pro-apoptotic related molecules were elevated in peripheral blood of patients who ultimately responded to therapy.
- FOX03 is a critical pro-apoptotic molecule that is inactivated during IL2 -mediated T-cell survival and has recently been shown to be inactivated during FLT3-induced, PDKinase dependent stimulation of proliferation in myeloid cells.
- the finding that FOX03 is elevated in peripheral blood of AML patients that ultimately responded to GO combination therapy supports the theory that apoptotically "primed" cells will be more sensitive to the effects of GO based therapy regimens and possibly other chemotherapies as well.
- Levels of FOXOl A are positively correlated with survival in AML patients receiving two different regimens. [0211] A number of transcripts were also elevated in blood samples of AML patients who failed to respond to therapy.
- metallothionein overexpression has recently been characterized as a hallmark of the t(15;17) chromosomal translocation in AML but none of the patients in the present study were characterized as possessing this cytogenetic abnormality. However, in that study metallothionein isoform overexpression was not specific to the t(15;17) translocation, occurring in several other karyotypes as well.
Landscapes
- Health & Medical Sciences (AREA)
- Life Sciences & Earth Sciences (AREA)
- Chemical & Material Sciences (AREA)
- Engineering & Computer Science (AREA)
- Immunology (AREA)
- Hematology (AREA)
- Molecular Biology (AREA)
- Organic Chemistry (AREA)
- Analytical Chemistry (AREA)
- Biomedical Technology (AREA)
- Urology & Nephrology (AREA)
- Physics & Mathematics (AREA)
- Biochemistry (AREA)
- Microbiology (AREA)
- Proteomics, Peptides & Aminoacids (AREA)
- Pathology (AREA)
- Biotechnology (AREA)
- General Health & Medical Sciences (AREA)
- Zoology (AREA)
- Oncology (AREA)
- Wood Science & Technology (AREA)
- Hospice & Palliative Care (AREA)
- Genetics & Genomics (AREA)
- Food Science & Technology (AREA)
- Medicinal Chemistry (AREA)
- General Physics & Mathematics (AREA)
- Cell Biology (AREA)
- Biophysics (AREA)
- Bioinformatics & Cheminformatics (AREA)
- General Engineering & Computer Science (AREA)
- Measuring Or Testing Involving Enzymes Or Micro-Organisms (AREA)
- Apparatus Associated With Microorganisms And Enzymes (AREA)
Abstract
Description


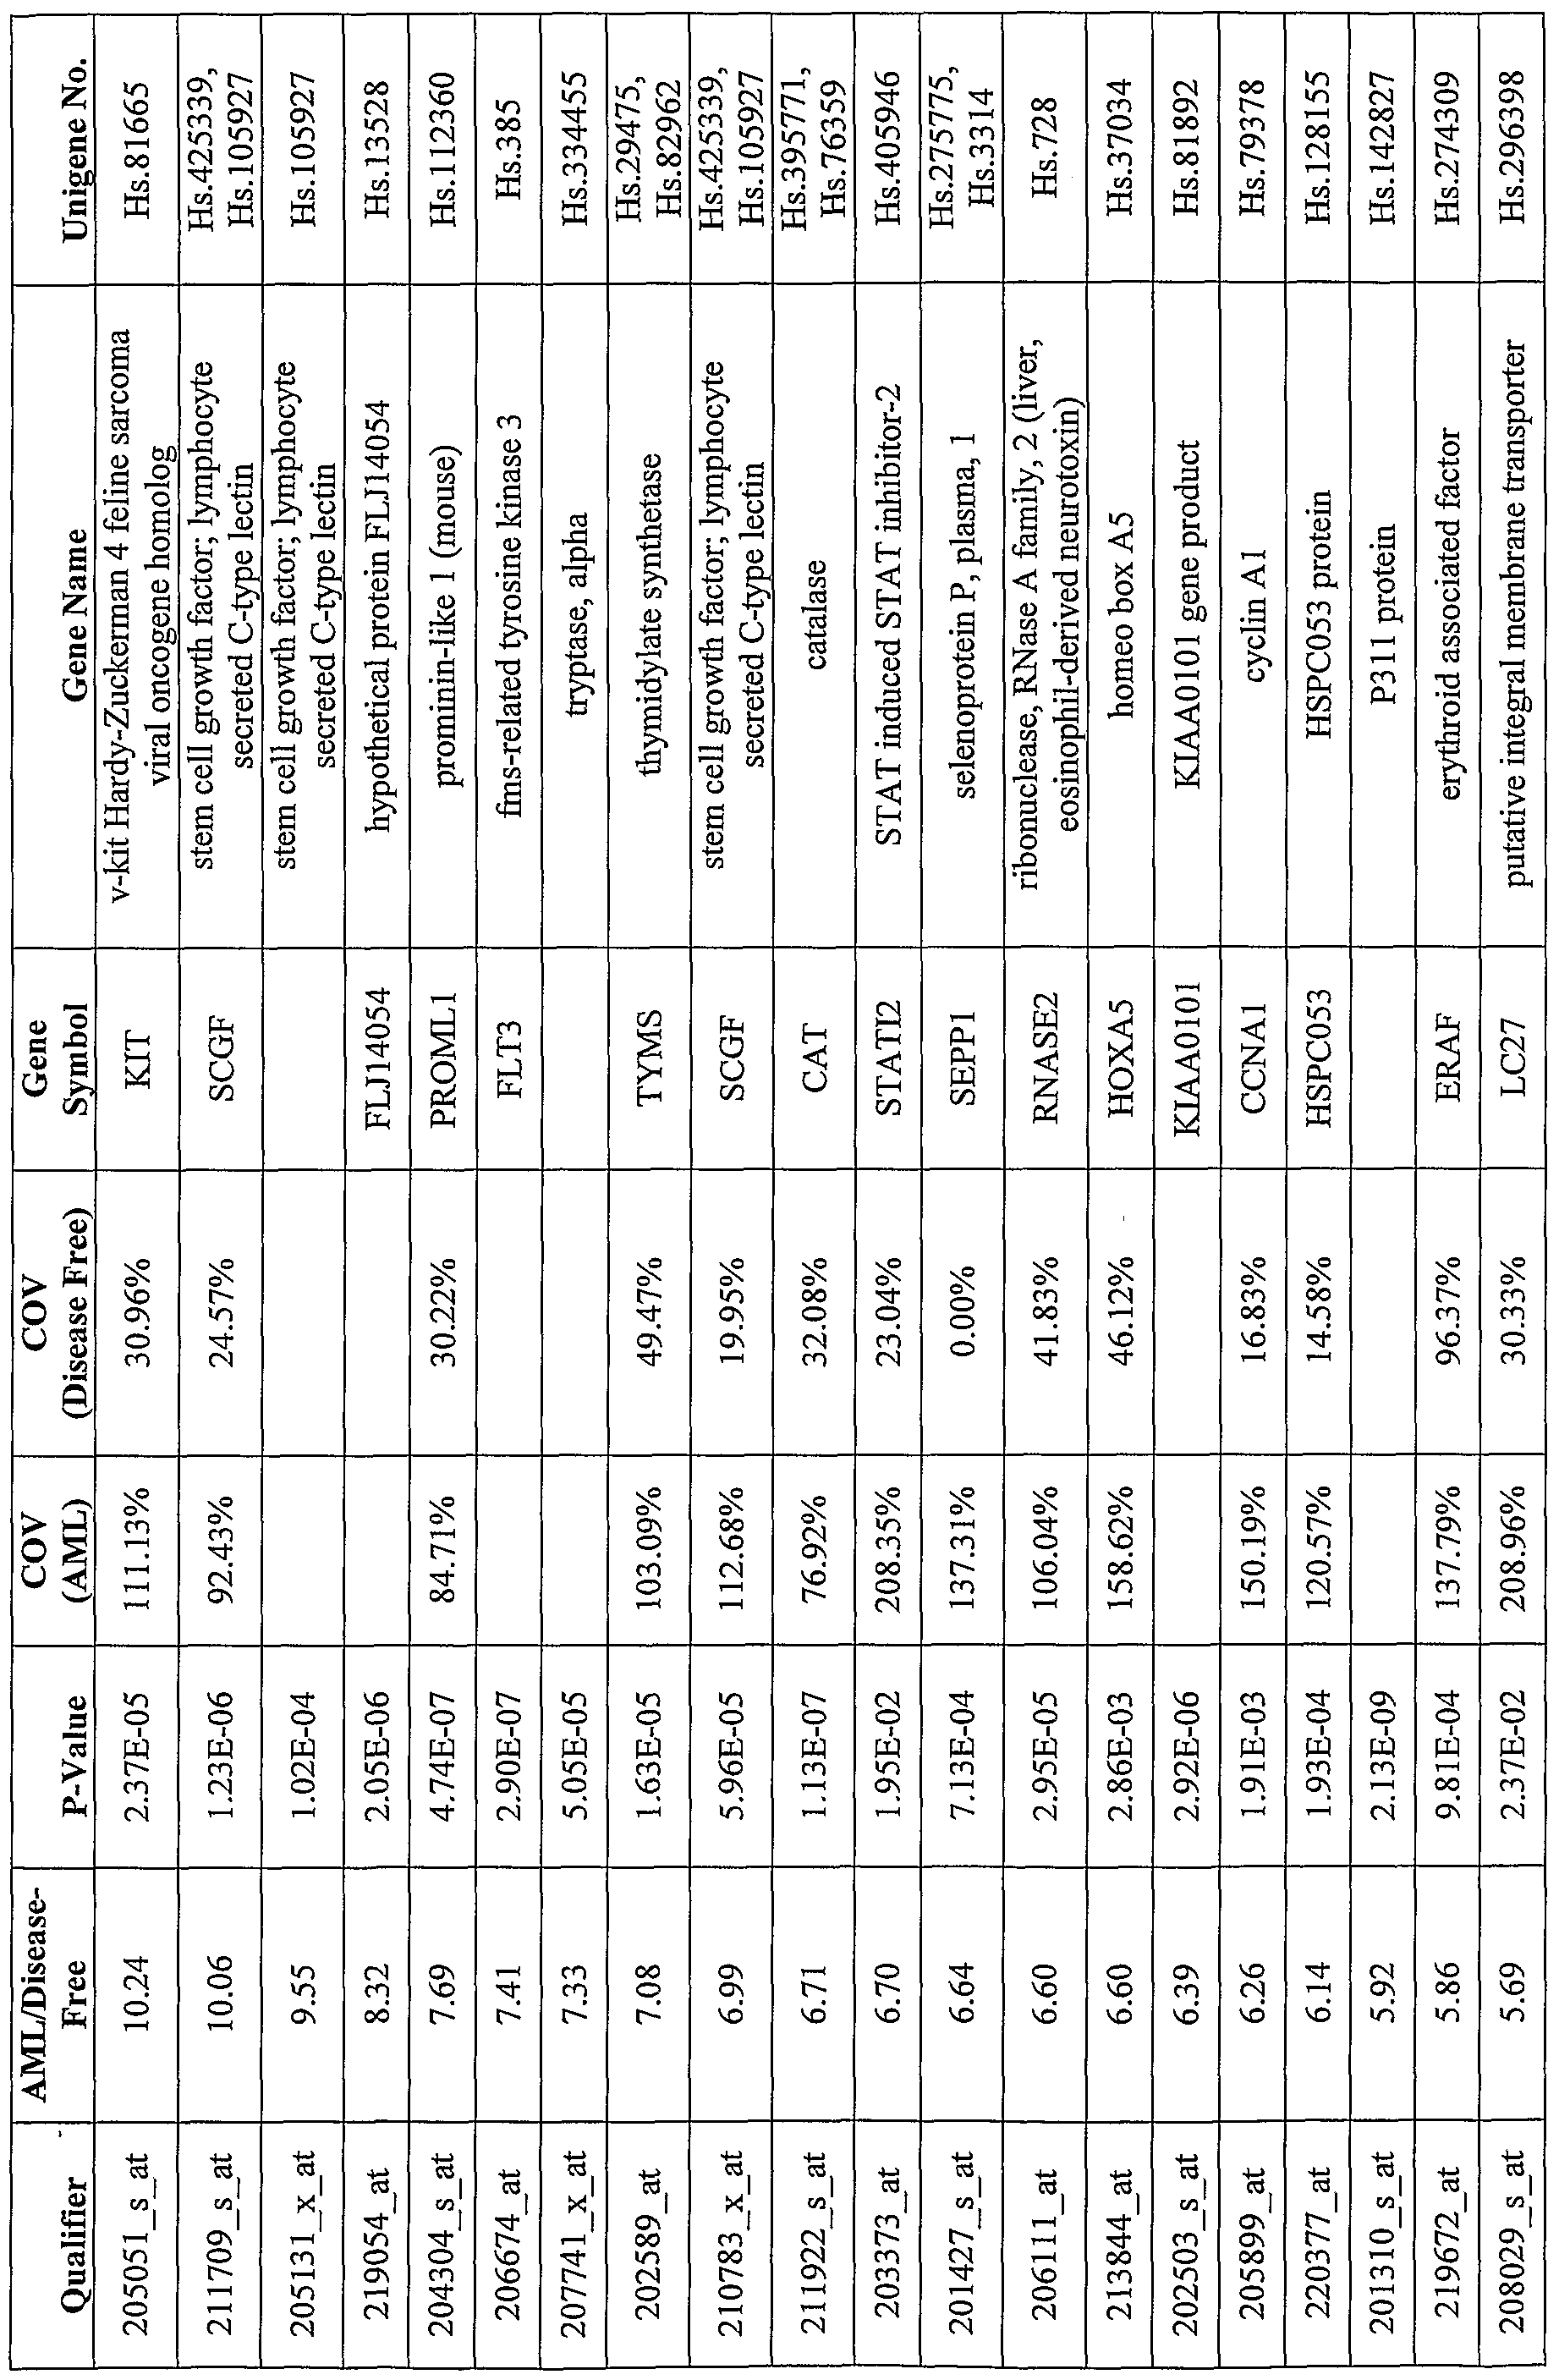


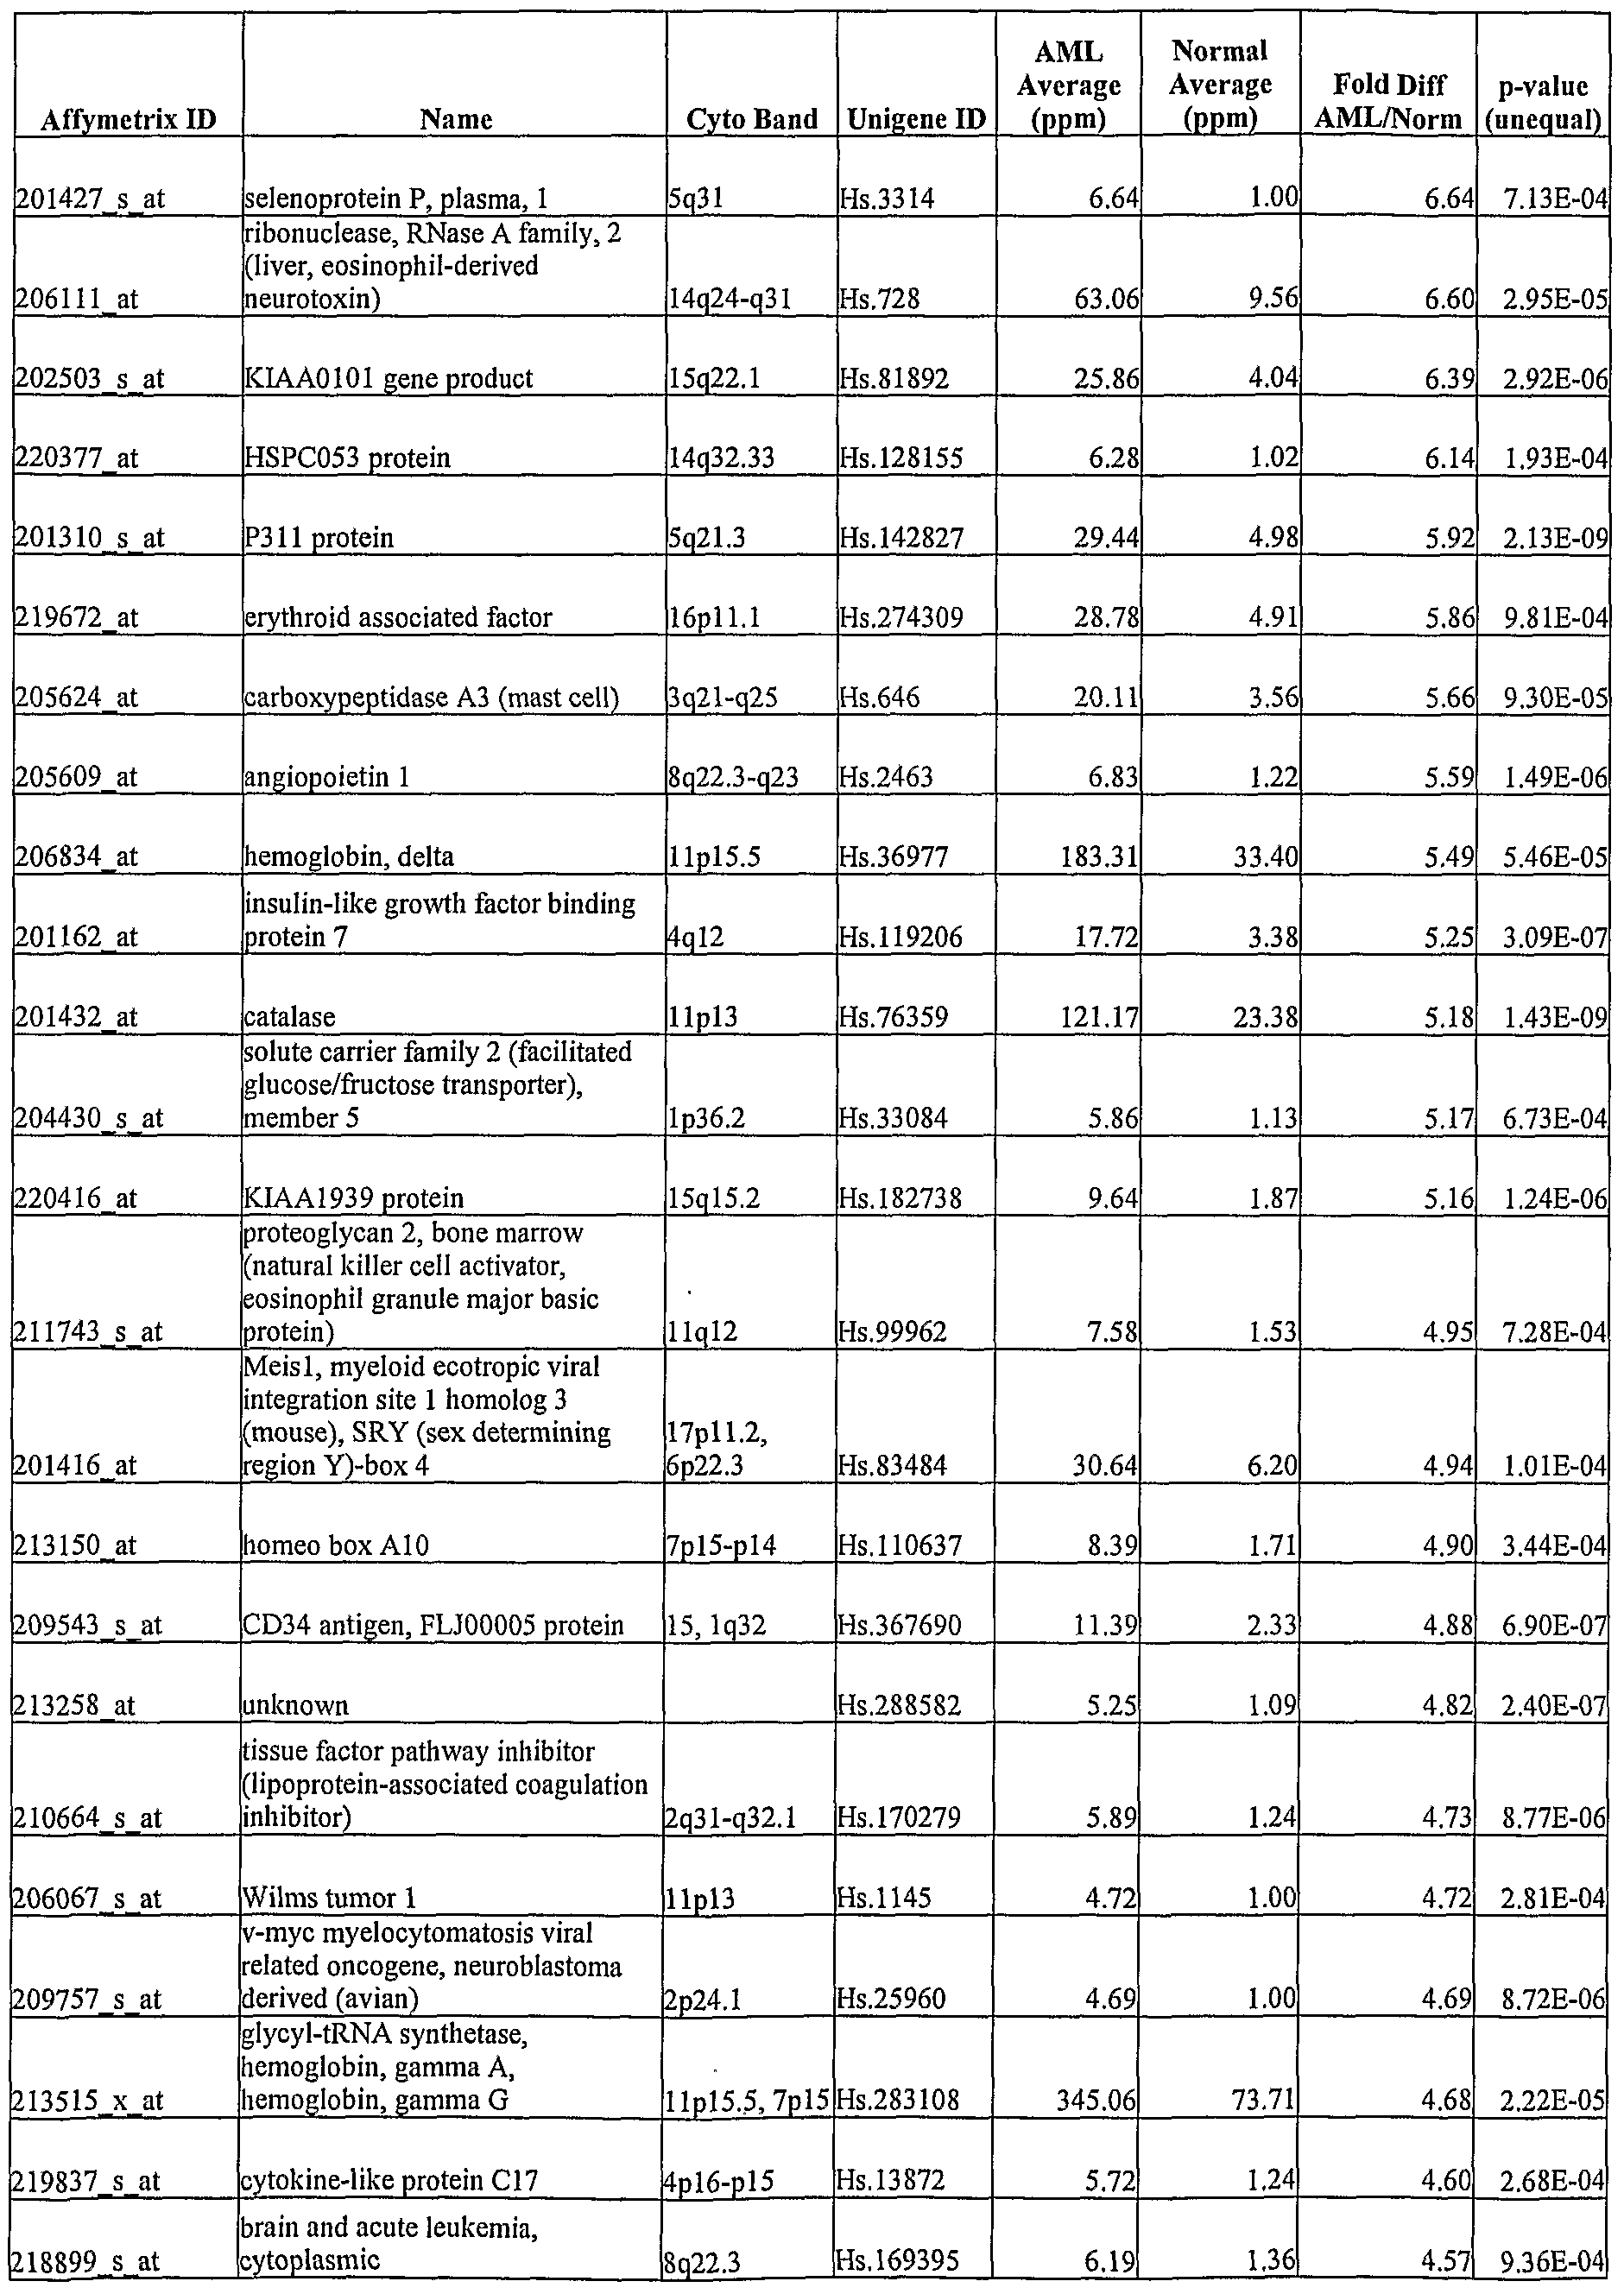


Claims
Priority Applications (9)
| Application Number | Priority Date | Filing Date | Title |
|---|---|---|---|
| MX2007009911A MX2007009911A (en) | 2005-02-16 | 2006-02-16 | Methods and systems for diagnosis, prognosis and selection of treatment of leukemia. |
| US11/884,169 US20080280774A1 (en) | 2005-02-16 | 2006-02-16 | Methods and Systems for Diagnosis, Prognosis and Selection of Treatment of Leukemia |
| CA002598025A CA2598025A1 (en) | 2005-02-16 | 2006-02-16 | Methods and systems for diagnosis, prognosis and selection of treatment of leukemia |
| EP06720889A EP1848994A2 (en) | 2005-02-16 | 2006-02-16 | Methods and systems for diagnosis, prognosis and selection of treatment of leukemia |
| AU2006214034A AU2006214034A1 (en) | 2005-02-16 | 2006-02-16 | Methods and systems for diagnosis, prognosis and selection of treatment of leukemia |
| BRPI0607753-6A BRPI0607753A2 (en) | 2005-02-16 | 2006-02-16 | method for predicting a clinical effect in response to a treatment of a leukemia; method for predicting a clinical effect of a leukemia; method for selecting a treatment for a leukemia patient; method for the diagnosis or monitoring of the occurrence, development, progression or treatment of a leukemia; arrangement for use in a method for predicting a clinical effect for an aml patient; arrangement for use in an aml diagnostic method; computer readable medium; aml prognosis kit |
| JP2007556371A JP2008529557A (en) | 2005-02-16 | 2006-02-16 | Methods and systems for leukemia diagnosis, prognosis and treatment selection |
| NO20074104A NO20074104L (en) | 2005-02-16 | 2007-08-08 | Methods and systems for diagnosis, prognosis and selection in the treatment of leukemia |
| IL185189A IL185189A0 (en) | 2005-02-16 | 2007-08-09 | Methods and systems for diagnosis, prognosis and selection of treatment of leukemia |
Applications Claiming Priority (2)
| Application Number | Priority Date | Filing Date | Title |
|---|---|---|---|
| US65311705P | 2005-02-16 | 2005-02-16 | |
| US60/653,117 | 2005-02-16 |
Publications (2)
| Publication Number | Publication Date |
|---|---|
| WO2006089233A2 true WO2006089233A2 (en) | 2006-08-24 |
| WO2006089233A3 WO2006089233A3 (en) | 2007-03-29 |
Family
ID=36659874
Family Applications (1)
| Application Number | Title | Priority Date | Filing Date |
|---|---|---|---|
| PCT/US2006/005855 WO2006089233A2 (en) | 2005-02-16 | 2006-02-16 | Methods and systems for diagnosis, prognosis and selection of treatment of leukemia |
Country Status (14)
| Country | Link |
|---|---|
| US (1) | US20080280774A1 (en) |
| EP (1) | EP1848994A2 (en) |
| JP (1) | JP2008529557A (en) |
| KR (1) | KR20070106027A (en) |
| CN (1) | CN101156067A (en) |
| AU (1) | AU2006214034A1 (en) |
| BR (1) | BRPI0607753A2 (en) |
| CA (1) | CA2598025A1 (en) |
| CR (1) | CR9315A (en) |
| IL (1) | IL185189A0 (en) |
| MX (1) | MX2007009911A (en) |
| NO (1) | NO20074104L (en) |
| RU (1) | RU2007130722A (en) |
| WO (1) | WO2006089233A2 (en) |
Cited By (4)
| Publication number | Priority date | Publication date | Assignee | Title |
|---|---|---|---|---|
| WO2006125195A2 (en) * | 2005-05-18 | 2006-11-23 | Wyeth | Leukemia disease genes and uses thereof |
| EP2113257A1 (en) | 2008-04-30 | 2009-11-04 | Consorzio per il Centro di Biomedica Moleculare Scrl | Polyelectrolyte with positive net charge for use as medicament and diagnostic for cancer |
| US20100041055A1 (en) * | 2008-08-12 | 2010-02-18 | Stokes Bio Limited | Novel gene normalization methods |
| US7754431B2 (en) | 2007-11-30 | 2010-07-13 | Applied Genomics, Inc. | TLE3 as a marker for chemotherapy |
Families Citing this family (56)
| Publication number | Priority date | Publication date | Assignee | Title |
|---|---|---|---|---|
| US10460080B2 (en) | 2005-09-08 | 2019-10-29 | Gearbox, Llc | Accessing predictive data |
| KR100617467B1 (en) * | 2005-09-27 | 2006-09-01 | 디지탈 지노믹스(주) | Markers for predicting the response of a patient with acute myeloid leukemia to anti-cancer drugs |
| US20090075266A1 (en) * | 2007-09-14 | 2009-03-19 | Predictive Biosciences Corporation | Multiple analyte diagnostic readout |
| JP2011515497A (en) * | 2008-03-26 | 2011-05-19 | セレラント セラピューティクス インコーポレイテッド | Immunoglobulins and / or Toll-like receptor proteins associated with myeloid hematological proliferative diseases and uses thereof |
| US8748103B2 (en) | 2008-11-07 | 2014-06-10 | Sequenta, Inc. | Monitoring health and disease status using clonotype profiles |
| SG195652A1 (en) | 2008-11-07 | 2013-12-30 | Sequenta Inc | Methods of monitoring conditions by sequence analysis |
| US9528160B2 (en) | 2008-11-07 | 2016-12-27 | Adaptive Biotechnolgies Corp. | Rare clonotypes and uses thereof |
| US9506119B2 (en) | 2008-11-07 | 2016-11-29 | Adaptive Biotechnologies Corp. | Method of sequence determination using sequence tags |
| US8691510B2 (en) * | 2008-11-07 | 2014-04-08 | Sequenta, Inc. | Sequence analysis of complex amplicons |
| US9365901B2 (en) | 2008-11-07 | 2016-06-14 | Adaptive Biotechnologies Corp. | Monitoring immunoglobulin heavy chain evolution in B-cell acute lymphoblastic leukemia |
| US8628927B2 (en) | 2008-11-07 | 2014-01-14 | Sequenta, Inc. | Monitoring health and disease status using clonotype profiles |
| HUE029424T2 (en) | 2009-01-15 | 2017-02-28 | Adaptive Biotechnologies Corp | Adaptive immunity profiling and methods for generation of monoclonal antibodies |
| KR100937720B1 (en) * | 2009-04-20 | 2010-01-20 | 전남대학교산학협력단 | A method for measurement of complement factor h (cfh) or apolipoprotein h (apoh) in serum of patients with acute myeloid leukemia to provide useful information in determining whether patients have achieved complete remission or not |
| JP2012531202A (en) | 2009-06-25 | 2012-12-10 | フレッド ハチンソン キャンサー リサーチ センター | How to measure adaptive immunity |
| EP2452207B1 (en) * | 2009-07-07 | 2015-08-12 | Koninklijke Philips N.V. | Dynamic pet imaging with isotope contamination compensation |
| GB2472856B (en) | 2009-08-21 | 2012-07-11 | Cantargia Ab | IL1-RAP modulators and uses thereof |
| JP5503942B2 (en) * | 2009-10-30 | 2014-05-28 | シスメックス株式会社 | Determination method of disease onset |
| US9043160B1 (en) | 2009-11-09 | 2015-05-26 | Sequenta, Inc. | Method of determining clonotypes and clonotype profiles |
| JP5467267B2 (en) * | 2010-03-05 | 2014-04-09 | 国立大学法人大阪大学 | DEVICE CONTROL DEVICE, DEVICE SYSTEM, DEVICE CONTROL METHOD, DEVICE CONTROL PROGRAM, AND RECORDING MEDIUM |
| CN107929730A (en) | 2011-01-19 | 2018-04-20 | 坎塔吉亚有限责任公司 | Anti- IL1RAP antibody and its purposes for treating the mankind |
| US9012422B2 (en) * | 2011-08-10 | 2015-04-21 | Wake Forest University Health Sciences | Method of treating acute myelogenous leukemia |
| US9873918B2 (en) | 2011-08-11 | 2018-01-23 | Albert Einstein College Of Medicine, Inc. | Treatment of acute myeloid leukemia and myelodysplastic syndromes |
| US10385475B2 (en) | 2011-09-12 | 2019-08-20 | Adaptive Biotechnologies Corp. | Random array sequencing of low-complexity libraries |
| EP2768982A4 (en) | 2011-10-21 | 2015-06-03 | Adaptive Biotechnologies Corp | Quantification of adaptive immune cell genomes in a complex mixture of cells |
| EP2788509B1 (en) | 2011-12-09 | 2018-07-11 | Adaptive Biotechnologies Corporation | Diagnosis of lymphoid malignancies and minimal residual disease detection |
| US9499865B2 (en) | 2011-12-13 | 2016-11-22 | Adaptive Biotechnologies Corp. | Detection and measurement of tissue-infiltrating lymphocytes |
| JP6156621B2 (en) * | 2012-02-14 | 2017-07-05 | 国立大学法人 岡山大学 | Data acquisition method for ATLL diagnosis, ATLL diagnosis kit, and ATLL diagnosis system |
| EP2823060B1 (en) | 2012-03-05 | 2018-02-14 | Adaptive Biotechnologies Corporation | Determining paired immune receptor chains from frequency matched subunits |
| DK2831276T3 (en) | 2012-05-08 | 2016-08-01 | Adaptive Biotechnologies Corp | Compositions and Methods for Measuring and Calibrating Amplification Bias in Multiplex PCR Reactions |
| ES2743767T3 (en) * | 2012-05-31 | 2020-02-20 | Univ Kinki | Agent to prevent and / or treat peripheral neuropathic pain caused by an anticancer drug |
| ES2749118T3 (en) | 2012-10-01 | 2020-03-19 | Adaptive Biotechnologies Corp | Assessment of immunocompetence for adaptive immunity receptor diversity and clonality characterization |
| WO2015160439A2 (en) | 2014-04-17 | 2015-10-22 | Adaptive Biotechnologies Corporation | Quantification of adaptive immune cell genomes in a complex mixture of cells |
| US9708657B2 (en) | 2013-07-01 | 2017-07-18 | Adaptive Biotechnologies Corp. | Method for generating clonotype profiles using sequence tags |
| WO2015134787A2 (en) | 2014-03-05 | 2015-09-11 | Adaptive Biotechnologies Corporation | Methods using randomer-containing synthetic molecules |
| US10066265B2 (en) | 2014-04-01 | 2018-09-04 | Adaptive Biotechnologies Corp. | Determining antigen-specific t-cells |
| CA2966201A1 (en) | 2014-10-29 | 2016-05-06 | Adaptive Biotechnologies Corp. | Highly-multiplexed simultaneous detection of nucleic acids encoding paired adaptive immune receptor heterodimers from many samples |
| US10246701B2 (en) | 2014-11-14 | 2019-04-02 | Adaptive Biotechnologies Corp. | Multiplexed digital quantitation of rearranged lymphoid receptors in a complex mixture |
| US11066705B2 (en) | 2014-11-25 | 2021-07-20 | Adaptive Biotechnologies Corporation | Characterization of adaptive immune response to vaccination or infection using immune repertoire sequencing |
| AU2016222788B2 (en) | 2015-02-24 | 2022-03-31 | Adaptive Biotechnologies Corp. | Methods for diagnosing infectious disease and determining HLA status using immune repertoire sequencing |
| AU2016242967B2 (en) | 2015-04-01 | 2021-07-01 | Adaptive Biotechnologies Corp. | Method of identifying human compatible T cell receptors specific for an antigenic target |
| US11474106B2 (en) | 2015-07-08 | 2022-10-18 | Lawrence Livermore National Security, Llc | Methods for cytotoxic chemotherapy-based predictive assays |
| US11035850B2 (en) | 2016-04-12 | 2021-06-15 | The Johns Hopkins University | Quantitative determination of nucleoside analogue drugs in genomic DNA or RNA |
| US10428325B1 (en) | 2016-09-21 | 2019-10-01 | Adaptive Biotechnologies Corporation | Identification of antigen-specific B cell receptors |
| WO2018132766A1 (en) * | 2017-01-12 | 2018-07-19 | The Regents Of The University Of California | Cytotoxic chemotherapy-based predictive assays for acute myeloid leukemia |
| CN106841624B (en) * | 2017-01-26 | 2019-02-22 | 庄磊靓 | The application of anti-human CD4 and anti-human CD184 monoclonal antibody as marker |
| US11254980B1 (en) | 2017-11-29 | 2022-02-22 | Adaptive Biotechnologies Corporation | Methods of profiling targeted polynucleotides while mitigating sequencing depth requirements |
| CN108182347B (en) * | 2018-01-17 | 2022-02-22 | 广东工业大学 | Large-scale cross-platform gene expression data classification method |
| KR102327062B1 (en) | 2018-03-20 | 2021-11-17 | 딜로이트컨설팅유한회사 | Apparatus and method for predicting result of clinical trial |
| CN109187987B (en) * | 2018-08-23 | 2021-05-11 | 中国人民解放军第三0九医院 | Application of MS4A3 protein as marker in diagnosis of active tuberculosis |
| US11497795B2 (en) | 2018-09-28 | 2022-11-15 | Asahi Kasei Pharma Corporation | Medicament for mitigating conditions and/or suppressing onset of peripheral neuropathy induced by anti-malignant tumor agent |
| CN109897900B (en) * | 2019-03-13 | 2023-04-07 | 温州医科大学 | Application of EPB42 gene in liver cancer SBRT curative effect evaluation |
| CN112831560B (en) * | 2019-11-23 | 2022-07-22 | 山东大学齐鲁医院 | New use of gamma-secretase activator protein gene and/or its coded protein |
| CN112852964B (en) * | 2021-03-08 | 2022-02-11 | 镇江市第一人民医院 | Circular RNA hsa _ circ _0059707, specific amplification primer thereof and application |
| CN114712381B (en) * | 2022-03-30 | 2024-04-26 | 浙江大学 | Application of AK2 gene in preparation of leukemia induced differentiation therapeutic drug |
| CN115029383B (en) * | 2022-04-21 | 2024-02-20 | 苏天生命科技(苏州)有限公司 | Application of MS4A3 protein in regulation of erythrocyte maturation |
| CN117737251B (en) * | 2024-02-21 | 2024-05-28 | 北京医院 | Combined molecular marker for AML diagnosis and prognosis |
Citations (5)
| Publication number | Priority date | Publication date | Assignee | Title |
|---|---|---|---|---|
| CA2325806A1 (en) * | 1999-12-03 | 2001-06-03 | Molecular Mining Corporation | Methods for the diagnosis and prognosis of acute leukemias |
| WO2003083140A2 (en) * | 2002-03-22 | 2003-10-09 | St.Jude Children's Research Hospital, Inc. | Classification and prognosis prediction of acute lymphoblasstic leukemia by gene expression profiling |
| WO2003102235A2 (en) * | 2002-05-31 | 2003-12-11 | Cancer Research Technology Limited | Specific genetic markets for cytogenetically defined acute myeloid leukaemia |
| WO2005080601A2 (en) * | 2004-02-23 | 2005-09-01 | Erasmus Universiteit Rotterdam | Classification, diagnosis and prognosis of acute myeloid leukemia by gene expression profiling |
| EP1612281A2 (en) * | 2004-05-06 | 2006-01-04 | Veridex, LLC | Methods for assessing patients with acute myeloid leukemia |
Family Cites Families (3)
| Publication number | Priority date | Publication date | Assignee | Title |
|---|---|---|---|---|
| US7625697B2 (en) * | 1994-06-17 | 2009-12-01 | The Board Of Trustees Of The Leland Stanford Junior University | Methods for constructing subarrays and subarrays made thereby |
| US6647341B1 (en) * | 1999-04-09 | 2003-11-11 | Whitehead Institute For Biomedical Research | Methods for classifying samples and ascertaining previously unknown classes |
| US20040152632A1 (en) * | 2002-11-06 | 2004-08-05 | Wyeth | Combination therapy for the treatment of acute leukemia and myelodysplastic syndrome |
-
2006
- 2006-02-16 CN CNA2006800119264A patent/CN101156067A/en active Pending
- 2006-02-16 RU RU2007130722/15A patent/RU2007130722A/en not_active Application Discontinuation
- 2006-02-16 KR KR1020077021244A patent/KR20070106027A/en not_active Application Discontinuation
- 2006-02-16 BR BRPI0607753-6A patent/BRPI0607753A2/en not_active IP Right Cessation
- 2006-02-16 JP JP2007556371A patent/JP2008529557A/en not_active Withdrawn
- 2006-02-16 MX MX2007009911A patent/MX2007009911A/en unknown
- 2006-02-16 AU AU2006214034A patent/AU2006214034A1/en not_active Abandoned
- 2006-02-16 US US11/884,169 patent/US20080280774A1/en not_active Abandoned
- 2006-02-16 WO PCT/US2006/005855 patent/WO2006089233A2/en active Application Filing
- 2006-02-16 EP EP06720889A patent/EP1848994A2/en not_active Ceased
- 2006-02-16 CA CA002598025A patent/CA2598025A1/en not_active Abandoned
-
2007
- 2007-08-08 NO NO20074104A patent/NO20074104L/en not_active Application Discontinuation
- 2007-08-09 IL IL185189A patent/IL185189A0/en unknown
- 2007-08-15 CR CR9315A patent/CR9315A/en not_active Application Discontinuation
Patent Citations (6)
| Publication number | Priority date | Publication date | Assignee | Title |
|---|---|---|---|---|
| CA2325806A1 (en) * | 1999-12-03 | 2001-06-03 | Molecular Mining Corporation | Methods for the diagnosis and prognosis of acute leukemias |
| WO2003083140A2 (en) * | 2002-03-22 | 2003-10-09 | St.Jude Children's Research Hospital, Inc. | Classification and prognosis prediction of acute lymphoblasstic leukemia by gene expression profiling |
| US20040018513A1 (en) * | 2002-03-22 | 2004-01-29 | Downing James R | Classification and prognosis prediction of acute lymphoblastic leukemia by gene expression profiling |
| WO2003102235A2 (en) * | 2002-05-31 | 2003-12-11 | Cancer Research Technology Limited | Specific genetic markets for cytogenetically defined acute myeloid leukaemia |
| WO2005080601A2 (en) * | 2004-02-23 | 2005-09-01 | Erasmus Universiteit Rotterdam | Classification, diagnosis and prognosis of acute myeloid leukemia by gene expression profiling |
| EP1612281A2 (en) * | 2004-05-06 | 2006-01-04 | Veridex, LLC | Methods for assessing patients with acute myeloid leukemia |
Cited By (9)
| Publication number | Priority date | Publication date | Assignee | Title |
|---|---|---|---|---|
| WO2006125195A2 (en) * | 2005-05-18 | 2006-11-23 | Wyeth | Leukemia disease genes and uses thereof |
| WO2006125195A3 (en) * | 2005-05-18 | 2007-05-31 | Wyeth Corp | Leukemia disease genes and uses thereof |
| US7754431B2 (en) | 2007-11-30 | 2010-07-13 | Applied Genomics, Inc. | TLE3 as a marker for chemotherapy |
| US7816084B2 (en) | 2007-11-30 | 2010-10-19 | Applied Genomics, Inc. | TLE3 as a marker for chemotherapy |
| US8785156B2 (en) | 2007-11-30 | 2014-07-22 | Clarient Diagnostic Services, Inc. | TLE3 as a marker for chemotherapy |
| US9005900B2 (en) | 2007-11-30 | 2015-04-14 | Clarient Diagnostic Services, Inc. | TLE3 as a marker for chemotherapy |
| EP2113257A1 (en) | 2008-04-30 | 2009-11-04 | Consorzio per il Centro di Biomedica Moleculare Scrl | Polyelectrolyte with positive net charge for use as medicament and diagnostic for cancer |
| US20100041055A1 (en) * | 2008-08-12 | 2010-02-18 | Stokes Bio Limited | Novel gene normalization methods |
| US20160083779A1 (en) * | 2008-08-12 | 2016-03-24 | Stokes Bio Limited | Novel Gene Normalization Methods |
Also Published As
| Publication number | Publication date |
|---|---|
| CN101156067A (en) | 2008-04-02 |
| CR9315A (en) | 2008-01-21 |
| BRPI0607753A2 (en) | 2009-10-06 |
| MX2007009911A (en) | 2008-02-20 |
| IL185189A0 (en) | 2007-12-03 |
| CA2598025A1 (en) | 2006-08-24 |
| KR20070106027A (en) | 2007-10-31 |
| JP2008529557A (en) | 2008-08-07 |
| NO20074104L (en) | 2007-11-13 |
| EP1848994A2 (en) | 2007-10-31 |
| AU2006214034A1 (en) | 2006-08-24 |
| WO2006089233A3 (en) | 2007-03-29 |
| US20080280774A1 (en) | 2008-11-13 |
| RU2007130722A (en) | 2009-03-27 |
Similar Documents
| Publication | Publication Date | Title |
|---|---|---|
| WO2006089233A2 (en) | Methods and systems for diagnosis, prognosis and selection of treatment of leukemia | |
| US20080032299A1 (en) | Methods for prognosis and treatment of solid tumors | |
| US20060134671A1 (en) | Methods and systems for prognosis and treatment of solid tumors | |
| WO2004097051A2 (en) | Methods for diagnosing aml and mds differential gene expression | |
| CA2608092A1 (en) | Leukemia disease genes and uses thereof | |
| AU2004258085A1 (en) | Expression profile algorithm and test for cancer prognosis | |
| US20090061423A1 (en) | Pharmacogenomic markers for prognosis of solid tumors | |
| WO2017132557A2 (en) | Prediction of therapeutic response in inflammatory conditions | |
| EP2458014A1 (en) | Prognostic markers for acute myeloid leukemia (AML) | |
| US11339446B2 (en) | Biomarker for measurement of response and prognosis of triple-negative breast cancer to anticancer agent | |
| US20210079479A1 (en) | Compostions and methods for diagnosing lung cancers using gene expression profiles | |
| US20120128651A1 (en) | Acute lymphoblastic leukemia (all) biomarkers | |
| EP4332242A1 (en) | Method for predicting prognosis of gastric cancer | |
| KR102326119B1 (en) | Biomarkers for predicting prognosis after immunotherapy of cancer | |
| WO2023187713A1 (en) | Methods and compositions for predicting and treating liver diseases | |
| EP1530046A9 (en) | Method for distinguishing AML subtypes with aberrant and prognostically intermediate karyotypes | |
| WO2005043161A2 (en) | Method for distinguishing leukemia subtypes | |
| EP1682906A2 (en) | Method for distinguishing aml subtypes with differents gene dosages |
Legal Events
| Date | Code | Title | Description |
|---|---|---|---|
| WWE | Wipo information: entry into national phase |
Ref document number: 200680011926.4 Country of ref document: CN |
|
| 121 | Ep: the epo has been informed by wipo that ep was designated in this application | ||
| WWE | Wipo information: entry into national phase |
Ref document number: 2006720889 Country of ref document: EP |
|
| WWE | Wipo information: entry into national phase |
Ref document number: 185189 Country of ref document: IL |
|
| WWE | Wipo information: entry into national phase |
Ref document number: 2006214034 Country of ref document: AU |
|
| WWE | Wipo information: entry into national phase |
Ref document number: 560591 Country of ref document: NZ |
|
| WWE | Wipo information: entry into national phase |
Ref document number: 6324/DELNP/2007 Country of ref document: IN |
|
| ENP | Entry into the national phase |
Ref document number: 2598025 Country of ref document: CA |
|
| WWE | Wipo information: entry into national phase |
Ref document number: MX/a/2007/009911 Country of ref document: MX Ref document number: 2007556371 Country of ref document: JP Ref document number: 07083782 Country of ref document: CO Ref document number: CR2007-009315 Country of ref document: CR |
|
| WWE | Wipo information: entry into national phase |
Ref document number: 12007501760 Country of ref document: PH |
|
| NENP | Non-entry into the national phase |
Ref country code: DE |
|
| ENP | Entry into the national phase |
Ref document number: 2006214034 Country of ref document: AU Date of ref document: 20060216 Kind code of ref document: A |
|
| WWE | Wipo information: entry into national phase |
Ref document number: 1020077021244 Country of ref document: KR |
|
| WWE | Wipo information: entry into national phase |
Ref document number: 2007130722 Country of ref document: RU Ref document number: 1200701882 Country of ref document: VN |
|
| WWE | Wipo information: entry into national phase |
Ref document number: 11884169 Country of ref document: US |
|
| ENP | Entry into the national phase |
Ref document number: PI0607753 Country of ref document: BR Kind code of ref document: A2 |