WO2002097047A2 - Compositions and methods for the inference of pigmentation traits - Google Patents
Compositions and methods for the inference of pigmentation traits Download PDFInfo
- Publication number
- WO2002097047A2 WO2002097047A2 PCT/US2002/016789 US0216789W WO02097047A2 WO 2002097047 A2 WO2002097047 A2 WO 2002097047A2 US 0216789 W US0216789 W US 0216789W WO 02097047 A2 WO02097047 A2 WO 02097047A2
- Authority
- WO
- WIPO (PCT)
- Prior art keywords
- nucleotide
- seq
- haplotype
- pigmentation
- ofthe
- Prior art date
Links
- 230000019612 pigmentation Effects 0.000 title claims abstract description 411
- 238000000034 method Methods 0.000 title claims abstract description 322
- 239000000203 mixture Substances 0.000 title abstract description 13
- 125000003729 nucleotide group Chemical group 0.000 claims abstract description 1666
- 239000002773 nucleotide Substances 0.000 claims abstract description 1659
- 102000054766 genetic haplotypes Human genes 0.000 claims abstract description 606
- 108700028369 Alleles Proteins 0.000 claims abstract description 348
- 108090000623 proteins and genes Proteins 0.000 claims abstract description 235
- 241000282414 Homo sapiens Species 0.000 claims abstract description 95
- 150000007523 nucleic acids Chemical class 0.000 claims abstract description 76
- 102000039446 nucleic acids Human genes 0.000 claims abstract description 75
- 108020004707 nucleic acids Proteins 0.000 claims abstract description 75
- 230000002068 genetic effect Effects 0.000 claims abstract description 72
- 230000037308 hair color Effects 0.000 claims abstract description 35
- 210000004209 hair Anatomy 0.000 claims abstract description 30
- 102000054765 polymorphisms of proteins Human genes 0.000 claims abstract description 8
- 208000012641 Pigmentation disease Diseases 0.000 claims description 426
- 239000000523 sample Substances 0.000 claims description 155
- 239000002157 polynucleotide Substances 0.000 claims description 124
- 102000040430 polynucleotide Human genes 0.000 claims description 124
- 108091033319 polynucleotide Proteins 0.000 claims description 124
- 101150068614 OCA2 gene Proteins 0.000 claims description 72
- 108010021428 Type 1 Melanocortin Receptor Proteins 0.000 claims description 62
- 102000003425 Tyrosinase Human genes 0.000 claims description 48
- 108060008724 Tyrosinase Proteins 0.000 claims description 48
- -1 TYRPl Proteins 0.000 claims description 45
- 102100031413 L-dopachrome tautomerase Human genes 0.000 claims description 39
- 108010051081 dopachrome isomerase Proteins 0.000 claims description 39
- 102000006822 Agouti Signaling Protein Human genes 0.000 claims description 38
- 108010072151 Agouti Signaling Protein Proteins 0.000 claims description 38
- 230000009870 specific binding Effects 0.000 claims description 36
- 102100039860 G-protein coupled receptor 143 Human genes 0.000 claims description 30
- 101000887425 Homo sapiens G-protein coupled receptor 143 Proteins 0.000 claims description 30
- 108010050345 Microphthalmia-Associated Transcription Factor Proteins 0.000 claims description 30
- 102000013760 Microphthalmia-Associated Transcription Factor Human genes 0.000 claims description 30
- 108010069820 Pro-Opiomelanocortin Proteins 0.000 claims description 30
- 239000000683 Pro-Opiomelanocortin Substances 0.000 claims description 30
- 102100027467 Pro-opiomelanocortin Human genes 0.000 claims description 30
- 238000004458 analytical method Methods 0.000 claims description 30
- 102100033936 AP-3 complex subunit beta-1 Human genes 0.000 claims description 27
- 101000779239 Homo sapiens AP-3 complex subunit beta-1 Proteins 0.000 claims description 26
- 238000006243 chemical reaction Methods 0.000 claims description 24
- 230000003321 amplification Effects 0.000 claims description 23
- 238000003199 nucleic acid amplification method Methods 0.000 claims description 23
- 101000583031 Homo sapiens Unconventional myosin-Va Proteins 0.000 claims description 22
- 102100030409 Unconventional myosin-Va Human genes 0.000 claims description 22
- 102000006581 rab27 GTP-Binding Proteins Human genes 0.000 claims description 21
- 108010033990 rab27 GTP-Binding Proteins Proteins 0.000 claims description 20
- 101150050916 DCT gene Proteins 0.000 claims description 19
- 201000007909 oculocutaneous albinism Diseases 0.000 claims description 19
- IQFYYKKMVGJFEH-XLPZGREQSA-N Thymidine Chemical group O=C1NC(=O)C(C)=CN1[C@@H]1O[C@H](CO)[C@@H](O)C1 IQFYYKKMVGJFEH-XLPZGREQSA-N 0.000 claims description 16
- 102100035111 Farnesyl pyrophosphate synthase Human genes 0.000 claims description 14
- 102100030310 5,6-dihydroxyindole-2-carboxylic acid oxidase Human genes 0.000 claims description 13
- 108010026318 Geranyltranstransferase Proteins 0.000 claims description 13
- 102000004286 Hydroxymethylglutaryl CoA Reductases Human genes 0.000 claims description 13
- 108090000895 Hydroxymethylglutaryl CoA Reductases Proteins 0.000 claims description 13
- 230000027455 binding Effects 0.000 claims description 13
- 238000004422 calculation algorithm Methods 0.000 claims description 13
- 230000000295 complement effect Effects 0.000 claims description 13
- 108010014402 tyrosinase-related protein-1 Proteins 0.000 claims description 13
- 108020005187 Oligonucleotide Probes Proteins 0.000 claims description 12
- 238000009826 distribution Methods 0.000 claims description 12
- 239000002751 oligonucleotide probe Substances 0.000 claims description 12
- 102100021704 Cytochrome P450 2D6 Human genes 0.000 claims description 10
- 239000011159 matrix material Substances 0.000 claims description 10
- 238000011144 upstream manufacturing Methods 0.000 claims description 10
- 239000013598 vector Substances 0.000 claims description 10
- 101150082201 ASIP gene Proteins 0.000 claims description 9
- 108010001237 Cytochrome P-450 CYP2D6 Proteins 0.000 claims description 9
- 101001098560 Homo sapiens Proteinase-activated receptor 2 Proteins 0.000 claims description 9
- 102100037132 Proteinase-activated receptor 2 Human genes 0.000 claims description 9
- BQCADISMDOOEFD-UHFFFAOYSA-N Silver Chemical compound [Ag] BQCADISMDOOEFD-UHFFFAOYSA-N 0.000 claims description 9
- 229910052709 silver Inorganic materials 0.000 claims description 9
- 239000004332 silver Substances 0.000 claims description 9
- 239000002676 xenobiotic agent Substances 0.000 claims description 9
- 230000002034 xenobiotic effect Effects 0.000 claims description 9
- 108010077835 Adaptor Protein Complex 3 Proteins 0.000 claims description 8
- 102000010646 Adaptor Protein Complex 3 Human genes 0.000 claims description 8
- 108091005769 Clathrin adaptor proteins Proteins 0.000 claims description 8
- 102000035183 Clathrin adaptor proteins Human genes 0.000 claims description 8
- 108010081668 Cytochrome P-450 CYP3A Proteins 0.000 claims description 8
- OIRDTQYFTABQOQ-KQYNXXCUSA-N adenosine group Chemical group [C@@H]1([C@H](O)[C@H](O)[C@@H](CO)O1)N1C=NC=2C(N)=NC=NC12 OIRDTQYFTABQOQ-KQYNXXCUSA-N 0.000 claims description 8
- 101150022728 tyr gene Proteins 0.000 claims description 8
- UHDGCWIWMRVCDJ-ZAKLUEHWSA-N cytidine Chemical group O=C1N=C(N)C=CN1[C@H]1[C@H](O)[C@@H](O)[C@H](CO)O1 UHDGCWIWMRVCDJ-ZAKLUEHWSA-N 0.000 claims description 7
- 239000000049 pigment Substances 0.000 claims description 7
- 102000004169 proteins and genes Human genes 0.000 claims description 7
- 102000018832 Cytochromes Human genes 0.000 claims description 6
- 108010052832 Cytochromes Proteins 0.000 claims description 6
- 101100154912 Mus musculus Tyrp1 gene Proteins 0.000 claims description 6
- 239000003153 chemical reaction reagent Substances 0.000 claims description 6
- 230000001427 coherent effect Effects 0.000 claims description 6
- 102100032306 Aurora kinase B Human genes 0.000 claims description 5
- 108090000749 Aurora kinase B Proteins 0.000 claims description 5
- 230000001747 exhibiting effect Effects 0.000 claims description 5
- 208000021005 inheritance pattern Diseases 0.000 claims description 5
- 102100031780 Endonuclease Human genes 0.000 claims description 4
- 108010042407 Endonucleases Proteins 0.000 claims description 4
- ZRALSGWEFCBTJO-UHFFFAOYSA-N guanidine group Chemical group NC(=N)N ZRALSGWEFCBTJO-UHFFFAOYSA-N 0.000 claims description 4
- 239000000758 substrate Substances 0.000 claims description 4
- 239000004215 Carbon black (E152) Substances 0.000 claims description 3
- 101000921934 Crocosmia x crocosmiiflora Flavonoid 3',5'-hydroxylase CYP75B138 Proteins 0.000 claims description 3
- 102000003960 Ligases Human genes 0.000 claims description 3
- 108090000364 Ligases Proteins 0.000 claims description 3
- 102000004316 Oxidoreductases Human genes 0.000 claims description 3
- 108090000854 Oxidoreductases Proteins 0.000 claims description 3
- 229930195733 hydrocarbon Natural products 0.000 claims description 3
- 101150109698 A2 gene Proteins 0.000 claims description 2
- 101000773083 Homo sapiens 5,6-dihydroxyindole-2-carboxylic acid oxidase Proteins 0.000 claims description 2
- 101100411302 Homo sapiens OCA2 gene Proteins 0.000 claims description 2
- 102000003505 Myosin Human genes 0.000 claims description 2
- 108060008487 Myosin Proteins 0.000 claims description 2
- 238000003018 immunoassay Methods 0.000 claims description 2
- 102100034216 Melanocyte-stimulating hormone receptor Human genes 0.000 claims 17
- 238000007635 classification algorithm Methods 0.000 claims 5
- 102000004328 Cytochrome P-450 CYP3A Human genes 0.000 claims 3
- 101001134060 Homo sapiens Melanocyte-stimulating hormone receptor Proteins 0.000 claims 1
- 108090000765 processed proteins & peptides Proteins 0.000 abstract description 44
- 102000004196 processed proteins & peptides Human genes 0.000 abstract description 40
- 229920001184 polypeptide Polymers 0.000 abstract description 39
- 239000003550 marker Substances 0.000 description 595
- 210000001508 eye Anatomy 0.000 description 65
- 239000013615 primer Substances 0.000 description 60
- 102000008314 Type 1 Melanocortin Receptor Human genes 0.000 description 34
- 150000001413 amino acids Chemical class 0.000 description 34
- 102000053602 DNA Human genes 0.000 description 32
- 108020004414 DNA Proteins 0.000 description 32
- 239000000047 product Substances 0.000 description 28
- 108091034117 Oligonucleotide Proteins 0.000 description 27
- 210000000554 iris Anatomy 0.000 description 20
- 238000012360 testing method Methods 0.000 description 19
- XUMBMVFBXHLACL-UHFFFAOYSA-N Melanin Chemical compound O=C1C(=O)C(C2=CNC3=C(C(C(=O)C4=C32)=O)C)=C2C4=CNC2=C1C XUMBMVFBXHLACL-UHFFFAOYSA-N 0.000 description 16
- 230000006870 function Effects 0.000 description 16
- 239000012472 biological sample Substances 0.000 description 15
- 238000009396 hybridization Methods 0.000 description 13
- 238000013456 study Methods 0.000 description 12
- 229920002477 rna polymer Polymers 0.000 description 11
- 108020004705 Codon Proteins 0.000 description 9
- 210000004027 cell Anatomy 0.000 description 9
- 239000002987 primer (paints) Substances 0.000 description 9
- 108091026890 Coding region Proteins 0.000 description 8
- 238000013459 approach Methods 0.000 description 8
- 230000011512 eye pigmentation Effects 0.000 description 8
- 230000035772 mutation Effects 0.000 description 8
- 102100029358 Cytochrome P450 2C9 Human genes 0.000 description 7
- 238000003556 assay Methods 0.000 description 7
- 230000003993 interaction Effects 0.000 description 7
- 210000001519 tissue Anatomy 0.000 description 7
- 108010000543 Cytochrome P-450 CYP2C9 Proteins 0.000 description 6
- 102100039205 Cytochrome P450 3A4 Human genes 0.000 description 6
- 102000004190 Enzymes Human genes 0.000 description 6
- 108090000790 Enzymes Proteins 0.000 description 6
- 241001465754 Metazoa Species 0.000 description 6
- 238000004364 calculation method Methods 0.000 description 6
- OPTASPLRGRRNAP-UHFFFAOYSA-N cytosine Chemical compound NC=1C=CNC(=O)N=1 OPTASPLRGRRNAP-UHFFFAOYSA-N 0.000 description 6
- 229940088598 enzyme Drugs 0.000 description 6
- 210000000582 semen Anatomy 0.000 description 6
- 241000894007 species Species 0.000 description 6
- 238000007619 statistical method Methods 0.000 description 6
- 230000009897 systematic effect Effects 0.000 description 6
- 241001156002 Anthonomus pomorum Species 0.000 description 5
- 241000699666 Mus <mouse, genus> Species 0.000 description 5
- 239000002253 acid Substances 0.000 description 5
- 239000000427 antigen Substances 0.000 description 5
- 108091007433 antigens Proteins 0.000 description 5
- 102000036639 antigens Human genes 0.000 description 5
- 230000007717 exclusion Effects 0.000 description 5
- 239000012634 fragment Substances 0.000 description 5
- 230000003793 hair pigmentation Effects 0.000 description 5
- 238000012163 sequencing technique Methods 0.000 description 5
- 239000000243 solution Substances 0.000 description 5
- 238000003786 synthesis reaction Methods 0.000 description 5
- 241000282412 Homo Species 0.000 description 4
- 108060003951 Immunoglobulin Proteins 0.000 description 4
- 101150015860 MC1R gene Proteins 0.000 description 4
- 241000699670 Mus sp. Species 0.000 description 4
- 108091028043 Nucleic acid sequence Proteins 0.000 description 4
- 102000007079 Peptide Fragments Human genes 0.000 description 4
- 108010033276 Peptide Fragments Proteins 0.000 description 4
- 150000007513 acids Chemical class 0.000 description 4
- 230000015572 biosynthetic process Effects 0.000 description 4
- 210000004369 blood Anatomy 0.000 description 4
- 239000008280 blood Substances 0.000 description 4
- 230000015556 catabolic process Effects 0.000 description 4
- 230000008859 change Effects 0.000 description 4
- 230000007547 defect Effects 0.000 description 4
- 238000006731 degradation reaction Methods 0.000 description 4
- 230000008021 deposition Effects 0.000 description 4
- 239000000796 flavoring agent Substances 0.000 description 4
- 235000019634 flavors Nutrition 0.000 description 4
- UYTPUPDQBNUYGX-UHFFFAOYSA-N guanine Chemical compound O=C1NC(N)=NC2=C1N=CN2 UYTPUPDQBNUYGX-UHFFFAOYSA-N 0.000 description 4
- 210000004408 hybridoma Anatomy 0.000 description 4
- 102000018358 immunoglobulin Human genes 0.000 description 4
- 238000005259 measurement Methods 0.000 description 4
- 238000003752 polymerase chain reaction Methods 0.000 description 4
- 238000005070 sampling Methods 0.000 description 4
- 241000255581 Drosophila <fruit fly, genus> Species 0.000 description 3
- 241000283973 Oryctolagus cuniculus Species 0.000 description 3
- 241000700159 Rattus Species 0.000 description 3
- 241000251539 Vertebrata <Metazoa> Species 0.000 description 3
- JLCPHMBAVCMARE-UHFFFAOYSA-N [3-[[3-[[3-[[3-[[3-[[3-[[3-[[3-[[3-[[3-[[3-[[5-(2-amino-6-oxo-1H-purin-9-yl)-3-[[3-[[3-[[3-[[3-[[3-[[5-(2-amino-6-oxo-1H-purin-9-yl)-3-[[5-(2-amino-6-oxo-1H-purin-9-yl)-3-hydroxyoxolan-2-yl]methoxy-hydroxyphosphoryl]oxyoxolan-2-yl]methoxy-hydroxyphosphoryl]oxy-5-(5-methyl-2,4-dioxopyrimidin-1-yl)oxolan-2-yl]methoxy-hydroxyphosphoryl]oxy-5-(6-aminopurin-9-yl)oxolan-2-yl]methoxy-hydroxyphosphoryl]oxy-5-(6-aminopurin-9-yl)oxolan-2-yl]methoxy-hydroxyphosphoryl]oxy-5-(6-aminopurin-9-yl)oxolan-2-yl]methoxy-hydroxyphosphoryl]oxy-5-(6-aminopurin-9-yl)oxolan-2-yl]methoxy-hydroxyphosphoryl]oxyoxolan-2-yl]methoxy-hydroxyphosphoryl]oxy-5-(5-methyl-2,4-dioxopyrimidin-1-yl)oxolan-2-yl]methoxy-hydroxyphosphoryl]oxy-5-(4-amino-2-oxopyrimidin-1-yl)oxolan-2-yl]methoxy-hydroxyphosphoryl]oxy-5-(5-methyl-2,4-dioxopyrimidin-1-yl)oxolan-2-yl]methoxy-hydroxyphosphoryl]oxy-5-(5-methyl-2,4-dioxopyrimidin-1-yl)oxolan-2-yl]methoxy-hydroxyphosphoryl]oxy-5-(6-aminopurin-9-yl)oxolan-2-yl]methoxy-hydroxyphosphoryl]oxy-5-(6-aminopurin-9-yl)oxolan-2-yl]methoxy-hydroxyphosphoryl]oxy-5-(4-amino-2-oxopyrimidin-1-yl)oxolan-2-yl]methoxy-hydroxyphosphoryl]oxy-5-(4-amino-2-oxopyrimidin-1-yl)oxolan-2-yl]methoxy-hydroxyphosphoryl]oxy-5-(4-amino-2-oxopyrimidin-1-yl)oxolan-2-yl]methoxy-hydroxyphosphoryl]oxy-5-(6-aminopurin-9-yl)oxolan-2-yl]methoxy-hydroxyphosphoryl]oxy-5-(4-amino-2-oxopyrimidin-1-yl)oxolan-2-yl]methyl [5-(6-aminopurin-9-yl)-2-(hydroxymethyl)oxolan-3-yl] hydrogen phosphate Polymers Cc1cn(C2CC(OP(O)(=O)OCC3OC(CC3OP(O)(=O)OCC3OC(CC3O)n3cnc4c3nc(N)[nH]c4=O)n3cnc4c3nc(N)[nH]c4=O)C(COP(O)(=O)OC3CC(OC3COP(O)(=O)OC3CC(OC3COP(O)(=O)OC3CC(OC3COP(O)(=O)OC3CC(OC3COP(O)(=O)OC3CC(OC3COP(O)(=O)OC3CC(OC3COP(O)(=O)OC3CC(OC3COP(O)(=O)OC3CC(OC3COP(O)(=O)OC3CC(OC3COP(O)(=O)OC3CC(OC3COP(O)(=O)OC3CC(OC3COP(O)(=O)OC3CC(OC3COP(O)(=O)OC3CC(OC3COP(O)(=O)OC3CC(OC3COP(O)(=O)OC3CC(OC3COP(O)(=O)OC3CC(OC3COP(O)(=O)OC3CC(OC3CO)n3cnc4c(N)ncnc34)n3ccc(N)nc3=O)n3cnc4c(N)ncnc34)n3ccc(N)nc3=O)n3ccc(N)nc3=O)n3ccc(N)nc3=O)n3cnc4c(N)ncnc34)n3cnc4c(N)ncnc34)n3cc(C)c(=O)[nH]c3=O)n3cc(C)c(=O)[nH]c3=O)n3ccc(N)nc3=O)n3cc(C)c(=O)[nH]c3=O)n3cnc4c3nc(N)[nH]c4=O)n3cnc4c(N)ncnc34)n3cnc4c(N)ncnc34)n3cnc4c(N)ncnc34)n3cnc4c(N)ncnc34)O2)c(=O)[nH]c1=O JLCPHMBAVCMARE-UHFFFAOYSA-N 0.000 description 3
- 239000002671 adjuvant Substances 0.000 description 3
- 230000008901 benefit Effects 0.000 description 3
- 238000009395 breeding Methods 0.000 description 3
- 230000001488 breeding effect Effects 0.000 description 3
- 238000013145 classification model Methods 0.000 description 3
- 238000003776 cleavage reaction Methods 0.000 description 3
- 239000002299 complementary DNA Substances 0.000 description 3
- 229940104302 cytosine Drugs 0.000 description 3
- 238000005516 engineering process Methods 0.000 description 3
- 244000144972 livestock Species 0.000 description 3
- 210000002752 melanocyte Anatomy 0.000 description 3
- 239000012071 phase Substances 0.000 description 3
- 239000002243 precursor Substances 0.000 description 3
- 230000007017 scission Effects 0.000 description 3
- 210000003491 skin Anatomy 0.000 description 3
- 230000022814 xenobiotic metabolic process Effects 0.000 description 3
- 229930024421 Adenine Natural products 0.000 description 2
- GFFGJBXGBJISGV-UHFFFAOYSA-N Adenine Chemical compound NC1=NC=NC2=C1N=CN2 GFFGJBXGBJISGV-UHFFFAOYSA-N 0.000 description 2
- DWRXFEITVBNRMK-UHFFFAOYSA-N Beta-D-1-Arabinofuranosylthymine Natural products O=C1NC(=O)C(C)=CN1C1C(O)C(O)C(CO)O1 DWRXFEITVBNRMK-UHFFFAOYSA-N 0.000 description 2
- 239000002126 C01EB10 - Adenosine Substances 0.000 description 2
- 101100492805 Caenorhabditis elegans atm-1 gene Proteins 0.000 description 2
- 101100497948 Caenorhabditis elegans cyn-1 gene Proteins 0.000 description 2
- 101100315627 Caenorhabditis elegans tyr-3 gene Proteins 0.000 description 2
- 241000283707 Capra Species 0.000 description 2
- 235000001543 Corylus americana Nutrition 0.000 description 2
- 240000007582 Corylus avellana Species 0.000 description 2
- 235000007466 Corylus avellana Nutrition 0.000 description 2
- 239000003155 DNA primer Substances 0.000 description 2
- 241000283073 Equus caballus Species 0.000 description 2
- NYHBQMYGNKIUIF-UUOKFMHZSA-N Guanosine Chemical compound C1=NC=2C(=O)NC(N)=NC=2N1[C@@H]1O[C@H](CO)[C@@H](O)[C@H]1O NYHBQMYGNKIUIF-UUOKFMHZSA-N 0.000 description 2
- 102000008394 Immunoglobulin Fragments Human genes 0.000 description 2
- 108010021625 Immunoglobulin Fragments Proteins 0.000 description 2
- 108091092724 Noncoding DNA Proteins 0.000 description 2
- 241000233855 Orchidaceae Species 0.000 description 2
- 108091028664 Ribonucleotide Proteins 0.000 description 2
- ISAKRJDGNUQOIC-UHFFFAOYSA-N Uracil Chemical compound O=C1C=CNC(=O)N1 ISAKRJDGNUQOIC-UHFFFAOYSA-N 0.000 description 2
- 229960000643 adenine Drugs 0.000 description 2
- 229960005305 adenosine Drugs 0.000 description 2
- IQFYYKKMVGJFEH-UHFFFAOYSA-N beta-L-thymidine Natural products O=C1NC(=O)C(C)=CN1C1OC(CO)C(O)C1 IQFYYKKMVGJFEH-UHFFFAOYSA-N 0.000 description 2
- 239000013060 biological fluid Substances 0.000 description 2
- 239000001058 brown pigment Substances 0.000 description 2
- 239000006227 byproduct Substances 0.000 description 2
- 210000004899 c-terminal region Anatomy 0.000 description 2
- 238000005251 capillar electrophoresis Methods 0.000 description 2
- 210000000349 chromosome Anatomy 0.000 description 2
- 239000003086 colorant Substances 0.000 description 2
- 239000005547 deoxyribonucleotide Substances 0.000 description 2
- 125000002637 deoxyribonucleotide group Chemical group 0.000 description 2
- 230000000694 effects Effects 0.000 description 2
- 238000001962 electrophoresis Methods 0.000 description 2
- 238000004374 forensic analysis Methods 0.000 description 2
- 239000008187 granular material Substances 0.000 description 2
- 210000003780 hair follicle Anatomy 0.000 description 2
- 238000002595 magnetic resonance imaging Methods 0.000 description 2
- 238000004519 manufacturing process Methods 0.000 description 2
- 210000002780 melanosome Anatomy 0.000 description 2
- 108020004999 messenger RNA Proteins 0.000 description 2
- 238000013508 migration Methods 0.000 description 2
- 230000005012 migration Effects 0.000 description 2
- 210000000056 organ Anatomy 0.000 description 2
- 125000002924 primary amino group Chemical group [H]N([H])* 0.000 description 2
- 238000009790 rate-determining step (RDS) Methods 0.000 description 2
- 238000011160 research Methods 0.000 description 2
- 239000002336 ribonucleotide Substances 0.000 description 2
- 125000002652 ribonucleotide group Chemical group 0.000 description 2
- 210000003296 saliva Anatomy 0.000 description 2
- 210000001082 somatic cell Anatomy 0.000 description 2
- 229940104230 thymidine Drugs 0.000 description 2
- RWQNBRDOKXIBIV-UHFFFAOYSA-N thymine Chemical compound CC1=CNC(=O)NC1=O RWQNBRDOKXIBIV-UHFFFAOYSA-N 0.000 description 2
- 230000032258 transport Effects 0.000 description 2
- JLEXUIVKURIPFI-UHFFFAOYSA-N tris phosphate Chemical compound OP(O)(O)=O.OCC(N)(CO)CO JLEXUIVKURIPFI-UHFFFAOYSA-N 0.000 description 2
- ASWBNKHCZGQVJV-UHFFFAOYSA-N (3-hexadecanoyloxy-2-hydroxypropyl) 2-(trimethylazaniumyl)ethyl phosphate Chemical compound CCCCCCCCCCCCCCCC(=O)OCC(O)COP([O-])(=O)OCC[N+](C)(C)C ASWBNKHCZGQVJV-UHFFFAOYSA-N 0.000 description 1
- UHDGCWIWMRVCDJ-UHFFFAOYSA-N 1-beta-D-Xylofuranosyl-NH-Cytosine Natural products O=C1N=C(N)C=CN1C1C(O)C(O)C(CO)O1 UHDGCWIWMRVCDJ-UHFFFAOYSA-N 0.000 description 1
- UFBJCMHMOXMLKC-UHFFFAOYSA-N 2,4-dinitrophenol Chemical compound OC1=CC=C([N+]([O-])=O)C=C1[N+]([O-])=O UFBJCMHMOXMLKC-UHFFFAOYSA-N 0.000 description 1
- 101150104892 AHR gene Proteins 0.000 description 1
- 101150046883 Ap3b1 gene Proteins 0.000 description 1
- 102100032388 Apical junction component 1 homolog Human genes 0.000 description 1
- 241000271566 Aves Species 0.000 description 1
- 101100434786 Bacillus sp amiE gene Proteins 0.000 description 1
- 201000004569 Blindness Diseases 0.000 description 1
- 101150053096 CYP2C9 gene Proteins 0.000 description 1
- 101150010738 CYP2D6 gene Proteins 0.000 description 1
- 101150022946 CYP3 gene Proteins 0.000 description 1
- 101150116544 CYP3A4 gene Proteins 0.000 description 1
- 241000282836 Camelus dromedarius Species 0.000 description 1
- 241001070941 Castanea Species 0.000 description 1
- 235000014036 Castanea Nutrition 0.000 description 1
- 208000002177 Cataract Diseases 0.000 description 1
- 241000700199 Cavia porcellus Species 0.000 description 1
- 102100029057 Coagulation factor XIII A chain Human genes 0.000 description 1
- 241000186216 Corynebacterium Species 0.000 description 1
- MIKUYHXYGGJMLM-GIMIYPNGSA-N Crotonoside Natural products C1=NC2=C(N)NC(=O)N=C2N1[C@H]1O[C@@H](CO)[C@H](O)[C@@H]1O MIKUYHXYGGJMLM-GIMIYPNGSA-N 0.000 description 1
- UHDGCWIWMRVCDJ-PSQAKQOGSA-N Cytidine Natural products O=C1N=C(N)C=CN1[C@@H]1[C@@H](O)[C@@H](O)[C@H](CO)O1 UHDGCWIWMRVCDJ-PSQAKQOGSA-N 0.000 description 1
- NYHBQMYGNKIUIF-UHFFFAOYSA-N D-guanosine Natural products C1=2NC(N)=NC(=O)C=2N=CN1C1OC(CO)C(O)C1O NYHBQMYGNKIUIF-UHFFFAOYSA-N 0.000 description 1
- HMFHBZSHGGEWLO-SOOFDHNKSA-N D-ribofuranose Chemical compound OC[C@H]1OC(O)[C@H](O)[C@@H]1O HMFHBZSHGGEWLO-SOOFDHNKSA-N 0.000 description 1
- 230000004544 DNA amplification Effects 0.000 description 1
- 101100137368 Dictyostelium discoideum cypD gene Proteins 0.000 description 1
- AHMIDUVKSGCHAU-UHFFFAOYSA-N Dopaquinone Natural products OC(=O)C(N)CC1=CC(=O)C(=O)C=C1 AHMIDUVKSGCHAU-UHFFFAOYSA-N 0.000 description 1
- 241000283086 Equidae Species 0.000 description 1
- 241000283074 Equus asinus Species 0.000 description 1
- 101150095928 F2rl1 gene Proteins 0.000 description 1
- 241000282326 Felis catus Species 0.000 description 1
- 241000287828 Gallus gallus Species 0.000 description 1
- 101000797924 Homo sapiens Apical junction component 1 homolog Proteins 0.000 description 1
- 101000918352 Homo sapiens Coagulation factor XIII A chain Proteins 0.000 description 1
- 208000003367 Hypopigmentation Diseases 0.000 description 1
- 102000001706 Immunoglobulin Fab Fragments Human genes 0.000 description 1
- 108010054477 Immunoglobulin Fab Fragments Proteins 0.000 description 1
- 241000344726 Iris spuria Species 0.000 description 1
- WTDRDQBEARUVNC-UHFFFAOYSA-N L-Dopa Natural products OC(=O)C(N)CC1=CC=C(O)C(O)=C1 WTDRDQBEARUVNC-UHFFFAOYSA-N 0.000 description 1
- AHMIDUVKSGCHAU-LURJTMIESA-N L-dopaquinone Chemical compound [O-]C(=O)[C@@H]([NH3+])CC1=CC(=O)C(=O)C=C1 AHMIDUVKSGCHAU-LURJTMIESA-N 0.000 description 1
- OUYCCCASQSFEME-QMMMGPOBSA-N L-tyrosine Chemical compound OC(=O)[C@@H](N)CC1=CC=C(O)C=C1 OUYCCCASQSFEME-QMMMGPOBSA-N 0.000 description 1
- 241000124008 Mammalia Species 0.000 description 1
- 102000004378 Melanocortin Receptors Human genes 0.000 description 1
- 108090000950 Melanocortin Receptors Proteins 0.000 description 1
- 241001529936 Murinae Species 0.000 description 1
- 101150090249 Myo5a gene Proteins 0.000 description 1
- 101150009380 PPIF gene Proteins 0.000 description 1
- 241000237988 Patellidae Species 0.000 description 1
- 241001494479 Pecora Species 0.000 description 1
- 102100034943 Peptidyl-prolyl cis-trans isomerase F, mitochondrial Human genes 0.000 description 1
- 241000320126 Pseudomugilidae Species 0.000 description 1
- 101150007276 Rab27a gene Proteins 0.000 description 1
- 108020004511 Recombinant DNA Proteins 0.000 description 1
- PYMYPHUHKUWMLA-LMVFSUKVSA-N Ribose Natural products OC[C@@H](O)[C@@H](O)[C@@H](O)C=O PYMYPHUHKUWMLA-LMVFSUKVSA-N 0.000 description 1
- 101100222691 Saccharomyces cerevisiae (strain ATCC 204508 / S288c) CPR3 gene Proteins 0.000 description 1
- 101100276454 Saccharomyces cerevisiae (strain ATCC 204508 / S288c) CYC7 gene Proteins 0.000 description 1
- 210000001744 T-lymphocyte Anatomy 0.000 description 1
- 101710097311 Tyrosinase-like protein Proteins 0.000 description 1
- 239000013543 active substance Substances 0.000 description 1
- HMFHBZSHGGEWLO-UHFFFAOYSA-N alpha-D-Furanose-Ribose Natural products OCC1OC(O)C(O)C1O HMFHBZSHGGEWLO-UHFFFAOYSA-N 0.000 description 1
- WNROFYMDJYEPJX-UHFFFAOYSA-K aluminium hydroxide Chemical compound [OH-].[OH-].[OH-].[Al+3] WNROFYMDJYEPJX-UHFFFAOYSA-K 0.000 description 1
- 101150011965 ami gene Proteins 0.000 description 1
- 230000004888 barrier function Effects 0.000 description 1
- 230000009286 beneficial effect Effects 0.000 description 1
- 239000012620 biological material Substances 0.000 description 1
- 230000005540 biological transmission Effects 0.000 description 1
- 239000000872 buffer Substances 0.000 description 1
- 238000004113 cell culture Methods 0.000 description 1
- 230000001413 cellular effect Effects 0.000 description 1
- 230000033077 cellular process Effects 0.000 description 1
- 238000002144 chemical decomposition reaction Methods 0.000 description 1
- 210000003764 chromatophore Anatomy 0.000 description 1
- 238000007398 colorimetric assay Methods 0.000 description 1
- 239000002131 composite material Substances 0.000 description 1
- 238000011840 criminal investigation Methods 0.000 description 1
- 101150055214 cyp1a1 gene Proteins 0.000 description 1
- 238000012217 deletion Methods 0.000 description 1
- 230000037430 deletion Effects 0.000 description 1
- 238000013461 design Methods 0.000 description 1
- 238000001514 detection method Methods 0.000 description 1
- 238000011161 development Methods 0.000 description 1
- 230000018109 developmental process Effects 0.000 description 1
- 238000010586 diagram Methods 0.000 description 1
- 238000000502 dialysis Methods 0.000 description 1
- MHUWZNTUIIFHAS-CLFAGFIQSA-N dioleoyl phosphatidic acid Chemical compound CCCCCCCC\C=C/CCCCCCCC(=O)OCC(COP(O)(O)=O)OC(=O)CCCCCCC\C=C/CCCCCCCC MHUWZNTUIIFHAS-CLFAGFIQSA-N 0.000 description 1
- 210000001840 diploid cell Anatomy 0.000 description 1
- 201000010099 disease Diseases 0.000 description 1
- 208000037265 diseases, disorders, signs and symptoms Diseases 0.000 description 1
- 238000002224 dissection Methods 0.000 description 1
- 238000010494 dissociation reaction Methods 0.000 description 1
- 230000005593 dissociations Effects 0.000 description 1
- 210000002257 embryonic structure Anatomy 0.000 description 1
- 239000000839 emulsion Substances 0.000 description 1
- 238000006911 enzymatic reaction Methods 0.000 description 1
- 210000002615 epidermis Anatomy 0.000 description 1
- 230000002922 epistatic effect Effects 0.000 description 1
- 238000002474 experimental method Methods 0.000 description 1
- 210000004905 finger nail Anatomy 0.000 description 1
- 239000012530 fluid Substances 0.000 description 1
- 238000002875 fluorescence polarization Methods 0.000 description 1
- 239000000499 gel Substances 0.000 description 1
- 238000001502 gel electrophoresis Methods 0.000 description 1
- 238000003205 genotyping method Methods 0.000 description 1
- 229940029575 guanosine Drugs 0.000 description 1
- 210000003783 haploid cell Anatomy 0.000 description 1
- 108060003552 hemocyanin Proteins 0.000 description 1
- 230000033444 hydroxylation Effects 0.000 description 1
- 238000005805 hydroxylation reaction Methods 0.000 description 1
- 230000003425 hypopigmentation Effects 0.000 description 1
- 230000028993 immune response Effects 0.000 description 1
- 238000002513 implantation Methods 0.000 description 1
- 238000000126 in silico method Methods 0.000 description 1
- 229910052500 inorganic mineral Inorganic materials 0.000 description 1
- 238000003780 insertion Methods 0.000 description 1
- 230000037431 insertion Effects 0.000 description 1
- 238000011835 investigation Methods 0.000 description 1
- 238000002372 labelling Methods 0.000 description 1
- 230000003902 lesion Effects 0.000 description 1
- 229960004502 levodopa Drugs 0.000 description 1
- 230000004777 loss-of-function mutation Effects 0.000 description 1
- 210000004962 mammalian cell Anatomy 0.000 description 1
- 238000004949 mass spectrometry Methods 0.000 description 1
- 239000000463 material Substances 0.000 description 1
- 230000008774 maternal effect Effects 0.000 description 1
- 101150091534 mauC gene Proteins 0.000 description 1
- 230000001404 mediated effect Effects 0.000 description 1
- 230000008099 melanin synthesis Effects 0.000 description 1
- 201000001441 melanoma Diseases 0.000 description 1
- 239000011707 mineral Substances 0.000 description 1
- 238000010369 molecular cloning Methods 0.000 description 1
- 230000000869 mutational effect Effects 0.000 description 1
- 230000001293 nucleolytic effect Effects 0.000 description 1
- 239000002777 nucleoside Substances 0.000 description 1
- 150000003833 nucleoside derivatives Chemical class 0.000 description 1
- 230000003647 oxidation Effects 0.000 description 1
- 238000007254 oxidation reaction Methods 0.000 description 1
- 230000008775 paternal effect Effects 0.000 description 1
- 238000002823 phage display Methods 0.000 description 1
- 230000004962 physiological condition Effects 0.000 description 1
- 230000004983 pleiotropic effect Effects 0.000 description 1
- 229920001983 poloxamer Polymers 0.000 description 1
- 229920000447 polyanionic polymer Polymers 0.000 description 1
- 229920000642 polymer Polymers 0.000 description 1
- 229920005862 polyol Polymers 0.000 description 1
- 150000003077 polyols Chemical class 0.000 description 1
- 230000008569 process Effects 0.000 description 1
- 230000005180 public health Effects 0.000 description 1
- 230000009467 reduction Effects 0.000 description 1
- 230000004044 response Effects 0.000 description 1
- 238000012216 screening Methods 0.000 description 1
- 210000004927 skin cell Anatomy 0.000 description 1
- 239000002689 soil Substances 0.000 description 1
- 239000007790 solid phase Substances 0.000 description 1
- 238000005728 strengthening Methods 0.000 description 1
- 238000002198 surface plasmon resonance spectroscopy Methods 0.000 description 1
- 238000012956 testing procedure Methods 0.000 description 1
- 229940113082 thymine Drugs 0.000 description 1
- 239000003104 tissue culture media Substances 0.000 description 1
- OIASAVWSBWJWBR-UKTHLTGXSA-N trans-2-[3-(4-tert-butylphenyl)-2-methyl-2-propenylidene]malononitrile Chemical compound N#CC(C#N)=CC(/C)=C/C1=CC=C(C(C)(C)C)C=C1 OIASAVWSBWJWBR-UKTHLTGXSA-N 0.000 description 1
- OUYCCCASQSFEME-UHFFFAOYSA-N tyrosine Natural products OC(=O)C(N)CC1=CC=C(O)C=C1 OUYCCCASQSFEME-UHFFFAOYSA-N 0.000 description 1
- 229940035893 uracil Drugs 0.000 description 1
- 238000005406 washing Methods 0.000 description 1
Classifications
-
- C—CHEMISTRY; METALLURGY
- C12—BIOCHEMISTRY; BEER; SPIRITS; WINE; VINEGAR; MICROBIOLOGY; ENZYMOLOGY; MUTATION OR GENETIC ENGINEERING
- C12Q—MEASURING OR TESTING PROCESSES INVOLVING ENZYMES, NUCLEIC ACIDS OR MICROORGANISMS; COMPOSITIONS OR TEST PAPERS THEREFOR; PROCESSES OF PREPARING SUCH COMPOSITIONS; CONDITION-RESPONSIVE CONTROL IN MICROBIOLOGICAL OR ENZYMOLOGICAL PROCESSES
- C12Q1/00—Measuring or testing processes involving enzymes, nucleic acids or microorganisms; Compositions therefor; Processes of preparing such compositions
- C12Q1/68—Measuring or testing processes involving enzymes, nucleic acids or microorganisms; Compositions therefor; Processes of preparing such compositions involving nucleic acids
- C12Q1/6876—Nucleic acid products used in the analysis of nucleic acids, e.g. primers or probes
- C12Q1/6883—Nucleic acid products used in the analysis of nucleic acids, e.g. primers or probes for diseases caused by alterations of genetic material
-
- C—CHEMISTRY; METALLURGY
- C12—BIOCHEMISTRY; BEER; SPIRITS; WINE; VINEGAR; MICROBIOLOGY; ENZYMOLOGY; MUTATION OR GENETIC ENGINEERING
- C12Q—MEASURING OR TESTING PROCESSES INVOLVING ENZYMES, NUCLEIC ACIDS OR MICROORGANISMS; COMPOSITIONS OR TEST PAPERS THEREFOR; PROCESSES OF PREPARING SUCH COMPOSITIONS; CONDITION-RESPONSIVE CONTROL IN MICROBIOLOGICAL OR ENZYMOLOGICAL PROCESSES
- C12Q2600/00—Oligonucleotides characterized by their use
- C12Q2600/156—Polymorphic or mutational markers
-
- C—CHEMISTRY; METALLURGY
- C12—BIOCHEMISTRY; BEER; SPIRITS; WINE; VINEGAR; MICROBIOLOGY; ENZYMOLOGY; MUTATION OR GENETIC ENGINEERING
- C12Q—MEASURING OR TESTING PROCESSES INVOLVING ENZYMES, NUCLEIC ACIDS OR MICROORGANISMS; COMPOSITIONS OR TEST PAPERS THEREFOR; PROCESSES OF PREPARING SUCH COMPOSITIONS; CONDITION-RESPONSIVE CONTROL IN MICROBIOLOGICAL OR ENZYMOLOGICAL PROCESSES
- C12Q2600/00—Oligonucleotides characterized by their use
- C12Q2600/172—Haplotypes
Definitions
- the invention relates generally to methods for inferring a genetic pigmentation trait or race of an individual, and more specifically to methods of detecting single nucleotide polymorphisms and combinations thereof in a nucleic acid sample that provide an inference as to hair color or shade or to eye color or shade, or to race.
- Biotechnology has revolutionized the field of forensics. More specifically, the identification of polymorphic regions in human genomic DNA has provided a means to distinguish individuals based on the occurrence of a particular nucleotide at each of several positions in the genomic DNA that are known to contain polymorphisms. As such, analysis of DNA from an individual allows a genetic fingerprint or "bar code" to be constructed that, with the possible exception of identical twins, essentially is unique to one particular individual in the entire human population.
- DNA analysis has become a routine tool in criminal cases as evidence that can free or, in some cases, convict a suspect. Indeed, criminal courts, which do not yet allow the results of a lie detector test into evidence, admit DNA evidence into trial. In addition, DNA extracted from evidence that, in some cases, has been preserved for years after the crime was committed, has resulted in the convictions of many people being overturned.
- DNA fingerprinting analysis has greatly advanced the field of forensics, and has resulted in freedom of people, who, in some cases, were erroneously imprisoned for years, current DNA analysis methods are limited.
- DNA fingerprinting analysis only provides confirmatory evidence that a particular person is, or is not, the person from which the sample was derived.
- DNA in a semen sample can be used to obtain a specific "bar code"
- the bar code can only be compared to the bar code of a suspect in the crime. If the bar codes match, then it can reasonably be concluded that the person likely is the source ofthe semen. However, if there is not a match, the investigation must continue.
- the present invention relates to methods for inferring a genetic pigmentation trait of a human subject from a nucleic acid sample or a polypeptide sample ofthe subject, and compositions for practicing such methods.
- the methods ofthe invention are based, in part, on the identification of single nucleotide polymorphisms (SNPs) that, alone or in combination, allow an inference to be drawn as to a genetic pigmentation trait such as hair shade, hair color, eye shade, or eye color, and further allow an inference to be drawn as to race.
- SNPs single nucleotide polymorphisms
- compositions and methods of the invention are useful, for example, as forensic tools for obtaining information relating to physical characteristics of a potential crime victim or a perpetrator of a crime from a nucleic acid sample present at a crime scene, and as tools to assist in breeding domesticated animals, livestock, and the like to contain a pigmentation trait as desired.
- a method ofthe invention can be performed, for example, by identifying in a nucleic acid sample at least one pigmentation-related haplotype allele of at least one pigmentation gene, wherein the pigmentation gene is oculocutaneous albinism II (OCA2), agouti signaling protein (ASIP), tyrosinase-related protein 1 (TYRP1), tyrosinase (TYR), adaptor-related protein complex 3, beta 1 subunit (AP3B1) (also known as adaptin Bl protein (ADPl)), adaptin 3 D subunit 1 (AP3D1), dopachrome tautomerase (DCT), silver homolog (SILN), AIM- 1 protein (LOC51151), proopiomelanocortin (POMC), ocular albinism 1 (OA1), microphthalmia-associated transcription factor (MITF), myosin NA (MYO5 A), RAB27A, coagulation factor II (thrombin) receptor-like 1 (F2RL1), or
- the pigmentation gene includes at least one of OCA2, ASIP, TYRP1, TYR, SILN AP3B1, AP3D1, AP3D1, or DCT
- the pigmentation-related haplotype allele is a penetrant pigmentation-related haplotype allele, which allows an inference to be drawn as to a pigmentation trait of a subject from which the nucleic acid sample was obtained.
- the genetic pigmentation trait is eye shade
- a pigmentation-related haplotype allele can be identified in at least one ofthe OCA2, TYRP1, or DCT gene.
- a genetic pigmentation trait that can be inferred according to a method ofthe invention can be hair color, hair shade, eye color, or eye shade, or can be race.
- a pigmentation-related haplotype allele includes specific nucleotide occurrences of two or more S ⁇ Ps in a sequence of a pigmentation gene, particularly specific nucleotide occurrences of S ⁇ Ps, which can be present and the same or different in one or both alleles ofthe pigmentation gene.
- a penetrant pigmentation-related haplotype allele is one that, by itself, allows an inference to be drawn that a genetic pigmentation trait of a human subject is more likely than random.
- a latent pigmentation-related haplotype allele is one that, in the context of one or more penetrant, or other latent haplotypes, allows a stronger inference to be drawn than the inference due to the penetrant or other latent haplotype allele(s), alone.
- a sample useful for practicing a method ofthe invention can be any biological sample of a subject that contains nucleic acid molecules, including portions ofthe gene sequences to be examined, or corresponding encoded polypeptides, depending on the particular method.
- the sample can be a cell, tissue or organ sample, or can be a sample of a biological fluid such as semen, saliva, blood, and the like.
- a nucleic acid sample useful for practicing a method ofthe invention will depend, in part, on whether the SNPs ofthe haplotype to be identified are in coding regions or in non-coding regions.
- the nucleic acid sample generally is a deoxyribonucleic acid (DNA) sample, particularly genomic DNA or an amplification product thereof.
- DNA deoxyribonucleic acid
- RNA heteronuclear ribonucleic acid
- the nucleic acid sample can be DNA or RNA, or products derived therefrom, for example, amplification products.
- the methods of the invention generally are exemplified with respect to a nucleic acid sample, it will be recognized that particular haplotype alleles can be in coding regions of a gene and can result in polypeptides containing different amino acids at the positions corresponding to the SNPs due to non-degenerate codon changes. As such, in another aspect, the methods of the invention can be practiced using a sample containing polypeptides ofthe subject.
- the identification of at least one penetrant pigmentation- related haplotype allele of at least one pigmentation gene allows an inference to be drawn as to a genetic pigmentation trait of a human subject.
- An inference drawn according to a method ofthe invention can be strengthened by identifying a second, third, fourth or more penetrant pigmentation related haplotype alleles and/or one or more latent pigmentation related haplotype alleles in the same pigmentation gene or in one or more other pigmentation genes.
- a method ofthe invention can further include identifying in the nucleic acid sample at least a second penetrant pigmentation related haplotype allele ofthe first pigmentation gene and/or at least one penetrant pigmentation-related haplotype allele of at least a second pigmentation gene, for example, of an OCA2, ASIP, TYRPl, TYR, AP3B1, AP3D1, DCT, SILN, LOC51151, AMI, POMC, OA1, MITF, MYO5A, RAB27A, F2RL1, AP3D1, or melanocortin-1 receptor (MC1R) gene.
- a method of the invention allows an inference to be drawn that a nucleic acid sample is that of a human Caucasian having a particular eye color or eye shade.
- a method of inferring that a sample is that of a Caucasian having a particular eye color or eye shade is performed by identifying a penetrant pigmentation-related haplotype allele, including at least one of a) nucleotides ofthe DCT gene corresponding to a DCT-A haplotype, which includes nucleotide 609 of SEQ ID NO:l [702], nucleotide 501 of SEQ ID NO:2 [650], and nucleotide 256 of SEQ ID NO:3 [marker 675]; b) nucleotides ofthe MC1R gene corresponding to a melanocortin-1 receptor (MC1R)-A haplotype, which includes nucleotide 442 of SEQ ID NO:4 [217438],, nucleotide 619
- the pigmentation-related haplotype allele of MC1R-A can be CCC; the pigmentation-related haplotype allele of OCA2-A can be TTA, CCAG, or TTAG; the pigmentation-related haplotype allele of OCA2-B can be CAA, CGA, CAC, or CGC; the pigmentation-related haplotype allele of OCA2-C can be GGAA, TGAA, or TAAA; the pigmentation-related haplotype allele of OCA2-D can be AGG or GGG; the pigmentation-related haplotype allele of OCA2-E can be GCA; the pigmentation-related haplotype allele of TYRPl -B can be TC; and the pigmentation-related haplotype allele of DCT- A can be CTG or GTG.
- nucleic acid sample is that of a human Caucasian having a particular eye color or eye shade
- the latent pigmentation-related SNP is nucleotide 61 of SEQ ID NO:25 [marker 560], nucleotide 201 of SEQ ID NO:26 [marker 552], nucleotide 201 of SEQ ID NO:27 [marker 559], nucleotide 201 of SEQ ID NO:28 [marker 468], nucleotide 657 of SEQ ID NO:29 [marker 657], nucleotide 599 of SEQ ID NO:30 [marker 674], nucleotide 267 of SEQ ID NO:31 [marker 632], nucleotide 61 of SEQ ID NO:32 [marker 701], nucleotide 451 of SEQ JD
- nucleotide 217480 nucleotide 221 of SEQ ID NO:41 [marker 951497], nucleotide 660 of SEQ ID NO:42 [marker 217468], nucleotide 163 of SEQ ID NO:43 [marker 217473], nucleotide 364 of SEQ ID NO:44 [marker 217485], nucleotide 473 of SEQ ID NO:45 [marker 217486], nucleotide 314 of SEQ ID NO:46 [marker 869787], nucleotide 224 of SEQ ID NO:47 [marker 869745], nucleotide 169 of SEQ ID NO:48 [marker 886933], nucleotide 214 of SEQ ID NO:49 [marker 886937], or nucleotide 903 of SEQ ID NO:50; [886942], or a combination ofthe above listed pigmentation-related SNPs.
- the inference can be strengthened by further identifying in the nucleic acid sample at least one latent pigmentation-related haplotype allele of a pigmentation gene, wherein the latent pigmentation-related haplotype allele includes a) nucleotides ofthe ASIP gene corresponding to an ASIP- A haplotype, which include nucleotide 201 of SEQ ID NO:26 [marker 552], and nucleotide 201 of SEQ ID NO:28 [marker 468]; b) nucleotides ofthe DCT gene corresponding to a DCT-B haplotype, which include nucleotide 451 of SEQ ID NO:33 [marker 710], and nucleotide 657 of SEQ ID NO:29 [marker 657]; c) nucleotides ofthe SILN gene corresponding to a SILN-A haplotype, which includes nucleotide 61 of SEQ ID ⁇ O:35 [marker 656], and nucleotide 61
- the latent pigmentation-related haplotype allele of ASIP- A can be GT, AT; the latent pigmentation-related haplotype allele of DCT-B can be TA, TG; the latent pigmentation-related haplotype allele of SILV-A can be TC, TT; or CC the latent pigmentation-related haplotype allele of TYR-A can be GA, AA, or GG; and the latent pigmentation-related haplotype allele of TYRPl -A can be GTG, TTG, or GTT.
- a method of identifying a pigmentation related SNP, including a pigmentation related haplotype allele can be performed using any method useful for identifying a particular nucleotide at a specific position in a nucleotide sequence or, where the nucleotide sequence encodes an amino acid sequence, by identifying an amino acid encoded by a codon ofthe nucleotide sequence, provided the nucleotide occurrences ofthe SNP result in a codons that encode different amino acids.
- Particularly useful methods include those that are readily adaptable to a high throughput format, to a multiplex format, or to both.
- a method ofthe invention can further include applying information relating to the pigment-related haplotype alleles to a matrix created using a feature modeling algorithm.
- the feature modeling algorithm can be quadratic classifier or can perform a correspondence analysis.
- Methods for detecting a nucleotide change can utilize one or more oligonucleotide probes or primers, including, for example, an amplification primer pair, that selectively hybridize to a target polynucleotide, which contains one or more pigmentation-related SNP positions.
- Oligonucleotide probes useful in practicing a method ofthe invention can include, for example, an oligonucleotide that is complementary to and spans a portion ofthe target polynucleotide, including the position ofthe SNP, wherein the presence of a specific nucleotide at the position (i.e., the SNP) is detected by the presence or absence of selective hybridization ofthe probe.
- Such a method can further include contacting the target polynucleotide and hybridized oligonucleotide with an endonuclease, and detecting the presence or absence of a cleavage product ofthe probe, depending on whether the nucleotide occurrence at the SNP site is complementary to the corresponding nucleotide ofthe probe.
- a pair of probes that specifically hybridize upstream and adjacent and downstream and adjacent to the site ofthe SNP, wherein one ofthe probes includes a nucleotide complementary to a nucleotide occurrence ofthe SNP also can be used in an oligonucleotide ligation assay, wherein the presence or absence of a ligation product is indicative ofthe nucleotide occurrence at the SNP site.
- An oligonucleotide also can be useful as a primer, for example, for a primer extension reaction, wherein the product (or absence of a product) ofthe extension reaction is indicative ofthe nucleotide occurrence.
- a primer pair useful for amplifying a portion of the target polynucleotide including the SNP site can be useful, wherein the amplification product is examined to determine the nucleotide occurrence at the SNP site.
- nucleotide occurrence of a SNP is such that the nucleotide occurrence results in an amino acid change in an encoded polypeptide
- nucleotide occurrence can be identified indirectly by detecting the particular amino acid in the polypeptide.
- the method for determining the amino acid will depend, for example, on the structure ofthe polypeptide or on the position ofthe amino acid in the polypeptide.
- the polypeptide contains only a single occurrence of an amino acid encoded by the particular SNP, the polypeptide can be examined for the presence or absence ofthe amino acid.
- the amino acid is at or near the amino terminus or the carboxy terminus ofthe polypeptide
- simple sequencing ofthe terminal amino acids can be performed.
- the polypeptide can be treated with one or more enzymes and a peptide fragment containing the amino acid position of interest can be examined, for example, by sequencing the peptide, or by detecting a particular migration ofthe peptide following electrophoresis.
- the particular amino acid comprises an epitope ofthe polypeptide
- the specific binding, or absence thereof, of an antibody specific for the epitope can be detected.
- a method ofthe invention allows an inference to be drawn as to hair color or hair shade of a human subject by identifying in a nucleic acid sample ofthe subject a penetrant pigmentation-related haplotype allele in at least one pigmentation gene, for example, in at least one of OCA2, ASIP, TYRPl, or MC1R.
- an inference can be drawn as to the hair color or hair shade of a human by identifying in a nucleic sample from the human a penetrant pigmentation- related haplotype allele, including in at least one of a) nucleotides ofthe ASIP gene corresponding to an ASIP-B haplotype, which include nucleotide 202 of SEQ ID NO:27, [559], and nucleotide 61 of SEQ ID NO:25, [560]; b) nucleotides ofthe MC1R gene corresponding to an MC1R-A haplotype, which include nucleotide 442 of SEQ ID NO:4 [217438],, nucleotide 619 of SEQ ID NO:5 [217439], and, nucleotide 646 of SEQ ID NO: 6 [217441]; c) nucleotides ofthe OCA2 gene corresponding to an OCA2-G haplotype, which include nucleotide 418 of SEQ ID NO:
- the penetrant pigmentation-related haplotype allele can be a) the ASIP-B haplotype allele GA or AA; b) the MC1R-A haplotype allele CCC, CTC, TCC or CCT; c) the OCA2-G haplotype allele AGG or AGA; d) the OCA2-H haplotype allele AGT or ATT; e) the OCA2-I haplotype allele TG; f) the OCA2-J haplotype allele GA or AA; or g) the TYRPl -C haplotype allele AA or TA; or a combination thereof, including, for example, the ASIP-B haplotype, the MC1R-A haplotype, the OCA2-G haplotype, the OCA2-H haplotype, the OCA2-I haplotype, the OCA2-J haplotype, and the TYRPl -C haplotype.
- an inference as to hair color or hair shade can be strengthened by further identifying, in addition to the at least one penetrant pigmentation related haplotype, in the nucleic acid sample, at least one latent pigmentation-related SNP of a pigmentation gene or at least one latent pigmentation-related haplotype allele, or a combination thereof.
- a method ofthe invention allows an inference to be drawn as to the race of a human subject from a nucleic acid sample of the subject.
- a method can be performed, for example, by identifying in the nucleic acid sample, the nucleotide occurrence of at least one race-related single nucleotide polymorphism (SNP) of a race-related gene, whereby the nucleotide occurrence ofthe race-related SNP is associated with race.
- SNP race-related single nucleotide polymorphism
- the race-related gene can include at least one of OCA2, ASIP, CYP2D6, TYRPl, CYP2C9, CYP3A4, TYR, MC1R, AP3B1, AP3D1, AP3D1, DCT, SILN, ATM-1 protein (LOC51151), POMC, OA1, MITF, MYO5A, RAB27A, F2RL1, HMGCR, FDPS, AHR, or CYPIAI, or can be a combination of nucleotide occurrence of a race-related S ⁇ P in any two or more ofthe above-listed genes, including in all ofthe genes.
- a method of inferring the race of a human subject can be strengthened, for example, by identifying a nucleotide occurrence in each of at least two race-related S ⁇ Ps, and grouping the identified nucleotide occurrences ofthe race-related S ⁇ Ps into one or more race-related haplotype alleles, wherein the relationship ofthe haplotype allele(s) to race is known.
- the race-related haplotype can be a race-related haplotype such as a) nucleotides ofthe DCT gene corresponding to a DCT-A haplotype, which includes nucleotide 609 of SEQ ID ⁇ O:l [702], nucleotide 501 of SEQ ID NO:2 [650], and nucleotide 256 of SEQ ID NO:3 [marker 675]; b) nucleotides ofthe MC1R gene corresponding to an MC1R-A haplotype, which includes nucleotide 442 of SEQ ID NO:4 [217438], nucleotide 619 of SEQ ID NO:5 [217439], and nucleotide 646 of SEQ ID NO:6 [217441]; c) nucleotides ofthe OCA2 gene corresponding to an OCA2-A haplotype, which includes nucleotide 135 of SEQ ID NO:7 [217458], nucleotide 193 of S
- a race-related haplotype allele can include nucleotide occurrences for a) nucleotides of the ASIP gene corresponding to a ASIP-A haplotype, which includes nucleotide 201 of SEQ ID NO:26 [marker 552], and nucleotide 201 of SEQ ID NO:28 [marker 468]; b) nucleotides ofthe DCT gene corresponding to a DCT-B haplotype, which includes nucleotide 451 of SEQ ID NO:33 [marker 710], and nucleotide 657 of SEQ ID NO:29 [marker 657]; c) nucleotides ofthe SILN gene corresponding to a SILV-A haplotype, which includes nucleotide 61 of SEQ ID ⁇ O:35 [marker 656], and nucleo
- race-related haplotype alleles which include genotype alleles (i.e., alleles of diploid pairs of haplotypes), including, for example, a combination ofthe MC1R-A haplotype, the OCA2-A haplotype, the OCA2-B haplotype, the OCA2-C haplotype, the OCA2-D haplotype, the OCA2-E haplotype, the TYRPl-B haplotype, and the DCT-B haplotype; and the ASIP-A haplotype, the DCT-B haplotype, the SILN-A haplotype, the TYR-A haplotype, and the TYRPl -A haplotype.
- genotype alleles i.e., alleles of diploid pairs of haplotypes
- the combination can include MC1R-A haplotype allele CCC; OCA2-A haplotype allele TTAA, CCAG, or TTAG; OCA2-B haplotype allele CAA, CGA, CAC, or CGC; OCA2-C haplotype allele GGAA, TGAA, or TAAA; OCA2-D haplotype allele AGG or GGG; OCA2-E haplotype allele GCA; TYRPl-B haplotype allele TC; and DCT-B haplotype allele CTG, or GTG; and ASIP-A haplotype allele GT or AT; DCT-B haplotype allele TA or TG; SILN-A haplotype allele TT, TC, or CC; TYR-A haplotype allele GA, AA, GG; and TYRPl -A haplotype allele GTG, TTG, or GTT.
- a method for inferring race of a human subject can be performed by identifying a nucleotide occurrence in the sample for at least one race- related S ⁇ P from a race-related gene such as OCA2, ASIP, CYP2D6, TYRPl, CYP2C9, CYP3A4, TYR, MC1R, AP3B1, AP3D1, AP3D1, DCT, SILV, ATM-1 (LOC51151), POMC, OAl, MITF, MYO5A, RAB27A, F2RL1, HMGCR, FDPS, AHR, or CYP1 Al, whereby the nucleotide occurrence is associated with the race of the human subject.
- a race-related gene such as OCA2, ASIP, CYP2D6, TYRPl, CYP2C9, CYP3A4, TYR, MC1R, AP3B1, AP3D1, AP3D1, DCT, SILV, ATM-1
- the inference can be strengthened by further identifying in the nucleic acid sample at least one nucleotide occurrence for at least a second race-related S ⁇ P of at least a second race-related gene such as the OCA2, ASIP, TYRPl, TYR, AP3B1, AP3D1, AP3D1, DCT, SILV, LOC51151, POMC, OAl, MITF, MYO5A, RAB27A, F2RL1, MC1R, CYP2D6, CYP2C9, CYP3A4, AP3B1, HMGCR, FDPS, AHR, or CYP1A1 gene.
- a second race-related S ⁇ P of at least a second race-related gene such as the OCA2, ASIP, TYRPl, TYR, AP3B1, AP3D1, AP3D1, DCT, SILV, LOC51151, POMC, OAl, MITF, MYO5A, RAB27A
- the position ofthe nucleotide occurrence can be nucleotide 609 of SEQ ID ⁇ O:l [marker 702], nucleotide 501 of SEQ ID NO:2 [marker 650], nucleotide 256 of SEQ ID NO:3 [marker 675], nucleotide 442 of SEQ ID NO:4 [marker 217438], nucleotide 619 of SEQ ID NO:5 [marker 217439], nucleotide 646 of SEQ ID NO:6 [marker 217441]; nucleotide 135 of SEQ ID NO:7 [marker 217458], nucleotide 193 of SEQ ID NO:8 [marker 886894], nucleotide 228 of SEQ ID NO:9 [marker 886895], nucleotide 245 of SEQ ID NO: 10 [marker 886896], nucleotide 189 of SEQ ID NO: 11 [217452], nucleotide 573
- nucleotide 712060 nucleotide 795 of SEQ ID NO: 17 [marker 712064], nucleotide 535 of SEQ ID NO: 18 [marker 712054], nucleotide 554 of SEQ ID NO:19 [marker 712056], nucleotide 210 of SEQ ID NO:20 [marker 886892], nucleotide 225 of SEQ ID NO:21 [marker 217455], nucleotide 170 of SEQ ID NO:22 [marker 712061], nucleotide 210 of SEQ ID NO:20 [marker 886892], nucleotide 172 of SEQ ID NO:23 [marker
- the invention also relates to a method for inferring a genetic pigmentation trait of a human subject from a nucleic acid sample ofthe human subject by identifying a nucleotide occurrence in the sample for a pigmentation-related SNP from a pigmentation gene, provided the pigmentation gene is not the melanocortin-1 receptor (MC1R) gene.
- M1R melanocortin-1 receptor
- the method can be practiced by identifying a nucleotide occurrence in the sample for at least one pigmentation-related SNP from a pigmentation gene such as OCA2, ASIP, CYP2D6, TYRPl, CYP2C9, CYP3A4, TYR, MC1R, AP3B1, AP3D1, AP3D1, DCT, SILV, AJM-1 protein (LOC51151), POMC, OAl, MITF, MYO5A, RAB27A, F2RL1, HMGCR, FDPS, AHR, or
- a pigmentation gene such as OCA2, ASIP, CYP2D6, TYRPl, CYP2C9, CYP3A4, TYR, MC1R, AP3B1, AP3D1, AP3D1, DCT, SILV, AJM-1 protein (LOC51151), POMC, OAl, MITF, MYO5A, RAB27A, F2RL1,
- the method can further include identifying in the nucleic acid sample at least one nucleotide occurrence for at least a second pigmentation-related SNP of at least a second pigmentation gene such as OCA2, ASIP, TYRPl, TYR, AP3B1, AP3D1, AP3D1, DCT, SILV, LOC51151, POMC, OAl, MITF, MYO5A, RAB27A, F2RL1, or MC1R.
- the genetic pigmentation trait inferred according to a method ofthe invention can be hair color, hair shade, eye color, or eye shade, and further can be race.
- pigmentation gene can be the OCA2 gene, DCT gene, MC1R gene, or TYRPl gene, or any combination thereof.
- a SNP identified according to a method ofthe invention can be a SNP of a penetrant haplotype associated with eye color or eye shade, for example, a nucleotide occurrence such as nucleotide 609 of SEQ JD NO:l [marker 702], nucleotide 501 of SEQ ID NO:2 [marker 650], nucleotide 256 of SEQ ID NO:3 [marker 675], nucleotide 442 of SEQ ID NO:4 [marker 217438], nucleotide 619 of SEQ ID NO:5 [marker 217439], nucleotide 646 of SEQ ID NO:6 [marker 217441]; nucleotide 135 of SEQ ID NO:7 [marker 217458], nucleotide 193 of SEQ ID NO:8 [
- the SNP also can be a SNP of a latent haplotype associated with eye color or eye shade, for example, a nucleotide occurrence such as nucleotide 61 of SEQ ID NO:25 [marker 560], nucleotide 201 of SEQ JD NO:26 [marker 552], nucleotide 201 of SEQ JD NO:27 [marker 559], nucleotide 201 of SEQ JD NO:28 [marker 468], nucleotide 657 of SEQ ID NO:29 [marker 657], nucleotide 599 of SEQ ID NO:30 [marker 674], nucleotide 267 of SEQ ID NO:31 [marker 632], nucleotide 61 of SEQ ID NO:32 [marker 701], nucleotide 451 of SEQ JD NO:33 [marker 710]; nucleotide 326 of SEQ ID NO:34 [marker 217456], nucleotide 61 of
- nucleotide 903 of SEQ ID NO:50 [marker 886942], or any combination thereof.
- a SNP identified according to a method ofthe invention can be a SNP of a penetrant haplotype associated with hair color or hair shade, for example, a nucleotide occurrence such as nucleotide 201 of SEQ ID NO:27 [marker 559], nucleotide 61 of SEQ ID NO:25 [marker 560], nucleotide 442 of SEQ ID NO:4 [marker 217438], nucleotide 619 of SEQ ID NO:5 [marker 217439], nucleotide 646 of SEQ JD NO:6 [marker 217441], nucleotide 418 of SEQ ID NO:16 [marker 712060], nucleotide 210 of SEQ ID NO:20 [marker 886892], nucleotide 245 of SEQ ID NO: 10 [marker 886896], nucleotide 225 of SEQ ID NO:21 [marker 217455], nucleo
- a method for inferring a genetic pigmentation trait of a human subject from a nucleic acid sample ofthe human subject by identifying a nucleotide occurrence in the sample for a pigmentation-related SNP from a pigmentation gene can further include grouping the nucleotide occurrences ofthe pigmentation-related SNPs for a gene into one or more haplotype alleles.
- the identified haplotype alleles then can be compared to known haplotype alleles such that, when the relationship ofthe known haplotype alleles to the genetic pigmentation trait is known, an inference can be drawn as to the genetic pigmentation trait ofthe subject providing the nucleic acid sample. Identification of the nucleotide occurrence can be performed using any method suitable for examining the particular sample.
- the identification can be performed by contacting polynucleotides in (or derived from) the sample with a specific binding pair member that selectively hybridizes to a region ofthe polynucleotide that includes the pigmentation-related SNP, under conditions wherein the binding pair member specifically binds at or near the pigmentation-related SNP.
- the binding pair member can be any molecule that specifically binds or associates with the target polynucleotide, including, for example, an antibody or an oligonucleotide.
- the invention also relates to a method for classifying an individual as being a member of a group sharing a common characteristic.
- a method for classifying an individual can be performed, for example, by identifying a nucleotide occurrence of a SNP in a polynucleotide ofthe individual, wherein the SNP corresponds to nucleotide 473 of SEQ JD NO:45 [marker 217486], nucleotide 224 of SEQ JD NO:47 [marker 869745], nucleotide 314 of SEQ ID NO:46 [marker 869787], nucleotide 210 of SEQ ID NO:20 [marker 886892], nucleotide 228 of SEQ ID NO:9 [marker 886895], nucleotide 245 of SEQ ID NO: 10 [marker 886896], nucleotide 169 of -SEQ ID NO:48 [marker 886933], nucleotide 214 of SEQ JD
- the invention further relates to a method for detecting a nucleotide occurrence for a SNP of a human pigmentation gene.
- a method for detecting a nucleotide occurrence for a SNP of a human pigmentation gene can be performed, for example, by contacting a sample containing a polynucleotide with a specific binding pair member, which can specifically bind at or near a sequence ofthe polynucleotide suspected of being polymorphic, including a nucleotide occurrence corresponding to nucleotide 473 of SEQ ID NO:45 [marker 217486], nucleotide 224 of SEQ ID NO:47 [marker 869745], nucleotide 314 of SEQ ID NO:46 [marker 869787], nucleotide 210 of SEQ ID NO:20 [marker 886892], nucleotide 228 of SEQ ID NO:9 [marker 886895], nucleotide 245 of SEQ
- the invention also relates to an isolated primer pair, which can be useful for determining a nucleotide occurrence of a SNP in a polynucleotide, wherein the primer pair includes a forward primer that can selectively bind to the polynucleotide upstream ofthe SNP position on one strand, and a reverse primer that can selectively bind to the polynucleotide upstream ofthe SNP position on a complementary strand, wherein the SNP position corresponds to nucleotide 473 of SEQ ID NO:45 [marker 217486], nucleotide 224 of SEQ ID NO:47 [marker 869745], nucleotide 314 of SEQ ID NO:46 [marker 869787], nucleotide 210 of SEQ ID NO:20 [marker 886892], nucleotide 228 of SEQ ID NO:9 [marker 886895], nucleotide 245 of SEQ ID NO: 10 [marker 886896],
- the invention relates to an isolated specific binding pair member, which can be useful for determining a nucleotide occurrence of a SNP in a target polynucleotide, particularly a region of a pigmentation gene or xenobiotic gene including a SNP, as disclosed herein.
- a specific binding pair member of the invention can be an oligonucleotide or an antibody that, under the appropriate conditions, selectively binds to a target polynucleotide at or near nucleotide 473 of SEQ ID NO:45 [marker 217486], nucleotide 224 of SEQ ID NO:47 [marker 869745], nucleotide 314 of SEQ ID NO:46 [marker 869787], nucleotide 210 of SEQ JD NO:20 [marker 886892], nucleotide 228 of SEQ ID NO:9 [marker 886895], nucleotide 245 of SEQ JD NO:10 [marker 886896], nucleotide 169 of SEQ ID NO:48 [marker 886933], nucleotide 214 of SEQ ID NO:49 [marker 886937], nucleotide 245 of SEQ ID NO:13 [marker 886994], nucleotide
- a specific binding pair member ofthe invention can be an oligonucleotide probe, which can selectively hybridize to a target polynucleotide and can, but need not, be a substrate for a primer extension reaction, or an anti-nucleic acid antibody.
- the specific binding pair member can be selected such that it selectively binds to any portion of a target polynucleotide, as desired, for example, to a portion of a target polynucleotide containing a SNP as the terminal nucleotide.
- the invention also relates isolated polynucleotides comprising a portion of a gene including a SNP associated with a genetic pigmentation trait, wherein the isolated polynucleotide is at least about 30 nucleotides in length (for example, about 40, 50, 100, 200, 250, or 500 nucleotides in length).
- Polynucleotides ofthe invention are exemplified by a polynucleotide of at least about 30 nucleotides ofthe human OCA2 gene, and including at least a thymidine residue at a nucleotide corresponding to nucleotide 193 of SEQ ID NO:8 [marker 886894], a guanidine residue at a nucleotide corresponding to nucleotide 228 of SEQ ID NO:9 [marker 886895], a cytidine residue at a nucleotide corresponding to nucleotide 210 of SEQ ID NO:20 [marker 886892], a thymidine residue at a nucleotide corresponding to nucleotide 245 of SEQ JD NO: 10 [marker 886896], an adenosine residue at a nucleotide corresponding to nucleotide 245 of SEQ ID NO:13 [marker 886994], or
- nucleotides in length also can be, for example, an isolated segment of an DCT gene, wherein nucleotides CTG or GTG occur at positions corresponding to nucleotide 609 of SEQ ID NO:l [702], nucleotide 501 of SEQ ID NO:2 [marker 650], and nucleotide 256 of SEQ JD NO:3 [675], respectively; or an isolated segment of an MCIR gene, wherein nucleotides CCC occur at positions corresponding to nucleotide 442 of SEQ ID NO:4 [217438], nucleotide 619 of SEQ JD NO:5 [217439], and nucleotide 646 of SEQ ID NO:6 [217441], respectively; or an isolated segment of an OCA2 gene, wherein nucleotides TTAA, CCAG, or TTAG occur at positions corresponding to nucleotide 135 of SEQ ID NO:7 [217458], nucleotide 193 of SEQ
- an isolated polynucleotide ofthe invention is derived from the OCA2 gene and includes comprises any combination of the nucleotides TTAA, CCAG, or TTAG at positions corresponding to nucleotide 135 of SEQ ID NO:7 [217458], nucleotide 193 of SEQ JD NO:8 [886894], nucleotide 228 of SEQ ID NO:9 [886895], and nucleotide 245 of SEQ JD NO:10 [886896], respectively; nucleotides CAA, CGA, CAC, or CGC at positions corresponding to position Y of SEQ JD NO:ll [217452], position 573 of SEQ ID NO:12 [712052], and position 245 of SEQ ID NO: 13 [886994], respectively; nucleotides GGAA, TGAA, and TAAA at positions corresponding to nucleotide 643 of SEQ JD NO:14 [712057], nucleotide 539
- An isolated polynucleotide ofthe invention also can be, for example, an isolated segment of an ASJP gene, wherein nucleotides GT or AT occur at positions corresponding to nucleotide 201 of SEQ ID NO:26 [552], and nucleotide 201 of SEQ ID NO:28 [468], respectively; an isolated segment of a DCT gene, wherein nucleotides TA or TG occur at positions corresponding to nucleotide 451 of SEQ JD NO:33 [710], and nucleotide 356 of SEQ ID NO:29 [657], respectively; an isolated segment of a SILV gene wherein nucleotides TC, TT, or CC occur at positions corresponding to nucleotide 61 of SEQ ID NO:35 [656], and nucleotide 61 of SEQ JD NO:36 [662], respectively; an isolated segment of a TYR gene, wherein nucleotides GA, AA, or GG occur at positions corresponding
- an isolated polynucleotide ofthe invention can be, for example, an isolated segment of an ASJP gene, wherein nucleotides GA or AA occur at positions corresponding to nucleotide 201 of SEQ JD NO:27 [559], and nucleotide 61 of SEQ ID NO:25 [560], respectively; an isolated segment of a MCIR gene, wherein nucleotides CCC, CTC, TCC, or CCT occur at positions corresponding to nucleotide 442 of SEQ ID NO:4 [217438], nucleotide 619 of SEQ JD NO:5 [217439], and nucleotide 646 of SEQ ID NO:6 [217441], respectively; an isolated segment of an OCA2 gene, wherein nucleotides AGG or AGA occur at positions corresponding to nucleotide 418 of SEQ ID NO:16 [712060], nucleotide 210 of SEQ JD NO:20 [886892], and nucle
- an isolated polynucleotide of the invention is derived from the OCA2 gene and includes comprises any combination ofthe nucleotides
- AGG or AGA occur at positions corresponding to nucleotide 418 of SEQ ID NO: 16 [712060], nucleotide 210 of SEQ ID NO:20 [886892], and nucleotide 245 of SEQ ID NO: 10 [886896], respectively; an isolated segment of an OCA2 gene, wherein nucleotides AGT or ATT occur at positions corresponding to nucleotide 225 of SEQ ID NO:21 [217455], nucleotide 643 of SEQ JD NO:14 [712057], and nucleotide 193 of SEQ JD NO:8 [886894], respectively; an isolated segment of an OCA2 gene, wherein nucleotides TG occur at positions corresponding to nucleotide 135 of SEQ JD NO:7 [217458], and nucleotide 554 of SEQ ID NO:19 [712056], respectively; an isolated segment of an OCA2 gene, wherein nucleotides GA or AA occur at positions corresponding
- kits which can be used, for example, to perform a method ofthe invention.
- the invention provides a kit for identifying haplotype alleles of pigmentation-related SNPs.
- a kit can contain, for example, an oligonucleotide probe, primer, or primer pair ofthe invention, such oligonucleotides being useful, for example, to identify a SNP or haplotype allele as disclosed herein; or can contain one or more polynucleotides corresponding to a portion of a pigmentation, xenobiotic, or other relevant gene containing one or more nucleotide occurrences associated with a genetic pigmentation trait, with race, or with a combination thereof, such polynucleotide being useful, for example, as a standard (control) that can be examined in parallel with a test sample.
- a kit ofthe invention can contain, for example, reagents for performing a method ofthe invention, including, for example, one or more detectable labels, which can be used to label a probe or primer or can be incorporated into a product generated using the probe or primer (e.g., an amplification product); one or more polymerases, which can be useful for a method that includes a primer extension or amplification procedure, or other enzyme or enzymes (e.g., a ligase or an endonuclease), which can be useful for ' performing an oligonucleotide ligation assay or a mismatch cleavage assay; and/or one or more buffers or other reagents that are necessary to or can facilitate performing a method ofthe invention.
- one or more detectable labels which can be used to label a probe or primer or can be incorporated into a product generated using the probe or primer (e.g., an amplification product)
- polymerases which can be useful for a method
- a kit ofthe invention includes one or more primer pairs of the invention, such a kit being useful for performing an amplification reaction such as a polymerase chain reaction (PCR).
- a kit also can contain, for example, one or reagents for amplifying a polynucleotide using a primer pair ofthe kit.
- the primer pair(s) can be selected, for example, such that they can be used to determine the nucleotide occurrence of a pigmentation-related SNP, wherein a forward primer of a primer pair selectively hybridizes to a sequence ofthe target polynucleotide upstream ofthe SNP position on one strand, and the reverse primer ofthe primer pair selectively hybridizes to a sequence ofthe target polynucleotide upstream ofthe SNP position on a complementary strand.
- a kit ofthe invention provides a plurality of oligonucleotides ofthe invention, including one or more oligonucleotide probes or one or more primers, including forward and/or reverse primers, or a combination of such probes and primers or primer pairs.
- a kit provides a convenient source for selecting ⁇ robe(s) and/or primer(s) useful for identifying one or more SNPs or haplotype alleles as desired.
- Such a kit also can contain probes and/or primers that conveniently allow a method ofthe invention to be performed in a multiplex format.
- the invention also relates to a method for identifying a pigmentation-related
- Such a method can be performed, for example, by identifying a candidate SNP of a pigmentation gene or a xenobiotic metabolism gene; determining that the candidate SNP has a genotype class comprising alleles exhibiting a coherent inheritance pattern, and a minor allele frequency that is greater than 0.01 in at least one race, thereby identifying a validated SNP; and determining that the validated SNP exhibits significantly different genotype distributions and allele frequencies between individuals of different pigmentation phenotypes or racial classes, thereby identifying a pigmentation-related SNP.
- the invention relates to a method for identifying a race-related SNP.
- Such a method can be performed, for example, by identifying a candidate SNP of a pigmentation gene or a xenobiotic metabolism gene; determining that the SNP has a genotype class, a coherent pattern, and a minor allele frequency that is greater than 0.01 in at least one race, thereby identifying a validated SNP; and determining that the validated SNP exhibits significantly different genotype distributions and allele frequencies between racial classes, thereby identifying a race- related SNP.
- Either of such methods can further include, for example, using linear, quadratic, correspondence analysis or classification tree multivariate modeling to develop an abstract classifier incorporating one or more validated SNP or set of validated SNP that blindly generalizes to other individuals of known pigmentation or of known race, respectively.
- the power ofthe inference drawn according to the methods ofthe invention is increased by using a complex classifier function.
- the invention also relates to methods that draw an inference regarding a pigmentation trait or race of a subject using a classification function.
- a classification function applies nucleotide occurrence information identified for a SNP or set of SNPs such as one or preferably a combination of haplotype alleles, to a set of rules to draw an inference regarding a pigmentation trait or a subject's race.
- the classifier function includes applying the pigment-related haplotype alleles to a matrix created using a feature modeling algorithm.
- classification function is a linear or quadratic classifier or performs correspondence analysis.
- the invention includes a method for identifying a classifier function for inferring a pigmentation-trait of a subject.
- the method includes: i) identifying one or more candidate SNPs of one or more pigmentation genes that have a genotype class comprising alleles exhibiting a coherent inheritance pattern, and a minor allele frequency that is greater than 0.01 in at least one race, thereby identifying one or more validated SNPs; ii) determining that the one or more validated SNPs exhibits significantly different genotype distributions and allele frequencies between individuals of different pigmentation phenotypes or racial classes, and iii) Using linear, quadratic, correspondence analysis or classification tree multivariate modeling to develop an abstract classifier function incorporating one or more validated SNPs or combinations of validated SNPs that blindly generalizes to other individuals of known pigmentation, thereby identifying a pigmentation-related classification strategy.
- the invention includes a method for identifying a classifier function for inferring the race of a subject.
- the method includes: i) identifying one or more candidate SNPs of one or more race-related genes that have a genotype class comprising alleles exhibiting a coherent inheritance pattern, and a minor allele frequency that is greater than 0.01 in at least one race, thereby identifying one or more validated SNPs; ii) determining that the one or more validated SNPs exhibits significantly different genotype distributions and allele frequencies between individuals of different pigmentation phenotypes or racial classes, and iii) Using linear, quadratic, correspondence analysis or classification tree multivariate modeling to develop an abstract classifier function incorporating one or more validated SNPs or combinations of validated SNPs that blindly generalizes to other individuals of known race, thereby identifying a classifier function for inferring the race of a subject.
- the invention provides a method for classifying a sample.
- the method includes: a) computing a variance/covariance matrix for all possible trait class pairs; b) creating a combination of class mean vectors, wherein vector components are binary encodings, correspondence analysis principal coordinates, correspondence analysis factor scores or correspondence analysis standard coordinates; c) representing a sample as an n-dimensional sample vector; and d) classifying a sample by identifying a class mean vector from the combination of class mean vectors, that is the shortest distance from the sample.
- Figure 1 is a cladogram or a parsimony tree showing that haplotypes observed in the human population can be expressed such that the evolutionary relationships between the haplotypes are discemable.
- lines separate haplotypes that are one mutational step from another and biallelic positions within a gene are represented in binary form (1 and 0).
- Figure 2 is a graph ofthe OCA2 8 haplotypes described in Example 6 herein.
- the plot is in two dimensions, with a third dimension, that ofthe TYR_3 genotype (for three classes of OCA2 haplotype pairs) shown in bold print.
- Each line represents a diploid set of haplotypes encoded as described in the text.
- the lines were placed next to one another to simplify presentation.
- the 6 lines without a square or circle attached, at the upper left-hand region ofthe plot placed next to one another represent the same combination of OCA2 haplotypes in different individuals of brown hair color.
- a third dimension in the grid is the TYR_3 genotype ofthe individuals, and this genotype is shown for three individual types in the plot (only 3 to keep the figure manageable.)
- Figure 3 shows the composite solution for predicting the natural hair color from an unknown DNA specimen (see Example 7). This particular solution correctly classified dark haired Caucasian individuals 95% ofthe time and light haired individuals 70% ofthe time.
- Figure 5 is a cladogram and clade designations for OCA3LOC920 haplotypes as indicated in Example 8.
- the haplotype is shown as a trinucleotide sequence, and the name ofthe haplotype appears above the sequence.
- Figure 6 is a cladogram for OCA2 haplotypes, as described in Example 11.
- Figure 7 is cladogram for OCA3LOC922, as described in Example 11.
- Figure 8 is cladogram for OCA3LOC922, as described in Example 11.
- the invention relates to methods for inferring a genetic pigmentation trait of a mammalian subject from a nucleic acid sample or a polypeptide sample ofthe subject, and compositions for practicing such methods.
- the methods ofthe invention are based, in part, on the identification of single nucleotide polymorphisms (SNPs) that, alone or in combination, allow an inference to be drawn as to a genetic pigmentation trait such as hair shade, hair color, eye shade, or eye color, and further allow an inference to be drawn as to race.
- SNPs single nucleotide polymorphisms
- compositions and methods ofthe invention are useful, for example, as forensic tools for obtaining information relating to physical characteristics of a potential crime victim or a perpetrator of a crime from a nucleic acid sample present at a crime scene, and as tools to assist in breeding domesticated animals, livestock, and the like to contain a pigmentation trait as desired.
- the invention provides a method for inferring a genetic pigmentation trait of a mammalian subject from a biological sample ofthe subject by identifying in the biological sample at least one pigmentation-related haplotype allele of at least one pigmentation gene.
- the pigmentation gene can be oculocutaneous albinism II (OCA2), agouti signaling protein (ASIP), tyrosinase-related protein 1 (TYRPl), tyrosinase (TYR), adaptor-related protem complex 3, beta 1 subunit (AP3B 1 ) (also known as adaptin B 1 protein (ADP 1 )), adaptin 3 D subunit 1 (AP3D 1 ), dopachrome tautomerase (DCT), silver homolog (SILV), AJ -l protein (LOC51151), proopiomelanocortin (POMC), ocular albinism 1 (OAl), microphthalmia-associated transcription factor (MITF), myosin VA (MYO5 A), RAB27
- the identification of at least one penetrant pigmentation- related haplotype allele of at least one pigmentation gene allows an inference to be drawn as to a genetic pigmentation trait of a mammalian subject.
- An inference drawn according to a method ofthe invention can be strengthened by identifying a second, third, fourth or more penetrant pigmentation related haplotype alleles and/or one or more latent pigmentation related haplotype alleles in the same pigmentation gene or in one or more other genes.
- the method can further include identifying in the nucleic acid sample at least one pigmentation-related haplotype allele of at least a second pigmentation gene.
- the second pigmentation gene can be OCA2, ASJP, TYRP 1 , TYR, AP3B 1 , AP3D 1 , DCT, SILV, LOC51151, POMC, OAl , MITF,
- MYO5A RAB27A, F2RL1, or melanocortin-1 receptor (MCIR), or any combination of these genes.
- the pigmentation gene for this aspect ofthe invention can include at least one of OCA2, ASJP, TYRPl, TYR, SILV AP3B1, AP3D1, or DCT.
- OCA2 organic coherence tomography
- ASJP TYRPl
- TYR TYR
- SILV AP3B1 AP3D1
- DCT digital coherence tomography
- penetrant and/or latent haplotypes and haplotype alleles for these genes are provided.
- the pigmentation-related haplotype allele is a penetrant pigmentation- related haplotype allele.
- the pigmentation trait can be eye shade, eye color, hair shade, or hair color.
- the pigmentation-related haplotype allele can occur in at least one of OCA2, TYRPl, or DCT.
- Penetrant haplotypes for eye color inference from these genes are identified herein (see Example 17).
- haplotypes refers to groupings of two or more nucleotide SNPs present in a gene.
- haplotype alleles refers to a non-random combination of nucleotide occurrences of SNPs that make up a haplotype. Haplotype alleles are much like a string of contiguous sequence bases, except the SNPs are not adjacent to one another on a chromosome. For example, the SNPs OCA2_5 and OCA2_8 can be included as part ofthe same haplotype, but they are about 60,000 base pairs apart from one another.
- Penetrant pigmentation-related haplotype alleles are haplotype alleles whose association with a pigmentation trait is strong enough that it can be detected using simple genetics approaches. Corresponding haplotypes of penetrant pigmentation- related haplotype alleles, are referred to herein as “penetrant pigmentation-related haplotypes.” Similarly, individual nucleotide occurrences of SNPs are referred to herein as “penetrant pigmentation-related SNP nucleotide occurrences” if the association ofthe nucleotide occurrence with a pigmentation trait is strong enough on its own to be detected using simple genetics approaches, or if the SNP loci for the nucleotide occurrence make up part of a penetrant haplotype.
- penetrant pigmentation-related SNPs The corresponding SNP loci are referred to herein as “penetrant pigmentation-related SNPs.”
- Haplotype alleles of penetrant haplotypes are also referred to herein as “penetrant haplotype alleles” or “penetrant genetic features.”
- Penetrant haplotypes are also referred to herein as “penetrant genetic feature SNP combinations.”
- Latent pigmentation-related haplotype alleles are haplotype alleles that, in the context of one or more penetrant haplotypes, strengthen the inference ofthe genetic pigmentation trait.
- Latent pigmentation-related haplotype alleles are typically alleles whose association with a pigmentation trait is not strong enough to be detected with simple genetics approaches.
- Latent pigmentation-related SNPs are individual SNPs that make up latent pigmentation-related haplotypes. As disclosed in Example 17, latent pigmentation-related SNPs show unusual minor allele frequency differences between Caucasians and Africans/Asians combined. Therefore, it will be recognized that, based on the teachings disclosed herein, additional latent pigmentation-related SNPs can be identified using routine methods.
- Table 1 identifies and provides information regarding SNPs disclosed herein that are preferentially associated with eye pigmentation and/or hair pigmentation. All ofthe SNPs ofthe methods and compositions ofthe invention have nucleotide occurrences that preferentially segregate for hair shade or eye shade. Table 1 sets out the marker number, a SEQ JD NO: for the SNP and surrounding nucleotide sequences in the genome, and the position ofthe SNP within the sequence listing entry for that SNP and surrounding sequences. From this information, the SNP loci can be identified within the human genome.
- Tables 9-1 and 18-1 Data regarding the nucleotide occurrences at many of these SNPs in hair color or eye color can be found in Tables 9-1 and 18-1, for eye shade and hair shade, respectively. Additionally, Tables 9-1 and 18-1 include the name and marker numbers for the SNPs identified as pigmentation-related and/or race-related herein, justifications explaining the association between a SNP and a pigmentation trait, as well as the name and Genbank accession number ofthe gene from which a SNP occurs.
- Polymorphisms are allelic variants that occur in a population .
- the polymo ⁇ hism can be a single nucleotide difference present at a locus, or can be an insertion or deletion of one or a few nucleotides.
- a single nucleotide polymorphism is characterized by the presence in a population of one or two, three or four nucleotides (i.e., adenosine, cytosine, guanosine or thymidine) at a particular locus in a genome such as the human genome.
- Simple genetic approaches for discovering penetrant pigmentation-related haplotype alleles include analyzing allele frequencies in populations with different phenotypes for a pigmentation trait being analyzed, to discover those haplotypes that occur more or less frequently in individuals with a certain pigmentation trait phenotype, for example, blue eyes.
- SNP nucleotide occurrences in different pigmentation traits, such as eye shade or hair shade are scored and distribution frequencies, such as those shown in Tables 9-1 and 18-1 are analyzed.
- the Examples provide illustrations of using simple genetics approaches to discover penetrant haplotypes, and disclose methods that can be used to discover other pigmentation-related haplotype and their alleles, and, therefore, pigmentation- related SNPs that make up the pigmentation-related haplotypes.
- Haplotypes can be inferred from genotype data corresponding to certain SNPs using the Stephens and Donnelly algorithm (Am. J. Hum. Genet. 68:978-989, 2001). Haplotype phases (i.e., the particular haplotype alleles in an individual) can also be determined using the Stephens and Donnelly algorithm (Am. J. Hum. Genet. 68:978- 989, 2001). Software programs are available which perform this algorithm (e.g., The PHASE program, Department of Statistics, University of Oxford).
- a candidate SNP combination is selected from a plurality of candidate SNP combinations for a gene associated with a genetic trait.
- Haplotype data associated with this candidate SNP combination are read for a plurality of individuals and grouped into a positive-responding group and a negative-responding group based on whether predetermined trait criteria for an individual are met.
- a statistical analysis (as discussed below) on the grouped haplotype data is performed to obtain a statistical measurement associated with the candidate SNP combination.
- the acts of selecting, reading, grouping, and performing are repeated as necessary to identify the candidate SNP combination having the optimal statistical measurement.
- all possible SNP combinations are selected and statistically analyzed.
- a directed search based on results of previous statistical analysis of SNP combinations is performed until the optimal statistical measurement is obtained.
- the number of SNP combinations selected and analyzed may be reduced based on a simultaneous testing procedure.
- the term "infer” or “inferring”, when used in reference to a genetic pigmentation trait or race, means drawing a conclusion about a pigmentation trait or about the race of a subject using a process of analyzing individually or in combination nucleotide occurrence(s) of one or more pigmentation-related or race- related SNP(s) in a nucleic acid sample ofthe subject, and comparing the individual or combination of nucleotide occurrence(s) ofthe SNP(s) to known relationships of nucleotide occurrence(s) ofthe pigmentation-related or race-related SNP(s).
- the nucleotide occurrence(s) can be identified directly by examining nucleic acid molecules, or indirectly by examining a polypeptide encoded by a particular gene, for example, an OCA2 gene, wherein the polymo ⁇ hism is associated with an amino acid change in the encoded polypeptide.
- Methods of performing such a comparison and reaching a conclusion based on that comparison are exemplified herein (see Example 17).
- the inference typically involves using a complex model that involves using known relationships of known alleles or nucleotide occurrences as classifiers.
- the comparison can be performed by applying the data regarding the subject's pigmentation-related haplotype allele(s) to a complex model that makes a blind, quadratic discriminate classification using a variance-covariance matrix.
- Various classification models are discussed in more detail herein, and illustrated in the Examples.
- haplotypes are useful in an inference of a pigmentation trait.
- Allele frequencies can be calculated for haplotypes and pair-wise haplotype frequencies estimated using an EM algorithm (Excoffier and Slatkin, Mol Biol Evol. 1995 Sep;12(5):921-7).
- Linkage disequilibrium coefficients can then be calculated.
- chi-square statistics and other population genetic parameters such as Panmitic indices can be calculated to control for ethnic, ancestral or other systematic variation between the case and control groups.
- Markers/haplotypes with value for distinguishing the case matrix from the control can be presented in mathematical form describing any relationship and accompanied by association (test and effect) statistics.
- a statistical analysis result which shows an association of a SNP marker or a haplotype with a pigmentation trait with at least 80%, 85%, 90%, 95%, or 99%, most preferably 95% confidence, or alternatively a probability of insignificance less than 0.05, can be used to identify penetrant haplotypes, as illustrated in Example 17.
- These statistical tools may test for significance related to a null hypothesis that an on-test SNP allele or haplotype allele is not significantly different between the groups. If the significance of this difference is low, it suggests the allele is not related to the a pigmentation trait.
- the discovery of penetrant haplotype alleles can be verified and validated as genetic features for pigmentation using a nested contingency analysis of haplotype cladograms, as illustrated in Example 17.
- haplotypes in nature that is far fewer than the number of haplotypes possible are common and appreciated as a general principle among those familiar with the state ofthe art, and it is commonly accepted that haplotypes offer enhanced statistical power for genetic association studies. This phenomenon is caused by systematic genetic forces such as population bottlenecks, random genetic drift, selection, and the like, which have been at work in the population for millions of years, and have created a great deal of genetic "pattern" in the present population. As a result, working in terms of haplotypes offers a geneticist greater statistical power to detect associations, and other genetic phenomena, than working in terms of disjointed genotypes.
- the disparity between the number of observed and expected haplotypes is larger than for smaller numbers of loci.
- the various haplotype alleles exemplified above can be considered as all possible or potential "flavors" ofthe OCA2 gene in the population.
- the disparity between the number of observed and expected haplotypes can be larger.
- Such a phenomenon is caused, in part, by systematic genetic forces such as population bottlenecks, random genetic drift, selection, and the like, which have been at work in the population for millions of years, and have created a great deal of genetic "pattern" in the present population.
- working in terms of haplotypes offers a geneticist greater statistical power to detect associations, and other genetic phenomena, than does working in terms of disjointed genotypes.
- somatic cells which are diploid, include two alleles for each haplotype.
- the two alleles of a haplotype are referred to herein as a genotype
- the analysis of somatic cells typically identifies the alleles for each copy ofthe haplotype.
- These alleles can be identical (homozygous) or can be different (heterozygous).
- the haplotypes of a subject can be symbolized by representing alleles on the top and bottom of a slash (e.g., ATG/CTA or GTT/AGA), where the sequence on the top ofthe slash represents the combination of polymo ⁇ hic alleles on the maternal chromosome and the other, the paternal (or vice versa).
- a slash e.g., ATG/CTA or GTT/AGA
- the sequence on the top ofthe slash represents the combination of polymo ⁇ hic alleles on the maternal chromosome and the other, the paternal (or vice versa).
- the methods ofthe invention are illustrated using analysis of diploid cells (see Examples), the analysis similarly can be applied to haploid cells, such as sperm cells.
- haploid sequences the contingency table from a population study that is used to derive the factor scores for quadratic discrimination, becomes a table of haploid sequences versus pigmentation classes.
- the power of he inference of a pigmentation trait can be improved using specific combinations of haplotypes, including penetrant and latent haplotypes. As shown, for example, in Example 17, such combinations improve the accuracy of an inference drawn according to a method ofthe invention. This result is not unreasonable in view, for example, of genetic epistasis, wherein specific combinations of genes have unique impacts on traits.
- the methods and compositions ofthe invention allow complex genomics solutions for eye, hair, and skin pigmentation and, therefore, provide numerous utilities.
- the methods and compositions are useful as forensic tools in human subjects.
- Pigmentation solutions for eye color also can have relevance for pigmentation related disease research focused, for example, on cataracts (Gumming et al., Am. J. Opthalmol. 130:237-238, 2000), late-onset blindness, and melanoma (Brogelli et al., Br. J. Dermatol. 125: 349-52, 1991; Palmer et al., Am. J. Hum. Genet. 66:176-86, 2000).
- a sample useful for practicing a method ofthe invention can be any biological sample of a subject that contains nucleic acid molecules, including portions ofthe gene sequences to be examined, or corresponding encoded polypeptides, depending on the particular method.
- the sample can be a cell, tissue or organ sample, or can be a sample of a biological fluid such as semen, saliva, blood, and the like.
- a nucleic acid sample useful for practicing a method ofthe invention will depend, in part, on whether the SNPs ofthe haplotype to be identified are in coding regions or in non-coding regions.
- the nucleic acid sample generally is a deoxyribonucleic acid (DNA) sample, particularly genomic DNA or an amplification product thereof.
- DNA deoxyribonucleic acid
- RNA heteronuclear ribonucleic acid
- the nucleic acid sample can be DNA or RNA, or products derived therefrom, for example, amplification products.
- the methods ofthe invention generally are exemplified with respect to a nucleic acid sample, it will be recognized that particular haplotype alleles can be in coding regions of a gene and can result in polypeptides containing different amino acids at the positions corresponding to the SNPs due to non-degenerate codon changes. As such, in another aspect, the methods ofthe invention can be practiced using a sample containing polypeptides ofthe subject.
- the human nucleic acid sample can be obtained from a crime scene, using well established sampling methods.
- the sample can be fluid sample or a swab sample
- the sample can be a swab sample, blood stain, semen stain, hair follicle, or other biological specimen, taken from a crime scene, or can be a soil sample suspected of containing biological material of a potential crime victim or pe ⁇ etrator, can be material retrieved from under the finger nails of a potential crime victim, or the like, wherein nucleic acids (or polypeptides) in the sample can be used as a basis for drawing an inference as to a pigmentation trait according to a method ofthe invention.
- a mammalian subject that can be examined according to a method ofthe invention can be any mammalian species.
- the methods are applicable to drawing an inference as to a pigmentation trait of a human subject.
- the human subject can be from a general population of mixed ethnicity, or the human subject can be of a particular ethnic background or race.
- the subject can be a Caucasian.
- a method ofthe invention can be performed using a biological sample from a human subject, the genetic pigmentation trait to be inferred can be eye color or eye shade, and the penetrant pigmentation-related haplotype allele can be from at least one ofthe following pigmentation-related haplotypes: a) nucleotides ofthe DCT gene corresponding to a DCT-A haplotype, which includes, nucleotide 609 of SEQ ID NO:l [702], nucleotide 501 of SEQ JD NO:2 [650], and nucleotide 256 of SEQ ID NO:3 [marker 675]; b) nucleotides ofthe MCIR gene corresponding to a melanocortin-1 receptor (MCIR)- A haplotype, which includes nucleotide 442 of SEQ ID NO:4 [217438], nucleotide 619 of SEQ ID NO:5 [217439], and nucleotide 646 of SEQ ID NO:6 [
- nucleotides ofthe OCA2 gene corresponding to an OCA2-E haplotype, which includes nucleotide 225 of SEQ JD NO:21, [217455], nucleotide 170 of SEQ JD NO:22, [712061], and nucleotide 210 of SEQ ID NO:20,
- nucleotides ofthe TYRPl gene corresponding to a TYRPl-B haplotype which includes: nucleotide 172 of SEQ JD NO:23, [886938], and nucleotide 216 of SEQ ID NO:24; [886943], or any combination of a) through h).
- the above listed haplotypes provide preferred penetrant pigmentation-related haplotypes for eye pigmentation (see Example 17).
- the pigmentation-related haplotype can be all ofthe above listed pigmentation-related haplotypes. This list of penetrant pigmentation-related SNPs are preferred penetrant pigmentation-related SNPs for eye color, as illustrated in Example 17.
- the invention includes any 1 ofthe pigmentation-related haplotypes, alone, or any combination of 2, 3, 4, or more, including, for example all 8 pigmentation-related haplotypes listed above.
- a method ofthe invention which can include methods wherein the pigmentation-related haplotype alleles are determined for the preferred penetrant pigmentation-related haplotypes for eye pigmentation, the subject is a human, and the genetic pigmentation trait is eye color or eye shade, can further include identifying in the nucleic acid sample a nucleotide occurrence of at least one latent pigmentation- related SNP of a pigmentation gene, thereby improving the power ofthe inference of eye color or eye shade.
- the latent pigmentation-related SNP can be, for example, one or more of nucleotide 61 of SEQ ID NO:25 [marker 560], nucleotide 201 of SEQ JD NO:26 [marker 552], nucleotide 201 of SEQ JD NO:27 [marker 559], nucleotide 201 of SEQ ID NO:28 [marker 468], nucleotide 657 of SEQ ID NO:29 [marker 657], nucleotide 599 of SEQ ID NO:30 [marker 674], nucleotide 267 of SEQ ID NO:31 [marker 632], nucleotide 61 of SEQ ID NO:32 [marker 701], nucleotide 451 of SEQ ID NO:33 [marker 710]; nucleotide 326 of SEQ ID NO:34 [marker 217456], nucleotide 61 of SEQ JD NO:35 [marker 656], nucleotide 61 of SEQ
- latent pigmentation-related haplotype allele can be: i) nucleotides ofthe ASIP gene corresponding to an ASIP-A haplotype, which includes nucleotide 201 of SEQ JD NO:26 [marker 552], and nucleotide 201 of SEQ ID NO:28 [marker 468]; j) nucleotides ofthe DCT gene corresponding to a DCT-B haplotype, which includes nucleotide 451 of SEQ ID NO:33 [marker 710], and nucleotide 657 of SEQ JD NO:29 [marker 657]; k) nucleotides ofthe SILV gene corresponding to a SILV-A haplotype, which includes nucleotide 61 of SEQ ID NO:35 [marker 656], and nucleotide
- nucleotides ofthe TYR gene corresponding to a TYR-A haplotype which includes nucleotide 93 of SEQ ED NO:38 [marker 278], and nucleotide 114 of SEQ ID NO:39 [marker 386]; or m) nucleotides ofthe TYRPl -A gene corresponding to a TYRPl -A haplotype, which includes nucleotide 364 of SEQ ID NO:44 [marker 217485], nucleotide 169 of SEQ ID NO:48 [marker 886933], and nucleotide 214 of SEQ ED NO:49 [marker 886937], or any combination of i) through m).
- the method can further include identifying in the nucleic acid sample all ofthe above listed following latent haplotypes.
- the penetrant pigmentation-trait related haplotypes for eye color can be one or more of the following: a) the MC1R-A haplotype allele CCC; b) the OCA2-A haplotype allele TTAA, CCAG, or TTAG; c) the OCA2-B haplotype allele CAA, CGA, CAC, or CGC; d) the OCA2-C haplotype allele GGAA, TGAA, or TAAA; e) the OCA2-D haplotype allele AGG or GGG; f) the OCA2-E haplotype allele GCA; g) the TYRPl-B haplotype allele TC; and h) the DCT-B haplotype allele CTG, or GTG.
- These alleles are preferred penetrant pigmentation-related haplotype alleles for eye color, as illustrated in Example 17.
- the method ofthe invention wherein the pigmentation-related haplotype alleles are determined for the preferred penetrant pigmentation-related haplotypes for eye color or eye shade, the subject is a human, and the genetic pigmentation trait is eye color or eye shade, further include the following penetrant pigmentation-trait related haplotype alleles: a) the MC1R-A haplotype allele CCC; b) the OCA2-A haplotype allele TTAA, CCAG, or TTAG; c) the OCA2-B haplotype allele CAA, CGA, CAC, or CGC; d) the OCA2-C haplotype allele GGAA, TGAA, or TAAA; e) the OCA2-D haplotype allele AGG or GGG; f) the OCA2-E haplotype allele GCA; g) the TYRPl-B haplotype allele TC; and h) the DCT-B haplotype allele allele
- the alleles listed in the preceding paragraph represent the group of penetrant and latent pigmentation-related haplotypes that are identified in Example 17. This combination of haplotypes when used to infer eye pigmentation using the classification model disclosed in Example 17, inferred eye shade for a group of 225 Caucasians with 99% accuracy for the inference of iris color shade, and 97% accuracy for the inference of actual eye colors.
- the invention provides a method for inferring eye shade or color of a human subject from a biological sample ofthe subject by performing a nested contingency analysis of haplotypes.
- the method includes performing the steps described in Table 17-4.
- the invention provides a method for inferring hair color or hair shade of a mammalian subject from a biological sample ofthe subject by identifying in the biological sample at least one pigmentation-related haplotype allele of at least one pigmentation gene.
- the biological sample can be (or contain) a nucleic acid sample.
- the pigmentation-related haplotype preferably includes a penetrant pigmentation-related haplotype.
- the penetrant pigmentation-related haplotype allele can occur in at least one ofthe OCA2, ASIP, TYRPl, or MCIR gene.
- a combination of penetrant pigmentation-related haplotype alleles from OCA2, ASIP, TYRPl and MCIR can be identified, with exemplary penetrant haplotypes related to an inference of hair color or hair shade set forth in Example 18.
- a method inferring hair color or hair shade can be performed using a biological sample from a human subject, and the penetrant pigmentation-related haplotype allele can occur in at least one pigmentation-related haplotypes, as follows: a) nucleotides ofthe ASIP-B haplotype corresponding to: nucleotide 202 of SEQ ID NO:27, [559], and nucleotide 61 of SEQ ID NO:25, [560] b) nucleotides ofthe MC1R-A haplotype corresponding to: nucleotide 442 of SEQ ID NO:4, [217438], nucleotide 619 of SEQ ID NO:5 [217439], and nucleotide 646 of SEQ ID NO:6 [217441]; c) nucleotides ofthe OCA2-G haplotype corresponding to: nucleotide 418 of SEQ ID NO:16 [712060], nucleotide 210 of SEQ ID NO:20, [
- the haplotypes listed in elements a)-g) above are preferred penetrant pigmentation-related haplotypes for hair pigmentation, as illustrated in Example 18.
- the method of this aspect ofthe invention directed at an inference drawn to hair color or hair shade can be performed using a biological sample from a human subject by identifying a penevers pigmentation- related haplotype allele in all ofthe following pigmentation-related haplotypes: a) nucleotides ofthe ASIP-B haplotype corresponding to: nucleotide 202 of SEQ ID NO:27, [559], and nucleotide 61 of SEQ ID NO:25, [560] b) nucleotides ofthe MC1R-A haplotype corresponding to: nucleotide 442 of SEQ ID NO:4, [217438], nucleotide 619 of SEQ ID NO:5 [217439], and nucleotide 646 of SEQ ID NO:6 [217441]; c)
- a method for inferring hair color or shade wherein the pigmentation-related haplotype alleles are determined for any one combination ofthe pigmentation-related haplotypes for the haplotypes listed as elements a)-g) above, can further include identifying at least one ofthe following alleles: a) the ASIP-B haplotype allele GA or AA; b) the MC1R-A haplotype allele CCC; c) the OCA2-G haplotype allele AGG, or AGA; d) the OCA2-H haplotype allele AGT or ATT; e) the OCA2-I haplotype allele TG; f) the OCA2-J haplotype allele GA or AA; and h) the TYRPl-C haplotype allele AA or TA.
- the method ofthe invention for inferring hair color or shade wherein the pigmentation-related haplotype alleles are determined for all ofthe alleles listed above.
- the method ofthe invention for this aspect ofthe invention includes methods wherein the pigmentation-related haplotype alleles are those listed in elements a)-h) above, and wherein the method further includes identifying in the nucleic acid sample, at least one latent pigmentation-related SNP of a pigmentation gene, to improve the power of the inference of hair color or hair shade.
- the mammalian subject can also be a livestock species, such as a cow, a sheep, a pig, or a goat, etc., or a cat, a horse, or a dog, or other domestic animal, or a mouse, a rat, or a rabbit, or other laboratory species.
- the methods ofthe invention when practiced on a non-human subject utilize pigmentation genes ofthe species of the non-human subject. These pigmentation genes include homologs ofthe human pigmentation genes disclosed herein. For example, in mice such homologs are known to exist, and some studies directed at mutations of pigmentation genes have been performed. Although little is known regarding SNPs of pigmentation genes of non- human species, MCIR SNPs have been described to be associated with chestnut coat coloration in horses (Rieder et al., Mamm Genome. 12(6):450-5 (2001).
- the methods ofthe invention are valuable in providing predictions of commercially valuable pigmentation phenotypes, for example in breeding.
- the methods ofthe invention can be used to derive homologous methods in other species that can be used to breed a mammalian subject such that offspring will be more likely to have a desired pigmentation trait.
- early stage embryos can be isolated and analyzed using the methods of the invention to select before implantation, those that will develop into adults with a desired pigmentation trait, whether it be coat color, eye color, or any other trait linked to pigmentation.
- the term "genetic pigmentation trait” is used herein to mean a trait involving variation in the degree to which melanin is deposited in a particular tissue. Such deposition generally occurs during development of a mammalian organism, and is a function ofthe degree to which melanin is synthesized and degraded.
- the pigmentation trait can be the degree of hair pigmentation, which can be analyzed in terms of hair color or hair shade; or the degree of eye pigmentation, which can be analyzed in terms of eye color or eye shade; or the degree of skin pigmentation.
- Melanin is synthesized, degraded, deposited, and transported by a group of genes referred to herein as pigmentation genes.
- Pigmentation genes are usually defined as such based on loss of function mutations observed in man as well as model organisms such as mouse or Drosophila.
- individuals For hair shade, individuals generally are partitioned into two groups - persons of dark natural hair color (black or brown) and persons of light natural hair color (red, blonde).
- the term "eye color” is synonymous with the degree to which the iris is pigmented; the term “hair color” is synonymous with the degree to which the hair is pigmented.
- individuals of dark natural eye color i.e., individuals of brown or black irises
- individuals of light iris shade group i.e., individuals of blue, green, or hazel irises. Therefore, by way of example, the methods ofthe invention can determine whether the eye color of a subject is blue, green, hazel, black, or brown.
- the first pigmentation gene and, where appropriate, second or other pigmentation genes useful for examination according to a method ofthe invention can be any gene that is involved in the production, degradation, or transport of melanin.
- the first pigmentation gene examined according to a method ofthe invention is not MCIR or is not MCIR and ASP, although in these embodiments the MCIR or ASJP gene can be the second, third, fourth or other pigmentation gene examined, thus strengthening an inference that can be drawn.
- Pigmentation genes can be identified by performing wet lab experiments, or as illustrated in the Examples, by identifying published reports of studies describing genes for which mutations are known to cause detectable changes in pigmentation. In humans, genes for which mutations cause severe hypopigmentation are especially attractive candidates as pigmentation genes for use in the disclosed methods.
- Pigmentation genes can be identified based on evidence from the literature, and from other sources of information, that implicate them in either the synthesis, degradation and/or the deposition ofthe human chromatophore melanin.
- the Physicians Desk Reference, Online Mendelian Inheritance database (available at the National Center for Biotechnology Information web site) and PubMed/Medline are two examples of sources that provide such information.
- Examples of pigmentation genes include OC A2, ASIP, OC A2, SILV, TYRP 1 ,
- these pigmentation genes comprise loci of penetrant and/or latent SNP haplotypes for hair pigmentation (i.e., color and shade) and/or eye pigmentation (i.e., color and shade).
- the methods ofthe invention include the identification of pigmentation-related haplotype alleles for one pigmentation gene, as well as for any combination of two or more pigmentation genes, which can improve the power ofthe inference drawn.
- the inferred pigmentation trait is eye shade and the pigmentation-related haplotype allele occurs in at least one of OCA2, TYRPl, or DCT.
- These genes are disclosed herein as including the loci of penetrant haplotypes associated with eye color and/or shade (see Example 17).
- Eumelanin is a light absorbing polymer synthesized in specialized lysozomes called melanosomes in a specialized cell type called melanocytes.
- melanocytes a specialized cell type called melanocytes.
- the tyrosinase (TYR) gene product catalyzes the rate-limiting hydroxylation of tyrosine (to 3,4- dihydroxyphenylanine or DOPA) and oxidation ofthe resulting product (to DOPA quinone) to form the precursor for eumelanin synthesis.
- DOPA 3,4- dihydroxyphenylanine
- variable iris color in healthy humans is the result ofthe differential deposition of melanin pigment granules within a fixed number of stromal melanocytes in the iris (Imesch et al., Surv. Ophthalmol. 41 Suppl 2:S117-S123, 1997). The density of granules appears to reach genetically determined levels by early childhood and usually remains constant throughout later life (but, see Bito et al., Arch Ophthalmol. 115(5):659-663, 1997).
- iris color variation is a function of two loci; a single locus responsible for de-pigmentation ofthe iris, not affecting skin or hair, and another pleiotropic gene for reduction of pigment in all tissues (Brues, Am. J. Phys. Anthropol. 43(3):387-391, 1975). Most of what we have learned about pigmentation since has been derived from molecular genetics studies of rare pigmentation defects in man and model systems such as mouse and Drosophila.
- OCA oculocutaneous albinism
- TYR catalyzes the rate- limiting step of melanin biosynthesis and the degree to which human irises are pigmented correlates well with the amplitude of TYR message levels (Lindsey et al., Arch. Opthalmol. 119(6):853-860, 2001). Nonetheless, the complexity of OCA phenotypes has illustrated that TYR is not the only gene involved in iris pigmentation (Lee et al, Hum. Molec. Genet. 3:2047-2051, 1994).
- OCA2 oculocutaneous 2
- OCA2 the oculocutaneous 2
- Durham-Pierre et al. Nature Genet. 7: 176-179, 1994
- Durham-Pierre et al. Hum. Mutat. 7:370-373, 1996
- Gardner et al. Science 257:1121-1124, 1992
- Hamabe et zl. Am. J. Med. Genet. 41 :54-63, 1991
- TYRPl Chintamaneni et al., Biochem. Biophys. Res. Commun.
- nucleic acid occurrences for the individual SNPs that make up the haplotype alleles are determined, then, the nucleic acid occurrence data for the individual SNPs is combined to identify the haplotype alleles.
- the haplotype alleles For example, for the OCA2-A haplotype, both nucleotide occurrences at each SNP loci corresponding to markers 217458, 886894, and 886895 can be combined to determine a the two OCA2-A haplotype alleles of a subject (i.e., OCA2-A genotype; see Example 17).
- the Stephens and Donnelly algorithm (Am. J. Hum. Genet. 68:978- 989, 2001, which is inco ⁇ orated herein by reference) can be applied to the data generated regarding individual nucleotide occurrences in SNP markers ofthe subject, in order to determine the alleles for each haplotype in the subject's genotype.
- Other methods that can be used to determine alleles for each haplotype in the subject's genotype for example Clarks algorithm, and an EM algorithm described by Raymond and Rousset (Raymond et al. 1994. GenePop. Ver 3.0. Institut des Siences de l'Evolution. Universite de Montpellier, France. 1994)
- flanking nucleotide sequences for the SNPs disclosed herein. These flanking sequence serve to aid in the identification of the precise location ofthe SNPs in the human genome, and serve as target gene segments useful for performing methods ofthe invention.
- a target polynucleotide typically includes a SNP locus and a segment of a corresponding gene that flanks the SNP. Primers and probes that selectively hybridize at or near the target polynucleotide sequence, as well as specific binding pair members that can specifically bind at or near the target polynucleotide sequence, can be designed based on the disclosed gene sequences and information provided herein.
- selective hybridization refers to hybridization under moderately stringent or highly stringent conditions such that a nucleotide sequence preferentially associates with a selected nucleotide sequence over unrelated nucleotide sequences to a large enough extent to be useful in identifying a nucleotide occurrence of a SNP.
- hybridization to a target nucleotide sequence is sufficiently selective such that it can be distinguished over the non-specific cross-hybridization, for example, at least about 2-fold more selective, generally at least about 3-fold more selective, usually at least about 5-fold more selective, and particularly at least about 10-fold more selective, as determined, for example, by an amount of labeled oligonucleotide that binds to target nucleic acid molecule as compared to a nucleic acid molecule other than the target molecule, particularly a substantially similar (i.e., homologous) nucleic acid molecule other than the target nucleic acid molecule.
- Conditions that allow for selective hybridization can be determined empirically, or can be estimated based, for example, on the relative GC:AT content ofthe hybridizing oligonucleotide and the sequence to which it is to hybridize, the length ofthe hybridizing oligonucleotide, and the number, if any, of mismatches between the oligonucleotide and sequence to which it is to hybridize (see, for example, Sambrook et al., "Molecular Cloning: A laboratory manual (Cold Spring Harbor Laboratory Press 1989)).
- An example of progressively higher stringency conditions is as follows: 2 x SSC/0.1% SDS at about room temperature (hybridization conditions); 0.2 x SSC/0.1% SDS at about room temperature (low stringency conditions); 0.2 x
- SSC/0.1% SDS at about 42EC moderate stringency conditions
- 0.1 x SSC at about 68EC high stringency conditions
- Washing can be carried out using only one of these conditions, e.g., high stringency conditions, or each ofthe conditions can be used, e.g., for 10-15 minutes each, in the order listed above, repeating any or all ofthe steps listed.
- optimal conditions will vary, depending on the particular hybridization reaction involved, and can be determined empirically.
- polynucleotide is used broadly herein to mean a sequence of deoxyribonucleotides or ribonucleotides that are linked together by a phosphodiester bond.
- oligonucleotide is used herein to refer to a polynucleotide that is used as a primer or a probe.
- an oligonucleotide useful as a probe or primer that selectively hybridizes to a selected nucleotide sequence is at least about 15 nucleotides in length, usually at least about 18 nucleotides, and particularly about 21 nucleotides or more in length.
- a polynucleotide can be RNA or can be DNA, which can be a gene or a portion thereof, a cDNA, a synthetic polydeoxyribonucleic acid sequence, or the like, and can be single stranded or double stranded, as well as a DNA/RNA hybrid.
- a polynucleotide, including an oligonucleotide e.g., a probe or a primer
- nucleotides comprising a polynucleotide are naturally occurring deoxyribonucleotides, such as adenine, cytosine, guanine or thymine linked to 2'-deoxyribose, or ribonucleotides such as adenine, cytosine, guanine or uracil linked to ribose.
- a polynucleotide or oligonucleotide also can contain nucleotide analogs, including non-naturally occurring synthetic nucleotides or modified naturally occurring nucleotides.
- nucleotide analogs are well known in the art and commercially available, as are polynucleotides containing such nucleotide analogs (Lin et al., Nucl. Acids Res. 22:5220-5234 (1994); Jellinek et al, Biochemistry 34:11363-11372 (1995); Pagratis et al., Nature Biotechnol. 15:68-73 (1997), each of which is inco ⁇ orated herein by reference).
- the covalent bond linking the nucleotides of a polynucleotide generally is a phosphodiester bond.
- the covalent bond also can be any of numerous other bonds, including a thiodiester bond, a phosphorothioate bond, a peptide-like bond or any other bond known to those in the art as useful for linking nucleotides to produce synthetic polynucleotides (see, for example, Tarn et al., Nucl. Acids Res. 22:977-986 (1994); Ecker and Crooke, BioTechnology 13:351360 (1995), each of which is inco ⁇ orated herein by reference).
- nucleotide analogs or bonds linking the nucleotides or analogs can be particularly useful where the polynucleotide is to be exposed to an environment that can contain a nucleolytic activity, including, for example, a tissue culture medium or upon administration to a living subject, since the modified polynucleotides can be less susceptible to degradation.
- a polynucleotide or oligonucleotide comprising naturally occurring nucleotides and phosphodiester bonds can be chemically synthesized or can be produced using recombinant DNA methods, using an appropriate polynucleotide as a template.
- a polynucleotide or oligonucleotide comprising nucleotide analogs or covalent bonds other than phosphodiester bonds generally are chemically synthesized, although an enzyme such as T7 polymerase can inco ⁇ orate certain types of nucleotide analogs into a polynucleotide and, therefore, can be used to produce such a polynucleotide recombinantly from an appropriate template (Jellinek et al., supra, 1995).
- polynucleotide as used herein includes naturally occurring nucleic acid molecules, which can be isolated from a cell, as well as synthetic molecules, which can be prepared, for example, by methods of chemical synthesis or by enzymatic methods such as by the polymerase chain reaction (PCR).
- PCR polymerase chain reaction
- a method ofthe identifying a SNP also can be performed using a specific binding pair member.
- the term "specific binding pair member” refers to a molecule that specifically binds or selectively hybridizes to another member of a specific binding pair.
- Specific binding pair member include, for example, probes, primers, polynucleotides, antibodies, etc.
- a specific binding pair member includes a primer or a probe that selectively hybridizes to a target polynucleotide that includes a SNP loci, or that hybridizes to an amplification product generated using the target polynucleotide as a template.
- a specific binding pair member ofthe invention can be an oligonucleotide or an antibody that, under the appropriate conditions, selectively binds to a target polynucleotide at or near nucleotide 473 of SEQ ID NO:45 [marker 217486], nucleotide 224 of SEQ ID NO:47 [marker 869745], nucleotide 314 of SEQ ID NO:46 [marker 869787], nucleotide 210 of SEQ ID NO:20 [marker 886892], nucleotide 228 of SEQ ID NO:9 [marker 886895], nucleotide 245 of SEQ ID NO: 10 [marker 886896], nucleotide 169 of SEQ ID NO:48 [marker 886933], nucleotide 214 of SEQ ED NO:49 [marker 886937], nucleotide 245 of SEQ ID NO:13 [marker 886994], nucleotide
- a specific binding pair member of the invention can be an oligonucleotide probe, which can selectively hybridize to a target polynucleotide and can, but need not, be a substrate for a primer extension reaction, or an anti-nucleic acid antibody.
- the specific binding pair member can be selected such that it selectively binds to any portion of a target polynucleotide, as desired, for example, to a portion of a target polynucleotide containing a SNP as the terminal nucleotide.
- the term "specific interaction,” or “specifically binds” or the like means that two molecules form a complex that is relatively stable under physiologic conditions.
- the term is used herein in reference to various interactions, including, for example, the interaction of an antibody that binds a polynucleotide that includes a SNP site; or the interaction of an antibody that binds a polypeptide that includes an amino acid that is encoded by a codon that includes a SNP site.
- an antibody can selectively bind to a polypeptide that includes a particular amino acid encoded by a codon that includes a SNP site.
- an antibody may preferentially bind a particular modified nucleotide that is inco ⁇ orated into a SNP site for only certain nucleotide occurrences at the SNP site, for example using a primer extension assay.
- a specific interaction can be characterized by a dissociation constant of at least about 1 x 10 "6 M, generally at least about 1 x 10 "7 M, usually at least about 1 x 10 "8 M, and particularly at least about 1 x 10 "9 M or 1 x 10 "10 M or greater.
- a specific interaction generally is stable under physiological conditions, including, for example, conditions that occur in a living individual such as a human or other vertebrate or invertebrate, as well as conditions that occur in a cell culture such as used for maintaining mammalian cells or cells from another vertebrate organism or an invertebrate organism.
- Methods for determining whether two molecules interact specifically include, for example, equilibrium dialysis, surface plasmon resonance, and the like. Numerous methods are known in the art for determining the nucleotide occurrence for a particular SNP in a sample.
- Such methods can utilize one or more oligonucleotide probes or primers, including, for example, an amplification primer pair, that selectively hybridize to a target polynucleotide, which contains one or more pigmentation-related SNP positions.
- Oligonucleotide probes useful in practicing a method ofthe invention can include, for example, an oligonucleotide that is complementary to and spans a portion ofthe target polynucleotide, including the position ofthe SNP, wherein the presence of a specific nucleotide at the position (i.e., the SNP) is detected by the presence or absence of selective hybridization ofthe probe.
- Such a method can further include contacting the target polynucleotide and hybridized oligonucleotide with an endonuclease, and detecting the presence or absence of a cleavage product ofthe probe, depending on whether the nucleotide occurrence at the SNP site is complementary to the corresponding nucleotide ofthe probe.
- An oligonucleotide ligation assay also can be used to identify a nucleotide occurrence at a polymo ⁇ hic position, wherein a pair of probes that selectively hybridize upstream and adjacent to and downstream and adjacent to the site ofthe SNP, and wherein one ofthe probes includes a terminal nucleotide complementary to a nucleotide occurrence ofthe SNP.
- the terminal nucleotide ofthe probe is complementary to the nucleotide occurrence
- selective hybridization includes the terminal nucleotide such that, in the presence of a ligase, the upstream and downstream oligonucleotides are ligated. As such, the presence or absence of a ligation product is indicative ofthe nucleotide occurrence at the SNP site.
- An oligonucleotide also can be useful as a primer, for example, for a primer extension reaction, wherein the product (or absence of a product) ofthe extension reaction is indicative ofthe nucleotide occurrence.
- a primer pair useful for amplifying a portion ofthe target polynucleotide including the SNP site can be useful, wherein the amplification product is examined to determine the nucleotide occurrence at the SNP site.
- Particularly useful methods include those that are readily adaptable to a high throughput format, to a multiplex format, or to both.
- the primer extension or amplification product can be detected directly or indirectly and/or can be sequenced using various methods known in the art.
- Amplification products which span a SNP loci can be sequenced using traditional sequence methodologies (e.g., the "dideoxy-mediated chain termination method,” also known as the “Sanger Method”(Sanger, F., et al., J. Molec. Biol. 94:441 (1975); Prober et al. Science 238:336-340 (1987)) and the "chemical degradation method," “also known as the “Maxam-Gilbert method”(Maxam, A. M., et al., Proc. Natl. Acad. Sci. (U.S.A.) 74:560 (1977)), both references herein inco ⁇ orated by reference) to determine the nucleotide occurrence at the SNP loci.
- sequence methodologies e.g., the "dideoxy-mediated chain termination method”(Sanger, F., et al., J. Molec. Biol. 94:441 (1975); Prober et al. Science 238:336-3
- Methods ofthe invention can identify nucleotide occurrences at SNPs using a "microsequencing" method.
- Microsequencing methods determine the identity of only a single nucleotide at a "predetermined" site. Such methods have particular utility in determining the presence and identity of polymo ⁇ hisms in a target polynucleotide.
- Such microsequencing methods, as well as other methods for determining the nucleotide occurrence at a SNP loci are discussed in Boyce-Jacino , et al., U.S. Pat. No. 6,294,336, inco ⁇ orated herein by reference, and summarized herein.
- Microsequencing methods include the Genetic Bit Analysis method disclosed by Goelet, P. et al. (WO 92/15712, herein inco ⁇ orated by reference). Additional, primer-guided, nucleotide inco ⁇ oration procedures for assaying polymo ⁇ hic sites in DNA have also been described (Komher, J. S. et al, Nucl. Acids. Res. 17:7779-7784 (1989); Sokolov, B. P., Nucl. Acids Res. 18:3671 (1990); Syvanen, A. -C, et al., Genomics 8:684-692 (1990); Kuppuswamy, M. N. et al., Proc. Natl. Acad. Sci.
- 5,002,867 describes a method for determining nucleic acid sequence via hybridization with multiple mixtures of oligonucleotide probes.
- the sequence of a target polynucleotide is determined by permitting the target to sequentially hybridize with sets of probes having an invariant nucleotide at one position, and a variant nucleotides at other positions.
- the Macevicz method determines the nucleotide sequence ofthe target by hybridizing the target with a set of probes, and then determining the number of sites that at least one member ofthe set is capable of hybridizing to the target (i.e., the number of "matches" ). This procedure is repeated until each member of a sets of probes has been tested.
- Boyce-Jacino et al., U.S. Pat. No. 6,294,336 provides a solid phase sequencing method for determining the sequence of nucleic acid molecules (either DNA or RNA) by utilizing a primer that selectively binds a polynucleotide target at a site wherein the SNP is the most 3' nucleotide selectively bound to the target.
- a primer that selectively binds a polynucleotide target at a site wherein the SNP is the most 3' nucleotide selectively bound to the target.
- the nucleotide occurrences of pigmentation-related SNPs in a sample can be determined using the SNP-ITTM method (Orchid BioSciences, Inc., Princeton, NJ).
- SNP-ITTM is a 3-step primer extension reaction.
- a target polynucleotide is isolated from a sample by hybridization to a capture primer, which provides a first level of specificity.
- the capture primer is extended from a terminating nucleotide trisphosphate at the target SNP site, which provides a second level of specificity.
- the extended nucleotide trisphosphate can be detected using a variety of known formats, including: direct fluorescence, indirect fluorescence, an indirect colorimetric assay, mass spectrometry, fluorescence polarization, etc.
- Reactions can be processed in 384 well format in an automated format using a SNPstreamTM instrument ((Orchid BioSciences, Inc., Princeton, NJ).
- a primer pair is synthesized that comprises a forward primer that hybridizes to a sequence 5' to the SNP of SEQ ID NO:7 (the SEQ ED corresponding to marker 217458 (see Table 1)) and a reverse primer that hybridizes to the opposite strand of a sequence 3 ' to the SNP of SEQ DD NO:7.
- This primer pair is used to amplify a target polynucleotide that includes marker 217458, to generate an amplification product.
- a third primer can then be used as a substrate for a primer extension reaction.
- the third primer can bind to the amplification product such that the 3' nucleotide ofthe third primer (e.g., adenosine) binds to the marker 217458 site and is used for a primer extension reaction.
- the primer can be designed and conditions determined such that the primer extension reaction proceeds only if the 3' nucleotide ofthe third primer is complementary to the nucleotide occurrence at the SNP . which proceeds if the nucleotide occurrence of marker 217458 is a thymidine, for example, but not if the nucleotide occurrence ofthe marker is cytidine.
- Phase known data can be generated by inputting phase unknown raw data from the SNPstreamTM instrument into the Stephens and Donnelly's PHASE program. Accordingly, using the methods described above, the pigmentation-related haplotype allele or the nucleotide occurrence ofthe pigmentation-related SNP can be identified using an amplification reaction, a primer extension reaction, or an immunoassay.
- the pigmentation-related haplotype allele or the pigmentation-related SNP can also be identified by contacting polynucleotides in the sample or polynucleotides derived from the sample, with a specific binding pair member that selectively hybridizes to a polynucleotide region comprising the pigmentation-related SNP, under conditions wherein the binding pair member specifically binds at or near the pigmentation-related SNP.
- the specific binding pair member can be an antibody or a polynucleotide.
- Antibodies that are used in the methods ofthe invention include antibodies that specifically bind polynucleotides that encompass a pigmentation-related or race- related haplotype.
- antibodies ofthe invention bind polypeptides that include an amino acid encoded by a codon that includes a SNP. These antibodies bind to a polypeptide that includes an amino acid that is encoded in part by the SNP.
- the antibodies specifically bind a polypeptide that includes a first amino acid encoded by a codon that includes the SNP loci, but do not bind, or bind more weakly to a polypeptide that includes a second amino acid encoded by a codon that includes a different nucleotide occunence at the SNP.
- Antibodies are well-known in the art and discussed, for example, in U.S. Pat. No. 6,391,589.
- Antibodies ofthe invention include, but are not limited to, polyclonal, monoclonal, multispecific, human, humanized or chimeric antibodies, single chain antibodies, Fab fragments, F(ab') fragments, fragments produced by a Fab expression library, anti-idiotypic (anti-Id) antibodies (including, e.g., anti-Id antibodies to antibodies ofthe invention), and epitope-binding fragments of any ofthe above.
- antibody refers to immunoglobulin molecules and immunologically active portions of immunoglobulin molecules, i.e., molecules that contain an antigen binding site that immunospecifically binds an antigen.
- the immunoglobulin molecules ofthe invention can be of any type (e.g., IgG, IgE, IgM, IgD, IgA and IgY), class (e.g., IgGi, IgG2, IgG3, IgG4, IgAl and IgA2) or subclass of immunoglobulin molecule.
- Antibodies ofthe invention include antibody fragments that include, but are not limited to, Fab, Fab' and F(ab')2, Fd, single-chain Fvs (scFv), single-chain antibodies, disulfide-lmked Fvs (sdFv) and fragments comprising either a VL or VH domain.
- Antigen-binding antibody fragments, including single-chain antibodies may comprise the variable region(s) alone or in combination with the entirety or a portion ofthe following: hinge region, CHI, CH2, and CH3 domains. Also included in the invention are antigen-binding fragments also comprising any combination of variable region(s) with a hinge region, CHI, CH2, and CH3 domains.
- the antibodies ofthe invention may be from any animal origin including birds and mammals.
- the antibodies are human, murine (e.g., mouse and rat), donkey, ship rabbit, goat, guinea pig, camel, horse, or chicken.
- the antibodies ofthe invention may be monospecific, bispecific, trispecific or of greater multispecificity.
- the antibodies ofthe invention may be generated by any suitable method known in the art.
- Polyclonal antibodies to an antigen-of-interest can be produced by various procedures well known in the art.
- a polypeptide ofthe invention can be administered to various host animals including, but not limited to, rabbits, mice, rats, etc. to induce the production of sera containing polyclonal antibodies specific for the antigen.
- adjuvants may be used to increase the immunological response, depending on the host species, and include but are not limited to, Freund's (complete and incomplete), mineral gels such as aluminum hydroxide, surface active substances such as lysolecithin, pluronic polyols, polyanions, peptides, oil emulsions, keyhole limpet hemocyanins, dinitrophenol, and potentially useful human adjuvants such as BCG (bacille Calmette-Guerin) and Corynebacterium parvum. Such adjuvants are also well known in the art.
- Monoclonal antibodies can be prepared using a wide variety of techniques known in the art including the use of hybridoma, recombinant, and phage display technologies, or a combination thereof.
- monoclonal antibodies can be produced using hybridoma techniques including those known in the art and taught, for example; in Harlow et al., Antibodies: A Laboratory Manual, (Cold Spring Harbor Laboratory Press, 2nd ed. 1988); Hammerling, et al., in: Monoclonal Antibodies and T-Cell Hybridomas 563-681 (Elsevier, N.Y., 1981) (said references inco ⁇ orated by reference in their entireties).
- the term "monoclonal antibody” as used herein is not limited to antibodies produced through hybridoma technology.
- the term “monoclonal antibody” refers to an antibody that is derived from a single clone, including any eukaryotic, prokaryotic, or phage clone, and not the method by which it is produced.
- the particular nucleotide occurrence of a SNP, or nucleotide occurrences of a pigmentation-related haplotype is such that the nucleotide occurrence results in an amino acid change in an encoded polypeptide
- the nucleotide occurrence can be identified indirectly by detecting the particular amino acid in the polypeptide.
- the method for determining the amino acid will depend, for example, on the structure ofthe polypeptide or on the position ofthe amino acid in the polypeptide.
- the polypeptide contains only a single occurrence of an amino acid encoded by the particular SNP
- the polypeptide can be examined for the presence or absence ofthe amino acid.
- simple sequencing ofthe terminal amino acids can be performed.
- the polypeptide can be treated with one or more enzymes and a peptide fragment containing the amino acid position of interest can be examined, for example, by sequencing the peptide, or by detecting a particular migration of the peptide following electrophoresis.
- the particular amino acid comprises an epitope ofthe polypeptide, the specific binding, or absence thereof, of an antibody specific for the epitope can be detected.
- the invention is a method for inferring a genetic pigmentation trait of a mammalian subject from a nucleic acid sample ofthe mammalian subject, wherein the method includes identifying a nucleotide occurrence in the sample for at least one pigmentation-related single nucleotide polymo ⁇ hism (SNP) from a pigmentation gene.
- SNP single nucleotide polymo ⁇ hism
- the pigmentation gene can be oculocutaneous albinism II (OCA2), agouti signaling protein (ASJP), tyrosinase-related protein 1 (TYRPl), tyrosinase (TYR), adaptor-related protein complex 3, beta 1 subunit (AP3B1), AP3D1, dopachrome tautomerase (DCT), silver homolog (SILV), AEVI-1 protein (LOC51151), proopiomelanocortin (POMC), ocular albinism 1 (OAl ), microphthalmia-associated transcription factor (MITF), myosin VA (MYO5 A), RAB27A, or coagulation factor II (thrombin) receptor-like 1 (F2RL1).
- OCA2 oculocutaneous albinism II
- ASJP agouti signaling protein
- TYRPl tyrosinase-related protein 1
- TRR tyrosinase
- A3D1 adaptor-related
- the nucleotide occurrence is associated with the pigmentation trait ofthe mammalian subject, thereby inferring the pigmentation trait ofthe mammalian subject.
- the method can further include identifying in the nucleic acid sample at least one nucleotide occurrence for at least a second pigmentation-related SNP of at least a second pigmentation gene.
- the pigmentation-related SNP(s) are not the ASIP SNPs disclosed in Kenetsky et al., Am. J. Hum. Genet. , 70:770 (2002).
- the method can further comprise identifying in the nucleic acid sample a nucleotide occurrence for at least a second pigmentation-related SNP of at least a second pigmentation gene.
- the second pigmentation gene can be OCA2, ASIP, TYRPl, TYR, AP3B1, AP3D1, DCT, SILV, LOC51151, POMC, OAl, MITF, MYO5A, RAB27A, F2RL1, or melanocortin-1 receptor (MCIR), or any combination of these genes.
- the first pigmentation gene does not include the MCIR gene.
- a method according to this aspect ofthe invention infers eye color or eye shade as the pigmentation trait, and identifies the nucleotide occurrence for at least one of: nucleotide 609 of SEQ ID NO:l [marker 702], nucleotide 501 of SEQ JD
- a method ofthe invention identifies nucleotide occurrences for at least one of: nucleotide 61 of SEQ DD NO:25 [marker 560], nucleotide 201 of SEQ DD NO:26 [marker 552], nucleotide 201 of SEQ DD NO:27 [marker 559], nucleotide 201 of SEQ DD NO:28 [marker 468], nucleotide 657 of SEQ DD NO:29 [marker 657], nucleotide 599 of SEQ ID NO:30 [marker 674], nucleotide 267 of SEQ DD NO:31 [marker 632], nucleotide 61 of SEQ ED NO:32 [marker 701], nucleotide 451 of SEQ ID NO:33 [marker 710]; nucleotide 326 of SEQ ID NO:34 [marker 217456], nucleotide occurrences for at least one of: nucleotide 61 of
- SNPs are latent SNPs for eye pigmentation in that they make up the latent haplotypes identified in Example 17.
- a method according to this aspect ofthe invention can infer hair color or hair shade as the pigmentation trait, and can identify the nucleotide occurrence for at least one of: nucleotide 201 of SEQ DD NO:27 [marker 559], nucleotide 61 of SEQ TD NO:25 [marker 560], nucleotide 442 of SEQ DD NO:4 [marker 217438], nucleotide 619 of SEQ ID NO:5 [marker 217439], nucleotide 646 of SEQ ED NO:6 [marker
- the method ofthe invention that include identifying a nucleotide occurrence in the sample for at least one pigmentation-related SNP from a pigmentation gene, as discussed above, in preferred embodiments can include grouping the nucleotide occunences ofthe pigmentation-related SNPs for a pigmentation gene into one or more identified haplotype alleles of a pigmentation-related haplotype. To infer the pigmentation trait ofthe subject, the identified haplotype alleles are then compared to known haplotype alleles ofthe pigmentation-related haplotype, wherein the relationship ofthe known haplotype alleles to the genetic pigmentation trait is known.
- the present method provides a method for inferring a genetic pigmentation trait of a mammalian subject from a biological sample ofthe mammalian subject.
- the method includes identifying a nucleotide occurrence in the sample for a pigmentation-related single nucleotide polymo ⁇ hism (SNP) from a pigmentation gene, wherein the pigmentation gene is other than melanocortin-1 receptor (MCIR).
- SNP single nucleotide polymo ⁇ hism
- MCIR melanocortin-1 receptor
- the nucleotide occurrence is associated with the pigmentation trait ofthe mammalian subject, thereby allowing an inference to be drawn related to pigmentation trait ofthe mammalian subject.
- the invention provides a method for inferring race of a human subject from a biological sample ofthe human subject.
- the method includes identifying in the nucleic acid sample, the nucleotide occurrence of at least one race- related single nucleotide polymo ⁇ hism (SNP) of a race-related gene.
- SNP race-related single nucleotide polymo ⁇ hism
- Racial classifiers can assist retrospective case work because, for various reasons, including within-individual mixture, race is not always easily discemable in certain individuals.
- a good racial classification tool that genetically defines a person's racial and ethnic background (including mixture) can legally justify the choice of reference database(s) used for calculating exclusion probabilities.
- racial classification markers can be (and are) used to guide criminal investigations towards individuals that cannot be racially excluded.
- a racial classification result can provide just cause for legally requesting a DNA specimen from a suspect, and in so doing, create a leverage crux for maximizing the efficacy of our criminal justice system.
- STR markers currently in use i.e., F13A, TH01, FES/FPS and VWA
- a collection of such markers may effectively resolve racial origin in most cases, the statistical distributions are such that 5-10% of classifications are ambiguous (Brenner, Proceedings 7 th Intl. Symposium on Hum. Identification 4892, 1997).
- Sampling bias can cause estimated frequencies to appear smaller or greater than they really are, artificially inflating or deflating (sometimes dramatically) the log likelihood ratios of racial classification (Brenner, Proceedings 7 th Intl. Symposium on Hum. Identification 4892, 1997). Problems such as these are unique to multi-allelic markers such as STRs.
- a positive by-product of STR allelic complexity is that relatively few loci need be measured for each test to identify a human, or infer his or her ethnic origin. Indeed, because this reduces the number of assays that need to be executed for each sample, this is one reason they are used.
- a negative by-product of this complexity is that very large databases are required in order to estimate allele frequencies, which are necessary for identity or racial exclusion calculations. For this reason, loci of complex allelic structure impose unique statistical problems for both identity testing and racial inference.
- bi-allelic tests involve the measurement of larger numbers of loci of simpler allelic structure to obtain the same statistical power as STR markers, because there are only two alleles for each locus in the population.
- SNPs small number of alleles
- fewer individuals from each population are necessary for accurate minor allele frequency determinations in reference databases. Since so many SNPs are available, those with reasonable minor allele frequencies can be selected so that the minor allele frequencies are relatively high compared to STR alleles. This potentially renders sampling bias issues mute and allows for the use of smaller reference databases in identity and racial exclusion calculation. Reference database sizes being equal, the statistical power of SNP-based identity determination and racial inference is likely to be greater due to the sheer number of SNPs that can be used.
- the invention provides a panel of 64 "Significant markers of race,” which are SNPs whose association with a particular race of a subject is strong enough to be detected using simple genetics approaches. As illustrated in Example 14, significant markers of race show a race- biased frequency distribution. Significant markers of race can also be refened to as "race-related SNPs.”
- a method according to this aspect ofthe invention that relates to an inference of race includes methods wherein the nucleotide occurrence of at least 2 race-related SNPs are identified.
- the method can further comprise grouping the identified nucleotide occurcences ofthe race-related SNPs into one or more race-related haplotype alleles, which exhibit a race-biased frequency distribution.
- Allele frequencies can be calculated for haplotypes and pair-wise haplotype frequencies estimated using an EM algorithm (Excoffier and Slatkin 1995).
- Linkage disequilibrium coefficients can then be calculated.
- chi-square statistics and other population genetic parameters such as Panmitic indices can be calculated to control for ethnic, ancestral or other systematic variation between the case and control groups.
- Markers/haplotypes with value for distinguishing the case matrix from the control can be presented in mathematical form describing any relationship and accompanied by association (test and effect) statistics.
- a statistical analysis result which shows an association of a SNP marker or a haplotype with a pigmentation trait with at least 80%, 85%, 90%, 95%, or 99%, most preferably 95% confidence, or alternatively a probability of insignificance less than 0.05.
- the panel of significant markers of race provided herein in Example 14, are SNP markers in the major human pigmentation and xenobiotic metabolism genes, as well as other genes, that can be used to infer the ethnic origin of a DNA specimen with near perfect accuracy in a sample of Asian, African, and Caucasian descent.
- SNP markers in the major human pigmentation and xenobiotic metabolism genes, as well as other genes, that can be used to infer the ethnic origin of a DNA specimen with near perfect accuracy in a sample of Asian, African, and Caucasian descent.
- Example 17 a series of penetrant haplotypes and a series of latent haplotypes for eye color.
- the SNPs of these penetrant and latent haplotypes are also significant markers of race, and can be used to infer the race of a subject with near perfect accuracy.
- the combination of haplotypes of Example 17, which includes these SNPs can be used to infer race.
- the race-related gene ofthe methods of this aspect ofthe invention can include a pigmentation gene or a xenobiotic gene, or any other gene in which a statistically significant association with a particular race or group of races (e.g., Asian and African populations) for a nucleotide occunence of a SNP or a haplotype occurring within the gene, is observed.
- Race-related SNPs are SNPs with genotype distributions and allele frequencies that are statistically different between the three ethnic groups (See e.g., Example 14). Minor alleles for each of these 68 SNP markers were preferentially represented in one ofthe three major racial groups tested (Asians, African Americans or Caucasians) and many of these SNPs showed dramatic differences between the groups.
- the race-related gene can include at least one of oculocutaneous albinism II (OCA2), agouti signaling protein (ASIP), CYP2D6, tyrosinase-related protein 1 (TYRP 1 ), cytochrome p450-2 (CYP2C9), cytochrome p450-3 (CYP3 A4), tyrosinase (TYR), melanocortin-1 receptor (MCIR), adaptor-related protein complex 3, beta 1 subunit (AP3B1), AP3D1, dopachrome tautomerase (DCT), silver homolog (SILV), AIM-1 protein (LOC51151), proopiomelanocortin (POMC), ocular albinism 1 (OAl), microphthalmia-associated transcription factor (MITF), myosin VA (MYO5A),
- OCA2 oculocutaneous albinism II
- ASIP agouti signaling protein
- CYP2D6 tyrosinas
- This method can further include in the nucleic acid sample at least one nucleotide occunence for at least a second race-related SNP of at least a second race- related gene.
- the second race-related gene can be OCA2, ASIP, TYRPl, TYR,
- AP3B1 AP3D1, DCT, SILV, LOC51151, POMC, OAl, MITF, MYO5A, RAB27A, F2RL1, melanocortin-1 receptor (MCIR), CYP2D6, CYP2C9, CYP3A4, AP3B1, HMGCR, FDPS, AHR, or CYPIAI, or any combination thereof.
- the present disclosure reveals that pigmentation genes and xenobiotic genes appear to include an unusually large number of significant markers of race, and these markers are strong indicators of race, as illustrated in Example 14. That is, the present disclosure reveals that the pigmentation and xenobiotic genes appear to be sinks for accumulating these kinds of SNPs over evolutionary time. Therefore, the race-related gene in this aspect ofthe invention can include one or more pigmentation gene and/or one or more xenobiotic genes.
- the race-related SNPs disclosed herein not only can be useful for inferring race but can be useful for inferring pigmentation traits through conelation.
- Example 14 illustrate methods of inferring an individual's race.
- the inference typically involves using a complex model that involves using known relationships of known alleles or nucleotide occunences as classifiers. As illustrated in Example 17, the inference can be drawn by applying data regarding the subject's race-related haplotype allele(s) to a complex model that makes a blind, quadratic discriminate classification using a variance-covariance matrix.
- Various classification models are discussed in more detail herein, and illustrated in the Examples.
- a method according to this aspect ofthe invention that relates to an inference of race includes methods wherein the nucleotide occunence of at least 2 race-related SNPs are identified.
- the method can further comprise grouping the identified nucleotide occurrences ofthe race-related SNPs into one or more race-related haplotype alleles, wherein the relationship ofthe haplotype alleles to race is known.
- the race-related haplotype can be at least one of the following race-related haplotypes: a) nucleotides ofthe DCT gene corresponding to a DCT-A haplotype, which includes: nucleotide 609 of SEQ JD NO: 1 [702], nucleotide 501 of SEQ JD NO:2 [650], and nucleotide 256 of SEQ ID NO:3 [marker 675]; b) nucleotides ofthe MCIR gene conesponding to an MC1R-A haplotype, which includes: nucleotide 442 of SEQ JD NO:4 [217438], nucleotide 619 of SEQ ID NO:5 [217439], and nucleotide 646 of SEQ ID NO:6 [217441]; or c) nucleotides ofthe OCA2 gene corresponding to an OCA2-A haplotype, which includes: nucleotide 135 of SEQ DD NO:
- these race-related haplotype can further include at least one ofthe following haplotypes: i) nucleotides ofthe ASD? gene conesponding to a ASEP-A haplotype, which comprises: nucleotide 201 of SEQ DD NO:26 [marker 552], and nucleotide 201 of SEQ ED NO:28 [marker 468]; j) nucleotides ofthe DCT gene corresponding to a DCT-B haplotype, which comprises: nucleotide 451 of SEQ DD NO:33 [marker 710], and nucleotide 657 of SEQ DD NO:29 [marker 657]; k) nucleotides ofthe SILV gene conesponding to a SILV-A haplotype, which comprises: nucleotide 61 of SEQ ID NO:35 [marker 656], and nucleot
- At least one race-related haplotype allele includes a combination of haplotype alleles ofthe MC1R-A haplotype, the OCA2-A haplotype, the OCA2-B haplotype, the OCA2-C haplotype, the OCA2-D haplotype, the OCA2-E haplotype, the TYRPl-B haplotype, and the DCT-B haplotype.
- the at least one haplotype allele of a) - m) above can include at least one haplotype allele in each of the ASJP-A haplotype, the DCT-B haplotype, the SILV-A haplotype, the TYR-A haplotype, and the TYRPl -A haplotype.
- the race-related haplotype allele is a combination of haplotype alleles that includes: a) the MC1R-A haplotype allele CCC; b) the OCA2-A haplotype allele TTAA, CCAG, or TTAG; c) the OCA2-B haplotype allele CAA, CGA, CAC, or CGC; d) the OCA2-C haplotype allele GGAA, TGAA, or TAAA; e) the OCA2-D haplotype allele AGG or GGG; f) the OCA2-E haplotype allele GCA; g) the TYRPl-B haplotype allele TC; and h) the DCTB gene haplotype allele CTG or GTG
- this method that includes all the haplotypes for race can further include a combination of haplotype alleles that includes, i) the ASEP-A haplotype allele TTAA, CCAG, or TTAG; c) the OCA2-B
- a method according to this aspect ofthe invention can include determining the nucleotide occunence for at least one ofthe SNPs disclosed herein as segregating preferentially with eye shade or hair shade.
- SNPs include: nucleotide 609 of SEQ ID NO: 1 [marker 702], nucleotide 501 of SEQ DD
- nucleotide 6 [marker 650], nucleotide 256 of SEQ ED NO:3 [marker 675], nucleotide 442 of SEQ DD NO:4 [marker 217438], nucleotide 619 of SEQ DD NO:5 [marker 217439], nucleotide 646 of SEQ ID NO:6 [marker 217441]; nucleotide 135 of SEQ DD NO:7 [marker 217458], nucleotide 193 of SEQ DD NO:8 [marker 886894], nucleotide 228 of SEQ ID NO:9 [marker 886895], nucleotide 245 of SEQ JD NO: 10 [marker 886896], nucleotide 189 of SEQ ED NO:ll [217452], nucleotide 573 of SEQ ED NO:12 [712052], nucleotide 245 of SEQ DD NO:13 [marker 886994], nucle
- a method according to this aspect ofthe invention can include determining the nucleotide occurrence for at least one of: nucleotide 442 of SEQ ID NO:4 [marker 217438], nucleotide 619 of SEQ ID NO:5 [marker 217439], nucleotide 646 of SEQ ID NO:6 [marker 217441]; nucleotide 193 of SEQ ID NO:8 [marker 886894], nucleotide 228 of SEQ ID NO:9 [marker 886895], nucleotide 245 of SEQ ID NO:10 [marker 886896], nucleotide 189 of SEQ HD NO:l 1 [217452], nucleotide 573 of SEQ ID NO:12 [712052], nucleotide 245 of SEQ ID NO:13 [marker 886994], nucleotide 643 of SEQ ED NO:14 [marker 712057], nucleotide 539 of
- SNPs listed above can be used to infer the ethnic origin of a DNA specimen with near perfect accuracy in a sample of Asian, African, and Caucasian descent.
- the invention also relates to a method for classifying an individual as being a member of a group sharing a common characteristic.
- a method for classifying an individual can be performed, for example, by identifying a nucleotide occurrence of a SNP in a polynucleotide ofthe individual, wherein the SNP corresponds to nucleotide 473 of SEQ ED NO:45 [marker 217486], nucleotide 224 of SEQ DD NO:47 [marker 869745], nucleotide 314 of SEQ ID NO:46 [marker 869787], nucleotide 210 of SEQ DD NO:20 [marker 886892], nucleotide 228 of SEQ DD NO:9 [marker 886895], nucleotide 245 of SEQ ID NO:10 [marker 886896], nucleotide 169 of SEQ DD NO:48 [marker
- a method according to this aspect ofthe invention can include an amplification reaction, a primer extension reaction, or an immiinoassay to identify the nucleotide occunence ofthe SNP.
- the invention provides a method for detecting a nucleotide occunence for a single nucleotide polymo ⁇ hism (SNP) of a human pigmentation gene.
- the method includes: i) incubating a sample that includes a polynucleotide with a specific binding pair member, wherein the specific binding pair member specifically binds at or near a polynucleotide suspected of being polymo ⁇ hic, wherein the polynucleotide comprises one ofthe nucleotide occurrences corresponding to at least one of nucleotide 473 of SEQ ID NO:45 [marker 217486], nucleotide 224 of SEQ DD NO:47 [marker 869745], nucleotide 314 of SEQ DD NO:46 [marker 869787], nucleotide 210 of SEQ ED NO:20 [marker 886892], nucleotide 228 of SEQ DD NO:9 [marker
- the invention provides an isolated primer pair for determining a nucleotide occurrence of a single nucleotide polymo ⁇ hism (SNP) in a polynucleotide.
- a forward primer ofthe primer pair binds the polynucleotide upstream ofthe SNP position on one strand and a reverse primer binds the polynucleotide upstream ofthe SNP position on a complementary strand.
- the invention provides an isolated specific binding pair member for determining a nucleotide occunence of a single-nucleotide polymo ⁇ hism (SNP) in a polynucleotide.
- the specific binding pair member for this aspect ofthe invention specifically binds to the polynucleotide at or near nucleotide 473 of SEQ DD NO:45 [marker 217486], nucleotide 224 of SEQ ID NO:47 [marker 869745], nucleotide 314 of SEQ ID NO:46 [marker 869787], nucleotide 210 of SEQ DD NO:20 [marker 886892], nucleotide 228 of SEQ ED NO:9 [marker 886895], nucleotide 245 of SEQ ED NO: 10 [marker 886896], nucleotide 169 of SEQ DD NO:48 [marker 886933], nucleotide 214 of SEQ EQ
- the specific binding pair member can be used to identify the nucleotide occunence at a SNP, for example a pigmentation-related SNP using methods described above for identifying SNPs.
- Many types of specific binding pair members are known in the art.
- the specific binding pair member can be a polynucleotide probe, an antibody, or a substrate for a primer extension reaction.
- the specific binding pair member is a primer that binds to a polynucleotide at a sequence comprising the SNP as the terminal nucleotide.
- methods such as SNP-IT (Orchid BioSciences) utilize primer extension reactions using a primer whose terminal nucleotide binds selectively to certain nucleotides at a SNP loci, to identify a nucleotide occunence at the SNP loci.
- the invention provides an isolated polynucleotide that includes at least 30 nucleotides ofthe human OCA2 gene, where the polynucleotide includes one or more of a thymidine residue at a nucleotide corresponding to nucleotide 193 of SEQ ID NO:8 [marker 886894], a guanidine residue at a nucleotide corresponding to nucleotide 228 of SEQ ID NO:9 [marker 886895], a cytidine residue at a nucleotide conesponding to nucleotide 210 of SEQ DD NO: 23 [marker 886892], a thymidine residue at a nucleotide conesponding to nucleotide 245 of SEQ DD NO: 10 [marker 886896], a adenosine residue at a nucleotide corresponding to nucleotide 245 of SEQ ID NO:13 [marker 886894
- the isolated polynucleotide can be 50, 100, 150, 200, 250, 500, 1000, etc. nucleotides in length. In certain embodiments of this aspect ofthe invention, the isolated polynucleotide can be at least 50, at least 100, at least 150, at least 200, at least 250, at least 500, at least 1000, etc. nucleotides in length.
- the invention provides an isolated polynucleotide comprising at least 30 nucleotides ofthe human TYRP gene, wherein the polynucleotide includes one or more of a thymidine residue at a nucleotide conesponding to nucleotide 172 of SEQ DD NO:23 [marker 886938], a thymidine residue at a nucleotide corresponding to nucleotide 216 of SEQ DD NO: 24 [marker 886943], a thymidine residue at a nucleotide conesponding to nucleotide 473 of SEQ ID NO:45 [marker 217486], a cytidine residue at a nucleotide conesponding to nucleotide 224 of SEQ ID NO:47 [marker 869745], a guanidine residue at a nucleotide corresponding to nucleotide 314 of SEQ DD NO:46 [mark
- the isolated polynucleotide can be at least 50, at least 100, at least 150, at least 200, at least 250, at least 500, at least 1000, etc. nucleotides in length.
- the invention provides an isolated polynucleotide at least 30 nucleotides in length, wherein the isolated polynucleotide includes: a) a segment ofthe DCT gene wherein nucleotides CTG or GTG occur at positions corresponding to nucleotide 609 of SEQ ED NO: 1 [marker 702], nucleotide 501 of SEQ ID NO:2 [marker 650], and nucleotide 256 of SEQ ID NO:3 [marker 675] [marker 675], respectively; b) a segment ofthe MCIR gene wherein nucleotides CCC, CTC, TCC or CCT occur at positions corresponding to nucleotide 442 of SEQ JD NO:4 [217438], nucleotide 619 of SEQ JD NO:5 [217439], and nucleotide 646 of SEQ ID NO: 6 [217441], respectively; c) a segment ofthe OCA2 gene wherein nucleot
- TTAG occur at positions conesponding to nucleotide 135 of SEQ DD NO:7 [217458], nucleotide 193 of SEQ ID NO:8 [886894], nucleotide 228 of SEQ HD NO:9 [886895], and nucleotide 245 of SEQ DD NO: 10 [886896], respectively; d) a segment ofthe OCA2 gene wherein nucleotides CAA, CGA, CAC, or CGC occur at positions conesponding to nucleotide 189 of SEQ ID NO: 11 [217452], nucleotide 573 of SEQ DD NO: 12 [712052], and nucleotide 245 of SEQ DD NO: 13 [886994], respectively; e) a segment ofthe OCA2 gene wherein nucleotides GGAA, TGAA, and TAAA occur at positions corresponding to nucleotide 643 of SEQ DD NO: 14 [712057], nucleot
- the invention provides an isolated polynucleotide at least 30 positions in length, wherein the isolated polynucleotide includes: a) a segment ofthe ASIP gene wherein nucleotides GT or AT occur at positions conesponding to nucleotide 201 of SEQ ED NO:26 [552], and nucleotide 201 of SEQ ID NO:28 [468], respectively; b) a segment ofthe DCT gene wherein nucleotides TA or TG occur at positions conesponding to nucleotide 451 of SEQ DD NO:33 [710], and nucleotide
- GTT occur at positions conesponding to nucleotide 442 of SEQ DD NO:44 [217485], nucleotide 442 of SEQ DD NO:48 [886933], and nucleotide 442 of SEQ DD NO:49
- This isolated polynucleotide includes the alleles for latent eye color or eye shade haplotypes.
- the isolated polynucleotide can be 50, 100, 150, 200, 250, 500, 1000, etc. nucleotides in length.
- the invention provides an isolated polynucleotide at least 30 positions in length, which includes: a) a segment ofthe ASIP gene wherein nucleotides GA or AA occur at positions conesponding to nucleotide 201 of SEQ DD NO:27 [559], and nucleotide 61 of SEQ DD NO:25 [560], respectively; b) a segment of the MC 1 R gene wherein nucleotides CCC, CTC, TCC or CCT occur at positions conesponding to nucleotide 442 of SEQ DD NO:4
- nucleotide 1 [217441], respectively; c) a segment ofthe OCA2 gene wherein nucleotides AGG or AGA occur at positions conesponding to nucleotide 418 of SEQ DD NO:16 [712060], nucleotide 210 of SEQ ID O:20 [886892], and nucleotide 245 of SEQ ID NO:10
- This isolated nucleotide includes one or any combination of alleles for penetrant eye color or eye shade haplotypes.
- the isolated polynucleotide is derived from the OCA2 gene and includes any combination of c-f.
- the isolated polynucleotide can be 50, 100, 150, 200, 250, 500, 1000, etc. nucleotides in length.
- the isolated polynucleotide can be at least 50, at least 100, at least 150, at least 200, at least 250, at least 500, at least 1000, etc. nucleotides in length.
- the invention provides a method for identifying genes, including pigmentation genes, SNPs, SNP alleles, haplotypes, and haplotype alleles that are statistically associated with a pigmentation trait.
- This aspect ofthe invention provides commercially valuable research tools, for example. The approach can be perfonned generally as follows:
- Examples 4, 14, and 17, illustrate general approaches for discovering pigmentation-related SNPs and SNP alleles as provided above.
- pigmentation-related SNPs and SNP alleles can be discovered using DNA from blood samples of patients exhibiting variable eye, skin and skin pigmentation levels (colors). Data on eye color, hair color, skin color, and race can also be collected and analyzed for patients providing the blood samples.
- Assays for identifying the alleles of a SNP or a SNP candidate can be performed using, for example, an Orchid SNPstream 25K instrument (Orchid BioSciences, Inc., Princeton, NJ) for high throughput genotyping.
- Other assays known in the art, as described above for identifying nucleic acid occunences at SNPs can be used for this step, as will be readily apparent to a skilled artisan.
- Specimens from patient samples can be used as a template for amplification using a polymerase, such as of Pfu turbo thermostable DNA polymerase, Taq polymerase, or a combination thereof.
- Amplification can be performed using standard conditions. For example, amplification can be performed in the presence of 1.5 mM MgCl 2 , 5 mM KCl, 1 mM Tris, pH 9.0, and 0.1% Triton X-100 nonionic detergent.
- Amplification products can be cloned into a T-vector using the Clontech (Palo Alto CA) PCR Cloning Kit, transformed into Calcium Chloride Competent cells (Stratagene; La Jolla CA), plated on LB-ampicillin plates, and grown overnight.
- Clones can be selected from each plate, isolated by mini-prep using the Promega Wizard or Qiagen Plasmid Purification Kit, and sequenced using standard methods, such as using PE Applied Biosystems Big Dye Terminator Sequencing Chemistry. Sequences can be trimmed of vector sequence and quality trimmed, and deposited into an Internet based relational database system.
- Candidate SNPs can be also discovered from pigmentation-related or race- related (see below) genes ("data mining") using, for example, the NCBI SNP database, the Human Genome Unique Gene database (Unigene; NCBI). Sequence files for the genes can be downloaded from proprietary and public databases and input into a SNP/HAPLOTYPE automated pipeline discovery software system such as (SNiPDOC SM system; DNAPrint genomics, Inc.; SarasotaFL). This system finds candidate SNPs among the sequences, and documents haplotypes for the sequences with respect to these SNPs. The software uses a variety of quality control metrics when selecting candidate SNPs including the use of user specified stringency variables, the use of PHRED quality control scores and others (See U.S. Pat. App. No. Serial No.: 09/964,059, filed September 26, 2001).
- the invention provides methods for discovering penetrant haplotype alleles.
- the method can use an iterative, empirical approach to test haplotype alleles of all possible SNP combination within a gene, for the ability to statistically resolve individuals of various trait values.
- prefened haplotype alleles discovered in a population can be analyzed.
- the invention provides a method for identifying a pigmentation-related or a race-related single nucleotide polymo ⁇ hism (SNP).
- the method includes: i) identifying a candidate SNP of a pigmentation-related gene or a race-related gene; ii) determining that the SNP has a genotype class comprising alleles exhibiting a coherent inheritance pattern, and a minor allele frequency that is greater than 0.01 in at least one race, thereby identifying a validated SNP; iii) determining that the validated SNP exhibits significantly different genotype distributions and allele frequencies between individuals of different pigmentation phenotypes or racial classes, thereby identifying a pigmentation-related or race-related SNP.
- kits which can be used, for example, to perform a method ofthe invention.
- the invention provides a kit for identifying haplotype alleles of pigmentation-related SNPs.
- a kit can contain, for example, an oligonucleotide probe, primer, or primer pair, or combinations thereof, ofthe invention, such oHgonucleotides being useful, for example, to identify a SNP or haplotype allele as disclosed herein; or can contain one or more polynucleotides corresponding to a portion of a pigmentation, xenobiotic, or other relevant gene containing one or more nucleotide occurrences associated with a genetic pigmentation trait, with race, or with a combination thereof, such polynucleotide being useful, for example, as a standard (control) that can be examined in parallel with a test sample.
- a kit ofthe invention can contain, for example, reagents for performing a method ofthe invention, including, for example, one or more detectable labels, which can be used to label a probe or primer or can be inco ⁇ orated into a product generated using the probe or primer (e.g., an amplification product); one or more polymerases, which can be useful for a method that includes a primer extension or amplification procedure, or other enzyme or enzymes (e.g., a ligase or an endonuclease), which can be useful for performing an oligonucleotide ligation assay or a mismatch cleavage assay; and/or one or more buffers or other reagents that are necessary to or can facilitate performing a method ofthe invention.
- one or more detectable labels which can be used to label a probe or primer or can be inco ⁇ orated into a product generated using the probe or primer (e.g., an amplification product)
- polymerases which can be useful
- a kit ofthe invention includes one or more primer pairs of the invention, such a kit being useful for performing an amplification reaction such as a polymerase chain reaction (PCR).
- a kit also can contain, for example, one or reagents for amplifying a polynucleotide using a primer pair ofthe kit.
- the primer pair(s) can be selected, for example, such that they can be used to determine the nucleotide occunence of a pigmentation-related SNP, wherein a forward primer of a primer pair selectively hybridizes to a sequence ofthe target polynucleotide upstream ofthe SNP position on one strand, and the reverse primer ofthe primer pair selectively hybridizes to a sequence ofthe target polynucleotide upstream ofthe SNP position on a complementary strand.
- a forward primer of a primer pair selectively hybridizes to a sequence ofthe target polynucleotide upstream ofthe SNP position on one strand
- the reverse primer ofthe primer pair selectively hybridizes to a sequence ofthe target polynucleotide upstream ofthe SNP position on a complementary strand.
- the kit can further include a probe that selectively hybridizes to the amplification product of one ofthe nucleotide occunences of a SNP, but not the other nucleotide occurrence.
- the kit can include a third primer which can be used for a primer extension reaction across the SNP loci using the amplification product as a template.
- the third primer preferably binds to the SNP loci such that the nucleotide at the 3' terminus ofthe primer is complementary to one ofthe nucleotide occunences at the SNP loci.
- the primer can then be used in a primer extension reaction to synthesize a polynucleotide using the amplification product as a template, preferably only where the nucleotide occunence is complementary to the 3 ' nucleotide ofthe primer.
- the kit can further include the components ofthe primer extension reaction.
- a kit ofthe invention provides a plurality of oligonucleotides ofthe invention, including one or more oligonucleotide probes or one or more primers, including forward and/or reverse primers, or a combination of such probes and primers or primer pairs.
- a kit provides a convenient source for selecting probe(s) and/or primer(s) useful for identifying one or more SNPs or haplotype alleles as desired.
- Such a kit also can contain probes and/or primers that conveniently allow a method ofthe invention to be performed in a multiplex format.
- the kit can also include instructions for using the probes or primers to identify a pigmentation-related haplotype allele.
- the power ofthe inference drawn according to the methods ofthe invention is increased by using a complex classifier function. Accordingly, prefened examples of the methods ofthe invention draw an inference regarding a pigmentation trait or race of a subject using a classification function.
- a classification function applies nucleotide occunence information identified for a SNP or set of SNPs such as one or preferably a combination of haplotype alleles, to a set of rules to draw an inference regarding a pigmentation trait or a subject's race.
- the Examples included herein provide numerous strategies for developing and implementing a classifier function.
- Example 7 shows that a classification scheme may be identified by performing statistical analysis on various combinations of SNPs and haplotypes until maximum accuracy is achieved..
- haplotypes inco ⁇ orating each of these positions in individuals of a known pigmentation trait can be scored, and the results can be combined in various combinations in order to obtain the optimum solution for resolving individuals for that pigmentation trait, for example individuals with dark versus light hair color.
- Example 7 illustrates a composite, nested solution for classifying an unknown individual as belonging to the dark versus light hair colored groups.
- genotype/biographical data matrices for two groups of pigmentation traits can be used for a pattern detection algorithm such as the SNiPDOCS SM algorithm (DNAPrint genomics, Inc., Sarasota, FL).
- the pu ⁇ ose of pattern detections algorithms is to fit quantitative (or Mendelian) genetic data with continuous trait distributions (or discrete trait distributions, as the case may be).
- Example 9 One specific approach that can be used, as illustrated in Example 9, is a Bayesian method, using the frequencies of, for example eye color classes, as the prior probabilities and the frequency of a haplotype based genotype in the eye color class as the class conditional density functions.
- the posterior probability that a subject belongs to a given class of eye color shade is simply the product ofthe posterior probabilities derived for each ofthe four genes, and the eye color class with the highest probability is selected.
- the power ofthe inference drawn by this method can be increased by assigning weights to the posterior probabilities for each haplotype system, based on the amount of variance each explains on its own.
- a nested statistical scheme can be developed, as illustrated in Example 9, by which to construct classification rules using complex, compound genotypes.
- a Bayesian classifier can also be used for this task.
- a routine can be chosen that resembles a genetic algorithm.
- the scheme builds a classification tree in a step-wise manner. The roots ofthe tree are genotypes of a randomly selected haplotype system. Nodes are randomly selected genotype classes, within which there are numerous different constituent genotypes.
- Compound genotype classes contain more than one compound genotype, the constituents of which are derived from a discrete combination of haplotype systems.
- edges connect roots and nodes to comprise compound genotype classes.
- the tree can be built by first selecting a set of roots and growing the edges to nodes based on the genetic distinction between individuals of light (blue, green) and dark (black, brown) eye color shade within the new compound genotype class defined by the connection (hazel is always assigned to the eye color shade with the most members).
- hazel is always assigned to the eye color shade with the most members.
- a pair-wise F statistic and associated p-value is used to measure the genetic structure differences between individuals ofthe various shade of eye colors, though an exact test p-value has also been used with similar results. Individuals of ambiguous haplotype class (less than 75% certainty) are discarded and classified as "not classifiable".
- All possible nodes not yet inco ⁇ orated in the path from the root are tested during each new branching step.
- the branch that results in the most distinctive partition (i.e., the lowest p-value) among the classes of eye color shade is selected. If there is no genetic structure within the new compound genotype class, another node (haplotype) is selected for possible branching, unless there are no more haplotype systems to consider or unless the sample size for the compound genotype is below a certain pre-selected threshold (in which case a "no-decision" is specified). If the lowest p-value for the new compound genotype class is significant, rules are made from its constituent compound genotypes exhibiting significant chi-square residuals.
- genotypes within the compound genotype class which are not explainable are segregated from the rest ofthe compound genotypes within the class to form new nested node(s), from which further branching is accomplished.
- Nested nodes always represent new compound genotype classes at first. If branching from this nested node does not result in the ability to create classification rules, the algorithm returns to the compound genotype class from which the nested node was derived and recreates N nested nodes of N constituent compound genotypes. In either case, nested nodes are only created from nodes with statistically significant population structure differences among the shade of eye color classes.
- this algorithm allows for the maximum amount of genetic variance contributed by the various combinations of haplotype systems to be learned within specific genetic backgrounds.
- the rules produced from it are used to predict the race or pigmentation trait, for example eye shade, of each individual. If the prediction rate is good (e.g., 95% or greater) the process ends, and if it is not, the process is begun again starting with a new haplotype system for the root.
- the classification function can also be performed using other classification methods, such as those disclosed in "Classification and Regression Trees" by Leo Brieman Charles J. Stone Richard A. Olshen Jerome H.
- Classification trees can be applied to individual haplotypes, or to improve the accuracy ofthe inference drawn using the classification trees, can be appHed to combinations of haplotypes.
- Example 6 discusses a general method for qualifying a genetic association between a haplotype and a phenotype using a cladogram or a parsimony tree. In the parsimony tree, lines separate haplotypes that are one mutational step from another and biallelic positions within a gene are represented in binary form (1 and 0): Haplotypes residing at sirriilar regions of a cladogram or tree tend to share common phenotypic attributes.
- haplotype analysis using the cladogram provides a useful means for representing genetic data in such a way as to facilitate multivariate analyses for the determination ofthe biological relevance ofthe haplotype, as discussed in further detail in Example 6.
- the classification function can be developed using linear, quadratic, or conespondence analysis or classification tree multivariate modeling to develop a classifier function inco ⁇ orating one or more SNPs or sets of SNPs that blindly generalizes to other individuals having a known pigmentation trait.
- conespondence analysis is used to encode genotypes for creating the vectors. This overcomes a problem associated with dimensionality, and then the vector components are weighted using a heuristic algorithm to optimize the classifier.
- the invention includes a method for identifying a classifier function for inferring a pigmentation-trait of a subject.
- the method includes: i) identifying one or more candidate SNPs of one or more pigmentation genes that have a alleles exhibiting a coherent inheritance pattern (i.e., they are in Hardy- Wienberg equilibrium), and a minor allele frequency that is greater than 0.01 in at least one race, thereby identifying one or more validated SNPs; ii) determining that the one or more validated SNPs exhibits significantly different genotype distributions and allele frequencies between individuals of different pigmentation phenotypes or racial classes, and iii) Using linear, quadratic, correspondence analysis or classification free multivariate modeling to develop an abstract classifier function inco ⁇ orating one or more validated SNPs or combinations of validated SNPs that blindly generalizes to other individuals of known pigmentation, thereby identifying a pigmentation-related classification strategy.
- the invention includes a method for identifying a classifier function for inferring the race of a subject.
- the method includes: i) identifying one or more candidate SNPs of one or more race-related genes that have a genotype class comprising alleles exhibiting a coherent inheritance pattern, and a minor allele frequency that is greater than 0.01 in at least one race, thereby identifying one or more validated SNPs; ii) determining that the one or more validated SNPs exhibits significantly different genotype distributions and allele frequencies between individuals of different pigmentation phenotypes or racial classes, and iii) Using linear, quadratic, conespondence analysis or classification tree multivariate modeling to develop an abstract classifier function inco ⁇ orating one or more validated SNPs or combinations of validated SNPs that blindly generalizes to other individuals of known race, thereby identifying a classifier function for inferring the race of a subject.
- the invention provides a method for classifying a sample.
- the method includes: a) computing a genetic variance/covariance matrix for all possible trait class pairs; b) creating a combination of class mean vectors, wherein vector components are binary encodings, conespondence analysis principal coordinates, conespondence analysis factor scores or conespondence analysis standard coordinates; c) representing a sample as an n-dimensional sample vector; and d) classifying a sample by identifying a class mean vector from the combination of class mean vectors, that is the shortest distance from the sample.
- a method is illustrated in Example 14.
- Example 17 illustrates the use of a classification function that uses a parametric, multivariate Quadratic classification technique with modifications for genomics data.
- a classification procedure introduced previously by Fisher, R.A. (Annals of Eugenics 1936. 7:179-188), Rao (1947, 1948a, 1948b) and Smith (Smith, C.A.B., et al., Annals of Eugenics 1948; 13:272-282), can be applied.
- sequences may contribute towards phenotype variation through dominance or additivity, wherein their associations with trait values from independent analyses are of varying degrees of strength, but statistically significant. Alternatively, sequences may contribute through epistasis, wherein their association with trait values from independent analyses is weak or non-existent.
- an optimal weighting strategy By successively selecting random combinations of weakly/non-associated pigmentation gene features for weighting and testing how well the model derived from these combinations generalizes to the test sample for iris color classification, an optimal weighting strategy can be obtained.
- Recoding in this manner generally increases the variability ofthe scores of weakly/non-associated sequences and hence it improves the discriminating power ofthe model.
- the coding procedure may seem arbitrary, it is important from a practical point of view. For example, there are instances in the areas of statistical forecasting of time series or economics, wherein a data supported methods are recommended, as long as they lead to relatively more accurate inferences.
- the weighting used for its generation can provide clues on the non-linear relationships between genotypes of different genes towards complex trait variation (i.e., epistasis).
- a Monte Carlo simulation study can be used.
- a computer program can be written to use a random number generator to select a significant number of individuals on the basis of observed allele frequencies from two pigmentation-trait groups to calculate a multivariate linear classification probability matrix. This experiment can be repeated many times (e.g., 10000 times) to get the summary statistics of Classification and misclassification rates and their Confidence Intervals.
- Example 16 further discusses the recording method used in Example 17 for improving a classification analysis, especially those involving a sample mean vector and sample covariance matrix. This method utilizes additional information that is not reflected by these statistics.
- This procedure recodes weaker genotypes whenever they appear along with 'best' genotypes in an individual sample unit.
- the procedure can include the following: Step 1. Identify a small number of 'best' genotypes for cross-coding the weak genotypes. This can be done by selecting a subset ofthe 'best' genotype in each gene according to their range of variation in their relative frequencies. Various combinations can be attempted to arrive at an optimal selection.
- the study reported in Example 16 revealed an optimal choice ofthe three genotypes g (1,1) (OCA2A), g (3,1) (OCA2C) and g (4,1) (OCA2D). (Note: the first number in parenthesis denotes the haplotype and the second number the allele of that haplotype.
- G(l,l) would means genoytpe 1 for feature combination 1.
- ATTA/ATTA may be genotype 1 , ATTA/ATTG, genotype 2 etc for the OCA2-A SNP combination which is combination number 1.
- Step 2 Recode second best genotypes: Assign Code 0 if the genotype is absent
- n is the number of selected 'best' genotypes that occur together in an individual.
- Such recoding generally increases the variability of scores across the colors (while canying out the usual discriminant analysis), and hence one can expect a marginal improvement over the results obtained before inco ⁇ orating such a recoding procedure in them.
- a multi-step approach was designed to identify genes and gene variants in the population that are statistically associated with hair, eye and skin color. The approach was performed generally as follows:
- step 4) Use the results obtained in step 3) to identify polymo ⁇ hisms, and sets of polymo ⁇ hisms, that are quantitatively and statistically associated with pigmentation. No relationship to human pigmentation for any of the originally reported
- SNPs for the TYRPl gene 3 SNPs for the TYRPl gene and 5 SNPs for the OCA gene has previously been reported. Accordingly, the polymo ⁇ hisms were scored in hundreds of individuals of known hair, eye and skin color, and statistical analysis was performed on the results (see below). As disclosed herein, an SNP in the TYRPl gene (TYRP1_3), which appears to be statistically associated with eye color, and an SNP in the OCA gene (OCA2_5), which appears to be statistically associated with eye color and hair color, were identified.
- Polymo ⁇ hisms were scored using a single-nucleotide sequencing protocol and equipment purchased and licensed from Orchid Biosciences (Orchid SNPsfream 25K instrument, (Orchid BioSciences, Inc., Princeton, NJ)). Briefly, primers were designed to flank the polymo ⁇ hism (see Tables 1 to 4), whereby one primer of each pair contained 5' polythiophosphonate groups. Amplification products were physically attached to a solid substrate via the polythiophosphonate groups and washed using TNT buffer. Washed amplification products were subject to exonuclease III in order to produce single stranded, polythiophosphonate strands. A primer was attached via hybridization to the single stranded molecule, such that the primer could be extended by a single labeled nucleotide.
- the primers used for the OCA2_5 genotyping were: CAATCACAGCCAGTGCTGC (SEQ ID NO: 97); and
- GCGGTAATTTCCTGTGCTTCT (SEQ ID NO: 98).
- the primers used for the TYRP1_3 genotyping were AAAGGGTCTTCCCAGCTTTG (SEQ TD NO: 99); and GTGGTCTAACAAATGCCCTACTCTC (SEQ DD NO: 100).
- TYRPl polymo ⁇ hism if the inco ⁇ orated nucleotide was a G, a monoclonal antibody was bound in the first step and read via secondary antibody hybridization and conjugate catalyzed reaction in a colorimeter.
- the inco ⁇ orated nucleotide was a T
- the antibody did not bind and no color was read
- an antibody that recognizes the modified "T” was used.
- the amplification product for an individual contained a "T” at the position, the antibody bound, and was read via secondary binding and conjugate activity in the colorimeter.
- individuals ofthe "GG” genotype showed a dark blue color in the first reaction, which did not change during the second reaction.
- Individuals ofthe "GT” genotype showed a light blue color in the first reaction, which became dark blue during the second reaction.
- Individuals ofthe "TT” genotype showed no color in the first reaction, and a dark blue color in the second reaction.
- the letters read were GG, GA and AA, in the same manner.
- the SNPs for TYRP1_3 (marker 217485) and OCA2_5 (marker 217455) are shown in Table 1 which provides information regarding a marker number for each SNP, the name ofthe gene in which the SNP is found on the chromosome, a public sequence database accession number for a sequence that includes at least one allele of the SNP (where appropriate), the variant TUB code for the SNP, as well as additional information such as the type of polymo ⁇ hism (coding or non-coding).
- Results in Table 1-1 are segregated based on pigmentation, as well as on the ethnicity of the donor. If a SNP allele is a genetic determinant, or is linked to a genetic determinant of pigmentation, then it should be enriched in African Americans as compared to Caucasians because the average African American generally tends to have darker average skin, eye and hair color than the average Caucasian.
- an SNP allele is enriched in African Americans compared to Caucasians, it is not necessarily involved in pigmentation, because a) most alleles in almost all human genes show ethnic frequencies differences, which are sometimes quite large, and most of these human genes have nothing to do with pigmentation; and b) any SNP allele that is involved in human pigmentation must show the relationship within any one ethnic group as well as between ethnic groups; i.e., the validity of an SNP allele as a marker for pigmentation (or any trait) must be based on association between individuals of any one ethnic group as well as individuals between ethnic groups, and using race differences to qualify a SNP allele only addresses the latter.
- the results in this Example indicate that the TYRP1_3 SNP and OCA2_5 can have predictive value for human eye color, and that the G allele may be part of a multi-SNP haplotype that is deterministic of, or related to, haplotypes that are deterministic to darker eye color.
- the OCA2 5 SNP can have a predictive value for human hair color, and the G allele again can be part of a multi-SNP haplotype that is deterministic of, or related to haplotypes that are deterministic for dark hair color.
- EYE COLOR No quantitative no qualitative relationship was detected between the zygosity or specific genotype ofthe TYR_2 SNP (SEQ DD NO:217467) in Caucasians and eye color. The frequency ofthe G allele was lower in Caucasians than in African Americans or Asians, though the sample size for Asians was low.
- the ratio of GG, GT and GA genotypes for Caucasians having light eye color was 1 :4:4, the ratio for Caucasians having dark eye color is 1 : 1 : 1.
- the ratio of these genotypes in African Americans was 7:2:1, whereas it was 1:2.5:3 in Caucasians, supporting the assertion that the G allele is associated with dark eye color in human beings (since African Americans tend to have darker eye color on average than Caucasians).
- the ratio in persons of light brown eye color (brown) was lower than the ratio of persons with medium (brown2) or dark (brown3) eye color, thus indicating a potential quantitative relationship among persons of brown eye color.
- the ratio of GG:GA:AA genotypes in Caucasians of light (blue, hazel or green) eye color was approximately 0:1:2
- the ratio in Caucasians of dark eye color was approximately 0:1:1.
- the ratio of GG:GA:AA genotypes in Caucasians is 0:1:2 and in African Americans, the ratio was approximately 2:1:0, supporting the assertion that the frequency ofthe G allele is higher in persons of dark eye color than in persons of lighter eye color (again following from the fact that the average African American has darker eye color than the average Caucasian).
- genotype alone, cannot explain 100% ofthe variation in the population of eye color, but that they explain some percent of variation greater than zero, and that the G allele may be part of a multi-SNP haplotype that is deterministic or related to haplotypes that are deterministic to eye color.
- OCA2_6 genotype no quantitative nor qualitative relationship existed between the zygosity or specific genotype and eye color within the Caucasian ethnic group.
- the ratio ofthe GG:GA:AA genotypes was about the same in
- HAIR COLOR With respect to the TYR_2 genotype, no quantitative or qualitative relationship existed between the zygosity or specific genotype in Caucasians and hair color. The ratio ofthe GG:GA:AA genotypes in persons of light hair color was 1:1:0, the same as the ratio in persons of dark hair color. Nevertheless, the frequency ofthe G allele was lower in Caucasians than in African Americans or Asians (though the sample size for Asians is low).
- the ratio of GG:GT:TT genotypes in Caucasian persons of light (blond, auburn) hair color was approximately 1 : 1 : 1
- the ratio in Caucasian persons of dark hair color was approximately 1:3:2.
- the ratio of these genotypes in the three ethnic groups does not support the assertion that the G allele is associated with lighter hair color; the frequency ofthe G allele was lower in Caucasians than African Americans, which contradicts the postulate that the frequency ofthe G allele is higher in persons of light hair color than in persons of dark hair color.
- the ratio of GG:GA:AA genotypes was 0:0:1 in Caucasian persons of lighter hair color
- the ratio in Caucasian persons of darker hair color was 0:1:1
- the ratio of GG:GA:AA genotypes in Caucasians was 0:1:2, and was approximately 2:1:0 in African Americans, supporting the assertion that the frequency ofthe G allele is higher in persons of dark hair color than in persons of lighter hair color (which follows from the fact that the average African American has darker hair color than the average Caucasian).
- genotype alone, cannot explain 100% ofthe variation in the population of hair color, but that they explain some percent of variation greater than zero; the G allele may be part of a multi-SNP haplotype that is deterministic to, or related to haplotypes that are deterministic for dark hair color.
- OCA2_6 genotype no quantitative or qualitative relationship existed between the zygosity or specific genotype and hair color within the Caucasian ethnic group.
- the ratio ofthe GG:GA:AA genotypes was about the same in Caucasians as in African Americans or Asians (though the sample size for Asians is low), supporting the assertion that this SNP is not deterministic for, nor related to haplotypes that are deterministic for human eye color.
- the ratio ofthe GG:GA:AA genotypes in persons of light skin color was 1:1:0, the same as the ratio in Caucasian persons of medium skin color, though the ratio is higher in Caucasian persons of dark skin color (2:0:0).
- the sample size for Caucasian persons of dark skin color was too low to draw a conclusion from this result.
- the frequency ofthe G allele was lower in Caucasians than in African Americans or Asians (though the sample size for Asians is low), suggesting that this allele can be involved in human skin color, though confirmation of this result must await further results with a larger sample size of Caucasian persons of dark skin color.
- Brown is light brown eye color
- Brown 3 is dark brown.
- All phenotype data(color) is self-reported by blood donor subjects on a questionnaire filled out at the time of blood donation.
- Example 1 describes an additional OCA polymo ⁇ hism, thus confirming and extending the results disclosed in Example 1.
- Methods for detecting the nucleotide occunence at a SNP position are described in Example 1.
- OCA2_8 is associated with the degree to which human eyes and hair are pigmented.
- the OCA2_8 polymo ⁇ hism is a Y (T or C) change and is present at position 86326 within the GenBank Accession No. 13651545 genomic sequence file (see Table 1 for information regarding OCA2_8 as well as all ofthe SNP markers disclosed herein).
- Haplotype analysis was performed involving three potentially valuable markers in the OCA2 gene - OCA2_5, OCA2_6, and OCA2-8.
- the haplotypes ofthe subjects were documented with respect to the three markers (e.g., ATG/CTA or GTT/ AGA; see Table 2-2), where the sequence on the top ofthe line represents the combination of polymo ⁇ hic alleles on the maternal chromosome and the other, the paternal (or vice versa).
- Haplotypes are strings of polymo ⁇ hic alleles, much like a string of contiguous sequence bases, except they are not adjacent to one another on a chromosome. In fact, OCA2 5 and OCA2_8 are about 60,000 base pairs apart from one another.
- haplotypes For larger numbers of polymo ⁇ hic loci the disparity between the number of observed and expected haplotypes is larger. This well known phenomenon is caused by systematic genetic forces such as population bottlenecks, random genetic drift, selection, and the like, which have been at work in the population for millions of years, and have created a great deal of genetic "pattern" in the present population. As a result, working in terms of haplotypes offers a geneticist greater statistical power to detect associations, and other genetic phenomena, than working in terms of disjointed genotypes.
- OCA2_5 - OCA2_6 - OCA2_8 haplotype counts for patients, counted with respect to hair color are shown in Table 2-2. Similar results were obtained when counted with respect to eye color. Though OCA2_6 only showed weak association, it was included in this analysis because its value as part ofthe haplotype is greater than its value on its own. (The same is true for the other two markers). From this data, it is clear that the ATG haplotype was the most frequent haplotype, and was disproportionately present in persons of lighter hair color. Haplotypes other than ATG (such as ACG, GCG and GCA) tended to occur in the DNA of persons of darker hair color.
- haplotype pairs or compound genotypes
- Table 2-3 Another way to look at this data is to look at haplotype pairs, or compound genotypes.
- This view ofthe data which is the most biologically relevant view, shows that persons of lighter hair color (blond and red) are almost always ATG/ATG, whereas persons of darker hair color are more likely to be of another combination including ATG and some other haplotype (see, also, Table 2-3).
- These results demonstrate that persons of light hair color (red or blond) are almost always ATG/ATG genotypes (12 out of 15 cases).
- persons of dark hair color usually harbor an ATG haplotype in combination with some other haplotype (26 out of 40 cases).
- a specimen of one ATG haplotype in combination with some other haplotype is almost always a person of darker hair color.
- a person of two ATG haplotypes could be either a person of Hght hair color or a person of dark hair color, but is more likely to be a person of light hair color.
- OCA2_5 - OCA2_6 - OCA2_8 multilocus genotype of a person provides a predictive value for their hair (and eye) color.
- the certainty of assignment of an unknown human specimen to the dark or light hair color class, using their compound genotype (haplotype pair) for these three loci can be calculated using well known statistical methods.
- This example demonstrates that a SNP in a third gene, encoding tyrosinase, is associated with pigmentation in humans. Methods for detecting the nucleotide occurrence at a SNP position are described in Example 1.
- a SNP, designated TYR_3, that was associated with pigmentation was identified in the tyrosinase gene.
- the TYR_3 SNP is shown in Table 1.
- the gene, the polymo ⁇ hism name, its location, and the reference sequence identifier (NCBI-.Genbank) are indicated in Table 1.
- the variant TUB code, its source of discovery, and the type of polymo ⁇ hisms are also shown; "Poly" indicates that it was verified as a polymo ⁇ hic position).
- TYR_3 is one ofthe SNPs disclosed herein as being associated with the degree to which human tissues are pigmented. Of a very large number of different genes, the TYR gene is the third gene found to harbor SNPs so associated. Each of the three genes, OCA2, TYRPl and, now, TYR, was discovered based on the observation that loss-of-function mutants in mice and humans exhibited a condition called oculocutaneous albinism. Individuals afflicted with this disease lack any pigment in their skin, hair or eyes, and are victims of numerous physiological and social challenges.
- the TYR_3 polymo ⁇ hism also is present in the publicly available NCBI SNP database (dbSNP), but it was not previously associated with the degree to which human tissues are pigmented.
- TYR_3 is a unique polymo ⁇ hism that meets the requirements for a SNP associated with pigmentation as disclosed herein.
- the data showing the association, as well as an inte ⁇ retation ofthe data, are presented in Table 3-1 and Table 3-2.
- the presented results are statistically significant for hair color.
- the ratio of CC:CA:AA genotypes in persons of dark eye color was 27:12:5, and the ratio in persons of light hair color was 12:20:4, which is significantly distinct. Nonetheless, the number of AA genotypes in the two classes of individuals was not significantly different (5 for dark, 4 for Hght). If the C allele was associated with darker eye color, as is indicated by the number of relative homozygous CC to heterozygous CA genotypes between these two groups, the number of AA homozygotes of lighter eye color would exceed that of darker eye color. However, this was not the case, and as a result, the results are less impressive (though not negative) for eye color.
- the C allele should be enriched in persons of average darker hair, eye and skin color.
- African Americans are one such group.
- the ratio of CC:CA:AA genotypes in randomly selected African Americans was 84:13:1, and the ratio in randomly selected Caucasians (a distinct population from that for which eye, hair and skin pigmentation results are presented above) was 37:49:13 (Table 3-2).
- the frequency ofthe C allele at this polymo ⁇ hic locus was enriched in persons of darker average eye, hair and skin color (African Americans), extending the results observed within the Caucasian group, and supporting the assertion that the C allele was associated with darker hair color in human beings.
- No polymo ⁇ hism has been found to be apparently associated with darker eye, hair, or skin color that was not also enriched in ethnic groups of average darker eye, hair or skin color.
- the study sample consisted of several hundred patients exhibiting variable eye, skin and skin pigmentation levels (colors). Subjects provided a blood sample after providing informed consent and completing a biographical questionnaire. Samples were processed immediately into DNA, which will be stored at -80 degrees for the duration of the study. Samples were used only as per the study design and project protocol. Biographical data was entered into an Oracle relational database system run on a Sun Ente ⁇ rise 420R server.
- Gene markers were selected based on evidence from the body of literature, and from other sources of information, that implicate them in either the synthesis, degradation and/or the deposition ofthe human chromatophore melanin.
- the Physicians Desk Reference, Online Mendelian Inheritance database (NCBI) and PubMed/Medline are two examples for sources of this type of information.
- Candidate SNPs were discovered from marker genes ("data mining") using, for example, the NCBI SNP database or the Human Genome Unique Gene database (Unigene; NCBI). Sequence files for the genes were downloaded from proprietary and public databases and saved as a text file in FASTA format and analyzed using a multiple sequence alignment tool. The text file that was obtained from this analysis served as the input for a SNP/HAPLOTYPE automated pipeline discovery software system. This system finds candidate SNPs among the sequences, and documents haplotypes for the sequences with respect to these SNPs. The software uses a variety of quality control metrics when selecting candidate SNPs including the use of user specified stringency variables, the use of PHRED quality control scores and others (See U.S. Pat. App. No. Serial No.: 09/964,059, filed September 26, 2001).
- Assays using SNP-specific kits were performed using an Orchid SNPstream 25K instrument for high throughput genotyping (Orchid BioSciences, Inc., Princeton, NJ). This instrument, which is based on Beckman-Coulter robotics and operates as a completely automated platform, canying out the entire process from DNA specimen to called allele, can read 25,000 genotypes in a day.
- An automated ABI310 and an ABI3700 capillary electrophoresis genetic analyzer are used for SNP discovery.
- Amplification reactions are set up using a Beckman Automated liquid handling system, and amplified in an MJ research Thermal Cyclers or using a PE Applied Biosystems 9700 thermal cycler. Data analysis is performed using a SUN Ente ⁇ rise 460 Unix server, which includes 6 PC terminals networked with the server.
- the public genome database was constructed from donors for which eye, skin and hair color information is absent. Further, it was constructed from only 5 donors.
- Amplification products were cloned into a T-vector using the Clontech (Palo Alto CA) PCR Cloning Kit, transformed into Calcium Chloride Competent cells (Stratagene; La Jolla CA), plated on LB-ampicillin plates, and grown overnight. Clones were selected from each plate, isolated by mini-prep using the Promega Wizard or Qiagen Plasmid Purification Kit, and sequenced using standard PE Applied Biosystems Big Dye Terminator Sequencing Chemistry. Sequences were trimmed of vector sequence and quality trimmed, and deposited into an Internet based relational database system.
- Genotypes were surveyed within the specimen cohorts by sequencing using Klenow fragment-based single base primer extension and an automated Orchid Biosciences SNPstream instrument (Orchid BioSciences, Inc., Princeton, NJ). Orchid technology is based on dye-linked immunochemical recognition of base inco ⁇ orated during extension. Reactions are processed in 384 well format and stored into a temporary database application until transfened to the UNIX based SQL database. The data produced conesponds to SNPs that are informative for distinguishing common genetic haplotypes identified from public and private databases. Using algorithms to infer haplotypes as described in the detail description section (See U.S. Pat. App. No.
- This example identifies SNPs with predictive value for the degree of iris or hair pigmentation, or both, in humans.
- the following results were obtained for the disclosed SNPs from Caucasians of various eye and hair colors. All phenotype data (color) is self-reported by blood donor subjects on a questionnaire filled out at the time of blood donation.
- "DARK” for eyes means brown and hazel
- "LIGHT” for eyes means blue and green
- "DARK” for hair means black and brown
- “LIGHT” for hair means blond and red/auburn.
- Methods for detecting the nucleotide occunence at a SNP position are described in Example 4. The results shown below are segregated based on pigmentation of each group of individuals.
- eye color is synonymous with the degree to which the retina is pigmented.
- skin pigmentation and hair color Numerous studies have shown that the variation in human skin, eye and hair color is caused by variation in the degree to which melanin is deposited in the appropriate tissues during development, which in turn is a function ofthe degree to which melanin is synthesized and degraded. Until now, it has not been known which, or whether, polymo ⁇ hic variation in the melanin synthesis genes determines natural variation in human eye and hair color.
- OCA2DBSNP 52401 The association of this marker with eye color can be seen by comparing the brown versus non-brown groups. Whereas the brown group shows an AA:GA:GG genotype ratio of 14:14:1, the non-brown group shows a 53:25:2 ratio. Thus, the ratio ofthe brown group reduces to a 1:1:0 ratio, that ofthe non-brown group reduces to an approximate 2:1 :0 ratio and the AA genotype is twice as common in persons of an eye color other than brown. The results comparing dark versus light eye color for this marker do not appear to be as strong. This may be because the AA genotype is carried more frequently in persons of hazel versus brown eye color, and looking at the ratios for the specific eye colors supports this idea.
- OCAIDBSNP 165011 The association of this marker with eye color can be seen by comparing the dark (brown plus hazel) versus light (green plus blue) groups.
- the ratio of AA:GA:GG genotypes for the dark eye group is 34:17:1, but is higher in the light eye group - 42:10:0. This reduces to an approximate ratio of 2:1:0 for dark and 4:1:0 for light.
- the ratio of brown versus non brown are similar - 20:9:0 for brown versus 56:18:1 for non brown. This reduces to 2:1:0 for brown and 3:1:0 for non-brown.
- the frequency ofthe A allele is higher in persons of lighter or non- brown eye color.
- QCA2DBSNP 146405 The association of this marker with eye color can be seen by comparing the dark (brown plus hazel) versus light (green plus blue) groups.
- the ratio of AA:GA:GG genotypes for the dark eye group is 24:16:9 but only 16:29:6 for the light eye group. This reduces to an approximate ratio of 3:2:1 for dark and 2:3:1 for Hght.
- the ratio of brown versus non brown are less compelling.
- the frequency ofthe A allele is higher in persons of darker or brownish eye color, and may be especially predictive ofthe HAZEL group.
- OCA2DBSNP 8321 The association of this marker with eye color can be seen by comparing the dark (brown plus hazel) versus light (green plus blue) groups.
- the ratio of GG:G:TT genotypes for the dark eye group is 32:20:2 but 44: 11 :0 for the light eye group. This reduces to an approximate ratio of 1.5:1 :0 for dark and 4:0:0 which is significantly different.
- the ratio of brown versus non brown are less compelling. In total, the frequency of the G allele is higher in persons of lighter or bluish/green eye color.
- HAIR COLOR OCA2DBSNP 52401: The association of the G allele with lighter hair color can be seen by comparing the ratios of blond persons versus persons of non-blond colored hair.
- the ratio of persons of blond hair is 8:6:0 versus a ratio of 42:23:2 for persons of non-blond hair. This reduces to an approximate ratio of 1 : 1 :0 for blonds and 2:1 :0 for non-blonds.
- the frequency ofthe G allele is greater by two-fold in persons of blond hair versus persons of non-blond hair color.
- OCA2DBSNP 165011 The association ofthe A allele with darker hair color can be seen by comparing the ratios of blond persons versus persons of non-blond colored hair.
- the ratio of persons of blond hair is 8:4:0 versus a ratio of 55:9:1 for persons of non-blond hair. This reduces to an approximate ratio of 2:1:0 for blonds and 5:1:0 for non-blonds.
- the results for persons of dark versus light hair color are similar in ratios.
- the frequency ofthe A allele is greater by 2.5-fold in persons of blond hair versus persons of non-blond hair color.
- OCA2DBSNP 146405 The association ofthe G allele with lighter hair color can be seen by comparing the ratios of blond persons versus persons of non-blond colored hair as well as the ratio of persons of dark versus light hair color.
- the ratio of persons of blond hair is 0:6:6 versus a ratio of 29:28:8 for persons of non-blond hair. This reduces to an approximate ratio of 0:6:6 for blonds and 4:4:1 for non-blonds.
- the results for persons of dark versus light hair color are similar in ratios. Dark hair persons show a 26:26:8 ratio but persons of lighter hair color show a ratio of 3:8:6 reducing to 4:4:1 and 1:2:2 respectively. These ratios are dramatically different. Thus the frequency ofthe G allele is greater in persons of blond or light hair versus persons of non-blond or dark hair color.
- OCA2DBSNP 8321 The sample size for the comparison of persons of lighter colored hair versus persons of darker colored hair is not adequate in this particular experiment.
- Example 4 The results in this Example provides a general method for qualifying a genetic association between a haplotype and a phenotype. Methods for detecting the nucleotide occunence at a SNP position are described in Example 4.
- the results described below demonstrate that the OCA2 SNPs disclosed herein are intimately involved in the degree to which human eye and hair is pigmented.
- the method relies on the generally known principle that haplotypes observed in the human population can be expressed in a cladogram or a parsimony tree such that the evolutionary relationships between the haplotypes are discemable.
- haplotypes derived from common haplotype ancestors will be present in similar regions ofthe tree.
- haplotypes that are similar in sequence content will be more closely proximated in the tree to one another than to dissimilar haplotypes.
- haplotype tree can be used as the starting point for a novel method of drawing associations between gene variants and physical traits in the human population because haplotypes that are similar to one another in sequence content are more likely to share common, or similar phenotypic values than randomly selected haplotypes.
- haplotypes residing at similar regions of a cladogram or tree will tend to share common phenotypic attributes.
- haplotype 00100001 at the lower right hand side ofthe cladogram in the above figure is more likely to be similar to that of 00110000 next to it in the cladogram than to 100010000 at the upper left hand side ofthe cladogram.
- This assumption is reasonable since haplotypes situated in proximity to one another share more sequence in common than randomly selected haplotypes, and it is the sequence of a gene that largely determines its function.
- haplotype analysis using the cladogram provides a useful means for representing genetic data in such a way as to facilitate multivariate analyses for the determination ofthe biological relevance ofthe haplotype.
- haplotype encoding scheme can be used to graphically project haplotypes in a manner that is sensitive to their position in the haplotype cladogram, and therefore their inter- relations (see below); and that both haplotypes present in an individual are encoded, and the diploid combinations of haplotypes are actually plotted.
- haplotypes present in an individual are encoded, and the diploid combinations of haplotypes are actually plotted.
- patterns are easily recognized (or not recognized, depending on the experiment).
- Each diploid pair of haplotypes was projected in n-dimensional space, in such a manner as to be true to the relative position ofthe haplotypes in the cladogram or tree.
- vectors for two individuals with "similar" haplotype combinations are closer to one another in the plot than to others that have a dissimilar haplotype combination (just like in the cladogram).
- the method can be used to plot n- dimensional vectors for individuals of various haplotype combinations, in n- dimensional feature space. Plots in n-dimensional feature space allow for the recognition of complex genetic pattern that results from dominance effects, additivity or other complex or quantitative genetic phenomena such epistatic effects.
- This method of genetic data representation offers a new power to detect and quantify the degree to which haplotypes determine various human traits because it allows data traditionally considered in discrete, discontinuously distributed terms, to be considered in a more useful continuous format.
- the method used to encode the haplotypes for plotting was as follows:
- the haploids are represented as points in a multidimensional haploid space.
- an 8 locus haplotype can be plotted in an 8 dimensional haploid space of (4 8 ) possible locations.
- a heterozygote pair of haplotypes can be represented by a line joining the two points. In the case of homozygotes, a loop is formed to join the point with itself.
- the line representing the conesponding haplotypes in a pair is colored for visual ease, or assigned a value for computational convenience. This analysis helps reveal the relationship between haplotype and phenotypes.
- the dimension ofthe plot can be reduced by considering a variety of mathematical methods. Doing this, the multidimensional plot can be projected into a two or three dimensional real space (R 2 or R 3 ), for making relationships visible.
- the value in the method is its ability to express discrete genetics combinations in terms of a continuum of values. Though it is counter-intuitive to considering genetic values such as genotypes or haplotypes in terms of continuous distributions (after all, genes are discrete entities), there is value in doing so. This can be appreciated when one considers that it is often times difficult to produce data that is representative of all the world's population. It is not practical, nor feasible to sequence every person in the world.
- Genetic data sets are therefore samples ofthe larger world populations, and parameters derived from these data are estimates of trae parameter values. Because it is not practical to generate genetic data sets completely representative ofthe world's peoples, classifying individuals based on estimates of genetic parameters or features is a common problem with genetic studies. For example, if a study using 1000 individuals produces a "solution" such that all 1000 people can be properly classified based on their genetic constitution, it is difficult to know how to classify an individual containing a haplotype or haplotype combination not observed in this study. The present approach helps to solve this problem.
- Geometric modeling of OCA2 haplotypes reveals the power ofthe individual SNP markers as predictive markers for human hair and eye color.
- the method is exemplified using the OCA2 gene subject as disclosed herein.
- a haplotype of these 8 markers would be expressed as ATGAAAAG.
- the first A represents the allele on a person's chromosome at the OCA2_5 locus, the second T the allele at the persons OCA2_6 locus, etc.
- Each person would have two haplotypes to make a haplotype pair, such as ATGAAAAG/ATGAAAAT. Applying the Stephens and Donnelly algorithm (Am. J. Hum. Genet.
- haplotype cladogram In 2-dimensional space, assign numerical values to the individual haplotypes and plot the haplotype value pairs for each individual in n-dimensional space (where n is the number of genes or haplotype systems), the haplotype cladogram in 2-dimensional space is plotted and assigned Cartesian coordinates to the individual haplotypes for plotting of haplotype pairs in the n-dimensional space.
- Haplotypes were used to construct a cladogram, or an evolutionary tree similar to that shown above.
- the tree was constructed using a maximum parsimony technique and is not shown because it is essentially represented in Table 6-2.
- the first step was to use the cladogram to recode the haplotypes into a form that is amenable for plotting in multidimensional space. The method could work as effectively for haplotype-haplotype combinations as for haplotype-genotype combinations.
- haplotype 2 gets the value (-1,2).
- haplotype list will now have two pair of coordinates.
- a person with one copy of haplotype 2 and one copy of haplotype 4 would have the values (-1,2) and (-2,4). This creates a 2X2 matrix for each individual (i.e., ⁇ -l,2/-2,4 ⁇ ).
- Table 6-1 shows a list of haplotypes for the OCA2 gene obtained by applying the Stephens and Donnelly algorithm to the genotype data set for the markers, in order, to form a haplotype.
- the grid in Figure 2 was used to encode individual haplotype pairs. For example, a person with the 2,3 haplotype combination would be represented with the values (-1,4) and (-2,1) in the matrix ⁇ (-l,4)/(-2,l) ⁇ .
- the haplotype pair of each individual was re-coded as a vector, they were plotted in m- dimensional feature space ( Figure 2).
- the haplotype pairs for each individual was plotted by drawing a line between the first pair of coordinates (encoded from the first haplotype for that person) to the second pair of coordinates (encoded from the second haplotype for that person).
- Figure 3 shows that the diploid pair of haplotypes in individuals is non- randomly distributed with respect to hair color.
- the block arrow indicates that one haplotype combination was only seen in persons of brown hair color. Only persons of blond hair color contain haplotype pairs that are represented in the plot as lines extending from the bottom left part of the upper left quadrant to the upper right quadrant. Only persons of brown hair color contain haplotype pairs that are represented in the plot as lines extending from the upper right quadrant to the lower left quadrant.
- the curved arrows indicate that another haplotype combination was seen in persons of black, brown and blond hair color, but that the TYR_3 genotype in persons of black hair color is CC, that in persons of brown hair color is CA and that in persons of blond hair color is AA.
- This is an example of a second dimension (a second variable) helping to resolve the data and facilitating concept formation. This results is reasonable in terms of genetic epistasis, wherein specific combinations of genes have unique impacts on traits. From the plot, a series of patterns are discemable, and from these patterns, rales can be constructed that can enable the classification ofthe posterior probability of conectly classifying a person as belonging to a particular hair color group.
- partitions in the space can be drawn to segregate the various hair color groups (which would then be planes), and these partitions can be used as a decision plane against which to make such a classification decision. Additional haplotypes also can be present in the population not represented in this analysis. However, using the present method, routine statistical tests can be used to measure the reliability ofthe classification of such unknown haplotypes. Assuming that members of a given hair color class contain previously identified haplotypes associated in this analysis with a given class, or related to such haplotypes evolutionarily, then the present method will provide that they would be positioned in the plot in the same neighborhood as others found in persons of that same hair color.
- haplotype 9 and a haplotype other than AGTAAAAG is brown haired individuals (4/4 individuals).
- haplotype AGTAAAGG (haplotype 2 encoded as (-1,4)), and any other haplotype, are always brown haired individuals (3/3 individuals). Evidently haplotype AGTAAAGG is dominant for brown hair. 7) Individuals with the haplotype AGTAAGAG/GACAAAAG (haplotype combination (6,8) encoded as (-3,l)(0,-4)) are always brown hair (2/2 individuals).
- haplotype GGCAAAAG (haplotype 7 encoded as (1,-4)) is always brown unless it is accompanied by a haplotype 7 (-3,1) (3/3 individuals). The same is trae for haplotype 5 (2,-4) - brown unless paired with (-3,1) (3/3 individuals)
- sample size is low for haplotype 5 or haplotype 7
- sample size for haplotype 5+7 is greater, and the result may show statistical significance.
- Table 16-2 provides a grid of OCA2 haplotypes obtained by overlaying the cladogram of haplotypes onto a two dimensional grid. The number ofthe haplotype conesponds to the number ofthe haplotype sequence shown in Table 16-1 (i.e., haplotype 2 is AGTAAAAT).
- EXAMPLE 7 HAIR COLOR HAPLOTYPE IDENTIFICATION AND MODEL
- SNPs single nucleotide polymo ⁇ hisms
- each, on their own, show an association with the degree to which human hair is pigmented, that is they are penetrant SNPs.
- these SNPs can be combined in different combinations to explain variable hair color in the human population.
- a "vertical" re-sequencing effort was performed in order to identify the common SNP variants at each of three genes known to be deterministically involved in melanin synthesis; the Tyrosinase (TYR), Tyrosinase like protein (TYRPl) and the Oculocutaneous albinism 2 gene (OCA2).
- TLR Tyrosinase
- TYRPl Tyrosinase like protein
- OCA2 Oculocutaneous albinism 2 gene
- TYRSNP_8 is a polymo ⁇ hism in the tyrosinase gene that was discovered through several mechanisms. Initially, it was identified using software as disclosed above to compare EST sequences to one another from the NCBI Unigene database. It was subsequently identified again from an in-house re-sequencing effort. The
- TYRSNP_8 SNP is one ofthe few TYR SNPs present in the public SNP database (dbSNP, NCBI). The data for the TYRSNP_8 marker are shown in Table 1. On its own, this marker appeared to have little value as a predictive tool for hair coloration in humans (Table 7-1). However, when combined into haplotypes with other TYR markers presented herein, TYRSNP_8 reveals its influence, which is significant.
- Unphased genotypes were scored at seven loci (Table 7-2) for 189 individuals. Of these, 46 individuals were Caucasians, for whom there were no missing data for any ofthe seven loci and for whom hair color was known. Haplotypes within the TYR and OCA2 genes were infened using the algorithm of Stephens and Donnelly (2001). A program was developed to store these infened haplotypes into an Oracle schema containing phenotype information for each individual, and phenotype and genotype date for the individuals were then partitioned into two groups; persons of dark natural hair color (black or brown) and persons of light natural hair color (red, blonde).
- Table 1 and Table 7-2 show the polymo ⁇ hisms used for constructing composite solution A.
- the gene within which the SNP resides is shown in column 1.
- the name ofthe SNP is shown in column 2, and the marker number (identification number) is shown in column 3.
- the IUB code for the nucleotide change imposed by the SNP is shown in column 4, and the amino acid change (if any) is shown in column 5.
- Nucleotides in brackets indicate deletions. All of these markers are disclosed herein and Table 1 provides additional information regarding the markers used in this study.
- Table 7-3 shows the population level structure differences between haplotyped individuals (Column 3) at three genes (Column 1) in two different groups (Column 2).
- the first group contained individuals with dark hair color (brown and black) and the second contained individuals with light hair color (red and blond).
- the exact test for non-differentiation (Column 4) performs several thousand randomly generated permutations to randomly generate haplotype constituencies for the two groups, and tests the frequency with which these virtual groups show a greater difference between them than the observed groups. A low number indicates that the data actually observed in the study was not due to chance.
- the conected pair-wise differences CORR.
- PW Column 5
- PW FST P The P-value for this measurement, which is an effect statistic, is shown in Column 6 (PW FST P); a value below 0.05 indicates that the value present in Column 5 is statistically significant.
- a third measurement ofthe difference between the colored hair groups is presented in Column 7., the Slatkin F-statistic (SLATKIN); a number higher than 0.05 indicates that the difference between the two groups is statistically significant.
- TYR haplotype pairs within each ofthe two groups.
- Four different TYR haplotypes ACG, ACA, AAG, and AGC
- five different haplotype combinations were observed in this analysis (AGC/ACA, ACG/AAG, ACG/ACG, AAG/AAG, AAG/ACA; Table 18).
- Table 7-4 shows the TYR haplotype pair frequencies for individuals of each of the four hair color classes.
- the haplotype pair is shown in columns 1 and 2, and the frequency of individuals exhibiting a given hair color within this group is shown in columns 3-6.
- OCA2 haplotypes were compared for the light and dark haired individuals, whom did not have an- AGC TYR haplotype. In addition to lacking an AGC haplotype at the TYR gene, each blond hair individual also haplotyped as a
- CACG homozygote at the OCA2 locus Half of the dark haired confounders also had a homozygote pair of CACG haplotypes, but half did not, and grouping the individuals based on the criteria of a homozygous CACG OCA2 haplotype partitioned the data most effectively; no other SNP combinations within the OCA2 gene resolved dark and light haired individuals not containing the AGC TYR haplotype.
- Table 7-5 shows a composite solution for variable human hair color in the Caucasian population.
- the constraints on gene haplotype sequences for our SNPs are boxed in columns 2 and 3, and the line between the columns indicate the operator "AND". For example, row one shows that 100% ofthe individuals with the non-AGC TYR haplotype AND the CACG homozygous haplotype pair were correctly classified as light haired individuals.
- the percent of individuals explained by these constraints for the two hair color classes is indicated (rows 1 and 3) in column 4.
- the total number of individuals explained by the composite solution are indicated in the fourth row of column 4.
- the logic ofthe solution is shown in Figure 3.
- the accuracy of predictions for the solution is shown in Table 7-6a and Table 7-6b.
- Part ofthe 10% not conectly classified are Auburn haired individuals who were not scored in this study (since it is not clear which group to assign them to). When the test is performed on a multiethnic group of individuals the accuracy improves to 98%.
- SNPs within the TYR, TYRPl and OCA2 genes were identified that are individually associated with the degree to which human hair is pigmented.
- haplotypes inco ⁇ orating each of these positions in individuals of known hair color were scored, and the results were combined in various combinations in order to obtain the optimum solution for resolving individuals with dark versus light hair color.
- the results revealed a composite, nested solution for classifying an unknown individual as belonging to the dark versus light hair colored groups.
- the solution employs haplotypes at two of these genes (TYR and OCA2).
- the first step ofthe solution detennines the diploid pair of TYR_3, TYR_5 and TYRSNP_8 haplotypes in an individual. Individuals with one or two copies ofthe AGC haplotype are classified as belonging to the dark hair color group with 81% accuracy in Caucasians and 98% accuracy when applied to individuals krespective of race. This step results in two groups - a conectly classified dark hair color group (AGC haplotype containing), and a mixed group of dark and light hair colored individuals (non-AGC haplotype containing). The second step uses the individuals without the TYR- AGC haplotype.
- the diploid pair of OCA2 2, OCA2_5, OCA2 RS 1800405 and OCA2_6 haplotypes were determined for each individual. If an individual had a homozygous CACG haplotype pair, they were classified in the light hair group with 100% accuracy. If not, they were classified in the dark hair group with only 50% accuracy. The final accuracy ofthe solution was 90% within the Caucasian group and 98% when applied to individuals inespective of race.
- This solution appears to be the first method capable of using a DNA specimen to classify an unknown individual with regard to natural hair color. If the ethnicity of the individual is known from other tests such as an STR test, then the accuracy ofthe determination can be precisely determined. For example, if the race ofthe individual is African American, the dark hair answer from our solution would be conect 98% of the time. If the race ofthe individual is Caucasian, the dark hair answer would have a likelihood of being conect of 90%, and a light hair answer would have a likelihood of conectness of nearly 100%o. The results also indicate that there is a dose response effect for the ACG haplotype, as individuals with the ACG/ACG haplotype pair are significantly more likely to have black hair than brown hair.
- ACG/ACG haplotype pair is the most frequent haplotype found in the African American group, which is mainly comprised of black haired individuals.
- the posterior probability that the specimen belongs to a black versus a brown haired individual can be calculated.
- Table 7-6b Total Caucasians, African Americans and Asians Correctly
- the tyrosinase (TYR), oculocutaneous 2 (OCA2), tyrosinase like protein 1 (TYRPl), melanocortin receptor (MCIR) and adaptin Bl protein (ADP1), adaptin 3 D subunit 1 (AP3D1) loci were selected as candidate genes for the study of variable human eye color because they are known to be involved in pigmentation and from mutant OCA phenotypes it is known that they play a role in retinal pigmentation. Except for the OCA2 gene, relatively few SNPs have been documented in public database resources (NCBLdbSNP), and those SNPs that are present are not evenly distributed across the coding sequence of the genes.
- NCBLdbSNP public database resources
- SNPs were prioritized by calculating the allele and genotype frequencies in groups of individuals of different races and varying eye colors and eye color shades. For the latter classification, light eyes were defined as either blue or green and dark eyes as black, brown or hazel.
- SNPs were passed to the third round of analysis if their bi-allelic genotypes, or one of their alleles, were preferentially represented within an eye color or eye color shade group as determined using chi-square tests. If a SNP passed this test, and the dark allele was prefened in, or monomo ⁇ hically present in races of average darker eye color than Caucasians (such as African Americans and Asians), it " was passed to the third phase ofthe analysis. In fact, this latter constraint proved to not be necessary, as all ofthe alleles associated with darker eye colors in Caucasians were over- represented in races with darker average eye color (data not shown).
- genotypes Gl 1 :CG/CG and G22: AG/AG are significantly and positively associated with dark eye colors (p ⁇ 0.05) and genotype G23: AG/CA is associated with light eye color (p ⁇ 0.05)(data not shown).
- OCA3LOC109 is significantly and positively associated with dark eye colors (p ⁇ 0.05) and genotype G23: AG/CA is associated with light eye color (p ⁇ 0.05)(data not shown).
- 0-step clades are represented by: HI :ATA, H2:ATG, H3: ACG, H4:GCA, H5:GCG, H6:GTA, H7:GTG.
- H4;GCA, H5:GCG, H6:GTA and H7:GTG are significantly associated with not-light eye colors. Odds ratio for (H1+H2+H3) presence in individuals of light eye color shade were 3.134 and its 95% CI. is [1.8871, 5.2051]. Analysis ofthe results showed that most ofthe significant variations in eye colors can be traced back to the mutation at site-1.
- haplotype HI :CAC is found to be significantly associated with light eye color
- haplotypes H2:CGC, and H3:TGC are found to be significantly associated with dark eye color at the p ⁇ 0.05 level.
- haplotype HI :CAC is positively and significantly associated with light eye color shade
- haplotypes, H2:CGC and H3: TGC are positively significantly associated with dark eye color shade.
- the best MC 1 R haplotype system was the MCR3LOC 105 haplotype system comprised of 3 SNPs (markers 217438, 217439, and 217441) distributed more or less evenly across the coding region ofthe gene (p>0.20).
- the first approach attempted was a Bayesian method, using the frequencies ofthe eye color classes as the prior probabilities and the frequency of a (haplotype based) genotype in the eye color class as the class conditional density functions.
- the posterior probability that an individual belongs to a given class of eye color shade is simply the product ofthe posterior probabilities derived for each ofthe four genes, and the eye color class with the highest probability is selected.
- this method resulted in a classification solution of poor accuracy (about 84%, data not shown) and low utility (less than 80%).
- weights to the posterior probabilities for each haplotype system based on the amount of variance each explains on its own, the accuracy could be improved slightly to 89%, but the utility ofthe classifier was still low (less than 85%).
- a nested statistical scheme was developed by which to construct classification rules using complex, compound genotypes. Though a Bayesian classifier could have been used for this task, instead a routine was chosen that resembles a genetic algorithm.
- the scheme builds a classification tree in a step-wise manner. The roots ofthe tree are genotypes of a randomly selected haplotype system. Nodes are randomly selected genotype classes, within which there are numerous different constituent genotypes.
- Compound genotype classes contain more than one compound genotype, the constituents of which are derived from a discrete combination of haplotype systems. Edges connect roots and nodes to comprise compound genotype classes.
- the tree is built by first selecting a set of roots and growing the edges to nodes based on the genetic distinction between individuals of light (blue, green) and dark (black, brown) eye color shade within the new compound genotype class defined by the connection (hazel is always assigned to the eye color shade with the most members).
- hazel is always assigned to the eye color shade with the most members.
- a pair-wise F statistic and associated p-value is used to measure the genetic structure differences between individuals ofthe various shade of eye colors, though an exact test p-value has also been used with similar results. Individuals of ambiguous haplotype class (less than 75% certainty) are discarded and classified as "not classifiable”.
- All possible nodes not yet inco ⁇ orated in the path from the root are tested during each new branching step, and the branch that results in the most distinctive partition (i.e., the lowest p-value) among the classes of eye color shade is selected. If there is no genetic structure within the new compound genotype class, the branching continues to another node (haplotype system), unless there are no more haplotype systems to consider or unless the sample size for the compound genotype is below a certain pre-selected threshold (in which case a "no-decision" is specified). If the lowest p-value for the new compound genotype class is significant, rules are made from its constituent compound genotypes exhibiting significant chi- square residuals.
- genotypes within the compound genotype class which are not explainable are segregated from the rest ofthe compound genotypes within the class to form new nested node(s), from which further branching is accomplished.
- Nested nodes always represent new compound genotype classes at first. If branching from this nested node does not result in the ability to create classification rules, the algorithm returns to the compound genotype class from which the nested node was derived and recreates N nested nodes of N constituent compound genotypes. In either case, nested nodes are only created from nodes with statistically significant population structure differences among the shade of eye color classes.
- this algorithm allows for the maximum amount of genetic variance contributed by the various combinations of haplotype systems to be learned within specific genetic backgrounds.
- the rules produced from it are used to predict the eye color shade of each individual. If the prediction rate is good (say 95% or greater) the process ends, and if it is not, the process is begun again starting with a new haplotype system for the root.
- a classification tree was generated using this approach with the TYR2LOC920 (markers 217468 and 217473), OCA3LOC920 (markers 217452, 217455, and 712061), OCA3LOC109 (markers 217458, 712054, and 886896), TYRP3L105 (markers 886937, 217485, and 217586) and MCR3LOC105 (markers 886937, 217485, and 217486) haplotype systems (Table 8-8).
- the roots for the optimal tree selected were genotypes ofthe TYR2LOC920 haplotype system.
- the identity and order ofthe subsequent nodes originating from the various TYR2LOC920 genotype classes were distinct for each particular root.
- the first node (second haplotype system) selected for TYR2LOC920 AG/CA individuals was the OCA3LOC920 system, though the MCR3LOC105 system was selected as the second node for TYR2LOC920 AG/AG individuals (rows 15-22, Table 8-8).
- the effect statistics for the branching process are shown in Table 8-9. Comparing this Table with the specific rules in Table 8-8, it is clear that all decisions to formulate classification rules for a compound genotype were justified by the existence of population level genetic stracture differences within the compound genotype class from which it was derived. A number of rales were formed from compound genotype classes for which measures of population level genetic structure differences were not calculable.
- rales could be constructed for compound genotypes derived from compound genotype classes of small sample size (i.e., n ⁇ 15), because the distribution of genotypes among the eye color shades were clearly partitioned as measured using the chi-square residuals.
- Table 8-9 follows the same format shown in Table 8-8, and shows the pair-wise F-statistic P values used within a compound genotype class to infer genetic structure differences between groups of individuals of different eye colors.
- the ability to partition individuals within a compound genotype class in a manner that is statistically significant using this test imparts justification by which to formulate classification rales for particular genotypes within the compound system (see text and Table 8-8).
- the rules are constructed from chi-square residuals as described in the. text.
- the haplotype system used to construct compound genotypes within each row (compound genotype) is indicated in each column.
- the node comprises individuals of only these genotypes. Degenerate nucleotide positions are indicated with IUB codes. The tree is read from left to right starting with the operator *if*. The first column contains the root (see text) of a compound genotype class.
- the operator *and* is used to include the first node (if any), and then the second (if any) and so on until a statistically significant partition can be made within the new compound genotype class. If individuals of different eye color shades within this new compound genotype class can be partitioned into subgroups of statistically significant genetic structure
- the process terminates along a row at the relevant P value for the test. If not, this process continues to the next haplotype system to the right.
- the compound genotypes are used to construct classification rales (shown in Figure 4 and discussed in text) for the pertinent individuals. For example, considering rows one through three, there is no statistical association between OCA3LOC920 genotypes and eye color within the class of individuals with a TYR2LOC920 AG/CA genotype. Thus, the path leads to the MCR3LOC106 haplotype system in the second column.
- TYR2LOC920 AG/CA OCA3LOC 109 CAC/CAC (rows 1 and 2) thus comprised a new compound genotype class.
- Members of this class are partitionable along eye color classes using the MCR3LOC106 haplotype system in column 3.
- classification rules were constructed for individuals of particular compound TYR2LOC920:OCA3LOC920:MCR3LOC106 genotypes.
- P JNCALC means that the P value was not calculable.
- the most common reason for this is genetic homogeneity within one or both ofthe eye color classes for the compound genotype in question.
- the pair- wise method measures the average number of differences within groups compared to that number between groups, and this genetic homogeneity within the final haplotype system of a compound class makes the calculation ofthe within group difference technically impossible. In this case, chi-square residuals were used to justify the formulation of classification rules.
- a four gene five haplotype system model for genetically predicting human eye color is described in this Example. To our knowledge this is the first such model described.
- the solution derived from this model is capable of correct classification 96.3% ofthe time, conditional on the race ofthe DNA donor being Caucasian. If there is equal probability that the race ofthe donor is Caucasian, African or Asian, the accuracy ofthe solution improves to 99.9%, and the utility (the ability to make a decision) improves from 81% to 98%.
- Most non-Caucasian ethnic groups exhibit low variability in eye color, so this improvement may not seem su ⁇ rising. However, though the variability of eye color is relatively low in these ethnic groups, an inconect solution would not necessarily be more accurate when applied unconditionally to individuals ofthe various world populations.
- the best classification tree (i.e., solution) derived from our algorithm inco ⁇ orated the haplotype system from the TYR gene as the root.
- Four ofthe five first nodes were genotypes ofthe haplotype system from the OCA2 gene. It is interesting to note that, ofthe four genes we used for classification rule construction, these two were by far the most significantly associated with eye color.
- MCIR and TYRPl haplotype systems in other genes
- 68 were conectly classifiable based on TYR and OCA genotype alone and virtually none ofthe eye color variation in our study was explainable with compound genotypes not including the TYR and OCA2 systems.
- variable hair or skin color does not appear to explain variable hair or skin color (data not shown). In fact, this is what one would expect from a good eye color solution for Caucasians since eye, skin and hair color are independently inherited and distributed within this racial group. Our solution is also usually not sensitive enough to predict the precise eye color of an individual. Rather, it can only be used to classify a biological specimen as having been derived from an individual of a given shade of eye color. This also portends the involvement of other genes and/or variant(s) in the determination of this complex trait. The accuracy ofthe solution for explaining variable eye color in members of other ethnic groups is not yet known with precision due to the low number of minor eye colors in these groups (which are difficult to obtain).
- Table 8-1 Individual TYR2LOC920 haplotype classes in the various shade of eye color classes. Dark - black, brown or hazel and Light - blue or green. The total number of individuals counted within each class is shown on the bottom row, and the total number of individuals of each haplotype are shown in the last column. Table 8-2
- Table 8-2 TYR2LOC920 genotype counts for the various classes of eye color shade. The genotype designations are shown at the top ofthe table. Not-light - black, brown or hazel and Light - blue or green. The total number of individuals counted within each class is shown on the bottom row, and the total number of individuals of each genotype are shown in the last column.
- Table 8-3 Individual OCA3LOC109 haplotype counts in the various classes of eye color shade. Dark - black, brown or hazel and Light - blue or green. The total number of individuals counted within each class is shown on the bottom row, and the total number of individuals of each haplotype are shown in the last column.
- OCA3LOC109 genotype diploid haplotype pair
- Table 8-4 OCA3LOC109 genotype (diploid haplotype pair) classes in the various shade of eye color classes. Dark - black, brown or hazel and Light - blue or green. The total number of individuals counted within each class is shown on the bottom row, and the total number of individuals of each haplotype are shown in the last column.
- Table 8-5 Individual OCA3LOC920 haplotype classes in the various shade of eye color classes. Dark - black, brown or hazel and Light - blue or green. The total number of individuals counted within each class is shown on the bottom row, and the total number of individuals of each haplotype are shown in the last column.
- OCA3LOC109 genotype diploid haplotype pair
- Table 8-6 OCA3LOC109 genotype (diploid haplotype pair) classes in the various shade of eye color classes. Dark - black, brown or hazel and Light - blue or green. The total number of individuals counted within each class is shown on the bottom row, and the total number of individuals of each haplotype are shown in the last column.
- Table 8-7 OCA3LOC109 genotype (diploid haplotype pair) classes in the various shade of eye color classes. Dark - black, brown or hazel and Light - blue or green. The total number of individuals counted within each class is shown on the bottom row, and the total number of individuals of each haplotype are shown in the last column. Table 8-7
- Table 8-7 Summary of analyses at the level ofthe single gene haplotype system.
- the gene within which the haplotype system is found is shown in column one (GENE).
- the distinction of light and dark classes of eye color shade is shown in column 2 (PARTITION).
- the haplotype system is shown in column 3, and the level of complexity for which the statistically significant results were obtained is shown in column 4.
- Example 8 further discusses the classification model presented in Example 8, that generated the prefened eye color solution involving optimal haplotype systems for four different genes, described therein.
- Our goal was to develop a classification solution for human eye color.
- About 300 Caucasians of variable eye color were genotyped for an average of 30 SNP markers in 5 genes known to be involved in melanin production.
- the results showed that alleles of SNPs in the TYR, TYRPl, OCA2 and MCIR genes showed statistical associations with certain human eye colors and/or shades, as discussed in Example 8.
- the relationship between allele and eye color/shade was one of bias. Though the associations between SNP alleles and eye color/shade were statistically significant, on their own, the markers make for poor predictive tools because the error rate of classification is too high. This suggested that the discovered SNPs were component pieces of a larger, more complex puzzle.
- eye color is a complex trait, not a simple Mendelian trait. Although there is an element of dominance for darker eye colors, knowing the eye color of a mother and father do not allow one to predict with accuracy the eye color ofthe children. This is because eye color is a function of multiple genes interacting among themselves, rather than a single gene. Given that a collection of SNPs that were informative for human eye color had been identified, the SNPs were considered in terms of both inter and infra- genie complexity.
- Step 1 fritra-genic complexity.
- haplotype system For each of these four genes, random SNP (marker) combinations were selected to constitute a haplotype system.
- raw genotypes were converted into haplotypes using computational inference (Stephens and Donnelly, 2000), and individuals were grouped into one of two groups of eye shade; light (blue, green, gray or hazel eyes) or dark (light brown, medium brown, dark brown or black eyes).
- a pair- wise F-statistic or in some cases, a Fishers exact test of sample differentiation
- the F statistic is based on genetic distances for short divergence time.
- the Exact test of population differentiation tests the non-random distribution of haplotypes into population samples under the hypothesis of panmixia.
- haplotype systems P-values calculated from these tests were stored. The process was repeated until all of the possible haplotype systems for the gene were tested. At this point, the haplotype systems showing the lowest P-values were selected for further analysis.
- the OCA2 gene had 19 SNPs with alleles that were biased for one ofthe two classes of eye shade (for a list ofthe SNPs identified in this Example as having predictive value for human eye color, see Table 9-1). Using this approach several haplotype systems were identified that each had predictive value for human eye color.
- the haplotype systems used for this work are defined, in order from left to right, as follows:
- the TYR2LOC920 and OCA3LOC109 haplotype systems are especially informative. Persons of dark eye color tend to have different haplotypes, and diploid combinations of haplotypes (haplotype pairs) than persons of lighter eye color as measured by the pair-wise F statistic. The P value for these statistics is shown below in Table 9-2. For the TYRP and MCIR systems which did not have p values that indicated statistical significance, analysis was continued despite this because their component alleles, found to be associated with darker eye colors, were more frequently found in (indeed, they were practically monomo ⁇ hic in) persons of African American or Asian descent.
- Step 2 Inter- enic complexity. Once the interesting haplotype systems had been defined for each gene, Classification rules based on these haplotype systems were then developed using a nested statistical approach (see Example 12). First, individuals were stratified based on their genotype at the TYR2LOC920 haplotype system. For example, individuals with CG/CA genotype were segregated from the rest.
- the haplotype system that showed the best ability to partition the subjects based on eye color was selected.
- OCA3LOC109 genotypes within the TYR2LOC106 CG/CA class it was possible to construct classification rules. For example, 7 of 7 individuals with the TYR2LOC106 CG/CA genotype and OCA3LOC109 ATG/ATG genotype (see Table 8-8) were of light eyes. This number is statistically significant. Therefore, we constructed a rule stating that if a person is found to have this compound genotype, they can be classified into the light eye group.
- the tree in Table 8-10 is read from left to right. Within a column, the haplotype system is listed and the genotype class for that system appears to the immediate right. Individuals of a given class within the haplotype system identified in a column are partitioned into genotype classes for the next haplotype system to the right (if any). If individuals within this new compound genotype class can be partitioned into subgroups, based on eye color shade (described in the text), that are statistically distinct with regard to haplotype composition (using a pair-wise F-statistic test), the process terminates along a row at the relevant P value for the test. If not, this process continues to the next haplotype system to the right. When (or if) statistical significance is achieved, the compound genotypes are used to constract classification rules (shown in Table 8-8) for the pertinent individuals.
- the most common reason for this is genetic homogeneity within one or both ofthe eye color classes for the compound genotype in question.
- the pair- wise method measures the average number of differences within groups compared to that number between groups, and this genetic homogeneity within the final haplotype system of a compound class makes the calculation of the within group difference impossible.
- JUSTIFICATION As can be seen from this distribution, the frequency of the A allele is greater in individuals with darker eye colors than lighter (blue and green).
- the ratio of genotypes AA:GA:GG in dark eyed individuals (Brown and Hazel) is 0:8:41, but only ):3:41 for light (blue and green) individuals.
- JUSTIFICATION The C allele is enriched in individuals of darker (brown and hazel) eye color relative to light.
- the ratio of CC:CT:TT genotypes in the former group is 4:24:26 but only 4:21 :34 in the latter group. 5.
- JUSTIFICATION The G allele is more frequently found in individuals of darker (brown and hazel) eye color than lighter eye color.
- the ratio of AA:GA:GG genotypes in the dark group is 34:25:3, but only 40:19:2 in the light group.
- BLUE 1 3 37 JUSTIFICATION The ratio of AA:GA:GG genotypes in dark eyed individuals (brown and hazel) is 0: 14:34, but 1:7:47 in lights showing that the A allele is more frequent in the dark group.
- This SNP is part ofthe OCA3LOC109 haplotype system described in the text.
- JUSTIFICATION The ratio of AA:GA:GG genotypes in the dark (brown and hazel) group is 27: 18: 12 but is 19:31 :6 in the light group showing that the G allele is more frequently found in the light eye group.
- JUSTIFICATION The GG:GT:TT genotype ratio in the dark group is 35:24:3, but 48:13:0 showing that the T allele is much more frequently found in the dark group.
- This SNP is part ofthe OCA3LOC109 haplotype system described in the text of the application. 11.
- JUSTIFICATION The ratio of AA:AG:GG genotypes in the dark eye group is 42:15:0 and 51 :9:2 in the light group. Though this does not seem to be too different, this SNP is part of the OCA3LOC109 haplotype system, the utility of which was described in the text. 12.
- OCA2 OCA2E11 350 886896 26779 1365145 POLY
- JUSTIFICATION The ratio of AA:AG:GG genotypes is 22:32:4 for dark hair individuals but only 41 : 17 : 4 for the light group . The frequency of the G allele is therefore greater in the dark eye group.
- Ibis SNP is part of the OCA3LOC109 haplotype system, the utility of which was demonstrated in the text.
- JUSTIFICATION The ratio of CC:CT:TT genotypes in dark eye individuals (brown and hazel) is 3:34:27 but only 3:11:13 in light eye individuals. The frequency ofthe C allele is therefore greater in the dark eye group (more heterozygotes relative to IT homozygotes).
- JUSTIFICATION The C allele is only found in persons of blue eye color. 15.
- JUSTIFICATON The ratio of AA:AG:GG genotypes in individuals of dark eye color is 2:11:30, but only 0:7:46 in persons of light eye color. Uierefore the frequency ofthe A allele is greater in persons of darker eye color.
- JUSTIFICATION The ratio of CC:CA:AA genotypes in persons of darker eye color is 2:16:38 but only 0:9:51 in persons of lighter eye color. Uierefore, the C allele is more frequently found in persons of darker eye color.
- JUSTIFICATION The ratio of CC:CA:AA genotypes is 24:21:9 in persons of darker eye color, but 19:33:4 in persons of lighter eye color. Therefore, the frequency ofthe A allele is greater in persons of lighter eye color. 18.
- JUSTIFICATION The frequency of AA:GA:GG genotypes in persons of dark eye color (brown and hazel) is 0:37:41, but 0:46:41 in persons of light eye color. Tnus, the frequency of the A allele is slightly higher in persons of light eye color.
- Tbe ratio of AA:GA:GG genotypes in persons of darker eye color is 0:16:41 but 2:5:54 in persons of lighter eye color.
- the heterozygous GA state is more frequently found in persons of darker eye color.
- BLUE 37 4 0 JUSTIFICATION The ratio of CC:CT:TT genotypes in persons of darker eye color is 54:6:0 and 53:5:0 in persons of lighter eye color, which is not significantly different. However, this SNP is part ofthe MCR3LOC105 haplotype system, the utility of which was discussed in the text.
- JUSTIFICATION This SNP is part of the MCR3LOC105 haplotype system, the utility of which was discussed in the text.
- JUSTIFICATION This SNP is only found to be a variant in African Americans, and absent in Caucasians, and the former have darker mean eye color than the latter.
- JUSTIFICATION This SNP is only found to be a variant in African Americans, and absent in Caucasians, and the former have darker mean eye color than the latter. 26.
- JUSTIFICATION This SNP is only found to be a variant in African Americans, and absent in Caucasians, and the former have darker mean eye color than the latter.
- JUSTIFICATION The ratio of GG:GT:TT genotypes is 7:18:16 in persons of darker eye color (brown and hazel) but 3: 15:15 in persons of lighter eye color. The GG genotype is therefore more frequently found in persons of darker eye color. 28.
- JUSTIFICATION The ratio of AA:AT:TT genotypes is 5:24:16 in persons of darker eye color (brown and hazel) but 2:26:22 in person of lighter eye color. Thus, the frequency of the A allele is greater in persons of darker eye color. 29.
- JUSTIFICATION The ratio of CC:CT:TT genotypes in persons of darker eye color (brown and hazel) is 13:5:0 but 14:6:2 in light eye persons. Thus, the frequency ofthe T allele is greater in persons of lighter eyes.
- JUSTIFICATION This SNP is only found to be a variant in African Americans, and absent in Caucasians, and the former have darker mean eye color than the latter.
- JUSTIFICATION This SNP is only found to be a variant in African Americans, and absent in Caucasians, and the former have darker mean eye color than the latter.
- JUSTIFICATION This SNP is only found to be a variant in African Americans, and absent in Caucasians, and the former have darker mean eye color than the latter.
- BLUE 0 2 45 JUSTIFICATION The ratio of CC:CT:TT genotypes in persons of darker eye color is 0:5:54 but 0:2:60 in lighter eye persons, demonstrating that the C allele is slightly more frequent in persons of darker eye color.
- JUSTIFICATION The ratio of GG:GT:T genotypes in persons of darker eye color is 53:6:0 but 55:7:0 in lighter eye persons. Though not significantly different, this SNP is part ofthe TYR3L105 haplotype system, the utility of which was described in the text.
- a lower P value indicates the haplotype system is especially useful for predicting eye color.
- INSIG means the P value was not statistically significant, but in the case of TYRP3L105 and MCR3LOC106 systems, it was close.
- EXAMPLE 10 FURTHER ANALYSIS OF HAPLOTYPES This example provides further analysis ofthe single haplotype systems discussed in Examples 8 and 9, and analysis of new combinations of these haplotypes using classification approaches other than the nested statistical approach.
- the classification from each ofthe four rule trees can be combined within one person. For example, one could classify individuals as dark eyed if at least 3 ofthe 4 classifications were dark, or if only 1 of 4 was dark etc .
- the conditional approach allows us to improve the accuracy of the solution to 88.5%. This is still far below the 96% the nested approach obtained.
- This example provides additional haplotypes from the OCA2 gene that are associated with eye color.
- Methods for detecting the nucleotide occunence at a SNP position are described in Example 4.
- the OCA3LOC908 haplotype system is comprised of markers 217452, 217455, and 217458 (See Table 1 for a description of the markers).
- Table 11-1 contains data on haplotype alleles and eye color for these haplotypes.
- Various statistical analyses are included below, that prove that the OCA3LOC908 haplotype system, and its constituent SNPs, are associated with (and possibly deterministic for) hmnan eye color. Statistically significant P values are in bold print. The results of successful as well as unsuccessful tests are presented.
- H1:CAT H2:CAC
- H3:CGC H4:TGC
- H5:TAT H5:TAT
- H6 CGT Eye Colors: Brown & Not Brown.
- HYPOTHESES HO: Eye Colors are not Associated with specific Haplotypes.
- HI Eye Colors are Associated with specific Haplotypes.
- Odds Ratio(OR) can also be used to infer the Association between Haplotypes
- the sample OR also confirms that Haplotypes H4 & H5 are more associated with Brown Eye color & Haplotypes HI & H3 are more associated with Not-Brown
- haplotypes form 0-step clades
- haplotypes connected by single mutation constitutes the 1-step clades
- haplotypes connected (including the infened ⁇ . ⁇ ones) by 2 or less mutations constitute the -step clades and so on and carry out nested contingency analysis.
- H1 (CAT), H2:CAC), H3:(CGC), H4:(TGC), H5:(TAT), H6:(CGT).
- 1-step clades are: I1:(H1,H5), I2:H2, 13:(H3,H4), I4:H6.
- HI Eye colors are associated with various levels of clades, which represents certain mutations.
- HI Vs H5 and H3 vs. H4 represents mutations at site 1 and H1+H2+H5 vs. H3+H4+H6 represents mutation at site-2.
Landscapes
- Chemical & Material Sciences (AREA)
- Life Sciences & Earth Sciences (AREA)
- Proteomics, Peptides & Aminoacids (AREA)
- Health & Medical Sciences (AREA)
- Organic Chemistry (AREA)
- Wood Science & Technology (AREA)
- Analytical Chemistry (AREA)
- Zoology (AREA)
- Genetics & Genomics (AREA)
- Engineering & Computer Science (AREA)
- Pathology (AREA)
- Immunology (AREA)
- Microbiology (AREA)
- Molecular Biology (AREA)
- Biotechnology (AREA)
- Biophysics (AREA)
- Physics & Mathematics (AREA)
- Biochemistry (AREA)
- Bioinformatics & Cheminformatics (AREA)
- General Engineering & Computer Science (AREA)
- General Health & Medical Sciences (AREA)
- Measuring Or Testing Involving Enzymes Or Micro-Organisms (AREA)
- Peptides Or Proteins (AREA)
Abstract
Description


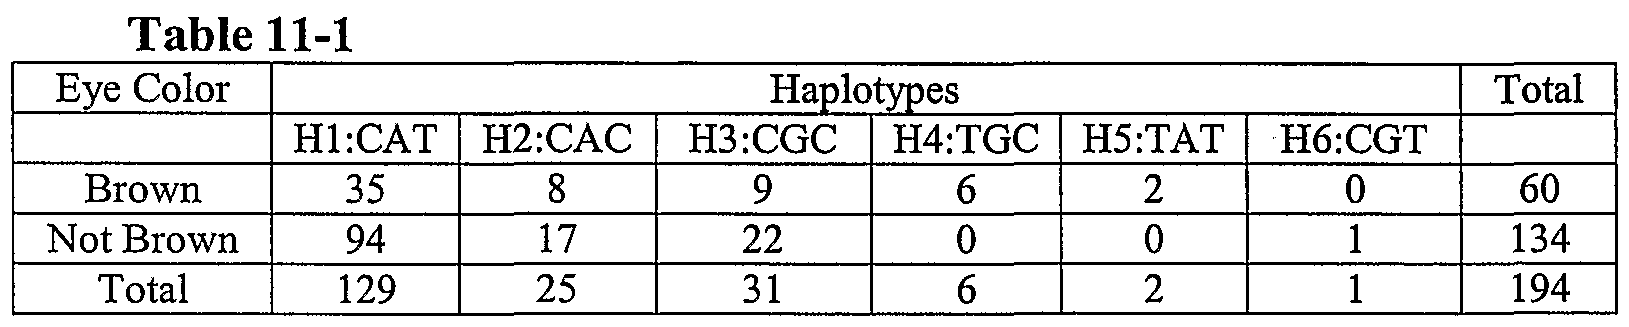

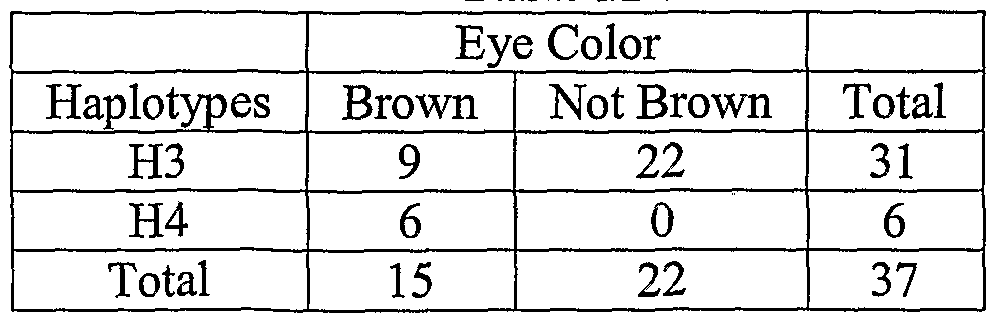


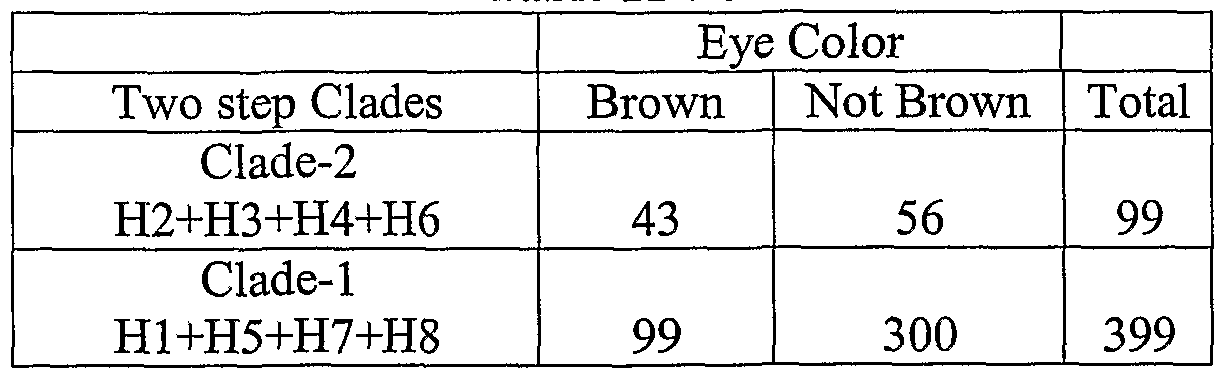

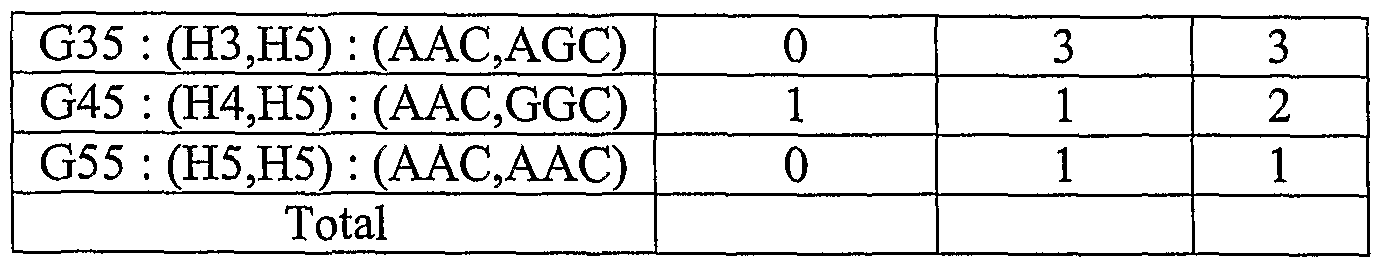

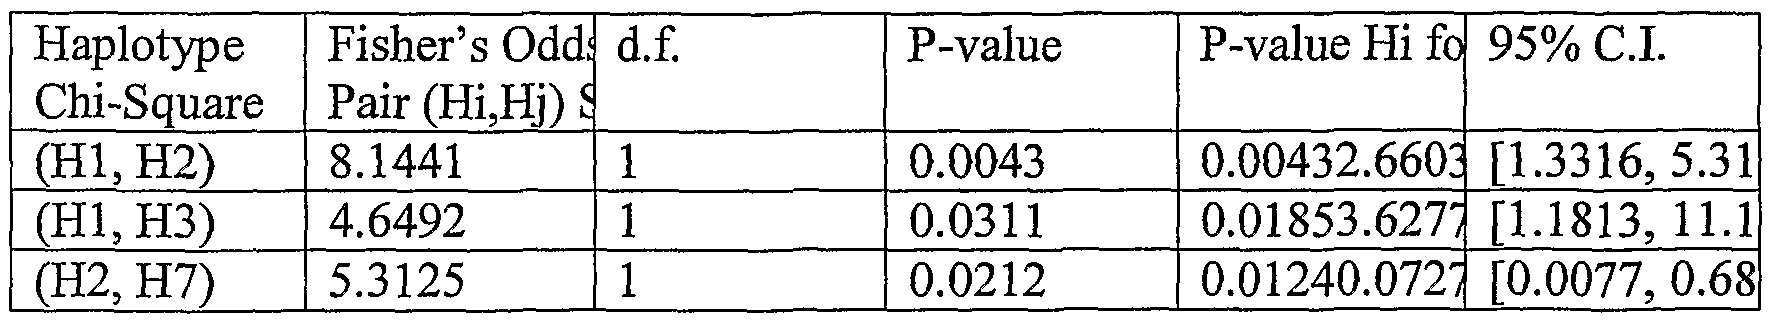


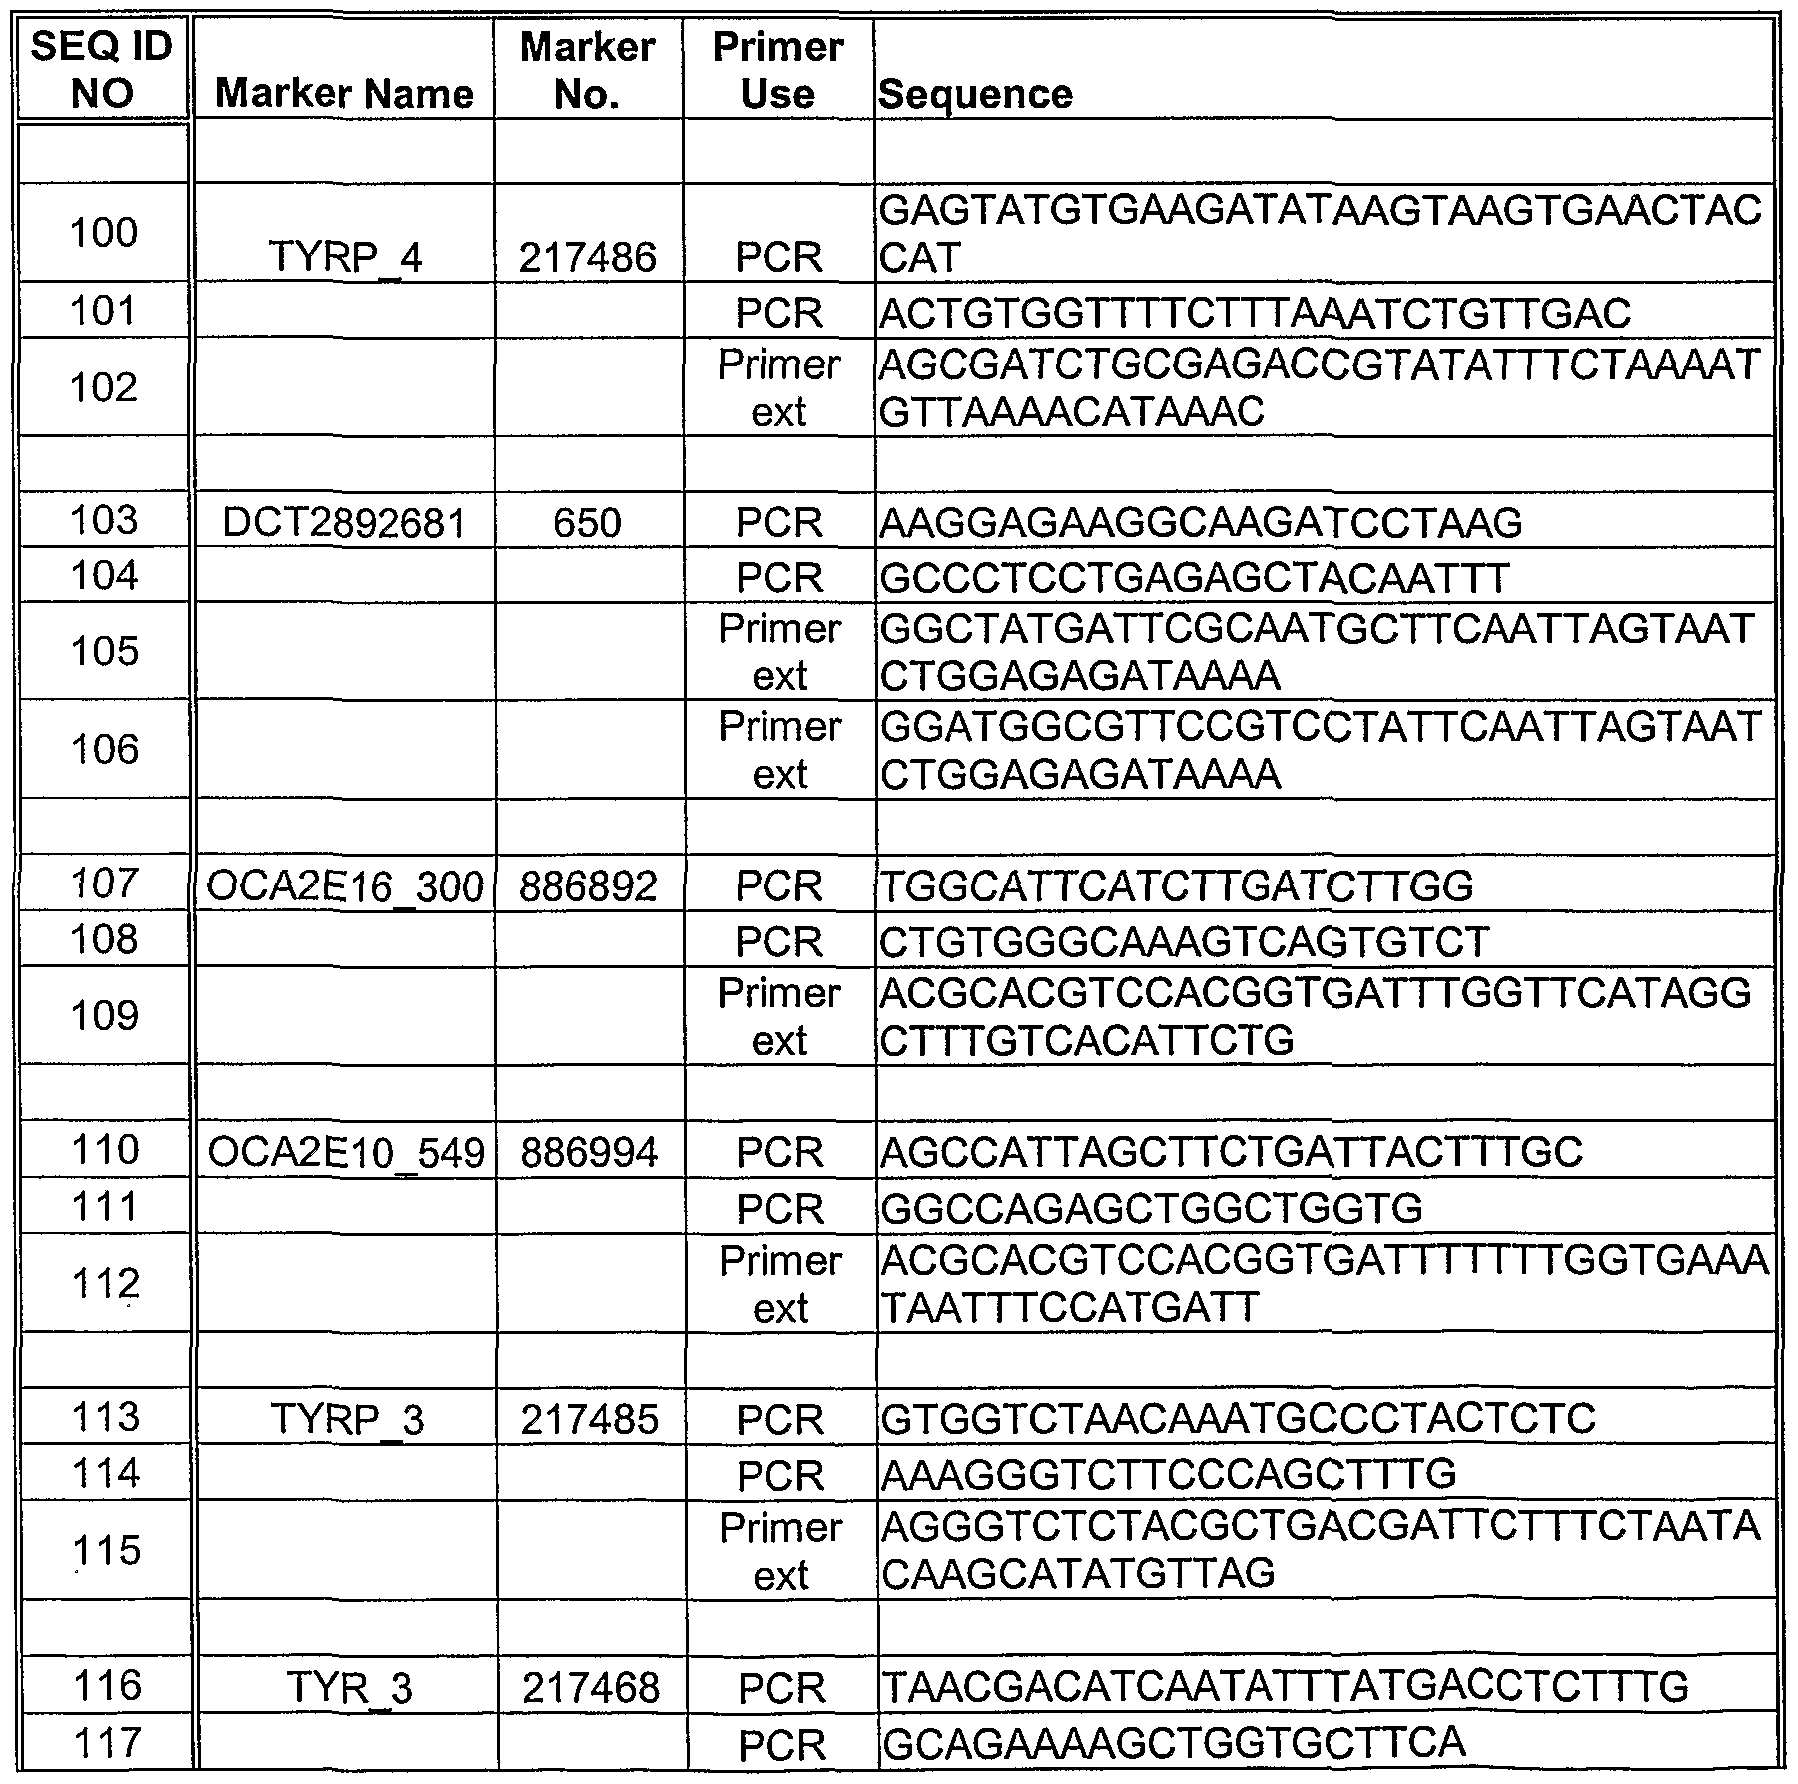


Claims
Priority Applications (3)
| Application Number | Priority Date | Filing Date | Title |
|---|---|---|---|
| EP02739467A EP1423531A4 (en) | 2001-05-25 | 2002-05-28 | Compositions and methods for the inference of pigmentation traits |
| JP2003500216A JP2004537292A (en) | 2001-05-25 | 2002-05-28 | Compositions and methods for estimating body color traits |
| CA002448569A CA2448569A1 (en) | 2001-05-25 | 2002-05-28 | Compositions and methods for the inference of pigmentation traits |
Applications Claiming Priority (14)
| Application Number | Priority Date | Filing Date | Title |
|---|---|---|---|
| US29356001P | 2001-05-25 | 2001-05-25 | |
| US60/293,560 | 2001-05-25 | ||
| US30018701P | 2001-06-21 | 2001-06-21 | |
| US60/300,187 | 2001-06-21 | ||
| US31078101P | 2001-08-07 | 2001-08-07 | |
| US60/310,781 | 2001-08-07 | ||
| US32366201P | 2001-09-17 | 2001-09-17 | |
| US60/323,662 | 2001-09-17 | ||
| US34441801P | 2001-10-26 | 2001-10-26 | |
| US60/344,418 | 2001-10-26 | ||
| US33467401P | 2001-11-15 | 2001-11-15 | |
| US60/334,674 | 2001-11-15 | ||
| US34630302P | 2002-01-02 | 2002-01-02 | |
| US60/346,303 | 2002-01-02 |
Publications (2)
| Publication Number | Publication Date |
|---|---|
| WO2002097047A2 true WO2002097047A2 (en) | 2002-12-05 |
| WO2002097047A3 WO2002097047A3 (en) | 2004-04-01 |
Family
ID=27569616
Family Applications (1)
| Application Number | Title | Priority Date | Filing Date |
|---|---|---|---|
| PCT/US2002/016789 WO2002097047A2 (en) | 2001-05-25 | 2002-05-28 | Compositions and methods for the inference of pigmentation traits |
Country Status (5)
| Country | Link |
|---|---|
| US (2) | US20030211486A1 (en) |
| EP (2) | EP1423531A4 (en) |
| JP (1) | JP2004537292A (en) |
| CA (1) | CA2448569A1 (en) |
| WO (1) | WO2002097047A2 (en) |
Cited By (12)
| Publication number | Priority date | Publication date | Assignee | Title |
|---|---|---|---|---|
| WO2004016768A2 (en) * | 2002-08-19 | 2004-02-26 | Dnaprint Genomics, Inc. | Compositions and methods for inferring ancestry |
| FR2853532A1 (en) * | 2003-04-08 | 2004-10-15 | Oreal | Use of human polynucleotides for treatment, prevention and diagnosis of pigmentation disorders, especially premature whitening of hair, derived from chromosomes 9 or 6 |
| FR2864899A1 (en) * | 2004-01-08 | 2005-07-15 | Oreal | Cosmetic and therapeutic use of specific nucleotides, for treatment of pigmentation disorders, especially premature loss of hair color, also for diagnosis |
| FR2865217A1 (en) * | 2004-01-15 | 2005-07-22 | Oreal | Using single nucleotide polymorphism markers, present on human chromosome 9, for determining predisposition to precocious canitis |
| WO2005068650A2 (en) * | 2004-01-08 | 2005-07-28 | L'oreal | Various human chromosomal regions implicated in premature canities |
| WO2005068652A1 (en) * | 2004-01-15 | 2005-07-28 | L'oreal | Polymorphisms of chromosome 9 implicated in premature canities |
| EP1718666A2 (en) * | 2004-02-13 | 2006-11-08 | DNAprint Genomics, Inc. | Methods and compositions for inferring eye color and hair color |
| KR20130016013A (en) * | 2011-08-03 | 2013-02-14 | 주식회사 엘지생활건강 | Genetic polymorphic markers for determining type of white skin and use thereof |
| CZ304385B6 (en) * | 2012-11-15 | 2014-04-09 | Univerzita Karlova v Praze, Lékařská fakulta v Plzni | Prediction method of visible phenotype markers and biogeographical origin, especially for forensic purposes |
| WO2014066217A1 (en) * | 2012-10-23 | 2014-05-01 | Illumina, Inc. | Hla typing using selective amplification and sequencing |
| WO2020143698A1 (en) * | 2019-01-11 | 2020-07-16 | 山东农业大学 | Genotype selection-based purification method for domestic rabbit having belgian hare coat color |
| CN116626467A (en) * | 2023-05-31 | 2023-08-22 | 西安工程大学 | Detection method for rapidly detecting defective silicon photomultiplier chip |
Families Citing this family (26)
| Publication number | Priority date | Publication date | Assignee | Title |
|---|---|---|---|---|
| US20030215819A1 (en) | 2001-06-29 | 2003-11-20 | Frudakis Tony N. | Compositions and methods for inferring a response to statin |
| US20050065809A1 (en) * | 2003-07-29 | 2005-03-24 | Blackbaud, Inc. | System and methods for maximizing donations and identifying planned giving targets |
| US7169560B2 (en) | 2003-11-12 | 2007-01-30 | Helicos Biosciences Corporation | Short cycle methods for sequencing polynucleotides |
| EP1716254B1 (en) * | 2004-02-19 | 2010-04-07 | Helicos Biosciences Corporation | Methods for analyzing polynucleotide sequences |
| US20070021918A1 (en) * | 2004-04-26 | 2007-01-25 | Georges Natsoulis | Universal gene chip for high throughput chemogenomic analysis |
| US20060035250A1 (en) * | 2004-06-10 | 2006-02-16 | Georges Natsoulis | Necessary and sufficient reagent sets for chemogenomic analysis |
| WO2006004659A1 (en) * | 2004-06-30 | 2006-01-12 | Applera Corporation | Methods for analyzing short tandem repeats and single nucleotide polymorphisms |
| US7588892B2 (en) * | 2004-07-19 | 2009-09-15 | Entelos, Inc. | Reagent sets and gene signatures for renal tubule injury |
| EP1945803B1 (en) * | 2005-08-16 | 2014-07-02 | Merlogen, LLC | Methods for identification of merle gene |
| US20070198653A1 (en) * | 2005-12-30 | 2007-08-23 | Kurt Jarnagin | Systems and methods for remote computer-based analysis of user-provided chemogenomic data |
| US20100021885A1 (en) * | 2006-09-18 | 2010-01-28 | Mark Fielden | Reagent sets and gene signatures for non-genotoxic hepatocarcinogenicity |
| ES2419183T3 (en) * | 2007-08-20 | 2013-08-19 | Erasmus University Medical Center Rotterdam | Procedure to predict iris color |
| US20100049665A1 (en) * | 2008-04-25 | 2010-02-25 | Christopher Allan Ralph | Basel adaptive segmentation heuristics |
| US20100311033A1 (en) * | 2009-06-09 | 2010-12-09 | Jhilmil Jain | Analytical measures for student-collected articles for educational project having a topic |
| US9111144B2 (en) * | 2011-09-15 | 2015-08-18 | Identigene, L.L.C. | Eye color paternity test |
| US9501522B2 (en) * | 2012-08-17 | 2016-11-22 | Sas Institute Inc. | Systems and methods for providing a unified variable selection approach based on variance preservation |
| WO2014121133A2 (en) * | 2013-02-03 | 2014-08-07 | Genelex Corporation | Systems and methods for quantification and presentation of medical risk arising from unknown factors |
| KR101538052B1 (en) * | 2013-10-30 | 2015-07-21 | 경상북도 (관련부서:경상북도축산기술연구소장) | Method for discrimination of chicken using single nucleotide polymorphism marker in TYRP1 gene |
| US10193956B2 (en) | 2013-11-13 | 2019-01-29 | Five3 Genomics, Llc | Grouping and transferring omic sequence data for sequence analysis |
| US11664088B2 (en) * | 2016-07-30 | 2023-05-30 | Battelle Memorial Institute | Systems and methods using DNA sequence strings as a common data format for forensic DNA typing applications |
| KR102485223B1 (en) * | 2017-09-29 | 2023-01-05 | (주)아모레퍼시픽 | Genetic Polymorphic marker for predicting melanin concentration in skin and use thereof |
| CN109680070B (en) * | 2018-11-01 | 2021-11-26 | 天津奥群牧业有限公司 | SNP (Single nucleotide polymorphism) marker and molecular marker remarkably related to Australia white sheep hoof color and application |
| US11055380B2 (en) * | 2018-11-09 | 2021-07-06 | International Business Machines Corporation | Estimating the probability of matrix factorization results |
| US11816834B2 (en) * | 2020-01-06 | 2023-11-14 | The Texas A&M University System | Unmanned aerial system genotype analysis using machine learning routines |
| CA3178467A1 (en) * | 2020-04-02 | 2021-10-07 | Embark Veterinary, Inc. | Methods and systems for determining pigmentation phenotypes |
| WO2022271631A2 (en) * | 2021-06-22 | 2022-12-29 | Evqlv, Inc. | Computationally directed protein sequence evolution |
-
2002
- 2002-05-28 US US10/156,995 patent/US20030211486A1/en not_active Abandoned
- 2002-05-28 EP EP02739467A patent/EP1423531A4/en not_active Withdrawn
- 2002-05-28 EP EP06022589A patent/EP1873257A3/en not_active Withdrawn
- 2002-05-28 CA CA002448569A patent/CA2448569A1/en not_active Abandoned
- 2002-05-28 WO PCT/US2002/016789 patent/WO2002097047A2/en not_active Application Discontinuation
- 2002-05-28 JP JP2003500216A patent/JP2004537292A/en active Pending
-
2006
- 2006-04-03 US US11/397,454 patent/US20070020651A1/en not_active Abandoned
Non-Patent Citations (3)
| Title |
|---|
| MANGA ET AL.: 'In Southern Africa, Brown oculocutaneous albinism (BOCA) maps to the OCA2 locus on chromosome 15q: P-gene mutations identified' AMERICAN JOURNAL OF HUMAN GENETICS vol. 68, March 2001, pages 782 - 787, XP002972650 * |
| OETTING ET AL.: 'Molecular basis of albinism: mutations and polymorphisms of pigmentation genes associated with albinism' HUMAN MUTATION vol. 13, 1999, pages 99 - 115, XP008018509 * |
| See also references of EP1423531A2 * |
Cited By (55)
| Publication number | Priority date | Publication date | Assignee | Title |
|---|---|---|---|---|
| WO2004016768A2 (en) * | 2002-08-19 | 2004-02-26 | Dnaprint Genomics, Inc. | Compositions and methods for inferring ancestry |
| WO2004016768A3 (en) * | 2002-08-19 | 2005-12-22 | Dnaprint Genomics Inc | Compositions and methods for inferring ancestry |
| FR2853532A1 (en) * | 2003-04-08 | 2004-10-15 | Oreal | Use of human polynucleotides for treatment, prevention and diagnosis of pigmentation disorders, especially premature whitening of hair, derived from chromosomes 9 or 6 |
| FR2864899A1 (en) * | 2004-01-08 | 2005-07-15 | Oreal | Cosmetic and therapeutic use of specific nucleotides, for treatment of pigmentation disorders, especially premature loss of hair color, also for diagnosis |
| WO2005068650A2 (en) * | 2004-01-08 | 2005-07-28 | L'oreal | Various human chromosomal regions implicated in premature canities |
| WO2005068650A3 (en) * | 2004-01-08 | 2005-11-24 | Oreal | Various human chromosomal regions implicated in premature canities |
| FR2865217A1 (en) * | 2004-01-15 | 2005-07-22 | Oreal | Using single nucleotide polymorphism markers, present on human chromosome 9, for determining predisposition to precocious canitis |
| WO2005068652A1 (en) * | 2004-01-15 | 2005-07-28 | L'oreal | Polymorphisms of chromosome 9 implicated in premature canities |
| JP2007517515A (en) * | 2004-01-15 | 2007-07-05 | ロレアル | Chromosome 9 polymorphism involved in young gray hair |
| EP1718666A2 (en) * | 2004-02-13 | 2006-11-08 | DNAprint Genomics, Inc. | Methods and compositions for inferring eye color and hair color |
| EP1718666A4 (en) * | 2004-02-13 | 2008-08-13 | Dnaprint Genomics Inc | Methods and compositions for inferring eye color and hair color |
| KR101742941B1 (en) | 2011-08-03 | 2017-06-02 | 주식회사 엘지생활건강 | Genetic polymorphic markers for determining type of white skin and use thereof |
| KR101742459B1 (en) | 2011-08-03 | 2017-05-31 | 주식회사 엘지생활건강 | Genetic polymorphic markers for determining type of white skin and use thereof |
| KR101763950B1 (en) | 2011-08-03 | 2017-08-03 | 주식회사 엘지생활건강 | Genetic polymorphic markers for determining wrinkle type of skin and use thereof |
| KR101747631B1 (en) | 2011-08-03 | 2017-06-16 | 주식회사 엘지생활건강 | Genetic polymorphic markers for determining wrinkle type of skin and use thereof |
| KR101725556B1 (en) | 2011-08-03 | 2017-04-12 | 주식회사 엘지생활건강 | Genetic polymorphic markers for determining type of white skin and use thereof |
| KR101727883B1 (en) | 2011-08-03 | 2017-04-17 | 주식회사 엘지생활건강 | Genetic polymorphic markers for determining type of white skin and use thereof |
| KR101727881B1 (en) | 2011-08-03 | 2017-04-17 | 주식회사 엘지생활건강 | Genetic polymorphic markers for determining type of white skin and use thereof |
| KR101727884B1 (en) | 2011-08-03 | 2017-04-17 | 주식회사 엘지생활건강 | Genetic polymorphic markers for determining type of white skin and use thereof |
| KR101727885B1 (en) | 2011-08-03 | 2017-04-17 | 주식회사 엘지생활건강 | Genetic polymorphic markers for determining type of white skin and use thereof |
| KR101727882B1 (en) | 2011-08-03 | 2017-04-17 | 주식회사 엘지생활건강 | Genetic polymorphic markers for determining type of white skin and use thereof |
| KR101732336B1 (en) | 2011-08-03 | 2017-05-02 | 주식회사 엘지생활건강 | Genetic polymorphic markers for determining type of white skin and use thereof |
| KR101732334B1 (en) | 2011-08-03 | 2017-05-02 | 주식회사 엘지생활건강 | Genetic polymorphic markers for determining type of white skin and use thereof |
| KR101732335B1 (en) | 2011-08-03 | 2017-05-02 | 주식회사 엘지생활건강 | Genetic polymorphic markers for determining type of white skin and use thereof |
| KR101733945B1 (en) | 2011-08-03 | 2017-05-08 | 주식회사 엘지생활건강 | Genetic polymorphic markers for determining type of white skin and use thereof |
| KR101732864B1 (en) | 2011-08-03 | 2017-05-08 | 주식회사 엘지생활건강 | Genetic polymorphic markers for determining type of white skin and use thereof |
| KR101733377B1 (en) | 2011-08-03 | 2017-05-08 | 주식회사 엘지생활건강 | Genetic polymorphic markers for determining type of white skin and use thereof |
| KR101733378B1 (en) | 2011-08-03 | 2017-05-08 | 주식회사 엘지생활건강 | Genetic polymorphic markers for determining type of white skin and use thereof |
| KR101739720B1 (en) | 2011-08-03 | 2017-05-24 | 주식회사 엘지생활건강 | Genetic polymorphic markers for determining type of white skin and use thereof |
| KR101742457B1 (en) | 2011-08-03 | 2017-05-31 | 주식회사 엘지생활건강 | Genetic polymorphic markers for determining type of white skin and use thereof |
| KR101742460B1 (en) | 2011-08-03 | 2017-05-31 | 주식회사 엘지생활건강 | Genetic polymorphic markers for determining type of white skin and use thereof |
| KR101742458B1 (en) | 2011-08-03 | 2017-05-31 | 주식회사 엘지생활건강 | Genetic polymorphic markers for determining type of white skin and use thereof |
| KR101747627B1 (en) | 2011-08-03 | 2017-06-16 | 주식회사 엘지생활건강 | Genetic polymorphic markers for determining wrinkle type of skin and use thereof |
| KR101742937B1 (en) | 2011-08-03 | 2017-06-02 | 주식회사 엘지생활건강 | Genetic polymorphic markers for determining type of white skin and use thereof |
| KR101742938B1 (en) | 2011-08-03 | 2017-06-02 | 주식회사 엘지생활건강 | Genetic polymorphic markers for determining type of white skin and use thereof |
| KR101742939B1 (en) | 2011-08-03 | 2017-06-02 | 주식회사 엘지생활건강 | Genetic polymorphic markers for determining type of white skin and use thereof |
| KR101742943B1 (en) | 2011-08-03 | 2017-06-02 | 주식회사 엘지생활건강 | Genetic polymorphic markers for determining type of white skin and use thereof |
| KR101742944B1 (en) | 2011-08-03 | 2017-06-02 | 주식회사 엘지생활건강 | Genetic polymorphic markers for determining type of white skin and use thereof |
| KR101742942B1 (en) | 2011-08-03 | 2017-06-02 | 주식회사 엘지생활건강 | Genetic polymorphic markers for determining type of white skin and use thereof |
| KR20130016013A (en) * | 2011-08-03 | 2013-02-14 | 주식회사 엘지생활건강 | Genetic polymorphic markers for determining type of white skin and use thereof |
| KR101742940B1 (en) | 2011-08-03 | 2017-06-02 | 주식회사 엘지생활건강 | Genetic polymorphic markers for determining type of white skin and use thereof |
| KR101742936B1 (en) | 2011-08-03 | 2017-06-02 | 주식회사 엘지생활건강 | Genetic polymorphic markers for determining type of white skin and use thereof |
| KR101742935B1 (en) | 2011-08-03 | 2017-06-02 | 주식회사 엘지생활건강 | Genetic polymorphic markers for determining type of white skin and use thereof |
| KR101747638B1 (en) | 2011-08-03 | 2017-06-16 | 주식회사 엘지생활건강 | Genetic polymorphic markers for determining wrinkle type of skin and use thereof |
| KR101747629B1 (en) | 2011-08-03 | 2017-06-16 | 주식회사 엘지생활건강 | Genetic polymorphic markers for determining wrinkle type of skin and use thereof |
| KR101747628B1 (en) | 2011-08-03 | 2017-06-16 | 주식회사 엘지생활건강 | Genetic polymorphic markers for determining wrinkle type of skin and use thereof |
| KR101747630B1 (en) | 2011-08-03 | 2017-06-16 | 주식회사 엘지생활건강 | Genetic polymorphic markers for determining wrinkle type of skin and use thereof |
| US9181583B2 (en) | 2012-10-23 | 2015-11-10 | Illumina, Inc. | HLA typing using selective amplification and sequencing |
| WO2014066217A1 (en) * | 2012-10-23 | 2014-05-01 | Illumina, Inc. | Hla typing using selective amplification and sequencing |
| US10262104B2 (en) | 2012-10-23 | 2019-04-16 | Illumina, Inc. | HLA typing using selective amplification and sequencing |
| EP3594362A1 (en) * | 2012-10-23 | 2020-01-15 | Illumina, Inc. | Method and systems for determining haplotypes in a sample |
| CZ304385B6 (en) * | 2012-11-15 | 2014-04-09 | Univerzita Karlova v Praze, Lékařská fakulta v Plzni | Prediction method of visible phenotype markers and biogeographical origin, especially for forensic purposes |
| WO2020143698A1 (en) * | 2019-01-11 | 2020-07-16 | 山东农业大学 | Genotype selection-based purification method for domestic rabbit having belgian hare coat color |
| CN116626467A (en) * | 2023-05-31 | 2023-08-22 | 西安工程大学 | Detection method for rapidly detecting defective silicon photomultiplier chip |
| CN116626467B (en) * | 2023-05-31 | 2024-01-05 | 西安工程大学 | Detection method for rapidly detecting defective silicon photomultiplier chip |
Also Published As
| Publication number | Publication date |
|---|---|
| CA2448569A1 (en) | 2002-12-05 |
| EP1423531A4 (en) | 2005-06-08 |
| WO2002097047A3 (en) | 2004-04-01 |
| EP1873257A3 (en) | 2008-03-19 |
| US20070020651A1 (en) | 2007-01-25 |
| EP1873257A2 (en) | 2008-01-02 |
| JP2004537292A (en) | 2004-12-16 |
| US20030211486A1 (en) | 2003-11-13 |
| EP1423531A2 (en) | 2004-06-02 |
Similar Documents
| Publication | Publication Date | Title |
|---|---|---|
| US20070020651A1 (en) | Compositions and methods for the inference of pigmentation traits | |
| JP6430998B2 (en) | System and method for cleaning and using genetic data for making predictions | |
| Chen et al. | Findings in an independent sample support an association between bipolar affective disorder and the G72/G30 locus on chromosome 13q33 | |
| Thomas et al. | Recent developments in genomewide association scans: a workshop summary and review | |
| Giner-Delgado et al. | Evolutionary and functional impact of common polymorphic inversions in the human genome | |
| US20070037182A1 (en) | Multiplex assays for inferring ancestry | |
| CA2598455A1 (en) | Multiplex assays for inferring ancestry | |
| Robert et al. | On the use of pharmacogenetics in cancer treatment and clinical trials | |
| WO2016176519A1 (en) | System and method for processing genotype information relating to drug metabolism | |
| WO2009026116A2 (en) | Genemap of the human genes associated with longevity | |
| JP2012050432A (en) | Composition and method for inferring ancestry | |
| Marsjan et al. | Molecular markers, a tool for exploring genetic diversity | |
| Peters et al. | Methodologic quality and genotyping reproducibility in studies of tumor necrosis factor− 308 G→ A single nucleotide polymorphism and bacterial sepsis: Implications for studies of complex traits | |
| US20040023275A1 (en) | Methods for genomic analysis | |
| Silverman | Haplotype thinking in lung disease | |
| AU2002312112A1 (en) | Compositions and methods for the inference of pigmentation traits | |
| Moghadam et al. | Molecular characterization of AIPL1 gene region in the Iranian population: application of novel informative haplotypes and detection of mutational founder effect | |
| US20080026367A9 (en) | Methods for genomic analysis | |
| Lysenko et al. | Genotyping and Statistical Analysis | |
| JPWO2005030952A1 (en) | Haplotype analysis method | |
| KR20220141659A (en) | Genetic polymorphic markers for determining skin color and use thereof | |
| KR20230088246A (en) | Method and System for Predicting Change of Skin Brightness in Prescriptions comprising Vitamin C | |
| Leboyer et al. | Psychiatric genetics: Methods and reviews | |
| Glickman et al. | Here's to Your Health: Pharmacogenetics and Pharmacogenomics: Statistical Challenges in Design and Analysis | |
| Halushka | Dissecting nucleotide variation in hypertension candidate genes |
Legal Events
| Date | Code | Title | Description |
|---|---|---|---|
| AK | Designated states |
Kind code of ref document: A2 Designated state(s): AE AG AL AM AT AU AZ BA BB BG BR BY BZ CA CH CN CO CR CU CZ DE DK DM DZ EC EE ES FI GB GD GE GH GM HR HU ID IL IN IS JP KE KG KP KR KZ LC LK LR LS LT LU LV MA MD MG MK MN MW MX MZ NO NZ OM PH PL PT RO RU SD SE SG SI SK SL TJ TM TN TR TT TZ UA UG US US US US US US US UZ VN YU ZA ZM ZW |
|
| AL | Designated countries for regional patents |
Kind code of ref document: A2 Designated state(s): GH GM KE LS MW MZ SD SL SZ TZ UG ZM ZW AM AZ BY KG KZ MD RU TJ TM AT BE CH CY DE DK ES FI FR GB GR IE IT LU MC NL PT SE TR BF BJ CF CG CI CM GA GN GQ GW ML MR NE SN TD TG |
|
| 121 | Ep: the epo has been informed by wipo that ep was designated in this application | ||
| WWE | Wipo information: entry into national phase |
Ref document number: 2448569 Country of ref document: CA Ref document number: 2003500216 Country of ref document: JP |
|
| WWE | Wipo information: entry into national phase |
Ref document number: 2002312112 Country of ref document: AU |
|
| WWE | Wipo information: entry into national phase |
Ref document number: 2002739467 Country of ref document: EP |
|
| REG | Reference to national code |
Ref country code: DE Ref legal event code: 8642 |
|
| DFPE | Request for preliminary examination filed prior to expiration of 19th month from priority date (pct application filed before 20040101) | ||
| WWP | Wipo information: published in national office |
Ref document number: 2002739467 Country of ref document: EP |
|
| WWW | Wipo information: withdrawn in national office |
Ref document number: 2002739467 Country of ref document: EP |