USRE47622E1 - High-sensitivity subsurface sensing system - Google Patents
High-sensitivity subsurface sensing system Download PDFInfo
- Publication number
- USRE47622E1 USRE47622E1 US15/720,619 US201715720619A USRE47622E US RE47622 E1 USRE47622 E1 US RE47622E1 US 201715720619 A US201715720619 A US 201715720619A US RE47622 E USRE47622 E US RE47622E
- Authority
- US
- United States
- Prior art keywords
- antenna
- target
- antenna array
- rotational orientation
- array
- Prior art date
- Legal status (The legal status is an assumption and is not a legal conclusion. Google has not performed a legal analysis and makes no representation as to the accuracy of the status listed.)
- Active, expires
Links
Images


Classifications
-
- G—PHYSICS
- G01—MEASURING; TESTING
- G01V—GEOPHYSICS; GRAVITATIONAL MEASUREMENTS; DETECTING MASSES OR OBJECTS; TAGS
- G01V3/00—Electric or magnetic prospecting or detecting; Measuring magnetic field characteristics of the earth, e.g. declination, deviation
- G01V3/08—Electric or magnetic prospecting or detecting; Measuring magnetic field characteristics of the earth, e.g. declination, deviation operating with magnetic or electric fields produced or modified by objects or geological structures or by detecting devices
- G01V3/10—Electric or magnetic prospecting or detecting; Measuring magnetic field characteristics of the earth, e.g. declination, deviation operating with magnetic or electric fields produced or modified by objects or geological structures or by detecting devices using induction coils
- G01V3/104—Electric or magnetic prospecting or detecting; Measuring magnetic field characteristics of the earth, e.g. declination, deviation operating with magnetic or electric fields produced or modified by objects or geological structures or by detecting devices using induction coils using several coupled or uncoupled coils
-
- H—ELECTRICITY
- H01—ELECTRIC ELEMENTS
- H01Q—ANTENNAS, i.e. RADIO AERIALS
- H01Q3/00—Arrangements for changing or varying the orientation or the shape of the directional pattern of the waves radiated from an antenna or antenna system
- H01Q3/02—Arrangements for changing or varying the orientation or the shape of the directional pattern of the waves radiated from an antenna or antenna system using mechanical movement of antenna or antenna system as a whole
- H01Q3/08—Arrangements for changing or varying the orientation or the shape of the directional pattern of the waves radiated from an antenna or antenna system using mechanical movement of antenna or antenna system as a whole for varying two co-ordinates of the orientation
Definitions
- the present invention is directed to an electromagnetic sensing system for geophysical or other applications and more particularly to such a system using mechanical rotation of a nulled array of antennas to reduce temporal drift, thereby greatly improving measurement sensitivity.
- FDEM Frequency-Domain Electromagnetic
- TDEM Time-Domain Electromagnetic
- TX Transmitter
- ISM Industrial, Scientific and Medical
- TDEM methods typically measure only during ‘off-times’ (i.e., when the primary field is turned off). This is equivalent to measuring only the quadrature-phase data and the important in-phase data are lost. FDEM measurements can be made at multiple frequencies and over a very broad bandwidth, which also allows for a more detailed characterization of the target.
- One common approach to reduce the primary field at the RX antenna is to orient the TX and RX coils orthogonal to each other (geometric nulling).
- a second common approach is to use a nulling signal from a third coil (electrical nulling).
- the long-term stability of the geometric or electric null is important for the system performance. Because the primary field is so large, small variations in the geometric alignment of the TX, RX, and nulling coils can cause a substantial change in the level of signal measured by the RX, which will result in a false anomaly. Therefore, the sensitivity and the measurement accuracy of state-of-the-art FDEM systems are largely dependent on the degree of stability of the null over long periods of time, which is commonly characterized by the long-term drift of the system.
- This new measurement technique allows one to make measurements in any direction about the rotation axis of the array. Data obtained from the multi-directional measurements can be used to determine the location of a target in 3D space, as well as to discriminate between multiple targets.
- UXO mapping unexploded ordnance
- this technology can be applied to many other near-surface geophysics problems, such as environmental studies and natural resources exploration.
- the technology can also be applied in many other fields, such as: nondestructive testing, medical diagnostic imaging, and security monitoring though walls and foliage.
- the present invention is particularly well suited to frequency-domain systems, where the primary field is very large, it can also be applied to time-domain systems. On-time measurements are made in the presence of the primary field; therefore, the present invention is directly applicable. In the off-time, where there is no primary field, there may still be a large background field, and the present invention is again applicable.
- FIG. 1 shows plots of the temporal drift in the GEM-300 sensor
- FIG. 2 shows an ATAC measuring system block diagram according to the preferred embodiment
- FIG. 3 shows an electronic nulling circuit
- FIG. 4 is a schematic illustration of the isolated rotating beam
- FIG. 5 is a diagram of the ideal orthogonal antenna arrays in vertical ( ⁇ ), and in horizontal (b) orientations above the surface of the earth;
- FIG. 6 shows a model geometry for a vertical array
- FIG. 7 shows plots of the secondary response of the earth, secondary response of the sheet target, and the combined or total response, calculated as a function of the array rotation angle
- FIG. 8 shows a model geometry for a horizontal array
- FIG. 9 shows plots of the secondary response of the earth, secondary response of the sheet target, and the combined or total response, calculated as a function of the array rotation angle
- FIG. 10 is an illustration of the imperfections in the geometric null between the TX and RX antennas
- FIG. 11 is an illustration of the basic principle of the digital-nulling (rotation) procedure
- FIG. 12 shows an example of the reduction of measurement errors due to temporal drift in the milling circuit
- FIG. 13 is an illustration of the antenna arrays over the tilted surface of the earth
- FIG. 14 shows the reduction in the response of the earth due to the asymmetric rotation of the horizontal array
- FIG. 15 shows the response of the earth due to the tilting of the vertical array
- FIG. 16 is a diagram of the setup for computing the response of a small conducting sheet buried under ground
- FIG. 17 shows simulation results from computing the response of a conductive target buried under ground when using the vertical array
- FIG. 18 is a diagram of the FSM setup for computing the response of a test resonant coil (TRC);
- FIG. 19 shows FSM results for the x-directed TX dipole and the z-directed TRC dipole
- FIG. 20 shows a standard target used for static calibration of the system
- FIG. 21 is an illustration of the ARTTEST method of dynamic calibration
- FIG. 22 is an illustration of the direct monitoring of the TX
- FIG. 23 shows an example of the reduction of measurement errors due to variations in the system gain
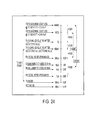
- FIG. 24 is a chart illustrating the dynamic range of the system
- FIG. 25 is a diagram of the setup for measuring the response of the TRC target
- FIG. 26 shows measurement results and FSM prediction for the TRC dipole in z
- FIG. 27 is a diagram of the set up for measuring the response of a metal sheet
- FIG. 28 shows magnitude and phase measurement results for the aluminum and steel sheets compared with the EM1DSH simulations and with the response of the TRC calculated by FSM;
- FIG. 29 shows in-phase and quadrature measurement results for the Aluminum and Steel sheets compared with the EM1DSH simulations and with the response of the TRC calculated by FSM;
- FIG. 30 is a diagram of the profile set up for measuring the response of the two conducting sheets using the four-directional measurement
- FIG. 31 shows four-directional measurement results for the two metal sheets separated by 1.6 m
- FIG. 32 is a diagram of the set up for measuring the response of a small iron sphere
- FIG. 33 shows measurement results for an iron sphere compared with the response of the equivalent magnetic dipoles predicted by the FSM
- FIG. 34 is a diagram of the set up for measuring the response of the 2′′ steel pipe
- FIG. 35 shows measurement results for the steel pipe, 5 m long and 5 cm in diameter
- FIG. 36 is a diagram of the set up for measuring the characteristic response of the UXO targets
- FIG. 37 shows measurement results for the UXO oriented in x
- FIG. 38 shows measurement results for the UXO oriented in y
- FIG. 40 shows a maximum range for the UXO detection
- FIG. 42 shows plots of the secondary response of the earth
- FIG. 43 shows EM1DSH computation results of the multi-frequency response of a conductive sheet at 1 m depth obtained with a horizontal array at a 0.5m height
- FIG. 44 shows plots of the secondary response of the earth.
- FIG. 2 A high-level block diagram of the ATAC measurement system is shown in FIG. 2 as 200 . Since this is currently a prototype, proof-of-principle system, certain simplifications have been made.
- the data-acquisition system 202 is controlled by a Gateway M 460 notebook computer 204 mounted on the beam.
- the analog-to-digital converters (ADCs) 206 and the digital-to-analog converters (DACs) 208 are provided by a Layla 24-bit data acquisition system from Echo Digital Audio Corporation.
- the control software is written in Lab-View from National Instruments and uses an ASIO compliant sound driver which handles low level I/O to the LAYLA.
- Layla hardware we have found the Layla hardware to be a very effective platform for these research measurements and we have made the software that we developed widely available at http://www.lasi.arizona.edul. Although this computer and data acquisition system are somewhat bulky, it has served very well for this demonstration, and it can be readily modified for lighter weight and field ruggedness.
- the output of one of the Layla DACs is amplified with an OpAmp Labs, model 423, amplifier 210 .
- This amplifier 210 drives an air-core coil 212 that is series tuned to a resonant frequency of 8000 Hz.
- the coil current is 200 mA
- the coil area is 9.8 ⁇ 10 ⁇ 4 m 2
- the number of turns is 2400
- the moment is 0.45 Am 2 .
- the current monitor will be described below.
- the receiver air-core coil 214 has 12,000 turns, an area of 9.8 ⁇ 10 ⁇ 4 m 2 , and is parallel tuned to resonance at 8 kHz.
- the coil sensitivity is 16.3 nV/fT. This coil is followed by a differential input operational amplifier 216 and then the Layla ADC channel.
- electronic nulling using simple manual-adjustment attenuators can provide approximately 40 dB of additional cancellation of the primary field at the RX antenna.
- one significant source of measurement error is the lack of perfect mechanical stability of the beam, which is used to hold the TX and RX antennas in an orthogonal configuration with respect to each other.
- a very small amount of bending or twisting in the beam can cause enough change in the alignment of the TX and RX antennas to substantially alter the geometric null, which appears in the measurement as large false anomalies.
- FIG. 4 shows the overall configuration as 400 .
- a motor 402 turns the rest of the assembly 400 , which includes TX/RX electronics 404 , the rotating beam main vertical beam 406 , the isolated beam 408 and the attachment point 410 .
- the magnitude of the false anomaly caused by the deformation of the vertical beam was reduced from 70 ppm in the original design to of the order of 0.1 ppm in the isolated-beam design.
- the secondary magnetic field generated by the eddy currents induced in the earth is a complicated function of the coil spacing S, the operating frequency f, and the earth conductivity ⁇ .
- the depth of investigation is limited only by the coil separation S and the system's dynamic range.
- TX and RX antennas with a 0.5 m separation and a single frequency of 8000 Hz to ensure operation at low induction numbers.
- EM1DSH which is an integral equation modeling code, to investigate the effect of the presence of the earth on the target's response.
- Our simulation results showed that for these operating conditions we can model a target response using targets in free-space. Therefore, we developed a free-space modeling (FSM) program, with an easy-to-use graphical interface that proved to be valuable in predicting the characteristic behavior of the target response for the new ATAC measurement method.
- FSM free-space modeling
- the vertical array in ( ⁇ ) is in null coupling with respect to the earth for any orientation (rotation angle ⁇ ) of the TX dipole in the x-y plane ( FIG. 6 ). Therefore, in this orientation, the array does not see the flat homogenous or layered earth ( FIG. 7 ). Hence, the response of a target buried underneath the earth's surface can be easily measured by moving the array down the survey line.
- the array When the array is placed horizontally over the earth, as shown in (b) of FIG. 5 , it will be coupled to the earth.
- the strength of the background response of the earth in this case will depend on the orientation (rotation angle a) of the TX dipole in the y-z plane ( FIG. 8 ).
- this array will not only measure a response of the target buried underneath the earth's surface, but also the background response of the earth. Therefore, the total measured response will consist of the sum of the target's response and the earth's response ( FIG. 9 ).
- H RX [(H p , ⁇ H p (ti))+(H SE + ⁇ H SE ( ⁇ i))+(H ST + ⁇ H ST ( ⁇ i))][G SR + ⁇ G SR (ti)] (1)
- ⁇ quantities denote the changes in the fields and in the system response function GSR
- the variables t and ⁇ represent changes with respect to time and rotational angle respectively
- the subscript i denotes the measurement number
- the change in the secondary response of the target that is denoted by ⁇ H ST ( ⁇ ) is only a function of orientation ( ⁇ ) with respect to the target and the target properties.
- the non-zero H p term in (1) is caused by any misalignment of the orthogonal TX and RX antennas, which leads to a residual primary field at the RX antenna.
- the mechanical stability of the TX and RX antennas in the array is very limited. Therefore, this residual primary field typically varies with time, as signified by the ⁇ H p (t)
- a non-zero H SE term in (1) will be present due to the strong coupling of the array to the earth.
- the changes in H SE denoted by the ⁇ H SE ( ⁇ i ) term in (1) will depend only on the rotation positions of the arrays with respect to the earth's surface and the electrical properties of the earth.
- the field terms in (1) are multiplied by the gain factor G SR , which changes with respect to time, ⁇ G SR (t i ).
- the objective in this system is to minimize all these terms except ⁇ H ST ( ⁇ i ), which models the changing target response as we rotate the array.
- the imperfection in the geometric null between the TX and RX antennas is illustrated in FIG. 10 .
- the misalignment of the TX and RX antennas is very small, and does not significantly change the secondary-field coupling between the array and the earth, as compared to the ideal case in FIG. 5 .
- Misalignment only has a significant effect on the much larger primary field, which is modeled by H p in (1).
- H p in (1)
- the sensitivity of the large primary field to the imperfections and instability of the geometric null results in system drift ⁇ H p (t i ), which is the most significant limitation in implementing the antenna array in practice.
- y ⁇ ⁇ 4 y ⁇ ⁇ 1 + ( y ⁇ ⁇ 3 - y ⁇ ⁇ 1 t ⁇ ⁇ 3 - t ⁇ ⁇ 1 ) ⁇ ( t ⁇ ⁇ 2 - t ⁇ ⁇ 1 ) ( 2 )
- y ⁇ ⁇ 5 y ⁇ ⁇ 2 - y ⁇ ⁇ 4
- H SE The background response of the earth, which is denoted by H SE in (1), will be measured as a false anomaly when using the array in either the vertical or horizontal orientations. The magnitude of this false anomaly will depend on the TX/RX separation, operating frequency, earth properties, tilt angle ⁇ , and array rotation angle ⁇ .
- the EM1DSH simulation results shown in FIG. 14 illustrate the effect of the tilt in the direction orthogonal to the array axis on the cancellation of the background response of the earth, when using a symmetric rotation of the horizontal array.
- the vertical array in FIG. 13 -a will have a non-zero H SE term in (1), unlike the ideal case in FIGS. 5 -a and 7 where the array in this orientation was completely decoupled from the earth.
- the strength of H SE will vary from site to site along the survey line.
- the coupling between the TX and RX antennas and the earth will change at different rotation positions of the array.
- the ⁇ H SE term in (1) will be a function of the array rotation angle ⁇ .
- the EM1DSH simulation results shown in FIG. 15 indicate that a tilt ⁇ in the vertical array relative to the earth's surface of less than 5 degrees results in a level of the background response of the earth that is less than 0.5 ppm.
- H RX (1 ⁇ 2) H RX (1)
- ⁇ H RX (2) [ ⁇ H P (1 ⁇ 2) + ⁇ H SE (1 ⁇ 2) + ⁇ H ST (1 ⁇ 2) ][G SR +G SR ] (3)
- the earth's response in FIG. 13 is significantly stronger for the horizontal array in (b) than it is for the vertical array in ( ⁇ ). Therefore, when trying to measure the target response in (3), the reduction in the earth's response is achieved by making measurements at the rotation positions of the array that are symmetric relative to the earth's surface.
- FIG. 18 shows the FSM setup that we used to investigate the response of a magnetic dipole target.
- FIG. 19 we show simulation results obtained with FSM to illustrate the diagnostic features of the response of a small conductive target that can be modeled as a magnetic dipole.
- the computational results are restricted to targets that can be modeled by magnetic dipoles of known moments. For this reason, most of our simulations involved a specially designed tuned resonant coil (TRC) with a known moment, M TRC , described by
- the static calibration is carried out in a target-free environment, typically once per day, prior to the survey measurements, to provide the system calibration in an absolute sense.
- This procedure involves measuring the response of a known standard target placed at a specific fixed location near the array, as shown in FIG. 20 .
- a known standard target placed at a specific fixed location near the array, as shown in FIG. 20 .
- the impedance of the standard target was measured with an HP 4192 impedance analyzer. This impedance was used to compute the expected target response. The magnitude and phase of this predicted response were always used as standard values for comparing the target response measured during the static calibration.
- Geophysical surveying typically requires taking continuous measurements over periods of many hours. We have found from our experience that the TX and RX response can have substantial variations over hours of operation. In practice, the static calibration can not be applied repeatedly during the survey because it requires an anomaly-free environment. Therefore, a continuous monitoring of the system response is needed for proper correction of the data for the changes that occur in the time-varying gain of the system over a long period of time. After the system initialization, we continuously monitor the changes in the absolute calibration using the ARTTEST method for the RX and employ a direct monitoring of the TX current ( FIG. 2 ).
- the basic principle of the ARTTEST method is to inject a constant calibration tone that is offset in frequency from the primary TX signal into the RX antenna as shown in FIG. 21 .
- the calibration signal and the data signal are measured simultaneously.
- the frequency offset between the calibration signal and the data signal is made small so that the RX response at the frequency of the calibration tone will accurately represent the RX response at the main operating frequency.
- the time variations in this calibration tone measured with the RX will correspond to the time variations in the response of the RX.
- This type of dynamic calibration allows for monitoring of the changes in the RX over long periods of time, which is used for continuous gain-correction of the measurement data. In our prototype system, we employed a 4 Hz offset between the data and calibration signals.
- the level of magnetic ambient noise in FIG. 24 was specified for urban conditions, in a rural environment, the level of magnetic ambient noise can be as low as 0.5-2.5 fT. Hence, in remote locations, the level of ambient noise could be smaller than the level of current-noise for the INA111 amplifier. It is therefore possible to increase the dynamic range from 134 dB to 168 dB (or 0.004 ppm) by coming down to the 2.5 fT level of ambient noise in rural conditions, and with a low current-noise amplifier, such as an INA111.
- each processed data point was obtained from three consecutive measurements taken first at the reference rotation position of the TX dipole, then at a second rotation position, and then back at the reference position. In this prototype system, these measurements were made manually. However, in an operational system, these measurements would be automated with stepper motors.
- TRC tuned resonant coil
- TRC target Measurements with the TRC target were conducted in two measurement directions, i.e., with the transmitter (TX) dipole in both the x and y directions.
- the vertical distance between the TX and receiver (RX) was fixed at 0.5 m for all of the tests.
- the TRC target was placed at a depth of 0.5 m below the receiver antenna.
- FIG. 26 where we plot the magnitude and phase of the measured and calculated TRC responses. These plots show very good agreement between the measured and calculated responses for the TRC target. This indicates that our measurement system is working properly and yielding correct data for the predicted target response.
- the measurement results show very good agreement with the EM1DSH simulations. They also indicate that the strength of the response of the 0.5 m by 0.5 m square metal sheet is approximately equal to the strength of the response of the TRC predicted by the FSM code. In addition, when the calculated phase response of the TRC is shifted by ⁇ 90°, as plotted in FIG. 28 , it agrees with the measured response of the metal sheet.
- the conductive sheet appears as an inductive target, i.e., an untuned multi-turn coil with predominantly inductive impedance. Based on these observations we conclude that a small conductive sheet can be modeled by our FSM program as a multi-turn coil circuit with inductive impedance.
- a small conducting sphere as another test target.
- We chose to use a sphere because it is commonly viewed as a basic model for compactly shaped conductors, and it is therefore a good representative of 3D conductive targets.
- the sphere we chose was made of iron and was 10 cm in diameter.
- the setup for measuring the response of the sphere is shown in FIG. 32 . This set up can be considered as using a horizontal array to measure the response of a sphere located at the depth of 0.5 m below the TX and RX antennas.
- the simulation results allowed us to determine the specific shape of the overall response of the sphere by adding the responses of the x-directed and y-directed TRC dipoles.
- the magnitude of the measured response was smaller than the magnitude of the calculated response by a factor of 0.00649, and the phase of the measured response differed from the phase of the calculated response by +130°.
- FIG. 33 we show the measured response of the sphere and the predicted response of the TRC dipoles with their moments scaled by a factor of 0.00649 in magnitude and shifted by +130° in phase.
- the phase response of the iron sphere that we tested was measured to be ⁇ 140°.
- the apparent permeability to be 1000 ⁇ 0 and the apparent conductivity to be 4.5 ⁇ 10 6 S/m, which are reasonable for iron material.
- UXO unexploded ordnance
- the response of each UXO was measured in two measurement directions with the TX dipole oriented in both x and in y.
- a diagram of the setup for these tests is shown in FIG. 36 .
- This set up can be considered as using a horizontal array to measure the response of the UXO target located at the depth of 0.75 m below the TX and RX antennas.
- the measurement results that are plotted in FIGS. 37-39 show a distinction between the UXO that contains only ferrous metal and the one that contains a mixture of ferrous and non-ferrous metal.
- the response of the mortar round, which is made of both ferrous and non-ferrous metal has a predominantly real component, whereas the response of the cannon projectile target, which is made of only a ferrous conductor, has approximately equal real and imaginary components. This is consistent with the measured response of the iron sphere, which also exhibited the same relationship between the real and imaginary data.
- the shape of the measured responses of the cannon projectile for all three orientations of the UXO is very similar to the shape of the measured response of the iron sphere. This result is explained by the geometrical similarities of the targets.
- the mortar round is very asymmetric in the longitudinal direction.
- the measured response of the mortar positioned along the profile line, i.e. in the x direction shown in FIG. 37 also indicates the asymmetry in the plot of imaginary data obtained for the TX dipole in the y direction.
- the set up in FIG. 36 can also be considered for the same array in a horizontal orientation with the earth's surface defined by the x-z plane.
- the same UXO response would correspond to the target buried under the earth's surface at a depth of ⁇ 0.75 m when the array is very near the surface.
- the measurement results from this test indicate that in the vertical array configuration, our system can detect both UXO targets at a depth of 0.45 m below the RX dipole.
- the measurement results from this test shown in FIG. 40 -b, indicate that in the horizontal array configuration our system can detect both UXO targets at the depth of 1.25 m below the RX dipole.
- the measurement results for the UXO maximum detection range correspond to approximately a 1 PPM level of the measurement noise, or 120 dB of dynamic range.
- the mortar round and cannon projectile could be detected with the vertical array at a depth of 0.9 m, and with the horizontal array at a depth of 2.5 m.
- the full potential of our design with a dynamic range of up to 200 dB can be realized when the sensitivity of our system is improved further by increasing the TX moment.
- the mortar and cannon projectile could be detected with the vertical array at a depth of 1.8 m, and with the horizontal array at a depth of 5.0 m.
- H SE_IM + ⁇ i ⁇ ⁇ x , ⁇ y , ⁇ z ⁇ ⁇ H ST_IM i ⁇ cos ⁇ ( ⁇ i ) ) ( 14 )
- FIG. 43 shows how these components change with frequency.
- FIG. 44 shows the inphase and quadrature responses as a function of the array rotation angle calculated for a frequency of 1 MHz.
- a comparison between FIGS. 42 and 44 shows that the zero crossings shift as the frequency is changed, and the zero-crossings for the real and imaginary components don't line up when there are both strong earth and target responses present. In both cases there is a diagnostic difference in the curves for the no-target case versus the earth-with-target case.
- a two- or three-dimensional modeling program e.g. integral equation, finite element, or finite difference code
- a two- or three-dimensional modeling program e.g. integral equation, finite element, or finite difference code
- a two- or three-dimensional modeling program e.g. integral equation, finite element, or finite difference code
- a hypothesized earth model consisting of one or more targets and the background response
- Apply the ATAC rotation algorithm to the theoretical calculated data; Compare the calculated and observed data. We then iterate the model to obtain the best match between the theoretical and observed data.
- the diagnostic character of the ATAC rotation data provides the necessary information for an effective interpretation algorithm and elimination of the background response.
- FSM free-space modeling
- the 81 mm mortar round and the 84 mm cannon projectile may be detected with the vertical array at a depth of as much as 1.8 m, and with the horizontal array at a depth of as much as 5.0 m.
Landscapes
- Physics & Mathematics (AREA)
- Engineering & Computer Science (AREA)
- Remote Sensing (AREA)
- Life Sciences & Earth Sciences (AREA)
- Electromagnetism (AREA)
- Environmental & Geological Engineering (AREA)
- Geology (AREA)
- General Life Sciences & Earth Sciences (AREA)
- General Physics & Mathematics (AREA)
- Geophysics (AREA)
- Variable-Direction Aerials And Aerial Arrays (AREA)
- Geophysics And Detection Of Objects (AREA)
Abstract
Description
HRX=[(Hp,ΔHp(ti))+(HSE+ΔHSE(αi))+(HST+ΔHST(αi))][GSR+ΔGSR(ti)] (1)
HRX (1−2)=HRX (1)−HRX (2)=[ΔHP (1−2)+ΔHSE (1−2)+ΔHST (1−2)][GSR+GSR] (3)
ATRC=0.009151 m2,
NTRC=1656,
ZTRC=298∠−2° (5)
[(h−S)h]3=[(h′+S)h′]3 (6)
h′=0.5└√{square root over (S2+4(h2−Sh))}−S┘ (7)
Claims (62)
Priority Applications (1)
| Application Number | Priority Date | Filing Date | Title |
|---|---|---|---|
| US15/720,619 USRE47622E1 (en) | 2008-07-11 | 2017-09-29 | High-sensitivity subsurface sensing system |
Applications Claiming Priority (3)
| Application Number | Priority Date | Filing Date | Title |
|---|---|---|---|
| US13456908P | 2008-07-11 | 2008-07-11 | |
| US12/501,231 US7994963B1 (en) | 2008-07-11 | 2009-07-10 | High-sensitivity subsurface sensing system |
| US15/720,619 USRE47622E1 (en) | 2008-07-11 | 2017-09-29 | High-sensitivity subsurface sensing system |
Related Parent Applications (1)
| Application Number | Title | Priority Date | Filing Date |
|---|---|---|---|
| US12/501,231 Reissue US7994963B1 (en) | 2008-07-11 | 2009-07-10 | High-sensitivity subsurface sensing system |
Publications (1)
| Publication Number | Publication Date |
|---|---|
| USRE47622E1 true USRE47622E1 (en) | 2019-09-24 |
Family
ID=44350774
Family Applications (2)
| Application Number | Title | Priority Date | Filing Date |
|---|---|---|---|
| US12/501,231 Ceased US7994963B1 (en) | 2008-07-11 | 2009-07-10 | High-sensitivity subsurface sensing system |
| US15/720,619 Active 2029-12-21 USRE47622E1 (en) | 2008-07-11 | 2017-09-29 | High-sensitivity subsurface sensing system |
Family Applications Before (1)
| Application Number | Title | Priority Date | Filing Date |
|---|---|---|---|
| US12/501,231 Ceased US7994963B1 (en) | 2008-07-11 | 2009-07-10 | High-sensitivity subsurface sensing system |
Country Status (1)
| Country | Link |
|---|---|
| US (2) | US7994963B1 (en) |
Families Citing this family (2)
| Publication number | Priority date | Publication date | Assignee | Title |
|---|---|---|---|---|
| US9651341B2 (en) * | 2013-03-14 | 2017-05-16 | The United States Of America, As Represented By The Secretary Of The Navy | System for the detection and classification of buried unexploded ordnance |
| US10393909B2 (en) | 2016-10-11 | 2019-08-27 | Arizona Board Of Regents On Behalf Of The University Of Arizona | Differential target antenna coupling (“DTAC”) data corrections |
Citations (14)
| Publication number | Priority date | Publication date | Assignee | Title |
|---|---|---|---|---|
| US4295096A (en) * | 1978-12-20 | 1981-10-13 | Conoco, Inc. | Electrode prospecting method providing calculable electromagnetic coupling for the indirect detection of hydrocarbon reservoirs |
| JPS58158576A (en) * | 1982-03-16 | 1983-09-20 | Tokyo Gas Co Ltd | Inspection of buried pipe |
| US4613821A (en) * | 1983-01-10 | 1986-09-23 | Conoco Inc. | Method and apparatus for obtaining high accuracy simultaneous calibration of signal measuring systems |
| US4642570A (en) * | 1983-03-25 | 1987-02-10 | Conoco Inc. | Method and apparatus for complex resistivity measurements with elimination of electromagnetic coupling effects |
| US4746867A (en) * | 1984-10-17 | 1988-05-24 | British Gas Corporation | Antenna assembly for microwave reflection survey equipment |
| US5767679A (en) * | 1995-05-19 | 1998-06-16 | Schroeder; Diether-Alfred | Geophysical prospecting apparatus utilizing pulsed electromagnetic signals and having a scanned four-cycle transmitter |
| US6522285B2 (en) * | 2000-06-27 | 2003-02-18 | Gerald L. Stolarczyk | Ground-penetrating imaging and detecting radar |
| US6657577B1 (en) * | 1997-07-02 | 2003-12-02 | Malaa Geoscience Forvaltning Ab | Radar plant and measurement technique for determination of the orientation and the depth of buried objects |
| US20040090230A1 (en) * | 2002-11-08 | 2004-05-13 | Matthias Appel | Method and apparatus for subterranean formation flow imaging |
| US20050156600A1 (en) * | 2002-10-09 | 2005-07-21 | Olsson Mark S. | Single and multi-trace omnidirectional sonde and line locators and transmitter used therewith |
| US6952101B2 (en) * | 2003-01-16 | 2005-10-04 | Kjt Enterprises, Inc. | Method for determining direction to a target formation from a wellbore by analyzing multi-component electromagnetic induction signals |
| US7170440B1 (en) * | 2005-12-10 | 2007-01-30 | Landray Technology, Inc. | Linear FM radar |
| US20070205937A1 (en) * | 2006-03-03 | 2007-09-06 | Realtronics Corporation | Apparatus and Method to Identify Targets Through Opaque Barriers |
| US7659847B2 (en) * | 2006-06-29 | 2010-02-09 | Stolar, Inc. | Radar mining guidance control system |
-
2009
- 2009-07-10 US US12/501,231 patent/US7994963B1/en not_active Ceased
-
2017
- 2017-09-29 US US15/720,619 patent/USRE47622E1/en active Active
Patent Citations (16)
| Publication number | Priority date | Publication date | Assignee | Title |
|---|---|---|---|---|
| US4295096A (en) * | 1978-12-20 | 1981-10-13 | Conoco, Inc. | Electrode prospecting method providing calculable electromagnetic coupling for the indirect detection of hydrocarbon reservoirs |
| US4295096B1 (en) * | 1978-12-20 | 1983-07-05 | ||
| JPS58158576A (en) * | 1982-03-16 | 1983-09-20 | Tokyo Gas Co Ltd | Inspection of buried pipe |
| US4613821A (en) * | 1983-01-10 | 1986-09-23 | Conoco Inc. | Method and apparatus for obtaining high accuracy simultaneous calibration of signal measuring systems |
| US4642570A (en) * | 1983-03-25 | 1987-02-10 | Conoco Inc. | Method and apparatus for complex resistivity measurements with elimination of electromagnetic coupling effects |
| US4746867A (en) * | 1984-10-17 | 1988-05-24 | British Gas Corporation | Antenna assembly for microwave reflection survey equipment |
| US5767679A (en) * | 1995-05-19 | 1998-06-16 | Schroeder; Diether-Alfred | Geophysical prospecting apparatus utilizing pulsed electromagnetic signals and having a scanned four-cycle transmitter |
| US6657577B1 (en) * | 1997-07-02 | 2003-12-02 | Malaa Geoscience Forvaltning Ab | Radar plant and measurement technique for determination of the orientation and the depth of buried objects |
| US6522285B2 (en) * | 2000-06-27 | 2003-02-18 | Gerald L. Stolarczyk | Ground-penetrating imaging and detecting radar |
| US20050156600A1 (en) * | 2002-10-09 | 2005-07-21 | Olsson Mark S. | Single and multi-trace omnidirectional sonde and line locators and transmitter used therewith |
| US20040090230A1 (en) * | 2002-11-08 | 2004-05-13 | Matthias Appel | Method and apparatus for subterranean formation flow imaging |
| US6952101B2 (en) * | 2003-01-16 | 2005-10-04 | Kjt Enterprises, Inc. | Method for determining direction to a target formation from a wellbore by analyzing multi-component electromagnetic induction signals |
| US7170440B1 (en) * | 2005-12-10 | 2007-01-30 | Landray Technology, Inc. | Linear FM radar |
| US20070132630A1 (en) * | 2005-12-10 | 2007-06-14 | Beckner Frederick L | Linear FM radar |
| US20070205937A1 (en) * | 2006-03-03 | 2007-09-06 | Realtronics Corporation | Apparatus and Method to Identify Targets Through Opaque Barriers |
| US7659847B2 (en) * | 2006-06-29 | 2010-02-09 | Stolar, Inc. | Radar mining guidance control system |
Non-Patent Citations (4)
| Title |
|---|
| B. Sternberg et al, "A New High-Sensitivity Eletromagnetic Sensing System: Part I - System Design, JEEG, September 2008, Vol. 13, Issue 3, pp. 247-261. (Year: 2008) * |
| B. Sternberg et al, A New High-Sensitivity Eletromagnetic Sensing System: Part I—System Design, JEEG, Sep. 2008, vol. 13, Issue 3, pp. 247-261. (Year: 2008). * |
| O. Krichenko et al, "A New High-Sensitivity Electromagnetic Sensing System: Part II - Measurement Results," JEEG, September 2008, Volume 13, Issue 3, pp. 263-275. (Year: 2008) * |
| O. Krichenko et al, "A New High-Sensitivity Electromagnetic Sensing System: Part II—Measurement Results," JEEG, Sep. 2008, vol. 13, Issue 3, pp. 263-275. (Year: 2008). * |
Also Published As
| Publication number | Publication date |
|---|---|
| US7994963B1 (en) | 2011-08-09 |
Similar Documents
| Publication | Publication Date | Title |
|---|---|---|
| US6559645B2 (en) | Detector apparatus and method | |
| Spies et al. | Electromagnetic sounding | |
| RU2279697C2 (en) | Device and method of measurement of electromagnet property of ground bed crossed by borehole | |
| CN108254792B (en) | Detection system, method, and medium for evaluating information of facility line | |
| US10393909B2 (en) | Differential target antenna coupling (“DTAC”) data corrections | |
| US5329235A (en) | Method for processing signals from an MWD electromagnetic resistivity logging tool | |
| Simon et al. | Mapping of quadrature magnetic susceptibility/magnetic viscosity of soils by using multi-frequency EMI | |
| Poliakov et al. | The range of induction-coil magnetic field sensors for geophysical explorations | |
| USRE47622E1 (en) | High-sensitivity subsurface sensing system | |
| EP2506040A1 (en) | Method and device for characterization of physical properties of a target volume by electromagnetic inspection. | |
| Won et al. | Magnetometers and electro-magnetomenters | |
| Tølbøll et al. | Sensitivity functions of frequency-domain magnetic dipole-dipole systems | |
| Dabas et al. | Slingram EMI devices for characterizing resistive features using apparent conductivity measurements: check of the DualEM‐421S instrument and field tests | |
| Thiesson et al. | Characterization of buried cables and pipes using electromagnetic induction loop-loop frequency-domain devices | |
| Mester et al. | Development and drift-analysis of a modular electromagnetic induction system for shallow ground conductivity measurements | |
| Brodie | Holistic inversion of airborne electromagnetic data | |
| Tereshchenko | Estimating the effective conductivity of the underlying surface based on the results of receiving the electromagnetic fields in the middle zone of an active source in the earth–ionosphere waveguide | |
| Sternberg et al. | Experimental studies and verification of a differential target antenna coupling method for sensing and imaging subsurface targets | |
| Li et al. | Electromagnetic propagation logging while drilling data acquisition method based on undersampling technology | |
| Sternberg et al. | A new high-sensitivity subsurface electromagnetic sensing system: Part I—system design | |
| KR20240055800A (en) | Systems and methods for detecting and describing conductors located above and/or below the seafloor | |
| Sternberg et al. | Experimental studies and verification of the vertical array-differential target antenna coupling (DTAC) method for rapid sensing and imaging of subsurface targets | |
| Dvorak et al. | Analytical and numerical studies of a differential target antenna coupling method for sensing and imaging subsurface targets | |
| CN108519622B (en) | Underground electric target detection method and device based on natural field source excitation | |
| Van Verre et al. | Reducing the induction footprint of ultra-wideband antennas for ground-penetrating radar in dual-modality detectors |
Legal Events
| Date | Code | Title | Description |
|---|---|---|---|
| FEPP | Fee payment procedure |
Free format text: ENTITY STATUS SET TO UNDISCOUNTED (ORIGINAL EVENT CODE: BIG.); ENTITY STATUS OF PATENT OWNER: SMALL ENTITY |
|
| FEPP | Fee payment procedure |
Free format text: ENTITY STATUS SET TO SMALL (ORIGINAL EVENT CODE: SMAL); ENTITY STATUS OF PATENT OWNER: SMALL ENTITY |
|
| AS | Assignment |
Owner name: THE ARIZONA BOARD OF REGENTS ON BEHALF OF THE UNIV Free format text: ASSIGNMENT OF ASSIGNORS INTEREST;ASSIGNORS:STERNBERG, BEN KOLLOCK;DVORAK, STEVEN LOUIS;KRICHENKO, OLEG GENNADYEVICH;SIGNING DATES FROM 20091008 TO 20091009;REEL/FRAME:049612/0199 |
|
| AS | Assignment |
Owner name: NATIONAL SCIENCE FOUNDATION, VIRGINIA Free format text: CONFIRMATORY LICENSE;ASSIGNOR:UNIVERSITY OF ARIZONA;REEL/FRAME:054371/0150 Effective date: 20200216 |
|
| FEPP | Fee payment procedure |
Free format text: MAINTENANCE FEE REMINDER MAILED (ORIGINAL EVENT CODE: REM.); ENTITY STATUS OF PATENT OWNER: SMALL ENTITY |
|
| AS | Assignment |
Owner name: NATIONAL SCIENCE FOUNDATION, VIRGINIA Free format text: CONFIRMATORY LICENSE;ASSIGNOR:UNIVERSITY OF ARIZONA;REEL/FRAME:063591/0040 Effective date: 20200216 |
|
| FEPP | Fee payment procedure |
Free format text: 11.5 YR SURCHARGE- LATE PMT W/IN 6 MO, SMALL ENTITY (ORIGINAL EVENT CODE: M2556); ENTITY STATUS OF PATENT OWNER: SMALL ENTITY |
|
| MAFP | Maintenance fee payment |
Free format text: PAYMENT OF MAINTENANCE FEE, 12TH YR, SMALL ENTITY (ORIGINAL EVENT CODE: M2553); ENTITY STATUS OF PATENT OWNER: SMALL ENTITY Year of fee payment: 12 |