US9959519B2 - Method and system for transit characteristic prediction - Google Patents
Method and system for transit characteristic prediction Download PDFInfo
- Publication number
- US9959519B2 US9959519B2 US11/094,505 US9450505A US9959519B2 US 9959519 B2 US9959519 B2 US 9959519B2 US 9450505 A US9450505 A US 9450505A US 9959519 B2 US9959519 B2 US 9959519B2
- Authority
- US
- United States
- Prior art keywords
- transit
- given
- data
- recited
- characteristic
- Prior art date
- Legal status (The legal status is an assumption and is not a legal conclusion. Google has not performed a legal analysis and makes no representation as to the accuracy of the status listed.)
- Expired - Fee Related, expires
Links
Images


Classifications
-
- G—PHYSICS
- G06—COMPUTING; CALCULATING OR COUNTING
- G06Q—INFORMATION AND COMMUNICATION TECHNOLOGY [ICT] SPECIALLY ADAPTED FOR ADMINISTRATIVE, COMMERCIAL, FINANCIAL, MANAGERIAL OR SUPERVISORY PURPOSES; SYSTEMS OR METHODS SPECIALLY ADAPTED FOR ADMINISTRATIVE, COMMERCIAL, FINANCIAL, MANAGERIAL OR SUPERVISORY PURPOSES, NOT OTHERWISE PROVIDED FOR
- G06Q10/00—Administration; Management
- G06Q10/08—Logistics, e.g. warehousing, loading or distribution; Inventory or stock management
- G06Q10/083—Shipping
- G06Q10/0833—Tracking
-
- G—PHYSICS
- G06—COMPUTING; CALCULATING OR COUNTING
- G06Q—INFORMATION AND COMMUNICATION TECHNOLOGY [ICT] SPECIALLY ADAPTED FOR ADMINISTRATIVE, COMMERCIAL, FINANCIAL, MANAGERIAL OR SUPERVISORY PURPOSES; SYSTEMS OR METHODS SPECIALLY ADAPTED FOR ADMINISTRATIVE, COMMERCIAL, FINANCIAL, MANAGERIAL OR SUPERVISORY PURPOSES, NOT OTHERWISE PROVIDED FOR
- G06Q10/00—Administration; Management
- G06Q10/08—Logistics, e.g. warehousing, loading or distribution; Inventory or stock management
- G06Q10/083—Shipping
- G06Q10/0834—Choice of carriers
- G06Q10/08345—Pricing
Definitions
- This invention relates to transit logistics and, more particularly, to predicting characteristics of transit between source locations and destination locations.
- a global, web-based or brick-and-mortar retail sales operation may routinely ship packages containing customer orders around the world.
- a distributed manufacturing operation may ship components or partially-assembled items from one manufacturing site to another for continued processing. Materials conveyance may also occur on a smaller scale, such as from a materials receiving area of a large, complex manufacturing site to one of a number of processing areas within the site.
- Reliably predicting a transit characteristic may be a critical parameter in an enterprise's operations. For example, in a manufacturing operation, overestimating transit time may result in having to hold materials in inventory until they are expected to be used, which may incur various logistical, facilities and overhead costs. By contrast, underestimating transit time may result in manufacturing downtime if reserves of materials are not available, which may result in lost productivity, missed production deadlines, etc. Similarly, a retail operation may find itself unable to meet customer demand or may suffer other problems with its supply chain to the extent that its supply-chain transit latencies remain unpredictable.
- the number of possible transit paths to be predicted and managed quickly becomes intractable.
- the number of possible transit paths is on the order of MN, and may be even higher if multiple different carriers or transit modalities are considered.
- the number of possible destinations may number in the tens or hundreds of millions, resulting in correspondingly many potential data points to be stored. Searching through such a large number of data points to predict transit time for a particular source and destination consequently may be prohibitively expensive.
- no historical data points may exist from which to predict transit time, or the data may be insufficient in quality or quantity for a meaningful prediction.
- a method may include determining respective transit latencies from a source location to a number of destination locations, and grouping the destination locations according to a similarity criterion into a number of subsets corresponding to respective geographical regions. Transit characteristics of destination locations grouped into a given geographical region may each satisfy the similarity criterion.
- the method may further include determining a respective distribution associated with each of the geographical regions. A given respective distribution may correlate a given transit characteristic from the source location to a given geographical region with a respective surety factor, where the respective surety factor includes a cumulative probability that the given transit characteristic will be achieved.
- the method may also include dynamically updating the respective transit characteristics, the grouping of destination locations into geographical regions and the respective distributions dependent upon collecting empirical transit data.
- transit characteristics may include transit latencies, distributions, transit rates, or other characteristics.
- a system may include an application program, a web services interface, and a transit characteristic model, where the application program may be configured to request from the transit characteristic model via the web services interface a prediction of a transit characteristic from a source location to a given destination location.
- the transit characteristic model may be configured to determine respective transit characteristic from the source location to a number of destination locations and to group the destination locations according to a similarity criterion into a number of subsets corresponding to respective geographical regions. Transit characteristics of destination locations grouped into a given geographical region may each satisfy the similarity criterion.
- the transit characteristic model may be further configured to determine a respective latency distribution associated with each of the geographical regions, where a given respective latency distribution correlates a given transit characteristic from the source location to a given geographical region with a respective surety factor.
- the respective surety factor may include a cumulative probability that the given transit characteristic will be achieved.
- the transit characteristic model may also be configured to predict the transit characteristic to the given destination location, where the prediction includes determining that the particular destination location falls within a particular one of the geographical regions, evaluating the distribution associated with the particular geographical region to determine the predicted transit characteristic, and returning the predicted transit characteristic to the application.
- FIG. 1 is a block diagram illustrating one embodiment of source locations, destination locations and shipping methods between sources and destinations.
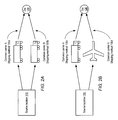
- FIGS. 2A-B are block diagrams illustrating exemplary embodiments of shipping methods between source locations and destination locations.
- FIG. 3 is a block diagram illustrating an example grouping of destination locations into regions.
- FIG. 4 is a flow diagram illustrating one embodiment of a method of grouping destinations into geographical regions according to transit time similarity.
- FIG. 5 is a graph illustrating one embodiment of transit time probability distribution.
- FIG. 6 is a flow diagram illustrating one embodiment of grouping destinations into geographical regions according to distributions of transit characteristics.
- FIG. 7 is a flow diagram illustrating one embodiment of a method of determining a transit time probability distribution associated with a geographical region.
- FIG. 8 is a flow diagram illustrating one embodiment of a method of predicting transit time to a destination using geographical regions.
- FIG. 9 is a block diagram illustrating one embodiment of a system including a predictive transit time model.
- FIG. 10A is a flow diagram illustrating one embodiment of a method of determining transit time of a shipping method given a desired surety factor.
- FIG. 10B is a flow diagram illustrating one embodiment of a method of determining a surety factor of a shipping method given a desired transit time.
- FIG. 11 is a block diagram illustrating an exemplary embodiment of a computer system.
- transit time or other transit characteristics between individual source and destination locations may quickly become intractable as the number of sources and destinations increases, e.g., to a global geographical scale.
- a method for grouping destination locations into geographical regions according to similarity of transit times to those destinations from a source location is described.
- such paths may be predicted on a region-by-region basis, which may dramatically reduce the complexity of the data required while preserving accuracy and flexibility in prediction.
- the transit time from a source to a given region may be modeled as a probability distribution rather than a single, static value, which may enable a more sophisticated analysis of possible transit scenarios to the given region.
- a number of source locations 110 a - b as well as a number of destination locations 120 a - e are shown. Additionally, a number of shipping methods 130 between some of source locations 110 and destination locations 120 are shown. It is noted that in various embodiments, an arbitrary number of source locations 110 , destination locations 120 and shipping methods 130 between them may be provided. For simplicity of reference, source locations 110 and destination locations 120 may also be referred to simply as sources 110 and destinations 120 .
- a source location 110 may include any type of point of origin or departure for materials in transit, and similarly a destination location 120 may include any type of intermediate or final destination point.
- a source location 110 may include a warehouse or fulfillment center within which inventory may be stored and items may be selected and packaged for delivery to customers.
- a source location 110 may also include a third party shipper or drop shipper, e.g., a manufacturer, wholesaler or other party in possession of items, who may ship items upon receiving instructions to do so from a retailer or other party who is primarily responsible for managing the order.
- a destination location 120 may include, for example, a business or residential location identified by an address (e.g., a street address including a postal code).
- source locations 110 and destination locations 120 may correspond to other types of facilities or locations, such as manufacturing plants, raw materials sources, product distributors or wholesalers, virtual or physical retailers, etc.
- neither source location 110 nor destination location 120 need represent the ultimate source or destination of an item in transit.
- multiple different modes or methods of transit may be used to convey materials from an originating source to a final destination.
- a destination location 120 with respect to one leg of transit such as a common carrier's shipping hub, may serve as a source location 110 with respect to another leg of transit.
- an entire supply chain for an item, from raw materials, manufacturing and distribution to final delivery to a customer may be modeled as a series of materials conveyance between source locations 110 and destination locations 120 .
- multiple different paths from different source locations 110 may correspond to the movement of raw materials or inventory throughout the supply chain. These paths may be modeled and tracked through the stage of assembly, packaging, delivery, etc., for example to coordinate just-in-time materials management, to meet manufacturing or shipping deadlines, or to meet other operational goals.
- a source location 110 and a destination location 120 may be reversed with respect to a given item in transit. For example, in some instances defective items or excess quantities may be returned from a given destination location 120 to the source location 110 from which they were received, or possibly to another source location 110 .
- a fulfillment center on the West Coast of the United States may be better suited in general to service shipments destined for western states and Asia, whereas a fulfillment center on the East Coast may be preferable for servicing shipments to the eastern United States and Europe.
- multiple different shipping methods 130 are illustrated between some pairs of source locations 110 and destination locations 120 , while no paths are illustrated between other pairs of source and destination locations.
- transshipment between two source locations 110 or two destination locations 120 may be performed.
- inventory may be repositioned from one fulfillment center to another.
- a source location 110 may be modeled as a destination location 120 (or vice versa) under such circumstances.
- FIGS. 2A-B illustrate several exemplary embodiments of particular shipping methods 130 .
- two different shipping methods 130 a - b between a source location 110 and a destination location 120 may correspond to the same mode or class of transit provided by two different common carriers, A and B.
- shipping methods 130 a - b may correspond to a surface-based mode of transit (e.g., ground service) provided by United Parcel Service (UPS) and FedEx, respectively.
- UPS United Parcel Service
- shipping methods 130 c - d may correspond to different modes of transit provided by the same common carrier A.
- shipping methods 130 c - d may correspond respectively to UPS Ground service and UPS Two-Day Air service.
- common carriers may include DHL, the United States Postal Service, and other shipping companies as well as the postal services of other countries.
- privately contracted carriers e.g., company-owned or leased fleets
- shipping methods 130 may include various smaller-scale procedures and resources for moving materials, such as manned push carts, trucks, conveyor systems, etc.
- a shipping method 130 may encompass any suitable method for conveying tangible goods from one location to another on a large or small geographic scale, including common or private carriers, land, air or sea modes, etc.
- each shipping method 130 may be independently modeled to yield predictions regarding transit times from sources 110 to destinations 120 using a particular shipping method 130 .
- a predictive model of a shipping method 130 will present an accurate representation of the actual behavior of shipping method 130 .
- a predictive model of a shipping method 130 may be constructed through analysis of empirical transit data of actual shipments from sources 110 to destinations 120 .
- many common carriers collect and maintain copious amounts of tracking data documenting the progress of packages in transit within their systems.
- common carriers typically make such tracking data available to shippers and customers via a variety of interfaces, such as web services interfaces accessible via a shipper's computer system.
- Tracking data may, for example, indicate the date and time at which a package was accepted by the carrier for shipment from a source 110 (or in some cases, a suitable proxy for a source such as, e.g., the nearest shipping hub) as well as the date and time of delivery at a destination 120 .
- empirical transit data may be collected by materials handling systems, such as bar code or RFID (radio frequency identifier) scanning devices operating in conjunction with a locator system (e.g., a global position system (GPS)), for example.
- materials handling systems such as bar code or RFID (radio frequency identifier) scanning devices operating in conjunction with a locator system (e.g., a global position system (GPS)
- GPS global position system
- a transit characteristic may encompass any measurable or empirically observable aspect of materials transit between a given source 110 and a given destination 120 .
- a transit characteristic may include a transit latency between given source 110 and given destination 120 .
- a transit characteristic may include a probability distribution of some metric associated with transit between given source 110 and given destination 120 , such as a probability distribution of transit latency values.
- a number of different data points representing historical shipments to a given destination 120 may be grouped into a probability distribution of those data points with respect to given destination 120 , and the probability distribution may be considered a transit characteristic corresponding to transit between given source 110 and given destination 120 .
- a transit characteristic may include a shipping rate or cost between given source 110 and given destination 120 , or a distribution of such rates (e.g., according to package size, weight, quality of service, etc.). Other types of transit characteristics are also possible and contemplated.
- destinations 120 having respective transit characteristics from source 110 for shipping method 130 may be grouped into geographical regions according to a similarity criterion, such that a given region circumscribes destinations 120 whose transit characteristics satisfy the similarity criterion.
- the transit characteristic may encompass transit latency from source 110 via shipping method 130
- the similarity criterion may specify that destinations 120 be grouped if their transit latencies match exactly or within a given threshold of difference (e.g., an absolute number of units of latency, such as 0.5 units, or a percentage, such as 20%).
- FIG. 3 One example illustrating the grouping of destinations 120 into regions is shown in FIG. 3 and the accompanying flow diagram of FIG. 4 .
- individual destinations 120 are identified using a coordinate system, such as a latitude-longitude coordinate system, a two-dimensional Cartesian coordinate system, or another suitable coordinate system.
- a coordinate system such as a latitude-longitude coordinate system, a two-dimensional Cartesian coordinate system, or another suitable coordinate system.
- a quasi-Cartesian latitude-longitude coordinate system will be assumed, although embodiments are not limited to such a system.
- a number of destinations 120 are illustrated as solid circles, and empirical transit time data for each destination 120 is illustrated as a tuples of the form (latitude, longitude, latency) near each circle, where latency is the transit time (e.g., in days) from a particular source 110 to the destination 120 designated by latitude and longitude.
- a number of methods may be applied to the tuples to derive corresponding geographical regions.
- the tuples may first be grouped or sorted according to common latency (block 400 ). For example, tuples having latency of 1 may be sorted into one group, tuples having a latency of 2 may be sorted into a second group, etc.
- a first group of tuples is then selected, for example the group corresponding to a latency of 1 (block 402 ).
- the dimensions or boundary coordinates of the corresponding region are then initialized to a default value, such as a value of one of the tuples (block 404 ).
- the dimensions or boundaries of a given rectangular region may be specified as a tuple of the form ⁇ (lat1, lon1), (lat2, lon2)>, where (lat1, lon1) represents the coordinates of the lower-left corner of the region, while (lat2, lon2) represents the coordinates of the upper-right corner of the region.
- the dimensions of the region corresponding to a latency of 1 may be initialized to, for example, ⁇ (4,3),(4,3)>.
- coordinates may be negative.
- latitude in the southern hemisphere or longitude in the western hemisphere may be represented as negative.
- the reverse sense may also be adopted, which may require reversing the sense of the conditions that follow.
- the tuple may be examined to determine whether the given tuple falls outside the existing region dimensions (block 406 ). For example, the given tuple may be examined to determine whether any latitude or longitude coordinate of the given tuple respectively falls outside a latitude or longitude coordinate of the dimensions of the corresponding region. In one embodiment, such an examination may include determining whether any of the following conditions is true: lat ⁇ lat1, lat>lat2, lon ⁇ lon1, lon>lon2.
- evaluating the tuple (2,2,1) with respect to the default region dimensions given above results in the first and third conditions being satisfied.
- other suitable tests based on region coordinates, boundaries, axes or other representations of region dimensions may be employed to determine whether a given tuple falls outside existing region dimensions.
- the dimensions may be expanded to encompass the given tuple. For example, in one embodiment, for any given coordinate of the region dimensions for which a corresponding one of the above conditions is satisfied, that coordinate of the region dimensions is replaced by the corresponding coordinate of the given tuple (block 408 ). Thus, in the current example, the coordinate (lat1, lon1) is changed from (4,3) to (2,2). This process may then iterate over the remaining tuples in the group (blocks 410 , 406 ). Once all tuples within a group have been processed, the resulting region dimensions may be saved (block 412 ). If other groups of tuples remain to be processed, dimensions of corresponding regions may be determined in a similar fashion (blocks 414 , 402 ). Otherwise, grouping of destinations 120 into regions is complete.
- geographical region 200 a corresponds to a transit time of 2 for a particular shipping method 130 from a particular source 110 , and has dimensions ⁇ (0,0),(5,7)>.
- geographical region 200 b corresponds to a transit time of 1 for particular shipping method 130 from particular source 110 , and has dimensions ⁇ (2,2),(4,5)>.
- regions 200 may be rectangular or approximately rectangular. However, depending on the coordinate system employed, other region shapes are possible (e.g., in a polar coordinate system, circular regions may be easier to manipulate than rectangular regions).
- the method just described for grouping destination transit time data into geographical regions may result in the definition of a minimum number of larger regions by virtue of first grouping data according to transit time similarity. If the actual shape of a contiguous region (e.g., as determined by connecting the outermost tuples of the region) is fairly symmetrical and convex, this minimization may be acceptable. However, if a region has a concave or asymmetrical shape, other grouping methods are possible and contemplated that may yield more accurate groupings. For example, instead of one large region corresponding to a given transit time, a larger number of smaller regions each corresponding to the given transit time may be formed.
- transit time tuples may first be arranged into a two-dimensional array, with each row of the array containing tuples of equal latitude and the rows ordered according to increasing or decreasing latitude. The grouping algorithm may then traverse rows of the array. While traversing the array, if the tuples encountered have the same transit time, steps 404 - 410 of the method of FIG. 4 may be applied to determine the dimensions of the region. If a tuple with a dissimilar transit time is encountered, the previous region is completed and the dimensions of a new region including the dissimilar tuple are determined.
- transit times were given as integer values of time.
- actual transit time or other characteristic data may be more continuously distributed across a range of values.
- the majority of transit time data points within a region corresponding to a latency of 1 may be fairly close to 1 (e.g., ranging from 0.8 to 1.2), some data points within that region might range in latency from, e.g., 0.2 to 4.5.
- By modeling the distribution of transit time data within a given region more sophisticated types of transit time analysis and prediction may be performed, as described in greater detail below.
- the following discussion generally refers to transit times in units of days, it is contemplated that any suitable unit or granularity of transit time may be employed (e.g., hours, weeks, months, etc.).
- a probability distribution or other representative distribution of a transit characteristic may be generated through analysis of transit characteristic data. For example, a histogram representing the frequency distribution of the tuples described above with respect to transit time may be constructed and generalized into a probability distribution representing the probability or likelihood that a given transit time value to the region 200 will be achieved.
- a transit time probability distribution is illustrated in FIG. 5 . As described in greater detail below, such a distribution may be representative of a region 200 or of an individual destination 120 .
- the individual probabilities that a transit time to region 200 or an individual destination 120 (from a particular source 110 via a corresponding shipping method 130 ) will be a time less than 0.4 days or greater than 4.4 days are nominally zero.
- the probability that a transit time to region 200 will be 1.0 days is approximately 0.25 (or 25%), while the probability that a transit time will be 1.6 days is approximately 0.67 (or 67%).
- the total or cumulative probability that a transit time will be less than or equal to a given transit time is given by the sum of all probabilities for transit times less than or equal to the given transit time.
- a sum may be obtained, for example, by determining the area under the probability distribution curve between 0 and the given transit time, such as by performing numerical or analytical integration of the probability distribution curve.
- the total probability that a transit time will be less than or equal to 2.0 days is equal to the area under the curve between 0 and 2.0, or approximately 61%. That is, according to the illustrated probability distribution, there is a 61% total probability or confidence that transit to region 200 will be complete in 2.0 days or less.
- Cumulative probability may also be referred to herein as a surety factor or simply as surety. For example, for the distribution of FIG. 5 , there exists a 98% surety that a given shipment to region 200 will be complete in approximately 3.4 days or less.
- transit characteristic data points may conform to a specific probability distribution for which there exists a general mathematical model of the distribution.
- Such mathematical models often have far fewer characteristic parameters than the number of data points themselves, and consequently may provide a more efficient representation of a probability distribution than the actual transit time frequency or probability histogram.
- the distribution illustrated in FIG. 5 conforms to a gamma distribution, which may be characterized by the relation:
- P ⁇ ( t ) t shape - 1 ⁇ e - t / scale ⁇ ⁇ ( shape ) ⁇ scale shape
- t denotes a transit time value
- P(t) denotes the individual (i.e., not cumulative) probability of t
- ⁇ (x) denotes the gamma function
- shape and scale denote parameters of the gamma distribution, which are related to and can be derived from the mean and variance of the data.
- use of a gamma distribution is not essential, and that other distribution models (e.g., Poisson distribution, normal distribution, uniform distribution, etc.) may be appropriate to different types of transit systems having different underlying behavioral assumptions.
- the fit of a set of transit time data against several possible probability models may be tested using standard curve-fitting techniques, while in other embodiments transit time data may be assumed to conform to a particular model based on, e.g., an a priori understanding of the dynamics of the behavior of the system generating the data.
- grouping of destinations 120 into regions according to a similarity criterion may be performed by applying the similarity criterion to a data distribution (e.g., a probability distribution as described above) rather than individual transit characteristic data points.
- a data distribution e.g., a probability distribution as described above
- FIG. 6 operation begins in block 600 where a given destination 120 corresponding to a particular source 110 and method 130 is chosen. The number of available transit characteristic data points corresponding to given destination 120 is then determined (block 602 ). For example, a destination 120 corresponding to a busy commercial location such as an office building may have numerous data points resulting from historical shipments, whereas another destination 120 may have few or only one historical data point.
- the quality of a distribution's reflection of actual data may depend on the existence of a sufficient number of data points from which to generate the distribution. For example, it may be difficult to discern a complex distribution from only two or three data points. Consequently, in the illustrated embodiment, if the number of data points corresponding to the given destination 120 is not sufficient to generate a distribution (e.g., fewer than 50, 100 or another suitable threshold number of data points), another destination 120 nearby the given destination 120 may be grouped with the given destination 120 (blocks 604 - 606 ). For example, data points corresponding to a destination 120 having an address that is adjacent to or near given destination 120 may be grouped with given destination 120 .
- blocks 602 - 606 may repeat until the number of data points corresponding to one or several destinations 120 is sufficient to generate a distribution, at which point the distribution corresponding to the destination(s) 120 is generated (block 608 ).
- a distribution may be generated using suitable statistical, numerical or other algorithmic techniques as described below with respect to FIG. 7 .
- the coordinates of the multiple destinations 120 may be used to determine the boundaries enclosed by the distribution in a manner similar to that described above in FIG. 4 .
- the data set processed by the method of FIG. 6 may include a subset or portion of all available transit characteristic data points, while in other embodiments all available data points may be processed.
- a given distribution is chosen (block 612 ) and compared against a nearby or adjacent distribution (block 614 ) to determine whether a similarity criterion is satisfied by the two distributions (block 616 ).
- comparison of two distributions may include determining the absolute difference in area under the graphical representations of each distribution, using standard analytical or numerical techniques.
- the similarity criterion may specify an absolute or relative threshold below which the two distributions may be considered similar.
- comparison of distributions may be performed using other techniques, such as by comparing statistical parameters of the distributions (e.g., mean, median, variance), for example.
- the two distributions satisfy the similarity criterion, they are grouped into a single region 200 (block 618 ).
- the dimensions of the region 200 may be determined by reference to the coordinates associated with the two distributions (e.g., the coordinates of the underlying destinations 120 , or the area encompassed by the distributions as may be determined in block 608 ).
- the two distributions may be combined or averaged to generate a single distribution corresponding to region 200 , while in another embodiment, the distribution associated with region 200 may be derived afresh from the underlying data points for the included destinations 120 .
- operation of the method illustrated in FIG. 6 may result in the “growing” or coalescence of regions 200 from a given distribution through progressive comparison with adjacent distributions. If a given distribution does not satisfy the similarity criterion with respect to a particular adjacent distribution, growth of the region 200 in the general direction of the particular adjacent distribution may stop, although growth may continue in other directions.
- comparison of distributions has been described as serial, binary comparison for the purposes of illustration, in other embodiments it is contemplated that multiple binary comparisons of distributions may occur concurrently. It is also contemplated that three or more distributions may be concurrently evaluated in a single comparison (e.g., comparison may be binary or N-way comparison).
- regions 200 may be performed by grouping distributions of transit characteristic data values, as just described, or by grouping of individual transit characteristic data values, such as illustrated in FIG. 4 .
- the precision of transit time data may be reduced by rounding, truncation, application of ceiling or floor functions, or other types of data conditioning prior to grouping into regions.
- transit times 2.05 and 1.92 may each be rounded to the closest integer value of 2, which may facilitate placing both data points in the same region.
- Such a data conditioning step may be performed, for example, prior to the application of the method of FIG. 4 or a suitable variant thereof.
- all the transit characteristic data points e.g., the tuples described above
- the region 200 may be analyzed in the aggregate to determine how they are probabilistically distributed within the region.
- FIG. 7 One embodiment of a method of determining a probability distribution associated with a particular destination 120 or a given region 200 is illustrated in FIG. 7 .
- the method may be applied to any collection of data points corresponding to a destination 120 or region 200 , for simplicity the steps of FIG. 7 refer to operation relative to a region 200 .
- operation begins in block 700 where a given region 200 is selected for analysis.
- the region 200 may have been previously determined by grouping of transit time data according to similarity, as described above.
- the transit time data set (e.g., the collection of tuples) associated with the selected region 200 is then analyzed, for example by determining statistical characteristics of the data set such as mean and variance (block 702 ). In some embodiments, if the target probability distribution is to be determined by determining the fit of the data set to various distributions, such curve-fitting may also be performed as a part of this step.
- Parameters specific to the data set and selected probability distribution are then determined (block 704 ). For example, in the case of the gamma distribution, shape and scale parameters may be determined from the previously determined statistical characteristics.
- the distribution parameters associated with the selected region 200 are stored along with other information identifying region 200 , such as its dimensions in terms of latitude and longitude coordinates (block 706 ). For example, in one embodiment, data corresponding to a region 200 such as its corresponding source 110 , shipping method 130 , dimensions and distribution parameters may be stored as a row or other type of record within a table or database.
- the reliability of a given probability distribution in characterizing the transit time behavior of a region 200 may depend on the quantity and quality of the data set used in determining the distribution. For example, a certain threshold number of data points may be needed in order to have confidence that the distribution reflects the actual behavior of the region (for instance, it may be impossible to distinguish a meaningful general relationship among only three or four data points). Similarly, if the data set includes a large number of outliers (anomalous data points that do not fit the distribution of the rest of the data), the resulting distribution may be skewed.
- the analysis of the transit time data set may include checking whether the data set includes a sufficient number of points for analysis as well as checking for outliers. If insufficient or skewed data is present, no distribution parameters may be generated, or the resulting distribution parameters may be flagged as possibly unreliable. Alternatively, if sufficient data is present, outliers may be identified and removed from the data set before distribution parameters are determined.
- a given surety factor p corresponding to a transit time t represents a p chance that an actual transit time will be less than or equal to t
- a 98% surety factor corresponding to a transit time of 3.6 days implies a 2% probability that the transit time will be greater than 3.6 days.
- anti-surety factors may be employed to manage the likelihood of an event not happening. For example, it may be desirable in some embodiments to ensure that a shipment does not reach its destination until after a certain date, such as an embargo date. Anti-surety factors may be employed in a manner similar to surety factors in the discussion that follows.
- the number of regions 200 generated for a given set of transit characteristic data tuples may be substantially fewer than the number of tuples themselves. Consequently, prediction of a transit time or other transit characteristic to a given destination 120 may be reduced to a matter of determining the region 200 in which given destination 120 belongs, rather than searching a large quantity of transit time data for a tuple corresponding to given destination 120 . That is, prediction of a transit characteristic of a given destination 120 may be reduced to a problem of determining set membership (e.g., region membership) of given destination 120 , rather than a problem of determining historical data specific to given destination 120 , which may not exist or may be insufficient for prediction.
- set membership e.g., region membership
- destinations 120 whose relevant transit characteristics satisfy a similarity criterion may be grouped into multiple discontiguous regions 200 .
- destinations 120 may exhibit transit latencies that are clustered around the locations of shipping hubs.
- several discontiguous “island” regions 200 having similar latencies or latency distributions may be formed around the shipping hubs and separated by regions 200 having dissimilar latencies or distributions.
- FIG. 8 One embodiment of a method of predicting transit time of a shipping method 130 from a given source 110 to a particular destination 120 using regions 200 is illustrated in FIG. 8 .
- operation begins in block 500 where the regions 200 associated with source 110 and shipping method 130 are identified.
- regions 200 may be generated for multiple different sources 110 and multiple different shipping methods 130 from a given source 110 .
- the coordinates of destination 120 are determined (block 502 ). For example, if destination 120 is specified as a shipping address including a postal code, the address may be translated into the appropriate coordinate system (e.g., latitude, longitude). Such a translation may be performed by, e.g., consulting a mapping service to obtain precise coordinates, or in some embodiments by simply mapping a portion of the postal code or destination city to a representative set of coordinates.
- the appropriate coordinate system e.g., latitude, longitude
- the coordinates of destination 120 are checked against the previously identified regions 200 to determine whether they fall within one or more regions 200 (block 504 ).
- a destination having coordinates (lat,lon) may fall within the region if both lat1 ⁇ lat ⁇ lat2 and lon1 ⁇ lon ⁇ lon2.
- a destination 120 having coordinates (3.5, 3.5) falls within both regions 200 a and 200 b of FIG. 3
- a destination having coordinates (5.7, 6) falls only within region 200 a.
- the predicted transit time to destination 120 is the transit time associated with that region 200 (blocks 506 , 508 ). If destination 120 falls within more than one region 200 , the predicted transit time to destination 120 may be chosen as the minimum transit time associated with the regions 200 to which destination 120 belongs (blocks 506 , 510 ). (In alternative embodiments, if the regions 200 to which destination 120 belongs are not completely overlapping, a less optimistic selection of transit time may be chosen, e.g., by averaging the transit times of the regions.)
- Destination 120 may not fall within any defined region 200 , for example if it is located in an area with little or no prior shipping history. If this is the case, in one embodiment the transit time of the region 200 whose center is closest to destination 120 may be chosen as the predicted transit time for destination 120 (blocks 506 , 512 ). In some embodiments, if one or more regions 200 are completely enclosed by another region 200 , only the center of the outermost region 200 may be considered. For example, referring to FIG. 3 , a destination 120 having coordinates (10, 11) falls outside of region 200 a . There being no other defined regions nearby, transit time associated with this destination may be predicted to be the transit time of region 200 a (e.g., 2). It is noted that in some instances, transit time predictions associated with destinations 120 that fall outside of known regions 200 may be considerably inaccurate, and in some embodiments such predictions may be treated as exceptional cases (e.g., flagged for special handling).
- regions 200 may not be static, but rather may be dynamically redefined as additional empirical transit time data is collected.
- the grouping algorithms of FIG. 4 or 6 may be performed in real time (e.g., continuously) or at intervals (e.g., weekly, monthly, etc.) to take into account underlying changes in the transit time performance of a given shipping method 130 .
- the grouping algorithms of FIG. 4 or 6 may be performed in real time (e.g., continuously) or at intervals (e.g., weekly, monthly, etc.) to take into account underlying changes in the transit time performance of a given shipping method 130 .
- a common carrier changes its schedule, its capacity between various hubs, or other logistical factors
- transit time to different destinations 120 may correspondingly change.
- Regenerating regions 200 to align them with current empirical data may assist in maintaining overall predictive accuracy of regions 200 , in contrast to conventional region mapping techniques that may be based on relatively static geographical or political boundaries that may bear little relationship to transit time behavior.
- not all fluctuations in empirical transit time data may be reflected in regions 200 .
- transient or anomalous transit time data may be excluded from the region-generating process. For example, weather conditions may cause temporary delays in shipping to a particular geographical area that are not indicative of a change in steady-state shipping behavior.
- transit time data reflecting such delays may be excluded from transit time modeling, so as not to skew transit time predictions.
- FIG. 9 illustrates one exemplary embodiment of a system including a predictive transit characteristic model configured to generate and utilize regions 200 and associated distribution information as described above.
- transit characteristic model 810 includes modeling logic 812 and runtime data model 814 , and is configured to interact with transit characteristic database 820 . Additionally, transit characteristic model 810 is configured to interact with a number of enterprise applications 860 via web services interface 830 and via local application programming interface (API) 840 . Further, a number of transit carriers 850 are configured to interact with transit characteristic database 820 via carrier data API 870 .
- API application programming interface
- transit characteristic model 810 may be configured to perform the general functions of acquiring transit characteristic data, for example from transit carriers 850 , grouping such data into regions 200 , and determining probability distribution parameters associated with regions 200 , for example as described above in conjunction with the descriptions of FIGS. 1-8 .
- transit characteristic model 810 may be configured to collect and model transit latency data, and may be referred to as a transit time model. Additionally, transit characteristic model 810 may be configured to make various types of model-based predictions as described in greater detail below. In some embodiments, transit characteristic model 810 may also include certain business rules or other policies that may influence modeling and prediction, or may be configured to obtain such rules or policies from another source.
- Transit characteristic model 810 may take such policies into account, for example by returning an error condition or selecting an alternate value (e.g., an alternate shipping method 130 ) if a transit time prediction for an illegal combination of inputs is requested.
- policy logic may be implemented externally and transparently to transit characteristic model 810 .
- modeling logic 812 may be configured to implement specific procedures, functions, or other types of processing routines corresponding to the general functions implemented by transit characteristic model 810 , including data acquisition functions, data analysis and modeling functions, and model querying or predictive functions.
- runtime data model 814 may be configured to implement the data upon which modeling logic 812 operates as described below.
- transit characteristic model 810 may employ different partitions of functionality.
- transit characteristic model 810 may be implemented as program instructions and data stored on a computer-accessible medium and executable, e.g., by a processor, to perform the functions of the model.
- database 820 may be configured to store the various types of data utilized in transit characteristic modeling. For example, individual transit characteristic data points (e.g., tuples) collected from carriers 850 may be stored as tables or records within database 820 , as may other data derived from such data points such as identities of sources 110 , dimensions of regions 200 , distribution parameters associated with regions 200 , as well as any other data generated or required by transit characteristic model 810 .
- database 820 may be implemented as a relational database or as a nonrelational database storing structured data (e.g., data formatted according to a version of extensible Markup Language (XML) or another suitable markup language).
- XML extensible Markup Language
- Transit characteristic data may be received and stored within database 820 through a different interface from the interface used to access transit characteristic model 810 .
- carriers 850 (or applications hosted by the carriers) may be configured to convey transit characteristic data, such as tracking data or other records, to database 820 for storage via carrier data interface 870 .
- carrier data interface 870 may be configured to implement electronic data interchange (EDI) functionality according to various EDI standards.
- EDI electronic data interchange
- interface 870 may be configured to implemented a version of the American National Standards Institute (ANSI) X12 EDI standard, a version of the Electronic Data Interchange for Administration, Commerce and Transport (EDIFACT) standard, or another suitable standard.
- ANSI American National Standards Institute
- EDIFACT Electronic Data Interchange for Administration, Commerce and Transport
- transit characteristic data may be conveyed from carriers 850 to database 820 in the form of EDI documents, text files, structured data such as XML-formatted data, or in another suitable format.
- carrier data interface 870 may be configured to implement various functions to coordinate the extraction and transformation of characteristic data records into a format suitable for storage in database 820 , as well as the actual loading of transformed data into database 820 .
- carrier data may be obtained from carriers 850 by transit characteristic model 810 via web services interface 840 . That is, in such embodiments, model 810 may make standard web services calls, as described in greater detail below, to obtain transit characteristic data.
- Database 820 may be particularly suited for storing and querying large quantities of varied data. However, in some embodiments the structure of region data stored by database 820 may not be well suited for dynamic processing by transit characteristic model 810 .
- database 820 may be configured to store each unique combination of source 110 , shipping method 130 and region 200 as a distinct row or record without any explicit representation of the relationships that may exist among regions 200 (e.g., the relative geographical positioning of regions 200 ). Consequently, searching database 820 to identify the record corresponding to a desired source-destination-shipping method combination may require an exhaustive search of all of the regions 200 for which the desired source and shipping method match records in database 820 .
- transit characteristic model 810 includes runtime data model 814 .
- runtime data model 814 may be configured to represent some or all of the source-shipping method-region associations reflected within database 820 , but using a more efficient data representation that reflects spatial relationships among different regions 200 , for example by mapping records from database 820 into a tree structure rather than a table structure.
- One exemplary data structure that may be employed by runtime data model 814 is referred to R-Trees and is described in greater detail in, for example, A. Guttman, “R-Trees: A dynamic index structure for spatial searching,” in Proceedings of the Association of Computing Machinery (ACM) SIGMOD International Conference on Management of Data, 1984, pp. 47-57.
- tree structures such as R-Trees may reduce the worst-case search depth of N records from, e.g., O(N) to O(log N).
- any data structure suitable for searching of spatial or geographical data may be employed by runtime data model 814 .
- carriers 850 may include any suitable sources of transit time data that may be used by transit characteristic model 810 .
- carriers 850 may include any suitable type of common or private carrier that may implement a shipping method 130 as described above.
- carriers 850 may make transit time data (e.g., tracking data) available for querying for web services interface 830 , while in other embodiments transit time data may be delivered by or retrieved from a carrier 850 via a proprietary API such as API 840 .
- a carrier 850 may deliver to an enterprise current tracking data for all shipments currently in transit on behalf of the enterprise in the form of electronic business documents that may be transmitted, e.g., several times per day.
- the enterprise may collect tracking data by submitting requests for data on particular shipments.
- transit characteristic model 810 may make various modeling functions available to enterprise applications 860 , either as web services via web services interface 830 , or as local or proprietary functions accessible via API 840 .
- web services describes a general programming model through which computational services may be available to different requesters in a platform- and programming-language independent manner.
- Web services interface 830 may encompass any of a number of protocols that may be used to present a computational service as a web service, such as a version of the XML protocol for encoding documents, a version of Simple Object Access Protocol (SOAP), a version of Web Services Description Language (WSDL), or other related protocols.
- SOAP Simple Object Access Protocol
- WSDL Web Services Description Language
- enterprise applications 860 may encompass any applications that may require or benefit from access to historical transit time data or predicted transit time behavior.
- enterprise applications 860 may include customer ordering applications that may request predictions from transit characteristic model 810 in order to provide shipping estimates to customers, or order fulfillment applications that may seek to optimize for the lowest-cost shipping method 130 that may still meet a promised delivery date, as described in greater detail below.
- Enterprise applications 860 may also include audit applications, order status monitoring applications, or any other suitable applications.
- enterprise applications 860 as well as web services interface 830 and local API 840 , may be implemented as program instructions and data stored via a computer-accessible medium as described below.
- a probability distribution associated with a region 200 may function to correlate a given transit time with a surety factor that the given transit time will be achieved (e.g., will not be exceeded).
- a surety factor that the given transit time will be achieved (e.g., will not be exceeded).
- the probability distribution either correlate may be determined from the other, as illustrated in the methods of FIGS. 9A-B .
- FIG. 9A illustrates one embodiment of a method of determining transit time given a desired surety for a given shipment.
- operation begins in block 900 where a particular region 200 is selected. For example, in one embodiment it may be desired to ship from a particular source 110 to a destination 120 using a particular shipping method 130 . Of all regions 200 corresponding to the source 110 and shipping method 130 , a region 200 that includes the destination 120 may be selected as the particular region 200 . In some embodiments, a destination 120 may fall into multiple qualifying regions 200 , in which case each qualifying region 200 may be evaluated or one particular region 200 may be selected based on other criteria.
- a desired surety factor is also specified (block 902 ). For example, a 98% surety that the transit time will be less than or equal to the predicted time may be specified.
- surety factor may be specified as an argument along with arguments identifying the source 110 , destination 120 and shipping method 130 in a single call to transit characteristic model 810 .
- the probability distribution corresponding to the selected region 200 is then evaluated with respect to the specified surety factor to determine the corresponding transit time (block 904 ).
- an inverse cumulative probability curve may be determined from the parameters defining the probability distribution curve and used to identify a transit time corresponding to a given surety factor.
- FIG. 9B illustrates one embodiment of a method of determining a surety factor given a desired transit time for a given shipment. Referring collectively to FIGS. 1-9B , operation begins in block 910 where a particular region 200 is selected, which may occur as for step 900 of FIG. 9A .
- a desired transit time is also specified (block 912 ). For example, a two-day transit time may be desired in order to meet a shipping commitment to a customer.
- desired transit time may be specified as an argument along with arguments identifying the source 110 , destination 120 and shipping method 130 in a single call to transit characteristic model 810 .
- the probability distribution corresponding to the selected region 200 is then evaluated with respect to the specified transit time to determine the corresponding surety factor (block 914 ).
- the probability distribution may be numerically integrated to determine the cumulative probability corresponding to the specified transit time.
- an analytic expression for cumulative probability may be determined and evaluated with respect to the specified transit time.
- the methods of FIGS. 9A-B may form the basis of basic transit time predictions implemented by transit characteristic model 810 . However, these methods, or variants thereof, may also be used to form more sophisticated inquiries based on transit time and surety factor.
- transit characteristic model 810 may be configured to determine what shipping method 130 , if any, satisfies both a given transit time and a given surety factor for shipment from a source 110 .
- transit characteristic model 810 may be configured to iterate over all regions 200 corresponding to the source 110 and containing the destination 120 , applying the method of FIG. 9A to each region 200 along with the given surety factor and determining whether the resulting transit time is less than or equal to the given transit time.
- the method of FIG. 9B may be applied to each region 200 along with the given transit time, and transit characteristic model 810 may be configured to determine whether the resulting surety factor is greater than or equal to the given or desired surety factor.
- transit characteristic model 810 may be configured to determine the lowest cost shipping method 130 that satisfies a given transit time and surety factor, or to minimize transit time for a given surety factor (or similarly, maximize surety factor for a given transit time) over a set of shipping methods 130 (e.g., shipping methods 130 representing a fixed or maximum cost, preferred shipping vendors, etc.).
- predictions based on empirically-based transit time and surety factor may enable an enterprise to manage transit decisions based on actual shipping behavior as well as risk tolerance. For example, a surety factor of 85% may be substantially less expensive to achieve than a surety factor of 98% for a given transit latency, while still reflecting a considerable likelihood that the given transit latency will be achieved.
- An enterprise may weigh the cost savings of shipping methods 130 exhibiting lower surety factor to a given region 200 against the possible costs if the given transit latency is not achieved (e.g., refunds owed to customers under shipping performance guarantees, opportunity costs, etc.).
- such an expected value analysis based on surety factor may be employed as the basis for determining whether to offer a customer a performance guarantee (e.g., insurance or compensation payable to the customer in the event the promised level of transit performance is not achieved), and/or the potential cost of such a guarantee (e.g., that may be charged to the customer, absorbed by the enterprise, or charged to a third party insurer or reinsurer).
- a performance guarantee e.g., insurance or compensation payable to the customer in the event the promised level of transit performance is not achieved
- the potential cost of such a guarantee e.g., that may be charged to the customer, absorbed by the enterprise, or charged to a third party insurer or reinsurer.
- high surety may imply low risk of failure to perform, and thus minimal risk in guaranteeing performance by, e.g., offering a full or partial refund of shipping costs to a customer in case of such a failure.
- the cost to guarantee performance may be relatively low.
- low surety may imply high risk of failure
- shipping methods 130 may be selected on the basis of transit time and surety factor for a specific destination 120 rather than on the method itself.
- a customer typically specifies a desired shipping method 130 to be used to fulfill an order.
- a customer may specify a desired transit time and/or surety factor, and transit characteristic model 810 may be configured to determine whether a given shipping method 130 satisfies the given constraints. For example, in one instance a customer may desire a single-day transit time with a reasonably high (e.g., 85%) surety factor.
- transit characteristic model 810 may identify that a less expensive shipping method 130 such as ground shipping yields the desired transit time and surety factor for the customer's destination 120 .
- the cost savings realized by identifying a satisfactory, less expensive shipping method 130 in this manner may be retained as profit margin, offered to the customer as a cost reduction, or a combination of these.
- transit characteristic modeling as described above may also be used in conjunction with a method or system for speculative or anticipatory package shipping, as described in greater detail in U.S. patent application Ser. No. 11/015,288, entitled “Method and system for anticipatory package shipping” and filed on Dec. 17, 2004, and in U.S. patent application Ser. No. 11/015,290, entitled “Method and system for forecasted package shipping using late-select addressing” and filed on Dec. 17, 2004, each of which is hereby incorporated by reference in its entirety.
- speculative or anticipatory shipping of a package includes shipping the package to a destination geographical area without completely specifying a delivery address for the package at the time of shipment, and completely specifying the delivery address while the package is in transit.
- Such shipping may be understood to be “anticipatory” in that it may be performed in anticipation of a customer actually placing an order or request for the contents of the package (e.g., prior to the order actually occurring).
- a package may be shipped to a particular geographical area (e.g., a metropolitan area) when there is a reasonable expectation that by the time the package arrives in the particular geographical area, a customer will have placed an order or request for the package contents, and the package may then be routed to the delivery address of the customer.
- Transit characteristic modeling may be particularly useful in conjunction with anticipatory package shipping.
- the geographical regions 200 of the transit characteristic model may correspond to geographical areas to which a package may be anticipatory shipped.
- transit characteristic model 810 may be used to predict the transit latency to a destination region 200 for an anticipatory shipped package using a given shipping method 130 and a given surety factor, as described above. The predicted transit time may then be used as a guide or metric for the window of time in which the package may be in transit before a corresponding customer order needs to occur, or the package needs to be returned, stored or redirected to another geographical region 200 .
- transit characteristic model 810 may be configured to identify destination regions 200 and/or shipping methods 130 that qualify. More generally, in some embodiments transit characteristic model 810 may be configured to optimize for (e.g., to maximize, minimize, or solve for an optimal value) any one or more of transit time, surety factor, shipping method 130 or cost thereof, or destination region 200 , given specified values for the remaining parameters. In some embodiments, transit characteristic model 810 may also model other variables that may be incorporated into the prediction and optimization processes, in addition to those variables that may be derived from empirical transit characteristic data. For example, in some embodiments transit characteristic model 810 may be integrated with other models that may predict customer demand, future item pricing behavior, or other variables.
- Transit characteristic modeling and prediction such as described above may also be useful in conjunction with other shipping and inventory management techniques.
- an enterprise may employ forward-deployed inventory as an alternative to using a small number of centralized inventory facilities.
- forward-deployed inventory includes the placement of inventory items at locations or nodes that are relatively close to potential customers, for example by implementing relatively small, localized inventory facilities or by contracting with common carriers to keep a supply of ready-to-ship inventory items at or near shipping hubs.
- each inventory node within a forward-deployed inventory system may be treated as a source location 110 for the purposes of transit characteristic modeling, which may considerably simplify transit data management over point-to-point modeling approaches especially if a large number of nodes are used.
- transit characteristics may be modeled to an arbitrary level of granularity or precision.
- transit latency may be modeled not only in days, but in hours or fractions of hours. Modeling transit latency with relatively fine granularity may enable the prediction of transit latencies within very narrow windows.
- transit characteristic model 810 may be configured to predict transit latency and associated surety for time windows as short as several hours, or even several minutes. Such fine-grained predictions may enable an enterprise to offer a variety of narrowly-targeted transit options to customers.
- fine-grained predictions may allow a customer to specify same-day delivery, a given window of time for delivery on a given day, or a given window of time for delivery relative to the current time (e.g., delivery within the next N hours from the current time).
- Modeling of surety factors in conjunction with fine-grained transit latency prediction may also enable a customer to specify closed-ended rather than open-ended delivery windows. That is, a customer may specify that if delivery cannot occur within an indicated window, the delivery should be cancelled (as opposed to being delivered later).
- the use of surety factors may enable a shipper to manage the risk associated with failing to fulfill closed-ended delivery windows in a manner similar to the performance guarantees described above.
- any of the methods or techniques described above may be implemented as program instructions and data capable of being stored or conveyed via a computer-accessible medium.
- Such methods or techniques may include, for example and without limitation, the functions of transit characteristic model 810 , database 820 , web services interface 830 , local API 840 , or enterprise applications 860 , as well as the methods illustrated in FIGS. 4, 5, 7, 9A and 9B .
- Such program instructions may be executed to perform a particular computational function such as analysis of transit time data to determine region dimensions and probability distributions, implementations of specific prediction algorithms, database management and querying, remote procedure calls and web services requests, operating system functionality, applications, and/or any other suitable functions.
- computer system 1000 includes one or more processors 1010 coupled to a system memory 1020 via an input/output (I/O) interface 1030 .
- Computer system 1000 further includes a network interface 1040 coupled to I/O interface 1030 .
- inventory management system 50 may be implemented using by a single instance of computer system 1000 , while in other embodiments multiple such systems may be configured to host different portions of inventory management system 50 .
- some data sources or services may be implemented via instances of computer system 1000 that are distinct from those instances implementing other data sources or services.
- computer system 1000 may be a uniprocessor system including one processor 1010 , or a multiprocessor system including several processors 1010 (e.g., two, four, eight, or another suitable number).
- Processors 1010 may be any suitable processor capable of executing instructions.
- processors 1010 may be a general-purpose or embedded processor implementing any of a variety of instruction set architectures (ISAs), such as the x86, PowerPC, SPARC, or MIPS ISAs, or any other suitable ISA.
- ISAs instruction set architectures
- each of processors 1010 may commonly, but not necessarily, implement the same ISA.
- System memory 1020 may be configured to store instructions and data accessible by process 1010 .
- system memory 1020 may be implemented using any suitable memory technology, such as static random access memory (SRAM), synchronous dynamic RAM (SDRAM), nonvolatile/Flash-type memory, or any other type of memory.
- SRAM static random access memory
- SDRAM synchronous dynamic RAM
- nonvolatile/Flash-type memory or any other type of memory.
- program instructions and data implementing desired functions, such as those described above, are shown stored within system memory 1020 as code 1025 .
- I/O interface 1030 may be configured to coordinate I/O traffic between processor 1010 , system memory 1020 , and any peripheral devices in the device, including network interface 1040 or other peripheral interfaces.
- I/O interface 1030 may perform any necessary protocol, timing or other data transformations to convert data signals from one component (e.g., system memory 1020 ) into a format suitable for use by another component (e.g., processor 1010 ).
- I/O interface 1030 may include support for devices attached through various types of peripheral buses, such as a variant of the Peripheral Component Interconnect (PCI) bus standard or the Universal Serial Bus (USB) standard, for example.
- PCI Peripheral Component Interconnect
- USB Universal Serial Bus
- I/O interface 1030 may be split into two or more separate components, such as a north bridge and a south bridge, for example. Also, in some embodiments some or all of the functionality of I/O interface 1030 , such as an interface to system memory 1020 , may be incorporated directly into processor 1010 .
- Network interface 1040 may be configured to allow data to be exchanged between computer system 1000 and other devices attached to a network, such as other computer systems, for example.
- network interface 1040 may support communication via wired or wireless general data networks, such as any suitable type of Ethernet network, for example; via telecommunications/telephony networks such as analog voice networks or digital fiber communications networks; via storage area networks such as Fibre Channel SANs, or via any other suitable type of network and/or protocol.
- system memory 1020 may be one embodiment of a computer-accessible medium configured to store program instructions and data as described above. However, in other embodiments, program instructions and/or data may be received, sent or stored upon different types of computer-accessible media.
- a computer-accessible medium may include storage media or memory media such as magnetic or optical media, e.g., disk or CD/DVD coupled to computer system 1000 via I/O interface 1030 .
- a computer-accessible medium may also include any volatile or non-volatile media such as RAM (e.g. SDRAM, DDR SDRAM, RDRAM, SRAM, etc.), ROM, etc, that may be included in some embodiments of computer system 1000 as system memory 1020 or another type of memory.
- a computer-accessible medium may be accessible via various transmission media or signals such as electrical, electromagnetic, or digital signals, conveyed via a communication medium such as a network and/or a wireless link, such as may be implemented via network interface 1040 .
Abstract
Description
lat<lat1,
lat>lat2,
lon<lon1,
lon>lon2.
Referring to the previous example, evaluating the tuple (2,2,1) with respect to the default region dimensions given above results in the first and third conditions being satisfied. However, it is contemplated that in other embodiments, other suitable tests based on region coordinates, boundaries, axes or other representations of region dimensions may be employed to determine whether a given tuple falls outside existing region dimensions.
where t denotes a transit time value, P(t) denotes the individual (i.e., not cumulative) probability of t, Γ(x) denotes the gamma function, and shape and scale denote parameters of the gamma distribution, which are related to and can be derived from the mean and variance of the data. However, it is noted that use of a gamma distribution is not essential, and that other distribution models (e.g., Poisson distribution, normal distribution, uniform distribution, etc.) may be appropriate to different types of transit systems having different underlying behavioral assumptions. In some embodiments, the fit of a set of transit time data against several possible probability models may be tested using standard curve-fitting techniques, while in other embodiments transit time data may be assumed to conform to a particular model based on, e.g., an a priori understanding of the dynamics of the behavior of the system generating the data.
E=S·surety−C·(1−surety)
where S and C respectively denote the savings and costs if the transit time is achieved or not achieved, and surety is expressed as a fractional value.
Claims (52)
Priority Applications (4)
| Application Number | Priority Date | Filing Date | Title |
|---|---|---|---|
| US11/094,505 US9959519B2 (en) | 2005-03-30 | 2005-03-30 | Method and system for transit characteristic prediction |
| CA2605354A CA2605354C (en) | 2005-03-30 | 2006-03-06 | Method and system for transit characteristic prediction |
| PCT/US2006/007981 WO2006107488A2 (en) | 2005-03-30 | 2006-03-06 | Method and system for transit characteristic prediction |
| EP06737189A EP1869404A4 (en) | 2005-03-30 | 2006-03-06 | Method and system for transit characteristic prediction |
Applications Claiming Priority (1)
| Application Number | Priority Date | Filing Date | Title |
|---|---|---|---|
| US11/094,505 US9959519B2 (en) | 2005-03-30 | 2005-03-30 | Method and system for transit characteristic prediction |
Publications (2)
| Publication Number | Publication Date |
|---|---|
| US20060224398A1 US20060224398A1 (en) | 2006-10-05 |
| US9959519B2 true US9959519B2 (en) | 2018-05-01 |
Family
ID=37071670
Family Applications (1)
| Application Number | Title | Priority Date | Filing Date |
|---|---|---|---|
| US11/094,505 Expired - Fee Related US9959519B2 (en) | 2005-03-30 | 2005-03-30 | Method and system for transit characteristic prediction |
Country Status (4)
| Country | Link |
|---|---|
| US (1) | US9959519B2 (en) |
| EP (1) | EP1869404A4 (en) |
| CA (1) | CA2605354C (en) |
| WO (1) | WO2006107488A2 (en) |
Cited By (1)
| Publication number | Priority date | Publication date | Assignee | Title |
|---|---|---|---|---|
| US20180218321A1 (en) * | 2017-01-31 | 2018-08-02 | Neopost Technologies | Advanced date selection systems and methods |
Families Citing this family (45)
| Publication number | Priority date | Publication date | Assignee | Title |
|---|---|---|---|---|
| US20070078793A1 (en) * | 2005-09-21 | 2007-04-05 | Dearing Stephen M | System and method for aggregating item delivery information |
| US7774463B2 (en) * | 2006-07-25 | 2010-08-10 | Sap Ag | Unified meta-model for a service oriented architecture |
| US8078497B1 (en) | 2006-09-21 | 2011-12-13 | Google Inc. | Distinguishing search results associated with an electronic commerce system |
| US20080155557A1 (en) * | 2006-12-21 | 2008-06-26 | Vladislav Bezrukov | Unified metamodel for web services description |
| US8688488B2 (en) * | 2008-07-25 | 2014-04-01 | Hireright, Inc. | Method and apparatus for the prediction of order turnaround time in an information verification system |
| US8456302B2 (en) | 2009-07-14 | 2013-06-04 | Savi Technology, Inc. | Wireless tracking and monitoring electronic seal |
| CN102713949A (en) | 2009-08-17 | 2012-10-03 | 交易魔法公司 | Contextually aware monitoring of assets |
| US20110054979A1 (en) * | 2009-08-31 | 2011-03-03 | Savi Networks Llc | Physical Event Management During Asset Tracking |
| US20130138574A1 (en) * | 2009-09-18 | 2013-05-30 | Enroute Systems Corporation | Package and freight shipping system and method, including shipping by fulfillment entities |
| WO2011035194A2 (en) * | 2009-09-18 | 2011-03-24 | Enroute Systems Corporation | Package shipping system and method, including usage of historical analytic data |
| US9842308B1 (en) * | 2010-02-25 | 2017-12-12 | Stamps.Com Inc. | Systems and methods for rules based shipping |
| US20110213729A1 (en) * | 2010-02-26 | 2011-09-01 | Jiri Pechanec | Automatic selection of cheapest suppliers for product assembly |
| US20110225076A1 (en) * | 2010-03-09 | 2011-09-15 | Google Inc. | Method and system for detecting fraudulent internet merchants |
| US8577827B1 (en) | 2010-03-12 | 2013-11-05 | Amazon Technologies, Inc. | Network page latency reduction using gamma distribution |
| CA2799153A1 (en) * | 2010-05-24 | 2011-12-01 | Ali Esmaili | Bulk distribution method |
| US20120030134A1 (en) * | 2010-07-30 | 2012-02-02 | Walz Group | System For Tracking USPS Mail, Predicting Delivery Times And Comparing USPS Costs Against Private Courier Services |
| US20120158608A1 (en) * | 2010-12-17 | 2012-06-21 | Oracle International Corporation | Fleet dispatch plan optimization |
| US8732039B1 (en) * | 2010-12-29 | 2014-05-20 | Amazon Technologies, Inc. | Allocating regional inventory to reduce out-of-stock costs |
| US8620707B1 (en) * | 2011-06-29 | 2013-12-31 | Amazon Technologies, Inc. | Systems and methods for allocating inventory in a fulfillment network |
| US9060062B1 (en) | 2011-07-06 | 2015-06-16 | Google Inc. | Clustering and classification of recent customer support inquiries |
| US8407154B1 (en) * | 2012-04-27 | 2013-03-26 | Google Inc. | Predicting shipment origin points |
| US20140122164A1 (en) * | 2012-10-28 | 2014-05-01 | SWeRP, Inc. | System and method for analyzing commuting metrics |
| EP2750087A1 (en) * | 2012-12-28 | 2014-07-02 | Exapaq Sas | Methods and systems for determining estimated package delivery/pick-up times |
| US20140214716A1 (en) * | 2013-01-31 | 2014-07-31 | Neopost Technologies | Shipment Planning |
| US10607178B2 (en) | 2013-01-31 | 2020-03-31 | Satori Software Inc. | Shipment planning |
| US20140279669A1 (en) * | 2013-03-13 | 2014-09-18 | Sap Ag | Predictive Order Scheduling |
| US9811797B2 (en) | 2013-03-15 | 2017-11-07 | Sap Se | Transportation connection cache for dynamic network and route determination |
| US20140330741A1 (en) * | 2013-05-03 | 2014-11-06 | Iwona Bialynicka-Birula | Delivery estimate prediction and visualization system |
| US9811830B2 (en) | 2013-07-03 | 2017-11-07 | Google Inc. | Method, medium, and system for online fraud prevention based on user physical location data |
| US9726750B2 (en) | 2013-08-26 | 2017-08-08 | Specialty Electrical, Llc | Method and apparatus for multi-mode tracking and display of personnel locations in a graphical model |
| US10489739B2 (en) | 2013-09-18 | 2019-11-26 | Simpler Postage, Inc. | System and method for object shipping automation |
| US10671966B2 (en) | 2013-09-18 | 2020-06-02 | Simpler Postage, Inc. | System and methods for enabling efficient shipping and delivery |
| US9953332B2 (en) | 2013-09-18 | 2018-04-24 | Simpler Postage, Inc. | Method and system for generating delivery estimates |
| US9336509B1 (en) | 2014-03-27 | 2016-05-10 | Amazon Technologies, Inc. | Crossdocking transshipments without sortation |
| KR20160025664A (en) * | 2014-08-27 | 2016-03-09 | 삼성에스디에스 주식회사 | Apparatus and method for early detection of abnormality |
| US10142353B2 (en) | 2015-06-05 | 2018-11-27 | Cisco Technology, Inc. | System for monitoring and managing datacenters |
| US10536357B2 (en) | 2015-06-05 | 2020-01-14 | Cisco Technology, Inc. | Late data detection in data center |
| US9912759B2 (en) * | 2015-06-24 | 2018-03-06 | International Business Machines Corporation | Dynamically generating solution stacks |
| US10395206B2 (en) * | 2015-06-29 | 2019-08-27 | Walmart Apollo, Llc | Refrigerating home deliveries |
| US20170262803A1 (en) * | 2016-03-14 | 2017-09-14 | United Parcel Service Of America, Inc. | Determining estimated pick-up/delivery windows using clustering |
| EP4031861A4 (en) * | 2019-09-18 | 2023-07-19 | Divert, Inc. | Systems and methods for tracking product environment throughout a supply chain |
| US11694152B2 (en) | 2020-10-14 | 2023-07-04 | Simpler Postage, Inc. | System and method for processing shipment requests using a multi-service shipping platform |
| US11514396B2 (en) | 2020-10-14 | 2022-11-29 | Simpler Postage, Inc. | System and method for determining a transit prediction model |
| US11687880B2 (en) * | 2020-12-29 | 2023-06-27 | Target Brands, Inc. | Aggregated supply chain management interfaces |
| US20220292407A1 (en) * | 2021-03-15 | 2022-09-15 | Walmart Apollo, Llc | System and method for machine learning-based delivery tagging |
Citations (13)
| Publication number | Priority date | Publication date | Assignee | Title |
|---|---|---|---|---|
| US5265006A (en) * | 1990-12-14 | 1993-11-23 | Andersen Consulting | Demand scheduled partial carrier load planning system for the transportation industry |
| US5963919A (en) * | 1996-12-23 | 1999-10-05 | Northern Telecom Limited | Inventory management strategy evaluation system and method |
| US6240362B1 (en) * | 2000-07-10 | 2001-05-29 | Iap Intermodal, Llc | Method to schedule a vehicle in real-time to transport freight and passengers |
| US6282489B1 (en) * | 1993-05-28 | 2001-08-28 | Mapquest.Com, Inc. | Methods and apparatus for displaying a travel route and generating a list of places of interest located near the travel route |
| US20010051876A1 (en) | 2000-04-03 | 2001-12-13 | Seigel Ronald E. | System and method for personalizing, customizing and distributing geographically distinctive products and travel information over the internet |
| US20020013734A1 (en) | 2000-03-14 | 2002-01-31 | E-Food.Com Corporation | Universal internet smart delivery agent |
| US20020082893A1 (en) * | 2000-02-29 | 2002-06-27 | Dennis Barts | Delivery system and method for vehicles and the like |
| US20020147631A1 (en) * | 2001-04-06 | 2002-10-10 | Smith Stephen A. | Method of and apparatus for forecasting item availability |
| US20020165804A1 (en) * | 2001-05-01 | 2002-11-07 | Beebe Melissa D. | Automated data warehouse for demand fulfillment system |
| US20030036938A1 (en) * | 2001-08-16 | 2003-02-20 | International Business Machines Corporation | Method and system for delivery of products within a predetermined time period |
| US20030195934A1 (en) * | 2002-04-15 | 2003-10-16 | Peterson Neil J. | Web services-based communications for use with process control systems |
| US20040243472A1 (en) | 2002-05-14 | 2004-12-02 | Andrew Vadjinia | Method and apparatus for display and collection of information and distribution of product |
| US20040249742A1 (en) * | 2003-03-25 | 2004-12-09 | Future Freight Corporation | Computer-implemented trading in freight derivatives and techniques therefor |
-
2005
- 2005-03-30 US US11/094,505 patent/US9959519B2/en not_active Expired - Fee Related
-
2006
- 2006-03-06 CA CA2605354A patent/CA2605354C/en active Active
- 2006-03-06 WO PCT/US2006/007981 patent/WO2006107488A2/en active Application Filing
- 2006-03-06 EP EP06737189A patent/EP1869404A4/en not_active Ceased
Patent Citations (13)
| Publication number | Priority date | Publication date | Assignee | Title |
|---|---|---|---|---|
| US5265006A (en) * | 1990-12-14 | 1993-11-23 | Andersen Consulting | Demand scheduled partial carrier load planning system for the transportation industry |
| US6282489B1 (en) * | 1993-05-28 | 2001-08-28 | Mapquest.Com, Inc. | Methods and apparatus for displaying a travel route and generating a list of places of interest located near the travel route |
| US5963919A (en) * | 1996-12-23 | 1999-10-05 | Northern Telecom Limited | Inventory management strategy evaluation system and method |
| US20020082893A1 (en) * | 2000-02-29 | 2002-06-27 | Dennis Barts | Delivery system and method for vehicles and the like |
| US20020013734A1 (en) | 2000-03-14 | 2002-01-31 | E-Food.Com Corporation | Universal internet smart delivery agent |
| US20010051876A1 (en) | 2000-04-03 | 2001-12-13 | Seigel Ronald E. | System and method for personalizing, customizing and distributing geographically distinctive products and travel information over the internet |
| US6240362B1 (en) * | 2000-07-10 | 2001-05-29 | Iap Intermodal, Llc | Method to schedule a vehicle in real-time to transport freight and passengers |
| US20020147631A1 (en) * | 2001-04-06 | 2002-10-10 | Smith Stephen A. | Method of and apparatus for forecasting item availability |
| US20020165804A1 (en) * | 2001-05-01 | 2002-11-07 | Beebe Melissa D. | Automated data warehouse for demand fulfillment system |
| US20030036938A1 (en) * | 2001-08-16 | 2003-02-20 | International Business Machines Corporation | Method and system for delivery of products within a predetermined time period |
| US20030195934A1 (en) * | 2002-04-15 | 2003-10-16 | Peterson Neil J. | Web services-based communications for use with process control systems |
| US20040243472A1 (en) | 2002-05-14 | 2004-12-02 | Andrew Vadjinia | Method and apparatus for display and collection of information and distribution of product |
| US20040249742A1 (en) * | 2003-03-25 | 2004-12-09 | Future Freight Corporation | Computer-implemented trading in freight derivatives and techniques therefor |
Non-Patent Citations (5)
| Title |
|---|
| Ho and Zheng, "Setting Customer Expectation in Service Delivery: An Integrated Marketing-Operations Perspective" Jun. 1, 2003. * |
| International Search Report from Application No. 06737189.8-1238 / 1869404 (PCT/US2006007981), dated May 28, 2010. |
| International Search Report in Application No. PCTUS06/07981 dated Dec. 28, 2006. |
| Microsoft Windows 2000 Server TCP/IP Core Networking Guide, Jan. 19, 2000. * |
| Orwant, Hietaniemi, and Macdonald, "Mastering Algorithms with Perl", Aug. 18, 1999. * |
Cited By (1)
| Publication number | Priority date | Publication date | Assignee | Title |
|---|---|---|---|---|
| US20180218321A1 (en) * | 2017-01-31 | 2018-08-02 | Neopost Technologies | Advanced date selection systems and methods |
Also Published As
| Publication number | Publication date |
|---|---|
| CA2605354C (en) | 2016-10-11 |
| EP1869404A2 (en) | 2007-12-26 |
| WO2006107488A3 (en) | 2007-03-01 |
| EP1869404A4 (en) | 2010-06-30 |
| WO2006107488A2 (en) | 2006-10-12 |
| US20060224398A1 (en) | 2006-10-05 |
| CA2605354A1 (en) | 2006-10-12 |
Similar Documents
| Publication | Publication Date | Title |
|---|---|---|
| US9959519B2 (en) | Method and system for transit characteristic prediction | |
| US8504485B1 (en) | Adaptive regionalization for transit characteristic prediction | |
| US8000988B1 (en) | Selecting shipping methods dependent on a dynamic model of shipping activity | |
| US20210090024A1 (en) | System and Method for Managing and Optimizing Delivery Networks | |
| US20200065759A1 (en) | Method and Apparatus for Managing, Displaying, Analyzing, Coordinating, and Optimizing Innovation, Engineering, Manufacturing, and Logistics Infrastructures | |
| US8700443B1 (en) | Supply risk detection | |
| US8352382B1 (en) | Heuristic methods for customer order fulfillment planning | |
| US10146214B2 (en) | Method and system for collecting supply chain performance information | |
| Landers et al. | The virtual warehousing concept | |
| US7881986B1 (en) | Method and system for event-driven inventory disposition | |
| US8447664B1 (en) | Method and system for managing inventory by expected profitability | |
| US8571915B1 (en) | System and method for selectively advancing items in a picking schedule | |
| US20200134557A1 (en) | Logistical service for processing modular delivery requests | |
| US9466043B1 (en) | System and method for generating shipment forecasts for materials handling facilities | |
| US20180137455A1 (en) | Automated Purchasing | |
| CN1862580A (en) | Method and system for performing inventory management | |
| Kaboudani et al. | Vehicle routing and scheduling in cross docks with forward and reverse logistics | |
| Hu et al. | Vehicle routing problem for fashion supply chains with cross-docking | |
| Miller et al. | A logistics deployment decision support system at Pfizer | |
| Leung et al. | Community logistics: a dynamic strategy for facilitating immediate parcel delivery to smart lockers | |
| US20140129269A1 (en) | Forecasting Business Entity Characteristics Based on Planning Infrastructure | |
| US20180374031A1 (en) | Transportation adjustments based on recommended shipping packages | |
| US8340990B2 (en) | Logistics planning in a business environment | |
| Minner | Inbound logistics | |
| Moldagulova et al. | Application of big data in logistics |
Legal Events
| Date | Code | Title | Description |
|---|---|---|---|
| AS | Assignment |
Owner name: AMAZON TECHNOLOGIES, INC., NEVADA Free format text: ASSIGNMENT OF ASSIGNORS INTEREST;ASSIGNORS:LAKSHMAN, GIRISH S.;BEZANSON, LLEWELLYN W.;DESAI, PRADEEP;SIGNING DATES FROM 20050506 TO 20060506;REEL/FRAME:021718/0284 Owner name: AMAZON TECHNOLOGIES, INC., NEVADA Free format text: ASSIGNMENT OF ASSIGNORS INTEREST;ASSIGNORS:LAKSHMAN, GIRISH S.;BEZANSON, LLEWELLYN W.;DESAI, PRADEEP;REEL/FRAME:021718/0284;SIGNING DATES FROM 20050506 TO 20060506 |
|
| STCF | Information on status: patent grant |
Free format text: PATENTED CASE |
|
| FEPP | Fee payment procedure |
Free format text: MAINTENANCE FEE REMINDER MAILED (ORIGINAL EVENT CODE: REM.); ENTITY STATUS OF PATENT OWNER: LARGE ENTITY |
|
| LAPS | Lapse for failure to pay maintenance fees |
Free format text: PATENT EXPIRED FOR FAILURE TO PAY MAINTENANCE FEES (ORIGINAL EVENT CODE: EXP.); ENTITY STATUS OF PATENT OWNER: LARGE ENTITY |
|
| STCH | Information on status: patent discontinuation |
Free format text: PATENT EXPIRED DUE TO NONPAYMENT OF MAINTENANCE FEES UNDER 37 CFR 1.362 |
|
| FP | Lapsed due to failure to pay maintenance fee |
Effective date: 20220501 |